Embed Size (px)
Citation preview
1
METHODOLOGY FOR ANALYSIS OF THE ENERGY INTENSITYOF CALIFORNIA’S WATER SYSTEMS,
AND
AN ASSSESSMENT OFMULTIPLE POTENTIAL BENEFITS THROUGH INTEGRATED
WATER-ENERGY EFFICIENCY MEASURES
Exploratory Research Project Supported by:
Ernest Orlando Lawrence Berkeley Laboratory,California Institute for Energy Efficiency
Agreement No. 4910110
January 2000
Principle Investigator:
Robert Wilkinson, Ph.D.Environmental Studies Program
University of California, Santa Barbara *
* Contact:([email protected]) phone: 805 569 25901428 West Valerio Street, Santa Barbara, CA 93101

2
Acknowledgments
The author would like to acknowledge the following individuals for their assistance andsupport for this project: Dr. Mel Manalis, Environmental Studies Program, UCSB; AshleyLyon and Jason Cline, UCSB environmental studies program research assistants; and RyanAubrey, National Center for Geographic Information Analysis and UCSB Department ofGeography.
Acknowledgment and appreciation is also due to the reviewers of this document (listed in theappendix) and to those who took time to provide valuable information for the analysis.
The California Institute for Energy Efficiency and the Lawrence Berkeley Lab projectmanagers also deserve a note of appreciation. Without exception, they have been highlysupportive of this exploratory analysis.
3
CONTENTS
Executive Summary 5
Overview 6Water Systems Account for Significant Energy Use in California 6
Interbasin Transfers 6California Energy Use 8
Water Sources and Use in California 10Whole-Systems Approach to Water/Energy Analysis 14Opportunities for Efficiency Improvements in Water Management 15Data for Specific Geographic Locations 17Methodology for Analysis 17Policy Implications 19
Energy Use in Water Systems 20Overview of Energy Inputs to Water Systems 20Primary Water Users: M&I and Agriculture 21Major Supply Systems: Interbasin Transfers 21
State Water Project 22Colorado River Aqueduct 30
Regional Distribution 32The Metropolitan Water District 32
Local Sources (Surface and Groundwater) 37Treatment and Distribution 38End-Use (Pumping, Treatment, Processes, and Thermal) 39Wastewater Catchment and Treatment 39Wastewater Reuse 43Desalination 44
Energy Analysis 45Methodologies Developed 45
Energy Matrix 45Geographical Information System Application 45
Spreadsheet Matrix for Energy Intensity Analysis 46
Potential Efficiency Improvements 54Water Systems and Potential Efficiency Improvements 54
Water-Efficiency Potential in the Residential Water Use Sector 54Water-Efficiency Potential in the Commercial, Industrial,
and Institutional (CII) Sector 55Water and Wastewater Treatment 61
Policy Implications and Opportunities Based on Findings 63The “Best Management Practices” Framework for Water Use
Efficiency Improvements 63The BMP Concept and Process 64
4
Background on the California “Best Management Practices” Process 66Implementation of the BMPs 68Performance Challenges 70Future BMP Progress 71
Agricultural Sector “Efficient Water Management Practices” Program 71The Southern California Energy and Water Partnership 72Policy Implications of Findings for the CII Sector 73
Recommendations for Further Research 76
Appendix 76List of Acronyms 77Conversion Factors 78Member Agencies of MWD 79Regulations Affecting the Water and Wastewater Industry 80
Sources 81
5
EXECUTIVE SUMMARY
Critical elements of California’s water infrastructure are highly energy intensive. Movinglarge quantities of water long distances and over significant elevations in California, treatingand distributing it within the state’s communities and rural areas, using it for various purposes,and treating the resulting wastewater, accounts for one of the largest uses of electrical energyin the state. Improving the efficiency with which water is used provides an importantopportunity to increase related energy efficiency. (“Efficiency” as used here describes theuseful work or service provided by a given amount of water.) Significant potential economicas well as environmental benefits can be cost-effectively achieved in the energy sectorthrough efficiency improvements in the state’s water systems.
This exploratory study for the California Institute for Energy Efficiency examines theenergy intensity of water used in specific geographic areas of the state, and it estimates thepotential energy benefits of efficiency improvements of water use. (Energy intensity is thetotal amount of energy, on a whole-system basis, required for the use of a given amount ofwater in a specific location.) A methodology was developed to account for total energyrequirements for water used within a specific service area. A user-friendly and adjustablespread-sheet tool was created to apply the methodology, and a geographic informationsystem (GIS) application was developed to represent the data in a map-based system. Datawas obtained for sample areas to demonstrate the application of the methodology and tools.
The study found that the energy intensity of water varies considerably by geographic locationof both end-users and sources. Water use in certain parts of the state is highly energy-intensive due to the combined requirements of conveyance over long distances withsignificant elevation lifts, local treatment and distribution, and wastewater collection andtreatment processes. The analysis also indicates that significant potential energy efficiencygains are possible through implementation of cost-effective water efficiency improvements.
The municipal and industrial (M&I) sector is considerably more energy intensive thanagriculture for a variety of reasons. Significant water and energy efficiency improvementshave been demonstrated in the M&I sector in many areas of the state. In the agriculturalsector, there is wide variability in both water use efficiency and energy intensity of the waterused depending on a number of factors including sources of water, irrigation practices, andprice. This analysis focused on the M&I sector for two reasons: greater energy intensity, andavailability of data.
An important element of this exploratory research project has been a review of previouswork, both in practice and on paper, addressing energy elements of water and wastewaterprocesses and systems. Background information is included on each element of the watersystem (supply through wastewater treatment), along with references and sources, in order tofacilitate further research.
This exploratory study identifies significant potential cost-effective energy efficiencybenefits from integrated energy, water, and wastewater efficiency programs. It alsoacknowledges important work already undertaken by various agencies, departments,associations, private sector users, and non-governmental organizations in the area ofcombined end-use efficiency strategies.
The report concludes with recommendations for further research priorities based on theexploratory work undertaken for this project.
6
OVERVIEW
Water Systems Account for Significant Energy Use in California
Water systems in California, including extraction of “raw water” supplies from naturalsources, conveyance, treatment and distribution, end-use, and wastewater treatment, accountfor one of the largest energy uses in the state. The total energy embodied in a unit ofdelivered water (that is, the amount of energy required to transport, treat, and process a givenamount of water) varies with location, source, and use within the state. In most areas, theenergy intensity will increase in the future due to limits on water resources and regulatoryrequirements for water quality and other factors. 1
Interbasin Transfers
California’s water systems are uniquely energy-intensive, relative to national averages, due topumping requirements for major conveyance systems which move large volumes of waterlong distances and over thousands of feet in elevation lift. Some of the interbasin transfersystems (systems that move water from one watershed to another) are net energy producers,such as the San Francisco and Los Angeles aqueducts. Others, such as the State Water Project(SWP) and the Colorado River Aqueduct (CRA) require large amounts of electrical energy toconvey water. On average, approximately 3,000 kWh is necessary to pump one acre-foot(AF) of SWP water to southern California,2 and 2,000 kWh is required to pump one AF ofwater through the CRA to southern California.3
As outlined in this study, energy inputs for local treatment and distribution, on-site uses(facility-level pumping, processing, thermal requirements for end-uses), and wastewatercollection and treatment, must be added to the energy required to provide “raw” water supplies(from imports and/or local supplies) in order to develop an estimate for total embodied energyor energy intensity.
Energy intensity, or embodied energy, is the total amount of energy,calculated on a whole-system basis, required for the use of a given amountof water in a specific location.
Total energy requirements for use of marginal (e.g. imported) supplies of water in SouthernCalifornia were estimated in 1992 in a study prepared for Southern California Edison at3,519 kWh/acre-foot (0.01 kWh/gallon).4 This is an average figure for marginal suppliesfor the region. In specific geographic areas, the figure is higher due to additional pumpingrequirements. The average energy requirement for blended water (local and importedsupplies) was estimated at 2,439 kWh/AF due to less energy intensive local supplies.
Water system operations provide a number of challenges for energy systems due to factorssuch as large loads for specific facilities, time and season of use, and geographic distribution ofloads. Key pumping plants are among the largest electrical loads in the state. For example,the SWP’s Edmonston Pumping Plant, situated at the foot of the Tehachapi mountains,raises water 1,926 feet (the highest single lift of any pumping plant in the world) and is oneof the largest single users of electricity in the state. 5 In total, the SWP is the largest singleuser of electricity in the state.6
7
Water use in homes located in some areas of the state accounts for the equivalent of a majorend-use electrical appliance. For example, a study conducted for Southern California Edisonfound that the energy required to provide water use in a typical southern California residencecan rank third behind the air conditioner and refrigerator as the largest energy-user “in” thehome.7 (For homes with efficient refrigerators and without air conditioners, water use maybe the largest energy user.) Approximately sixty percent of the state’s population is locatedin Southern California.
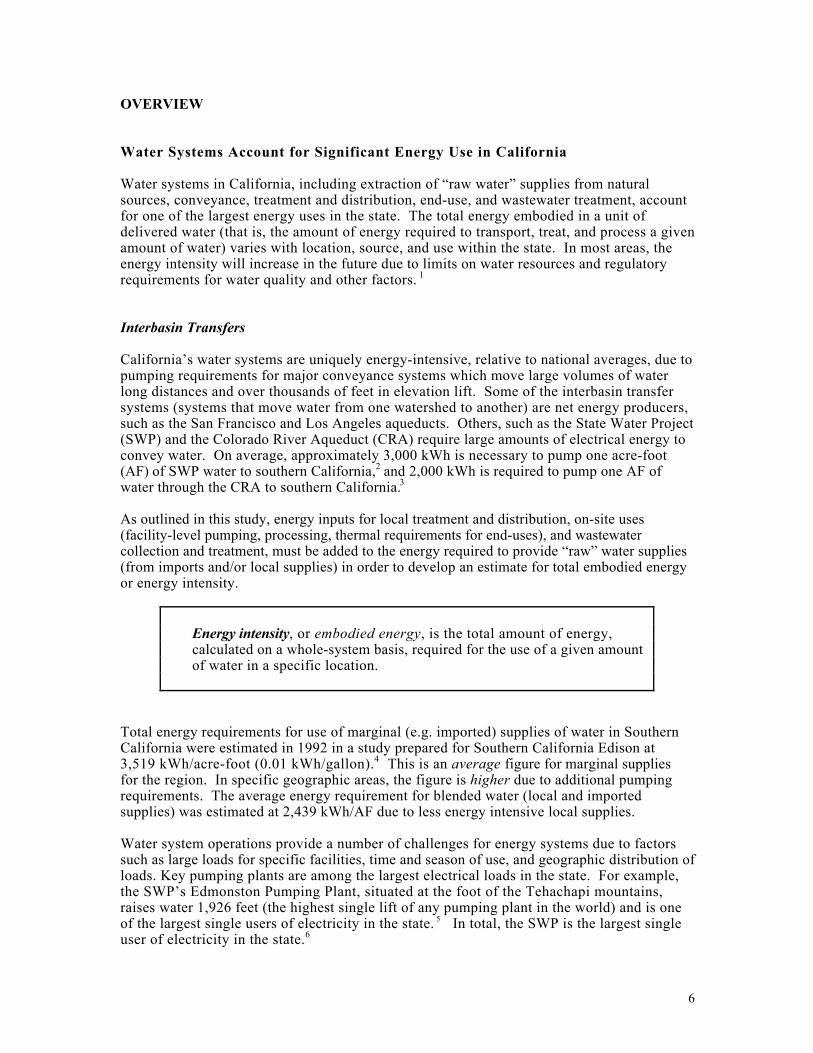
The following graph indicates the average constituent energy inputs for water systems insouthern California as a percent of total energy use for water systems.
Source: QEI, Inc., 1992, Electricity Efficiency Through Water Efficiency, Report for the Southern California Edison Company, p. 2.
Electricity Use for Water System Components In Southern California
(As a percent of total energy inputs)
Waste Treatment
14%
Imported Water Supply71%
Groundwater Supply
6%Local Distribution9%
Source: QEI, Inc., 1992, Electricity Efficiency Through Water Efficiency, Report for the Southern California Edison Company, p. 2.
8
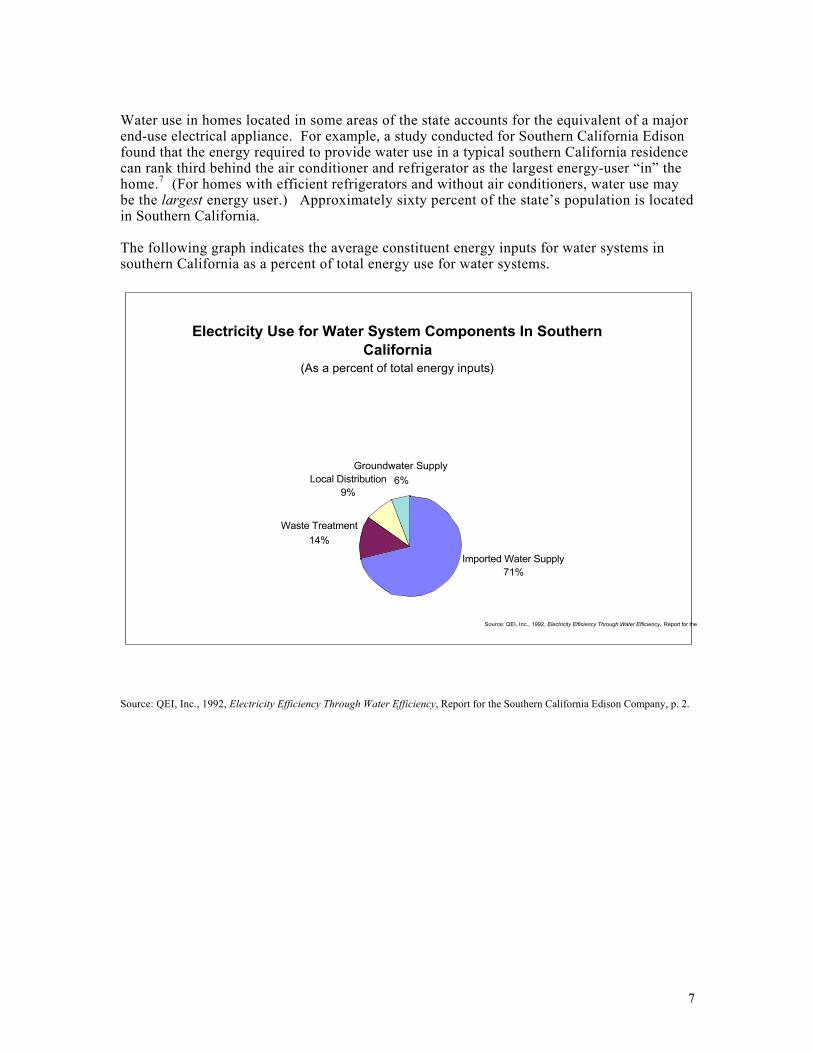
The percentages in the pie graph above are represented in energy units (kWh/af) in thefollowing graph. (The “supply” figure includes imported and groundwater.)
Source: QEI, Inc., 1992, Electricity Efficiency Through Water Efficiency, Report for the Southern California Edison Company, p.21.
The analysis for this exploratory research seeks to account for all energy inputs to watersystems based on a specific geographical area of use.
California Energy Use
California uses more energy than most nations, with a total consumption of more than sevenquads (quadrillion BTUs).8 On a per capita consumption basis, however, California ranks48th in the nation,9 and on the basis of energy used per dollar of gross product, Californiaranks 46th.10
According to the California Energy Commission, California’s electricity use has increased anaverage of 2.3 percent per year since 1977. The greatest share of electricity consumption isin the commercial sector, using 34 percent of the total and growing at an average annual rateof 3.3 percent. Residential electricity consumption has increased 2.3 percent per year onaverage, and industrial demand has grown at 1.4 percent per year.11 By some projections, the
Average Water System Electricity Use In Southern California(kWh/af)
1876
652
2747
2190
500
1000
1500
2000
2500
3000
Supply Distribution Waste Treatment Total
kW
h p
er
ac
re-f
oo
t
Source: QEI, Inc., 1992, Electricity Efficiency Through Water Efficiency, Report for the Southern California Edison Company, p. 21.

9
state’s population could increase 50 percent by 2020,12 and energy requirements willcontinue to rise with it.
The Metropolitan Water District of Southern California (MWD) reached similar findings.MWD estimates that energy requirements to deliver water to residential customers equals asmuch as 33 percent of the total average household electric use.13 A recent study for theElectric Power Research Institute (EPRI) by Franklin Burton indicates that at a nationallevel, water systems account for an estimated 75 billion kWh (3% of total electricitydemand).14 Due to California’s settlement patterns, topography, and climate patterns,energy use for water systems is greater than in other areas. Water systems in California areestimated to use about 6.9% of the state’s electricity.
The following pie graph indicates the general categories of energy use in the state. Note thatall three non-transportation sectors (residential, commercial, and industrial) account fornearly two-thirds of the state’s energy use (62%). Energy use for water systems in each ofthese three is significant.
California Energy Consumption by Sector—1993
Industrial27%
Transportation38%
Residential18%
Commercial17%
Source: California Energy Commission, www.energy.ca.gov
10
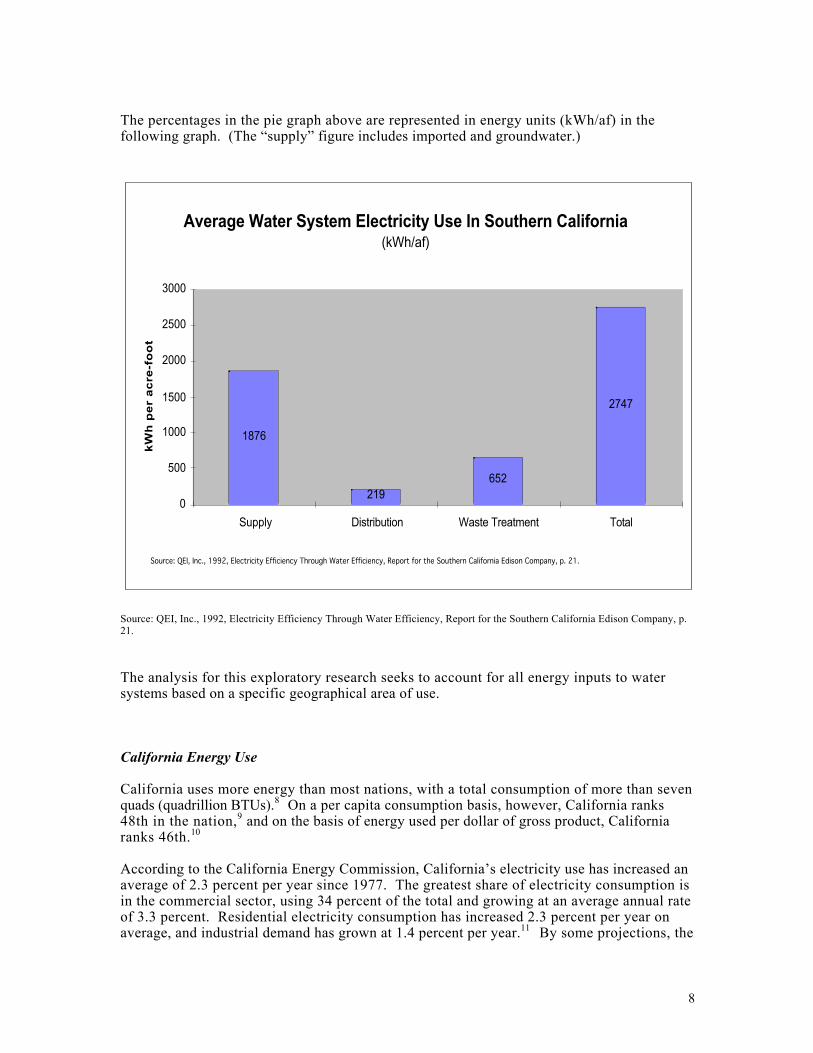
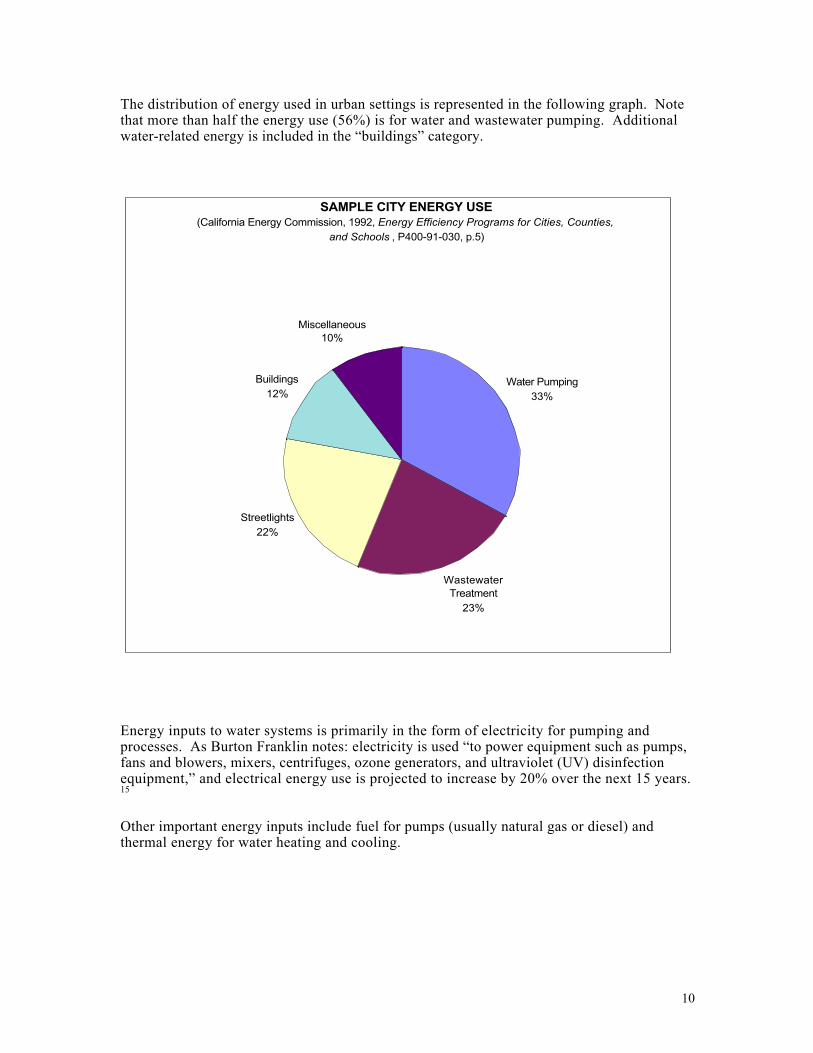
The distribution of energy used in urban settings is represented in the following graph. Notethat more than half the energy use (56%) is for water and wastewater pumping. Additionalwater-related energy is included in the “buildings” category.
Energy inputs to water systems is primarily in the form of electricity for pumping andprocesses. As Burton Franklin notes: electricity is used “to power equipment such as pumps,fans and blowers, mixers, centrifuges, ozone generators, and ultraviolet (UV) disinfectionequipment,” and electrical energy use is projected to increase by 20% over the next 15 years.15
Other important energy inputs include fuel for pumps (usually natural gas or diesel) andthermal energy for water heating and cooling.
SAMPLE CITY ENERGY USE(California Energy Commission, 1992, Energy Efficiency Programs for Cities, Counties,
and Schools , P400-91-030, p.5)
Water Pumping33%
Wastewater Treatment
23%
Streetlights22%
Buildings12%
Miscellaneous10%
11
Water Sources and Use in California
The distribution, in both time and space, of water sources in California impact the energyrequirements of water systems. A brief review of the context for water systems is providedhere.
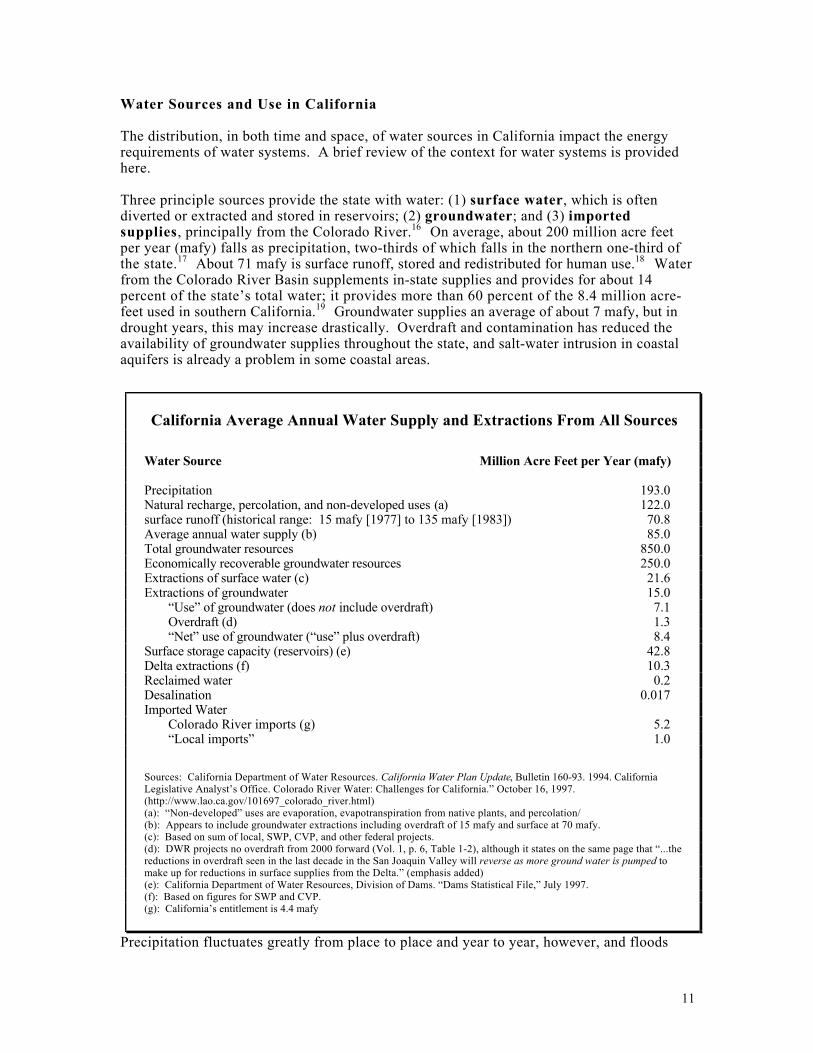
Three principle sources provide the state with water: (1) surface water, which is oftendiverted or extracted and stored in reservoirs; (2) groundwater; and (3) importedsupplies, principally from the Colorado River.16 On average, about 200 million acre feetper year (mafy) falls as precipitation, two-thirds of which falls in the northern one-third ofthe state.17 About 71 mafy is surface runoff, stored and redistributed for human use.18 Waterfrom the Colorado River Basin supplements in-state supplies and provides for about 14percent of the state’s total water; it provides more than 60 percent of the 8.4 million acre-feet used in southern California.19 Groundwater supplies an average of about 7 mafy, but indrought years, this may increase drastically. Overdraft and contamination has reduced theavailability of groundwater supplies throughout the state, and salt-water intrusion in coastalaquifers is already a problem in some coastal areas.
California Average Annual Water Supply and Extractions From All Sources
Water Source Million Acre Feet per Year (mafy)
Precipitation 193.0Natural recharge, percolation, and non-developed uses (a) 122.0surface runoff (historical range: 15 mafy [1977] to 135 mafy [1983]) 70.8Average annual water supply (b) 85.0Total groundwater resources 850.0Economically recoverable groundwater resources 250.0Extractions of surface water (c) 21.6Extractions of groundwater 15.0
“Use” of groundwater (does not include overdraft) 7.1Overdraft (d) 1.3“Net” use of groundwater (“use” plus overdraft) 8.4
Surface storage capacity (reservoirs) (e) 42.8Delta extractions (f) 10.3Reclaimed water 0.2Desalination 0.017Imported Water
Colorado River imports (g) 5.2“Local imports” 1.0
Sources: California Department of Water Resources. California Water Plan Update, Bulletin 160-93. 1994. CaliforniaLegislative Analyst’s Office. Colorado River Water: Challenges for California.” October 16, 1997.(http://www.lao.ca.gov/101697_colorado_river.html)(a): “Non-developed” uses are evaporation, evapotranspiration from native plants, and percolation/(b): Appears to include groundwater extractions including overdraft of 15 mafy and surface at 70 mafy.(c): Based on sum of local, SWP, CVP, and other federal projects.(d): DWR projects no overdraft from 2000 forward (Vol. 1, p. 6, Table 1-2), although it states on the same page that “...thereductions in overdraft seen in the last decade in the San Joaquin Valley will reverse as more ground water is pumped tomake up for reductions in surface supplies from the Delta.” (emphasis added)(e): California Department of Water Resources, Division of Dams. “Dams Statistical File,” July 1997.(f): Based on figures for SWP and CVP.(g): California’s entitlement is 4.4 mafy
Precipitation fluctuates greatly from place to place and year to year, however, and floods
12
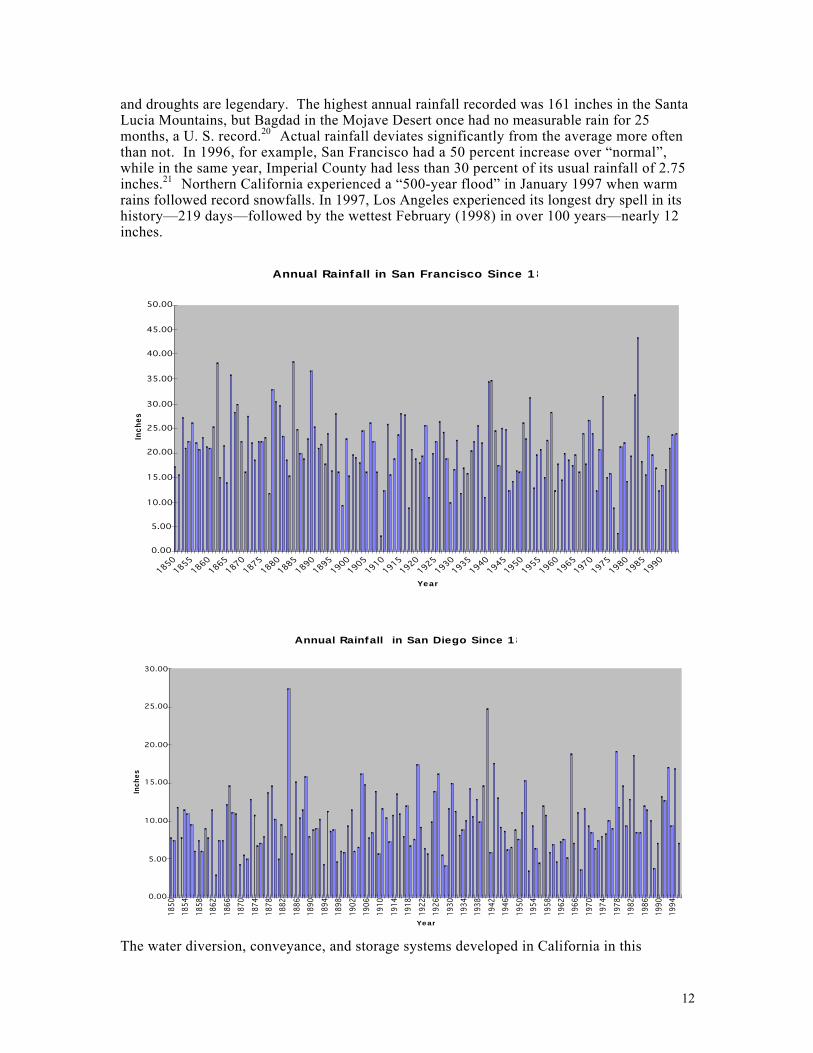
and droughts are legendary. The highest annual rainfall recorded was 161 inches in the SantaLucia Mountains, but Bagdad in the Mojave Desert once had no measurable rain for 25months, a U. S. record.20 Actual rainfall deviates significantly from the average more oftenthan not. In 1996, for example, San Francisco had a 50 percent increase over “normal”,while in the same year, Imperial County had less than 30 percent of its usual rainfall of 2.75inches.21 Northern California experienced a “500-year flood” in January 1997 when warmrains followed record snowfalls. In 1997, Los Angeles experienced its longest dry spell in itshistory—219 days—followed by the wettest February (1998) in over 100 years—nearly 12inches.
Annual Rainfall in San Francisco Since 1850
0.00
5.00
10.00
15.00
20.00
25.00
30.00
35.00
40.00
45.00
50.00
18501855
18601865
18701875
18801885
18901895
19001905
19101915
19201925
19301935
19401945
19501955
19601965
19701975
19801985
1990
Year
Inch
es
Annual Rainfall in San Diego Since 1850
0.00
5.00
10.00
15.00
20.00
25.00
30.00
1850
1854
1858
1862
1866
1870
1874
1878
1882
1886
1890
1894
1898
1902
1906
1910
1914
1918
1922
1926
1930
1934
1938
1942
1946
1950
1954
1958
1962
1966
1970
1974
1978
1982
1986
1990
1994
Year
Inch
es
The water diversion, conveyance, and storage systems developed in California in this
13
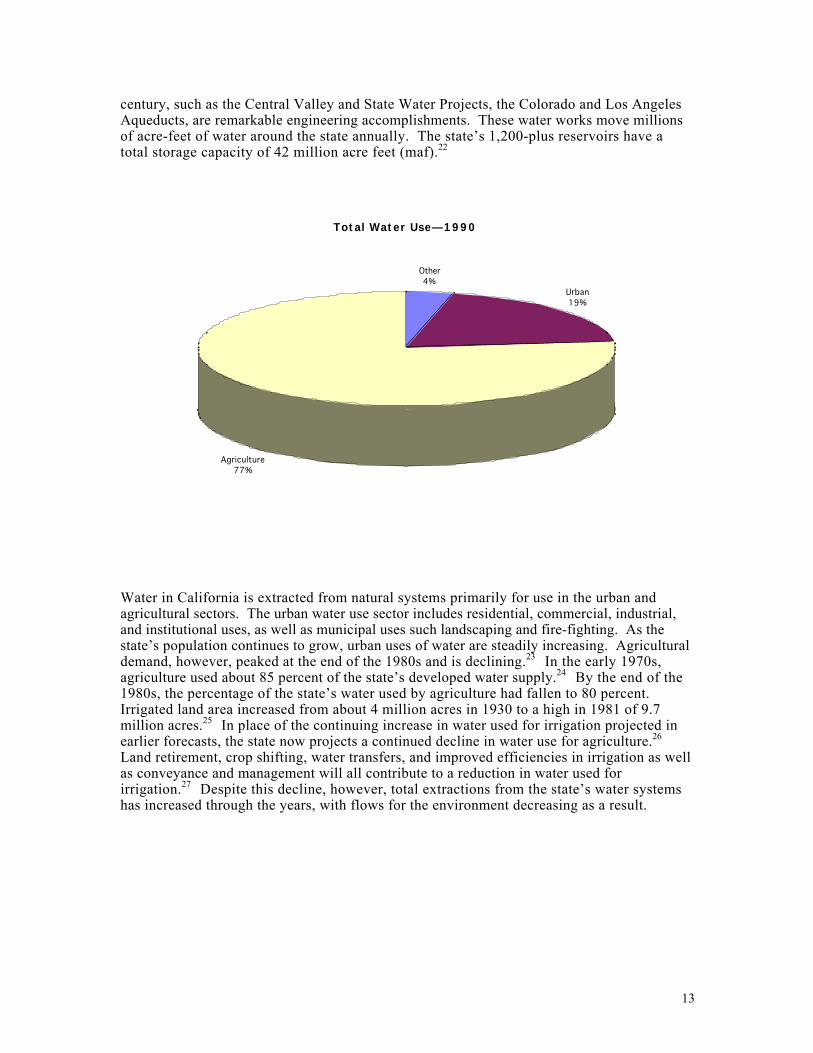
century, such as the Central Valley and State Water Projects, the Colorado and Los AngelesAqueducts, are remarkable engineering accomplishments. These water works move millionsof acre-feet of water around the state annually. The state’s 1,200-plus reservoirs have atotal storage capacity of 42 million acre feet (maf).22
Total Water Use—1990
Other4%
Urban19%
Agriculture77%
Water in California is extracted from natural systems primarily for use in the urban andagricultural sectors. The urban water use sector includes residential, commercial, industrial,and institutional uses, as well as municipal uses such landscaping and fire-fighting. As thestate’s population continues to grow, urban uses of water are steadily increasing. Agriculturaldemand, however, peaked at the end of the 1980s and is declining.23 In the early 1970s,agriculture used about 85 percent of the state’s developed water supply.24 By the end of the1980s, the percentage of the state’s water used by agriculture had fallen to 80 percent.Irrigated land area increased from about 4 million acres in 1930 to a high in 1981 of 9.7million acres.25 In place of the continuing increase in water used for irrigation projected inearlier forecasts, the state now projects a continued decline in water use for agriculture.26
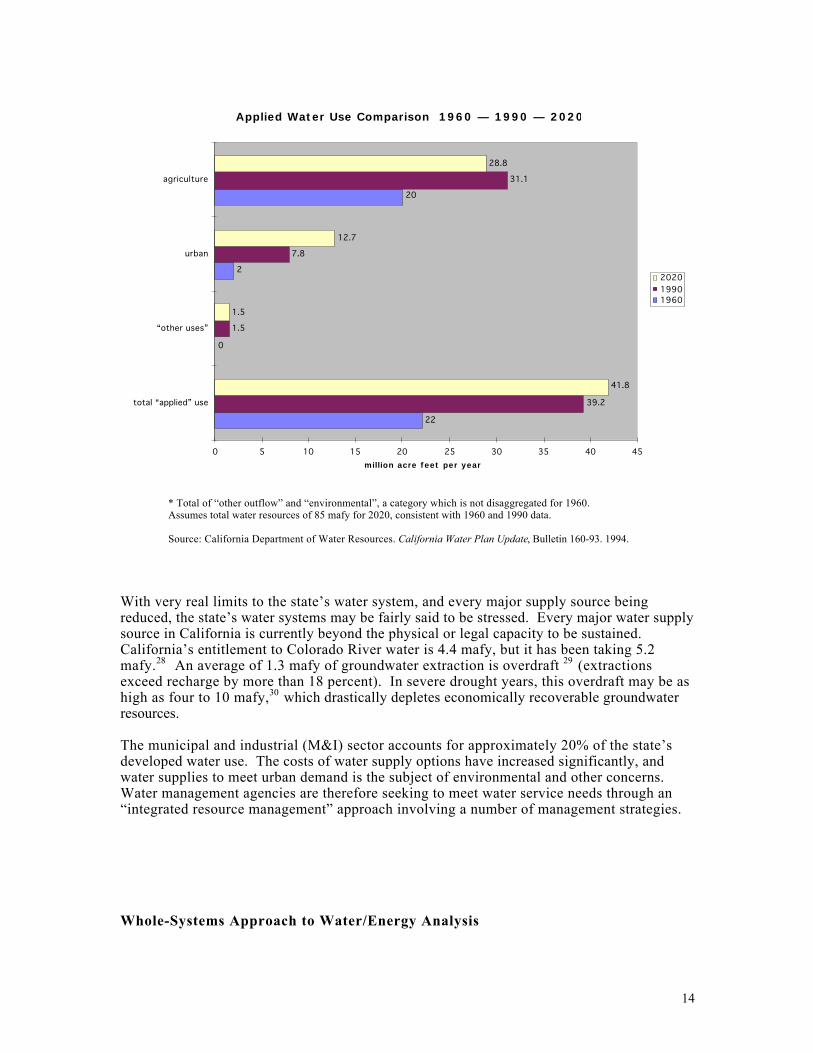
Land retirement, crop shifting, water transfers, and improved efficiencies in irrigation as wellas conveyance and management will all contribute to a reduction in water used forirrigation.27 Despite this decline, however, total extractions from the state’s water systemshas increased through the years, with flows for the environment decreasing as a result.
14
Applied Water Use Comparison 1960 — 1990 — 2020
22
0
2
20
39.2
1.5
7.8
31.1
41.8
1.5
12.7
28.8
0 5 10 15 20 25 30 35 40 45
total “applied” use
“other uses”
urban
agriculture
million acre feet per year
202019901960
* Total of “other outflow” and “environmental”, a category which is not disaggregated for 1960.Assumes total water resources of 85 mafy for 2020, consistent with 1960 and 1990 data.
Source: California Department of Water Resources. California Water Plan Update, Bulletin 160-93. 1994.
With very real limits to the state’s water system, and every major supply source beingreduced, the state’s water systems may be fairly said to be stressed. Every major water supplysource in California is currently beyond the physical or legal capacity to be sustained.California’s entitlement to Colorado River water is 4.4 mafy, but it has been taking 5.2mafy.28 An average of 1.3 mafy of groundwater extraction is overdraft 29 (extractionsexceed recharge by more than 18 percent). In severe drought years, this overdraft may be ashigh as four to 10 mafy,30 which drastically depletes economically recoverable groundwaterresources.
The municipal and industrial (M&I) sector accounts for approximately 20% of the state’sdeveloped water use. The costs of water supply options have increased significantly, andwater supplies to meet urban demand is the subject of environmental and other concerns.Water management agencies are therefore seeking to meet water service needs through an“integrated resource management” approach involving a number of management strategies.
Whole-Systems Approach to Water/Energy Analysis
15
This exploratory research project analyzes “whole-system” energy use in water systems forselected locations in California. Data for total energy use in each area includes the extractionand conveyance of water imported from outside of a local watershed, extraction of localsupplies (e.g. surface and groundwater sources), treatment and distribution of potable supplies,and wastewater collection and treatment. The sum of these energy inputs equals the net or“embodied” energy for water used in a specific location and is referred to as the energyintensity.31 Potential efficiency improvements in water use in the urban or “M&I” sector areexamined to estimate potential energy efficiency improvements.
Whole-systems analysis is an ambitious analytical undertaking due to the links of watersystems to other key resource, environmental, and economic systems. As used in the presentanalysis, the concept is inclusive of direct energy inputs to water systems. Secondary andtertiary impacts (positive and negative) are not within the scope of this exploratory effort.Important research questions relating to related environmental and economic implicationsand benefits are listed in the appendix.
It is important to note that this broader analytical approach is useful for water managers anddecision-makers who are seeking to comply in cost-effective and economically efficient wayswith regulatory requirements and policies to manage for multiple objectives. Water andwastewater service providers are facing significant management challenges due to increasingdemands for services caused by rapid population growth, the promulgation of more stringentand comprehensive environmental and health standards and regulations, and increasingoperating and capital costs.
Management and investment strategies based on whole-systems analysis provide potentialopportunities for superior return on investment (public or private), because the solution toone problem (e.g. capacity of wastewater treatment facilities) may be found in efficiencystrategies that also reduce requirements for extraction of water from natural systems,pumping requirements, treatment needs, and so on. Furthermore, the total multiple benefitsaccruing from efficiency improvements should be calculated based on whole-system impacts,not on sub-sets such as wastewater flow reduction alone. The whole-system methodology isan important tool for more accurate cost/benefit analysis.
Opportunities for Efficiency Improvements in Water Management
Water and wastewater managers have developed a number of effective technical andmanagement approaches to increasing efficiencies of both water and energy systems.Important progress has been made in all sectors of water systems, and a combination of bothtechnical and management opportunities exist for further improvement.32 Burton found inhis study for EPRI that further improvements are possible: “Improved efficiency can bebrought about by better management of operations and the incorporation of technologicalchanges.” 33
In certain important respects, water management trends are following the energy sectorexperience of the past several decades. For example, the Metropolitan Water District, thelargest water utility in the state, noted in the introduction to its 1990 Water ManagementPlan:
During the last decade, the arena of long-term water resources planning hasbeen broadened to include conservation as a promising managementalternative. Water supplies are currently undergoing the same change whichtook place in the energy industry during the 1970s. Metropolitan has made
16
water conservation an integral part of water resources planning. This requiredconsideration of the full implications of conservation in an engineering,economic, social, and environmental sense.34
MWD’s management approach embraces water efficiency improvements as an extension ofsupply: “A gallon of water conserved is a gallon of water that can be directed to another use.”35 MWD reported in 1998 that, along with its member agencies, it had “replacedapproximately 1 million water-wasting toilets with ultra-low flush models and distributedapproximately 3 million low-flow showerheads.” 36 According to MWD’s estimates, thesenew fixtures save more than 44,000 acre-feet annually.
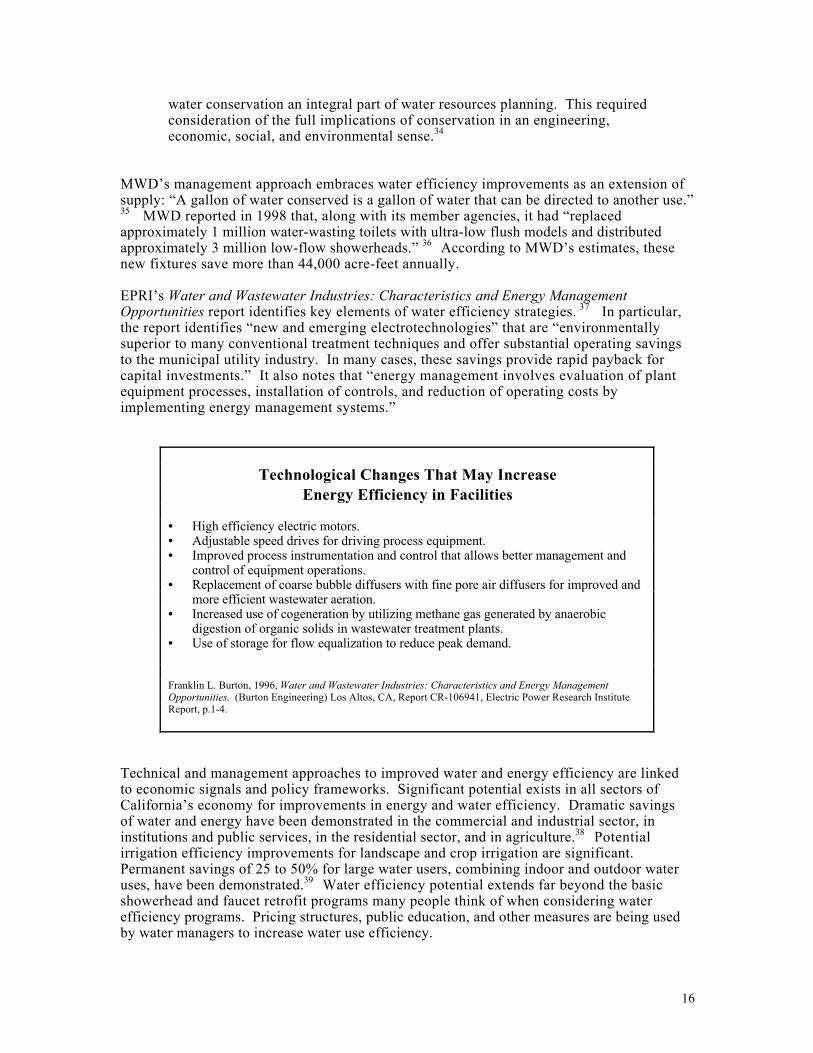
EPRI’s Water and Wastewater Industries: Characteristics and Energy ManagementOpportunities report identifies key elements of water efficiency strategies. 37 In particular,the report identifies “new and emerging electrotechnologies” that are “environmentallysuperior to many conventional treatment techniques and offer substantial operating savingsto the municipal utility industry. In many cases, these savings provide rapid payback forcapital investments.” It also notes that “energy management involves evaluation of plantequipment processes, installation of controls, and reduction of operating costs byimplementing energy management systems.”
Technological Changes That May IncreaseEnergy Efficiency in Facilities
• High efficiency electric motors.• Adjustable speed drives for driving process equipment.• Improved process instrumentation and control that allows better management and
control of equipment operations.• Replacement of coarse bubble diffusers with fine pore air diffusers for improved and
more efficient wastewater aeration.• Increased use of cogeneration by utilizing methane gas generated by anaerobic
digestion of organic solids in wastewater treatment plants.• Use of storage for flow equalization to reduce peak demand.
Franklin L. Burton, 1996, Water and Wastewater Industries: Characteristics and Energy ManagementOpportunities. (Burton Engineering) Los Altos, CA, Report CR-106941, Electric Power Research InstituteReport, p.1-4.
Technical and management approaches to improved water and energy efficiency are linkedto economic signals and policy frameworks. Significant potential exists in all sectors ofCalifornia’s economy for improvements in energy and water efficiency. Dramatic savingsof water and energy have been demonstrated in the commercial and industrial sector, ininstitutions and public services, in the residential sector, and in agriculture.38 Potentialirrigation efficiency improvements for landscape and crop irrigation are significant.Permanent savings of 25 to 50% for large water users, combining indoor and outdoor wateruses, have been demonstrated.39 Water efficiency potential extends far beyond the basicshowerhead and faucet retrofit programs many people think of when considering waterefficiency programs. Pricing structures, public education, and other measures are being usedby water managers to increase water use efficiency.
17
“Best Management Practices” (BMPs) have been developed and refined for California’s urbanwater sector which incorporate both technical and management elements.40 The BMPs arebeing implemented to varying degrees by urban water management agencies.41 A similarprocess has also been developed for the agricultural sector, though it is less comprehensiveand has yet to be widely employed.42 A detailed discussion of each measure may be found onthe CUWCC web site as noted. As noted in the section on recommended research, ancomprehensive analysis of efficiency potential for the BMPs and other measures should beundertaken.
Data for Specific Geographic Locations
The energy intensity of water is usually determined by geographic factors including thelocation of the sources of water and the location of end-use. Water in California is oftenmoved from one area to another via conveyance facilities. Total energy requirements forthe conveyance of water in systems like the SWP and the CRA to particular destinations maybe estimated with reasonable accuracy.43 In a given geographic area, the water used may be amix of imported and/or local supplies from surface or groundwater sources. 44 Each of thesesources can be identified and an energy value per unit of water from each may be determined.
Water is typically treated and delivered by a local water management entity, and thewastewater generated by users is usually collected and treated in specific geographic areas.45
Each responsible entity, from imported supply delivery agencies to local treatment anddistribution, to wastewater authorities, operate within specific geographic areas. In manycases the boundaries for jurisdiction of these agencies overlap or are inconsistent. Theanalysis must therefor account for geographic boundaries and attribute the appropriate energyfactor for each element of the system. The use of geographic information systems (GIS) todelineate the boundaries and record energy and other data is envisioned as a next step in theresearch initiated here. One significant benefit of the use of GIS is the ability to define areasof use based on location, and to attribute the energy per unit of water values accordingly.
Methodology for Analysis
One objective of this exploratory research project is the development of a methodology forthe calculation of total embodied energy in water in a particular location or geographic areaof use. To meet this objective, a spread-sheet tool has been developed with equationsembedded to calculate total energy requirements for water use. Both the equations and thedata input to the spread-sheet are fully transparent, so the user can alter elements as needed.The spread-sheet can be linked directly to GIS applications, such that data can be calculatedand displayed for the user through the GIS tool.
For purposes of this exploratory project, all data listed in the spread-sheet is referenced tothe text (located in the notes section of the appendix) which explains the source of the dataand other information.
Energy and Water UnitsThe units for energy are kilowatt hours (kWh) and therms. Therms (based on theenergy content of fuel) are 100,000 British thermal units (BTUs). For comparisonof total energy, therms are converted to kWh equivalent.
The common unit for water supply is an “acre-foot” (AF). An acre-foot of water isthe volume of water that would cover one acre with one foot. An acre-foot equals
18
325,851 gallons, or 43,560 cubic feet, or 1,233.65 cubic meters. (See conversiontable in the Appendix.) Wastewater is typically measured in “million gallons perday” (MGD). Figures have been converted to AF to provide consistency. One MGDequals 1,120 AF per year, and one AFY equals 0.000893 MGD. One acre-foot equals0.325851 MG.
Energy Inputs Included (and Excluded) in the AnalysisThe methodology developed for this analysis seeks to account for all of the energyinputs embodied in water delivered to and used in specific locations. Energy inputsfor extractions from natural systems through end-uses to ultimate disposal or re-useare included.
For purposes of this analysis, power generated by water systems separate from thedelivery and conveyance systems is not included in the calculations. This is becausepower would be generated in any event, regardless of the ultimate use of the water,and whether power is generated or not does not influence the energy requirements fordelivery and use. For example, hydro-power generation from water flowing fromnorthern California to the Delta is not counted in this analysis because it would begenerated whether the water flows out the Golden Gate or is pumped out of the deltato southern California in the SWP. The calculations for the SWP therefore start atthe delta. (This methodology is not intended to diminish the role and importance ofhydro-power production. The consideration is strictly the correct methodology forassessment of the total embodied energy in each unit of water used in a specificlocation.)
Power generated as part of the conveyance systems, however, is counted because it isdirectly related to the volumes of water pumped through the system. (For example,power recovered from the Warne and Castaic plants on the west branch of the SWPrecover a portion of the energy inputs in the system from the Banks through WindGap pumping plants in the Central Valley and the Edmonston and Oso pumpingplants that lift water over the Tehachapi Mountains. Total energy requirements areadjusted to credit back to the system the power generation against the pumpingrequirements to a given point in the system.
Policy Implications
This exploratory research project addresses the linkage between efficiency improvements inwater and energy use in California and the potential multiple benefits to be derived fromthem. Efficient water and energy use, and the facilitation of cost-effective measures toimprove efficiency for both, is an important policy challenge and opportunity. Multiplebenefits from integrated strategies constitute potential opportunities for policydevelopment.
With better information regarding the energy implications of water use, public policy andcombined investment and management strategies between energy, water, and wastewateragencies and utilities can be improved. Potential benefits include improved allocation ofcapital, avoided capital and operating costs, reduced burdens on rate-payers, andenvironmental benefits. Other societal goals, including restoration and maintenance ofenvironmental quality, can also be addressed more cost-effectively through policycoordination. Full benefits derived through water/energy efficiency strategies have not been

19
adequately quantified or factored into policy, although the California Public UtilitiesCommission adopted principles supporting such approaches in 1989.46 Recent droughtcycles in California, coupled with economic considerations and an increasing concern forenvironmental impacts, have confirmed the importance of efficient resource use as a policyobjective. Energy efficiency benefits accruing as a result of water efficiency programs holdsignificant potential.
20
ENERGY USE IN WATER SYSTEMS
Overview of Energy Inputs to Water Systems
There are four principle energy elements in water systems:
1. primary water extraction and supply delivery (imported and local)2. treatment and distribution within service areas3. on-site water pumping, treatment, and thermal inputs (heating and cooling)4. wastewater collection and treatment
Pumping water in each of these four stages is energy-intensive and constitutes a major use ofCalifornia’s total energy. Other important components of energy embodied in water useinclude groundwater pumping, treatment and pressurization of the water supply systems,treatment and thermal energy (heating and cooling) applications at the point of end-use, andwastewater pumping and treatment.
1. Primary water extraction and supply deliveryMoving water from near sea-level in the Sacramento-San Joaquin delta to theSan Joaquin-Tulare Lake Basin, the Central Coast, and Southern California,and from the Colorado River to metropolitan Southern California, is highlyenergy intensive. As noted, approximately 3,000 kWh is necessary to pumpone acre-foot (AF) of SWP water to southern California, and 2,000 kWh isrequired to pump one AF of water through the CRA to southern California.47
Groundwater pumping also requires significant amounts of energy dependingon the depth of the source. (Data on groundwater is incomplete and difficultto obtain because California does not manage groundwater resources, otherthan in adjudicated basins, and meters and data reporting are not required.)
2. Treatment and distribution within service areasWithin local service areas, water is treated, pumped, and pressurized fordistribution. Local conditions and sources determine both the treatmentrequirements and the energy required for pumping and pressurization.
3. On-site water pumping, treatment, and thermal inputsIndividual water users use energy to further treat water supplies (e.g. softeners,filters, etc.), circulate and pressurize water supplies (e.g. building circulationpumps), and heat and cool water for various purposes.
4. Wastewater collection and treatmentFinally, wastewater is collected and treated by a wastewater authority (unless aseptic system or other alternative is being used). Wastewater is sometimespumped to treatment facilities where gravity flow is not possible, and thestandard treatment processes require energy for pumping, aeration, and otherprocesses. (In cases where water is reclaimed and re-used, the calculation oftotal energy intensity is adjusted to account for wastewater as a source ofwater supply. The energy intensity generally includes the additional energyfor treatment processes beyond the level required for wastewater discharge,plus distribution.)
Water pumping, and specifically the long-distance transport of water in conveyancesystems, is a major element of California’s total demand for electricity. Water use, based on
21
embodied energy, is the second or third largest consumer of electricity in a typical SouthernCalifornia home after refrigerators and air conditioners. Electricity required to supportwater service in the typical home in Southern California is estimated at between 14% to 19%of total residential energy demand. If air conditioning is not a factor the figure is evenhigher.48 Nearly three quarters of this energy demand is for pumping imported water.
Both California State Water Project (SWP) and Colorado River supplies are energy-intensivedue to pumping requirements. The SWP supplies average 2,956 kWh/acre foot for deliverypumping alone, with Colorado River supplies averaging 1,916 kWh/acre foot.49 For the1989-90 fiscal year, Colorado river pumping50 (without accounting for station service andtransmission losses) was 2,434,567,313 kWh.51 The SWP required approximately3,420,092,000 kWh in the same year.52 The cost of this electricity is incorporated intowater rates.
Primary Users: M&I and Agricultural
The two major water users in California are agriculture (at around 80% of the total extractedamounts) and urban or “M&I” (municipal and industrial) sector at around 20%. The presentanalysis is focused on the M&I sector for several reasons. First, important data for theagriculture sector analysis is unavailable or difficult to obtain due to prevailing groundwaterlaw and other factors. Second, water use in the M&I sector is considerably more energy-intensive than in agriculture due in large part to major inter-basin conveyance systems.
Water managers typically identify urban water use in a broad category called municipal andindustrial (M&I), which generally includes residential uses as well as commercial andinstitutional, industrial, and municipal uses. An important sub-set of M&I water use is thenon-residential category of commercial, industrial, and institutional (CII) users.53
As noted above, this analysis focuses on the M&I sector due to its energy intensity and theavailability of data.
Major Supply Systems: Interbasin Transfers
Major inter-basin water transfers in California began at the turn of the 20th century. Earlytransfers, such as the Colorado River diversions to the Imperial Valley, were gravity fed andtherefore required no energy for pumping. The infamous Los Angeles aqueduct and SanFrancisco’s water from Hetch Hetchy Valley (in Yosemite National Park) are net energyproducers due to the hydro-power production of the systems. Systems built later in thecentury, however, required significant pumping plants ad energy inputs to run them to liftwater over mountain ranges. The State Water Project and the Colorado River Aqueduct arethe two most energy-intensive systems in the state, and are therefore the focus of thisanalysis.
The State Water Project
The State Water Project (SWP) is managed by the California Department of WaterResources (DWR) and provides water for agricultural and urban uses. 54 SWP facilities include
22
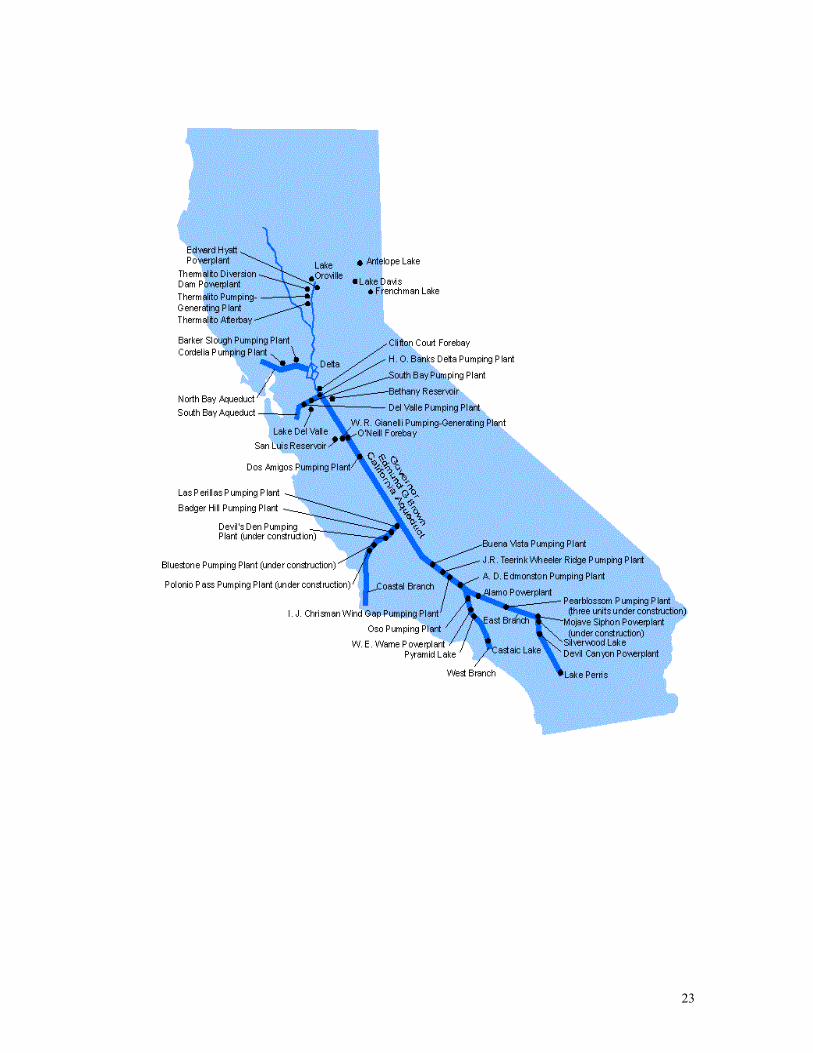
28 dams and reservoirs, 22 pumping and generating plants, and nearly 660 miles of aqueducts.55
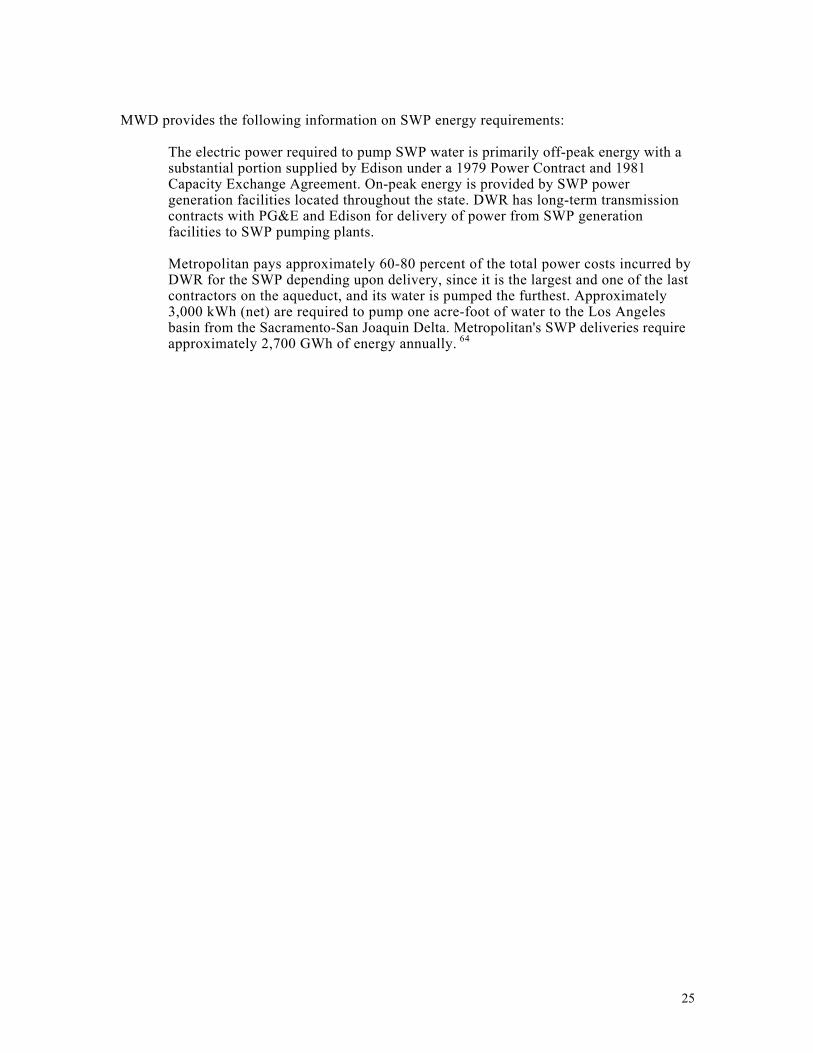
The SWP stores water in the Feather River watershed in Northern California. Lake Oroville,the project’s largest storage facility, has a capacity of about 3.5 million acre-feet. Threesmaller upstream reservoirs provide additional storage.56 (Oroville Dam is the tallest and oneof the largest earth-fill dams in the United States.)57 Power is generated at the Oroville Damas water is released down the Feather River, which flows in natural water courses into theSacramento River, through the Sacramento-San Joaquin Delta, and to the ocean through theSan Francisco Bay.
Water is pumped out of the delta for the SWP at two locations. From the northern Delta,Barker Slough Pumping Plant diverts water for delivery to Napa and Solano counties throughthe North Bay Aqueduct.58 Further south at the Clifton Court Forebay, water is pumped intoBethany Reservoir by the Banks Pumping Plant. From Bethany Reservoir, the majority ofthe water is conveyed south in the 444-mile-long Governor Edmund G. Brown CaliforniaAqueduct to agricultural users in the San Joaquin Valley and to urban users in SouthernCalifornia. The South Bay Pumping Plant also lifts water from the Bethany Reservoir intothe South Bay Aqueduct. 59
State Water ProjectNames and Locations of Primary Water Delivery Facilities
23

24
DWR provides the following description of water conveyance in the SWP:
California State Water Project
The California Aqueduct moves water south along the west side of the San JoaquinValley. It transports water to the Gianelli Pumping-Generating Plant and the San LuisReservoir60 which has a storage capacity of more than 2 million acre-feet.61 SWP waternot stored in San Luis Reservoir, and water released from San Luis, continues to flowsouth through the San Luis Canal, a portion of the California Aqueduct jointly owned bythe Department and the USBR. As the water flows through the San Joaquin Valley, it israised over 1,000 feet by four pumping plants—Dos Amigos, Buena Vista, Teerink, andChrisman — before reaching the foot of the Tehachapi Mountains. In the San JoaquinValley near Kettleman City, the Coastal Branch Aqueduct extends west to servemunicipal and industrial water users in San Luis Obispo and Santa Barbara counties.
The remaining water conveyed by the California Aqueduct is delivered to SouthernCalifornia. Pumps at Edmonston Pumping Plant, situated at the foot of the mountains,raise the water 1,926 feet — the highest single lift of any pumping plant in the world.Then the water enters 8.5 miles of tunnels and siphons as it flows into the AntelopeValley, where the California Aqueduct divides into two branches, the East Branch andthe West Branch. The East Branch carries water through the Antelope Valley intoSilverwood Lake in the San Bernardino Mountains. From Silverwood Lake, the waterflows through the San Bernardino Tunnel into the Devil Canyon Powerplant. The watercontinues down the East Branch to Lake Perris, the southernmost SWP reservoir. Waterin the West Branch flows through the Warne Powerplant into Pyramid Lake in LosAngeles County. From there it flows through the Angeles Tunnel and CastaicPowerplant into Castaic Lake, terminus of the West Branch.
California Department of Water Resources, 1996, Management of the California State Water Project .Bulletin 132-96.
The SWP is the largest consumer of electrical energy in the state, requiring an average of5,000 GWh per year.62 The energy required to operate the SWP is provided by acombination of DWR’s own hydroelectric and coal-fired generation plants and powerpurchased from other utilities. The project’s eight hydroelectric power plants, including threepumping-generating plants, and a coal-fired plant produce enough electricity in a normal yearto supply about two-thirds of the project's necessary power.
Energy requirements would be considerably higher if the SWP was delivering full entitlementvolumes of water. The project has in fact been delivering approximately half its contractedvolumes. As DRW comments:
Facilities were designed and built to meet demands for water through 1990; thesedemands were projected to be about 4.0 million acre-feet. Actual demand, however,has not developed as projected, owing to circumstances such as slower populationgrowth, changes in local use, local water conservation programs, and conjunctive useprograms. The most SWP entitlement water delivered to date was about 2.8 millionacre-feet in 1989.63
25
MWD provides the following information on SWP energy requirements:
The electric power required to pump SWP water is primarily off-peak energy with asubstantial portion supplied by Edison under a 1979 Power Contract and 1981Capacity Exchange Agreement. On-peak energy is provided by SWP powergeneration facilities located throughout the state. DWR has long-term transmissioncontracts with PG&E and Edison for delivery of power from SWP generationfacilities to SWP pumping plants.
Metropolitan pays approximately 60-80 percent of the total power costs incurred byDWR for the SWP depending upon delivery, since it is the largest and one of the lastcontractors on the aqueduct, and its water is pumped the furthest. Approximately3,000 kWh (net) are required to pump one acre-foot of water to the Los Angelesbasin from the Sacramento-San Joaquin Delta. Metropolitan's SWP deliveries requireapproximately 2,700 GWh of energy annually. 64
26
State Water ProjectNames, Locations and Generating Capacity of Primary Power Facilities
27
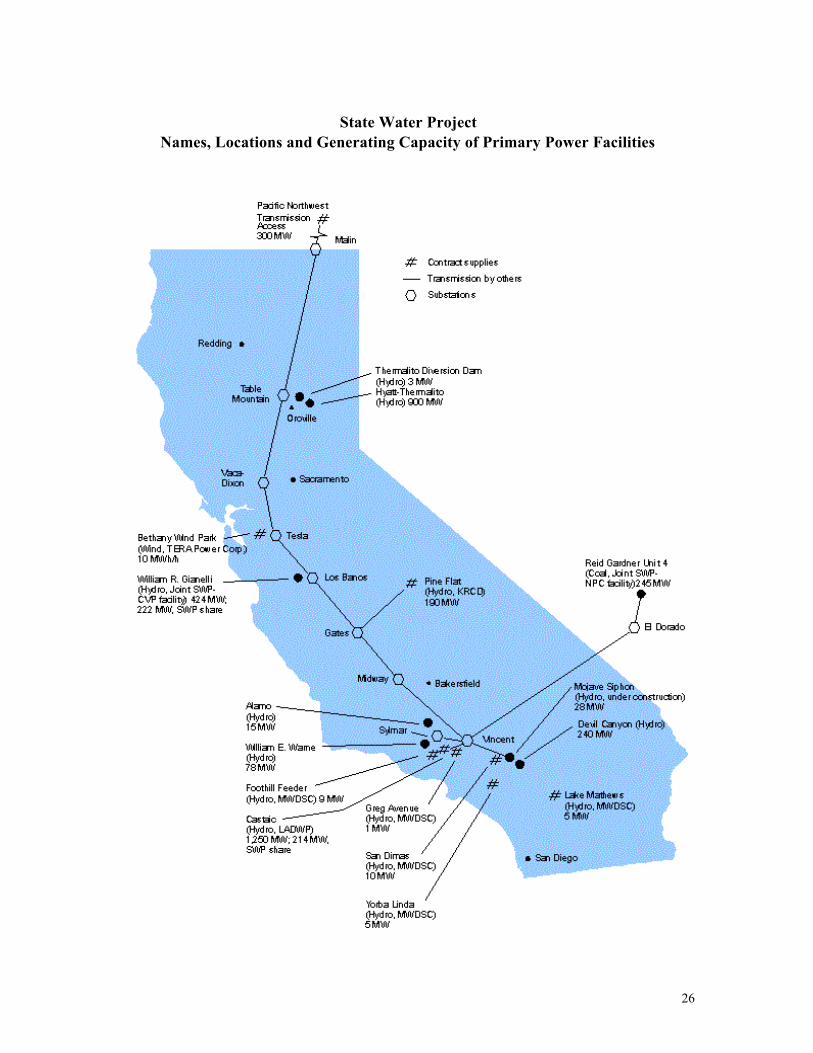
The following chart shows energy requirements to pump an acre-foot of water through eachpumping station on the SWP. Also shown is the cumulative kilowatt-hours necessary topump the water as it moves south down the state and the recovery energy from generators onthe down-hill runs.
State Water ProjectKilowatt-Hours Per Acre Foot Pumped
(Includes Transmission Losses)
Source: Based on data from: California Department of Water Resources, State Water Project Analysis Office, Divisionof Operations and Maintenance, Bulletin 132-97, 4/25/97.
All figures: kWh/AFTop figure = cumulative energyLower Figure = facility energy Devil Canyon
Mojave Siphon Variable
Pearblossom 4,349 3,2364,444 -95 -1,113
703
H.O. Banks Dos Amigos Buena Vista Wheeler Ridge Wind Gap A.D. Edmonston Alamo296 434 676 971 1,610 3,846 3,741296 138 242 295 639 2,236 -105
South Bay Las Perillas
1,093 511797 77
San Luis VariablePumping (169-523) Badger Hill Oso W.E. Warne Castaic
Generating (105-287) 711 4,126 3,553 2,580Del Valle 200 280 -573 -9731,16572
Devil's Den Bluestone Polonio
1,416 2,121 2,826705 705 705
28
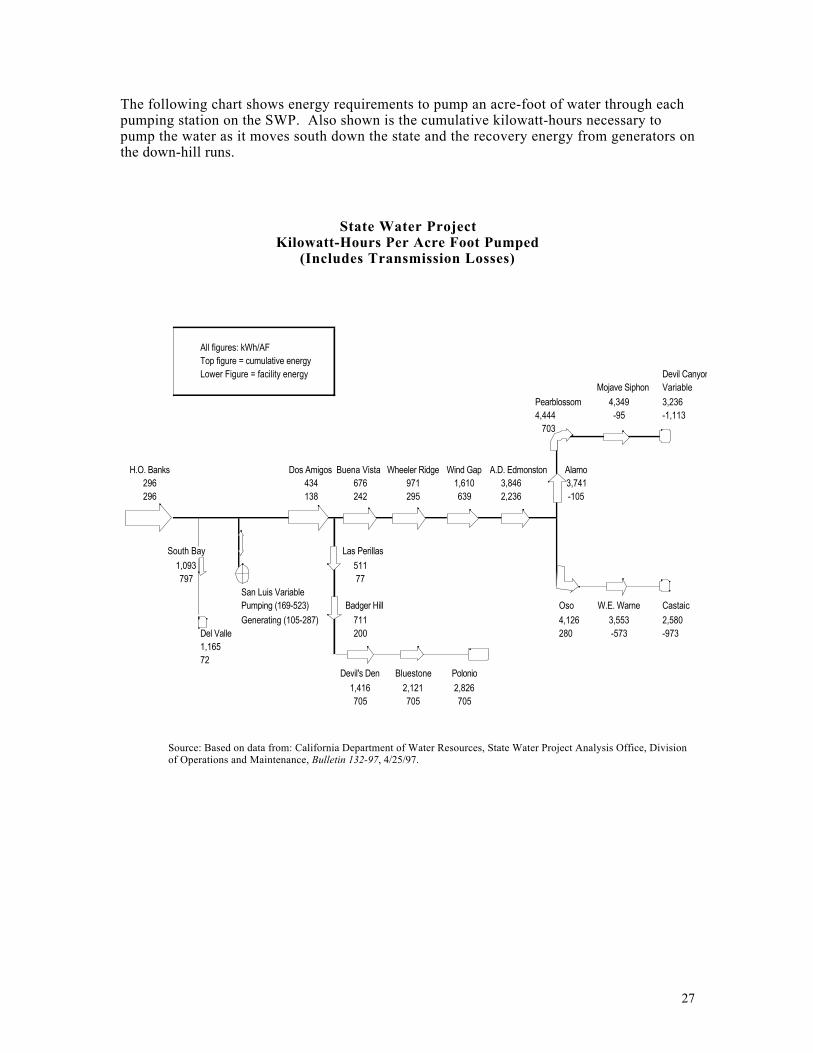
State Water ProjectWater Delivered in Calendar Year 1995 and Delivery Locations
29
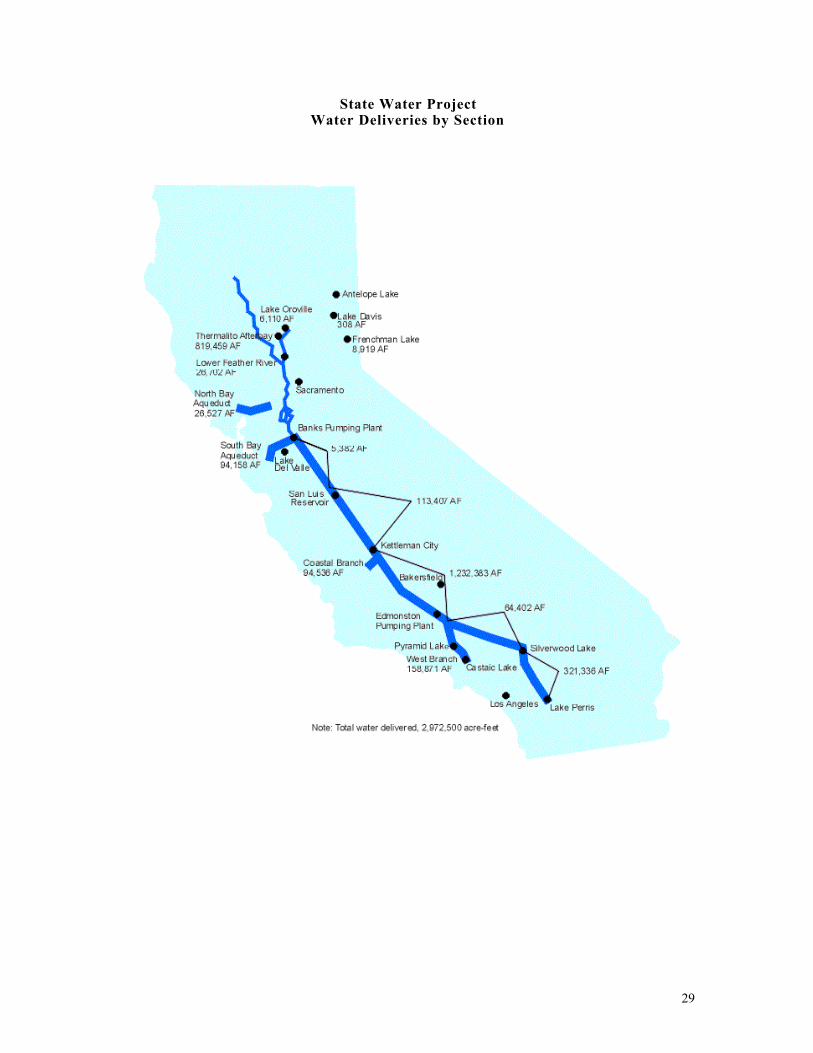
State Water ProjectWater Deliveries by Section
30
Colorado River Aqueduct
Significant volumes of water are imported to Southern California from the Colorado Rivervia the Colorado River Aqueduct (CRA). Though MWD’s entitlement to Colorado Riverwater is 550,000 afy, it has extracted as much as 1.3 mafy through waste reductionarrangements with IID (adding about 106,000 afy) and by using “surplus” water.65 TheColorado River water supplies require about 2,000 kWh/af for conveyance to Lake Mathewsin the Los Angeles basin.
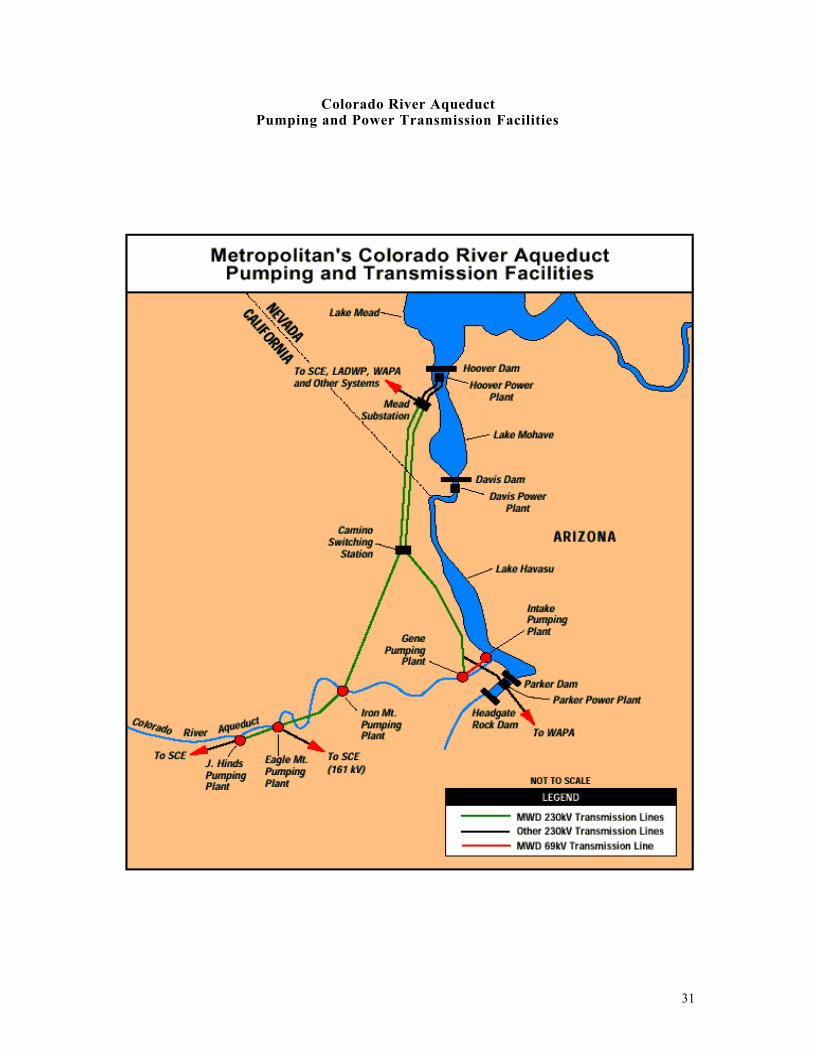
The Colorado River Aqueduct extends 242 miles from Lake Havasu on the Colorado River toits terminal reservoir, Lake Mathews, near Riverside. The Colorado River aqueduct wascompleted in 1941 and expanded in 1961 to a capacity of more than 1 MAF per year. Fivepumping plants lift the water 1,616 feet, over several mountain ranges, to southernCalifornia. To pump an average of 1.2 million acre-feet of water per year into the LosAngeles basin requires approximately 2,400 GWh of energy for the CRA's five pumpingplants.66 On average, the energy required to import Colorado River water is therefore about2,000 kWh/AF. The aqueduct was designed to carry a flow of 1,605 cfs (with the capacityfor an additional 15%).
The sequence for pumping the water supplies is as follows: The Whitsett Pumping Plantelevates water from Lake Havasu 291 feet out of the Colorado River basin. At “mile 2,”Gene pumping plant elevates water 303 feet to Iron Mountain pumping plant at mile 69,which then boosts the water another 144 feet. The last two pumping plants provide thehighest lifts - Eagle Mountain, at mile 110, lifts the water 438 feet, and Hinds PumpingPlant, located at mile 126, lifts the water 441 feet. 67 The five pumping plants each havenine pumps. The plants are designed for a maximum flow of 225 cubic feet per second (cfs).The CRA is designed to operate at full capacity with eight pumps in operation at each plant(1800 cfs). The ninth pump operates as a spare to facilitating maintenance, emergencyoperations, and repairs.68
31
Colorado River AqueductPumping and Power Transmission Facilities
32
MWD has recently improved the system’s energy efficiency. The average energy requirementfor the CRA was reduced from approximately 2,100 kWh /af to about 2,000 kWh /af “throughthe increase in unit efficiencies provided through an energy efficiency program.”69 The energyrequired to pump each af of water through the CRA is essentially constant, regardless of thetotal annual volume of water pumped. This is due to the 8-pump design at each pumping plant.The average pumping energy efficiency does not vary with the number of pumps operated, andthe same 2,000 kWh /af estimate is appropriate for both the “Maximum Delivery Case” andthe “Minimum Delivery Case.”70
Based on the relatively steep grade of the CRA, limited active water storage, and transit timesbetween plants, the system does not generally lend itself to shifting pumping loads from on-peak to off-peak. Under the Minimum Delivery Case, the reduced annual water deliverieswould not necessarily bring a reduction in annual peak load, since an 8-pump flow may stillneed to be maintained in certain months.71
Electricity to run the CRA pumps is provided by power from hydroelectric projects on theColorado River as well as off-peak power purchased from a number of utilities. TheMetropolitan Water District has contractual hydroelectric rights on the Colorado River to“more than 20 percent of the firm energy and contingent capacity of the Hoover powerplant and 50 percent of the energy and capacity of the Parker power plant.”72 Energypurchased from utilities makes up approximately 25 percent of the remaining energy neededto power the Colorado River Aqueduct.73
Regional Distribution
The Metropolitan Water District
The Metropolitan Water District of Southern California (MWD) is a regional waterwholesaler that imports water from the Colorado River and Northern California for resale toagencies in Southern California. Because MWD is the principal water supplier for southernCalifornia and an important link in the state’s two most energy-intensive interbasin watertransfers, the SWP and the CRA, it is described in some detail in this section.
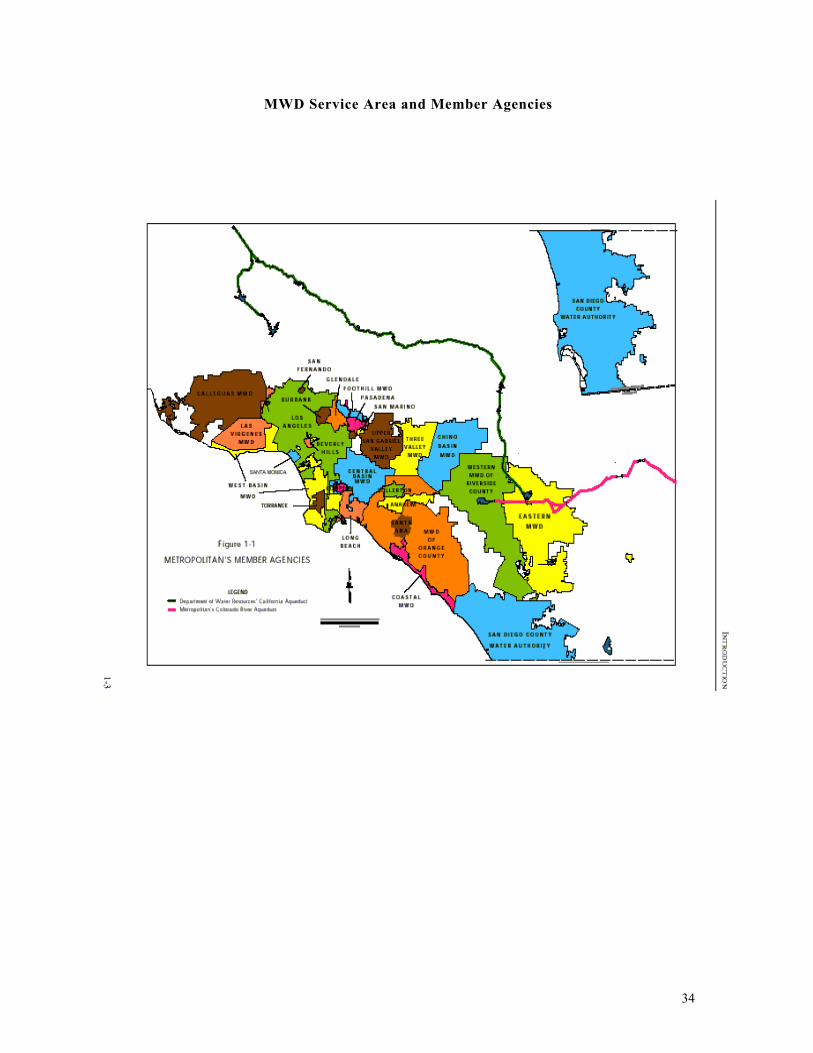
The Colorado River is MWD’s primary source of water supply, and MWD is the largest user ofSWP supplies. MWD provides about 60 percent of the water used by the nearly 16 millionpeople living in portions of Los Angeles, Ventura, Orange, Riverside, San Bernardino, and SanDiego counties.74 The area served covers about 5,200 square miles.
MWD owns and operates transmission infrastructure and has long-term entitlements to theHoover power plant and perpetual rights to the Parker power plant which provide sufficientpower for the CRA. Metropolitan pays “approximately 70 percent of the total SWP powerand transmission costs” arising from DWR's long-term agreements, and it Metropolitan ownsgenerates hydroelectric power along Metropolitan's water distribution system.75
Metropolitan generates hydroelectric energy within its system. MWD “sells energy from 15small and conduit hydroelectric units in its Southern California water distribution system. Theunits have a combined peak capacity of approximately 101 MW, and the energy from theunits is sold to DWR, Edison and PG&E under long-term contracts. A total of approximately330 GWh per year is sold from these power plants.” 76 “Metropolitan also owns and

33
operates five water filtration plants, which currently require approximately 30 GWh ofenergy annually. This energy is provided by the local serving utility under retail tariffs.” 77
Metropolitan's Integrated Resources Plan identified the following water supply sources as“developable” to meet southern California’s water uses: Colorado River Aqueduct, StateWater Project, recycling wastewater, recovering groundwater, conservation, desalination,storage and water transfers and exchanges.78
Member Agencies of theMWD of Southern California
City of Anaheim Three Valleys MWDFoothill MWD Inland Empire Utilities AgencyCity of San Fernando City of Los AngelesCity of Beverly Hills City of TorranceCity of Fullerton Coastal Municipal Water DistrictCity of San Marino MWD of Orange CountyCity of Burbank Upper San Gabriel Valley MWDCity of Glendale City of ComptonCity of Santa Ana City of PasadenaCalleguas MWD West Basin MWDLas Virgenes MWD Eastern Municipal Water DistrictCity of Santa Monica San Diego County Water AuthorityCentral Basin MWD Western MWD of Riverside CountyCity of Long Beach
34
MWD Service Area and Member Agencies

35
Metropolitan Water District of Southern CaliforniaWater Distribution System
36
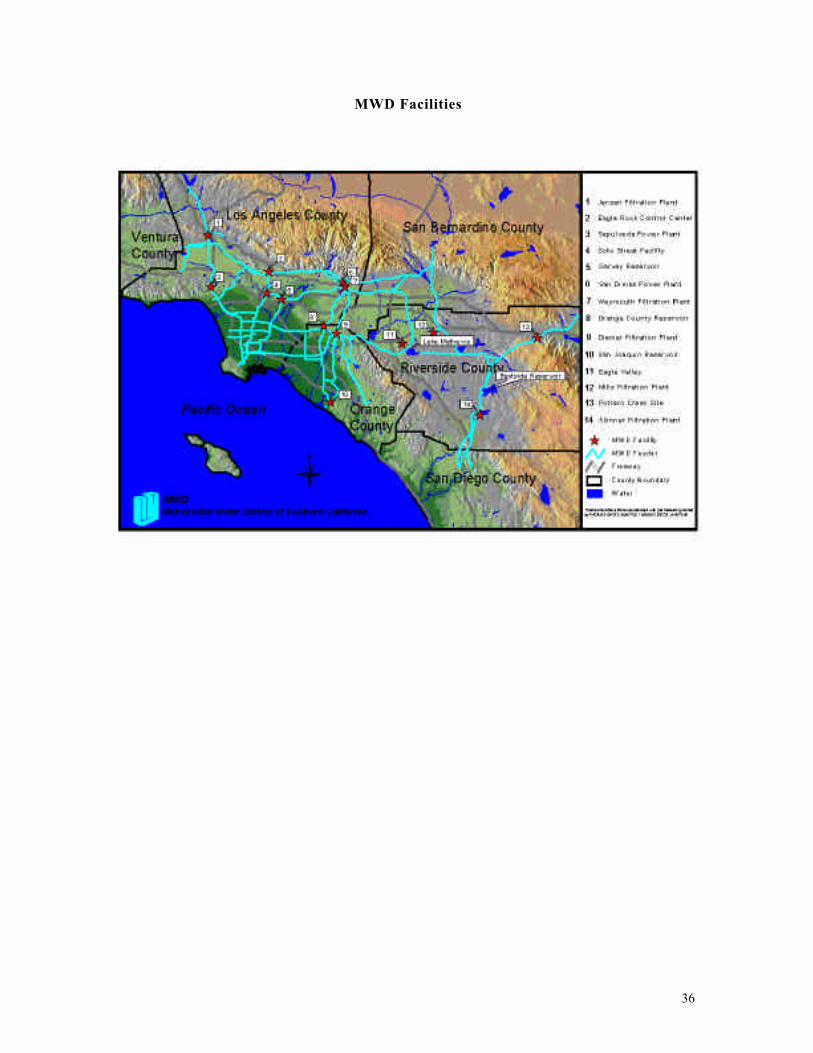
MWD Facilities
37
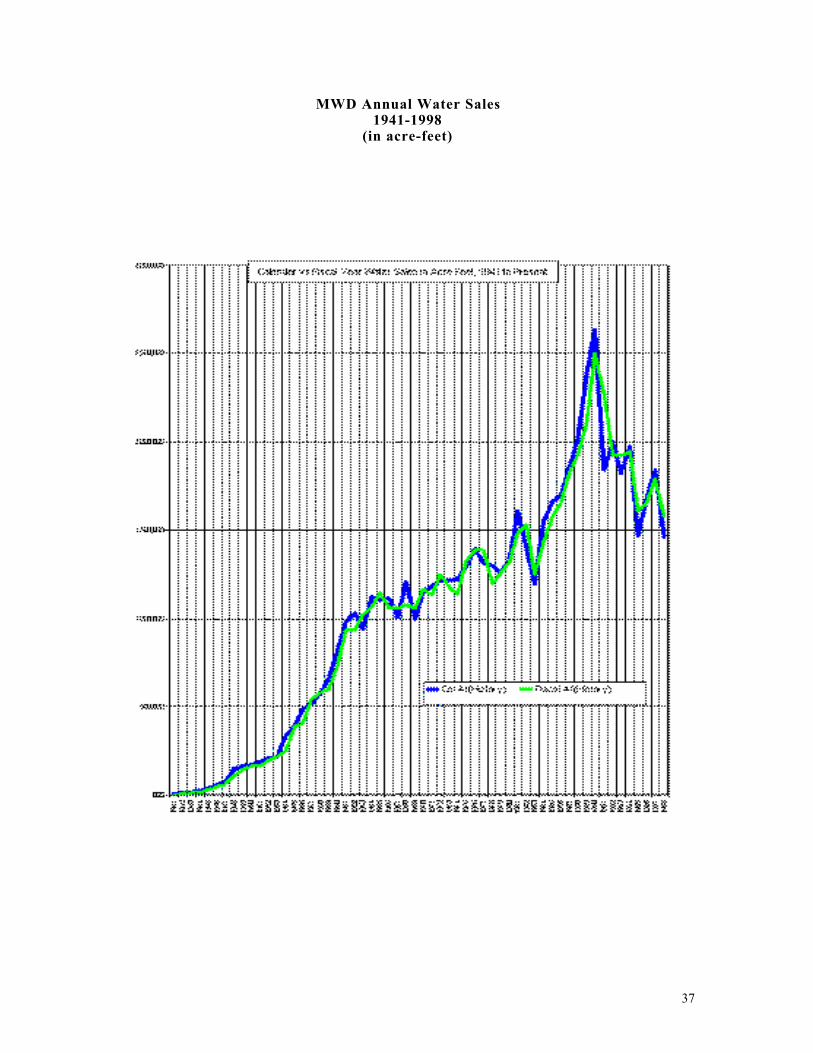
MWD Annual Water Sales1941-1998
(in acre-feet)
38
Local Sources (Surface and Groundwater)
Approximately one-third of the water used in southern California is provided by local surfaceand groundwater resources. 79 In some areas, all water is provided by local supplies. Inothers, imported water from the Colorado River and/or the SWP make up all of the supply.In most areas in southern California, water supplied to users is a variable mix of SWP, CRA,and local supplies depending on the time of year, the hydrologic conditions in the particularyear (e.g. wet conditions in the northern part of the state vs. local conditions).
Local supplies are considerably less energy-intensive than CRA and SWP imported suppliesdue to the pumping requirements for importing both CRA and SWP water. Some groundwater pumping is required.
The present analysis and methodology disaggregates imported and local supplies, and itprovides for identification of energy requirements for each source on a per kWh basis. Incases where pumps are driven by fuel rather than electricity, the energy is recorded in thermalunits (therms/Btus) and then converted to kWh for comparison and aggregation.
Treatment and Distribution
Once water is extracted from surface and/or groundwater sources and delivered to ageographic area where it is to be used, it is processed through treatment and/or filtrationsystems to meet health and other quality standards. It is then delivered to end-users throughlocal distribution systems which typically require pumping for delivery and pressurization torequired levels for fire protection. Pressure it typically regulated at the point of connection(POC) to an end-user.
The treatment processes and the system distribution and pressurization require varyingamounts of energy depending on factors such as water quality, the topography of the areaserved, and system requirements. Treatment requirements, and therefor energy inputs, areincreasing.80 As Franklin Burton notes: “Recently promulgated regulations will have asignificant impact on energy consumption in water treatment because many water utilitieswill install energy-consuming technologies such as ozone for disinfection and membranefiltration for the removal of particulate and organic matter. New filtration facilities will alsobe required to be added to existing surface supplies that currently are not treated (other thandisinfection). Existing facilities will also be upgraded if they do not meet new requirementsfor disinfection.”81 Treatment is designed to deal with contaminants such as the following:
• trihalomethanes (TTHMs)• haloacetic acids (HAAs)• chlorinated organic compounds that are suspected carcinogens• gastrointestinal illnesses• Giardia lamblia• Cryptosporidium
Conventional surface water treatment technologies commonly use physical methods such assedimentation and filtration to remove suspended material from the water and chemicaldisinfection – mostly with chlorine – to control bacteria, viruses, and Giardia lamblia.Chemical processes may be added such as coagulation to enhance the effectiveness ofsedimentation and chemical softening to remove the dissolved salts responsible for hardness.Water delivery systems at the local level require the following energy inputs. 82
39
After treatment, water is usually pumped at high pressure to the distribution andstorage system. Distribution pumping serves several purposes including:
• overcoming pipe friction within the distribution system• providing adequate pressure for the water users• providing adequate pressure for supplying hoses and/or pumper trucks for fire
fighting• supplying water to elevated storage
The term “adequate pressure” can vary widely from one system to the next, with atypical range of 40 to 100 pounds per square inch (psi) (276 to 689 kPa) measured inthe distribution mains. For fire flow conditions, both adequate quantities andpressures are required. Often minimum requirements established for fire flows are 500gallons per minute (gpm) (32 L/s) at 20 psi (138 kPa), but fire flows in denselypopulated areas can range from 1,500 to 3,000 gpm (96 to 192 L/s).
End-Use (Pumping, Treatment, Processes, and Thermal)
Once water is delivered to an end-user, additional energy inputs are required for some or all ofthe following functions:
• treatment (e.g. water softening and/or additional filtration)• recirculation loops within buildings and facilities• additional pressurization• thermal requirements (heating and/or cooling)• wastewater pumping
Efficiency improvements in the residential sector include appliances in the residential sectorsuch as showers, faucet aerators, dishwashers, and washing machines. The presentexploratory analysis has not focused on end-use energy inputs. Important efficiencyopportunities clearly exist at this level, and it is recommended as an area for further research.
Wastewater Catchment and Treatment
Most M&I water users are connected to wastewater systems which collect and treat it toprescribed standards.83 (Some areas utilize septic systems.) Increasingly, water is being re-used following treatment. (See following section.) Otherwise treated water is returned tonatural water courses or to the sea. Wastewater systems require energy for pumping in thecollection systems and for pumping, treatment operations and processes, and solidsprocessing in the treatment facilities.84 New treatment processes such as UV also use energy.85 Franklin Burton describes the treatment processes in Water and Wastewater Industries:Characteristics and Energy Management Opportunities as follows:
Wastewater treatment requires a combination of physical operations (such aspumping, screening, settling, and filtration) and chemical and biologicalprocesses for the removal of pollutants. In biological processes, cultures ofmicroorganisms are used to clean the water by removing suspended anddissolved organic pollutants. The most common form of biological treatmentused in wastewater treatment is activated sludge. Activated sludge requires
40
aeration, either by mechanical aerators or blower-operated diffused air, tosupply oxygen to the microorganisms. Wastewater aeration, pumping andsolids processing account for most of the electric energy used in wastewatertreatment. 86
Wastewater catchment systems are generally designed to operate with gravity flow. In manyinstances, however, pumping is required to move wastewater to the treatment facility.87
Wastewater pumps are less energy-efficient than water pumps because of the tolerancesrequired.
Pumping stations for untreated wastewater must be capable of handling avariety of solids, grease, grit, and stringy material. To pass these materials,the pumps must contain sufficient clear passages so the pumping units do notbecome clogged. Because of the type of pump construction required forreliable operation, efficiencies of wastewater pumps are generally low (60 to75 percent) when compared to water pumps, which have efficiencies rangingfrom 75 to 85 percent.88
Pumping energy required to handle wastewater at all times of the day and night is also moredifficult than in water supply systems because storage is usually not an option.
In most cases, there is little storage capacity in community sewer systems toabsorb the peak flow rates. Pumping stations, therefore, have to be designedto handle the peak flow rates to prevent system backup and overflows.Because system pumping stations need to be operational at all times,particularly during peak flow rate conditions, most of the stations areprovided with a standby or redundant power source such as engine-generators.Regulatory agencies may also require the installation of standby units tomaintain system reliability.89
Franklin Burton provides a useful summary of wastewater treatment systems: 90
Wastewater treatment plants vary widely in terms of the processes employed.The processes depend largely on the level of treatment required as prescribedby the discharge permit issued by the regulating agency. Levels of treatmentrequired are defined customarily as “preliminary” (removal of coarse solids);“secondary” (substantial removal of organic material and suspended anddissolved solids); and “advanced” or “tertiary” (essentially complete removalof organic matter and suspended solids, typically accompanied by somereduction in nutrients such as nitrogen and phosphorus).
Burton notes that: “Historically, the term preliminary and/or primary treatment referred tophysical unit operations; secondary treatment referred to chemical and biological unitprocesses; and advanced or tertiary treatment referred to combinations of all three. Theseterms are arbitrary, however and in most cases are of little value even though they continueto be used.” He argues sensibly for a more useful definition. “A more rational approach towastewater treatment is first to establish the level of contaminant removal (treatment)required before the wastewater can be reused or discharged to the environment. The requiredunit operations and processes necessary to achieve that required level of treatment can thenbe grouped together on the basis of fundamental considerations. The unit operations or

41
processes may be grouped and termed preliminary treatment, primary treatment,conventional secondary (biological) treatment, or advanced wastewater treatment.Disinfection of the final effluent is almost always required before discharge or reuse.”

42
Wastewater Treatment Processes
Preliminary Wastewater TreatmentPreliminary wastewater treatment is defined as the removal of wastewater constituentsthat may cause maintenance or operational problems with the treatment operations,processes, and ancillary systems.
Primary Wastewater TreatmentIn primary treatment, a portion of the suspended solids and organic matter is removedfrom the wastewater. This removal is usually accomplished with physical operationssuch as screening and sedimentation. The effluent from primary treatment will ordinarilycontain a considerable amount of organic matter.
Conventional Secondary Wastewater TreatmentSecondary treatment systems are intended to remove soluble and colloidal organic matterthat remains after primary treatment. Secondary treatment is generally understood toimply a biological process. Biological treatment consists of applicati8on of a controllednatural process in which microorganisms remove soluble and colloidal organic matterfrom the wastewater and are, in turn removed themselves.
Advanced Wastewater TreatmentAdvanced wastewater treatment has many definitions. Commonly, the term is defined asthe level of treatment required beyond conventional secondary treatment to removeconstituents of concern including nutrients, toxic compounds, and increased amounts oforganic material and suspended solids.
DisinfectionDisinfection is practiced to protect water quality for subsequent use. A water body intowhich inadequately disinfected wastewater effluent is discharged may becomecontaminated by pathogenic (disease causing) organisms such as bacteria and virusescontained in the waste stream.
Solids ManagementAs wastewater treatment plants expand and are called upon to remove greater amounts ofpollutants, large quantities of solids are produced that have to be processed. Most ofthese solids has a high organic fraction that will biodegrade (hence the term “biosolids”).Organic material will putrefy and cause odors unless properly processed and stabilized.
Effluent Disposal and ReuseFor reuse applications, additional treatment processes may be necessary, and effluenttransport facilities (pumping stations and pipelines) may also be required.
Burton, Franklin L., 1996, Water and Wastewater Industries: Characteristics and Energy ManagementOpportunities. (Burton Engineering) Los Altos, CA, Report CR-106941, Electric Power Research InstituteReport, p.2-14.

43
Estimates of Electricity Use in Wastewater Treatment(National Average)
The unit electricity requirements expressed as kilowatt hours per million gallons(kWh/mg) for each generic system were computed by a weighted average over the rangeof capacities to determine a single value to be used in projecting the national use. Thevalues used are:
955 kWh/mg for trickling filters1,322 kWh/mg for activated sludge1,541 kWh/mg for advanced wastewater treatment without nitrification1,911 kWh/mg for advanced wastewater treatment with nitrification
The value used for a level of treatment less than secondary was taken as about 50 percentof the value for activated sludge treatment (661 kWh/mg).
For secondary treatment, a weighted unit value was used assuming that 70 percent of thecapacity was activated sludge and 30 percent was trickling filters. The weighted value is1,212 kWh/mg.
For advanced wastewater treatment, it was assumed that, for 1988, 10 percent of thecapacity included nitrification; for the future (when needs met), it was assumed that 50percent of the capacity included nitrification. The weighted values are 1,578 and 1,726kWh/mg, respectively.
Burton, Franklin L., 1996, Water and Wastewater Industries: Characteristics and Energy ManagementOpportunities. (Burton Engineering) Los Altos, CA, Report CR-106941, Electric Power Research InstituteReport, p.2-45.
Wastewater Reuse
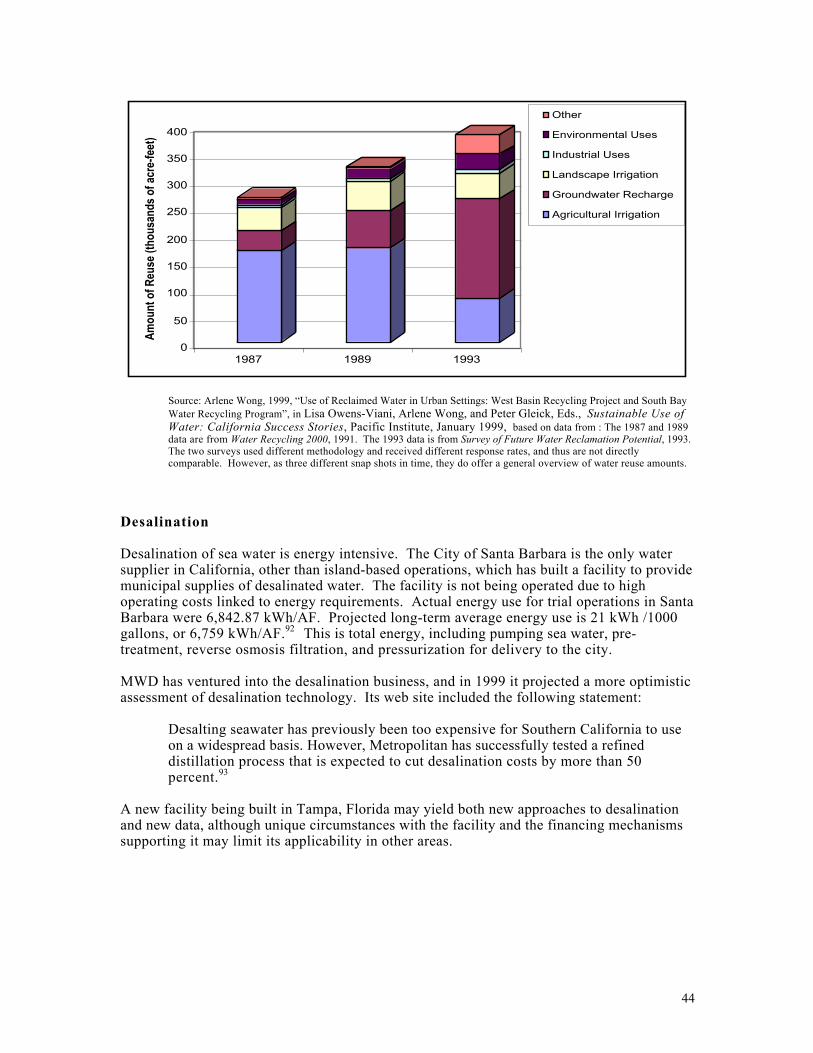
Water is increasingly being used more than once within systems at both the end-use level andat the municipal level. At the end-use, water is recycled within processes such as coolingtowers and industrial processes prior to entering the wastewater system. Once-throughsystems are increasingly being replaced by re-use technologies. At the municipal level, waterre-use has become a significant source of supplies for both landscape irrigation (e.g. forfreeways and golf courses) and for commercial and industrial processes. MWD is supporting33 recycling programs in which treated wastewater is used for non-potable purposes. 91
In a case study for the Pacific Institute, Arlene Wong identified the following trends in reusein California:
Comparison of Water Reuse Activities for 1987, 1989, 1993
44
0
50
100
150
200
250
300
350
400
Am
ount
of R
euse
(tho
usan
ds o
f acr
e-fe
et)
1987 1989 1993
Other
Environmental Uses
Industrial Uses
Landscape Irrigation
Groundwater Recharge
Agricultural Irrigation
Source: Arlene Wong, 1999, “Use of Reclaimed Water in Urban Settings: West Basin Recycling Project and South BayWater Recycling Program”, in Lisa Owens-Viani, Arlene Wong, and Peter Gleick, Eds., Sustainable Use ofWater: California Success Stories, Pacific Institute, January 1999, based on data from : The 1987 and 1989data are from Water Recycling 2000, 1991. The 1993 data is from Survey of Future Water Reclamation Potential, 1993.The two surveys used different methodology and received different response rates, and thus are not directlycomparable. However, as three different snap shots in time, they do offer a general overview of water reuse amounts.
Desalination
Desalination of sea water is energy intensive. The City of Santa Barbara is the only watersupplier in California, other than island-based operations, which has built a facility to providemunicipal supplies of desalinated water. The facility is not being operated due to highoperating costs linked to energy requirements. Actual energy use for trial operations in SantaBarbara were 6,842.87 kWh/AF. Projected long-term average energy use is 21 kWh /1000gallons, or 6,759 kWh/AF.92 This is total energy, including pumping sea water, pre-treatment, reverse osmosis filtration, and pressurization for delivery to the city.
MWD has ventured into the desalination business, and in 1999 it projected a more optimisticassessment of desalination technology. Its web site included the following statement:
Desalting seawater has previously been too expensive for Southern California to useon a widespread basis. However, Metropolitan has successfully tested a refineddistillation process that is expected to cut desalination costs by more than 50percent.93
A new facility being built in Tampa, Florida may yield both new approaches to desalinationand new data, although unique circumstances with the facility and the financing mechanismssupporting it may limit its applicability in other areas.
45
ENERGY ANALYSIS
Methodologies Developed
Energy Matrix
One element of the present exploratory project was to develop a method for analyzing theenergy intensity of water used in a given location. The following section steps through aspreadsheet tool developed as part of this exploratory work. The spreadsheet is fullytransparent in its assumptions. It is constructed such that changes in inputs (e.g. the amountof SWP water supplied to a given agency, or the amount of groundwater pumped with specificmotors) and structure (e.g. new energy elements) can be easily adjusted or added.
One option for future development is to post a revised spreadsheet on the web with fullaccess for use and alteration.
Geographical Information System Application
A geographical information system application is also being developed as a tool for watermanagers and decision-makers. The GIS application will link to the spreadsheet to provideusers with the data directly from the spreadsheet analysis. Users will be able to click on awater use zone (e.g. a city) and a screen will pop up providing data for that geographic area.
A version of the GIS can be provided through the web at no cost to the user, and the programis user-friendly and accessible to all levels of computer literacy.
The GIS would not be user-adjustable, so data provided could be secure. The spreadsheet tool,on the other hand, could be downloaded such that users could consider an infinite number ofwater supply and use scenarios and estimate the energy intensity of each option.
46
Spreadsheet Matrix for Energy Intensity Analysis
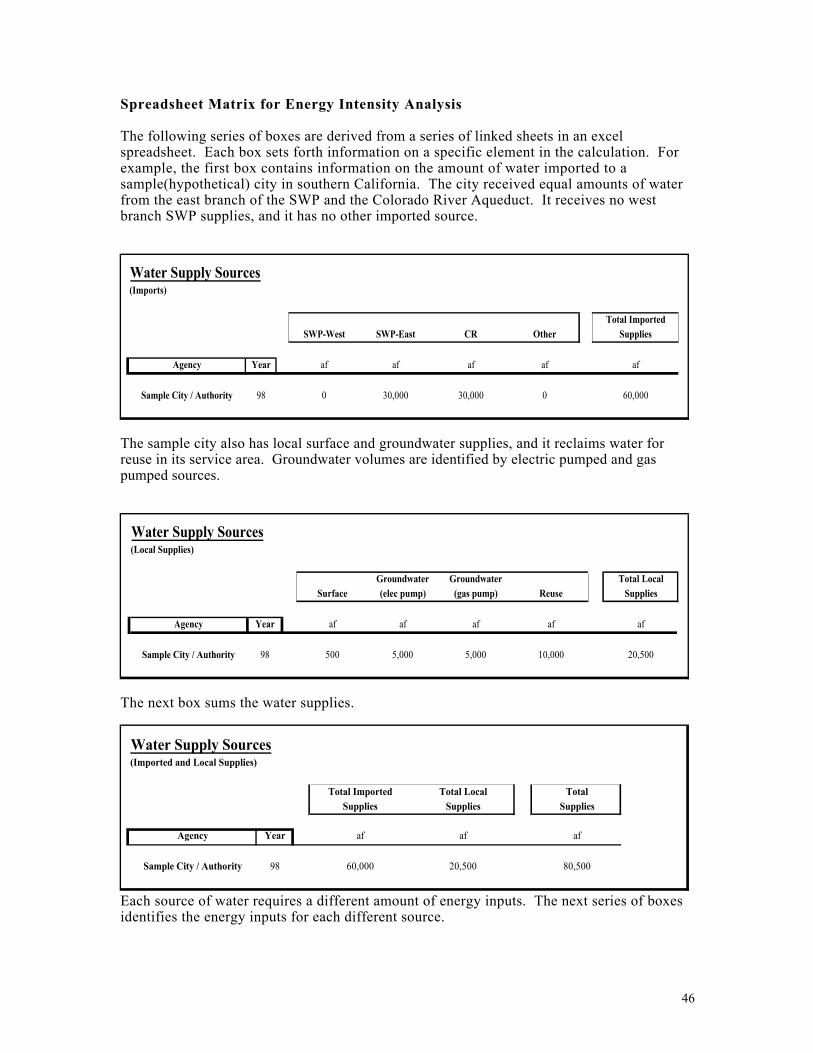
The following series of boxes are derived from a series of linked sheets in an excelspreadsheet. Each box sets forth information on a specific element in the calculation. Forexample, the first box contains information on the amount of water imported to asample(hypothetical) city in southern California. The city received equal amounts of waterfrom the east branch of the SWP and the Colorado River Aqueduct. It receives no westbranch SWP supplies, and it has no other imported source.
The sample city also has local surface and groundwater supplies, and it reclaims water forreuse in its service area. Groundwater volumes are identified by electric pumped and gaspumped sources.
The next box sums the water supplies.
Each source of water requires a different amount of energy inputs. The next series of boxesidentifies the energy inputs for each different source.
Water Supply Sources(Imports)
Total Imported
SWP-West SWP-East CR Other Supplies
Agency Year af af af af af
Sample City / Authority 98 0 30,000 30,000 0 60,000
Water Supply Sources(Local Supplies)
Groundwater Groundwater Total Local
Surface (elec pump) (gas pump) Reuse Supplies
Agency Year af af af af af
Sample City / Authority 98 500 5,000 5,000 10,000 20,500
Water Supply Sources(Imported and Local Supplies)
Total Imported Total Local Total
Supplies Supplies Supplies
Agency Year af af af
Sample City / Authority 98 60,000 20,500 80,500
47
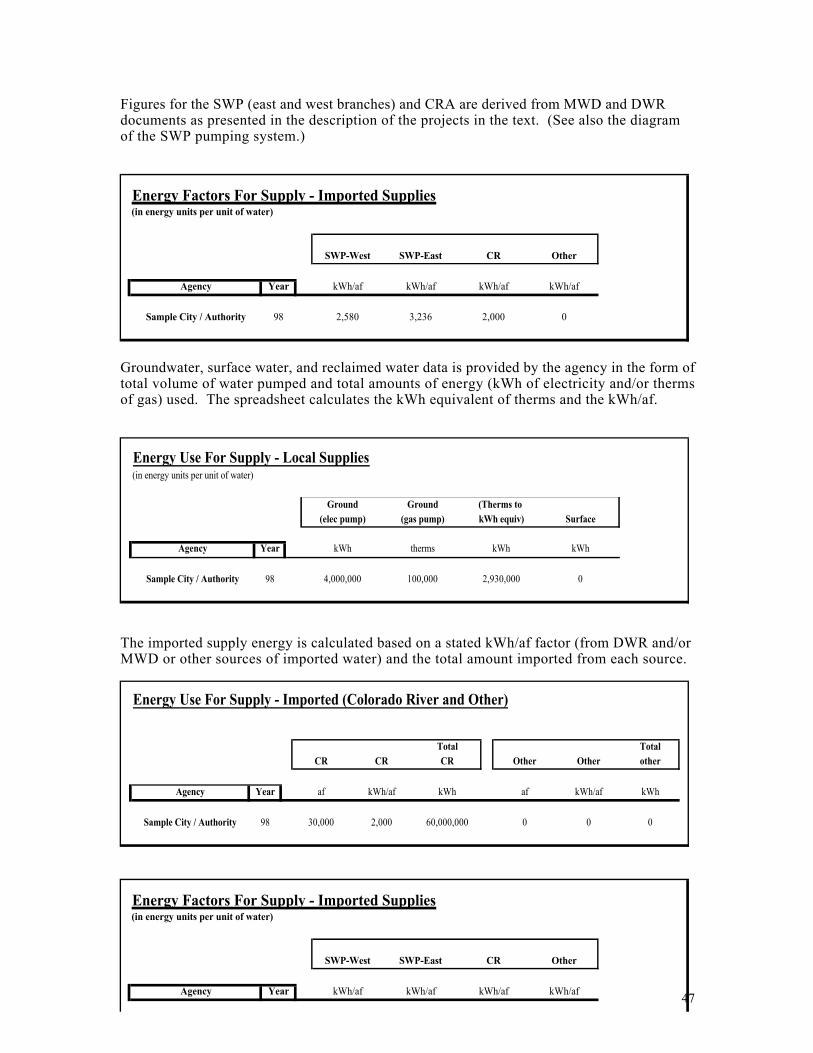
Figures for the SWP (east and west branches) and CRA are derived from MWD and DWRdocuments as presented in the description of the projects in the text. (See also the diagramof the SWP pumping system.)
Groundwater, surface water, and reclaimed water data is provided by the agency in the form oftotal volume of water pumped and total amounts of energy (kWh of electricity and/or thermsof gas) used. The spreadsheet calculates the kWh equivalent of therms and the kWh/af.
The imported supply energy is calculated based on a stated kWh/af factor (from DWR and/orMWD or other sources of imported water) and the total amount imported from each source.
Energy Use For Supply - Local Supplies(in energy units per unit of water)
Ground Ground (Therms to
(elec pump) (gas pump) kWh equiv) Surface
Agency Year kWh therms kWh kWh
Sample City / Authority 98 4,000,000 100,000 2,930,000 0
Energy Factors For Supply - Imported Supplies(in energy units per unit of water)
SWP-West SWP-East CR Other
Agency Year kWh/af kWh/af kWh/af kWh/af
Sample City / Authority 98 2,580 3,236 2,000 0
Energy Use For Supply - Imported (Colorado River and Other)
Total Total
CR CR CR Other Other other
Agency Year af kWh/af kWh af kWh/af kWh
Sample City / Authority 98 30,000 2,000 60,000,000 0 0 0
Energy Factors For Supply - Imported Supplies(in energy units per unit of water)
SWP-West SWP-East CR Other
Agency Year kWh/af kWh/af kWh/af kWh/af
48
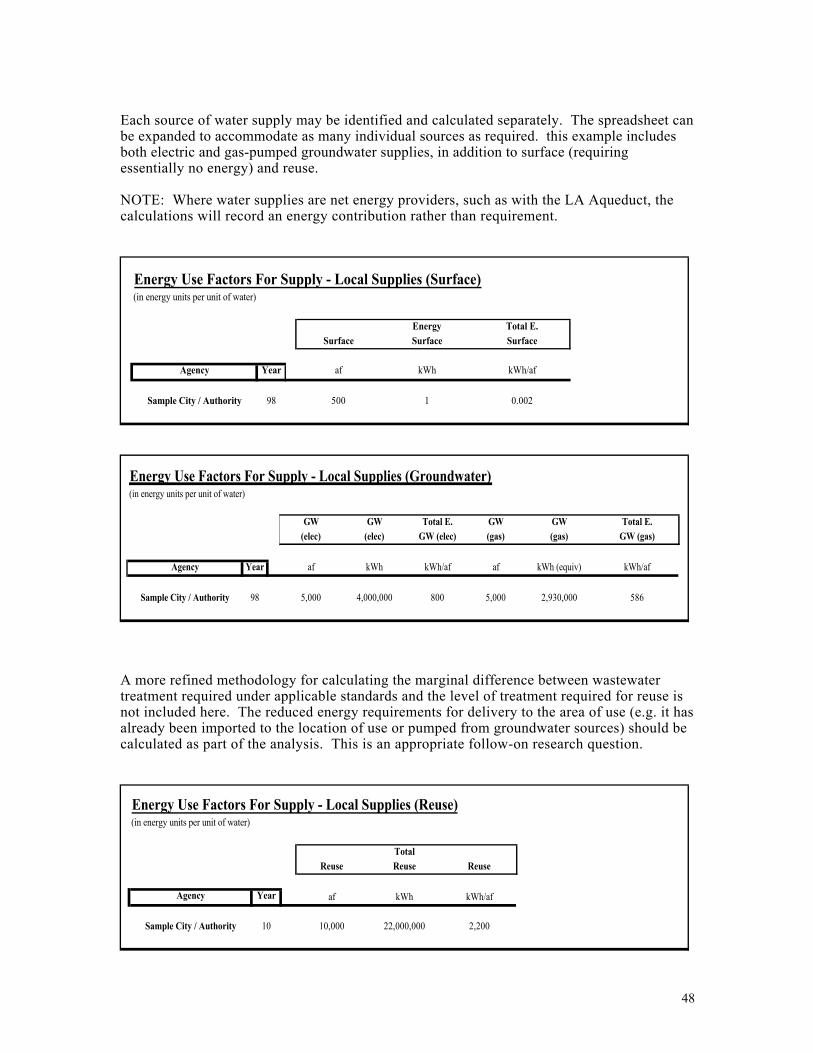
Each source of water supply may be identified and calculated separately. The spreadsheet canbe expanded to accommodate as many individual sources as required. this example includesboth electric and gas-pumped groundwater supplies, in addition to surface (requiringessentially no energy) and reuse.
NOTE: Where water supplies are net energy providers, such as with the LA Aqueduct, thecalculations will record an energy contribution rather than requirement.
A more refined methodology for calculating the marginal difference between wastewatertreatment required under applicable standards and the level of treatment required for reuse isnot included here. The reduced energy requirements for delivery to the area of use (e.g. it hasalready been imported to the location of use or pumped from groundwater sources) should becalculated as part of the analysis. This is an appropriate follow-on research question.
Energy Use Factors For Supply - Local Supplies (Groundwater)(in energy units per unit of water)
GW GW Total E. GW GW Total E.
(elec) (elec) GW (elec) (gas) (gas) GW (gas)
Agency Year af kWh kWh/af af kWh (equiv) kWh/af
Sample City / Authority 98 5,000 4,000,000 800 5,000 2,930,000 586
Energy Use Factors For Supply - Local Supplies (Reuse)(in energy units per unit of water)
Total
Reuse Reuse Reuse
Agency Year af kWh kWh/af
Sample City / Authority 10 10,000 22,000,000 2,200
Energy Use Factors For Supply - Local Supplies (Surface)(in energy units per unit of water)
Energy Total E.
Surface Surface Surface
Agency Year af kWh kWh/af
Sample City / Authority 98 500 1 0.002
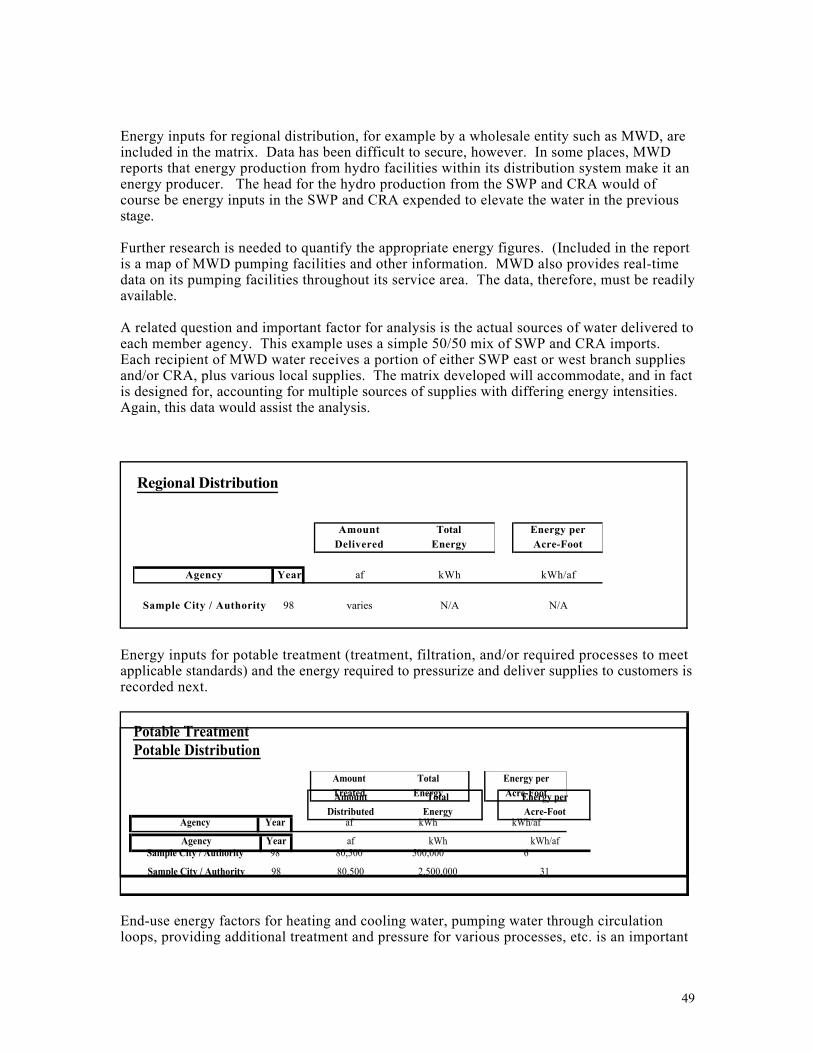
49
Energy inputs for regional distribution, for example by a wholesale entity such as MWD, areincluded in the matrix. Data has been difficult to secure, however. In some places, MWDreports that energy production from hydro facilities within its distribution system make it anenergy producer. The head for the hydro production from the SWP and CRA would ofcourse be energy inputs in the SWP and CRA expended to elevate the water in the previousstage.
Further research is needed to quantify the appropriate energy figures. (Included in the reportis a map of MWD pumping facilities and other information. MWD also provides real-timedata on its pumping facilities throughout its service area. The data, therefore, must be readilyavailable.
A related question and important factor for analysis is the actual sources of water delivered toeach member agency. This example uses a simple 50/50 mix of SWP and CRA imports.Each recipient of MWD water receives a portion of either SWP east or west branch suppliesand/or CRA, plus various local supplies. The matrix developed will accommodate, and in factis designed for, accounting for multiple sources of supplies with differing energy intensities.Again, this data would assist the analysis.
Energy inputs for potable treatment (treatment, filtration, and/or required processes to meetapplicable standards) and the energy required to pressurize and deliver supplies to customers isrecorded next.
End-use energy factors for heating and cooling water, pumping water through circulationloops, providing additional treatment and pressure for various processes, etc. is an important
Regional Distribution
Amount Total Energy per
Delivered Energy Acre-Foot
Agency Year af kWh kWh/af
Sample City / Authority 98 varies N/A N/A
Potable Treatment
Amount Total Energy per
Treated Energy Acre-Foot
Agency Year af kWh kWh/af
Sample City / Authority 98 80,500 500,000 6
Potable Distribution
Amount Total Energy per
Distributed Energy Acre-Foot
Agency Year af kWh kWh/af
Sample City / Authority 98 80,500 2,500,000 31
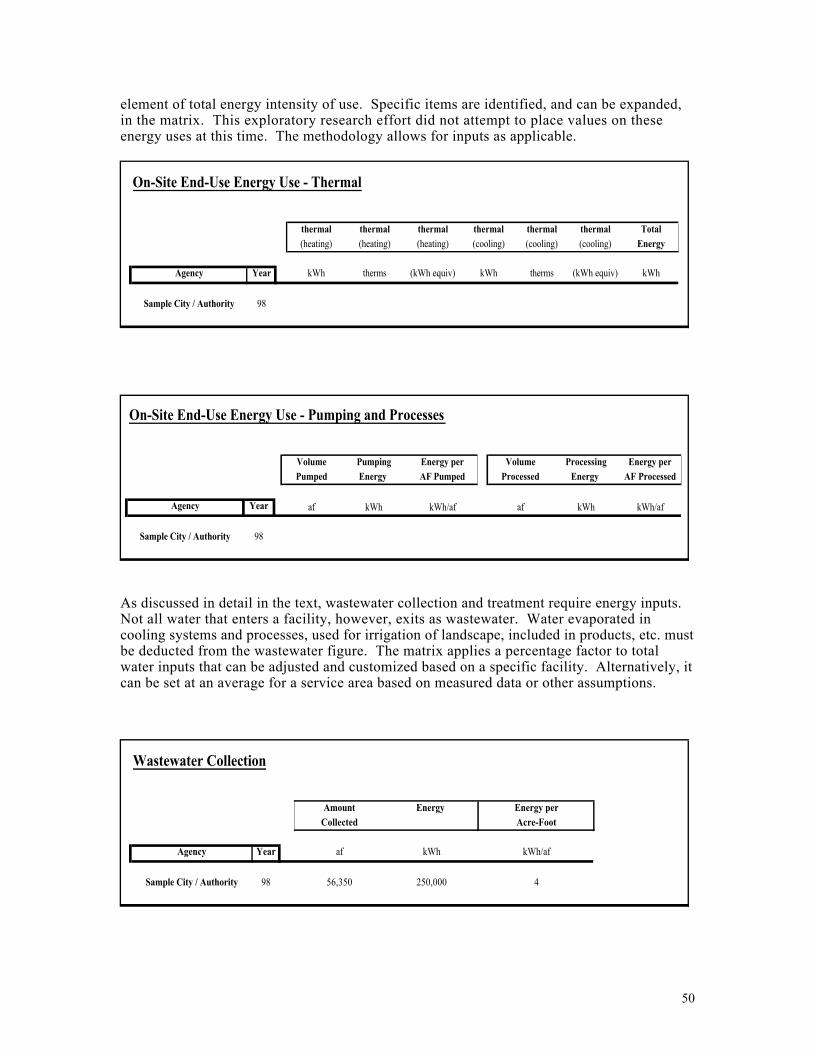
50
element of total energy intensity of use. Specific items are identified, and can be expanded,in the matrix. This exploratory research effort did not attempt to place values on theseenergy uses at this time. The methodology allows for inputs as applicable.
As discussed in detail in the text, wastewater collection and treatment require energy inputs.Not all water that enters a facility, however, exits as wastewater. Water evaporated incooling systems and processes, used for irrigation of landscape, included in products, etc. mustbe deducted from the wastewater figure. The matrix applies a percentage factor to totalwater inputs that can be adjusted and customized based on a specific facility. Alternatively, itcan be set at an average for a service area based on measured data or other assumptions.
On-Site End-Use Energy Use - Thermal
thermal thermal thermal thermal thermal thermal Total
(heating) (heating) (heating) (cooling) (cooling) (cooling) Energy
Agency Year kWh therms (kWh equiv) kWh therms (kWh equiv) kWh
Sample City / Authority 98
On-Site End-Use Energy Use - Pumping and Processes
Volume Pumping Energy per Volume Processing Energy per
Pumped Energy AF Pumped Processed Energy AF Processed
Agency Year af kWh kWh/af af kWh kWh/af
Sample City / Authority 98
Wastewater Collection
Amount Energy Energy per
Collected Acre-Foot
Agency Year af kWh kWh/af
Sample City / Authority 98 56,350 250,000 4
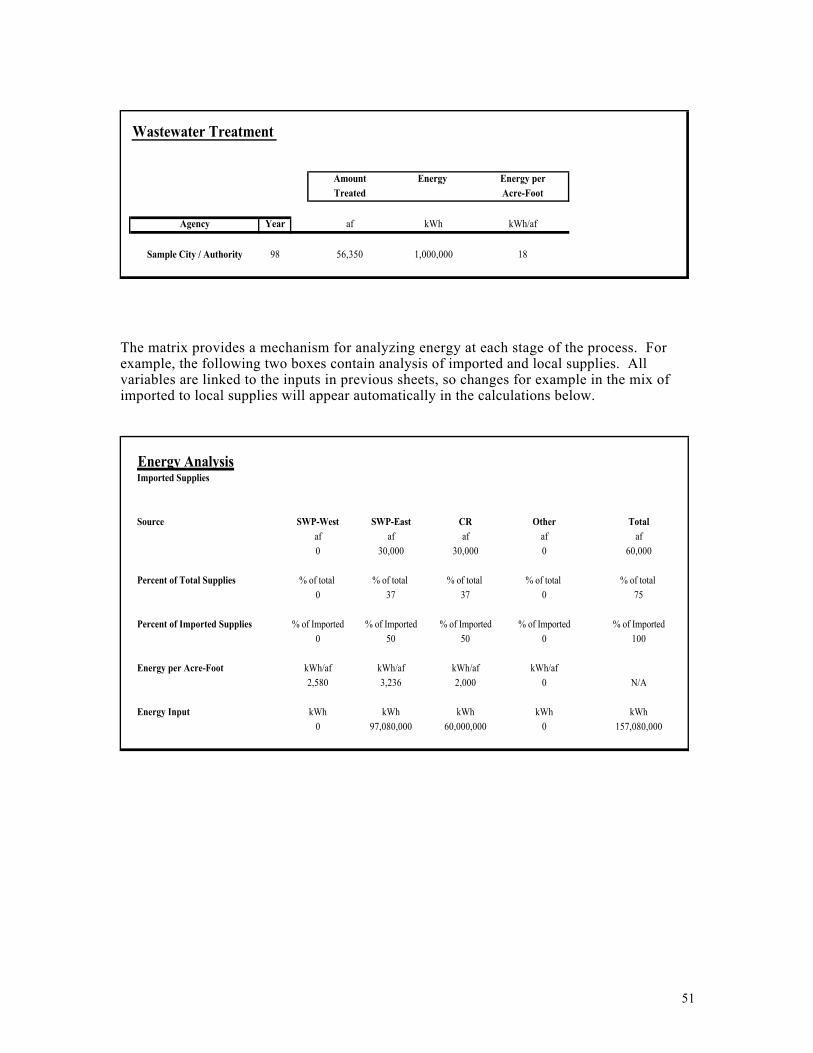
51
The matrix provides a mechanism for analyzing energy at each stage of the process. Forexample, the following two boxes contain analysis of imported and local supplies. Allvariables are linked to the inputs in previous sheets, so changes for example in the mix ofimported to local supplies will appear automatically in the calculations below.
Wastewater Treatment
Amount Energy Energy per
Treated Acre-Foot
Agency Year af kWh kWh/af
Sample City / Authority 98 56,350 1,000,000 18
Energy AnalysisImported Supplies
Source SWP-West SWP-East CR Other Total
af af af af af
0 30,000 30,000 0 60,000
Percent of Total Supplies % of total % of total % of total % of total % of total
0 37 37 0 75
Percent of Imported Supplies % of Imported % of Imported % of Imported % of Imported % of Imported
0 50 50 0 100
Energy per Acre-Foot kWh/af kWh/af kWh/af kWh/af
2,580 3,236 2,000 0 N/A
Energy Input kWh kWh kWh kWh kWh
0 97,080,000 60,000,000 0 157,080,000
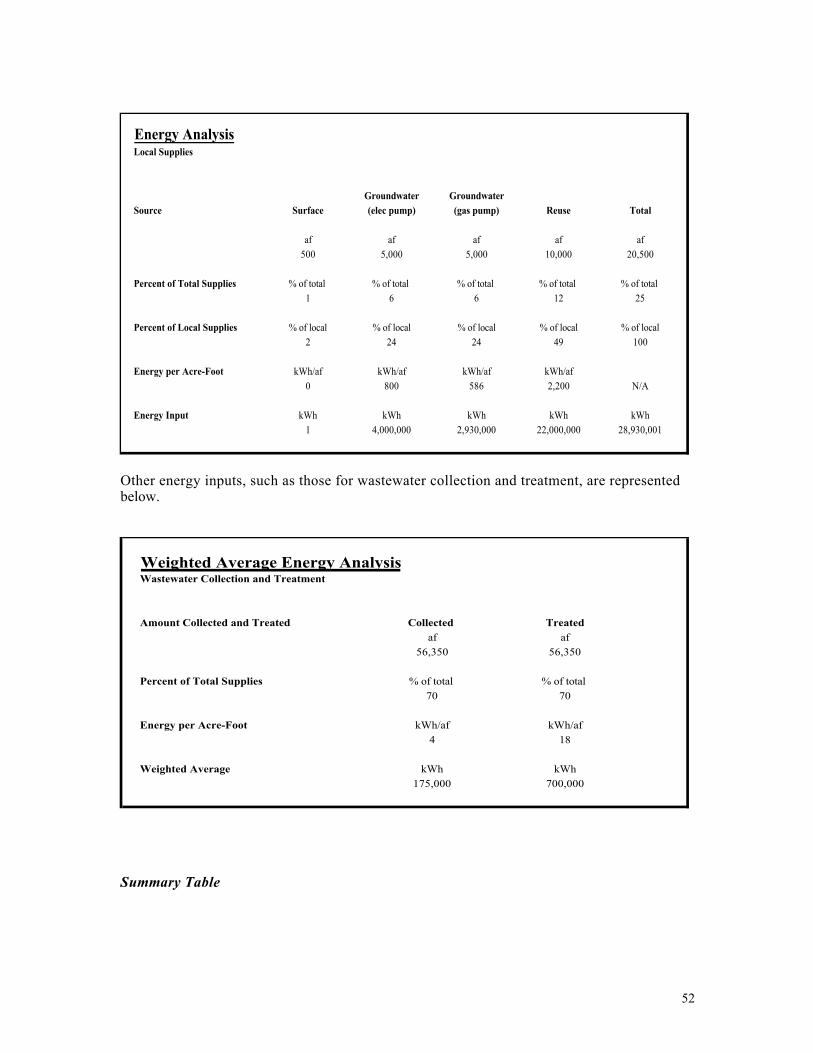
52
Other energy inputs, such as those for wastewater collection and treatment, are representedbelow.
Summary Table
Energy AnalysisLocal Supplies
Groundwater Groundwater
Source Surface (elec pump) (gas pump) Reuse Total
af af af af af
500 5,000 5,000 10,000 20,500
Percent of Total Supplies % of total % of total % of total % of total % of total
1 6 6 12 25
Percent of Local Supplies % of local % of local % of local % of local % of local
2 24 24 49 100
Energy per Acre-Foot kWh/af kWh/af kWh/af kWh/af
0 800 586 2,200 N/A
Energy Input kWh kWh kWh kWh kWh
1 4,000,000 2,930,000 22,000,000 28,930,001
Weighted Average Energy AnalysisWastewater Collection and Treatment
Amount Collected and Treated Collected Treated
af af
56,350 56,350
Percent of Total Supplies % of total % of total
70 70
Energy per Acre-Foot kWh/af kWh/af
4 18
Weighted Average kWh kWh
175,000 700,000
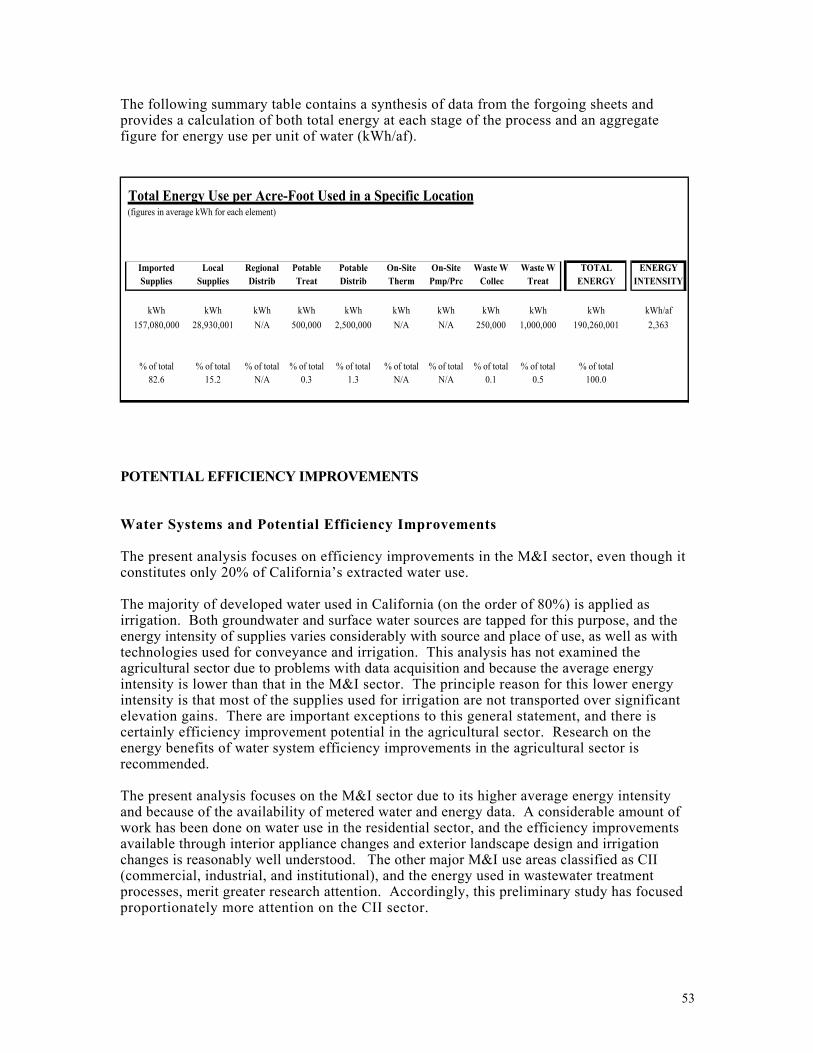
53
The following summary table contains a synthesis of data from the forgoing sheets andprovides a calculation of both total energy at each stage of the process and an aggregatefigure for energy use per unit of water (kWh/af).
POTENTIAL EFFICIENCY IMPROVEMENTS
Water Systems and Potential Efficiency Improvements
The present analysis focuses on efficiency improvements in the M&I sector, even though itconstitutes only 20% of California’s extracted water use.
The majority of developed water used in California (on the order of 80%) is applied asirrigation. Both groundwater and surface water sources are tapped for this purpose, and theenergy intensity of supplies varies considerably with source and place of use, as well as withtechnologies used for conveyance and irrigation. This analysis has not examined theagricultural sector due to problems with data acquisition and because the average energyintensity is lower than that in the M&I sector. The principle reason for this lower energyintensity is that most of the supplies used for irrigation are not transported over significantelevation gains. There are important exceptions to this general statement, and there iscertainly efficiency improvement potential in the agricultural sector. Research on theenergy benefits of water system efficiency improvements in the agricultural sector isrecommended.
The present analysis focuses on the M&I sector due to its higher average energy intensityand because of the availability of metered water and energy data. A considerable amount ofwork has been done on water use in the residential sector, and the efficiency improvementsavailable through interior appliance changes and exterior landscape design and irrigationchanges is reasonably well understood. The other major M&I use areas classified as CII(commercial, industrial, and institutional), and the energy used in wastewater treatmentprocesses, merit greater research attention. Accordingly, this preliminary study has focusedproportionately more attention on the CII sector.
Total Energy Use per Acre-Foot Used in a Specific Location(figures in average kWh for each element)
Imported Local Regional Potable Potable On-Site On-Site Waste W Waste W TOTAL ENERGY
Supplies Supplies Distrib Treat Distrib Therm Pmp/Prc Collec Treat ENERGY INTENSITY
kWh kWh kWh kWh kWh kWh kWh kWh kWh kWh kWh/af
157,080,000 28,930,001 N/A 500,000 2,500,000 N/A N/A 250,000 1,000,000 190,260,001 2,363
% of total % of total % of total % of total % of total % of total % of total % of total % of total % of total82.6 15.2 N/A 0.3 1.3 N/A N/A 0.1 0.5 100.0
54
Water-Efficiency Potential in the Residential Water Use Sector
Water efficiency potential in the residential sector is generally categorized into indoor useand outdoor use. Efficiency improvements in interior use may achieved with plumbingfixture changes (shower heads, faucet aerators, toilets, washing machines, dish washers, andother appliances) and by repairing leaks. Exterior use changes generally are achieved througha combination of irrigation systems changes and landscape changes.
Temporary, low-cost approaches such as home surveys and the installation of toilet damshave been found to be far less reliable and effective as permanent efficiency improvementsachieved through the replacement or initial installation of water-efficient devices. Citing astudy by A&N Technical, the CUWCC notes that the “average level of savings from homewater surveys decreased over time, reaching about 50% of initial yield by the fourth yearfollowing the survey.”94
Water managers and policy-makers share a concern that water efficiency improvements needto be reliable over time. Water management authorities have therefore focused on theinstallation of quality plumbing fixtures that will reliably reduce water use while providingequal or even superior water-use services to the consumer.
For purposes of this analysis, water efficiency improvements achieved within residencestypically translate into wastewater savings. On the other hand, exterior savings due toimproved landscape irrigation and landscape design do not.
The present analysis has not focused on the residential sector in detail because reasonableestimations of efficiency potential are available. A number of studies have been conductedon water use and efficiency potential. While further work on the quantification of residentialsector water savings is needed to refine the numbers, it was not within the scope of thisexploratory analysis to undertake that work. In addition to the work of the CUWCC,research by Amy Vickers, A&N Technical, M Cubed, the Rocky Mountain Institute, BillMaddaus, and studies like the Pacific Institute’s California Water 2020: A SustainabilityVision, have outlined residential water efficiency opportunities.95 For a recent reportsurveying a number of success stories in water efficiency improvements see Sustainable Useof Water: California Success Stories.96
Water-Efficiency Potential in the Commercial, Industrial, and Institutional (CII) Sector 97
Water managers typically identify urban water use in a broad category called municipal andindustrial (M&I), which generally includes residential uses as well as commercial,institutional, industrial, and municipal uses. An important sub-set of M&I water use is thenon-residential category of commercial, industrial, and institutional (CII) users.
While the potential to increase water-use efficiency in the residential sector has receivedconsiderable attention, the potential in other urban sectors is less well understood, possiblydue in part to the large variety of water uses, technologies, and processes in those sectors.However, recent surveys and actual experiences at specific sites suggest that significantopportunities exist in each of these sectors for efficiency improvements and cost savings.
55
Various definitions of water uses and differing methodologies have been used by analysts toclassify water uses in the CII sector.98 For the purposes of the present analysis, the followingCII uses are defined as follows, as adapted from Charlie Pike: 99
Commercial and Industrial Water Uses
Commercial water use includes water for motels, hotels, restaurants, officebuildings, and other commercial facilities.
Industrial water use includes water for industrial processes such as fabrication,processing, washing, and cooling.
Institutional water use includes indoor and outdoor uses at schools, colleges,universities, churches, hospitals, and government facilities.
Municipal water use includes water system management and uses such as firesuppression and landscape irrigation in public parks.
Water savings potential in the CII sector is significant. Two recent studies have attemptedto estimate the potential CII sector savings. The first is an audit program sponsored byMWD100 for its service area in which the district audited over 900 commercial, industrial, andinstitutional water users in its service area.101 The second is a study sponsored by the USEPA and conducted by the California Department of Water Resources in which data wasstudied from three audit programs (a total of 744 audits) in 12 utility service areas nationwide(seven in California). 102 In MWD’s service area, CII accounts for about 25% of wateruse,103 and efficiency potential is conservatively estimated at 23% based on a recent analysisby MWD.104 The 23 percent overall savings should be considered conservative, however,because the study was careful to employ conservative assumptions regarding both potentialconservation measures and economic factors. Only measures within a specified paybackperiod (usually no more than 5 years) were included as opposed to investments that stillexceed normal rates of return. Recommendations did not include all available conservationmeasures, instead favoring very basic responses. For example, landscape water efficiencyimprovements represented 9 percent of identified savings based on adjusting irrigationcontrol programming alone. Landscape savings, even with this modest approach, was “alarge portion of the potential savings at many sites” in the MWD study. A morecomprehensive approach such as converting CII landscapes and irrigation systems to morewater-efficient (and maintenance-efficient) designs was not included. Using a technicalefficiency potential at current cost-effectiveness test, a significantly higher water efficiencypotential would be feasible.
The California Department of Water Resources (DWR) estimated in 1990 that the CII sectoraccounted for an average of 32 percent of urban water use, totaling over 2.4 million acre-feet, with 18 percent attributed to commercial and 9 percent to industrial uses.105 Thefollowing chart indicates the savings by types of uses.
Average Potential Savings for Commercial and Institutional Categories
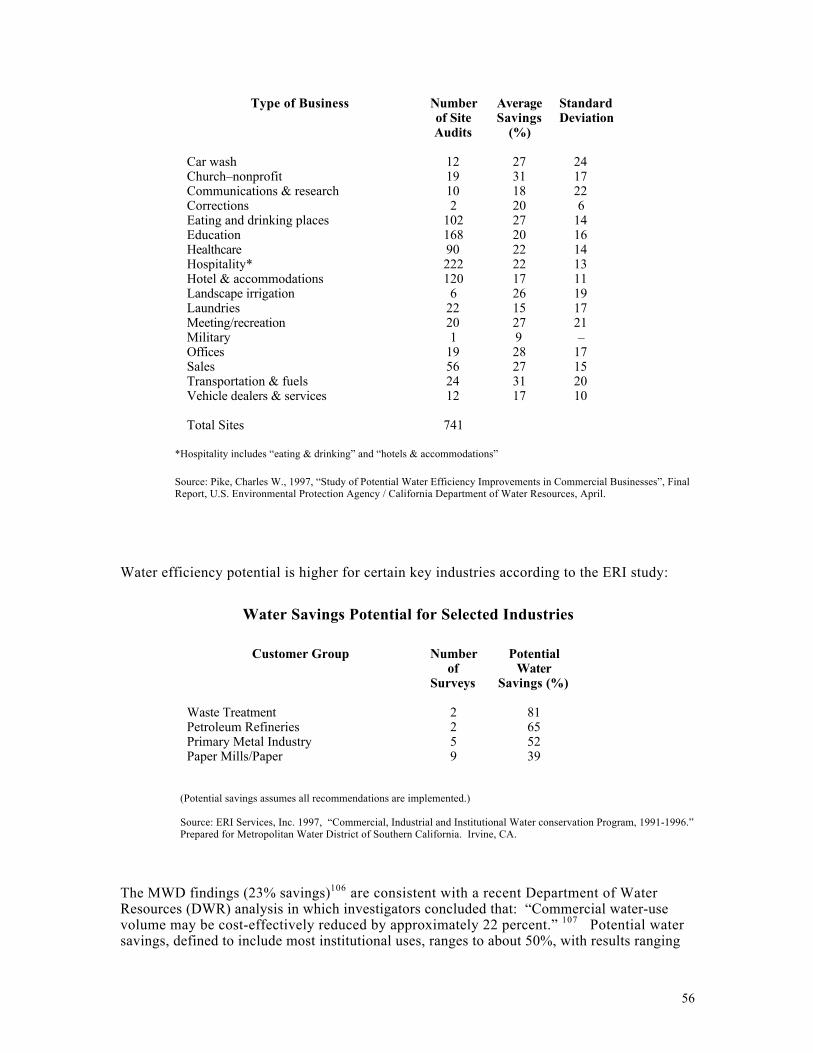
56
Type of Business Numberof SiteAudits
AverageSavings
(%)
StandardDeviation
Car wash 12 27 24Church–nonprofit 19 31 17Communications & research 10 18 22Corrections 2 20 6Eating and drinking places 102 27 14Education 168 20 16Healthcare 90 22 14Hospitality* 222 22 13Hotel & accommodations 120 17 11Landscape irrigation 6 26 19Laundries 22 15 17Meeting/recreation 20 27 21Military 1 9 –Offices 19 28 17Sales 56 27 15Transportation & fuels 24 31 20Vehicle dealers & services 12 17 10
Total Sites 741
*Hospitality includes “eating & drinking” and “hotels & accommodations”
Source: Pike, Charles W., 1997, “Study of Potential Water Efficiency Improvements in Commercial Businesses”, FinalReport, U.S. Environmental Protection Agency / California Department of Water Resources, April.
Water efficiency potential is higher for certain key industries according to the ERI study:
Water Savings Potential for Selected Industries
Customer Group Numberof
Surveys
PotentialWater
Savings (%)
Waste Treatment 2 81Petroleum Refineries 2 65Primary Metal Industry 5 52Paper Mills/Paper 9 39
(Potential savings assumes all recommendations are implemented.)
Source: ERI Services, Inc. 1997, “Commercial, Industrial and Institutional Water conservation Program, 1991-1996.”Prepared for Metropolitan Water District of Southern California. Irvine, CA.
The MWD findings (23% savings)106 are consistent with a recent Department of WaterResources (DWR) analysis in which investigators concluded that: “Commercial water-usevolume may be cost-effectively reduced by approximately 22 percent.” 107 Potential watersavings, defined to include most institutional uses, ranges to about 50%, with results ranging

57
from 20-25% in the analysis. According to the DWR analysis, the potential for watersavings are greatest in the following categories: offices, health care, sales, eating and drinking,hotels and accommodation, education, landscape irrigation, laundries, meeting and recreation.(The figures vary by region in this study.)
Average Projected Savings for Each Category
category of use percent savings
institutional: hospitals 22schools 21hotels 20
commercial: office buildings 40laundry 29
industrial: beverage processors 16metal finishers/PC board manufacturers 15food processors 19
Source: Ploeser, Jane H., Charles W. Pike, and J. Douglas Kobrick, 1992, “Nonresidential WaterConservation: A Good Investment”, Journal American Water Works Association, Vol. 84, No. 10, October.
Several studies have been conducted examining efficiency potential in these categories. Oneinteresting finding is that within the overall CII sector in Southern California, 80% of thewater is used by 20% of the customers.108 From the standpoint of water managers seeking tofacilitate and support efficiency improvements, this focus greatly increases the prospects fortargeted strategies to assist large users with efficiency programs. Implementation at thelarge-user level also provides important models for the other 80-90% of CII users (on theorder 300,000 accounts in southern California), which undoubtedly possess profitableefficiency improvement opportunities.
In assessing the potential for future efficiency improvements in the CII sector, it isimportant to recognize that by the late 1980s many firms and institutions had alreadydemonstrated dramatic savings. Some have used these past improvements to suggest that theopportunities for additional reductions are limited. Recent analyses, however, indicates thatmany opportunities still exist for highly cost-effective efficiency improvements. Severallessons are evident. One is that new ideas and technologies continue to improve the cost-effectiveness of efficiency measures. Second, many CII users have never implemented eventhe most basic efficiency improvements. Third, many improvements are the result of carefulanalysis and overcoming the “human,” not technological or economic, factors (i.e. changingbehavior) in many public and private institutions.
It is also worth noting that water-efficiency potentials estimated in the DWR and MWDstudies indicating (22% and 23% savings) are conservative, since the economic criteria reflectvery short payback periods and the conservation recommendations primarily involve simpletechnological improvements. Examples of water-efficiency achievements for specific sitesshow that modest estimates are routinely surpassed.

58
Total costs to customers for implementation at all sites in the MWD study were estimated at$12,500,000, with the potential dollar value of water savings at $7,500,000 per year, whichrepresents a simple payback of 1.7 years. Some measures requiring operational changes wereassumed to have no investment (such as adjusting the blowdown for cooling towers orrescheduling irrigation times). An examination of the sites involved in the follow-up surveyshows that the simple payback for all measures was 1.6 years, and the average payback forthose measures reported implemented was 0.8 year. It is not surprising that customers wouldchose to implement those measures with shorter payback periods. 109
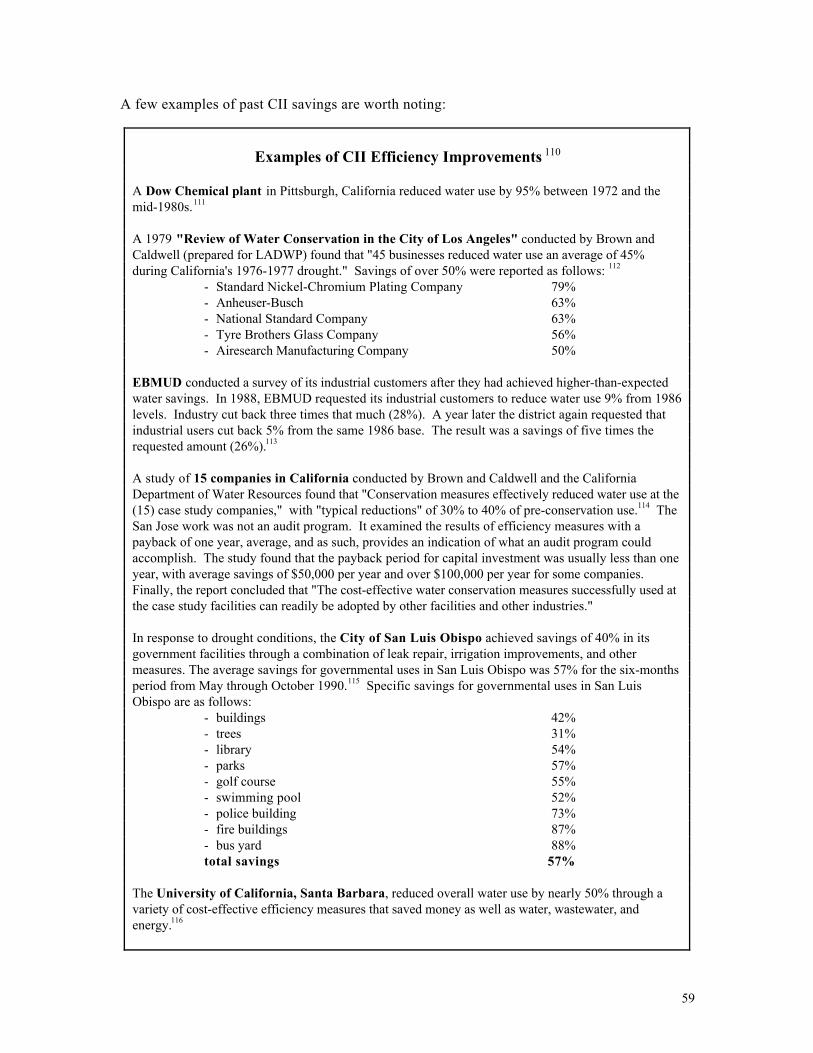
59
A few examples of past CII savings are worth noting:
Examples of CII Efficiency Improvements 110
A Dow Chemical plant in Pittsburgh, California reduced water use by 95% between 1972 and themid-1980s.111
A 1979 "Review of Water Conservation in the City of Los Angeles" conducted by Brown andCaldwell (prepared for LADWP) found that "45 businesses reduced water use an average of 45%during California's 1976-1977 drought." Savings of over 50% were reported as follows: 112
- Standard Nickel-Chromium Plating Company 79%- Anheuser-Busch 63%- National Standard Company 63%- Tyre Brothers Glass Company 56%- Airesearch Manufacturing Company 50%
EBMUD conducted a survey of its industrial customers after they had achieved higher-than-expectedwater savings. In 1988, EBMUD requested its industrial customers to reduce water use 9% from 1986levels. Industry cut back three times that much (28%). A year later the district again requested thatindustrial users cut back 5% from the same 1986 base. The result was a savings of five times therequested amount (26%).113
A study of 15 companies in California conducted by Brown and Caldwell and the CaliforniaDepartment of Water Resources found that "Conservation measures effectively reduced water use at the(15) case study companies," with "typical reductions" of 30% to 40% of pre-conservation use.114 TheSan Jose work was not an audit program. It examined the results of efficiency measures with apayback of one year, average, and as such, provides an indication of what an audit program couldaccomplish. The study found that the payback period for capital investment was usually less than oneyear, with average savings of $50,000 per year and over $100,000 per year for some companies.Finally, the report concluded that "The cost-effective water conservation measures successfully used atthe case study facilities can readily be adopted by other facilities and other industries."
In response to drought conditions, the City of San Luis Obispo achieved savings of 40% in itsgovernment facilities through a combination of leak repair, irrigation improvements, and othermeasures. The average savings for governmental uses in San Luis Obispo was 57% for the six-monthsperiod from May through October 1990.115 Specific savings for governmental uses in San LuisObispo are as follows:
- buildings 42%- trees 31%- library 54%- parks 57%- golf course 55%- swimming pool 52%- police building 73%- fire buildings 87%- bus yard 88%total savings 57%
The University of California, Santa Barbara, reduced overall water use by nearly 50% through avariety of cost-effective efficiency measures that saved money as well as water, wastewater, andenergy.116
60
Water and Wastewater Treatment
Historically, water and wastewater facilities have been designed with the emphasis on processreliability; efficient utilization of electricity has not received equal consideration.117
Opportunities exist for electric utilities to develop and implement programs aimed at energymanagement that will provide substantial benefits both to the electric utilities themselves andto their water and wastewater customers.118
At water treatment plants, most of the electricity used is for pumping. Fraklin Burton foundthat: In water systems, energy management opportunities mainly relate to pumpingequipment and operational control systems. The greatest opportunities include usingpremium efficiency motors and adjustable speed drives, selecting efficient pumps, utilizingeffective instrumentation and control, managing pumping operations by the efficient use ofavailable storage and high-efficiency pumping units, and operating emergency generators forpeak clipping. Significant reductions in energy use and cost are reported at existing facilitiesthrough energy management. In many applications, measures such as the installation of highefficiency motors, adjustable speed drives, and fine pore diffusers can be accomplished withpayback periods of three years or less.119
Energy Efficiency Measures For Water and Wastewater Systems
Energy efficiency measures, as defined here, are measures that have the primary impact of reducingenergy consumption. As a secondary impact, peak demand may be reduced. Some of the morecommon energy efficiency measures are discussed below.
High Efficiency Motors. The replacement of motors in existing plants with high-efficiencymotors has significant potential for strategic conservation, as well as some load managementpotential, because most of all the electric energy used in wastewater plants is due to motors.
Adjustable Speed Drives (ASDs). ASDs have become more attractive to customers in recentyears because developments in electronics have increased efficiencies and reduced costs. ASDs area means of controlling flow rates through reducing the speed of the motor, rather than throttlingfluids.
Fine Pore Diffused Air Systems. Diffused air systems use a combination of low pressureblowers (usually 7 to 10 psi), an air piping system, and submerged air diffusers in the aerationtanks. Fine pore diffusers produce fine air bubbles that provide better oxygen transfer efficiency inwastewater than other types that produce coarse (large) bubbles.
Increased Instrumentation and Control. Treatment plants can benefit from instrumentationand controls (I&C) to monitor dissolved oxygen (DO) in the aeration basins, control the aerationequipment to maintain set DO levels, and optimize the overall performance (including electricityconsumption) of the aeration system.
Burton, Franklin L., 1996, Water and Wastewater Industries: Characteristics and Energy Management Opportunities.(Burton Engineering) Los Altos, CA, Report CR-106941, Electric Power Research Institute Report, pp.2-46-48.
61
Load Management Measures
Energy Management Systems (EMS). EMS can serve several purposes in a wastewatertreatment plant; their greatest benefits can be peak shaving. EMS can be used to stagger startand duty cycle wastewater transfer pumps, start backup generators when peak demand approaches,and monitor and control DO levels.
Cogeneration Using Digester Biogas. If anaerobic digesters are used for biosolids stabilization,the biogas produced by the fermentation of organic matter can be used to power engine-drivenequipment or to generate electricity.
Operation of Backup Generators During Peak Periods. Almost every wastewater treatmentplant has emergency generators to provide power to operate essential systems. During othertimes, these generators are seldom used and can be operated for peak shaving at some plants.
Burton, Franklin L., 1996, Water and Wastewater Industries: Characteristics and Energy Management Opportunities.(Burton Engineering) Los Altos, CA, Report CR-106941, Electric Power Research Institute Report, p.2-49.
62
POLICY IMPLICATIONS AND OPPORTUNITIES BASED ON FINDINGS
The multiple and combined benefits of water, wastewater, and energy efficiency have beenrecognized in policy and practice in California and at the national level. The present analysisbuilds on important work undertaken by California government agencies and energy andwater utilities, and the logic of multiple benefits is embedded in state and federal policy,including the Energy Policy Act of 1992, which includes efficiency standards for plumbingdevices and a requirement for implementation of cost-effective energy and water efficiencymeasures within 10 years in federal facilities.120
One reason for undertaking this exploratory analysis was to determine if energy benefitsbased on technical efficiency potential in the area of water use could be supported by policymeasures. This section explores several policy processes related to water-use efficiency andconsiders possibilities for multiple benefits from combined water, wastewater, and energyefficiency strategies.
Several important policy initiatives are discussed here as they relate directly to theexploratory analysis. The first is the “Best Management Practices” process developed in theCalifornia urban water sector (and more recently in the agricultural sector as discussedbriefly). The second is a partnership between water, wastewater, and energy utilities insouthern California which produced important conceptual approaches, though it wasterminated prematurely. Policies supporting efficiency potential in the CII sector is alsodiscussed.
This section focuses particular attention on the California BMP process because of its directrelation to the analysis of the energy efficiency potential derived from water efficiencyimprovements. Also, the BMP process anticipates and supports the multiple-benefitsanalysis and related policy approaches which are the subject of this exploratory project.
The “Best Management Practices” Framework for Water Use EfficiencyImprovements
Policies and programs facilitating and supporting energy and water efficiency have madesignificant contributions toward cost-effective improvements in the use of resources inCalifornia. While energy efficiency programs, particularly in the electric utility sector, haveundergone major changes in the 1990s (in part due to changes in the regulatory frameworkfor the industry), the water sector has moved forward with an important and constructiveprogram known as “Best Management Practices” (BMPs). This section describes the BMPprocess, its background, and its success over the past decade. The process is ongoing, and itappears that the successful efforts of the various stakeholders involved over the past 10years will be recognized with the creation of a formal role for the Conservation Council incertification of BMP performance.
The BMP concept and approach to achieving increased water-use efficiency throughout theM&I sector is important to the present analysis of energy efficiency for several reasons.First, the process involves a coordinated effort to better understand the uses of water in theM&I sector, the possibilities for increased efficiencies, and the cost-effectiveness ofalternative approaches. Second, the BMP process explicitly includes consideration of water,wastewater, and energy consideration, and as such, is seeking to develop a comprehensiveapproach to resource management. Finally, the California Urban Water ConservationCouncil (CUWCC -- the entity comprised of the signatories to the process as describedbelow) has developed considerable competence in both technical assessments and policy
63
development. With an increasing role in water management efforts in the state, theCUWCC is well-positioned to utilize the energy-intensity analysis analyzed in the presentexploratory project.
Research Report Note:
This exploratory research project originally envisioned utilizing an assessment currentlybeing undertaken of the overall water savings attributable to the California BMPs as abasis for calculations of energy efficiency potential. Unfortunately, the release of thestudy examining water savings has been delayed indefinitely.
Certain BMPs have been analyzed and a water efficiency factor or range is stated.121
These factors can be used to estimate a portion of the savings attributable to the BMPs,but it is only a sub-set of the BMPs’ total impact.
The BMP process has been driven from its inception by considerations of a major waterrights hearing (as described further below). The implications of this legal and politicalcontext is than estimates of water efficiency potential have been conservative (e.g.efficiency potential is understated, and greater efficiencies than those formally stated areroutinely achieved by end-users and water agency programs throughout the state).Therefore, the BMP process may be viewed as a credible, if conservative, basis forassessing the potential for increasing water use efficiency.
This point is made directly in the MOU: “It is probable that average savingsachieved by water suppliers will exceed the estimates of reliable savings.”122
The BMP Concept and Process
The “Best Management Practices” process is a promising approach to water management,and it has demonstrated important and impressive results in certain areas. The basic ideabehind BMPs is that technically feasible, cost-effective, and socially acceptable water-efficiency improvements can and should be made through a variety of measures ranging fromtechnology retrofit programs to pricing approaches and public education. If fully andproperly implemented, BMPs should yield significant economic, social, and environmentalbenefits in a "win-win" for all parties.
The concept behind "Best Management Practices" (BMPs) as a guiding framework for waterpolicy is the creation of an "industry standard" for the management and reasonable andbeneficial use of the water resources.123 Through the BMP process, technical aspects ofwater distribution and use are joined by economic factors and management issues within alegal and political framework. The BMP concept has the potential to provide positivebenefits to California's economy and environment and to become a model policy for broaderapplication in resource management. Some of that potential has been realized. The BMPlist is a specific set of policy measures intended to be implemented as a package as part of anagreement between water suppliers and environmental and public interest organizations.
“Best Management Practices” are defined as “a policy, program, practice, rule, regulation orordinance or the use of devices, equipment or facilities which meets either of the followingcriteria:
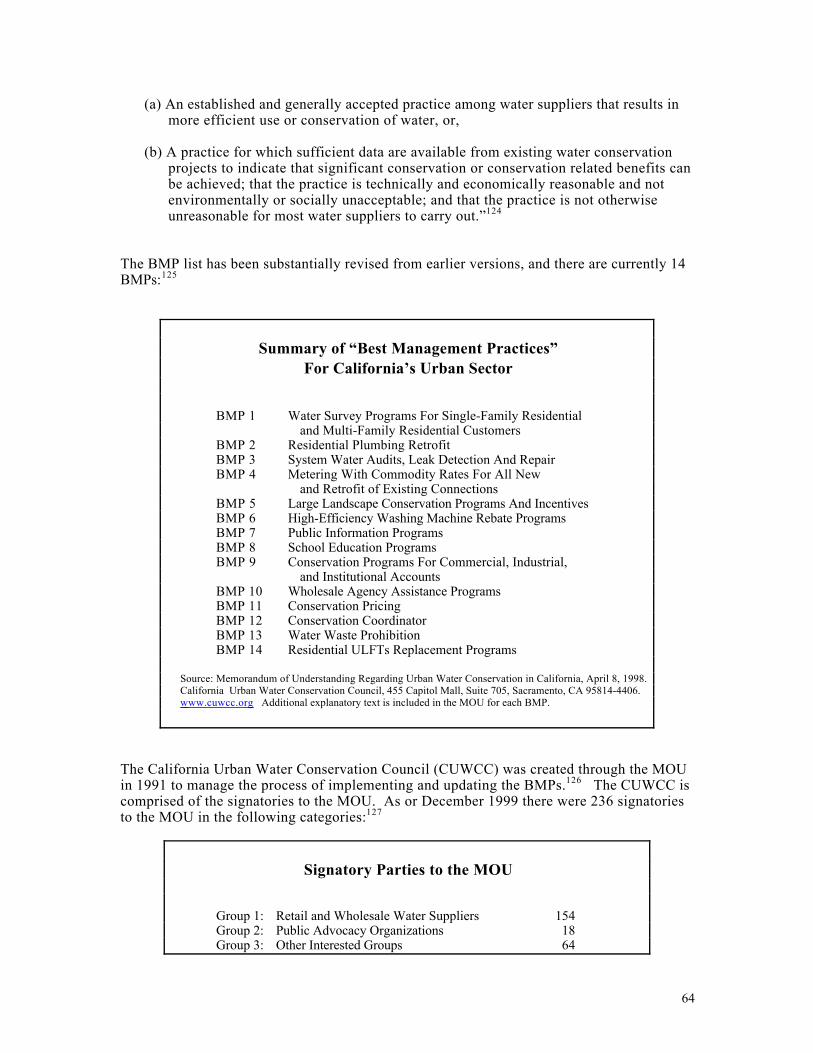
64
(a) An established and generally accepted practice among water suppliers that results inmore efficient use or conservation of water, or,
(b) A practice for which sufficient data are available from existing water conservationprojects to indicate that significant conservation or conservation related benefits canbe achieved; that the practice is technically and economically reasonable and notenvironmentally or socially unacceptable; and that the practice is not otherwiseunreasonable for most water suppliers to carry out.”124
The BMP list has been substantially revised from earlier versions, and there are currently 14BMPs:125
Summary of “Best Management Practices”For California’s Urban Sector
BMP 1 Water Survey Programs For Single-Family Residentialand Multi-Family Residential Customers
BMP 2 Residential Plumbing RetrofitBMP 3 System Water Audits, Leak Detection And RepairBMP 4 Metering With Commodity Rates For All New
and Retrofit of Existing ConnectionsBMP 5 Large Landscape Conservation Programs And IncentivesBMP 6 High-Efficiency Washing Machine Rebate ProgramsBMP 7 Public Information ProgramsBMP 8 School Education ProgramsBMP 9 Conservation Programs For Commercial, Industrial,
and Institutional AccountsBMP 10 Wholesale Agency Assistance ProgramsBMP 11 Conservation PricingBMP 12 Conservation CoordinatorBMP 13 Water Waste ProhibitionBMP 14 Residential ULFTs Replacement Programs
Source: Memorandum of Understanding Regarding Urban Water Conservation in California, April 8, 1998.California Urban Water Conservation Council, 455 Capitol Mall, Suite 705, Sacramento, CA 95814-4406. www.cuwcc.org Additional explanatory text is included in the MOU for each BMP.
The California Urban Water Conservation Council (CUWCC) was created through the MOUin 1991 to manage the process of implementing and updating the BMPs.126 The CUWCC iscomprised of the signatories to the MOU. As or December 1999 there were 236 signatoriesto the MOU in the following categories:127
Signatory Parties to the MOU
Group 1: Retail and Wholesale Water Suppliers 154Group 2: Public Advocacy Organizations 18Group 3: Other Interested Groups 64
65
The general goal of the BMP process is to implement a set of policies and technologies thatwill cost-effectively improve water-use efficiency in California’s urban sector. The primaryreason for engagement and the specific goal of water agencies is to secure continuing suppliesof water from sources such as the delta based on a demonstration of reasonable and beneficialuse.
Background on the California “Best Management Practices” Process
The BMP process was developed in reaction to a State Water Resources Control Board(SWRCB) concern regarding reasonable and beneficial use of water in the context ofextractions from the Sacramento-San Joaquin Delta. The California Constitution requiresthat water be used reasonably and beneficially in California. Recent court cases, such as theAudubon case (Mono Lake), the Imperial Irrigation District case (regarding water wasted inunlined canals), and the “Raconelli” decision (eight cases regarding Delta water rights andmanagement), had raised serious questions regarding water rights and “reasonable” water uses.128 These cases and rulings brought into question the practices and levels of efficiency ofuse of water in the state. "Reasonable and beneficial use" has been interpreted as bothavoidance of waste and efficient use as well as beneficial use of water resources.
The SWRCB convened hearings, commonly referred to as the "Bay-Delta" hearings, todetermine future allocation of key water supplies in California. Recipients of water inCalifornia must demonstrate that it is being used reasonably and beneficially. SWRCB madeinitial estimates of water efficiency potential in the urban sector.129 Some water purveyorschallenged the estimated efficiency improvement potential contained in the report andcommissioned their own studies.130 The BMP process was developed to meet therequirements of reasonable and beneficial use. BMPs are envisioned as a means ofestablishing an evolving "industry standard" for reasonable and beneficial use. The urbanBMPs form the basis for an agreement, through a memorandum of understanding (MOU),upon which purveyors, environmental organizations, and public-interest groups agree onreasonable and beneficial use. Estimates of reasonable and reliable savings through efficiencyimprovements in turn are being used as part of a process to determine water rights andallocation in the state.
The MOU addresses the water rights hearing as follows:
The BMPs, the estimates of reliable savings and the processes established by thisMOU are agreed to by the signatories for purposes of the present proceedings on theSan Francisco Bay/Sacramento-San Joaquin Delta Estuary ("Bay/Delta") and in orderto move the water conservation process forward. "Present Bay/Delta proceedings" isintended to mean those Bay/Delta proceedings presently underway and thoseconducted until a final water rights decision is reached by the State Water ResourcesControl Board ("State Board").131
DWR observed in 1989, as the BMP process was being established, that "A majorconsideration in these hearings (the SWRCB Bay-Delta hearings) is how urban water districtsare currently conserving and how they will implement additional Best ManagementPractices."132 From the purveyor's perspective, BMPs were developed in part todemonstrate reasonable use in order that they may continue to receive water allocations. A
66
manager for the Metropolitan Water District summed up the agency’s perspective in 1989:"Best Management Practices will show the State Board that water districts are serious aboutconservation. At the same time, we will get enough water for our reasonable needs."133
In 1990, DWR noted that the agreement on BMPs "will allow water districts to satisfyconservation requirements of the State Water Resource Control Board." Assuming that anagreement would be reached, "The signed MOU will be given to the SWRCB this spring(1991) to satisfy conservation requirements for the Bay-Delta water rights proceedings."134
MWD also commented that the BMP process and the agreement were intended to resolvethe issue of urban water conservation as it relates to the Bay-Delta hearings: "Thisagreement will demonstrate our commitment to improving the efficiency of water use. Atthe same time the MOU will remove urban water conservation as a controversy in the Bay-Delta proceedings."135 The MOU was signed in 1991. Sixteen initial BMPs were agreed to(revised to 14 as of 1999), and specific definitions and parameters, implementationschedules, and coverage requirements are set forth in the MOU.136 (Evolving into theCalFed process, the Bay-Delta proceedings continued through the 1990s.)
The MOU contains a provision under which signatories agree to send a letter to the stateboard as follows:137
The signatories will make the following recommendations to the State Board inconjunction with the present Bay/Delta proceedings and to the EPA to the extent theEPA concerns itself with the proceedings:
(a) That for purposes of the present Bay/Delta proceedings, implementation ofthe BMP process set forth in this MOU represents a sufficient long-termwater conservation program by the signatory water suppliers, recognizing thatadditional programs may be required during occasional water supply shortages;
(b) That for purposes of the present Bay/Delta proceedings only, the State Boardand EPA should base their estimates of future urban water conservationsavings on the implementation of all of the BMPs included in Section A ofExhibit 1 to this MOU for the entire service area of the signatory watersuppliers and only on those BMPs, except for (I) the conservation potentialfor water supplied by urban agencies for agricultural purposes, or (ii) in caseswhere higher levels of conservation have been mandated;.
(c) That for the purposes of the present Bay/Delta proceedings, the State Boardand EPA should make their estimates of future urban water conservationsavings by employing the reliable savings assumptions associated with thoseBMPs set forth in Section C of Exhibit 1 to this MOU;
(d) That the State Board should include a policy statement in the water rightsphase of the Bay/Delta proceedings supporting the BMP process described inthis MOU and that the BMP process should be considered in any documentsprepared by the State Board pursuant to the California Environmental QualityAct as part of the present Bay/Delta proceedings.
The BMP process initially identified specific practices already in place in various watermanagement agencies in California. Participants analyzed “proven” measures that deliverwater efficiency improvements and reduce waste. 138 In the bargaining that took place, wateragencies agreed to list these measures as “best” practices and to implement them, while

67
environmental and other public interest organizations agreed to support conservativeestimates of the amounts of water which the measures would save.
The parties agreed that:
California's economy, quality of life and environment depend in large part upon thewater resources of the State. The signatories also recognize the need to providereliable urban water supplies and to protect the environment. Increasing demands forurban, agricultural and environmental water uses call for conservation and theelimination of waste as important elements in the overall management of waterresources.139
Implementation of the BMPs
Important work has been done to implement the BMP process by the California UrbanWater Conservation Council (CUWCC), an institution created as part of the BMP process,and by the DWR and numerous water agency, industry, and environmental and public interestorganization participants. Some agencies have demonstrated leadership and becomeexamples of high-quality management. Others have been slow to follow. As a recent reviewof performance notes: “The level of implementation has varied considerably across watersuppliers.”140
As stipulated in the MOU, the water management agencies agree to work proactively withother legal authorities, such as wastewater and energy utilities, to accomplish the goal ofefficiency improvement. Both the concept of multiple benefits and the logic of sharedresponsibility is clear in the agreement. Even where agencies are constrained, the agreementcalls for signatories to work with other entities to develop programs that achieve multiplebenefits. As such, the BMP program is considerably ahead of other resource policy efforts.
The term “implementation” is explicitly defined for purposes of the MOU as follows:
"Implementation" means achieving and maintaining the staffing, funding, and ingeneral, the priority levels necessary to achieve the level of activity called for in thedescriptions of the various BMPs and to satisfy the commitment by the signatoriesto use good faith efforts to optimize savings from implementing BMPs.141
The MOU contains important and well-crafted language regarding the signatories’ “goodfaith” responsibilities:142
While specific BMPs and results may differ because of varying local conditionsamong the areas served by the signatory water suppliers, a good faith effort toimplement BMPs will be required of all signatory water suppliers. The following areincluded within the meaning of "good faith effort to implement BMPs":
(a) The proactive use by a signatory water supplier of legal authorities andadministrative prerogatives available to the water supplier as necessary andreasonable for the implementation of BMPs.
(b) Where implementation of a particular BMP is not within the legal authorityof a signatory water supplier, encouraging timely implementation of the BMPby other entities that have the legal authority to carry out the BMP within
68
that water supplier's service area pursuant to existing legal authority. Thisencouragement may include, but is not limited to, financial incentives asappropriate.
(c) Cooperating with and encouraging cooperation between other water suppliersand other relevant entities whenever possible and within existing legalauthority to promote the implementation of BMPs.
(d) Optimizing savings from implementing BMPs.
(b) For each signatory water supplier and all signatory public advocacyorganizations, encouraging the removal of institutional barriers to theimplementation of BMPs within that water supplier's service area. Examplesof good faith efforts to remove institutional barriers include formalpresentations and/or written requests to entities requesting approval of, oramendment to, local ordinances, administrative policies or legislation whichwill promote BMP implementation.
In addition to the “good faith” obligation, signatories seeking an exemption from theprovisions of the agreement are required to follow a rigorous procedure as follows:143
A signatory water supplier will be exempt from the implementation of specific BMPsfor as long as the supplier substantiates each reporting period that based upon thenprevailing local conditions, one or more of the following findings applies:
(a) A full cost-benefit analysis, performed in accordance with the principles setforth in Exhibit 3, demonstrates that either the program (i) would not becost-effective overall when total program benefits and costs are considered;OR (ii) would not be cost-effective to the individual water supplier even afterthe water supplier has made a good faith effort to share costs with otherprogram beneficiaries.
(b) Adequate funds are not and cannot reasonably be made available from sourcesaccessible to the water supplier including funds from other entities. However,this exemption cannot be used if a new, less cost-effective water managementoption would be implemented instead of the BMP for which the watersupplier is seeking this exemption.
(c) Implementation of the BMP is (i) not within the legal authority of the watersupplier; and (ii) the water supplier has made a good faith effort to work withother entities that have the legal authority to carry out the BMP; and (iii) thewater supplier has made a good faith effort to work with other relevantentities to encourage the removal of institutional barriers to theimplementation of BMPs within its service area.
Signatory water suppliers shall submit exemptions to the Council within two monthsfollowing the start of the reporting period for which the exemptions are beingclaimed.
Performance Challenges
69
Water-use efficiency is a major factor in policy discussions, and the Bay-Delta water rightsissue remains contentious. The SWRCB process has now evolved into the “CalFed”process.144 It is clear that any long-term water management system arising from theseprocesses will include a water-use efficiency provision. The urban BMP program is beingconsidered as part of the criteria for water-use efficiency, and the CUWCC is beingconsidered as the certification agency to verify compliance with BMPs.
The creation of the voluntary BMP process and the initial efforts of the CUWCC haveproduced important but limited results. The parties agree that significant net water suppliescan be made available through efficiency improvements, but implementation of BMPs andthe consequent realization of water efficiency potential in many water service areas has beendisappointing. As of 1997 (based on the 1995-1996 biennial report), less than half thestate’s population was covered by the program. Fewer than half of the retail water agenciesthat had signed the MOU had submitted reports, and of those, less than half wereimplementing key BMPs such as BMP 1, Residential Water Surveys (Audits), BMP 2,Plumbing Retrofits, BMP 5, Large Landscape Water Audits and Incentives, BMP 9,Commercial, Industrial, Institutional Water Conservation, and BMP 16 (now BMP 14),Ultra-low-flush Toilet Replacements.145 Not a single agency had submitted a cost-effectiveness analysis supporting claims for exemptions from the program, though manyhave exempted themselves on key measures (e.g. 22 suppliers for BMP 2, 23 for BMP 5, 28for BMP 9, and 24 for BMP 16).146
On the positive side, 75% of the wholesale water suppliers and 88% of the combinedretail/wholesale suppliers had submitted reports on their activities by 1997. The totalinvestment in efficiency by retail, wholesale, and combined agencies for 1995-96 was$48,922,965, split nearly evenly between wholesale ($23.4 million) and retail ($25.5million).147
It has become clear that voluntary action, while sufficient for some key players, is notenough to bring about sufficient levels of implementation of the BMP program. Waste,inefficient use, and poor management practices persist. State authorities cannot conclude atthis point that water is being put to “reasonable and beneficial use” in all areas when someagencies are ignoring the BMP measures. For this reason, there is consideration at the statelevel of making the BMPs mandatory. The CUWCC is considering the eventuality of acertification and compliance role under a “beyond voluntary” BMP process.
Future BMP Progress
The BMP process is an important new model of cooperative information-sharing anddecision-making between diverse stakeholders. While implementation has lagged in somequarters, there is strong commitment among many of the leading water managers and publicinterest advocates in the state. The work commissioned by the CUWCC has greatlyimproved our understanding of the technical dimensions of water use and efficiency potential.The methodologies developed have also contributed to more effective implementation bythose who have chosen to adopt them. If policy measures in California provide strongermandates for implementation, considerable improvements in water use efficiency can beexpected.
To enhance the process, clear and more detailed criteria and methodologies for determiningtotal benefits and costs would be beneficial. With a more comprehensive matrix, includingenergy data, the question of how much efficiency is possible, appropriate, and cost-effectivecan be more accurately answered. The important question is "how much efficiency potentialexists at a certain cost/price level?" This factor is key both to purveyors who wish to
70
optimize allocation of their resources and to consumers who seek optimal allocation of theirresources.
The energy efficiency benefits derived from the BMP policy has not been quantified, in partbecause the total water savings have not been estimated. Studies have examined parts of theenergy/water equation, and “embodied” energy has been calculated for certain areas.148 Theapplication of energy-intensity data to the water efficiency information would provideimportant information for policy.
Agricultural Sector “Efficient Water Management Practices” Program
As noted above, this exploratory project does not include analysis of the energy intensity orefficiency potential of water used in the agricultural sector. It is important to note, however,that efficiency opportunities exist in this sector, and a corollary to the urban sector BMPprogram has been developed in the agricultural sector. Stimulated by state legislation passedin 1990 (Agricultural Water Suppliers Efficient Water Management Practices Act of 1990 (AB3616)), agricultural water users have been discussing approaches to increased water useefficiency.
In 1999, a “Memorandum of Understanding” (MOU) was drafted in response to thelegislation.149 Pump efficiencies and energy savings potential is included in the “GenerallyApplicable Efficient Water Management Practices” which are required of signatories (withconditions and exceptions).150 Item number 6 in List A of the MOU is: “Evaluate andimprove efficiencies of water suppliers’ pumps,” and it states in part: “A program toevaluate and improve the efficiencies of such pumps may result in energy savings or peakload reductions, or reveal capacity limitations due to inefficient facilities. Over the longterm, the water supplier may be able to reduce operational costs and improve operationalefficiency.”151
The MOU also addresses, with significant reservations, the issues of metering, measuring andmonitoring water use, water pricing options, and various approaches to increasing water useefficiency. Future research on the energy intensity of water should seek to incorporateagricultural uses.
The Southern California Energy and Water Partnership
In 1990, Southern California Edison, the Metropolitan Water District of Southern California,the Los Angeles Department of Water and Power, and the Southern California Gas Company,formed the Southern California Energy and Water Partnership. As the director of MWDcommented at the time of its formation, “The Partnership is founded on the principle thatpooling resources and cooperatively developing conservation programs is mutually beneficialand cost-effective.”152 The partnership was joined by the sanitation district of OrangeCounty, the cities of Anaheim, Burbank, Glendale, Pasadena, and Santa Monica, the CentralBasin Municipal Water District, the Municipal Water District of Orange County, and theWest Basin Municipal Water District.
The collaborative effort worked for several years to develop joint energy/water efficiencyprograms. Some excellent work was undertaken involving co-funding of efficiency measuresbased on combined energy, water, and wastewater efficiency improvements.153 SCEcoordinated efforts for water/energy efficiency programs at federal facilities in the regionunder an agreement with the General Services Administration (GSA). Much of the focus ofthis partnership was on technologies such as ULF toilets, showerheads, and horizontal axis

71
washing machines. Efforts undertaken included a study by Barakat and Chamberlin oncombined water/energy/wastewater benefits attributable primarily to ULF toilet replacementprograms. The study concluded that water pumping required $110/acre foot (1992 dollars)of electricity cost in the Southern California area.154 Unfortunately, for a variety of reasonsthe Partnership is no longer active.
The Southern California Energy and Water Partnership developed a cost-sharing approachfor efficiency measures. A specific focus of the program was the replacement of older toiletswith ultra-low-flow (ULF) retrofits, as well as high efficiency washing machine rebates, andpublic information efforts. The agencies agreed on a cost-sharing formula in which MWDpicked up 60% of the program costs, with the wastewater and energy partners each pickingup 20%.155 An example of a co-funding breakdown for a $580,000 retrofit program toreplace 5,000 toilets with ULF technology is:
Southern California Energy and Water Partnership(cost-sharing percentages)
MWD 60%Wastewater agencies 20%SC Edison 20%
Source: Barakat & Chamberlin, Inc., 1992, A Framework for Sharing the Costs of an Ultra-Low-Flush ToiletRetrofit Program, Final Report to Metropolitan Water District of Southern California, October 5, 1992, p. 3.
The partnership effort was initiated by Edison and catalyzed by the severe drought inCalifornia in the late 1980s. The effort was facilitated in part by DSM policies for energyutilities in the state. With the end of the drought and the deregulation of the electricityindustry, the partnership evaporated. Recently the energy and water utilities havereestablished a joint program to incentivize the use of horizontal axis washing machines.
Policy Implications of Findings for the CII Sector
Various policy measures are available which can encourage, facilitate, and incentivizeincreased water-use efficiency in the CII sector. A number of models exist.
The urban “Best Management Practices” include two measures directed specifically at the CIIsector. The first stipulates that agencies, at a minimum, support CII water conservation byoffering audits and incentives that target the top 10 percent of industrial and commercialcustomers, providing follow up audits at least once very five years if necessary. A secondmeasure establishes a CII review program which ensures that agencies review any proposedwater uses for new commercial and industrial water service and make recommendations forimproved water-use efficiency before completion of the building process.
Some agencies have developed water conservation programs for the CII sector utilizing acombination of audits, financial incentives, water rate structures, and educational programs.The following examples, while not exhaustive, illustrate the range of programs in place andthe positive water efficiency improvements achieved.
MWD followed its audit program with a menu of rebates available to CII customers who undertakewater-efficiency improvements. MWD offers customers fixed-rate rebates for retrofitting or replacing
72
toilets or urinals, flush valves, pre-rinse spray heads, conductivity meters for cooling towers, orhorizontal-axis washers.156 Initial estimates of savings potential in this sector were 15percent for commercial and institutional and 20 percent for the industrial sector. Thefindings of the program exceeded these estimates by a considerable margin, with anoverall potential for 29 percent water savings. This was adjusted to 23 percent when tworemarkably heavy water-using wastewater facilities were excluded. Examining the auditresults by sector shows the industrial sector with 26 percent identified savings, thecommercial sector with 20 percent identified savings, and the institutional sector with 19percent identified savings.
The East Bay Municipal Utility District (EBMUD) offers both audit and rebate programs to CIIcustomers. Rebates are provided for conservation measures recommended in the course of an audit andare designed to offset part of the initial cost of hardware upgrades or retrofits that are expected to resultin significant savings. Rebates are based on estimated water savings at a rate of $0.73 per billing unit(748 gallons)—$318 per acre-foot—of water saved and may cover up to half of the installation cost ofan eligible conservation measure.
The City of San Jose’s Environmental Services Department implemented a Financial IncentiveProgram for commercial and industrial users. The primary motivating factor behind the program wasreducing wastewater. To qualify, proposed projects must reduce wastewater by at least 1,496 gallonsper year, and equipment must be purchased or leased within six months of the project being approvedby the city. Equipment must have a life expectancy of no less than five years, and leases must be for aminimum period of three years.157 The amount of the awards was initially based on the city’s avoidedcost of treating the water the new equipment would conserve, as well as its avoided cost of expandingthe wastewater treatment plant. The city determined its (avoided cost) savings to be $1,000 per acre-foot, and initially offered customers $435 per acre-foot saved. However, in October 1991, they doubledthe incentive, to $870 per acre-foot, to encourage more companies to apply. In 1998, the incentive wasagain doubled, to $1,740 per acre foot, the percent of a project’s capital costs paid increased from 30 to50 percent, and the $20,000 maximum award increased to $50,000 per project. These incentiveamounts are cost-effective when compared to the city’s reclaimed and other water conservationprograms, such as ULFTs.158
In 1988, the City of Palo Alto was ordered by the San Francisco Water Department (its chief watersupplier) to reduce its annual water use by 25 percent. In response, the city initiated a pilot WaterEfficiency Program in September 1991 that included a water audit program for industrial facilities,which accounted for approximately 19 percent of the city’s total water consumption. The city decidedto focus on internal plant operations, examining domestic uses (toilets and faucets), heating, venting,and air conditioning (HVAC) systems, and processing applications (materials transportation, rinsebaths, lubrication systems, and chemicals). Three companies were chosen from the responses to amailing describing the audit program. The companies—an ice cream plant, a pharmaceutical company,and an electronic components manufacturer—each implemented some of the changes recommendedduring the audits. Palo Alto’s conservation programs (CII and residential) were so successful that thecity reduced overall water consumption by 35 percent.159 One of the most successful consequences ofthe information discovered during the pilot study was the passage of a city ordinance that prohibits theinstallation of once-through cooling systems.160
Since 1992, the Contra Costa Water District (CCWD)161 has offered free audits to all of its CIIcustomers, and it performs an average of 200 audits per year. CCWD also offers financial incentives tocommercial customers for upgrading selected plumbing fixtures, machines, and HVAC equipment.The incentives include $75 for each low-flow toilet, horizontal-axis washing machine, or commercialdishwasher using no more than 1.6 gallons per rack installed; $200 for each conductivity meterinstalled (conductivity meters automate cooling tower bleed water); and half of the cost, up to $500, ofeach pressure washer or recirculating pump installed. Funds are available on a first-come/first-servebasis. After the customer receives an audit and the project is approved, the customer has one year inwhich to upgrade its equipment. According to Water Conservation Specialist Ray Cardwell, whenSafeway installed conductivity meters at its seven stores in the CCWD service area that use coolingtowers, average water use by those stores dropped from 3,000 gpd to 300 gpd, resulting in a payback
73
period of less than one month. The Safeway program was a joint effort between PG&E and theCCWD.162
The Green Business Program is a coalition of 12 government agencies that works with Bay Areabusinesses to upgrade equipment like irrigation timers, washing machines, conductivity meters, etc.The program pays up to 50 percent of the material cost of water-conserving equipment.163 To allaythese fears, the agencies offer an “amnesty” program—if violations are found when the customer hascome forward to participate, the customer is not fined but given a courtesy “ticket” and the opportunityto fix any violation.
Summary of Policy Implications and Opportunities
Significant water efficiency improvement potential has been identified through variousprograms in California. Even when technically sound, cost-effective, and socially, desirable,many of the available opportunities have yet to be realized. In order to facilitate andencourage greater implementation of cost-effective technology and management measures,policy approaches need to be developed based on analysis of the multiple benefits ofefficiency strategies.
The BMP process offers a unique and important opportunity to pursue policies to achievemultiple benefits through increased water, wastewater, and energy efficiencies.
74
RECOMMENDATIONS FOR FURTHER RESEARCH
The exploratory effort indicates that significant cost-effective energy efficiency potentialexists in California through water efficiency improvements. Efficiency measures in the watersector have a number of important benefits in addition to energy savings, includingenvironmental and economic benefits. Based on the promising results from this initialresearch effort, the following recommendations are set forth:
1. Apply the methodology and tools developed to specific areas of the state in which theenergy intensity of water is highest. (This would include the most urbanized areas southof the Tehachapi Mountains to the Mexican border), central coast areas, the SanFrancisco Bay area, and other areas to be determined.
2. Further develop the methodology to include and quantify multiple benefits of efficiencyimprovements including air quality benefits (reduced energy use translating into reducedemissions based on actual power generation sources and time and season of use), capitaland operating cost savings for both water and energy systems, and other economic andenvironmental benefits.
3. Investigate the pumping energy used within facilities and potential savings due toimproved system efficiency.
4. Refine the already fairly well-developed methodology for estimating thermal energysavings within facilities resulting from water efficiency programs. (Previous work onshowerhead and aerator replacement programs, horizontal axis washing machines, andother devices provides a strong basis for estimating thermal energy savings potential.)
5. Examine the energy implications of incorporating distributed water storage and treatmentand technologies. These technologies range from cooling tower re-use treatment optionsgrey water applications to rain water catchment for irrigation. In many cases, on-sitestorage and/or treatment may provide important energy efficiencies due to reducedpumping and treatment off-site.
Additional research efforts should focus on the following topics:
• quantifying energy efficiency potential by sector through water efficiency• multiple benefits accounting for water efficiency and derived energy benefits• peak load analysis and water systems• implications for electricity transmission system of increased water pumping demand• analysis of BMPs and energy benefits potential• air quality implications of the water/energy efficiency link• implications of decentralized electricity generation technologies on water use
(location and amount)

75
APPENDIX
List of AcronymsConversion FactorsMember Agencies of MWDRegulations Affecting the Water and Wastewater Industry
76
LIST OF ACRONYMS
AF acre foot or acre feetAFY acre feet per yearANSI American National Standards InstituteAWRA American Water Resources AssociationAWWA American Water Works AssociationBMP best management practicesCRA Colorado River AqueductCVP Central Valley ProjectCVPIA Central Valley Project Improvement ActDAF dissolved air filtrationDWR California Department of Water ResourcesEBMUD East Bay Municipal Utility DistrictEPA U.S. Environmental Protection AgencyESA Endangered Species ActFCD flushes per capita per dayGCD gallons per capita per dayGPD gallons per dayGPF gallons per flushGPH gallons per hourGPM gallons per minuteHCF hundred cubic feetIAPMO International Association of Plumbing and Mechanical OfficialsIID Imperial Irrigation DistrictIWR-MAIN Institute for Water Resources Municipal and Industrial NeedsLADWP Los Angeles Department of Water and PowerM&I municipal and industrialMAF (or maf) million acre feetMAFY million acre feet per yearMGD million gallons per dayMOU memorandum of understanding MWD Metropolitan Water District of Southern CaliforniaMWD-MAIN Metropolitan Water District Municipal and Industrial NeedsMWRA Massachusetts Water Resources AuthorityPSI pounds per square inchRO reverse osmosisROI return on investmentSWP State Water ProjectSWRCB California State Water Resources Control BoardTAF (or taf) thousand acre feetTDS total dissolved solidsUAW unaccounted-for-waterUCSB University of California, Santa BarbaraUFF unaccounted-for-flows (= UAW)ULF ultra-low-flow (1.6 GPF and less)ULV ultra-low-volumeUPC Uniform Plumbing Code
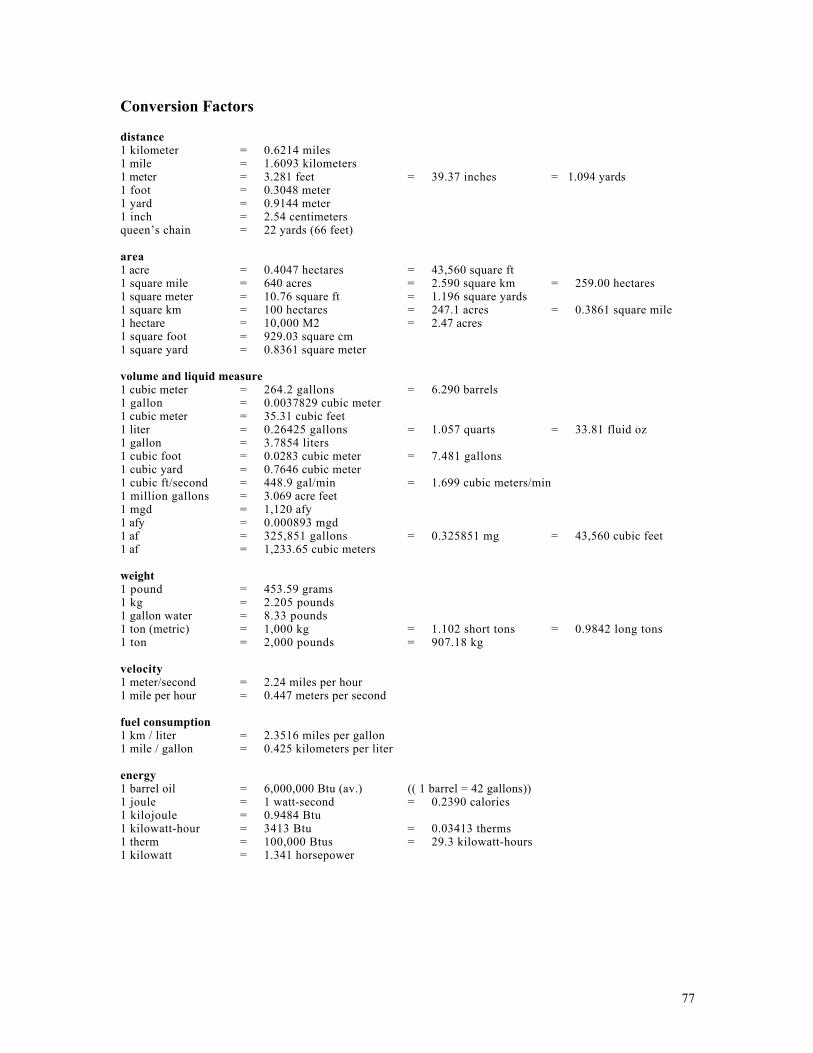
77
Conversion Factors
distance1 kilometer = 0.6214 miles1 mile = 1.6093 kilometers1 meter = 3.281 feet = 39.37 inches = 1.094 yards1 foot = 0.3048 meter1 yard = 0.9144 meter1 inch = 2.54 centimetersqueen’s chain = 22 yards (66 feet)
area1 acre = 0.4047 hectares = 43,560 square ft1 square mile = 640 acres = 2.590 square km = 259.00 hectares1 square meter = 10.76 square ft = 1.196 square yards1 square km = 100 hectares = 247.1 acres = 0.3861 square mile1 hectare = 10,000 M2 = 2.47 acres1 square foot = 929.03 square cm1 square yard = 0.8361 square meter
volume and liquid measure1 cubic meter = 264.2 gallons = 6.290 barrels1 gallon = 0.0037829 cubic meter1 cubic meter = 35.31 cubic feet1 liter = 0.26425 gallons = 1.057 quarts = 33.81 fluid oz1 gallon = 3.7854 liters1 cubic foot = 0.0283 cubic meter = 7.481 gallons1 cubic yard = 0.7646 cubic meter1 cubic ft/second = 448.9 gal/min = 1.699 cubic meters/min1 million gallons = 3.069 acre feet1 mgd = 1,120 afy1 afy = 0.000893 mgd1 af = 325,851 gallons = 0.325851 mg = 43,560 cubic feet1 af = 1,233.65 cubic meters
weight1 pound = 453.59 grams1 kg = 2.205 pounds1 gallon water = 8.33 pounds1 ton (metric) = 1,000 kg = 1.102 short tons = 0.9842 long tons1 ton = 2,000 pounds = 907.18 kg
velocity1 meter/second = 2.24 miles per hour1 mile per hour = 0.447 meters per second
fuel consumption1 km / liter = 2.3516 miles per gallon1 mile / gallon = 0.425 kilometers per liter
energy1 barrel oil = 6,000,000 Btu (av.) (( 1 barrel = 42 gallons))1 joule = 1 watt-second = 0.2390 calories1 kilojoule = 0.9484 Btu1 kilowatt-hour = 3413 Btu = 0.03413 therms1 therm = 100,000 Btus = 29.3 kilowatt-hours1 kilowatt = 1.341 horsepower

78
Member Agencies of MWD
City of Anaheim201 S. Anaheim BoulevardCity Hall West, 11th FloorAnaheim, CA 92805(714) 765-4268
City of Beverly HillsPublic Works Department9298 W. Third StreetBeverly Hills, CA 90210(310) 285-2462
City of BurbankPublic Service Department164 W. Magnolia Blvd.Burbank, CA 91502(818) 238-3550
Calleguas Municipal Water District2100 Olsen RoadThousand Oaks, CA 91362(805) 526-9323
Central Basin Municipal WaterDistrict17140 S. Avalon Blvd., #210Carson, CA 90746-1218(310) 217-2222
Coastal Municipal Water District3 Monarch Bay Plaza, #205Dana Point, CA 92629(714) 493-3411
City of ComptonWater DepartmentCity Hall205 S. Willowbrook Ave.Compton, CA 90220(310) 605-5595
Eastern Municipal Water District2270 Trumble RoadPerris, CA 92570(909) 928-3777
Foothill Municipal Water District4536 Hampton RoadLa Canada Flintridge, CA 91011(818) 790-4036
City of Fullerton
Water Engineering Division303 W. Commonwealth Ave.Fullerton, CA 92632(714) 738-6886
City of GlendalePublic Service Department141 N. Glendale Ave., 4th LevelGlendale, CA 91206-4496(818) 548-2107
Inland Empire Utilities Agency9400 Cherry AvenueBuilding AFontana, CA 92335(909) 357-0241
Las Virgenes Municipal WaterDistrict4232 Las Virgenes RoadCalabasas, CA 91302(818) 880-4110
City of Long BeachWater Department1800 E. Wardlow Rd.Long Beach, CA 90807(562) 570-2300
City of Los AngelesDepartment of Water & PowerP.O. Box 111Los Angeles, CA 90051(213) 367-1338
Municipal Water District of OrangeCounty10500 Ellis AvenueFountain Valley, CA 92708(714) 963-3058
City of PasadenaWater & Power Department150 S. Los Robles Ave., #200Pasadena, CA 91101(818) 405-4409
San Diego County Water Authority3211 Fifth Ave.San Diego, CA 92103(619) 682-4100
City of San Fernando
City Hall117 Macneil StreetSan Fernando, CA 91340(818) 898-1200
City of San MarinoCalifornia-American Water Co.2020 Huntington DriveSan Marino, CA 91108-2022(818) 289-7821
City of Santa AnaPublic Works Agency217 N. Main St., 3rd Fl., M-22Santa Ana, CA 92701(714) 647-3345
City of Santa MonicaUtilities Division1212 5th Street, 3rd FloorSanta Monica, CA 90401(310) 458-8230
Three Valleys Municipal WaterDistrict1021 Miramar AvenueClaremont, CA 91711(909) 621-5568
City of TorranceWater Division3031 Torrance Blvd.Torrance, CA 90509-2970(310) 618-6216
Upper San Gabriel Valley MunicipalWater District11310 East Valley Blvd.El Monte, CA 91731(818) 443-2297
West Basin Municipal Water District17140 S. Avalon Blvd., #210Carson, CA 90746-1218(310) 217-2411
Western Municipal Water District ofRiverside County450 Alessandro Blvd.Riverside, CA 92517-5286(909) 780-4170
79
Regulations Affecting the Water and Wastewater Industry
The following is from Franklin Burton, Water and Wastewater Industries: Characteristics and EnergyManagement Opportunities. 164
Over the last 40 years, the number of treatment plants serving population centers in theUnited States has nearly tripled. Implementation of the federal Clean Water Act (CWA)brought about substantial changes in water pollution control to achieve “fishable andswimmable” waters.
A significant event in the field of wastewater management in the United States was thepassage of the Federal Water Pollution Control Act Amendments of 1972 (Public Law 92-500) often referred to as the CWA. Before that date, there were no specific national waterpollution control goals or objectives.
A National Pollution Discharge Elimination System (NPDES) program was established basedon uniform technological minimums with which each point source discharge had to comply.To date, over 60,000 permits have been issued under the SPDES program. EPA is theresponsible governmental agency in administering the clean water program.
In 1987, Congress enacted the Water Quality Act of 1987 (WQA), the first major revisionof the CWA. Important provisions of the WQA are: (1) the strengthening of federal waterquality regulations by providing changes in permitting and adding substantial penalties forpermit violations, (2) significantly amending the CWA’s formal sludge (biosolids) controlprogram by emphasizing the identification and regulation of toxic pollutants in sewage sludge,(3) providing funding for state and EPA studies for defining non-point and toxic sources ofpollution, (4) setting new deadlines for compliance including priorities and permitrequirements for stormwater, and (5) establishing a phase-out of the construction grantsprogram as a method of financing publicly owned treatment works (POTW). Subsequently,construction grants have been replaced largely by state revolving loan programs.
The Ocean Dumping Ban Act of 1988 prohibited any dumping of wastewater solids intoocean waters after December 31, 1991. In 1993, EPA issued new regulations (40 CFR Part503) for the use and disposal of biosolids from wastewater treatment plants. The regulationscover three general categories of beneficial use and disposal practices: application of land,surface disposal, and incineration. Limitations were established for items such ascontaminants (mainly metals), pathogen content, and vector attraction reduction (vectorsinclude birds, insects, and rodents). The general thrust of the Part 503 regulations is tosupport beneficial use.
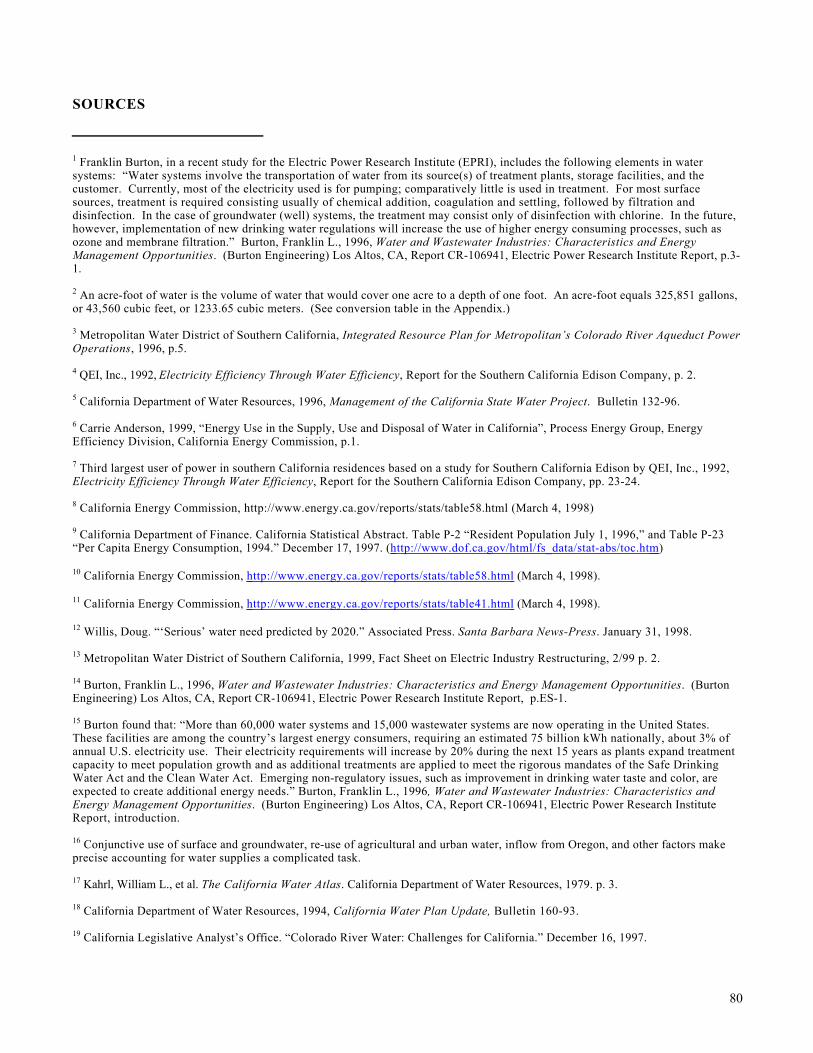
80
SOURCES
1 Franklin Burton, in a recent study for the Electric Power Research Institute (EPRI), includes the following elements in watersystems: “Water systems involve the transportation of water from its source(s) of treatment plants, storage facilities, and thecustomer. Currently, most of the electricity used is for pumping; comparatively little is used in treatment. For most surfacesources, treatment is required consisting usually of chemical addition, coagulation and settling, followed by filtration anddisinfection. In the case of groundwater (well) systems, the treatment may consist only of disinfection with chlorine. In the future,however, implementation of new drinking water regulations will increase the use of higher energy consuming processes, such asozone and membrane filtration.” Burton, Franklin L., 1996, Water and Wastewater Industries: Characteristics and EnergyManagement Opportunities. (Burton Engineering) Los Altos, CA, Report CR-106941, Electric Power Research Institute Report, p.3-1.
2 An acre-foot of water is the volume of water that would cover one acre to a depth of one foot. An acre-foot equals 325,851 gallons,or 43,560 cubic feet, or 1233.65 cubic meters. (See conversion table in the Appendix.)
3 Metropolitan Water District of Southern California, Integrated Resource Plan for Metropolitan’s Colorado River Aqueduct PowerOperations, 1996, p.5.
4 QEI, Inc., 1992, Electricity Efficiency Through Water Efficiency, Report for the Southern California Edison Company, p. 2.
5 California Department of Water Resources, 1996, Management of the California State Water Project. Bulletin 132-96.
6 Carrie Anderson, 1999, “Energy Use in the Supply, Use and Disposal of Water in California”, Process Energy Group, EnergyEfficiency Division, California Energy Commission, p.1.
7 Third largest user of power in southern California residences based on a study for Southern California Edison by QEI, Inc., 1992,Electricity Efficiency Through Water Efficiency, Report for the Southern California Edison Company, pp. 23-24.
8 California Energy Commission, http://www.energy.ca.gov/reports/stats/table58.html (March 4, 1998)
9 California Department of Finance. California Statistical Abstract. Table P-2 “Resident Population July 1, 1996,” and Table P-23“Per Capita Energy Consumption, 1994.” December 17, 1997. ( http://www.dof.ca.gov/html/fs_data/stat-abs/toc.htm )
10 California Energy Commission, http://www.energy.ca.gov/reports/stats/table58.html (March 4, 1998).
11 California Energy Commission, http://www.energy.ca.gov/reports/stats/table41.html (March 4, 1998).
12 Willis, Doug. “‘Serious’ water need predicted by 2020.” Associated Press. Santa Barbara News-Press. January 31, 1998.
13 Metropolitan Water District of Southern California, 1999, Fact Sheet on Electric Industry Restructuring, 2/99 p. 2.
14 Burton, Franklin L., 1996, Water and Wastewater Industries: Characteristics and Energy Management Opportunities. (BurtonEngineering) Los Altos, CA, Report CR-106941, Electric Power Research Institute Report, p.ES-1.
15 Burton found that: “More than 60,000 water systems and 15,000 wastewater systems are now operating in the United States.These facilities are among the country’s largest energy consumers, requiring an estimated 75 billion kWh nationally, about 3% ofannual U.S. electricity use. Their electricity requirements will increase by 20% during the next 15 years as plants expand treatmentcapacity to meet population growth and as additional treatments are applied to meet the rigorous mandates of the Safe DrinkingWater Act and the Clean Water Act. Emerging non-regulatory issues, such as improvement in drinking water taste and color, areexpected to create additional energy needs.” Burton, Franklin L., 1996, Water and Wastewater Industries: Characteristics andEnergy Management Opportunities. (Burton Engineering) Los Altos, CA, Report CR-106941, Electric Power Research InstituteReport, introduction.
16 Conjunctive use of surface and groundwater, re-use of agricultural and urban water, inflow from Oregon, and other factors makeprecise accounting for water supplies a complicated task.
17 Kahrl, William L., et al. The California Water Atlas. California Department of Water Resources, 1979. p. 3.
18 California Department of Water Resources, 1994, California Water Plan Update, Bulletin 160-93.
19 California Legislative Analyst’s Office. “Colorado River Water: Challenges for California.” December 16, 1997.
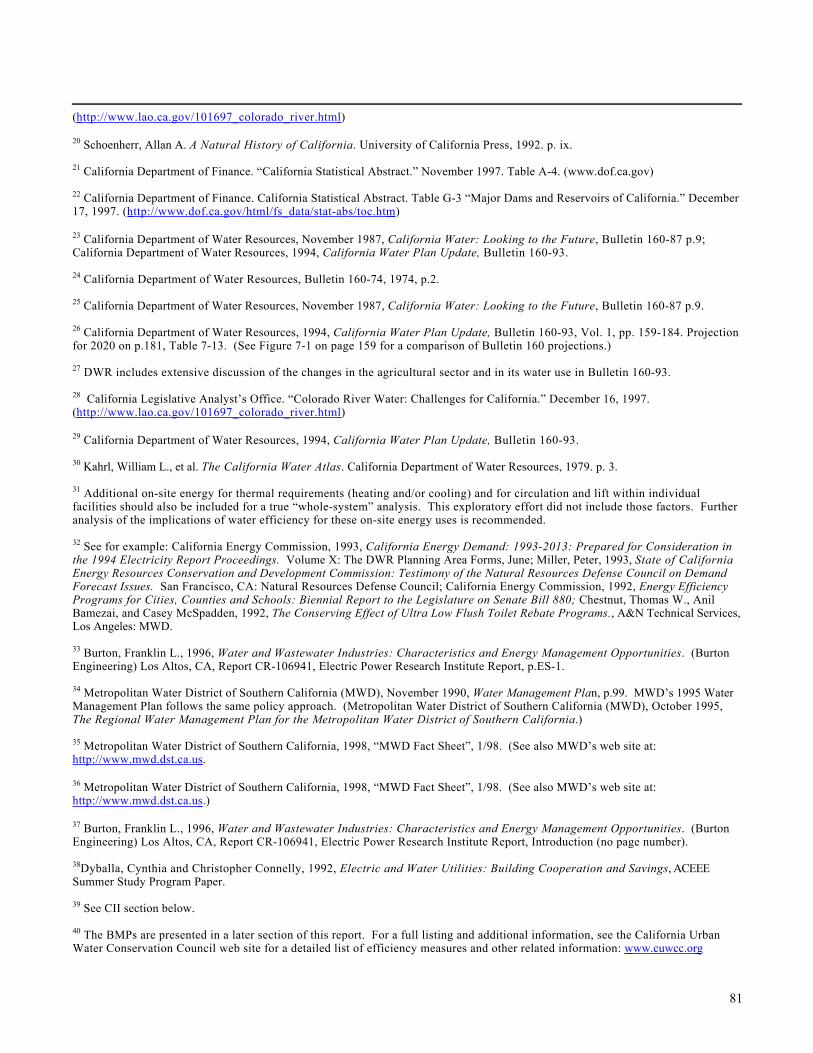
81
( http://www.lao.ca.gov/101697_colorado_river.html )
20 Schoenherr, Allan A. A Natural History of California. University of California Press, 1992. p. ix.
21 California Department of Finance. “California Statistical Abstract.” November 1997. Table A-4. (www.dof.ca.gov)
22 California Department of Finance. California Statistical Abstract. Table G-3 “Major Dams and Reservoirs of California.” December17, 1997. ( http://www.dof.ca.gov/html/fs_data/stat-abs/toc.htm )
23 California Department of Water Resources, November 1987, California Water: Looking to the Future, Bulletin 160-87 p.9;California Department of Water Resources, 1994, California Water Plan Update, Bulletin 160-93.
24 California Department of Water Resources, Bulletin 160-74, 1974, p.2.
25 California Department of Water Resources, November 1987, California Water: Looking to the Future, Bulletin 160-87 p.9.
26 California Department of Water Resources, 1994, California Water Plan Update, Bulletin 160-93, Vol. 1, pp. 159-184. Projectionfor 2020 on p.181, Table 7-13. (See Figure 7-1 on page 159 for a comparison of Bulletin 160 projections.)
27 DWR includes extensive discussion of the changes in the agricultural sector and in its water use in Bulletin 160-93.
28 California Legislative Analyst’s Office. “Colorado River Water: Challenges for California.” December 16, 1997.( http://www.lao.ca.gov/101697_colorado_river.html )
29 California Department of Water Resources, 1994, California Water Plan Update, Bulletin 160-93.
30 Kahrl, William L., et al. The California Water Atlas. California Department of Water Resources, 1979. p. 3.
31 Additional on-site energy for thermal requirements (heating and/or cooling) and for circulation and lift within individualfacilities should also be included for a true “whole-system” analysis. This exploratory effort did not include those factors. Furtheranalysis of the implications of water efficiency for these on-site energy uses is recommended.
32 See for example: California Energy Commission, 1993, California Energy Demand: 1993-2013: Prepared for Consideration inthe 1994 Electricity Report Proceedings. Volume X: The DWR Planning Area Forms, June; Miller, Peter, 1993, State of CaliforniaEnergy Resources Conservation and Development Commission: Testimony of the Natural Resources Defense Council on DemandForecast Issues. San Francisco, CA: Natural Resources Defense Council; California Energy Commission, 1992, Energy EfficiencyPrograms for Cities, Counties and Schools: Biennial Report to the Legislature on Senate Bill 880; Chestnut, Thomas W., AnilBamezai, and Casey McSpadden, 1992, The Conserving Effect of Ultra Low Flush Toilet Rebate Programs., A&N Technical Services,Los Angeles: MWD.
33 Burton, Franklin L., 1996, Water and Wastewater Industries: Characteristics and Energy Management Opportunities. (BurtonEngineering) Los Altos, CA, Report CR-106941, Electric Power Research Institute Report, p.ES-1.
34 Metropolitan Water District of Southern California (MWD), November 1990, Water Management Plan, p.99. MWD’s 1995 WaterManagement Plan follows the same policy approach. (Metropolitan Water District of Southern California (MWD), October 1995,The Regional Water Management Plan for the Metropolitan Water District of Southern California.)
35 Metropolitan Water District of Southern California, 1998, “MWD Fact Sheet”, 1/98. (See also MWD’s web site at:http://www.mwd.dst.ca.us .
36 Metropolitan Water District of Southern California, 1998, “MWD Fact Sheet”, 1/98. (See also MWD’s web site at:http://www.mwd.dst.ca.us .)
37 Burton, Franklin L., 1996, Water and Wastewater Industries: Characteristics and Energy Management Opportunities. (BurtonEngineering) Los Altos, CA, Report CR-106941, Electric Power Research Institute Report, Introduction (no page number).
38Dyballa, Cynthia and Christopher Connelly, 1992, Electric and Water Utilities: Building Cooperation and Savings, ACEEESummer Study Program Paper.
39 See CII section below.
40 The BMPs are presented in a later section of this report. For a full listing and additional information, see the California UrbanWater Conservation Council web site for a detailed list of efficiency measures and other related information: www.cuwcc.org
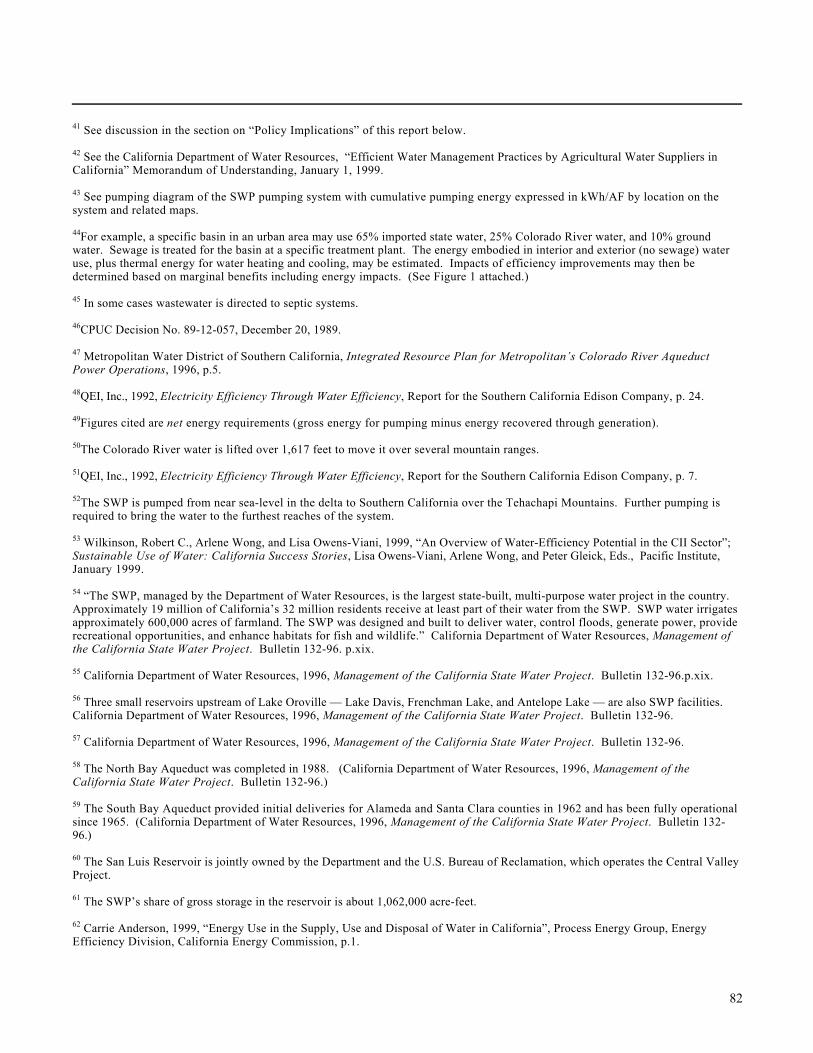
82
41 See discussion in the section on “Policy Implications” of this report below.
42 See the California Department of Water Resources, “Efficient Water Management Practices by Agricultural Water Suppliers inCalifornia” Memorandum of Understanding, January 1, 1999.
43 See pumping diagram of the SWP pumping system with cumulative pumping energy expressed in kWh/AF by location on thesystem and related maps.
44For example, a specific basin in an urban area may use 65% imported state water, 25% Colorado River water, and 10% groundwater. Sewage is treated for the basin at a specific treatment plant. The energy embodied in interior and exterior (no sewage) wateruse, plus thermal energy for water heating and cooling, may be estimated. Impacts of efficiency improvements may then bedetermined based on marginal benefits including energy impacts. (See Figure 1 attached.)
45 In some cases wastewater is directed to septic systems.
46CPUC Decision No. 89-12-057, December 20, 1989.
47 Metropolitan Water District of Southern California, Integrated Resource Plan for Metropolitan’s Colorado River AqueductPower Operations, 1996, p.5.
48QEI, Inc., 1992, Electricity Efficiency Through Water Efficiency, Report for the Southern California Edison Company, p. 24.
49Figures cited are net energy requirements (gross energy for pumping minus energy recovered through generation).
50The Colorado River water is lifted over 1,617 feet to move it over several mountain ranges.
51QEI, Inc., 1992, Electricity Efficiency Through Water Efficiency, Report for the Southern California Edison Company, p. 7.
52The SWP is pumped from near sea-level in the delta to Southern California over the Tehachapi Mountains. Further pumping isrequired to bring the water to the furthest reaches of the system.
53 Wilkinson, Robert C., Arlene Wong, and Lisa Owens-Viani, 1999, “An Overview of Water-Efficiency Potential in the CII Sector”;Sustainable Use of Water: California Success Stories, Lisa Owens-Viani, Arlene Wong, and Peter Gleick, Eds., Pacific Institute,January 1999.
54 “The SWP, managed by the Department of Water Resources, is the largest state-built, multi-purpose water project in the country.Approximately 19 million of California’s 32 million residents receive at least part of their water from the SWP. SWP water irrigatesapproximately 600,000 acres of farmland. The SWP was designed and built to deliver water, control floods, generate power, providerecreational opportunities, and enhance habitats for fish and wildlife.” California Department of Water Resources, Management ofthe California State Water Project. Bulletin 132-96. p.xix.
55 California Department of Water Resources, 1996, Management of the California State Water Project. Bulletin 132-96.p.xix.
56 Three small reservoirs upstream of Lake Oroville — Lake Davis, Frenchman Lake, and Antelope Lake — are also SWP facilities.California Department of Water Resources, 1996, Management of the California State Water Project. Bulletin 132-96.
57 California Department of Water Resources, 1996, Management of the California State Water Project. Bulletin 132-96.
58 The North Bay Aqueduct was completed in 1988. (California Department of Water Resources, 1996, Management of theCalifornia State Water Project. Bulletin 132-96.)
59 The South Bay Aqueduct provided initial deliveries for Alameda and Santa Clara counties in 1962 and has been fully operationalsince 1965. (California Department of Water Resources, 1996, Management of the California State Water Project. Bulletin 132-96.)
60 The San Luis Reservoir is jointly owned by the Department and the U.S. Bureau of Reclamation, which operates the Central ValleyProject.
61 The SWP’s share of gross storage in the reservoir is about 1,062,000 acre-feet.
62 Carrie Anderson, 1999, “Energy Use in the Supply, Use and Disposal of Water in California”, Process Energy Group, EnergyEfficiency Division, California Energy Commission, p.1.
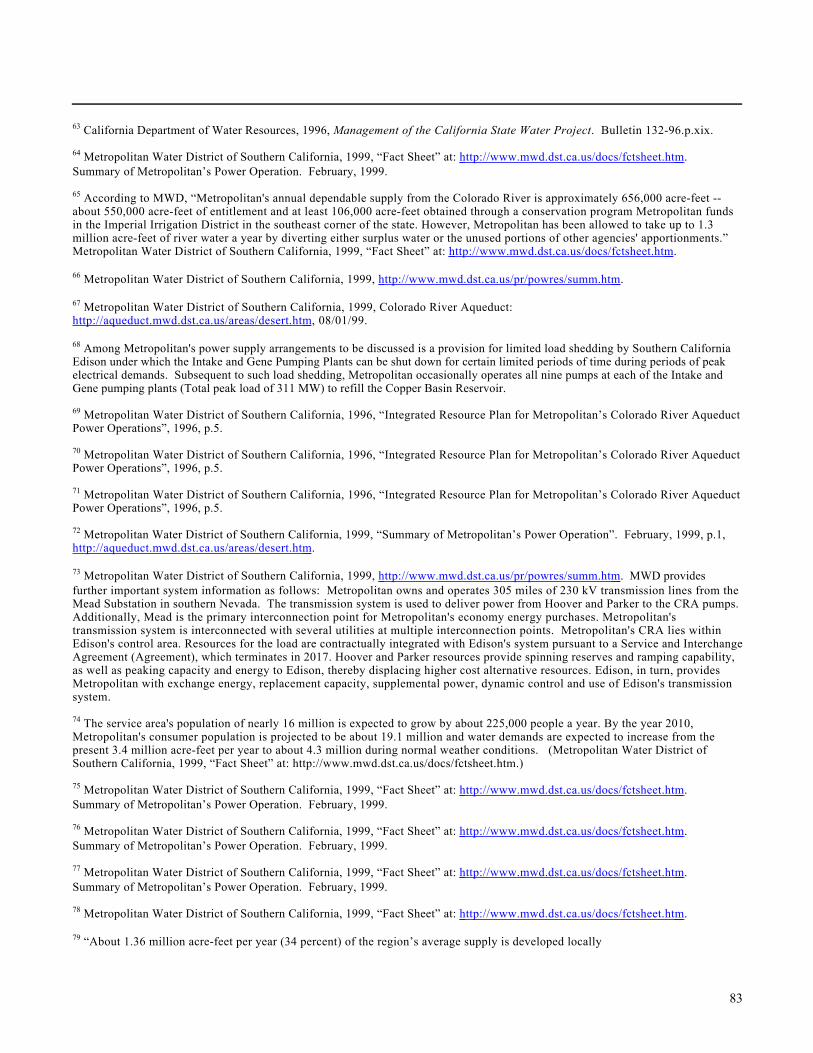
83
63 California Department of Water Resources, 1996, Management of the California State Water Project. Bulletin 132-96.p.xix.
64 Metropolitan Water District of Southern California, 1999, “Fact Sheet” at: http://www.mwd.dst.ca.us/docs/fctsheet.htm .Summary of Metropolitan’s Power Operation. February, 1999.
65 According to MWD, “Metropolitan's annual dependable supply from the Colorado River is approximately 656,000 acre-feet --about 550,000 acre-feet of entitlement and at least 106,000 acre-feet obtained through a conservation program Metropolitan fundsin the Imperial Irrigation District in the southeast corner of the state. However, Metropolitan has been allowed to take up to 1.3million acre-feet of river water a year by diverting either surplus water or the unused portions of other agencies' apportionments.”Metropolitan Water District of Southern California, 1999, “Fact Sheet” at: http://www.mwd.dst.ca.us/docs/fctsheet.htm .
66 Metropolitan Water District of Southern California, 1999, http://www.mwd.dst.ca.us/pr/powres/summ.htm .
67 Metropolitan Water District of Southern California, 1999, Colorado River Aqueduct:http://aqueduct.mwd.dst.ca.us/areas/desert.htm , 08/01/99.
68 Among Metropolitan's power supply arrangements to be discussed is a provision for limited load shedding by Southern CaliforniaEdison under which the Intake and Gene Pumping Plants can be shut down for certain limited periods of time during periods of peakelectrical demands. Subsequent to such load shedding, Metropolitan occasionally operates all nine pumps at each of the Intake andGene pumping plants (Total peak load of 311 MW) to refill the Copper Basin Reservoir.
69 Metropolitan Water District of Southern California, 1996, “Integrated Resource Plan for Metropolitan’s Colorado River AqueductPower Operations”, 1996, p.5.
70 Metropolitan Water District of Southern California, 1996, “Integrated Resource Plan for Metropolitan’s Colorado River AqueductPower Operations”, 1996, p.5.
71 Metropolitan Water District of Southern California, 1996, “Integrated Resource Plan for Metropolitan’s Colorado River AqueductPower Operations”, 1996, p.5.
72 Metropolitan Water District of Southern California, 1999, “Summary of Metropolitan’s Power Operation”. February, 1999, p.1,http://aqueduct.mwd.dst.ca.us/areas/desert.htm .
73 Metropolitan Water District of Southern California, 1999, http://www.mwd.dst.ca.us/pr/powres/summ.htm . MWD providesfurther important system information as follows: Metropolitan owns and operates 305 miles of 230 kV transmission lines from theMead Substation in southern Nevada. The transmission system is used to deliver power from Hoover and Parker to the CRA pumps.Additionally, Mead is the primary interconnection point for Metropolitan's economy energy purchases. Metropolitan'stransmission system is interconnected with several utilities at multiple interconnection points. Metropolitan's CRA lies withinEdison's control area. Resources for the load are contractually integrated with Edison's system pursuant to a Service and InterchangeAgreement (Agreement), which terminates in 2017. Hoover and Parker resources provide spinning reserves and ramping capability,as well as peaking capacity and energy to Edison, thereby displacing higher cost alternative resources. Edison, in turn, providesMetropolitan with exchange energy, replacement capacity, supplemental power, dynamic control and use of Edison's transmissionsystem.
74 The service area's population of nearly 16 million is expected to grow by about 225,000 people a year. By the year 2010,Metropolitan's consumer population is projected to be about 19.1 million and water demands are expected to increase from thepresent 3.4 million acre-feet per year to about 4.3 million during normal weather conditions. (Metropolitan Water District ofSouthern California, 1999, “Fact Sheet” at: http://www.mwd.dst.ca.us/docs/fctsheet.htm.)
75 Metropolitan Water District of Southern California, 1999, “Fact Sheet” at: http://www.mwd.dst.ca.us/docs/fctsheet.htm .Summary of Metropolitan’s Power Operation. February, 1999.
76 Metropolitan Water District of Southern California, 1999, “Fact Sheet” at: http://www.mwd.dst.ca.us/docs/fctsheet.htm .Summary of Metropolitan’s Power Operation. February, 1999.
77 Metropolitan Water District of Southern California, 1999, “Fact Sheet” at: http://www.mwd.dst.ca.us/docs/fctsheet.htm .Summary of Metropolitan’s Power Operation. February, 1999.
78 Metropolitan Water District of Southern California, 1999, “Fact Sheet” at: http://www.mwd.dst.ca.us/docs/fctsheet.htm .
79 “About 1.36 million acre-feet per year (34 percent) of the region’s average supply is developed locally
84
using groundwater basins and surface reservoirs and diversions to capture natural runoff.” Metropolitan Water District of SouthernCalifornia, 1996, “Integrated Resource Plan for Metropolitan’s Colorado River Aqueduct Power Operations”, 1996, Vol.1, p.1-2.
80 See discussion of applicable regulations in the appendix.
81 Burton, Franklin L., 1996, Water and Wastewater Industries: Characteristics and Energy Management Opportunities. (BurtonEngineering) Los Altos, CA, Report CR-106941, Electric Power Research Institute Report, p.ES-4.
82 Burton, Franklin L., 1996, Water and Wastewater Industries: Characteristics and Energy Management Opportunities. (BurtonEngineering) Los Altos, CA, Report CR-106941, Electric Power Research Institute Report, p.3-5.
83 Approximately 71 percent of the U.S. population (or 176 million people) is served currently by publicly owned treatment works(POTWs). The municipal wastewater treatment industry is composed of over 15,000 plants that handle a total flow of about 28,000million gallons per day (mgd), according to the 1988 Needs Assessment Survey conducted by EPA. In the next 20 to 30 years, theU.S. Environmental Protection Agency (EPA) has estimated that nearly 87 percent of the U.S. population, or 247 million people, willbe served by POTWs. Burton, Franklin L., 1996, Water and Wastewater Industries: Characteristics and Energy ManagementOpportunities. (Burton Engineering) Los Altos, CA, Report CR-106941, Electric Power Research Institute Report, p.ES-2.
84 Wastewater systems generally consist of three principal components: collection system (sewers and pumping stations), treatmentfacilities (including sludge – now termed “biosolids” – processing), and effluent disposal or reuse. Burton, Franklin L., 1996,Water and Wastewater Industries: Characteristics and Energy Management Opportunities. (Burton Engineering) Los Altos, CA,Report CR-106941, Electric Power Research Institute Report.
85 “In the last five years, the use of UV light as a means of disinfecting wastewater treatment plant effluent has increasedsignificantly. Its use has increases because of (1) the increased awareness o f the impact of chlorine and chlorinated compounds onthe environment, (2) improvements in UV hardware, (3) regulations requiring reductions in chlorine residual in plant effluent, (4)regulations governing the storage and handling of chlorine, especially in its gaseous form, and (5) safety and operating concerns inthe use and handling of chlorine and dechlorinating agents.” Burton, Franklin L., 1996, Water and Wastewater Industries:Characteristics and Energy Management Opportunities. (Burton Engineering) Los Altos, CA, Report CR-106941, Electric PowerResearch Institute Report, p.2-32.
86 Burton, Franklin L., 1996, Water and Wastewater Industries: Characteristics and Energy Management Opportunities. (BurtonEngineering) Los Altos, CA, Report CR-106941, Electric Power Research Institute Report, p.ES-2.
87 “Most of the pipelines in a collection system handling sanitary wastewater are gravity sewers. At certain locations, typicallywhen the sewers reach depths of 20 to 30 ft below ground, it generally becomes cost-effective to lift (pump) the wastewater to ahigher elevation.”Burton, Franklin L., 1996, Water and Wastewater Industries: Characteristics and Energy Management Opportunities. (BurtonEngineering) Los Altos, CA, Report CR-106941, Electric Power Research Institute Report, p.2-5.
88 Burton, Franklin L., 1996, Water and Wastewater Industries: Characteristics and Energy Management Opportunities. (BurtonEngineering) Los Altos, CA, Report CR-106941, Electric Power Research Institute Report, p.2-5.
89 Burton, Franklin L., 1996, Water and Wastewater Industries: Characteristics and Energy Management Opportunities. (BurtonEngineering) Los Altos, CA, Report CR-106941, Electric Power Research Institute Report, pp.2-5-2-6.
90 Burton, Franklin L., 1996, Water and Wastewater Industries: Characteristics and Energy Management Opportunities. (BurtonEngineering) Los Altos, CA, Report CR-106941, Electric Power Research Institute Report, p.2-6.
91 MWD estimates that reclaimed water will ultimately produce 190,000 acre-feet of water annually. Metropolitan Water District ofSouthern California, 1999, “Fact Sheet” at: http://www.mwd.dst.ca.us/docs/fctsheet.htm .
92 Curt Gollrad, Ionics Corporation, (Contact: 617-926-2510 x556)
93 Metropolitan Water District of Southern California, 1999, “Fact Sheet” at: http://www.mwd.dst.ca.us/docs/fctsheet.htm .
94 A & N Technical Services, 1995, “What is the Reliable Yield from Residential Home Water Survey Programs: The Experience ofLADWP” (AWWA Conference Proceedings, 1995), A & N Technical Services, Inc.(Cited as a reference in: Memorandum ofUnderstanding Regarding Urban Water Conservation in California, (as amended September, 1991; February, 1993; March 9, 1994;September 30, 1997; and April 8, 1998), Exhibit 1, p.15. California Urban Water Conservation Council, 455 Capitol Mall, Suite705, Sacramento, CA 95814-4406. The full MOU and related documents are available at: www.cuwcc.org.
85
95 See for example: Amy Vickers, 1991, “The Emerging Demand-Side Era in Water Management,” Journal of the American WaterWorks Association, vol. 83, no. 10; Amy Vickers, 1993, “The National Energy Policy Act: Assessing Its Impacts on Utilities,”Journal of the American Water Works Association, vol. 85, no. 8; Maddaus, William O., 1987, Water Conservation, American WaterWorks Association; Chestnut, Thomas W., Anil Bamezai, and Casey McSpadden, 1992, The Conserving Effect of Ultra Low FlushToilet Rebate Programs., A&N Technical Services, Los Angeles: MWD; Wilkinson, Robert C., 1991, California BMP Assessment:Analysis of Methodology and Assumptions for Assessing Water Savings Potential Resulting from Specific “Best ManagementPractices”, Rocky Mountain Institute; Chapin, S.W., 1994, “Water-Efficient Landscaping: A Guide for Utilities and CommunityPlanners,” Water Efficiency Implementation Report #6, Rocky Mountain Institute; and many other excellent references.
96 See: Lisa Owens-Viani, Arlene Wong, and Peter Gleick, Eds., Sustainable Use of Water: California Success Stories, PacificInstitute, January 1999.
97 This section draws from several studies by Wilkinson and co-authors as follows: Wilkinson, Robert C., Arlene Wong, and LisaOwens-Viani, 1999, “An Overview of Water-Efficiency Potential in the CII Sector”; Wilkinson, Robert C. and Arlene Wong, 1999,“Assessing Commercial, Industrial, and Institutional Water Efficiency Potential: The MWD Audit Program”; Wilkinson, Robert C.,1999, “Increasing Institutional Water-Use Efficiencies: University of California, Santa Barbara Program”, Lisa Owens-Viani, ArleneWong, and Peter Gleick, Eds., Sustainable Use of Water: California Success Stories, Pacific Institute, January 1999.
97. There are various definitions of commercial and other categories of M&I water use. One of the most comprehensive lists andperhaps the best basis available for categorization of commercial uses is found in Pike, C.W., 1997, “Study of Potential WaterEfficiency Improvements in Commercial Businesses”, Final Report, U.S. Environmental Protection Agency / California Departmentof Water Resources, April, Table 1, pp.2-5. The USGS lists water uses according to a categorization scheme. A study by MWD andERI Services disaggregates the CII categories slightly differently for an extensive analysis of the sectors in Southern California.See Sweeten, Jon, and Ben Chaput, “Identifying the Conservation Opportunities in the Commercial, Industrial, and InstitutionalSector”, paper delivered to AWWA, June 1997.
99 Pike, Charles W., 1994. “Water Efficiency Guide for Business Managers and Facility Engineers,” California Department of WaterResources, October; Pike, Charles W., 1997, “Study of Potential Water Efficiency Improvements in Commercial Businesses”, FinalReport, U.S. Environmental Protection Agency / California Department of Water Resources, April.
100 The goal of the program was to identify the water efficiency potential that can be achieved in the CII sector within MWD’s servicearea using cost-effective measures and to provide users with the practical information necessary to take advantage of identifiedopportunities.
101 See: Wilkinson, Robert C. and Arlene Wong, “Assessing Commercial, Industrial, and Institutional Water Efficiency Potential:The MWD Audit Program”; Sustainable Use of Water: California Success Stories, Lisa Owens-Viani, Arlene Wong, and PeterGleick, Eds., Pacific Institute, January 1999.
102 Audits were conducted by Metropolitan Water District (which provided a majority of the data), City of Tucson, Arizona, and theMassachusetts Water Resources Authority. See: Pike, Charles W., 1997, “Study of Potential Water Efficiency Improvements inCommercial Businesses”, Final Report, U.S. Environmental Protection Agency / California Department of Water Resources, April.
103 The CII sector in MWD’s service area includes approximately 35,000 industrial customers and 350,000 commercial customers.
104 Sweeten, Jon, and Ben Chaput, “Identifying the Conservation Opportunities in the Commercial, Industrial, and InstitutionalSector”, paper delivered to AWWA, 1997, p.8.
105 Pike, Charles W. 1994. “Water Efficiency Guide for Business Managers and Facility Engineers,” California Department of WaterResources, October.
106 The survey work identified cost-effective water savings potential of 29 percent for all facilities studied, 23 percent when twowastewater treatment plants were excluded as outliers. Potential savings were higher than expected. The large sample size has alsoallowed for valuable analysis of water-savings potential by industry or commercial sector and by conservation measure. A follow-up survey of 605 customers (representing 69 percent of total surveyed water use) found that water savings from efficiencyimprovements implemented after the audits are 3,080 mgal over the lifetime of the measures installed, which is 26 percent of thepotential lifetime water savings identified. See: Hagler Bailly Services, Inc. 1997. “Evaluation of the MWD CII Survey Database.”Prepared for Metropolitan Water district of Southern California. San Francisco, CA.
107 Pike, Charles W., 1997, “Study of Potential Water Efficiency Improvements in Commercial Businesses”, Final Report, U.S.Environmental Protection Agency / California Department of Water Resources, April, statement of conclusion and range of 0-50%from p. 28, range of 20-25.6% from p.11.
86
108 The 20% figure is from Sweeten, Jon, and Ben Chaput, “Identifying the Conservation Opportunities in the Commercial,Industrial, and Institutional Sector”, paper delivered to AWWA, 1997, p.1.
109 ERI Services, Inc. 1997. “Commercial, Industrial and Institutional Water conservation Program, 1991-1996.” Prepared forMetropolitan Water District of Southern California. Irvine, CA.
110 For a variety of case studies see: Wilkinson, Robert C. and Arlene Wong, “Assessing Commercial, Industrial, and InstitutionalWater Efficiency Potential: The MWD Audit Program”; Wilkinson, Robert C., Arlene Wong, and Lisa Owens-Viani, 1999, “AnOverview of Water-Efficiency Potential in the CII Sector”; and: Wilkinson, Robert C. and Arlene Wong, 1999, “AssessingCommercial, Industrial, and Institutional Water Efficiency Potential” in: Sustainable Use of Water: California Success Stories,Lisa Owens-Viani, Arlene Wong, and Peter Gleick, Eds., Pacific Institute, January 1999.
111 Maddaus, William O., 1987, Water Conservation, American Water Works Association, p.59.
112 Maddaus, William O., 1987, Water Conservation, American Water Works Association, p.59, citing DWR, A Pilot ConservationBill, Bulletin #191, and Brown and Caldwell, June 1979, Review of Water Conservation in the City of Los Angeles.
113 EBMUD, October 1990, "Industrial Water Conservation," p.1.
114 Brown and Caldwell, 1990, Case Studies of Industrial Water Conservation in the San Jose Area, p.38.
115 Ron Munds, Water Conservation Coordinator, City of San Luis Obispo, personal communication 1/3/91.
116 Wilkinson, Robert C., 1999, “Increasing Institutional Water-Use Efficiencies: University of California, Santa Barbara Program”,Sustainable Use of Water: California Success Stories, Lisa Owens-Viani, Arlene Wong, and Peter Gleick, Eds., Pacific Institute,January 1999.
117 Burton, Franklin L., 1996, Water and Wastewater Industries: Characteristics and Energy Management Opportunities. (BurtonEngineering) Los Altos, CA, Report CR-106941, Electric Power Research Institute Report, p.ES-8.
118 Burton, Franklin L., 1996, Water and Wastewater Industries: Characteristics and Energy Management Opportunities. (BurtonEngineering) Los Altos, CA, Report CR-106941, Electric Power Research Institute Report, p.1-1.
119 Burton, Franklin L., 1996, Water and Wastewater Industries: Characteristics and Energy Management Opportunities. (BurtonEngineering) Los Altos, CA, Report CR-106941, Electric Power Research Institute Report, p.ES-6.
120 Energy Policy Act of 1992. The Energy Policy Act sets minimum performance standards for plumbing fixtures as established bythe American Society of Mechanical Engineers (ASME), the American National Standards Institute (ANSI). Applicable standardsinclude A116.19.2 and A116.19.6.
121 Where available, the water savings level is identified in Section F of each of the 14 BMPs. See: Memorandum of UnderstandingRegarding Urban Water Conservation in California, as amended September, 1991; February, 1993; March 9, 1994; September 30,1997; and April 8, 1998; California Urban Water Conservation Council, 455 Capitol Mall, Suite 705, Sacramento, CA 95814-4406.The full MOU and related documents are available at: www.cuwcc.org.
122 Memorandum of Understanding Regarding Urban Water Conservation in California, (as amended September, 1991; February,1993; March 9, 1994; September 30, 1997; and April 8, 1998), Section 2.1 (2), p.6. California Urban Water Conservation Council,455 Capitol Mall, Suite 705, Sacramento, CA 95814-4406. The full MOU and related documents are available at: www.cuwcc.org.
123 A similar process was envisioned for the agricultural sector in California, but the process was much slower and resulted in an“Agricultural Water Management Council” which did not even meet until July 16 of 1997. (DWR, Water Conservation News, July1997, p.3. At that time there were 60 signatories to the Agricultural MOU, with only three from the environmental community.Some agricultural interests have long denied the possibility of any improvement in water use efficiency in the agricultural sector,making reasonable discussions of improvement difficult. The effort has not been notably successful in furthering what manybelieve to be vast potential for cost-effective efficiency improvements in the sector.
124 Memorandum of Understanding Regarding Urban Water Conservation in California, (as amended September, 1991; February,1993; March 9, 1994; September 30, 1997; and April 8, 1998), p.5. California Urban Water Conservation Council, 455 CapitolMall, Suite 705, Sacramento, CA 95814-4406. The full MOU and related documents are available at: www.cuwcc.org.
125 As noted on page 7 of the MOU, “In 1997, the Council substantially revised the BMP list, definitions, and schedules containedin Exhibit 1. These revisions were adopted by the Council September 30, 1997.” Memorandum of Understanding Regarding UrbanWater Conservation in California, (as amended September, 1991; February, 1993; March 9, 1994; September 30, 1997; and April 8,

87
1998), p.5. California Urban Water Conservation Council, 455 Capitol Mall, Suite 705, Sacramento, CA 95814-4406. The full MOUand related documents are available at: www.cuwcc.org.
126 The CUWCC is a non-profit organization with 501(c)(3) tax status.
127 CUWCC, personal communication 12/3/99.
128 For the state constitutional requirement and related case law see California Constitution, Article X, Section 2,; the "Audubon"case (National Audubon Society v. Superior Court of Alpine County, 1983); (Imperial Irrigation District v. State Water ResourcesControl Board, 1986); and "Raconelli", consolidation of eight cases, (United States v. State Water Resources Control Board,1986).
129 State Water Resources Control Board (SWRCB), October 1988, Water Quality Control Plan For Salinity - San FranciscoBay/Sacramento-San Joaquin Delta Sanctuary (draft).
130 See for example: Brown and Caldwell, "Assessment of Water Conservation Potential in Metropolitan's Service Area: PreliminaryReport" which was undertaken in direct response (pp.1-1, 1-2) to estimates made by SWRCB's staff of water efficiency potential inCalifornia.
131 Memorandum of Understanding Regarding Urban Water Conservation in California, (as amended September, 1991; February,1993; March 9, 1994; September 30, 1997; and April 8, 1998), Section 5.1, p.9. California Urban Water Conservation Council, 455Capitol Mall, Suite 705, Sacramento, CA 95814-4406. The full MOU and related documents are available at: www.cuwcc.org.
132 California Department of Water Resources, Water Conservation News, October 1989, p.3.
133 Ed Thornhill, Conservation Manager, MWD, quoted in the same issue of DWR, Water Conservation News, October 1989, p.3.
134 DWR and MWD quoted in, Water Conservation News, December 1990, pp.1-2.
135 DWR and MWD quoted in, Water Conservation News, December 1990, pp.1-2.
136 The initial time frame stipulated in the MOU runs from 1991 to 2001.
137 Memorandum of Understanding Regarding Urban Water Conservation in California, (as amended September, 1991; February,1993; March 9, 1994; September 30, 1997; and April 8, 1998), Section 5.2, p.9. California Urban Water Conservation Council, 455Capitol Mall, Suite 705, Sacramento, CA 95814-4406. The full MOU and related documents are available at: www.cuwcc.org .
138 A comprehensive assessment of the technical aspects and efficiency potential of the BMPs was undertaken by Wilkinson as aneutral third party under contract to the Metropolitan Water District in 1989 and 1990 as the MOU was being negotiated. Theanalysis focused in detail on the water-saving potential for the proposed BMP measures, and it included a review of practices andcurrent information in each technical area. In general, it found that the BMPs were conservative relative to more effective programsalready in place and running at various locations around the state. It also found that the assumptions regarding the levels of waterefficiency improvements were significantly understated. See: Wilkinson, Robert C., 1991, California BMP Assessment: Analysis ofMethodology and Assumptions for Assessing Water Savings Potential Resulting from Specific “Best Management Practices”,Rocky Mountain Institute, Snowmass, CO 81654-9199.
139 Memorandum of Understanding Regarding Urban Water Conservation in California, (as amended September, 1991; February,1993; March 9, 1994; September 30, 1997; and April 8, 1998), “Recitals, A”, p.4. California Urban Water Conservation Council,455 Capitol Mall, Suite 705, Sacramento, CA 95814-4406. The full MOU and related documents are available at: www.cuwcc.org.
140 Mitchell, David L. and Wendy Illingworth, California Urban Water Agencies BMP Performance Evaluation, Final Report, M.Cubed, July 1997, p.1.
141 Memorandum of Understanding Regarding Urban Water Conservation in California, (as amended September, 1991; February,1993; March 9, 1994; September 30, 1997; and April 8, 1998), p.5. California Urban Water Conservation Council, 455 CapitolMall, Suite 705, Sacramento, CA 95814-4406. The full MOU and related documents are available at: www.cuwcc.org.
142 Memorandum of Understanding Regarding Urban Water Conservation in California, (as amended September, 1991; February,1993; March 9, 1994; September 30, 1997; and April 8, 1998), Section 4.4, p.8. California Urban Water Conservation Council, 455Capitol Mall, Suite 705, Sacramento, CA 95814-4406. The full MOU and related documents are available at: www.cuwcc.org .
88
143 Memorandum of Understanding Regarding Urban Water Conservation in California, (as amended September, 1991; February,1993; March 9, 1994; September 30, 1997; and April 8, 1998), Section 4.5, p.8. California Urban Water Conservation Council, 455Capitol Mall, Suite 705, Sacramento, CA 95814-4406. The full MOU and related documents are available at: www.cuwcc.org .
144 The “CalFed” Bay-Delta Program was established in May of 1995 as part of a “Framework Agreement” signed in June 1994 byGovernor Wilson and Secretary of the Interior Babbitt.
145 California Urban Water Conservation Council, Best Management Practices Summary Report, 1995-1996, for fiscal 1995-96,October 8, 1997, pp.3-4.
146 California Urban Water Conservation Council, Best Management Practices Summary Report, 1995-1996, for fiscal 1995-96,October 8, 1997, pp.5-20.
147 California Urban Water Conservation Council, Best Management Practices Summary Report, 1995-1996, for fiscal 1995-96,October 8, 1997, p.3.
148 See for example: QEI, Inc., 1992, Electricity Efficiency Through Water Efficiency, Report prepared for the Southern CaliforniaEdison Company; Barakat & Chamberlin, Inc., 1992, A Framework for Sharing the Costs of an Ultra-Low-Flush Toilet RetrofitProgram, Final Report to Metropolitan Water District of Southern California, October 5, 1992.
149 Memorandum of Understanding Regarding Efficient Water Management Practices by Agricultural Water Suppliers in California,January 1, 1999, (pursuant to the) Agricultural Water Suppliers Efficient Water Management Practices Act of 1990 (AB 3616).
150 Memorandum of Understanding Regarding Efficient Water Management Practices by Agricultural Water Suppliers in California,January 1, 1999, (pursuant to the) Agricultural Water Suppliers Efficient Water Management Practices Act of 1990 (AB 3616),Exhibit A, List A, item 6, p.A-2.
151 Memorandum of Understanding Regarding Efficient Water Management Practices by Agricultural Water Suppliers in California,January 1, 1999, (pursuant to the) Agricultural Water Suppliers Efficient Water Management Practices Act of 1990 (AB 3616),Exhibit A, List A, item 6, p.A-2.
152 Wodraska, John R., 1994, Memorandum to the Board of Directors from the General Manager, April 20, 1994, regarding “Updateon the Southern California Water and Energy Partnership”.
153 Wodraska, John R., 1994, Update Memo to the MWD Board of Directors on the Southern California Water and EnergyPartnership, April 20, 1994. The partnership included the Metropolitan Water District of Southern California, the Los AngelesDepartment of Water and Power, the Southern California Gas Company, Southern California Edison, the sanitation districts ofOrange County, the cities of Anaheim, Burbank, Glendale, Pasadena, Santa Monica, and the Central Basin Municipal Water District,the Municipal Water District of Orange County, and West Basin Municipal Water District.
154 Barakat & Chamberlin, Inc., 1992, A Framework for Sharing the Costs of an Ultra-Low-Flush Toilet Retrofit Program, FinalReport to Metropolitan Water District of Southern California, October 5, 1992, p. 3.
155 Southern California Water and Energy Partnership minutes, Executive board meeting, March 6, 1993.
156 The audit program went through several changes in its five-year life as adjustments were made to streamline procedures andbetter respond to agency and customer needs. In the 18-month pilot phase, fifteen sites received full water-efficiency studiesconducted by a senior engineer. These initial studies targeted high-volume water users, with lower-volume users filtered out toensure cost-efficiency, and the average survey cost was $6,500. Reports to the customer reviewed the primary water uses at the siteand recommend specific measures that would reduce water use. Only those measures that had a short simple payback period withinthe customer’s stated tolerance would be recommended (usually 5 years or less). To provide a complete picture of expected savings,water, sewer, and the water-related energy and chemical costs savings were factored into the payback analysis.
157 Wilson, E. 1998. City of San Jose. Personal communications. (See Wilkinson, Robert C., Arlene Wong, and Lisa Owens-Viani,1999, “An Overview of Water-Efficiency Potential in the CII Sector” in: Sustainable Use of Water: California Success Stories, LisaOwens-Viani, Arlene Wong, and Peter Gleick, Eds., Pacific Institute, January 1999.)
158 Tovar, M. 1998. City of San Jose. Personal communications. (See Wilkinson, Robert C., Arlene Wong, and Lisa Owens-Viani,1999, “An Overview of Water-Efficiency Potential in the CII Sector” in: Sustainable Use of Water: California Success Stories, LisaOwens-Viani, Arlene Wong, and Peter Gleick, Eds., Pacific Institute, January 1999.)
159 Zamost, B. 1993. “Offer Water Audits for Business and Industry,” Building Sustainable Communities Water Efficiency Series,The Global Cities Project, San Francisco, CA.
89
160 Waik, V. 1998. City of Palo Alto. Personal communications, in: Wilkinson, Robert C., Arlene Wong, and Lisa Owens-Viani, 1999,“An Overview of Water-Efficiency Potential in the CII Sector”, Sustainable Use of Water: California Success Stories, Lisa Owens-Viani, Arlene Wong, and Peter Gleick, Eds., Pacific Institute, January 1999.
161 The Contra Costa Water District (CCWD) is both a water wholesaler and retailer to over 400,000 users.
162 Ray Cardwell comments that one of the biggest challenges in implementing these programs is convincing corporate decision-makers of their value, since the cost of water is not usually a huge motivating factor. (Cardwell, Ray. 1998. Contra Costa WaterDistrict, Martinez, CA. Personal communications: Personal communications, in: Wilkinson, Robert C., Arlene Wong, and LisaOwens-Viani, 1999, “An Overview of Water-Efficiency Potential in the CII Sector”, Sustainable Use of Water: California SuccessStories, Lisa Owens-Viani, Arlene Wong, and Peter Gleick, Eds., Pacific Institute, January 1999.)
163 Cardwell, Ray. 1998. Contra Costa Water District, Martinez, CA. Personal communications: Personal communications, in:Wilkinson, Robert C., Arlene Wong, and Lisa Owens-Viani, 1999, “An Overview of Water-Efficiency Potential in the CII Sector”,Sustainable Use of Water: California Success Stories, Lisa Owens-Viani, Arlene Wong, and Peter Gleick, Eds., Pacific Institute,January 1999.
164 Burton, Franklin L., 1996, Water and Wastewater Industries: Characteristics and Energy Management Opportunities. (BurtonEngineering) Los Altos, CA, Report CR-106941, Electric Power Research Institute Report, p.2-13-18.