Embed Size (px)
Citation preview
© The Council for Adult and Experiential Learning 2017
Methodology
for Collecting
Actionable
Labor Market
Information
p1 © The Council for Adult and Experiential Learning 2017
Table of Contents Understanding Labor Market Intelligence .................................................................................................... 3
What is the need? ..................................................................................................................................... 3
Identifying the Ingredients for Success ..................................................................................................... 3
Step 1: Defining the Scope ............................................................................................................................ 5
1.1 Determining Project Parameters ........................................................................................................ 5
Step 2: Gathering Quantitative Labor Market Intelligence .......................................................................... 6
2.1 Identifying an LMI Aggregator ............................................................................................................ 6
2.2 Applying Parameters ........................................................................................................................... 6
2.3 Gathering Data .................................................................................................................................... 6
Traditional Labor Market Data .............................................................................................................. 6
Real-Time Labor Market Data ............................................................................................................... 6
Step 3: Gathering Custom Qualitative Labor Market Intelligence ................................................................ 8
3.1 Applying Parameters ........................................................................................................................... 8
Short Term ............................................................................................................................................ 8
Medium Term ....................................................................................................................................... 8
Long Term ............................................................................................................................................. 8
3.2 Performing Background Research....................................................................................................... 9
3.3 Identifying Stakeholders ..................................................................................................................... 9
3.3 Gathering Data .................................................................................................................................. 10
Method 1: Focus Groups ..................................................................................................................... 10
Method 2: Surveys .............................................................................................................................. 10
Method 3: Interviews .......................................................................................................................... 10
Step 4: Collecting and Using Labor Market Intelligence Data .................................................................... 12
4.1 Designing and Implementing Custom Data Storage Procedures ...................................................... 12
4.2 Application and Uses ......................................................................................................................... 12
4.3 Data Update Protocol ....................................................................................................................... 12
Repeat Steps 1-4 Regularly ................................................................................................................. 12
Conclusion ................................................................................................................................................... 13
Appendices .................................................................................................................................................. 14
Appendix A: Protocol for Gathering and Updating Quantitative Labor Market Data ............................ 14
Examples of Quantitative Labor Market Intelligence Sources ............................................................ 16
Example of Quantitative Labor Market Intelligence Analyses ............................................................ 17
p2 © The Council for Adult and Experiential Learning 2017
Table 1: Iowa Occupations with an Annual Salary under $03,000 with the Greatest Decline between
2010 and 2015 .................................................................................................................................... 17
Table 2: Iowa Occupations with an Annual Salary over $30,000 with the Greatest Growth between
2010 and 2015 .................................................................................................................................... 18
Table 3: Burning Glass Jobs Insight Data on Skills and Minimum Education Requirements for Home
Health Aides and Health Diagnosing and Treating Practitioners, All Other, 2015. ............................ 19
Appendix B: Protocol for Gathering and Updating Qualitative Labor Market Data ............................... 20
Protocols ............................................................................................................................................. 20
Sample Employer Focus Group Emails ................................................................................................ 21
Sample Employer Focus Group Agenda .............................................................................................. 23
Sample Employer Focus Group Questions .......................................................................................... 24
Appendix C: Survey Protocol ................................................................................................................... 26
Appendix D: Protocol for Data Repository .............................................................................................. 28
p3 © The Council for Adult and Experiential Learning 2017
Understanding Labor Market Intelligence
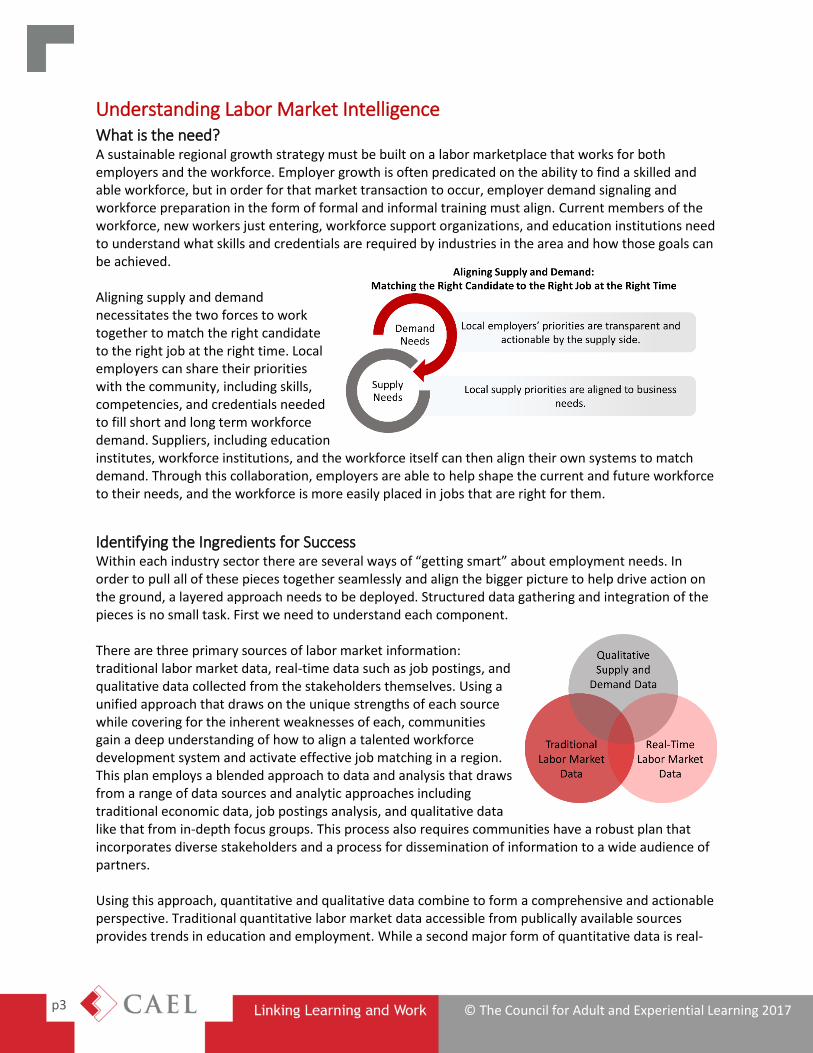
What is the need? A sustainable regional growth strategy must be built on a labor marketplace that works for both employers and the workforce. Employer growth is often predicated on the ability to find a skilled and able workforce, but in order for that market transaction to occur, employer demand signaling and workforce preparation in the form of formal and informal training must align. Current members of the workforce, new workers just entering, workforce support organizations, and education institutions need to understand what skills and credentials are required by industries in the area and how those goals can be achieved. Aligning supply and demand necessitates the two forces to work together to match the right candidate to the right job at the right time. Local employers can share their priorities with the community, including skills, competencies, and credentials needed to fill short and long term workforce demand. Suppliers, including education institutes, workforce institutions, and the workforce itself can then align their own systems to match demand. Through this collaboration, employers are able to help shape the current and future workforce to their needs, and the workforce is more easily placed in jobs that are right for them.
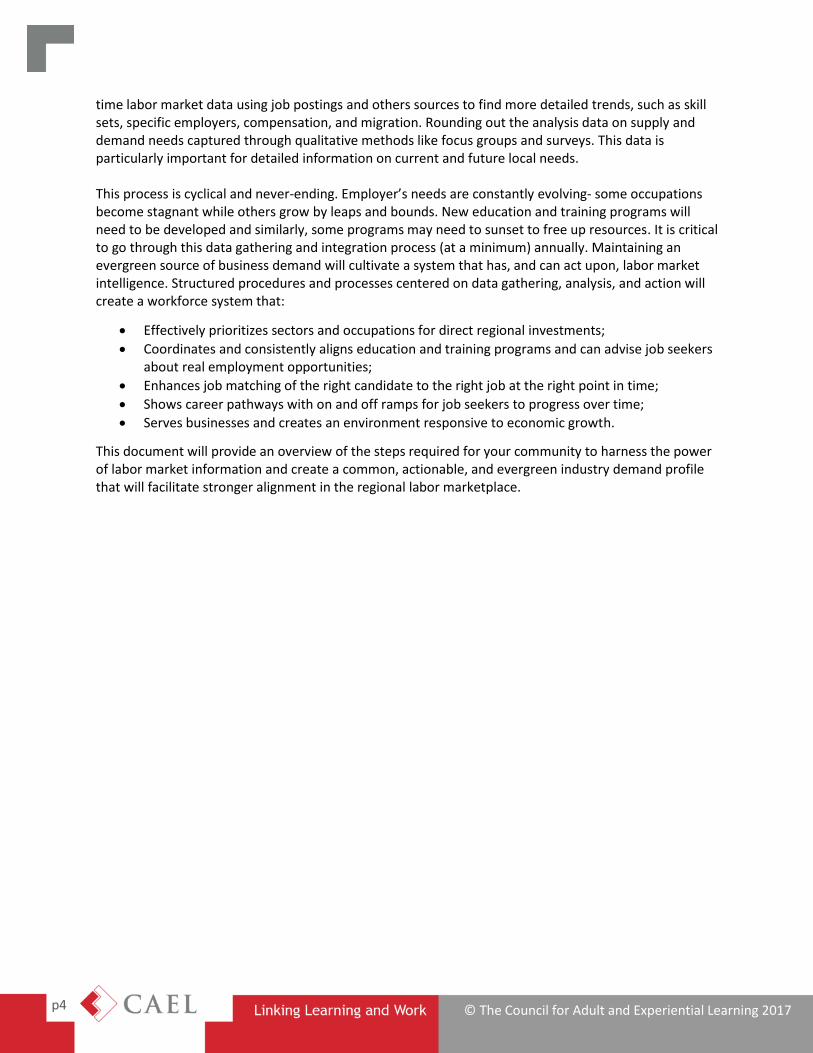
Identifying the Ingredients for Success Within each industry sector there are several ways of “getting smart” about employment needs. In order to pull all of these pieces together seamlessly and align the bigger picture to help drive action on the ground, a layered approach needs to be deployed. Structured data gathering and integration of the pieces is no small task. First we need to understand each component. There are three primary sources of labor market information: traditional labor market data, real-time data such as job postings, and qualitative data collected from the stakeholders themselves. Using a unified approach that draws on the unique strengths of each source while covering for the inherent weaknesses of each, communities gain a deep understanding of how to align a talented workforce development system and activate effective job matching in a region. This plan employs a blended approach to data and analysis that draws from a range of data sources and analytic approaches including traditional economic data, job postings analysis, and qualitative data like that from in-depth focus groups. This process also requires communities have a robust plan that incorporates diverse stakeholders and a process for dissemination of information to a wide audience of partners. Using this approach, quantitative and qualitative data combine to form a comprehensive and actionable perspective. Traditional quantitative labor market data accessible from publically available sources provides trends in education and employment. While a second major form of quantitative data is real-
p4 © The Council for Adult and Experiential Learning 2017
time labor market data using job postings and others sources to find more detailed trends, such as skill sets, specific employers, compensation, and migration. Rounding out the analysis data on supply and demand needs captured through qualitative methods like focus groups and surveys. This data is particularly important for detailed information on current and future local needs. This process is cyclical and never-ending. Employer’s needs are constantly evolving- some occupations become stagnant while others grow by leaps and bounds. New education and training programs will need to be developed and similarly, some programs may need to sunset to free up resources. It is critical to go through this data gathering and integration process (at a minimum) annually. Maintaining an evergreen source of business demand will cultivate a system that has, and can act upon, labor market intelligence. Structured procedures and processes centered on data gathering, analysis, and action will create a workforce system that:
Effectively prioritizes sectors and occupations for direct regional investments;
Coordinates and consistently aligns education and training programs and can advise job seekers about real employment opportunities;
Enhances job matching of the right candidate to the right job at the right point in time;
Shows career pathways with on and off ramps for job seekers to progress over time;
Serves businesses and creates an environment responsive to economic growth.
This document will provide an overview of the steps required for your community to harness the power of labor market information and create a common, actionable, and evergreen industry demand profile that will facilitate stronger alignment in the regional labor marketplace.
p5 © The Council for Adult and Experiential Learning 2017
Step 1: Defining the Scope 1.1 Determining Project Parameters In order to achieve the greatest success in studying labor market issues, communities should first determine the parameters of the project and design the study around those parameters. The volume of potential data sources and analyses is extensive, and by defining the scope, a community can determine what subjects are most relevant to their study and create a plan for obtaining and analyzing the most useful information. The following is a non-comprehensive list of questions communities should ask before beginning the project. The answers to these questions should inform every step going forward.
1. What is the study question? o What industries are we focused on? o How do we account for cross-industry occupations like IT? o What time horizons are we interested in? e.g. current demand, long-term demand?
2. Who are the stakeholders? o Workforce training and education partners o Employers
3. What data points would be most useful to answering the study question? o How will the data translate to action?
4. What geographic areas are of interest? o Defining the region to align to the function labor marketplace o How is the data organized? e.g. state, WIB region, etc.?
5. What is the final product? o Who are the key supply partners who need this information? o Will this information be communicated to students, job seekers, the general public? o How, where and in what form will information be presented?
Communities can determine which data sources and approaches they want to employ using the answers to the above questions. Allow the scope defined here to provide parameters for each subsequent step and sub-step.
p6 © The Council for Adult and Experiential Learning 2017
Step 2: Gathering Quantitative Labor Market Intelligence Labor market intelligence requires information and data to come from a variety of sources and approaches that complement each other. None of these sources on their own produce a complete picture but when combined, the end product is very powerful. Traditional labor market data provides context on long term trends and projections for a range of geographic units. It can be combined with real-time data to gather more detail and address a constantly changing labor market environment. Merging the information gained from these two types of data sources provides a more complete picture, forms a basis for further analysis, and allows communities to align employer and workforce needs more successfully. Please see Appendix A for protocols on gathering and updating quantitate labor market intelligence.
2.1 Identifying an LMI Aggregator There are often numerous partners and stakeholders who have a vested interest in labor market intelligence and the alignment of supply and demand. Many of these partners will have their own data sources and efforts to engage employers. To get the most comprehensive and actionable view of industry demand and labor supply, one organization should take the lead in creating a “gold standard” that aggregates the range of data sources. This aggregator organization should be seen as impartial and trusted by all the partners. It is also extremely helpful for that organization to have strong business relationships and credibility within the business community. This organization does not necessarily have to be a direct provider of labor supply or consumer of industry demand. For example, a Chamber of Commerce could fill the aggregator role. Whomever takes on this aggregator role will need to commit to producing and sharing this labor market information on a regular basis.
2.2 Applying Parameters Using the scope defined in 1.1, determine what data points can be found in quantitative labor market and education data and for what locality. The desired data points and location parameter will then govern which sources to gather from, how to analyze the data, and where to use it. Remember that a little data can go a long way, but often times more is available than what is reasonable to act on. Be selective when identifying what data points to use, think of the data as a guide and starting point.
2.3 Gathering Data
Traditional Labor Market Data Traditional sources of labor market data provide a big picture, long-range perspective on employment and education in the United States. The information provides long-term trends and projections for the future and may be more complete and accurate than sources like real-time job postings. Traditional labor market data from the demand-side includes information on employment, occupations, wages, and labor force statistics. Falling into a similar category is traditional supply-side data, including education data from national and state sources that provide information on secondary and postsecondary institutions training the current and upcoming labor force. Please see Appendix A for more detail on traditional labor market data sources.
Real-Time Labor Market Data Labor markets are constantly changing, and the needs of employers are in continuous development. Through the benefit of hindsight, traditional labor market data may show a more complete picture,

p7 © The Council for Adult and Experiential Learning 2017
however, it may not provide timely and actionable information. Real-time labor market data uses sources like job postings to show current trends in employer and workforce needs. In addition, it can provide data elements that are more unique to the local area and based on the real needs of local employers and workforce. Using this data, communities can further enhance the labor market data that is available from traditional sources and continue to craft customized reports to gather information that is needed on an ad hoc or situational basis. Please see Appendix A for more detail on real-time labor market data sources.
p8 © The Council for Adult and Experiential Learning 2017
Step 3: Gathering Custom Qualitative Labor Market Intelligence In order to perform more comprehensive examinations, this strategy uses an approach that blends the quantitative external data discussed in Step 2 with information provided by key stakeholders. Those results provide context and help form a framework for information gathering and analysis in Step 3. This will help tie the strategy to the actual needs of the community and allow for more confident projections moving forward.
3.1 Applying Parameters Using the scope defined in 1.1, determine what data points can be found in quantitative labor market
and education data and for what locality. The desired data points and location parameter will then
govern which data gathering approaches to use, how to analyze the data, and where to utilize it.
In addition to broader questions of scope, it’s important to consider the labor demand within a context of time. If a community is looking to get “ahead of the curve”, then the information collected must be framed within a context that is actionable. Workforce development and education can take time. Students in high school are by definition several years away from the workforce, and so immediate/urgent labor demand information is not as applicable as it might be for adults currently going through short-term training in an effort to get a job quickly. Similarly, long-term trends are best integrated into traditional educational institutions, post-secondary & K-12. In collecting actionable labor market information, it’s important to consider three distinct time horizons:
Short Term - Experience in hiring over the last 6 months, current experience and expectations moving
forward for the next 6 months - What are the best sources of talent? - What employers want and need right now (HR representatives) - Local job centers, current job seekers, WIBs - Real time job posting data - Qualitative data- particularly focus group
Medium Term - 3-5 years in the future - What sorts of jobs/skills will change the most from a skill and demand standpoint in the
foreseeable future? - Are there regulatory or technology changes coming in the next few years that employers are
planning for and will require new skills? (e.g. electronic medical record implementation in healthcare)
- Traditional labor market data - Qualitative data- particularly survey group - Time trends for all of the data sources
Long Term - 5-10 years in the future - Are there common “safe-bet” skills and competencies that under almost all circumstances
with be important for employers in the future?
p9 © The Council for Adult and Experiential Learning 2017
- What are the disruptive technologies and market forces which may change the industry and by extension the workforce? (e.g. autonomous vehicles, additive manufacturing, etc.)
- What jobs are going away? Are those responsibilities/skills migrating to other jobs? (job hybridization)
- Traditional labor market data - Qualitative data- particularly focus group and interviews - Time trends for all of the data sources
3.2 Performing Background Research Performing independent research around the stakeholders identified in 1.1 helps drive the subsequent data gathering and analysis. For example, create an education inventory of degree programs available in the region for a specific industry (e.g. perform an internet search on all education institutions providing degrees in Information Technology, and compile degree availability into a shared spreadsheet). On the demand side, make sure you understand all aspects of the industry cluster you intend to focus on: who are the major employers, who are key suppliers, are there start-ups in your region? The information acquired in this step is critical to ensure that the most relevant stakeholders are included in step 3.3, design the most appropriate data gathering methods in 3.4, and make sure that the results are broadly applicable.
3.3 Identifying Stakeholders Using the results from 3.1 and 3.2, categorize stakeholders into interest areas in order to determine what useful information each stakeholder can provide and the most appropriate method for obtaining it. Categorizing stakeholders includes determining whether they can deliver insight into supply or demand issues (or, in some cases, both) and what data points from 1.1 they can provide information on. Industry and employer representatives are key sources of data on industry need, occupations, and related information. Education and training institutions provide valuable insight into supply information such as programs and degrees offered, skill developed, and future workforce volume. Job centers and workforce boards usually work with both supply and demand stakeholders and so hold useful information on the interaction between. When it comes to employers, it’s important to have a representative sample set of companies that cover the full range of variables, including geographic location, size of the firm, growth and mature companies, etc. It is similarly important to ensure that the actual business representatives from each company represent the range of business functions within the company. A CEO can have a very different perspective than does an HR manager. This is especially important when we consider the three time horizons across which demand data should be collected. The HR manager is likely the best person to speak to short term need but may not have the wide angle lens of a CEO to speak to the long term need. Similarly, someone who works in operations is likely the best person to speak to medium term changes. The ideal sample set would include diversity of company as well as diversity of representatives across senior leadership (CEO, President, Founder), operations (plant manager, COO, director of operations) and human resources (VP of HR, HR manager, recruiter).
p10 © The Council for Adult and Experiential Learning 2017
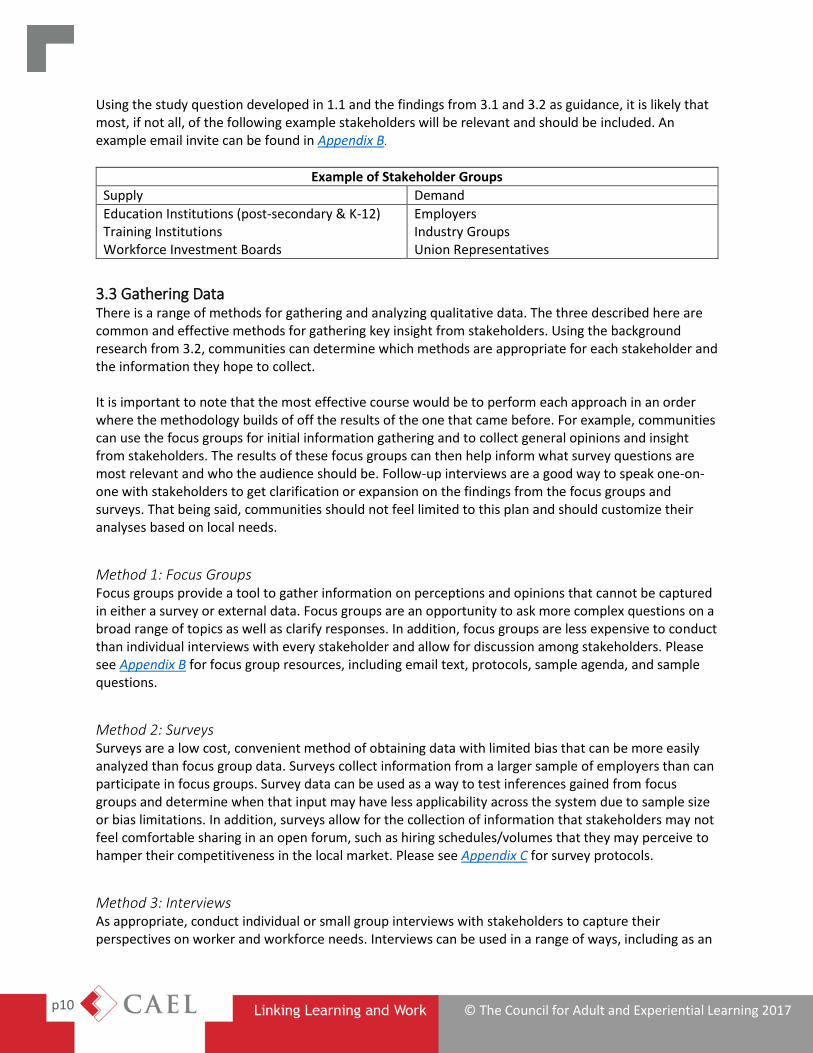
Using the study question developed in 1.1 and the findings from 3.1 and 3.2 as guidance, it is likely that most, if not all, of the following example stakeholders will be relevant and should be included. An example email invite can be found in Appendix B.
Example of Stakeholder Groups
Supply Demand
Education Institutions (post-secondary & K-12) Training Institutions Workforce Investment Boards
Employers Industry Groups Union Representatives
3.3 Gathering Data There is a range of methods for gathering and analyzing qualitative data. The three described here are common and effective methods for gathering key insight from stakeholders. Using the background research from 3.2, communities can determine which methods are appropriate for each stakeholder and the information they hope to collect. It is important to note that the most effective course would be to perform each approach in an order where the methodology builds of off the results of the one that came before. For example, communities can use the focus groups for initial information gathering and to collect general opinions and insight from stakeholders. The results of these focus groups can then help inform what survey questions are most relevant and who the audience should be. Follow-up interviews are a good way to speak one-on-one with stakeholders to get clarification or expansion on the findings from the focus groups and surveys. That being said, communities should not feel limited to this plan and should customize their analyses based on local needs.
Method 1: Focus Groups Focus groups provide a tool to gather information on perceptions and opinions that cannot be captured in either a survey or external data. Focus groups are an opportunity to ask more complex questions on a broad range of topics as well as clarify responses. In addition, focus groups are less expensive to conduct than individual interviews with every stakeholder and allow for discussion among stakeholders. Please see Appendix B for focus group resources, including email text, protocols, sample agenda, and sample questions.
Method 2: Surveys Surveys are a low cost, convenient method of obtaining data with limited bias that can be more easily analyzed than focus group data. Surveys collect information from a larger sample of employers than can participate in focus groups. Survey data can be used as a way to test inferences gained from focus groups and determine when that input may have less applicability across the system due to sample size or bias limitations. In addition, surveys allow for the collection of information that stakeholders may not feel comfortable sharing in an open forum, such as hiring schedules/volumes that they may perceive to hamper their competitiveness in the local market. Please see Appendix C for survey protocols.
Method 3: Interviews As appropriate, conduct individual or small group interviews with stakeholders to capture their perspectives on worker and workforce needs. Interviews can be used in a range of ways, including as an

p11 © The Council for Adult and Experiential Learning 2017
opening introduction to stakeholders to gather general information or as a follow up to clarifying information gathered through background research, focus groups, and surveys. This method may be most useful for the supply conversation as each educational institution may require its own conversation rather than a focus group with many institutions. This method should also be used if businesses are unwilling to discuss certain topics in front of competitors.
p12 © The Council for Adult and Experiential Learning 2017
Step 4: Collecting and Using Labor Market Intelligence Data 4.1 Designing and Implementing Custom Data Storage Procedures After gathering quantitative and qualitative labor market intelligence in Steps 2 and 3, the next step is to compile that data into a common format for efficient and actionable use. This step can take a number of forms, and it should be designed to fit the community’s custom needs. Common tools for holding data are in spreadsheets (e.g. Excel) and databases (e.g. Access). The tools used will depend on how a community wants to use the data and what resources it has for inputting data (i.e. what technology staff currently uses). Minutes and notes from qualitative focus groups should be collected in a standardized format to allow for longitudinal tracking, especially as it relates to long-term projections. Another element of this data repository that should be customized to the local needs is availability of
access. For example, should the data only be available internally or should it be open to all
stakeholders? The answers to these questions may affect the form the repository takes. Please see
Appendix D for protocols.
4.2 Application and Uses Once labor market intelligence is compiled, communities should then employ strategies to analyze information and make it broadly applicable to key supply partners. While all partners should have a general understanding of all information, action should be taken by the various partners based on the time horizons outlined in 3.1. Workforce investment boards and non-credit community college programs should focus on taking action in response to the short –term demand. Community College programs as well as Universities and K-12 programs that have capstone programs, internships, or apprenticeships are well positioned to respond to medium term changes. Finally, when trends and consensus appears on long-term demand, post-secondary and K-12 curriculum discussions should be had to better align to industry needs. Foundations and community based organization as well as job seekers may also be interested in this information. Once the information has been collected and put into a shareable format, the aggregator organization should look for public event venues to share the information, e.g. Rotary Clubs, Chamber of Commerce events, Business Journal Articles, etc.
4.3 Data Update Protocol
Repeat Steps 1-4 Regularly It is important to note that Steps 1-4 are cyclical and should be updated to keep information relevant and actionable as well as to be able to track trends over time. Please see Appendix A for information on updating quantitative labor market intelligence and Appendix B for qualitative labor market intelligence. All methods of data gathering, analysis, dissemination, and use should reflect the recurring nature of the process.
p13 © The Council for Adult and Experiential Learning 2017
Conclusion Alignment and efficiency of regional labor markets will come to define winning and losing communities over the coming decades. The urgency has never been higher for communities and partners to come together with business partners to ensure that the labor marketplace works for both employers and job seekers. A strong program of labor market intelligence will guarantee community success, but communities who have a standardized, evergreen, and actionable source of information from which to build, will have a competitive advantage over those who continue to react in an uncoordinated fashion. For additional information please contact the Council for Adult and Experiential Learning’s (CAEL) Workforce and Economic Development team.
p14 © The Council for Adult and Experiential Learning 2017
Appendices Appendix A: Protocol for Gathering and Updating Quantitative Labor Market Data
Traditional labor market data should be updated annually and more frequently if the source allows it.
Real-time labor market data should be updated quarterly and on an ad-hoc basis as needed.
Depending on the study question, reports should collect at a minimum o Regional and local employment levels by industry o Regional and local long-term employment projections for a menu of occupations,
including a deeper “drill down” into the 50 to 100 occupations with the highest employment in the region and locality.
o Short-term projections and current demand for the same group of occupations. o Narrative describing the meaning of this information, with particular attention to unique
characteristics of the trends, where growth is most dramatic, linkages among this data. o A deeper snapshot of each of the targeted industries/occupations, showing the number
of current openings, number of employers hiring, average wages, and data showing how the regional/locality compares to the state and nation as a whole. Also included should be demographics on the current/future workforce, including education level, experience, credentials, and skillsets.
o Within each industry, a deeper analysis of the key occupations (top 25 approximately) in that industry.
o The number of job openings based upon educational level. This information can provide insights into the type of trainings a community should allow or target.
o The location quotient of each industry and its sub-sectors. o Education, credential, and training availability in the region/locality, including
institutions, degrees/credentials offered, and employment outcomes.
The data will be formatted and delivered using the following guiding principles o The report will include the same information on each industry, providing a snapshot of
the current state of the industry in the locality and the surrounding region(s). o Consistency is critical to allow for cross-industry analysis and to aide users in becoming
familiar with the data and make comparisons over time. o The report will use multiple graphics to allow users (including job-seekers as well as staff
and partners) a range of ways of visualizing and understanding the data. The goal of all of this data is to guide decisions, and the better understanding each group has, with information provided in the clearest format, the better their decisions can be.
The data will present insights on the following key topics, as well as additional topics and insights that are identified during the process of gathering the data.
o Insights regarding what jobs on which to focus career preparation efforts, versus those that are less a priority in the region. The priority occupations are those that are in demand, provide solid wages, and have potential for advancement and job stability, based on available data.
o Insights on what fields to train toward, with particular focus on those trainings that are: Valued and demanded by employers Leads to higher wages, career advancement, and/or increased job security Meet a specific skills gap in a key industry. Reasonably expected to result in high levels of placement and retention. Portable – skills learned are transferable and provide broad opportunities
p15 © The Council for Adult and Experiential Learning 2017
Stackable – skills learned may lead to opportunities for continuous or advanced training and education
o Insights on what occupations are a good match for targeted populations. While this is not the primary goal in a demand-driven system, communities should not ignore the reality of the characteristics of the target population. Thus, all analysis will also include an element of considering what trainings are accessible and achievable for our targeted job seeker populations and what occupations are a reasonable match for these groups.
o Insights on the career pathways that can be developed in conjunction with business and industry and a focus on those occupations that are accessible along those career pathways.
o And, in general, any insights and data that answer the questions, “What is the story that the numbers tell?” and “How does this validate, inform, or conflict with information from the other sources and levels of data?”.
p16 © The Council for Adult and Experiential Learning 2017
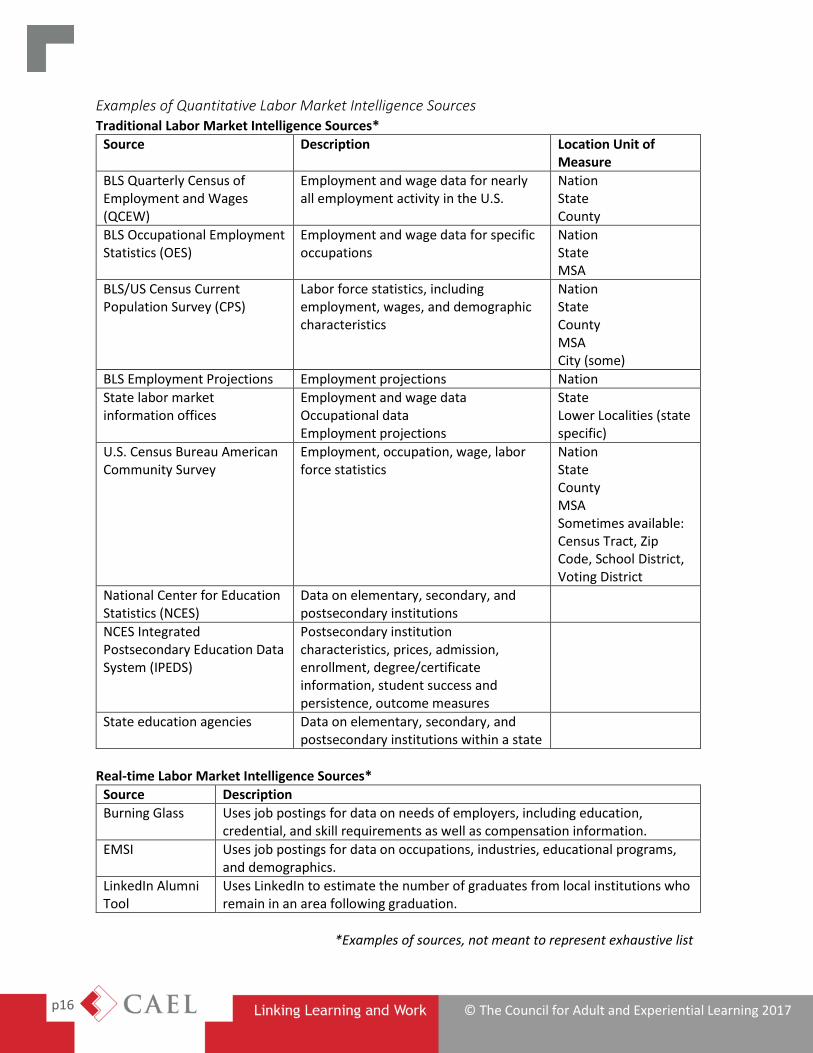
Examples of Quantitative Labor Market Intelligence Sources Traditional Labor Market Intelligence Sources*
Source Description Location Unit of Measure
BLS Quarterly Census of Employment and Wages (QCEW)
Employment and wage data for nearly all employment activity in the U.S.
Nation State County
BLS Occupational Employment Statistics (OES)
Employment and wage data for specific occupations
Nation State MSA
BLS/US Census Current Population Survey (CPS)
Labor force statistics, including employment, wages, and demographic characteristics
Nation State County MSA City (some)
BLS Employment Projections Employment projections Nation
State labor market information offices
Employment and wage data Occupational data Employment projections
State Lower Localities (state specific)
U.S. Census Bureau American Community Survey
Employment, occupation, wage, labor force statistics
Nation State County MSA Sometimes available: Census Tract, Zip Code, School District, Voting District
National Center for Education Statistics (NCES)
Data on elementary, secondary, and postsecondary institutions
NCES Integrated Postsecondary Education Data System (IPEDS)
Postsecondary institution characteristics, prices, admission, enrollment, degree/certificate information, student success and persistence, outcome measures
State education agencies Data on elementary, secondary, and postsecondary institutions within a state
Real-time Labor Market Intelligence Sources*
Source Description
Burning Glass Uses job postings for data on needs of employers, including education, credential, and skill requirements as well as compensation information.
EMSI Uses job postings for data on occupations, industries, educational programs, and demographics.
LinkedIn Alumni Tool
Uses LinkedIn to estimate the number of graduates from local institutions who remain in an area following graduation.
*Examples of sources, not meant to represent exhaustive list
p17 © The Council for Adult and Experiential Learning 2017
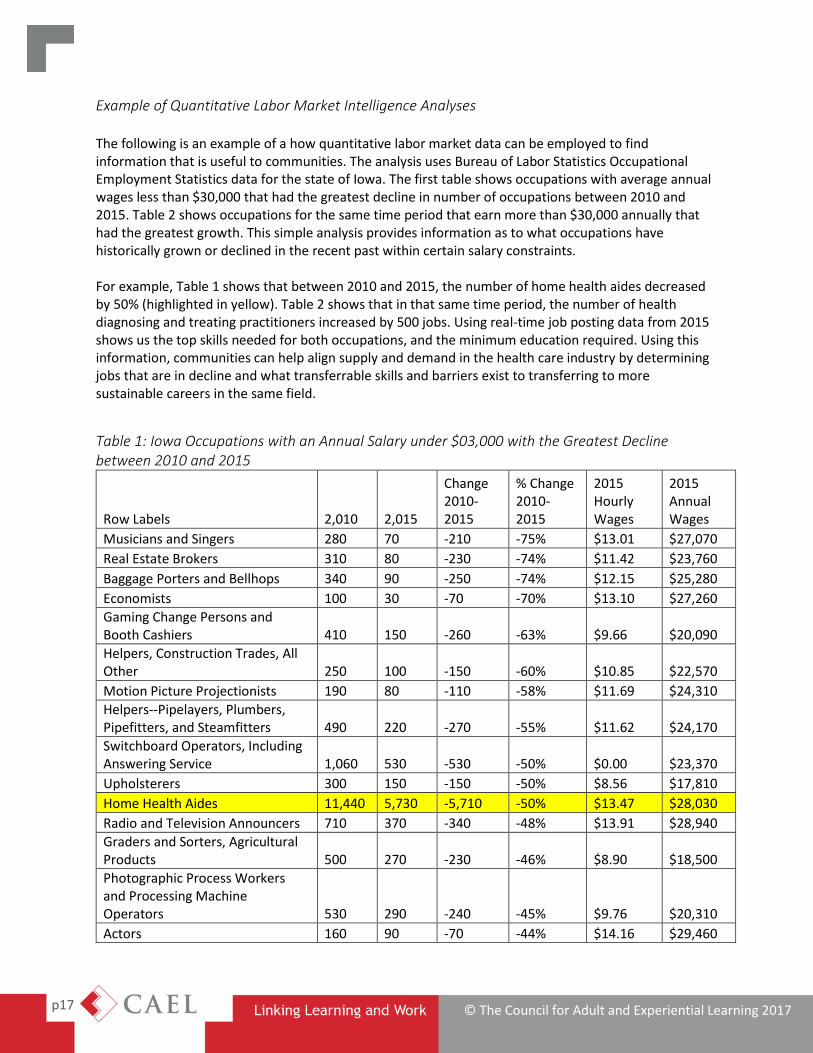
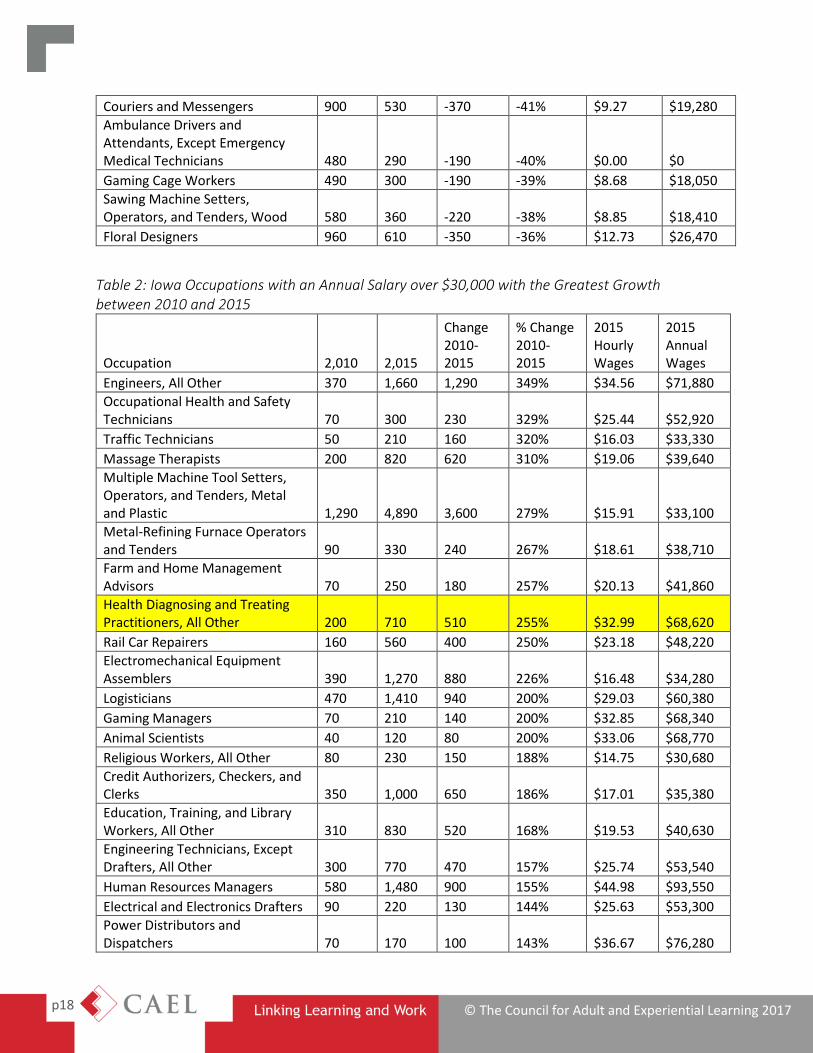
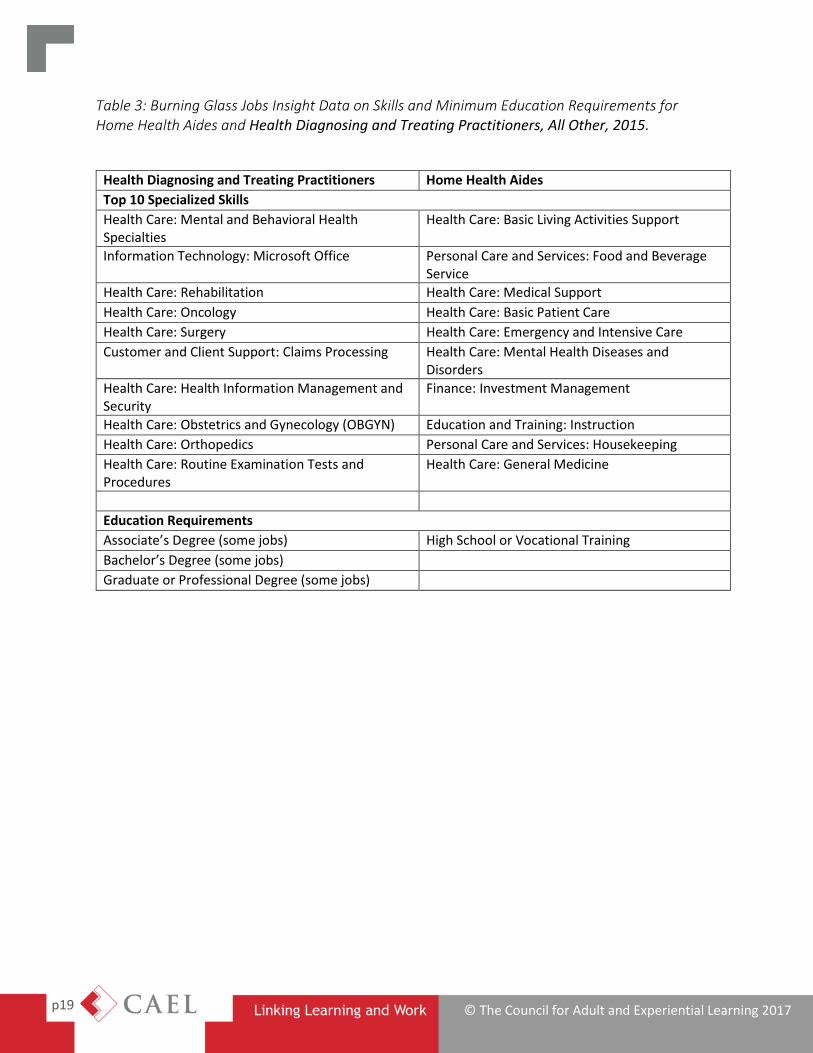
Example of Quantitative Labor Market Intelligence Analyses The following is an example of a how quantitative labor market data can be employed to find information that is useful to communities. The analysis uses Bureau of Labor Statistics Occupational Employment Statistics data for the state of Iowa. The first table shows occupations with average annual wages less than $30,000 that had the greatest decline in number of occupations between 2010 and 2015. Table 2 shows occupations for the same time period that earn more than $30,000 annually that had the greatest growth. This simple analysis provides information as to what occupations have historically grown or declined in the recent past within certain salary constraints. For example, Table 1 shows that between 2010 and 2015, the number of home health aides decreased by 50% (highlighted in yellow). Table 2 shows that in that same time period, the number of health diagnosing and treating practitioners increased by 500 jobs. Using real-time job posting data from 2015 shows us the top skills needed for both occupations, and the minimum education required. Using this information, communities can help align supply and demand in the health care industry by determining jobs that are in decline and what transferrable skills and barriers exist to transferring to more sustainable careers in the same field.
Table 1: Iowa Occupations with an Annual Salary under $03,000 with the Greatest Decline between 2010 and 2015
Row Labels 2,010 2,015
Change 2010-2015
% Change 2010-2015
2015 Hourly Wages
2015 Annual Wages
Musicians and Singers 280 70 -210 -75% $13.01 $27,070
Real Estate Brokers 310 80 -230 -74% $11.42 $23,760
Baggage Porters and Bellhops 340 90 -250 -74% $12.15 $25,280
Economists 100 30 -70 -70% $13.10 $27,260
Gaming Change Persons and Booth Cashiers 410 150 -260 -63% $9.66 $20,090
Helpers, Construction Trades, All Other 250 100 -150 -60% $10.85 $22,570
Motion Picture Projectionists 190 80 -110 -58% $11.69 $24,310
Helpers--Pipelayers, Plumbers, Pipefitters, and Steamfitters 490 220 -270 -55% $11.62 $24,170
Switchboard Operators, Including Answering Service 1,060 530 -530 -50% $0.00 $23,370
Upholsterers 300 150 -150 -50% $8.56 $17,810
Home Health Aides 11,440 5,730 -5,710 -50% $13.47 $28,030
Radio and Television Announcers 710 370 -340 -48% $13.91 $28,940
Graders and Sorters, Agricultural Products 500 270 -230 -46% $8.90 $18,500
Photographic Process Workers and Processing Machine Operators 530 290 -240 -45% $9.76 $20,310
Actors 160 90 -70 -44% $14.16 $29,460
p18 © The Council for Adult and Experiential Learning 2017
Couriers and Messengers 900 530 -370 -41% $9.27 $19,280
Ambulance Drivers and Attendants, Except Emergency Medical Technicians 480 290 -190 -40% $0.00 $0
Gaming Cage Workers 490 300 -190 -39% $8.68 $18,050
Sawing Machine Setters, Operators, and Tenders, Wood 580 360 -220 -38% $8.85 $18,410
Floral Designers 960 610 -350 -36% $12.73 $26,470
Table 2: Iowa Occupations with an Annual Salary over $30,000 with the Greatest Growth between 2010 and 2015
Occupation 2,010 2,015
Change 2010-2015
% Change 2010-2015
2015 Hourly Wages
2015 Annual Wages
Engineers, All Other 370 1,660 1,290 349% $34.56 $71,880
Occupational Health and Safety Technicians 70 300 230 329% $25.44 $52,920
Traffic Technicians 50 210 160 320% $16.03 $33,330
Massage Therapists 200 820 620 310% $19.06 $39,640
Multiple Machine Tool Setters, Operators, and Tenders, Metal and Plastic 1,290 4,890 3,600 279% $15.91 $33,100
Metal-Refining Furnace Operators and Tenders 90 330 240 267% $18.61 $38,710
Farm and Home Management Advisors 70 250 180 257% $20.13 $41,860
Health Diagnosing and Treating Practitioners, All Other 200 710 510 255% $32.99 $68,620
Rail Car Repairers 160 560 400 250% $23.18 $48,220
Electromechanical Equipment Assemblers 390 1,270 880 226% $16.48 $34,280
Logisticians 470 1,410 940 200% $29.03 $60,380
Gaming Managers 70 210 140 200% $32.85 $68,340
Animal Scientists 40 120 80 200% $33.06 $68,770
Religious Workers, All Other 80 230 150 188% $14.75 $30,680
Credit Authorizers, Checkers, and Clerks 350 1,000 650 186% $17.01 $35,380
Education, Training, and Library Workers, All Other 310 830 520 168% $19.53 $40,630
Engineering Technicians, Except Drafters, All Other 300 770 470 157% $25.74 $53,540
Human Resources Managers 580 1,480 900 155% $44.98 $93,550
Electrical and Electronics Drafters 90 220 130 144% $25.63 $53,300
Power Distributors and Dispatchers 70 170 100 143% $36.67 $76,280
p19 © The Council for Adult and Experiential Learning 2017
Table 3: Burning Glass Jobs Insight Data on Skills and Minimum Education Requirements for Home Health Aides and Health Diagnosing and Treating Practitioners, All Other, 2015.
Health Diagnosing and Treating Practitioners Home Health Aides
Top 10 Specialized Skills
Health Care: Mental and Behavioral Health Specialties
Health Care: Basic Living Activities Support
Information Technology: Microsoft Office Personal Care and Services: Food and Beverage Service
Health Care: Rehabilitation Health Care: Medical Support
Health Care: Oncology Health Care: Basic Patient Care
Health Care: Surgery Health Care: Emergency and Intensive Care
Customer and Client Support: Claims Processing Health Care: Mental Health Diseases and Disorders
Health Care: Health Information Management and Security
Finance: Investment Management
Health Care: Obstetrics and Gynecology (OBGYN) Education and Training: Instruction
Health Care: Orthopedics Personal Care and Services: Housekeeping
Health Care: Routine Examination Tests and Procedures
Health Care: General Medicine
Education Requirements
Associate’s Degree (some jobs) High School or Vocational Training
Bachelor’s Degree (some jobs)
Graduate or Professional Degree (some jobs)
p20 © The Council for Adult and Experiential Learning 2017
Appendix B: Protocol for Gathering and Updating Qualitative Labor Market Data
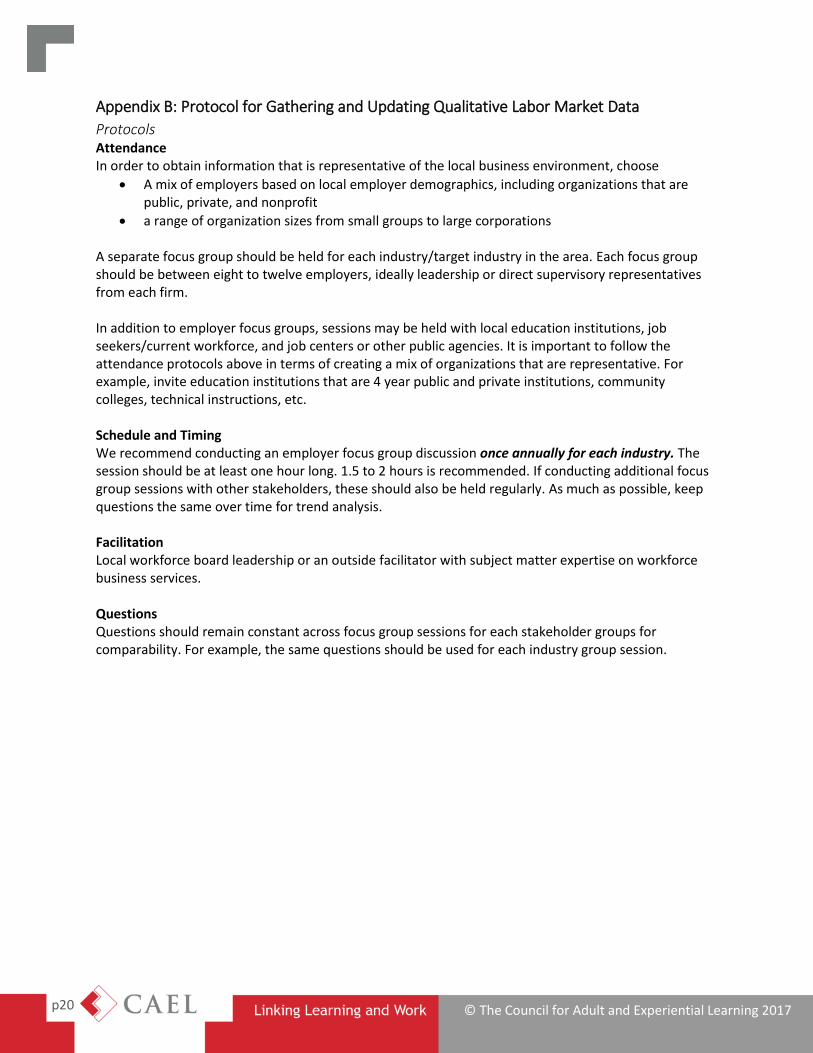
Protocols Attendance In order to obtain information that is representative of the local business environment, choose
A mix of employers based on local employer demographics, including organizations that are public, private, and nonprofit
a range of organization sizes from small groups to large corporations A separate focus group should be held for each industry/target industry in the area. Each focus group should be between eight to twelve employers, ideally leadership or direct supervisory representatives from each firm. In addition to employer focus groups, sessions may be held with local education institutions, job seekers/current workforce, and job centers or other public agencies. It is important to follow the attendance protocols above in terms of creating a mix of organizations that are representative. For example, invite education institutions that are 4 year public and private institutions, community colleges, technical instructions, etc. Schedule and Timing We recommend conducting an employer focus group discussion once annually for each industry. The session should be at least one hour long. 1.5 to 2 hours is recommended. If conducting additional focus group sessions with other stakeholders, these should also be held regularly. As much as possible, keep questions the same over time for trend analysis. Facilitation Local workforce board leadership or an outside facilitator with subject matter expertise on workforce business services. Questions Questions should remain constant across focus group sessions for each stakeholder groups for comparability. For example, the same questions should be used for each industry group session.
p21 © The Council for Adult and Experiential Learning 2017
Sample Employer Focus Group Emails
Initial Email
Dear Partners, We know that many of you are struggling to find the candidates you need to grow your businesses, and as our region’s INDUSTRY ORGANIZATION, we have been working closely with regional partners to address the awareness and availability of INDUSTRY talent. To help ensure that all our efforts are aligned to industry demand, we ask for your participation in a targeted INDUSTRY labor supply/demand conference on DATE. This labor supply/demand conversation is designed to help ensure that job seekers as well as workforce training and education providers throughout our region have awareness and access to information about job demand in INDUSTRY with a goal towards increasing the quantity and quality of candidates you have access to. We ask that you or a member of your Human Resources staff participate in a one hour meeting at LOCATION HERE on XXXX DATE at XXXX time. Please RSVP to NAME During this meeting you will be asked to share industry demand across three distinct time horizons:
• Short Term (Past 6 Months & Next 6 Months) • Medium Term (Next 3-5 Years) • Long Term (5 Years and Beyond)
We will take all of your very important feedback and insight and incorporate that into a supply/demand document for our region. Ultimately this information will allow the educators and workforce development practitioners to better prepare and give guidance to local residents and help us to implement a more robust pathway and pipeline process throughout the region. Should you have any questions in the interim please don’t hesitate to reach out, thank you in advance for your partnership. Regards,
p22 © The Council for Adult and Experiential Learning 2017
Pre-Meeting Email
Dear Industry Partners,
In anticipation of next week’s industry demand focus group please find attached meeting materials for your review. You will see that the agenda is designed to examine industry demand across three distinct time horizons: Short Term (Past 6 Months & Next 6 Months), Medium Term (Next 3-5 Years) and Long Term (5 Years and Beyond). We will be looking to identify common themes and trends within your industry as it relates to required skills and competencies. The results of these focus groups, along with the labor market data collected by regional partners will form the foundation of a regional workforce supply/demand analysis that will help us shape talent development efforts throughout the region. While this focus group is convening specifically to help inform the report, the goal is for these industry conversations to continue on a regular basis. In addition to the meeting agenda, you will find a snapshot of industry labor data which will be reviewed during next week’s meeting. For reference, Table 1 shows the occupations within your industry which have had the highest volume of activity over the past 12 months based on the real-time job postings data. Table 2 highlights occupations whose job posting activity suggests businesses are hiring these positions at much faster rates. We will discuss if these are indeed growth occupations or if other factors contribute to the high volume. Table 3 shows the occupations which currently project the most growth over the next 10 years. Finally, Table 4 shows the most requested skills for the top 5 occupations from Table 3. We are interested to hear if those skills ring true for your company and how those skills might change over the next decade. Should you have any questions please don’t hesitate to reach out, and thank you in advance for your partnership. Regards,
p23 © The Council for Adult and Experiential Learning 2017
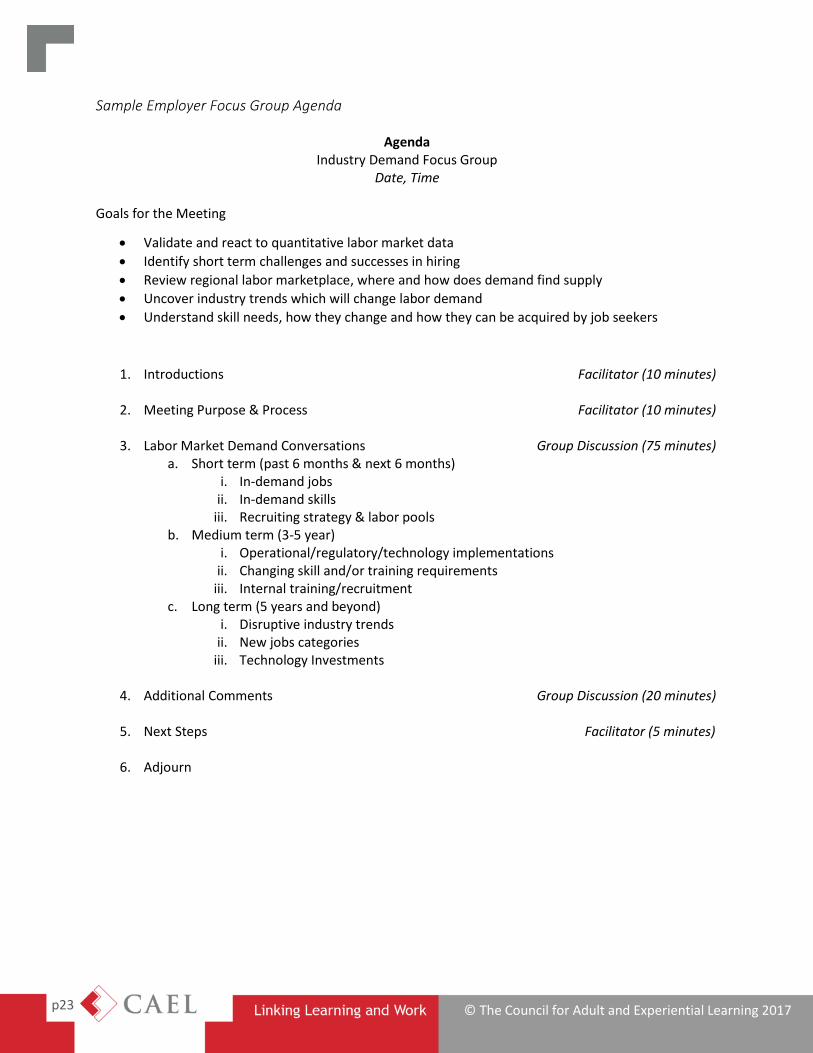
Sample Employer Focus Group Agenda
Agenda Industry Demand Focus Group
Date, Time Goals for the Meeting
Validate and react to quantitative labor market data
Identify short term challenges and successes in hiring
Review regional labor marketplace, where and how does demand find supply
Uncover industry trends which will change labor demand
Understand skill needs, how they change and how they can be acquired by job seekers
1. Introductions Facilitator (10 minutes)
2. Meeting Purpose & Process Facilitator (10 minutes)
3. Labor Market Demand Conversations Group Discussion (75 minutes) a. Short term (past 6 months & next 6 months)
i. In-demand jobs ii. In-demand skills
iii. Recruiting strategy & labor pools b. Medium term (3-5 year)
i. Operational/regulatory/technology implementations ii. Changing skill and/or training requirements
iii. Internal training/recruitment c. Long term (5 years and beyond)
i. Disruptive industry trends ii. New jobs categories
iii. Technology Investments
4. Additional Comments Group Discussion (20 minutes)
5. Next Steps Facilitator (5 minutes)
6. Adjourn
p24 © The Council for Adult and Experiential Learning 2017
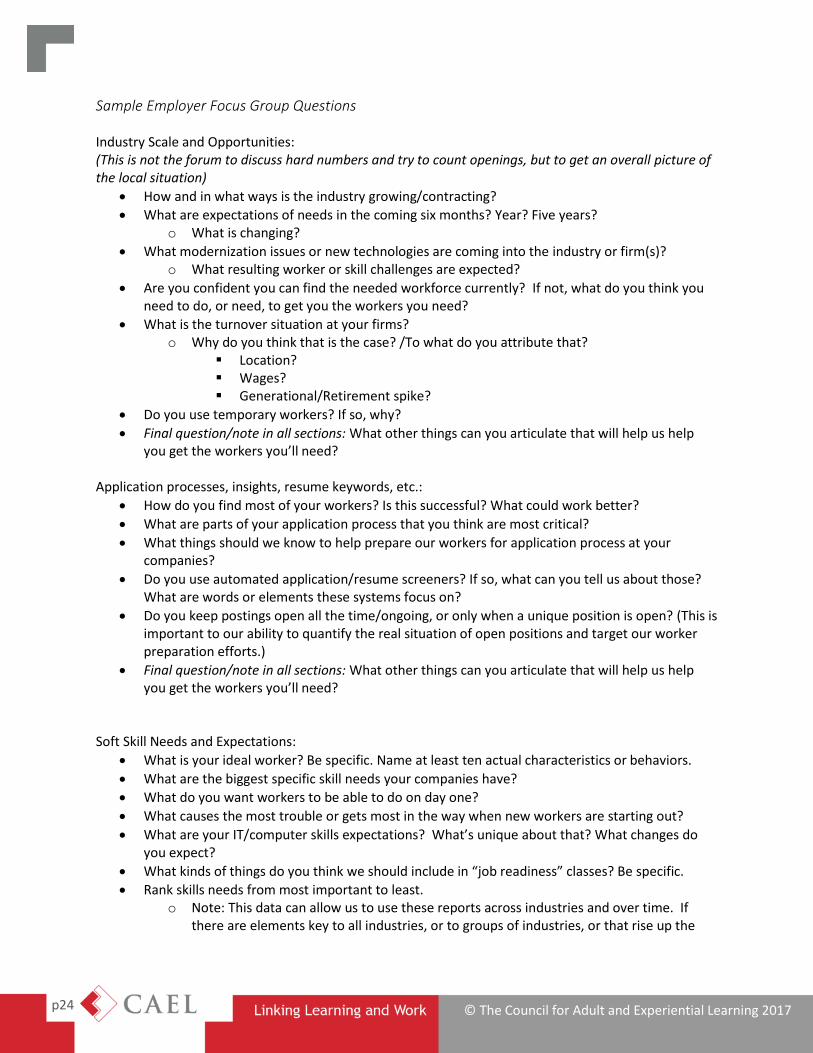
Sample Employer Focus Group Questions Industry Scale and Opportunities: (This is not the forum to discuss hard numbers and try to count openings, but to get an overall picture of the local situation)
How and in what ways is the industry growing/contracting?
What are expectations of needs in the coming six months? Year? Five years? o What is changing?
What modernization issues or new technologies are coming into the industry or firm(s)? o What resulting worker or skill challenges are expected?
Are you confident you can find the needed workforce currently? If not, what do you think you need to do, or need, to get you the workers you need?
What is the turnover situation at your firms? o Why do you think that is the case? /To what do you attribute that?
Location? Wages? Generational/Retirement spike?
Do you use temporary workers? If so, why?
Final question/note in all sections: What other things can you articulate that will help us help you get the workers you’ll need?
Application processes, insights, resume keywords, etc.:
How do you find most of your workers? Is this successful? What could work better?
What are parts of your application process that you think are most critical?
What things should we know to help prepare our workers for application process at your companies?
Do you use automated application/resume screeners? If so, what can you tell us about those? What are words or elements these systems focus on?
Do you keep postings open all the time/ongoing, or only when a unique position is open? (This is important to our ability to quantify the real situation of open positions and target our worker preparation efforts.)
Final question/note in all sections: What other things can you articulate that will help us help you get the workers you’ll need?
Soft Skill Needs and Expectations:
What is your ideal worker? Be specific. Name at least ten actual characteristics or behaviors.
What are the biggest specific skill needs your companies have?
What do you want workers to be able to do on day one?
What causes the most trouble or gets most in the way when new workers are starting out?
What are your IT/computer skills expectations? What’s unique about that? What changes do you expect?
What kinds of things do you think we should include in “job readiness” classes? Be specific.
Rank skills needs from most important to least. o Note: This data can allow us to use these reports across industries and over time. If
there are elements key to all industries, or to groups of industries, or that rise up the
p25 © The Council for Adult and Experiential Learning 2017
levels, then we see and can predict that it will be even more important in future and can focus strategy for worker preparation.
Final question/note in all sections: What other things can you articulate that will help us help you get the workers you’ll need?
Training Expectations:
What training or credentials are needed for positions in your companies?
How well is the education and training system preparing workers for careers with your companies? What could work better?
What is your specific experience of current training providers (name the top 5 or so within the industry, to spur discussion about those specifically)? What was missing? What skills do you need more or better training on?
Rank training expectations from most important to least. (See note above).
Final question/note in all sections: What other things can you articulate that will help us help you get the workers you’ll need?
Intermediary Expectations (perspective on local workforce board and partners):
If you’ve used our system, what is your opinion of the services you have received? (Depending on the group, you may want to list the sub-grantees, sites, and programs that make up your organization in order that they know what services and programs we’re considering).
o Did they meet your staffing or training needs? o What was the best part of your experience? o What would you change if you could? o Have you needed any additional services that were not available? o Were there any services you would have liked to use but could not access?
What other intermediaries have you used? What made them better or worse than ours? o Did they meet your staffing or training needs? o What was the best part of your experience? o What would you change if you could? o Have you needed any additional services that were not available? o Were there any services you would have liked to use but could not access?
If you have not used staffing or training services, why or why not? o Are they difficult to access or use? o How could they be easier to access? o Do they lack the services you need?
What services would be more useful?
What would it take for you use staffing or training services or our services more?
Final question/note in all sections: What other things can you articulate that will help us help you get the workers you’ll need?
p26 © The Council for Adult and Experiential Learning 2017
Appendix C: Survey Protocol Respondents Surveys are a low cost way to obtain information from a larger group of stakeholders than through focus groups and interviews. Respondents should still be representative of the demographics of stakeholders (e.g. all relevant/target industries, different types of education intuitions), but the number of respondents are essentially limitless. For example, a manageable employer focus group should include eight to twelve employer representatives, but a survey can be sent to as many employers in the region as contact information is available for. Schedule and Timing We recommend implementing surveys once annually for each stakeholder group. As much as possible, keep questions the same over time for trend analysis. Facilitation Local workforce board leadership or an outside survey designer with subject matter expertise on workforce business services should provide insight into methodology. Surveys may be created using a range of tools including pen and paper surveys and online surveys, depending on the project. Questions There are many benefits of surveys over focus groups and interviews. Questions can include information that stakeholders may not feel comfortable sharing in open forum, such as hiring schedules/volumes that they may perceive to hamper their competitiveness in the local market. Questions can also ask for hard numbers and statistics as survey respondents have the ability to find the information before responding. There are many online resources on survey methodology that include how best to design the survey, choose a tool, increase survey responses and analyze results that should be consulted when creating a survey. Below are a few important points that may be useful in preparing the questions.
Use information gathered in other steps to inform your question and answer choices.
Avoid excessively detailed or long surveys that take more than 30 minutes to answer.
Keep questions simple. Split complex questions into two separate questions if necessary.
Avoid questions that can introduce bias (e.g. “How awesome are our programs?” vs “On a scale of 1-10, how would you rate our program effectiveness for job placement?”
Avoid open ended questions as much as possible, as these are the most difficult to analyze. Try to create multiple choice, checkboxes, ranges and other pre-formed answer questions based on findings from other information gathering means.
Provide an “Other” option with a write-in box where appropriate.
When using categories, create answer options that are balanced o e.g. the same number of negative and positive choices, with a neutral option. Below is
an example with two negative, two positive, and a neutral response option. strongly disagree disagree neutral agree
p27 © The Council for Adult and Experiential Learning 2017
strongly agree
Create answer choices that are mutually exclusive, even, and comprehensive o For example, when asking about the number of particular degree programs an
institution has, a sound set of choices may be 0 1-10 11-20 > 20
o An example of choices that are not mutually exclusive may be the following, because 10 and 20 appear twice and respondents may not know which category to choose
0 1-10 10-20 20+
o An example of choices that are not even may be the following, where the category ranges are both 10 and 20
0 1-10 11-30 > 30
o An example of choices that are not comprehensive may be the following, where an option for greater than 30 is missing
0 1-10 11-30
p28 © The Council for Adult and Experiential Learning 2017
Appendix D: Protocol for Data Repository Communities should choose a tool that they are comfortable with and can easily be updated and added to, as this process is cyclical. There are many forms this step can take and different best-practices for each, but a few general tips include the following.
Keep it simple.
Keep a log or how-to guide of all data input methodology so that it can be recreated easily.
Keep it consistent (use consistent naming convention for all columns and tables)
Create mechanisms that make it easy to add more data.
Create a “data dictionary” or a glossary of all data inputs and structure of the repository.