Embed Size (px)
Citation preview

U.S. Department of the InteriorU.S. Geological Survey
Scientific Investigations Report 2009–5167
Prepared in cooperation with the New Jersey Department of Environmental Protection and the U.S. Army Corps of Engineers
Methodology for Estimation of Flood Magnitude and Frequency for New Jersey Streams
v2.0

Cover. Photo on cover shows the April 2007 flood event at the U.S. Geological Survey streamflow-gaging station 01378500, Hackensack River at New Milford, New Jersey. (Photograph by Blaine T. White, U.S. Geological Survey)

Methodology for Estimation of Flood Magnitude and Frequency for New Jersey Streams
By Kara M. Watson and Robert D. Schopp
Prepared in cooperation with the New Jersey Department of Environmental Protection and the U.S. Army Corps of Engineers
Scientific Investigations Report 2009–5167
U.S. Department of the InteriorU.S. Geological Survey

U.S. Department of the InteriorKEN SALAZAR, Secretary
U.S. Geological SurveyMarcia K. McNutt, Director
U.S. Geological Survey, Reston, Virginia: 2009Revised: May 2010
For more information on the USGS—the Federal source for science about the Earth, its natural and living resources, natural hazards, and the environment, visit http://www.usgs.gov or call 1-888-ASK-USGS
For an overview of USGS information products, including maps, imagery, and publications, visit http://www.usgs.gov/pubprod
To order this and other USGS information products, visit http://store.usgs.gov
Any use of trade, product, or firm names is for descriptive purposes only and does not imply endorsement by the U.S. Government.
Although this report is in the public domain, permission must be secured from the individual copyright owners to reproduce any copyrighted materials contained within this report.
Suggested citation:Watson, K.M., and Schopp, R.D., 2009, Methodology for estimation of flood magnitude and frequency for New Jersey streams: U.S. Geological Survey Scientific Investigations Report 2009–5167, 51 p.

iii
Contents
Abstract ...........................................................................................................................................................1Introduction.....................................................................................................................................................1
Purpose and Scope ..............................................................................................................................2Description of the Study Area ............................................................................................................2Previous Investigations........................................................................................................................2
Methods of Study .........................................................................................................................................11Peak-Flow Data ...................................................................................................................................12Trend Analysis .....................................................................................................................................12Generalized Skew Coefficients ........................................................................................................15Basin Characteristics Used in Regression Equation Development ...........................................18
Explanatory Variable Selection Methods ..............................................................................18Land Use .............................................................................................................................26Main Channel Length .......................................................................................................26Basin Slope 10–85 Method ..............................................................................................26Population Density ............................................................................................................27
Development of Flood-Frequency Regression Equations .....................................................................27Regression Analysis and Resultant Equations .......................................................................................28
Accuracy of the Flood-Frequency Regression Equations ...........................................................29Limitations of Regression Equations ...............................................................................................29
Flood Frequency and Magnitude at Gaged Sites ...................................................................................29Estimation of Flood Frequency and Magnitude at Ungaged Sites ......................................................30Estimation of Flood Frequency and Magnitude for an Ungaged Site Upstream or Downstream
from a Gaged Site ...........................................................................................................................30Estimation of Flood Frequency and Magnitude for a Site Between Gaged Sites .............................32StreamStats ..................................................................................................................................................33Summary........................................................................................................................................................35Acknowledgments .......................................................................................................................................35References Cited..........................................................................................................................................35Appendix 1. Results of skew analysis for 119 streamflow-gaging stations in New Jersey
and surrounding States .............................................................................................................40Appendix 2. Flood-frequency estimates computed from observed streamflow-gaging-station
data, estimates predicted from regression equations, and a weighted average for streamflow-gaging stations ......................................................................................................43

iv
Figures 1–2. Map showing— 1. Study area and physiographic provinces in New Jersey and surrounding
States .....................................................................................................................................3 2. Location of flood-frequency regions and streamflow-gaging stations in
New Jersey and surrounding States for which flood-frequency estimates were computed ..................................................................................................................13
3. Graph showing distribution of streamflow-gaging stations used for the flood- frequency analysis, by drainage-basin area ..........................................................................14
4. Map showing streamflow-gaging stations in New Jersey and surrounding States with 25 or more years of record used for the skew study ...................................................17
5. Schematic diagram showing a drainage basin, the main channel of a stream, and the points used to compute the stream slope using the basin slope 10–85 method .......26
6. Map showing highly regulated stream reaches on the Hackensack, Rockaway, Wanaque, and Pequannock Rivers and tidal areas excluded from basin delineation and statistics estimation on the StreamStats Web site .......................................................34
Tables 1. Streamflow-gaging stations in New Jersey and surrounding States for which
streamflow statistics were computed. ......................................................................................4 2. Number of streamflow-gaging stations with records included in the regression
analysis of New Jersey streams, by flood-frequency region and State ...........................12 3. Values of basin characteristics for streamflow-gaging stations in New Jersey
and surrounding States used in the regression analysis. ....................................................19 4. Ranges of values for basin characteristics used to develop the flood-frequency
regression equations .................................................................................................................25 5. Values for the regional constant coefficent (KTR) for the peak-flow regression
equations ......................................................................................................................................29 6. Accuracy of peak-flow discharges predicted using flood-frequency regression
equations for New Jersey .........................................................................................................29 7. Value of exponent, b, for flood-frequency regions in New Jersey used in regional
regression analysis ....................................................................................................................31

v
Conversion Factors and Abbreviations
Multiply By To obtainLength
inch (in.) 2.54 centimeter (cm)inch (in.) 25.4 millimeter (mm)foot (ft) 0.3048 meter (m)mile (mi) 1.609 kilometer (km)
Areasquare mile (mi2) 259.0 hectare (ha)square mile (mi2) 2.590 square kilometer (km2)
Flow ratecubic foot per second (ft3/s) 0.02832 cubic meter per second (m3/s)
Hydraulic gradientfoot per mile (ft/mi) 0.1894 meter per kilometer (m/km)
Vertical coordinate information is referenced to the North American Vertical Datum of 1988 (NAVD 88).
Horizontal coordinate information is referenced to the North American Datum of 1983 (NAD 83).
Abbreviations used in this report
DA, drainage area DEM, digital elevation model FEMA, Federal Emergency Management Agency GIS, geographic information system GLS, generalized least squares GP, Glaciated Piedmont flood-frequency region HUC14, Hydrologic Unit Code-14 digit IACWD, Interagency Advisory Committee on Water Data IN, Inner Coastal Plain flood-frequency region MSE, mean-squared error NHD, National Hydrography Dataset NJDEP, New Jersey Department of Environmental Protection NLCD, National Land Cover Data OC, Outer Coastal Plain flood-frequency region OLS, ordinary least squares PopDen, population density UP, Unglaciated Piedmont flood-frequency region USACE, U.S. Army Corps of Engineers USGS, U.S. Geological Survey VR, Valley and Ridge, New England flood-frequency region

vi
This page intentionally left blank.

Methodology for Estimation of Flood Magnitude and Frequency for New Jersey Streams
By Kara M. Watson and Robert D. Schopp
AbstractMethodologies were developed for estimating flood mag-
nitudes at the 2-, 5-, 10-, 25-, 50-, 100-, and 500-year recur-rence intervals for unregulated or slightly regulated streams in New Jersey. Regression equations that incorporate basin char-acteristics were developed to estimate flood magnitude and frequency for streams throughout the State by use of a general-ized least squares regression analysis. Relations between flood-frequency estimates based on streamflow-gaging-station discharge and basin characteristics were determined by mul-tiple regression analysis, and weighted by effective years of record. The State was divided into five hydrologically similar regions to refine the regression equations. The regression analysis indicated that flood discharge, as determined by the streamflow-gaging-station annual peak flows, is related to the drainage area, main channel slope, percentage of lake and wetland areas in the basin, population density, and the flood-frequency region, at the 95-percent confidence level. The standard errors of estimate for the various recurrence-interval floods ranged from 49 to 63.9 percent.
Annual-maximum peak flows observed at streamflow-gaging stations through water year1 2007 and basin charac-teristics determined using geographic information system tech-niques for 254 streamflow-gaging stations were used for the regression analysis. Drainage areas of the streamflow-gaging stations range from 0.18 to 779 mi2. Peak-flow data and basin characteristics for 191 streamflow-gaging stations located in New Jersey were used, along with peak-flow data for stations located in adjoining States, including 25 stations in Pennsyl-vania, 17 stations in New York, 16 stations in Delaware, and 5 stations in Maryland. Streamflow records for selected stations outside of New Jersey were included in the present study because hydrologic, physiographic, and geologic boundaries commonly extend beyond political boundaries.
The StreamStats Web application was developed coop-eratively by the U.S. Geological Survey and the Environ-mental Systems Research Institute, Inc., and was designed for national implementation. This web application has been recently implemented for use in New Jersey. This program
used in conjunction with a geographic information system provides the computation of values for selected basin charac-teristics, estimates of flood magnitudes and frequencies, and statistics for stream locations in New Jersey chosen by the user, whether the site is gaged or ungaged.
IntroductionThe size and number of urban and suburban areas in New
Jersey are increasing. The U.S. Bureau of the Census reported in the 2000 Census that the population density of New Jer-sey was 1,134 persons per square mile (U.S. Census Bureau, 2008), making New Jersey the most densely populated State in the United States. In New Jersey, housing developments, office parks, and industrial complexes are rapidly replacing farms and woodlands, especially in the northern part of the State. Careful planning for future development is needed to ensure that land use does not adversely affect water resources of the State.
Increasing development and the subsequent reduction of open land have led to increased pressure to develop flood-prone areas. An attempt to manage this encroachment into flood-prone areas can be made through careful planning and zoning. Storm sewers, detention basins, and drainage structures can be designed for these areas at a relatively minimal expense if the information about flood characteristics is available.
Urbanization tends to increase the amount of impervi-ous cover, which can increase surface-water runoff volume, as well as instantaneous peak streamflows. The amounts of curbs, gutters, and storm sewers that accompany urbanization have the potential to change the surface-water runoff patterns from a basin by increasing the rate of runoff. Reasonably accurate methods for estimating the magnitude and frequency of peak flows expected from streams draining undeveloped rural areas are available (Lumia, 1991; Stuckey and Reed, 2000); how-ever, because of the rapid urbanization that is occurring in New Jersey, these methods may not be adequate for use in urban areas. Therefore, methods are needed for estimating the magni-tude and frequency of floods in urban areas.
The U.S. Geological Survey (USGS), in cooperation with the New Jersey Department of Environmental Protection (NJDEP) and the U.S. Army Corps of Engineers (USACE), developed peak-flow regression equations to estimate flood
1Water year is the 12-month period from October 1 through September 30. It is designated by the calendar year in which it ends.

2 Methodology for Estimation of Flood Magnitude and Frequency for New Jersey Streams
magnitudes at the 2-, 5-, 10-, 25-, 50-, 100-, and 500-year recurrence intervals for streams in New Jersey with drainage areas greater than 0.4 mi2.
Basin characteristics exhibiting significant correlation to log-Pearson type III peak flows were weighted according to their level of correlation. Values for those characteristics were then incorporated into regional regression equations that can be used to predict peak-flow magnitude and frequency for both gaged and ungaged locations. Because the State was divided into hydrologically similar regions, the equations presented in this report allow improved estimates to be made without the regional bias of some previously developed regression equations.
The purpose of this study was to develop a method for estimating peak-flow magnitudes for various recurrence intervals in basins with varying degrees of urban and suburban development. The method was developed with four constraints.1. Input data (for example, stream-basin characteristics) can
be readily obtained.
2. Sound and basic hydrologic principles are incorporated so the method can be used with confidence and understand-ing.
3. Minimal subjective judgment is needed in order to obtain consistent results with various users.
4. The format is simple and practical for ease of use.Peak-flow data and basin characteristics from 254
continuous-record streamflow-gaging stations2 and crest-stage partial-record station3 with 10 or more years of record, continuing through the 2007 water year for most stations, were used to develop regional regression equations to estimate flood magnitudes at selected recurrence intervals (table 1). Peak-flow data for New Jersey can be accessed from the Web site http://nwis.waterdata.usgs.gov/nj/nwis/peak. Of the 254 streamflow-gaging stations, 191 are located in New Jersey; 25 are in Pennsylvania, 17 in New York, 16 in Delaware, and 5 in Maryland. Those stations outside New Jersey provided peak-flow data. The streamflow-gaging stations chosen are at open-channel sites on non-tidal portions of streams where peak flow is not substantially affected by upstream reservoir operations.
Purpose and Scope
This report presents techniques for estimating flood magnitudes and frequencies for rural and urban, unregulated or slightly regulated streams in New Jersey. The develop-ment of regional regression equations through the use of
multiple-regression techniques is described, and the relation of physical characteristics of drainage basins to log-Pearson type III peak flows at gaged sites within each basin is presented. Peak flows and basin characteristics for 254 streamflow-gag-ing stations were used to develop the equations.
This report also presents information relative to the USGS web application StreamStats, which was implemented for use in New Jersey. This program, driven by a geographic information system (GIS), provides the computation of values for selected basin characteristics and estimates of peak-flow magnitudes and frequencies for stream locations in New Jer-sey chosen by the user, whether the site is gaged or ungaged.
Description of the Study Area
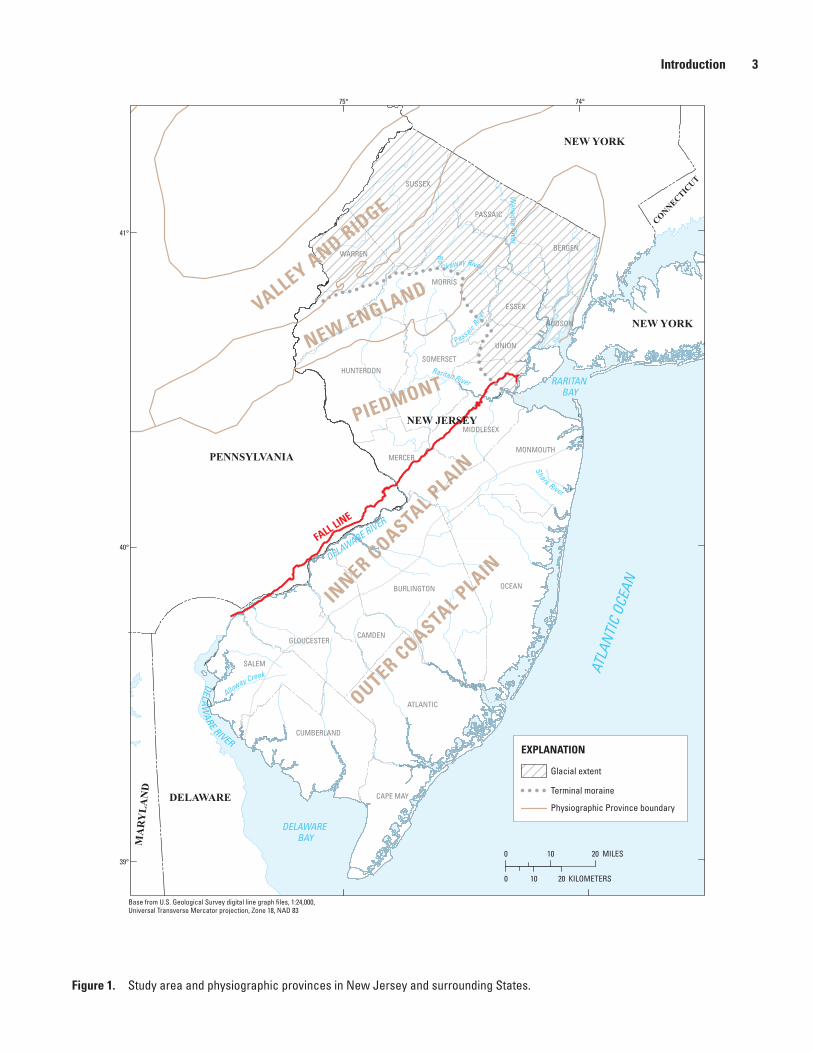
New Jersey, located in the North Atlantic slope adja-cent to the Atlantic Ocean, includes parts of four physio-graphic provinces: (1) the Coastal Plain, (2) the Piedmont, (3) the New England (Highlands), and (4) the Valley and Ridge (Fenneman, 1938) (fig. 1). Inasmuch as the last gla-cial advance covered about one-half of northern New Jersey, the Piedmont, New England (Highlands), and Valley and Ridge Provinces can be further subdivided into glaciated and unglaciated areas, as noted in figure 1. Because of the nature of surface and near-surface geologic materials in these two areas, this subdivision represents differences great enough to affect streamflow. In addition, the Piedmont and Coastal Plain physiographic provinces are separated by the western limit of the Coastal Plain sediments, or the Fall Line.
The Fall Line is a low, eastward-facing, largely buried cliff extending more or less parallel to the Atlantic coastline from New Jersey to the Carolinas. The Fall Line is the western limit of the coastal sediments separating the hard Paleozoic metamorphic rocks of the Piedmont physiographic province to the west from softer, more gently dipping Mesozoic and Ter-tiary sedimentary rocks of the Coastal Plain to the east. This erosional scarp, in many ways, affects the behavior of stream-flow due to the nature of the underlying geology. For example, whether a stream channel is steeply sloped with swift-moving waters or is more gently sloped with typically lower stream velocities is, to varying degrees, dependent on the underlying geology and streambed material.
The Coastal Plain has been subdivided into an Inner and an Outer Coastal Plain. The division of the Coastal Plain roughly follows the topographic high of the underlying sedi-ments. The Inner Coastal Plain extends from the Fall Line at the northern reach and the topographic high of the Coastal Plain to the southern reach. The extent of the Outer Coastal Plain covers the low-elevation region from the topographic high to the Atlantic Ocean.
Previous Investigations
The techniques presented in this report update tech-niques previously used for estimating flood magnitude and
2Continuous-record streamflow-gaging staion is a site on a stream or canal where observations of gage height or discharge are obtained, with sufficient frequency to define daily mean values and variations within a day.
3Partial-record station is a site where discrete measurements of one or more hydrologic parameters are obtained over a period of time without continuous data being recorded or computed. A common example is a crest-stage gage partial-record station, at which only peak stages and flows are recorded.
Introduction 3
Figure 1. Study area and physiographic provinces in New Jersey and surrounding States.
Shark River
Raritan River
Passaic Riv
er
Ro
c kaway River
Alloway Creek
Wana que Rive r
OUTER COASTAL P
LAIN
INNER C
OASTAL PLAIN
PIEDMONT
NEW ENGLANDVALLEY AND RID
GE
ATLA
NTI
C OC
EAN
NEW YORK
PENNSYLVANIA
MA
RY
LA
ND
NEW YORK
DELAWARE BAY
RARITAN BAY
FALL LINE
0 10 20 MILES
0 10 20 KILOMETERS
DELAW
ARE RIVER
DELAWARE RIVER
74°75°
41°
40°
39°
EXPLANATION
Glacial extent
Terminal moraine
Base from U.S. Geological Survey digital line graph files, 1:24,000, Universal Transverse Mercator projection, Zone 18, NAD 83
Physiographic Province boundary
NEW JERSEY
DELAWARE
CONNECTICUT
OCEAN
SUSSEX
ATLANTIC
BURLINGTON
MORRIS
SALEM
WARREN
MONMOUTH
CUMBERLAND
HUNTERDON
BERGEN
MERCER
ESSEX
UNION
CAPE MAY
MIDDLESEX
SOMERSET
CAMDENGLOUCESTER
PASSAIC
HUDSON
4 Methodology for Estimation of Flood Magnitude and Frequency for New Jersey Streams
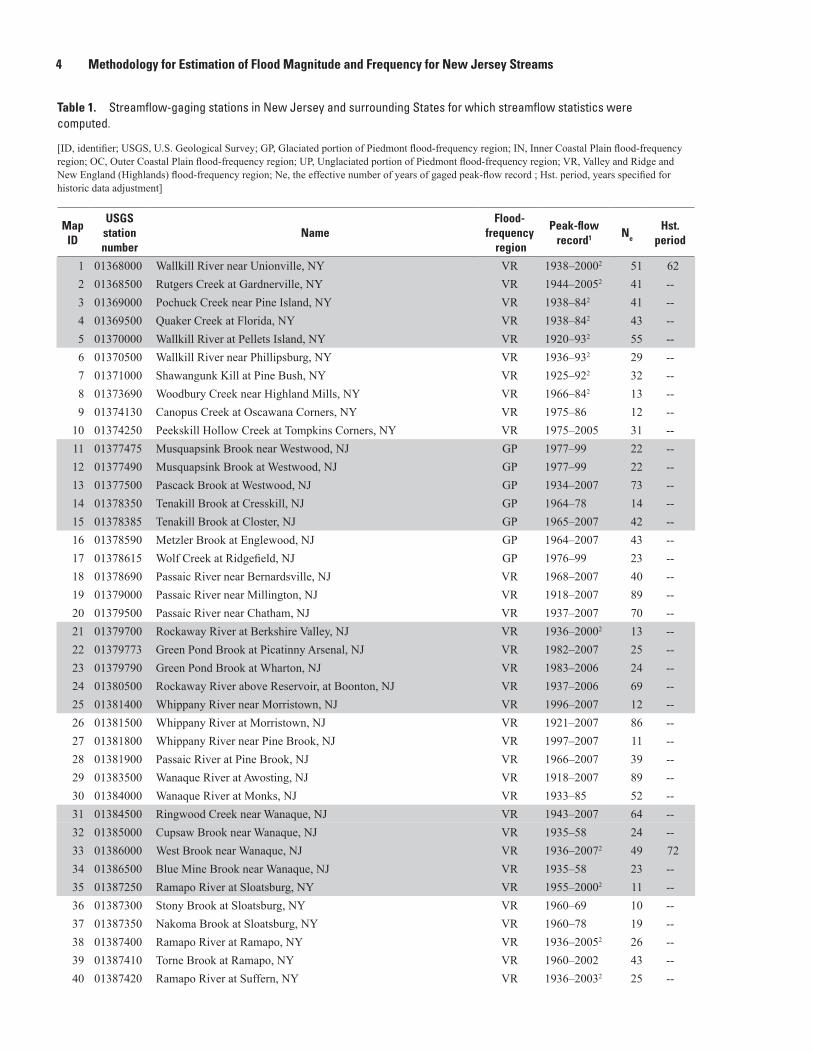
Table 1. Streamflow-gaging stations in New Jersey and surrounding States for which streamflow statistics were computed.—Continued
[ID, identifier; USGS, U.S. Geological Survey; GP, Glaciated portion of Piedmont flood-frequency region; IN, Inner Coastal Plain flood-frequency region; OC, Outer Coastal Plain flood-frequency region; UP, Unglaciated portion of Piedmont flood-frequency region; VR, Valley and Ridge and New England (Highlands) flood-frequency region; Ne, the effective number of years of gaged peak-flow record ; Hst. period, years specified for historic data adjustment]
Map ID
USGS station number
NameFlood-
frequency region
Peak-flow record1 Ne
Hst. period
1 01368000 Wallkill River near Unionville, NY VR 1938–20002 51 622 01368500 Rutgers Creek at Gardnerville, NY VR 1944–20052 41 --3 01369000 Pochuck Creek near Pine Island, NY VR 1938–842 41 --4 01369500 Quaker Creek at Florida, NY VR 1938–842 43 --5 01370000 Wallkill River at Pellets Island, NY VR 1920–932 55 --6 01370500 Wallkill River near Phillipsburg, NY VR 1936–932 29 --7 01371000 Shawangunk Kill at Pine Bush, NY VR 1925–922 32 --8 01373690 Woodbury Creek near Highland Mills, NY VR 1966–842 13 --9 01374130 Canopus Creek at Oscawana Corners, NY VR 1975–86 12 --
10 01374250 Peekskill Hollow Creek at Tompkins Corners, NY VR 1975–2005 31 --11 01377475 Musquapsink Brook near Westwood, NJ GP 1977–99 22 --12 01377490 Musquapsink Brook at Westwood, NJ GP 1977–99 22 --13 01377500 Pascack Brook at Westwood, NJ GP 1934–2007 73 --14 01378350 Tenakill Brook at Cresskill, NJ GP 1964–78 14 --15 01378385 Tenakill Brook at Closter, NJ GP 1965–2007 42 --16 01378590 Metzler Brook at Englewood, NJ GP 1964–2007 43 --17 01378615 Wolf Creek at Ridgefield, NJ GP 1976–99 23 --18 01378690 Passaic River near Bernardsville, NJ VR 1968–2007 40 --19 01379000 Passaic River near Millington, NJ VR 1918–2007 89 --20 01379500 Passaic River near Chatham, NJ VR 1937–2007 70 --21 01379700 Rockaway River at Berkshire Valley, NJ VR 1936–20002 13 --22 01379773 Green Pond Brook at Picatinny Arsenal, NJ VR 1982–2007 25 --23 01379790 Green Pond Brook at Wharton, NJ VR 1983–2006 24 --24 01380500 Rockaway River above Reservoir, at Boonton, NJ VR 1937–2006 69 --25 01381400 Whippany River near Morristown, NJ VR 1996–2007 12 --26 01381500 Whippany River at Morristown, NJ VR 1921–2007 86 --27 01381800 Whippany River near Pine Brook, NJ VR 1997–2007 11 --28 01381900 Passaic River at Pine Brook, NJ VR 1966–2007 39 --29 01383500 Wanaque River at Awosting, NJ VR 1918–2007 89 --30 01384000 Wanaque River at Monks, NJ VR 1933–85 52 --31 01384500 Ringwood Creek near Wanaque, NJ VR 1943–2007 64 --32 01385000 Cupsaw Brook near Wanaque, NJ VR 1935–58 24 --33 01386000 West Brook near Wanaque, NJ VR 1936–20072 49 7234 01386500 Blue Mine Brook near Wanaque, NJ VR 1935–58 23 --35 01387250 Ramapo River at Sloatsburg, NY VR 1955–20002 11 --36 01387300 Stony Brook at Sloatsburg, NY VR 1960–69 10 --37 01387350 Nakoma Brook at Sloatsburg, NY VR 1960–78 19 --38 01387400 Ramapo River at Ramapo, NY VR 1936–20052 26 --39 01387410 Torne Brook at Ramapo, NY VR 1960–2002 43 --40 01387420 Ramapo River at Suffern, NY VR 1936–20032 25 --

Introduction 5
Table 1. Streamflow-gaging stations in New Jersey and surrounding States for which streamflow statistics were computed.—Continued
[ID, identifier; USGS, U.S. Geological Survey; GP, Glaciated portion of Piedmont flood-frequency region; IN, Inner Coastal Plain flood-frequency region; OC, Outer Coastal Plain flood-frequency region; UP, Unglaciated portion of Piedmont flood-frequency region; VR, Valley and Ridge and New England (Highlands) flood-frequency region; Ne, the effective number of years of gaged peak-flow record ; Hst. period, years specified for historic data adjustment]
Map ID
USGS station number
NameFlood-
frequency region
Peak-flow record1 Ne
Hst. period
41 01387450 Mahwah River near Suffern, NY GP 1959–2007 47 --42 01387500 Ramapo River near Mahwah, NJ VR 1911–2007 96 10343 01387880 Pond Brook at Oakland, NJ VR 1972–2007 35 --44 01388000 Ramapo River at Pompton Lakes, NJ VR 1921–2006 85 --45 01388500 Pompton River at Pompton Plains, NJ VR 1940–2007 67 10346 01389030 Preakness Brook near Preakness, NJ GP 1979–2007 29 --47 01389500 Passaic River at Little Falls, NJ VR 1898–2007 109 19748 01389534 Peckman River at Ozone Avenue, at Verona, NJ GP 1978–2007 29 6149 01389765 Molly Ann Brook at North Haledon, NJ GP 1978–2007 29 6250 01389900 Fleischer Brook at Market Street, at Elmwood Park, NJ GP 1968–2007 39 --51 01390450 Saddle River at Upper Saddle River, NJ GP 1965–2007 42 --52 01390500 Saddle River at Ridgewood, NJ GP 1954–2007 53 6253 01390810 Hohokus Brook at Allendale, NJ GP 1968–2007 39 --54 01390900 Ramsey Brook at Allendale, NJ GP 1974–2007 33 --55 01391000 Hohokus Brook at Ho-Ho-Kus, NJ GP 1953–2007 54 --56 01391485 Sprout Brook at Rochelle Park, NJ GP 1965–78 13 --57 01391500 Saddle River at Lodi, NJ GP 1966–2007 42 --58 01392000 Weasel Brook at Clifton, NJ GP 1969–99 30 6159 01392170 Third River at Bloomfield, NJ GP 1988–2007 19 --60 01392210 Third River at Passaic, NJ GP 1978–99 21 2461 01392500 Second River at Belleville, NJ GP 1937–99 59 --62 01393450 Elizabeth River at Ursino Lake, at Elizabeth, NJ GP 1952–2007 55 --63 01394000 West Branch Rahway River at Millburn, NJ GP 1985–2007 22 9064 01394500 Rahway River near Springfield, NJ GP 1937–2007 67 --65 01395000 Rahway River at Rahway, NJ GP 1921–2007 86 --66 01396000 Robinsons Branch at Rahway, NJ GP 1942–2007 66 6967 01396500 South Branch Raritan River near High Bridge, NJ VR 1919–2007 90 11168 01396582 Spruce Run at Main Street, at Glen Gardner, NJ VR 1979–2007 26 --69 01396660 Mulhockaway Creek at Van Syckel, NJ UP 1977–2007 30 --70 01397000 South Branch Raritan River at Stanton, NJ UP 1915–2007 92 --71 01397500 Walnut Brook near Flemington, NJ UP 1936–2007 71 --72 01398000 Neshanic River at Reaville, NJ UP 1930–2007 77 --73 01398045 Back Brook tributary near Ringoes, NJ UP 1978–2007 29 --74 01398107 Holland Brook at Readington, NJ UP 1981–2007 26 --75 01398500 North Branch Raritan River near Far Hills, NJ VR 1921–2007 86 8876 01399190 Lamington (Black) River at Succasunna, NJ VR 1988–2000 12 --77 01399200 Lamington (Black) River near Ironia, NJ VR 1986–2000 14 --78 01399500 Lamington (Black) River near Pottersville, NJ VR 1921–2007 86 --79 01399510 Upper Cold Brook near Pottersville, NJ VR 1974–99 25 --80 01399525 Axle Brook near Pottersville, NJ UP 1978–2007 29 --

6 Methodology for Estimation of Flood Magnitude and Frequency for New Jersey Streams
Table 1. Streamflow-gaging stations in New Jersey and surrounding States for which streamflow statistics were computed.—Continued
[ID, identifier; USGS, U.S. Geological Survey; GP, Glaciated portion of Piedmont flood-frequency region; IN, Inner Coastal Plain flood-frequency region; OC, Outer Coastal Plain flood-frequency region; UP, Unglaciated portion of Piedmont flood-frequency region; VR, Valley and Ridge and New England (Highlands) flood-frequency region; Ne, the effective number of years of gaged peak-flow record ; Hst. period, years specified for historic data adjustment]
Map ID
USGS station number
NameFlood-
frequency region
Peak-flow record1 Ne
Hst. period
81 01399670 South Branch Rockaway Creek at Whitehouse Station, NJ UP 1977–2007 30 --82 01399700 Rockaway Creek at Whitehouse, NJ UP 1980–99 19 --83 01399830 North Branch Raritan River at North Branch, NJ UP 1979–2007 28 11184 01400000 North Branch Raritan River near Raritan, NJ UP 1922–2007 85 11185 01400300 Peters Brook near Raritan, NJ UP 1980–99 19 11186 01400350 Macs Brook at Somerville, NJ UP 1981–95 14 --87 01400500 Raritan River at Manville, NJ UP 1911–2007 96 11188 01400630 Millstone River Southfield Road, near Grovers Mill, NJ IN 1976–2000 24 --89 01400730 Millstone River at Plainsboro, NJ IN 1964–2000 36 --90 01400775 Bear Brook at Route 535, near Locust Corner, NJ IN 1976–2000 24 --91 01400795 Bear Brook at Route 571, near Grovers Mill, NJ IN 1986–2000 15 --92 01400822 Little Bear Brook at Penns Neck, NJ IN 1976–95 19 --93 01400850 Woodsville Brook at Woodsville, NJ UP 1961–80 19 --94 01400900 Stony Brook at Glenmoore, NJ UP 1959–99 40 --95 01400930 Baldwins Creek at Pennington, NJ UP 1959–2007 48 --96 01400947 Stony Brook at Pennington, NJ UP 1965–78 13 --97 01400950 Hart Brook near Pennington, NJ UP 1967–2007 39 --98 01400960 Honey Branch near Mount Rose, NJ UP 1968–78 10 --99 01400970 Honey Branch near Rosedale, NJ UP 1968–78 10 --
100 01401000 Stony Brook at Princeton, NJ UP 1953–2007 54 --101 01401160 Duck Pond Run near Princeton Junction, NJ IN 1979–2000 21 --102 01401200 Duck Pond Run at Clarksville, NJ UP 1966–85 19 --103 01401301 Millstone River at Carnegie Lake, at Princeton, NJ UP 1933–20072 50 84104 01401520 Beden Brook near Hopewell, NJ UP 1966–85 19 --105 01401595 Rock Brook near Blawenburg, NJ UP 1967–2007 40 --106 01401600 Beden Brook near Rocky Hill, NJ UP 1966–2007 40 --107 01401650 Pike Run at Belle Mead, NJ UP 1979–2007 28 197108 01401870 Six Mile Run near Middlebush, NJ UP 1967–2007 40 --109 01402000 Millstone River at Blackwells Mills, NJ UP 1920–2007 87 --110 01402600 Royce Brook tributary near Belle Mead, NJ UP 1978–2005 29 195111 01403060 Raritan River below Calco Dam, at Bound Brook, NJ UP 1933–2007 76 306112 01403150 West Branch Middle Brook near Martinsville, NJ UP 1979–2007 28 --113 01403395 Blue Brook at Seeley Pond Dam, near Berkeley Heights, NJ UP 1979–2007 28 110114 01403400 Green Brook at Seeley Mills, NJ UP 1968–2007 39 110115 01403500 Green Brook at Plainfield, NJ UP 1935–2007 72 --116 01403535 East Branch Stony Brook at Best Lake, at Watchung, NJ UP 1979–2007 28 110117 01403540 Stony Brook at Watchung, NJ UP 1974–2007 33 110118 01403600 Green Brook at Rock Avenue, at Plainfield, NJ UP 1972–20072 25 110119 01403900 Bound Brook at Middlesex, NJ UP 1973–2007 34 --120 01405030 Lawrence Brook at Weston Mills, NJ UP 1989–2007 19 --

Introduction 7
Table 1. Streamflow-gaging stations in New Jersey and surrounding States for which streamflow statistics were computed.—Continued
[ID, identifier; USGS, U.S. Geological Survey; GP, Glaciated portion of Piedmont flood-frequency region; IN, Inner Coastal Plain flood-frequency region; OC, Outer Coastal Plain flood-frequency region; UP, Unglaciated portion of Piedmont flood-frequency region; VR, Valley and Ridge and New England (Highlands) flood-frequency region; Ne, the effective number of years of gaged peak-flow record ; Hst. period, years specified for historic data adjustment]
Map ID
USGS station number
NameFlood-
frequency region
Peak-flow record1 Ne
Hst. period
121 01405300 Matchaponix Brook at Spotswood, NJ IN 1956–67 11 --122 01405400 Manalapan Brook at Spotswood, NJ IN 1956–2007 51 --123 01405500 South River at Old Bridge NJ IN 1940–88 49 --124 01407000 Matawan Creek at Matawan, NJ IN 1933–55 22 --125 01407290 Big Brook near Marlboro, NJ IN 1980–2007 28 --126 01407500 Swimming River near Red Bank, NJ IN 1922–2007 85 87127 01407705 Shark River near Neptune City, NJ OC 1966–2007 41 --128 01407760 Jumping Brook near Neptune City, NJ OC 1966–2007 41 --129 01407830 Manasquan River near Georgia, NJ OC 1968–95 27 --130 01408000 Manasquan River at Squankum, NJ OC 1931–2007 76 --131 01408015 Mingamahone Brook at Farmingdale, NJ OC 1968–2007 39 --132 01408029 Manasquan River near Allenwood, NJ OC 1969–2007 39 --133 01408120 North Branch Metedeconk River near Lakewood, NJ OC 1972–2007 35 --134 01408500 Toms River near Toms River, NJ OC 1928–2007 79 --135 01409000 Cedar Creek at Lanoka Harbor, NJ OC 1968–2007 39 --136 01409095 Oyster Creek near Brookville, NJ OC 1965–85 20 26137 01409280 Westecunk Creek at Stafford Forge, NJ OC 1985–2007 22 --138 01409375 Mullica River near Atco, NJ OC 1985–99 14 25139 01409400 Mullica River near Batsto, NJ OC 1957–2007 50 --140 01409403 Wildcat Branch at Chesilhurst, NJ OC 1974–87 13 --141 01409500 Batsto River at Batsto, NJ OC 1927–2005 78 --142 01409810 West Branch Wading River near Jenkins, NJ OC 1975–20072 25 --143 01410000 Oswego River at Harrisville, NJ OC 1930–2007 77 --144 01410150 East Branch Bass River near New Gretna, NJ OC 1977–2007 30 --145 01410810 Fourmile Branch at New Brooklyn, NJ OC 1972–91 19 --146 01411000 Great Egg Harbor River at Folsom, NJ OC 1925–2007 82 --147 01411120 Deep Run at US Route 40, at Buena, NJ OC 1997–2007 11 --148 01411122 Little Deep Run at NJ Route 54, at Landisville, NJ OC 1997–2007 11 --149 01411300 Tuckahoe River at Head of River, NJ OC 1970–2007 37 --150 01411456 Little Ease Run near Clayton, NJ OC 1988–2007 20 --151 01411500 Maurice River at Norma, NJ OC 1932–2007 75 140152 01412000 Menantico Creek near Millville, NJ OC 1951–95 44 --153 01412500 West Branch Cohansey River at Seeley, NJ OC 1953–2007 54 --154 01412800 Cohansey River at Seeley, NJ OC 1985–2007 22 --155 01440000 Flat Brook near Flatbrookville, NJ VR 1923–2007 84 --156 01443280 East Branch Paulins Kill near Lafayette, NJ VR 1993–2007 15 --157 01443500 Paulins Kill at Blairstown, NJ VR 1923–2007 84 --158 01445000 Pequest River at Huntsville, NJ VR 1945–2007 63 --159 01445430 Pequest River at Townsbury, NJ VR 1977–93 16 --160 01445490 Furnace Brook at Oxford, NJ VR 1965–78 13 --

8 Methodology for Estimation of Flood Magnitude and Frequency for New Jersey Streams
Table 1. Streamflow-gaging stations in New Jersey and surrounding States for which streamflow statistics were computed.—Continued
[ID, identifier; USGS, U.S. Geological Survey; GP, Glaciated portion of Piedmont flood-frequency region; IN, Inner Coastal Plain flood-frequency region; OC, Outer Coastal Plain flood-frequency region; UP, Unglaciated portion of Piedmont flood-frequency region; VR, Valley and Ridge and New England (Highlands) flood-frequency region; Ne, the effective number of years of gaged peak-flow record ; Hst. period, years specified for historic data adjustment]
Map ID
USGS station number
NameFlood-
frequency region
Peak-flow record1 Ne
Hst. period
161 01445500 Pequest River at Pequest, NJ VR 1951–2007 56 --162 01446000 Beaver Brook near Belvidere, NJ VR 1929–2007 78 --163 01446564 Lapahannock Creek at Ridge Road, at Roxburg, NJ VR 1995–2006 12 --164 01446600 Martins Creek near East Bangor, PA VR 1961–86 26 --165 01451500 Little Lehigh Creek near Allentown, PA VR 1935–20052 60 --166 01452500 Monocacy Creek at Bethlehem, PA VR 1945–2005 57 --167 01455200 Pohatcong Creek at New Village, NJ VR 1962–2000 38 --168 01456000 Musconetcong River near Hackettstown, NJ VR 1925–2000 75 --169 01457000 Musconetcong River near Bloomsbury, NJ VR 1918–2007 89 --170 01459010 Delaware River tributary at Byram, NJ UP 1945–20072 14 63171 01459500 Tohickon Creek near Pipersville, PA UP 1936–20052 40 --172 01462197 Moores Creek tributary at Valley Road, near Lambertville, NJ UP 1995–2007 13 --173 01463620 Assunpink Creek near Clarksville, NJ IN 1982–2007 25 --174 01463812 Shabakunk Creek trib at Texas Avenue, near Lawrenceville, NJ UP 1995–2007 13 --175 01464000 Assunpink Creek at Trenton, NJ UP 1924–20072 42 125176 01464400 Crosswicks Creek at New Egypt, NJ OC 1968–94 26 --177 01464405 Stony Ford Brook at New Egypt, NJ OC 1978–20072 14 --178 01464500 Crosswicks Creek at Extonville, NJ IN 1940–2007 67 69179 01464515 Doctors Creek at Allentown, NJ IN 1968–95 27 --180 01464520 Doctors Creek at Groveville, NJ IN 1967–79 12 --181 01464524 Crosswicks Creek trib 3 at US Route 206, near Bordentown, NJ IN 1995–2007 13 --182 01464525 Thorton Creek at Bordentown, NJ IN 1995–2007 13 --183 01464530 Blacks Creek at Mansfield Square, NJ IN 1977–95 18 --184 01464533 Crafts Creek at NJ Route 68, at Georgetown, NJ IN 1995–2007 13 --185 01464538 Crafts Creek at Columbus, NJ IN 1977–2007 30 --186 01464582 Assiscunk Creek near Columbus, NJ IN 1978–95 17 --187 01465000 Neshaminy Creek at Rushland, PA UP 1885–19342 32 --188 01465500 Neshaminy Creek near Langhorne, PA UP 1933–2005 71 --189 01465785 Walton Run at Philadelphia, PA UP 1965–78 14 --190 01465790 Byberry Creek at Chalfont Road, Philadelphia, PA UP 1966–78 13 --191 01465798 Poquessing Creek at Grant Avenue, at Philadelphia, PA UP 1966–2005 40 --192 01465850 South Branch Rancocas Creek at Vincentown, NJ IN 1965–2007 42 68193 01465880 Southwest Branch Rancocas Creek at Medford, NJ IN 1990–2007 17 --194 01466000 Middle Branch Mt Misery Brook in Byrne State Forest, NJ OC 1953–78 25 --195 01466500 McDonalds Branch in Byrne State Forest, NJ OC 1953–2007 54 --196 01467000 North Branch Rancocas Creek at Pemberton, NJ IN 1921–2007 86 --197 01467042 Pennypack Creek at Pine Road, at Philadelphia, PA UP 1965–81 17 --198 01467048 Pennypack Creek at Lower Rhawn St. Brg., Philadelphia, PA UP 1966–2005 40 --199 01467057 Pompeston Creek at Cinnaminson, NJ IN 1974–88 14 --200 01467069 North Branch Pennsauken Creek near Moorestown, NJ IN 1974–88 14 --

Introduction 9
Table 1. Streamflow-gaging stations in New Jersey and surrounding States for which streamflow statistics were computed.—Continued
[ID, identifier; USGS, U.S. Geological Survey; GP, Glaciated portion of Piedmont flood-frequency region; IN, Inner Coastal Plain flood-frequency region; OC, Outer Coastal Plain flood-frequency region; UP, Unglaciated portion of Piedmont flood-frequency region; VR, Valley and Ridge and New England (Highlands) flood-frequency region; Ne, the effective number of years of gaged peak-flow record ; Hst. period, years specified for historic data adjustment]
Map ID
USGS station number
NameFlood-
frequency region
Peak-flow record1 Ne
Hst. period
201 01467081 South Branch Pennsauken Creek at Cherry Hill, NJ IN 1968–2007 39 --202 01467086 Tacony Creek at County Line, Philadelphia, PA UP 1966–86 21 --203 01467087 Frankford Creek at Castor Avenue, Philadelphia, PA UP 1982–2005 24 --204 01467130 Cooper River at Kirkwood, NJ IN 1964–20042 17 64205 01467150 Cooper River at Haddonfield, NJ IN 1963–2007 44 67206 01467160 North Branch Cooper River near Marlton, NJ IN 1978–2004 26 64207 01467305 Newton Creek at Collingswood, NJ IN 1964–2007 43 --208 01467317 South Branch Newton Creek at Haddon Heights, NJ IN 1963–2007 44 --209 01467330 South Branch Big Timber Creek at Blackwood, NJ IN 1963–84 21 --210 01467351 North Branch Big Timber Creek, Laurel Road, Laurel Springs, NJ IN 1974–88 14 --211 01472198 Perkiomen Creek at East Greenville, PA VR 1982–2005 24 --212 01472199 West Branch Perkiomen Creek at Hillegass, PA VR 1982–2005 24 --213 01472500 Perkiomen Creek near Frederick, PA UP 1885–1913 29 --214 01473000 Perkiomen Creek at Graterford, PA UP 1915–2005 91 --215 01473120 Skippack Creek near Collegeville, PA UP 1966–94 29 --216 01475000 Mantua Creek at Pitman, NJ IN 1948–2007 59 124217 01475017 Bees Branch at Hurffville, NJ IN 1997–2007 11 --218 01475019 Mantua Creek at Salina, NJ IN 1974–88 14 --219 01475033 Plank Run at Glassboro, NJ IN 1997–2007 11 --220 01475300 Darby Creek at Waterloo Mills, near Devon, PA UP 1972–99 26 --221 01475510 Darby Creek near Darby, PA UP 1964–90 27 --222 01475530 Cobbs Creek at US Highway No 1, at Philadelphia, PA UP 1965–20052 18 --223 01475550 Cobbs Creek at Darby, PA UP 1964–90 27 --224 01475850 Crum Creek near Newtown Square, PA UP 1977–2005 29 --225 01476500 Ridley Creek at Moylan, PA UP 1932–852 31 --226 01477000 Chester Creek near Chester, PA UP 1932–2005 74 --227 01477102 Miery Run near Ewan, NJ IN 1997–2007 11 --228 01477110 Raccoon Creek at Mullica Hill, NJ IN 1980–99 19 118229 01477120 Raccoon Creek near Swedesboro, NJ IN 1966–2007 41 --230 01477480 Oldmans Creek near Harrisonville, NJ IN 1974–95 21 --231 01477500 Oldmans Creek near Woodstown, NJ IN 1932–19672 10 84232 01477800 Shellpot Creek at Wilmington, DE UP 1945–2004 59 --233 01478000 Christina River at Coochs Bridge, DE UP 1943–2003 61 --234 01478040 Christina River near Bear, DE UP 1979–91 12 --235 01482310 Doll Run at Red Lion, DE IN 1966–75 10 --236 01482500 Salem River at Woodstown, NJ IN 1946–2007 61 124237 01483000 Alloway Creek at Alloway, NJ IN 1952–72 20 --238 01483200 Blackbird Creek at Blackbird, DE IN 1952–2004 52 --239 01483290 Paw Paw Branch tributary near Clayton, DE IN 1966–75 10 --240 01483400 Sawmill Branch tributary near Blackbird, DE IN 1966–75 10 --

10 Methodology for Estimation of Flood Magnitude and Frequency for New Jersey Streams
Table 1. Streamflow-gaging stations in New Jersey and surrounding States for which streamflow statistics were computed.—Continued
[ID, identifier; USGS, U.S. Geological Survey; GP, Glaciated portion of Piedmont flood-frequency region; IN, Inner Coastal Plain flood-frequency region; OC, Outer Coastal Plain flood-frequency region; UP, Unglaciated portion of Piedmont flood-frequency region; VR, Valley and Ridge and New England (Highlands) flood-frequency region; Ne, the effective number of years of gaged peak-flow record ; Hst. period, years specified for historic data adjustment]
Map ID
USGS station number
NameFlood-
frequency region
Peak-flow record1 Ne
Hst. period
241 01483500 Leipsic River near Cheswold, DE IN 1943–75 33 --242 01483700 St. Jones River at Dover, DE IN 1958–2004 47 --243 01483720 Puncheon Branch at Dover, DE IN 1966–75 10 --244 01484000 Murderkill River near Felton, DE IN 1932–992 31 --245 01484002 Murderkill River tributary near Felton, DE IN 1966–75 10 --246 01484050 Pratt Branch near Felton, DE IN 1966–75 10 --247 01488500 Marshyhope Creek near Adamsville, DE IN 1943–20052 59 --248 01489000 Faulkner Branch at Federalsburg, MD IN 1950–91 42 --249 01490600 Meredith Branch near Sandtown, DE IN 1966–75 10 --250 01490800 Oldtown Branch at Goldsboro, MD IN 1967–76 10 --251 01491000 Choptank River near Greensboro, MD IN 1948–2005 58 --252 01491010 Sangston Prong near Whiteleysburg, DE IN 1966–75 10 --253 01491050 Spring Branch near Greensboro, MD IN 1967–76 10 --254 01495000 Big Elk Creek at Elk Mills, MD UP 1884–20042 73 --1 Peak-flow record is given in water years, the 12-month period from October 1 through September 30, with the water year designated by the
calendar year in which it ends.2 Years given for the peak-flow record may have gaps as a result of a gage being discontinued for a number of years due to loss of funding.

Methods of Study 11
frequency. Thomas (1964) presented a peak-flow magnitude and frequency estimating procedure based on the flood-index method outlined by Dalrymple (1960). Later analyses by the same method resulted in the estimating procedure presented by Tice (1968). McCall and Lendo (1970) used a multiple-regression method to develop yet another estimating technique. Stankowski (1972) related population density in New Jersey to the percentage of drainage areas occupied by manmade impervious surface cover in order to simplify the estimation of manmade impervious surface cover under future or past conditions. Stankowski (1974) developed a set of equations based on regression techniques that were intended for use throughout the State. Drainage area, percentage of lakes and wetland (storage), channel slope, and percentage of manmade impervious surface cover are basin characteristics input to these regression equations. These equations, presented in NJDEP Special Report 38 (Stankowski, 1974), are the most recent equations for estimating flood magnitude in New Jersey prior to the present study.
Methods of StudyThe publication “Guidelines for Determining Flood Flow
Frequency, Bulletin 17B” (Interagency Advisory Committee on Water Data, 1982), first published as “A Uniform Tech-nique for Determining Flood Flow Frequencies, Bulletin 15” (Water Resources Council, 1967), provides recommendations for the computation of peak-flow frequency estimates, which are based on measurements of peak-flow data at unregulated streamflow-gaging stations.
An estimation of flood magnitude and frequency for a specific location can be developed by analyzing the annual peak flows at a streamflow-gaging station. Typically, these estimates are reported in terms of exceedance probability, or they may be presented in terms of recurrence intervals, for example the 100-year flood. Exceedance probability is defined as the probability of exceeding a specified flow within a 1-year period and is usually expressed as a fraction less than 1.0. It can also be expressed as a percentage less than 100, the recip-rocal of recurrence interval. Recurrence interval is the aver-age interval of time, in years, within which annual maximum flood peaks were greater than a particular value. For example, a peak streamflow at the 100-year recurrence interval would be expected to be exceeded, on average, once every 100 years. However, the 100-year flood may occur more frequently and, indeed, may occur more than once in a single year. The des-ignation “100-year flood” does not mean that peak flow will occur only once every 100 years; it is a probability of occur-rence, not a certainty. The 100-year flood means a recurrence interval of 100 years has an annual exceedance probability of 0.01 (1 percent), hence the definition that there is a 1 percent chance the peak flow will be exceeded in any given year.
Different procedures are used to estimate flood mag-nitude and frequency at streamflow-gaging stations and at
ungaged sites along a stream. Estimates for streamflow-gaging stations were made using log-Pearson type III statistics. The general procedure used to determine flood-frequency estimates for ungaged sites follows 10 steps. Details of each step are discussed farther on in the report.1. A group of continuous-record streamflow-gaging sta-
tions and crest-stage gages with 10 or more years of annual peak-flow data, located on unregulated or slightly flow-regulated non-tidal streams within New Jersey and surrounding States, is selected.
2. The initial log-Pearson type III flood-frequency estimates are computed (for each of the previously selected stations) by weighting the respective station skew with gener-alized-skew values taken from “Guidelines For Deter-mining Flood Flow Frequency” (Bulletin 17B) by the Interagency Advisory Committee on Water Data (1982). The log-Pearson type III estimates of flow at specific frequencies for the streamflow-gaging stations in New Jersey are computed by inputting annual maximum flood-peak flows measured at streamflow-gaging stations to the USGS computer program PeakFQ. The PeakFQ program and associated documentation can be downloaded from the Web at http://water.usgs.gov/software/PeakFQ/.
3. A trend analysis is conducted to identify streamflow-gaging stations with streamflow records that would require additional review and to determine whether the station should be included in the analysis or if the period of record for the station needed to be adjusted because of hydraulic modification in the drainage basin, such as channel modification or an addition of an upstream reservoir.
4. The initial station-skew coefficients are analyzed to deter-mine new generalized-skew values for the regions. Skew analysis was run on a subset of 119 streamflow-gaging stations from the flood-frequency study.
5. The flood-frequency estimates for the streamflow-gaging stations are re-computed by weighting the station skew with the new generalized-skew values, using the PeakFQ computer program.
6. Values for physical basin characteristics are computed to quantify their relation to annual peak streamflow for the drainage basin associated with each streamflow-gaging station.
7. Regression analysis is used to develop equations for use in estimating flood frequencies and magnitudes at ungaged sites in the State or regions.
8. Flood-frequency estimates and basin characteristics are analyzed to determine whether relations are homogenous throughout the State or if the State should be divided into multiple regions.

12 Methodology for Estimation of Flood Magnitude and Frequency for New Jersey Streams
9. The accuracy of the regression equations developed is assessed for estimating flood magnitudes and frequencies for ungaged sites.Use of these steps results in the selection of peak-flow
data and basin characteristics from 254 continuous-record streamflow-gaging stations and crest-stage gages in New Jersey and surrounding States for use in the flood-frequency analysis. The State was divided into five regions for this flood-frequency analysis.
Peak-Flow Data
The streamflow data forming the basis of the current study are the records of annual maximum flood-peak flows measured for a group of USGS streamflow-gaging stations and crest-stage gages located throughout New Jersey, plus records for selected sites in the adjoining States of New York, Pennsylvania, Delaware, and Maryland (fig. 2; table 2). Peak-flow data from surrounding states were used because political and civil boundaries ignore physiographic, geologic, and drainage-basin characteristics. The peak-flow data from surrounding States were included to better define the rela-tions between drainage-basin characteristics and annual peak streamflow, with the expected result of more accurate regional regression equations. The drainage areas of the streamflow-gaging stations range from 0.18 to 779 mi2. The distribution of streamflow-gaging stations used in this study relative to drainage-area size is shown in figure 3.
A number of revisions have been made to the original 1967 publication, Bulletin 15 (Water Resources Council, 1967), reflecting advances in the understanding of flood-flow frequency determination and associated techniques; Bulletin 17B is the most current publication. Among other guidelines, Bulletin 17B outlines methods and weighting techniques for the inclusion of historical annual streamflow peaks that may have been inferred from newspaper accounts, personal
interviews, anecdotal evidence, or indirect measurements of discharge from past floods. Annual peak water levels consid-ered to be reasonable on the basis of information from nearby streamflow-gaging stations have been included in the annual peak-flow records for New Jersey and weighted accordingly. In many instances, this type of information can dramatically extend the period of record4 used for analysis. For each sta-tion in table 1, professional judgment was used to determine whether to include the information in the computation of regional regression equations. The historical adjustment of confirmed records of annual peak streamflows can have a substantial effect on the final predicted flood-flow frequencies for a location.
Trend Analysis
In New Jersey, unlike many more rural States, there are few watersheds that have not undergone some type of anthro-pogenic change. Changes such as development from wood-lands and open farmland to suburban housing and shopping centers; greater industrial development; the accompanying infrastructure of roads, bridges, and water-control structures such as retention and detention basins; and the straightening and channelization of streams have occurred. In other areas, drainage basins have evolved from undeveloped woodlands to nearly clear-cut farmland, then allowed to revert to mostly for-ested basins. All of these changes in land use can affect peak streamflow and flood frequency. Add to this climate change in the form of global warming or the natural cyclical patterns in precipitation, or the combination of these influences, and a complex scenario emerges for developing regional regression equations for estimating flood-flow frequency.
Bulletin 17B presents guidelines for making assumptions about data, including climate trends and watershed changes. To better understand the possible effects of these changes on flood peaks, an analysis of trends was conducted for 191 streamflow-gaging stations in an attempt to identify signifi-cant trends or discontinuities. All 191 stations are located in New Jersey and New York and were considered for inclusion in the flood-frequency study, although some were not used. Streamflow-gaging stations located in Delaware, Maryland, and Pennsylvania were not included in the trend study because these stations were used in a flood-frequency analysis for Delaware/Maryland and Pennsylvania (Ries and Dillow, 2006; Roland and Stuckey, 2008). The trend analysis was conducted to identify streamflow-gaging stations that would require additional review of the annual streamflow record and to determine whether the station should be included in the study or whether the period of record to be used should be adjusted. As discussed below, four stations with significant trends were found to have discontinuities in peak flows around the time of channel modifications; the period of record used in the analy-sis was adjusted accordingly.
Table 2. Number of streamflow-gaging stations with records included in the regression analysis of New Jersey streams, by flood-frequency region and State.
[NJ, New Jersey; PA, Pennsylvania; NY, New York; DE, Delaware; MD, Maryland]
Flood-frequency region
StateTotal
NJ PA NY DE MD
Glaciated Piedmont 27 0 1 0 0 28Inner Coastal Plain 46 0 0 13 4 63Outer Coastal Plain 32 0 0 0 0 32Unglaciated Piedmont 45 20 0 3 1 69Valley and Ridge 41 5 16 0 0 62All 191 25 17 16 5 254 4The time period for which records have been published for the Station.

Methods of Study 13
!
!
115
113
OCEAN
SUSSEX
ATLANTIC
BURLINGTON
MORRIS
SALEM
WARREN
MONMOUTH
CUMBERLAND
HUNTERDON
BERGEN
MERCER
ESSEX
UNION
CAPE MAY
MIDDLESEX
SOMERSET
CAMDEN
GLOUCESTER
PASSAIC
HUDSON
98
7
6
5
4
3
2
1
79 78
77
76
75
69
6665
10
254
253
251250 249
248
247
247245
244
243242
241
240
239
238
237
236
235
234233
232
230231
229228
226225
224
223
222
221
220
219
218
215
214
213
212
211
211
208207
206205
205
203202
201 200
199
197
196
195
194193
192
192
191
188
187
186185 184
183182180
179
177176
171170
169
168
167
166
165
164
163
162
161160
159
158157
156155
154
153
152
151
150
149
148147
146
145
143
143
142
141xxxx
139
138
137
136
135
134
133
132
131130
129128
126125
124123122
121
120
127
178181
190
198
252
140216217
209
227
NEW YORK
PENNSYLVANIA
CONNECTICUT
Delaware Bay
Raritan Bay
0 20 40 MILES
0 20 40 KILOMETERS
74°75°76°
41°
40°
39°
Base from U.S. Geological Survey digital line graph files, 1:24,000, Universal Transverse Mercator projection, Zone 18, NAD 83
Chesapeake
Bay
DELAWARE
MARYLAND
Delaware R ive r
9998
9796
95
9493
92
91
90
89
88
8786
8584
838281
80 75
74
73
72
71
70
68 67 19
175
174 173
172
119
118117
116112
111
110109 108
107
106105
104103
102
100
6463
62
61
6059
585756
555453
52
51
49
48
47
4645
4443
42
4140
38
37 3635
3433 32
3130
29
28
27
2625
2423
2221
2019
18
17
16
15
14
13
39
12
11
50
ATLA
NTI
C O
CEA
N
EXPLANATION
Glaciated Valley and Ridge (VR)
Glaciated Piedmont (GP)
Unglaciated Piedmont (UP)
Inner Coastal Plain (IN)
Outer Coastal Plain (OC)
U.S. Geological Survey streamflow- gaging station—Number is map identifier listed in table 1
50
FALL LINE
Chatham
Trenton
A
A
B
B
Figure 2. Location of flood-frequency regions and streamflow-gaging stations in New Jersey and surrounding States for which flood-frequency estimates were computed.

14 Methodology for Estimation of Flood Magnitude and Frequency for New Jersey Streams
There are a number of possible reasons for trends in streamflow data:1. increased development and the resultant increase in
impervious cover;
2. hydraulic modifications as a result of the construction of reservoirs, rerouting of stormwater, or stream modifica-tions;
3. changes to forest cover within a basin; and
4. changes in precipitation cycles as a result of both short-term (drought of the 1960s or periods of heavy rain such as the 1970s) and long-term climate changes (global warming).
An increase in impervious cover would be expected to increase peak discharge, especially for the low-recurrence-interval floods such as the 2- and 5-year floods. For high-recurrence-interval floods, such as the 100-year flood, the effect may be less significant because, with increasing precipi-tation, even soils in forested areas tend to become saturated and act similarly to impervious surfaces. One factor that may reduce the effect of an increase in impervious cover in New Jersey is that stormwater detention basins have been required to be included in most new developments since about 1980.
A number of water-supply reservoir systems, at loca-tions such as the Rockaway, Wanaque, Hackensack, Pequan-nock, and Delaware Rivers, have been developed in New Jersey and New York over the past 100 years, and gaging
stations immediately downstream from these systems were not included in the development of the regional regression equa-tions because those stations could be subject to flow regula-tion. Flood-frequency estimates developed for the Federal Emergency Management Agency (FEMA) flood-insurance studies may be available for these gaging-station locations (Federal Emergency Management Agency, 1985, 1995, 2007).
Forest cover is a basin characteristic that was initially considered in the development of the flood-flow frequency regression equations but was not one of the final basin char-acteristics used. In general, as forest cover decreases it is expected that flood-peak flow will increase, and the opposite would occur with an increase in forest cover. Although this is what one would expect, streamflow-gaging station 01440000, Flat Brook near Flatbrookville, NJ, which is in a predomi-nantly forested area and is considered an index station (close to natural conditions) in New Jersey for both streamflow and water quality, had a significant positive trend in annual peak flow (that is, annual peak flows increased over the station’s period of record). Because forest land has probably increased over the last 100 years, and agriculture declined when much of the watershed was purchased for inclusion in the Dela-ware Water Gap National Recreation Area in the late 1960s, a possible explanation would be a climate shift that increased precipitation (Lins, 2005).
In much of New Jersey, forests were clear cut for timber or for agricultural use in the late 1800s. From the early 1900s to the present, much of this land has been reforested, has remained in agriculture, or has been urbanized. For example,
Figure 3. Distribution of streamflow-gaging stations used for the flood-frequency analysis, by drainage-basin area.
55
50
45
40
35
30
25
20
15
10
5
0
NUM
BER
OF G
AGIN
G ST
ATIO
NS
DRAINAGE-BASIN AREA, IN SQUARE MILES
less than1.00
1.01–2.00
2.01–5.00
5.01–10.0
10.1–20.0
20.1–50.0
50.1–100
101–200
201–500
501–1,000

Methods of Study 15
the watershed upstream from streamflow-gaging station 01403060, Raritan River below Calco Dam at Bound Brook, NJ, which has a drainage area of 779 mi2, had approximately 13 percent forest cover (Vermeule, 1894) in 1894, and in 2002 forest cover was determined to be 30 percent of the basin, even with the presence of development throughout the basin.
Climate change as a result of global warming or some other factor can affect the amount of precipitation. The effect of global warming on precipitation in New Jersey is not clear. Cyclical patterns of precipitation may last 1 or 2 months, 30 years, 500 years, or tens of thousands of years. A streamflow study by Lins (2005) indicates a shift to a wet period begin-ning in 1940 and an abrupt shift to increasing precipitation in the northeastern United States about 1970.
Initially, plots of the annual peak flows were visually examined for monotonic trends, step trends, or some combina-tion. Both monotonic trends and step trends were noted for some stations, warranting further analysis. SWSTAT was run to perform a Kendall’s tau test (Helsel and Hirsch, 2002) for the 191 streamflow-gaging stations. The SWSTAT program and accompanying documentation can be downloaded from http://water.usgs.gov/software/SWSTAT/.
The Kendall’s tau test is a nonparametric test that can be used to indicate the likelihood of an upward or downward trend over time. A nonparametric test is one that does not require a known or assumed probability distribution for the variables in question. The Kendall’s tau test is rank-based and does not depend specifically on the magnitudes of the data val-ues. This test is effective for identifying monotonic trends in streamflow because extreme values and skewness in the data have little effect on the outcome.
Within the Kendall’s tau test, the data are first ranked. Then the rank of each peak flow is compared to the rank of peaks following it in the time series. If the second value is consistently higher than the previous value, tau is positive. If the second value is consistently lower than the previous value, tau is negative. An equal number of positive and negative values indicates that a trend does not exist. Therefore, tau is a measure of the correlation between the series and time.
A trend is considered to be significant if the probability, p (p-value is the probability that a true null hypothesis of no trend is falsely rejected), is less than or equal to 0.05 (the 95-percent confidence interval). The slope of the trend line, then, gives some measure of the magnitude of the trend.
Although the Kendall’s tau test is relatively insensitive to the presence of individual outliers, a sequence of extreme occurrences near the beginning or end of the period of record could have an effect on the outcome of the test. Therefore, the record must be examined for multi-year sequences that are wetter or drier than normal at both ends of the period. The existence of a trend can be determined by the results of the Kendall’s tau test. If tau is positive, there is an upward trend; if tau is negative, there is a downward trend; and if tau is zero, no trend exists. Likewise, a small p-value indicates a rare event, and a large slope value indicates a trend of greater magnitude than that of a small slope.
The results of the trend analysis for New Jersey and New York streamflow-gaging-station annual peak-flow data show that, at a significance level of 95 percent, 35 stations have significant trends. Of these, 31 have positive trends, and 4 have negative trends. Each of the annual peak-flow series was plotted, and the results were studied. Four of the identi-fied stations—01391500 Saddle River at Lodi, NJ; 01392500, Second River at Belleville, NJ; 01393450, Elizabeth River at Ursino Lake, at Elizabeth, NJ; and 01445500, Pequest River at Pequest, NJ—showed significant discontinuities in years when substantial changes in channel geometry are believed to have occurred in the basins. Data from these four stations were reanalyzed with an adjusted period of record using only those peaks following the discontinuity before the stations were included in the flood-frequency study.
The remaining 31 stations that showed significant trends were reviewed, but no obvious hydraulic modification in the basin could be identified that would justify adjusting the period of record or removing the stations from the analysis. It was noted that 22 of the 31 stations showed a jump in peak flows around 1970. This abrupt increase in peak flows is consistent with the findings of Lins (2005) for portions of the United States, including the Mid-Atlantic Region. This jump may be indicative of a climate change. The remaining nine sta-tions had generally short records or were located in the south-ern part of the State. It was decided by the authors that in the absence of a specific reason, such as a channel modification or an upstream reservoir, for not including a gaging station or for adjusting the record used in the analysis, the full record of the station would be used in the analysis even if there was a significant trend. To attribute a cause and effect to each trend was beyond the scope of this study. In addition, some of the stations with significant trends were those that experienced what the authors considered to be very little change in basin characteristics over the period of record.
Generalized Skew Coefficients
The methodology used in this study to compute stream-flow for various recurrence intervals, as specified in Bulletin 17B (Interagency Advisory Committee on Water Data, 1982), includes a weighting of the station skew coefficient with the generalized skew coefficient. A national map with isolines of generalized skew values was published in the Bulletin 17B guidelines. Since that publication, other studies have shown that the generalized skew values for New Jersey were over-estimated by Bulletin 17B (for example, U.S. Army Corps of Engineers, 1983). Consequently, the generalized skew values for New Jersey were recomputed as part of the current study in an effort to improve streamflow estimates.
Bulletin 17B provides several guidelines for computing generalized skew, including the following:
• Any streamflow-gaging stations used for the study must have at least 25 years of systematic record, data routinely collected over a number of years;

16 Methodology for Estimation of Flood Magnitude and Frequency for New Jersey Streams
• At least 40 stations, or all stations within a 100-mile radius of the study area, are used in the analysis;
• For each station used in the analysis, the station skew is plotted at the centroid of the station basin and contoured to determine whether any topographic or geographic trends are apparent;
• A prediction equation, developed through linear-regres-sion techniques, is developed to relate the computed skew coefficients to watershed and climatic variables;
• The arithmetic mean of the station skews at a minimum of 20 stations in an area of homogeneous hydrology is computed; and
• The results from the method that provides the most accurate estimate of the skew coefficient, based on minimization of the mean-square error of computed skews, is used for the final computation.
For the current study, the State was partitioned into two regions, Coastal Plain and non-Coastal Plain, on the basis of differences in geology, topography, and typical hydrologic response to storms (fig. 4). The Fall Line provides the division between the two regions. From the data set of 254 streamflow-gaging stations analyzed for the peak-flow frequency study, 119 stations had 25 or more years of record and were used for the skew study. A list of the 119 streamflow-gaging stations used and the results of the skew study are presented in Appen-dix 1.
The centroid of the drainage basin for each streamflow-gaging station was determined and plotted with the station skew value. Isolines were created using the value of the station skew at each of the station centroids. The isolines were exam-ined for patterns, but no discernible patterns were evident. The mean and variance of the station skew were computed for each of the regions, and those results were used for the generalized skew and variance values.
The generalized skew is the average unbiased station skew from all stations with 25 or more years of record within each region. A bias-correction equation based on record length (years) is presented by Tasker and Stedinger (1986) as:
gN
Gii
i� = +
∗1 6 , (1)
where gi� is the unbiased station skew, Ni is the number of years of record for the
streamflow-gaging station, and Gi is the station skew coefficient.
This correction factor takes the number of years of record for the station into account and creates an unbiased skew value for the station. The average of the unbiased station skews
for the Coastal Plain and non-Coastal Plain regions is then computed, producing the generalized skew for each region. To determine the mean-square error (MSE) of the generalized skew, the difference between the unbiased station skew and the generalized skew for each station was computed, and the differences were averaged. The Bulletin 17B map skew MSE was compared with that of the generalized skew to determine the method that provides the most accurate estimate of the skew coefficient, based on minimization of the mean-square error of computed skews. The generalized skew MSE for both regions was lower; therefore, it was determined the general-ized skew would be used for the final computation.
Published estimates of generalized skew from Bulletin 17B maps for the entire State are approximately 0.7, using a total of 38 streamflow-gaging stations from New Jersey. In the current study, for non-Coastal Plain stations, the generalized skew was computed to be 0.41 with a standard error of 0.53, using data from a total of 75 streamflow-gaging stations—66 from New Jersey, 4 from New York, and 5 from Pennsylva-nia. These results agree well with those of past studies where generalized skew values from 0.3 to 0.4 were determined, depending on data used, using the same methods (U.S. Army Corps of Engineers, 1983; Lumia, 2000). For streamflow-gaging stations located in the Coastal Plain, the generalized skew was computed to be 0.156 with a standard error of 0.65, using data from 44 streamflow-gaging stations—38 from New Jersey and 6 from Delaware. The results for the Coastal Plain region agree well with those of past studies from neighboring States, such as Delaware, where a generalized skew value for the Coastal Plain of 0.204 was determined, depending on the data used, using the same methods (Ries and Dillow, 2006). Therefore, these estimates of generalized skew were used in the current study in the computation of flood frequencies at gaged sites, effectively separating streamflow-gaging stations into those that fall within the Coastal Plain physiographic province and those that do not.
The station and generalized skew coefficients can be combined to form a more accurate estimate of skew for a given streamflow-gaging station. The weighted skew can be computed using the following equation as presented in Bul-letin 17B:
GMSE G MSE G
MSE MSEWG G
G G
=+
+�
�
�( ) ( ) , (2)
where GW is the streamflow-gaging station’s weighted
skew coefficient, G is the streamflow-gaging station’s skew
coefficient, Ĝ is the streamflow-gaging station’s unbiased
generalized skew coefficient, MSEĜ is the mean-square error of the unbiased
generalized skew coefficient, and MSEG is the mean-square error of the streamflow-
gaging station’s skew coefficient.

Methods of Study 17
Figure 4. Streamflow-gaging stations in New Jersey and surrounding States with 25 or more years of record used for the skew study.
SUSSEX
ATLANTIC
BURLINGTON
MORRIS
SALEM
WARREN
MONMOUTH
CUMBERLAND
HUNTERDON
BERGEN
MERCER
ESSEX
CAPE MAY
MIDDLESEX
SOMERSET
CAMDENGLOUCESTER
PASSAIC
HUDSON
OCEAN
UNION
ATLA
NTI
C OC
EAN
NEW YORK
PENNSYLVANIA
CONNECTICUT
Raritan Bay
0 20 40 MILES
0 20 40 KILOMETERS
74°75°76°
41°
40°
39°
Base from U.S. Geological Survey digital line graph files, 1:24,000, Universal Transverse Mercator projection, Zone 18, NAD 83
COASTAL PLAIN
PIEDMONT
NEW ENGLANDVALLEY AND
RIDGE
EXPLANATION
U.S. Geological Survey streamflow-gaging station, non-coastal skew region
U.S. Geological Survey streamflow-gaging station, coastal skew region
Physiographic province boundary
Non-coastal skew region
Coastal skew region
NEW JERSEY
DELAWARE
MARYLAND
F A L L LI N E
Delaware R i v e r
Delaware Bay
Chesapeake B
ay

18 Methodology for Estimation of Flood Magnitude and Frequency for New Jersey Streams
Basin Characteristics Used in Regression Equation Development
Several basin characteristics were examined to quantify their relation to annual peak streamflow, using ordinary least squares (OLS) regression. The basin characteristics were derived using GIS techniques to ensure consistency and repro-ducibility. Basin characteristics evaluated for each streamflow-gaging station considered for use in the regression analysis are listed in table 3. The GIS-computed values for drainage-basin areas agree closely with previously published values for drainage areas. The values for drainage areas presented in this report are from the GIS computations. The ranges of values for basin characteristics used to develop the equations are pro-vided in table 4. The original set of variables regressed against flood-magnitude and -frequency data included—1. basin drainage area, in square miles;
2. percentage of forest cover, from the GIS data set NJDEP 2002 Landuse/Landcover by Watershed Management Area (WMA) (New Jersey Department of Environmental Protection, 2007);
3. percentage of urban development, from the GIS data set NJDEP 2002 Landuse/Landcover by Watershed Manage-ment Area (WMA);
4. percentage of lakes/wetlands/reservoirs, commonly defined as storage, from the GIS data set NJDEP 2002 Landuse/Landcover by Watershed Management Area (WMA). Storage values used in the current study may be significantly higher than those used in Special Report 38 (Stankowski, 1974). Land-use coverages have improved since Special Report 38 was published, thereby adding more detailed coverage of the wetland areas;
5. channel slope by the 10–85 method—that is, the differ-ence in elevation of points 10 and 85 percent of the dis-tance along the main channel, from the gage to the basin divide, divided by the distance between the two points, in feet per mile;
6. main channel length, to basin divide, in miles;
7. basin shape index, computed as the ratio of the square of the main channel stream length (in square miles) to the drainage area (in square miles), a dimensionless ratio of basin length to basin width; and
8. statewide population density from each of the decadal censuses (Workforce New Jersey Public Information Network, 2000) from 1930 to 1990, and the ratios among these population densities.From the initial OLS regression analysis, those basin
characteristics that were found to relate to annual peak
streamflows with statistical significance at the 95-percent confidence interval were
• drainage area,
• the 10–85 basin stream slope,
• 1990 Census population density, and
• percentage of storage.
Each of these variables is described in the following section, “Explanatory Variable Selection Methods.” These are the variables that were used in the determination of the final regression equations using the Generalized Least Squares (GLS) method. The multiple linear-regression iterations were performed using the statistical software package Generalized Least Squares-Network Analysis (GLSNet). The GLSNet pro-gram and accompanying documentation can be downloaded from http://water.usgs.gov/software/GLSNet/.
Explanatory Variable Selection Methods
The methods discussed in the following sections describe the work required, and data sets used, to determine the basin-characteristic values for the peak-flow frequency study. Drainage-basin boundaries are needed before any other basin characteristic can be calculated. For each streamflow-gaging station, coordinates of the site location and a 10-meter-res-olution Digital Elevation Model (DEM) coverage from the National Elevation Data set (U.S. Geological Survey, 1999b) for New Jersey were used to create the drainage-basin bound-ary. The DEM is a digital cartographic/geographic data set of elevations derived from contour lines and aerial photography using USGS 7.5-minute topographic quadrangle maps. All elevation data presented in this report are referenced to the North American Vertical Datum of 1988 (NAVD 88). The 10-meter DEM uses the same source as the historical elevation data, which are manually derived from 7.5-minute quadrangle maps, but the 10-meter DEM also contains updated point data that provide refined elevation values. The vertical accuracy of the 10-meter DEM is considered to be +/- 7 to 15 meters.
The DEM can be inaccurate in geographically flat areas, such as the coastal areas of New Jersey. To improve the DEM used for this study, a process was performed to conform the stream boundaries from the National Hydrography Data set (NHD) (U.S. Geological Survey, 1999a) and the Hydrologic Unit Code-14 (HUC14) (New Jersey Department of Environ-mental Protection and New Jersey Geological Survey, 2000) to the DEM. This process was conducted using the ArcHydro Tools (Environmental Systems Research Institute, Inc., 2007) developed by Peter Steeves (2002). The result is a conditioned DEM, which was used for drainage-basin delineation.

Methods of Study 19
Table 3. Values of basin characteristics for streamflow-gaging stations in New Jersey and surrounding states used in the regression analysis.—Continued
[USGS, U.S. Geological Survey; mi2, square miles; ft/mi, feet per mile; mi, miles, 10-85, elevation at points 10- and 85- percent along the main channel length of the stream, used to calculate stream slope]
USGS station number
Drainage area (mi2)
Storage (percent)
1990 population density
(persons per mi2)
10-85 stream slope (ft/mi)
Forest cover
(percent)
Basin shape index
Main channel length
(mi)
01368000 140 18.8 312 15.6 46.4 5.68 28.201368500 59.1 4.37 138 26.2 56.4 6.96 20.301369000 97.9 13.4 335 28.0 54.3 11.5 33.501369500 9.70 6.82 380 42.1 50.6 4.33 6.501370000 381 12.5 255 21.5 48.0 5.04 43.801370500 415 11.6 308 19.7 47.4 5.91 49.501371000 103 2.36 180 19.3 69.9 12.4 35.701373690 11.2 3.96 436 104 74.6 2.54 5.301374130 8.30 3.99 105 103 94.6 7.79 8.001374250 14.9 7.29 134 75.8 89.0 3.85 7.601377475 2.18 3.94 1,850 86.2 16.7 4.75 3.201377490 6.67 5.89 2,840 25.7 9.97 8.24 7.401377500 27.8 4.68 3,410 33.5 10.2 10.3 17.001378350 3.09 .74 3,770 176 4.61 2.47 2.801378385 8.65 3.73 2,840 87.8 12.0 3.62 5.601378590 1.57 3.88 7,310 31.6 3.46 4.55 2.701378615 1.75 8.08 12,600 92.0 4.78 6.83 3.501378690 8.80 5.43 413 50.2 49.3 4.82 6.501379000 54.2 30.1 608 7.15 26.9 3.64 14.001379500 98.8 25.5 878 2.56 24.4 9.02 29.801379700 24.4 12.4 364 33.4 66.2 11.9 17.001379773 7.70 30 107 48.5 57.7 5.92 6.801379790 13.1 25.4 111 43.7 55.8 8.97 10.801380500 117 14.7 829 12.9 53.1 11.4 36.501381400 13.9 9.25 539 86.2 53.3 4.10 7.601381500 29.7 6.93 1450 44.6 40.7 5.47 12.701381800 68.7 15.4 1490 15.9 26.8 7.17 22.201381900 350 18.7 1170 17.5 33.8 6.69 48.401383500 28.4 17.9 504 44.4 61.1 3.74 10.301384000 42.1 15.8 403 38.1 68.0 6.41 16.401384500 16.9 8.11 103 56.1 87.1 7.52 11.301385000 4.23 13.6 523 85.4 71.0 3.74 4.001386000 11.8 11.3 376 161 69.8 2.89 5.801386500 1.01 14.5 237 268 85.2 5.70 2.401387250 60.3 5.89 396 17.2 76.4 6.39 19.601387300 18.4 7.22 72 75.3 91.2 6.17 10.701387350 5.25 8.14 183 99.5 86.8 3.21 4.101387400 87.0 6.18 317 16.4 80.2 5.87 22.601387410 2.68 5.98 41 220 97.1 4.90 3.601387420 93.2 5.78 308 17.1 80.7 6.53 24.7

20 Methodology for Estimation of Flood Magnitude and Frequency for New Jersey Streams
Table 3. Values of basin characteristics for streamflow-gaging stations in New Jersey and surrounding states used in the regression analysis.—Continued
[USGS, U.S. Geological Survey; mi2, square miles; ft/mi, feet per mile; mi, miles, 10-85, elevation at points 10- and 85- percent along the main channel length of the stream, used to calculate stream slope]
USGS station number
Drainage area (mi2)
Storage (percent)
1990 population density
(persons per mi2)
10-85 stream slope (ft/mi)
Forest cover
(percent)
Basin shape index
Main channel length
(mi)
01387450 12.4 3.08 645 117 54.1 5.79 8.501387500 121 5.29 537 16.8 71.6 5.77 26.401387880 7.12 9.59 1,330 25.2 21.2 7.14 7.101388000 160 7. 00 649 12.3 66.2 9.29 38.501388500 355 11.9 552 12.2 67.0 4.68 40.701389030 3.06 7.50 1,270 70.5 55.3 3.11 3.101389500 763 15.9 919 11.9 48.1 5.49 64.701389534 4.39 3.23 3,590 67.8 21.8 4.23 4.301389765 4.01 6.30 1,740 76.7 27.9 4.08 4.001389900 1.27 1.95 6,350 17.6 7.22 3.96 2.201390450 10.9 1.00 2,150 65.7 8.89 2.91 5.601390500 21.7 3.92 1,750 38.0 14.3 6.64 12.001390810 9.08 9.34 1,650 26.2 18.2 3.72 5.801390900 2.64 8.23 1,980 52.3 12.5 11.7 5.601391000 16.4 8.83 2,080 26.9 14.6 5.45 9.501391485 5.62 5.92 2,060 9.37 6.08 9.55 7.301391500 56.4 5.71 2,530 20.9 11.7 7.13 20.001392000 4.05 3.55 5,680 51.2 8.03 2.99 3.501392170 7.73 2.18 5,130 34.5 9.52 9.68 8.701392210 11.9 1.76 6,090 22.2 7.30 14.0 12.901392500 11.4 .62 9,250 43.0 6.22 4.44 7.101393450 16.7 2.59 13,500 19.9 3.74 4.87 9.001394000 7.13 5.69 1,820 33.5 41.7 8.09 7.601394500 24.9 2.73 3,980 34.1 18.8 5.32 11.501395000 41.7 3.92 4,010 19.2 15.3 11.3 21.701396000 21.2 11.6 3490 11.0 7.58 3.98 9.201396500 66.3 14.9 565 14.2 41.3 11.2 27.201396582 12.3 11.1 288 62.4 47.7 8.19 10.001396660 11.7 12.4 178 106 48.0 2.75 5.701397000 150 12.8 431 18.3 39.9 10.3 39.301397500 2.23 16.9 184 155 45.4 3.76 2.901398000 25.5 11.6 297 30.0 22.7 4.00 10.101398045 1.97 13.4 118 119 27.1 2.71 2.301398107 9.02 3.95 279 31.6 33.7 5.68 7.201398500 26.5 7.56 411 65.5 48.6 6.18 12.801399190 7.39 14.5 975 66.8 42.4 4.17 5.501399200 10.9 17.3 1,120 34.3 34.4 4.52 7.001399500 32.2 17.0 570 18.4 41.7 11.4 19.101399510 2.20 7.14 209 184 40.6 2.47 2.301399525 1.22 .86 83 138 49.7 4.24 2.3

Methods of Study 21
Table 3. Values of basin characteristics for streamflow-gaging stations in New Jersey and surrounding states used in the regression analysis.—Continued
[USGS, U.S. Geological Survey; mi2, square miles; ft/mi, feet per mile; mi, miles, 10-85, elevation at points 10- and 85- percent along the main channel length of the stream, used to calculate stream slope]
USGS station number
Drainage area (mi2)
Storage (percent)
1990 population density
(persons per mi2)
10-85 stream slope (ft/mi)
Forest cover
(percent)
Basin shape index
Main channel length
(mi)
01399670 12.2 8.02 312 56.3 41.8 6.35 8.801399700 37.0 6.38 228 50.8 44.1 6.85 15.901399830 173 8.52 356 23.3 42.6 7.07 35.001400000 188 8.49 378 22.0 41.2 7.44 37.401400300 4.20 7.53 1,230 37.8 18.0 4.04 4.101400350 .77 9.08 658 111 17.7 4.87 1.901400500 492 11.1 439 11.6 35.1 8.86 66.001400630 40.9 28.4 588 5.31 16.6 8.60 18.801400730 65.7 27.1 695 5.72 13.1 7.53 22.201400775 6.58 25.6 1,240 6.16 7.38 4.72 5.601400795 9.25 23.9 1,020 7.33 6.53 5.70 7.301400822 1.84 20.2 660 19.0 7.44 1.06 1.401400850 1.73 9.21 164 52.9 44.5 4.21 2.701400900 16.9 18.8 142 43.3 42.0 3.95 8.201400930 1.98 5.81 179 115 24.6 2.15 2.101400947 26.6 15.7 222 31.5 36.8 5.27 11.801400950 .49 9.03 165 35.2 20.1 3.49 1.301400960 1.20 21.3 317 61.0 33.2 3.76 2.101400970 3.84 12.9 330 27.6 36.3 3.58 3.701401000 44.4 14.7 356 21.6 35.6 9.47 20.501401160 1.83 27.5 1,430 11.4 10.3 3.20 2.401401200 3.82 32.0 959 13.3 10.1 5.40 4.501401301 162 23.3 658 4.89 18.6 4.32 26.501401520 6.60 12.4 442 87.7 41.3 3.62 4.901401595 9.16 15.6 210 65.9 50.3 6.01 7.401401600 27.0 13.8 276 28.7 39.0 5.40 12.101401650 5.29 16.2 433 88.8 36.3 5.02 5.201401870 10.8 15.0 1,760 29.5 18.0 3.03 5.701402000 260 20.7 624 4.73 22.5 6.40 40.801402600 .99 3.20 1,980 10.8 11.5 5.99 2.401403060 779 14.6 523 11.0 30.2 6.06 68.701403150 1.89 22.3 765 70.2 22.6 3.14 2.401403395 3.60 4.65 1,120 22.7 63.5 6.85 5.001403400 6.24 3.53 1,140 22.3 51.6 4.08 5.001403500 8.88 3.36 2,120 27.2 44.3 10.5 9.601403535 1.52 .97 745 101 28.7 2.70 2.001403540 5.49 7.57 822 79.0 30.8 1.99 3.301403600 18.6 5.63 2,530 26.4 33.2 7.37 11.701403900 48.5 11.7 3,330 21.0 15.5 5.02 15.601405030 44.7 19.4 1,450 6.09 18.3 5.63 15.4

22 Methodology for Estimation of Flood Magnitude and Frequency for New Jersey Streams
Table 3. Values of basin characteristics for streamflow-gaging stations in New Jersey and surrounding states used in the regression analysis.—Continued
[USGS, U.S. Geological Survey; mi2, square miles; ft/mi, feet per mile; mi, miles, 10-85, elevation at points 10- and 85- percent along the main channel length of the stream, used to calculate stream slope]
USGS station number
Drainage area (mi2)
Storage (percent)
1990 population density
(persons per mi2)
10-85 stream slope (ft/mi)
Forest cover
(percent)
Basin shape index
Main channel length
(mi)
01405300 43.9 26.5 1,250 5.96 15.2 6.85 17.301405400 40.5 26.8 470 6.27 22.1 12.4 22.401405500 95.1 27.5 982 6.56 18.9 6.28 24.401407000 6.05 15.0 1,540 27.4 21.1 3.30 4.501407290 6.41 20.6 810 24.7 15.7 3.53 4.801407500 49.7 21.8 469 13.6 17.6 2.72 11.601407705 9.95 37.2 414 15.4 29.7 6.01 7.701407760 6.48 14.7 1,390 21.1 18.3 5.85 6.201407830 10.7 22.7 871 14.4 18.9 2.35 5.001408000 44.0 30.6 732 7.75 17.5 6.37 16.701408015 6.18 46.3 190 8.79 23.0 5.13 5.601408029 63.6 37.5 551 7.11 19.0 6.04 19.601408120 34.6 31.2 1,250 6.76 22.2 11.7 20.101408500 124 24.6 361 4.82 46.8 6.86 29.201409000 53.1 19.5 108 7.57 71.9 7.11 19.401409095 7.78 19.5 15 20.1 75.6 4.23 5.701409280 15.8 19.3 28 11.8 80.1 2.99 7.001409375 3.20 13.3 1,310 12.8 33.7 6.46 4.501409400 46.9 35.0 267 1.79 47.0 11.01 22.701409403 1.03 5.51 782 34.6 36.8 2.24 1.501409500 67.9 31.4 100 4.30 53.7 6.48 21.001409810 83.9 37.2 25 4.68 60.5 6.41 23.201410000 68.8 19.9 23 5.84 78.4 6.91 21.801410150 8.15 15.1 19 11.6 81.9 4.65 6.201410810 7.46 21.4 1,050 9.84 20.7 6.04 6.701411000 57.0 25.6 810 4.21 34.3 8.35 21.801411120 .18 6.15 330 15.7 18.3 3.32 0.801411122 1.68 3.10 315 14.8 16.1 2.40 2.001411300 30.8 23.0 50 7.48 65.4 5.99 13.601411456 9.78 28.4 432 8.74 32.9 3.20 5.601411500 112 19.4 446 4.62 32.0 3.84 20.701412000 23.2 14.9 597 6.62 19.1 4.16 9.801412500 2.56 3.04 113 22.8 4.38 4.17 3.301412800 28.0 8.04 152 11.1 11.9 3.01 9.201440000 65.0 11.2 35 34.0 87.2 11.3 27.101443280 12.8 17.3 240 19.9 40.7 3.23 6.401443500 126 18.1 226 7.18 49.5 8.62 33.001445000 31.0 17.2 295 10.3 52.4 3.47 10.401445430 92.4 21.5 203 2.97 46.2 9.12 29.001445490 4.28 11.6 258 86.1 59.1 3.83 4.0

Methods of Study 23
Table 3. Values of basin characteristics for streamflow-gaging stations in New Jersey and surrounding states used in the regression analysis.—Continued
[USGS, U.S. Geological Survey; mi2, square miles; ft/mi, feet per mile; mi, miles, 10-85, elevation at points 10- and 85- percent along the main channel length of the stream, used to calculate stream slope]
USGS station number
Drainage area (mi2)
Storage (percent)
1990 population density
(persons per mi2)
10-85 stream slope (ft/mi)
Forest cover
(percent)
Basin shape index
Main channel length
(mi)
01445500 106 20.5 203 3.75 48.4 9.90 32.401446000 36.6 12.9 103 22.0 46.5 6.69 15.601446564 .87 25.5 95 75.0 49.4 3.42 1.701446600 10.5 7.79 107 110 75.5 4.41 6.801451500 80.8 2.74 598 12.6 32.0 7.55 24.701452500 44.5 2.97 605 24.7 19.0 7.81 18.601455200 35.4 10.4 351 32.9 47.4 9.81 18.601456000 68.9 18.5 845 23.1 57.2 7.51 22.801457000 139 12.8 611 16.7 48.8 17.0 48.601459010 1.23 10.8 83 181 57.9 3.98 2.201459500 97.4 5.74 328 14.2 59.0 8.14 28.201462197 .74 1.81 94 191 70.6 5.26 2.001463620 34.3 33.6 256 7.84 14.2 7.61 16.201463812 .25 10.5 2,860 53.5 1.79 4.02 1.001464000 90.5 25.0 1,450 4.31 10.4 5.81 22.901464400 41.1 35.5 418 8.06 29.4 2.96 11.001464405 1.13 35.1 158 39.6 30.9 6.60 2.701464500 81.5 28.6 284 4.07 34.6 5.21 20.601464515 17.5 20.5 156 10.9 26.3 9.32 12.801464520 24.6 21.0 216 9.98 22.8 12.5 17.601464524 .66 20.6 1,430 19.9 6.45 4.65 1.801464525 .79 26.6 2,360 32.3 11.0 3.88 1.801464530 19.6 22.4 150 11.1 21.8 4.94 9.801464533 .58 24.3 134 23.0 22.5 8.98 2.301464538 5.42 36.8 142 16.5 14.9 6.61 6.001464582 10.9 41.1 122 12.5 17.4 5.04 7.401465000 134 1.11 951 9.11 26.6 6.47 29.401465500 208 1.58 1,000 8.70 26.0 9.02 43.301465785 2.20 .97 2,600 45.6 10.2 4.14 3.001465790 5.38 2.24 3,990 29.0 10.8 4.12 4.701465798 21.4 2.73 4,870 15.0 6.66 6.97 12.201465850 64.9 38.5 161 4.65 43.2 6.80 21.001465880 47.1 27.8 1,040 10.4 35.0 3.48 12.801466000 2.81 15.2 6 9.00 79.7 7.76 4.701466500 2.34 11.3 8 14.8 80.5 7.28 4.101467000 118 28.8 316 5.00 57.2 6.05 26.701467042 38.1 .94 2,660 18.6 12.4 5.06 13.901467048 50.1 1.02 3,880 13.1 12.2 8.55 20.701467057 5.77 8.68 2,340 12.3 4.64 3.50 4.501467069 12.8 19.2 1,630 8.43 9.94 4.43 7.5

24 Methodology for Estimation of Flood Magnitude and Frequency for New Jersey Streams
Table 3. Values of basin characteristics for streamflow-gaging stations in New Jersey and surrounding states used in the regression analysis.—Continued
[USGS, U.S. Geological Survey; mi2, square miles; ft/mi, feet per mile; mi, miles, 10-85, elevation at points 10- and 85- percent along the main channel length of the stream, used to calculate stream slope]
USGS station number
Drainage area (mi2)
Storage (percent)
1990 population density
(persons per mi2)
10-85 stream slope (ft/mi)
Forest cover
(percent)
Basin shape index
Main channel length
(mi)
01467081 8.99 13.9 2850 9.68 6.29 8.36 8.701467086 16.2 .56 6250 27.3 4.57 5.52 9.501467087 30.0 .34 11100 22.4 4.25 5.71 13.101467130 5.06 18.0 1770 18.5 25.6 3.18 4.001467150 17.1 11.1 2400 11.1 17.8 5.94 10.101467160 5.32 16.5 2,430 15.1 11.4 7.67 6.401467305 1.36 1. 00 5,380 30.8 1.37 4.70 2.501467317 .60 1.94 5,200 40.8 .04 4.58 1.701467330 20.8 10.4 1,930 19.7 21.2 3.68 8.801467351 7.16 9.15 2,900 26.4 26.5 5.01 6.001472198 38.0 3.43 286 48.7 52.0 5.20 14.101472199 23.0 3.18 195 40.3 60.0 11.2 16.001472500 152 4.34 284 28.4 58.0 5.90 29.901473000 279 3.06 411 22.4 50.0 4.42 35.101473120 53.7 2.12 938 14.5 34.0 5.49 17.201475000 6.05 7.70 2,420 18.4 12.8 3.20 4.401475017 .41 17.7 997 51.4 23.1 3.05 1.101475019 14.1 8.67 1,910 17.4 16.5 4.74 8.201475033 .73 5.51 551 54.3 20.4 1.29 1.001475300 5.18 .28 1,400 36.6 22.7 3.46 4.201475510 37.5 .36 3,230 20.3 13.1 9.72 19.101475530 4.78 .46 5,410 91.4 3.37 4.37 4.601475550 21.8 .45 10,800 31.5 3.78 6.59 12.001475850 15.8 .30 786 29.8 42.4 5.38 9.201476500 31.5 .30 903 21.1 42.4 11.4 19.001477000 60.6 1.80 1060 22.7 32.8 7.85 21.801477102 .80 3.86 192 55.5 10.8 5.04 2.001477110 14.6 11.9 244 14.9 20.2 4.74 8.301477120 25.9 12.6 224 13.2 19.5 4.76 11.101477480 13.8 16.8 102 13.6 18.5 6.09 9.201477500 18.5 15.5 100 13.4 17.1 5.40 10.001477800 7.34 .23 2,930 66.4 7.29 5.07 6.101478000 20.8 2.26 1,310 21.7 23.7 8.67 13.401478040 40.6 4.71 1,250 17.6 25.1 8.08 18.101482310 1.05 4.92 390 32.0 13.3 3.10 1.801482500 14.6 11.8 111 15.1 12.6 4.83 8.401483000 20.3 16.7 79 15.0 26.4 4.46 9.501483200 4.06 17.7 73 14.8 30.7 4.33 4.201483290 1.20 10.4 88 11.7 7.34 4.79 2.401483400 .51 18.0 88 28.2 7.44 2.30 1.1

Methods of Study 25
Table 3. Values of basin characteristics for streamflow-gaging stations in New Jersey and surrounding states used in the regression analysis.—Continued
[USGS, U.S. Geological Survey; mi2, square miles; ft/mi, feet per mile; mi, miles, 10-85, elevation at points 10- and 85- percent along the main channel length of the stream, used to calculate stream slope]
USGS station number
Drainage area (mi2)
Storage (percent)
1990 population density
(persons per mi2)
10-85 stream slope (ft/mi)
Forest cover
(percent)
Basin shape index
Main channel length
(mi)
01483500 9.15 11.3 101 8.22 9.40 3.75 5.901483700 31.0 16.1 490 4.95 14.0 6.04 13.701483720 2.54 3.33 742 14.3 9.95 2.51 2.501484000 12.9 18.0 141 6.23 14.4 3.70 6.901484002 .88 3.91 113 14.6 10.3 5.92 2.301484050 2.91 4.74 111 12.3 10.2 4.19 3.501488500 46.8 27.7 67 2.49 8.30 3.21 12.301489000 7.33 1.64 54 5.56 19.8 5.01 6.101490600 8.90 36.6 62 5.33 11.9 4.05 6.001490800 4.00 3.97 71 7.85 37.7 4.49 4.201491000 117 23.1 93 2.75 21.0 4.15 22.001491010 2.11 16.7 34 4.22 11.9 5.24 3.301491050 3.51 1.00 83 4.76 25.5 5.37 4.301495000 53.2 1.64 220 16.6 23.2 11.8 25.1
Table 4. Ranges of values for basin characteristics used to develop the flood-frequency regression equations.
[mi2, square mile; ft/mi, feet per mile; 10-85, elevation at points 10- and 85- percent along the main channel length of the stream, used to calculate stream slope; GP, Glaciated Piedmont flood-frequency region; IN, Inner Coastal flood-frequency region; OC, Outer Coastal flood-frequency region; UP, Unglaciated Piedmont flood-frequency region; VR, Valley and Ridge and New England flood-frequency region; Min., minimum value; Max., maximum value]
Flood-frequency
region
Drainage area (mi2)
Storage (percent)
1990 population density (persons per mi2)
10-85 main channel slope (ft/mi)
Min. Max. Min. Max. Min. Max. Min. Max.
GP 1.27 56.4 0.62 11.6 645 13,492 9.37 176.0IN .41 118 1.00 41.1 34 5,382 2.49 55.5OC .18 124 3.04 46.3 6 1,387 1.79 39.6UP .25 779 .23 32.0 83 11,084 4.31 191.0VR .87 763 2.36 30.1 35 1,493 2.56 268.0
ALL .18 779 .23 46.3 6 13,492 1.79 268.0

26 Methodology for Estimation of Flood Magnitude and Frequency for New Jersey Streams
Land UseThe land uses for drainage basins entirely within New
Jersey were derived from a GIS data set developed from 2002 digital infrared aerial photography, NJDEP 2002 Landuse/Landcover by Watershed Management Area (WMA) (New Jersey Department of Environmental Protection, 2007) through use of the Anderson method of classification. Land uses for drainage basins extending outside New Jersey were derived from the 2001 National Land Cover Data (NLCD) data set (Yang and others, 2003). The land-use coverage divides the land area into a series of polygon segments that are assigned a single land-use classification, as in Level 1 classifications in the Anderson system (Anderson and others, 1976). Level 1 classification consists of the major land-use categories, including agriculture, urban, wetland, forested, bar-ren, and water areas. Each polygon segment is assumed to be uniform in land-use category.
Anderson Level 1 land-use classifications used for basin characteristics in this study are forest, urban, water, and wetlands. Land use categorized as storage is the percentage of water and wetland land-use areas in a drainage basin. The urban land-use category is a composite of residential, commer-cial, and industrial uses. A raster data set of the land-use cov-erage was created for data processing. For each site the 2002 land-use data set and (or) 2001 NLCD data set was overlaid on the drainage-basin polygon and clipped to the basin boundary. Percentages of each land-use type were calculated as the sum of the areas of the selected land-use type divided by the total area of the basin.
Main Channel LengthThe ArcHydro Tools (Environmental Systems Research
Institute, Inc., 2007) were used to measure main channel length. The ArcHydro Tools method for measuring main channel length uses the longest flow path of the NHD (U.S. Geological Survey, 1999a) stream network in the basin. The main channel length is defined as the distance measured along the main channel from the drainage-basin outlet to the basin divide, which extends the flow path from the upstream end of the stream to the basin divide. The extension to the basin divide follows a path in which the greatest volume of water would travel. The main channel length is measured in miles.
Basin Slope 10–85 MethodMain channel slope of a drainage basin was determined
using the 10–85 method. This method computes the stream slope as the difference in elevation between two points located
10 percent and 85 percent of the distance along the main chan-nel length, from the stream outlet to the basin divide, divided by the distance between the two points along the main channel (fig. 5). The elevation data presented in this report are from the conditioned DEM. The 10–85 stream slope is measured in feet per mile. The following is the equation for the 10–85 stream-slope calculation:
SE E
L10 8585 10
0 75− =−
.
, (3)
where S10–85 is the basin slope, in feet per mile, E85–E10 is the difference in elevation between the
85- and 10-percent points on the main channel, in feet; and
0.75L is the distance between the 85- and 10-percent points along the main channel, in miles.
Figure 5. Schematic diagram showing a drainage basin, the main channel of a stream, and the points used to compute the stream slope using the basin slope 10–85 method.
NOT TO SCALE
E10%
E85%
L10–85
Drainage-basin divide
S10-85 = ∆E10–85 / 0.75L
where S10-85 is the basin slope, in feet per mile; ∆E10-85 is the absolute difference in elevation between points E10% and E85% on main channel, in feet; and L10-85 is the distance between points E10% and E85% along main channel, in miles.

Development of Flood-Frequency Regression Equations 27
Population DensityPopulation density, in persons per square mile, was cal-
culated for each of the 254 streamflow-gaging-station drainage basins, using the 1990 National census block group data (U.S. Census Bureau, 2007). The population in each census block encompassing a drainage basin was summed and divided by the drainage area to determine the population density for the basin.
PopDen = ΣPOP/DA , (4)
where PopDen is the 1990 population density for the
drainage basin, in persons per square mile; POP is the population from 1990 National census
block group data for the drainage basin; and
DA is the drainage area, in square miles.
Development of Flood-Frequency Regression Equations
Estimates of flow at specific frequencies for gaged loca-tions in New Jersey were computed by submitting annual maximum flood-peak flows observed at streamflow-gaging stations to the USGS computer program PeakFQ. Output from that program includes the 2-, 5-, 10-, 25-, 50-, 100-, and 500-year return-interval flows, in cubic feet per second. Input to PeakFQ includes the annual peak-flow time series for each streamflow-gaging station; utilizing the log-Pearson Type III distribution, the estimated flow at specified return intervals is computed. The results are summarized in Appendix 2 as flood-frequency estimates from observed data from the systematic record. These data were then used in the determination of the final regional regression equations.
The State was divided into five flood-frequency regions based on geographic distribution of the residuals from the initial OLS regression runs, the physiographic map (Parker and others, 1964), and a soils map (Quakenbush and Tedrow, 1954). The five flood-frequency regions are shown in figure 2. The flood-frequency regions for New Jersey are the following:
• Valley and Ridge (VR), northwestern New Jersey including the glaciated portion of the New England physiographic province, the entire Valley and Ridge physiographic province, and the Upper Passaic River Basin;
• Glaciated Piedmont (GP), northeastern New Jersey within the area of the Piedmont physiographic prov-ince, and the Lower Passaic River Basin downstream
from Chatham, NJ (the southern extent of the GP is the terminal moraine);
• Unglaciated Piedmont (UP), within the area of the Piedmont physiographic province in New Jersey, excluding the Passaic River Basin, with the northern extent as the boundary with the New England phys-iographic province, the eastern extent as the terminal moraine, and the southern extent as the Fall Line;
• Inner Coastal Plain (IN), consisting of the streams tributary to the Raritan River east of the Fall Line, the Raritan Bay, the Atlantic Ocean north of Shark River Basin, and Delaware River south of Trenton, NJ, and
• Outer Coastal Plain (OC), consisting of the streams tributary to the Atlantic Ocean south of Sandy Hook, NJ, including the Shark River Basin, and to Delaware Bay north to and including the Cohansey River Basin.
In order to develop only one set of equations that could be used for the entire State—one equation for each recurrence interval—a constant regional coefficient that allows regression parameters to vary with the flood-frequency region was used.
All response (recurrence-interval peak flows) and explanatory (basin characteristic) variables were transformed to logarithms, base 10, within the regression analysis to obtain linear relations between the response variables and the explanatory variables and to achieve equal variance about the regression line. A one (1) was added to the percentage of stor-age and population-density explanatory variables so that no values would be equal to zero.
Equation development was done in two phases. In the first phase, peak-flow statistics for each flood-frequency recur-rence interval were related to basin characteristics using the Ordinary Least Squares (OLS) regression method. OLS, com-monly referred to as linear regression, is used to describe the covariation between some variable of interest and one or more other variables (Helsel and Hirsch, 2002). The regression iter-ations using OLS were performed using the statistical software package Minitab (Minitab, 2006). This step was performed to identify those basin characteristics that were significant at the 95-percent confidence interval.
Multiple linear regression analysis using Generalized Least Squares (GLS) was used for the second phase to derive the final regression equations that best fit the data. GLS is considered to be a more accurate regression technique for hydrologic regressions as it accounts for differences in record length, the variance of flows, and cross-correlation among the stations used in the analysis (Tasker and Stedinger, 1989). The software package GLSNet was used for the analysis. Regres-sion analysis was performed using the variables obtained from the OLS method that were determined to be significant. After regression analyses were performed, the residuals were exam-ined to assess goodness of fit and determine whether regional trends existed.

28 Methodology for Estimation of Flood Magnitude and Frequency for New Jersey Streams
Regression Analysis and Resultant EquationsIn this report, flood magnitude for a selected frequency is expressed as a function of basin
characteristics. The general form of the mathematical model used is
QT = b0x1b1x2
b2x 3b3...xn
bn , (5)
where QT is the estimated flood discharge for a selected recurrence interval, T; b0 is the intercept also referred to as the regional regression constant (K) in
this report; x1, x2, x3,...xn are basin characteristics; and b1, b2, b3,...bn are the fitting coefficients.
The coefficients were estimated by weighted multiple linear regression, GLS analysis of the following equivalent logarithmic relation:
log QT = log b0+ b1 log x1+ b2 log x2 + b3 log x3 +...+bn log xn , (6)
where QT is the estimated flood discharge for a selected recurrence interval, T; b0, b1, b2,...bn are regression coefficients; and x1, x2, x3,...xn are basin characteristics.
Multiple-regression analysis was used in a forward-stepwise procedure to include or exclude independent variables (basin characteristics) in the model. The regression analysis was run using the effective years of record, Ne, as a weighting factor (table 1). The variables included in the final equations are those that are significant at a prescribed confidence level—that is, those variables that when included in the regression equation account for a sufficiently large portion of the total variance so that the relation is unlikely to have resulted from chance alone. The basin characteristics used in developing the flood-frequency regression equations are drainage area, 10–85 basin slope, percentage of storage, 1990 population density, and flood-frequency region.
After the regression analysis was completed, a final set of equations was produced. The final combination of variables chosen for the regression equations had the lowest standard error, and all variables were significant at the 95-percent confidence interval when run using the GLSNet.
The best-fit equations are as follows: Q2 = KTR(DA)0.753 (Storage+ 1)-0.054 (Slope)0.251 (PopDen + 1)0.127 (7) Q5 = KTR(DA)0.741 (Storage+ 1)-0.084 (Slope)0.254 (PopDen + 1)0.104 (8) Q10 = KTR(DA)0.736 (Storage+ 1)-0.104 (Slope)0.258 (PopDen + 1)0.092 (9) Q25 = KTR(DA)0.732 (Storage+ 1)-0.127 (Slope)0.263 (PopDen + 1)0.079 (10) Q50 = KTR(DA)0.729 (Storage+ 1)-0.144 (Slope)0.267 (PopDen + 1)0.070 (11) Q100 = KTR(DA)0.728 (Storage+ 1)-0.158 (Slope)0.271 (PopDen + 1)0.062 (12) Q500 = KTR(DA)0.725 (Storage+ 1)-0.189 (Slope)0.278 (PopDen + 1)0.043 , (13)where Q2, Q5,…Q500 are the peak-flow discharges for floods with recurrence intervals of 2 years,
5 years,…500 years, in cubic feet per second; KTR is the coefficient for the recurrence interval for the specified flood-
frequency region (table 5); DA is the drainage area, in square miles; Storage is the percentage of the basin covered by streams, lakes, and wetlands; Slope is the 10–85 basin slope, in feet per mile; and PopDen is the population density, in persons per square mile.
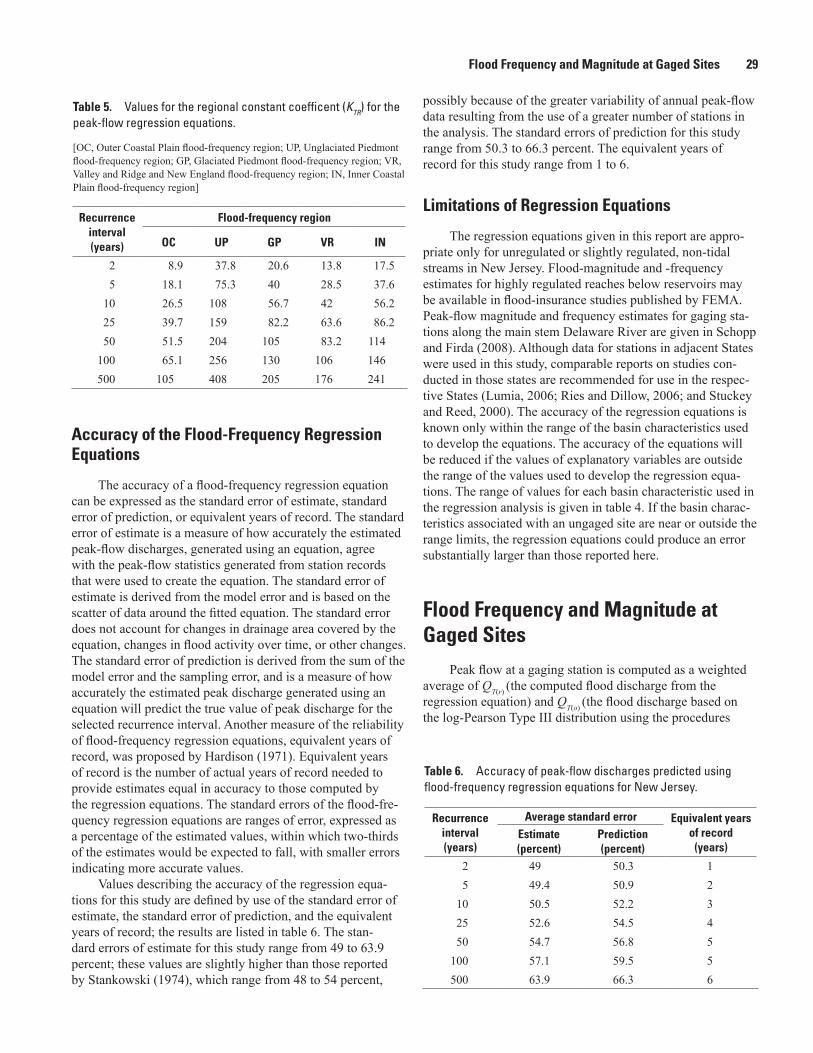
Flood Frequency and Magnitude at Gaged Sites 29
Accuracy of the Flood-Frequency Regression Equations
The accuracy of a flood-frequency regression equation can be expressed as the standard error of estimate, standard error of prediction, or equivalent years of record. The standard error of estimate is a measure of how accurately the estimated peak-flow discharges, generated using an equation, agree with the peak-flow statistics generated from station records that were used to create the equation. The standard error of estimate is derived from the model error and is based on the scatter of data around the fitted equation. The standard error does not account for changes in drainage area covered by the equation, changes in flood activity over time, or other changes. The standard error of prediction is derived from the sum of the model error and the sampling error, and is a measure of how accurately the estimated peak discharge generated using an equation will predict the true value of peak discharge for the selected recurrence interval. Another measure of the reliability of flood-frequency regression equations, equivalent years of record, was proposed by Hardison (1971). Equivalent years of record is the number of actual years of record needed to provide estimates equal in accuracy to those computed by the regression equations. The standard errors of the flood-fre-quency regression equations are ranges of error, expressed as a percentage of the estimated values, within which two-thirds of the estimates would be expected to fall, with smaller errors indicating more accurate values.
Values describing the accuracy of the regression equa-tions for this study are defined by use of the standard error of estimate, the standard error of prediction, and the equivalent years of record; the results are listed in table 6. The stan-dard errors of estimate for this study range from 49 to 63.9 percent; these values are slightly higher than those reported by Stankowski (1974), which range from 48 to 54 percent,
possibly because of the greater variability of annual peak-flow data resulting from the use of a greater number of stations in the analysis. The standard errors of prediction for this study range from 50.3 to 66.3 percent. The equivalent years of record for this study range from 1 to 6.
Limitations of Regression Equations
The regression equations given in this report are appro-priate only for unregulated or slightly regulated, non-tidal streams in New Jersey. Flood-magnitude and -frequency estimates for highly regulated reaches below reservoirs may be available in flood-insurance studies published by FEMA. Peak-flow magnitude and frequency estimates for gaging sta-tions along the main stem Delaware River are given in Schopp and Firda (2008). Although data for stations in adjacent States were used in this study, comparable reports on studies con-ducted in those states are recommended for use in the respec-tive States (Lumia, 2006; Ries and Dillow, 2006; and Stuckey and Reed, 2000). The accuracy of the regression equations is known only within the range of the basin characteristics used to develop the equations. The accuracy of the equations will be reduced if the values of explanatory variables are outside the range of the values used to develop the regression equa-tions. The range of values for each basin characteristic used in the regression analysis is given in table 4. If the basin charac-teristics associated with an ungaged site are near or outside the range limits, the regression equations could produce an error substantially larger than those reported here.
Flood Frequency and Magnitude at Gaged Sites
Peak flow at a gaging station is computed as a weighted average of QT(r) (the computed flood discharge from the regression equation) and QT(o) (the flood discharge based on the log-Pearson Type III distribution using the procedures
Table 5. Values for the regional constant coefficent (KTR) for the peak-flow regression equations.
[OC, Outer Coastal Plain flood-frequency region; UP, Unglaciated Piedmont flood-frequency region; GP, Glaciated Piedmont flood-frequency region; VR, Valley and Ridge and New England flood-frequency region; IN, Inner Coastal Plain flood-frequency region]
Recurrence interval (years)
Flood-frequency region
OC UP GP VR IN
2 8.9 37.8 20.6 13.8 17.55 18.1 75.3 40 28.5 37.6
10 26.5 108 56.7 42 56.225 39.7 159 82.2 63.6 86.250 51.5 204 105 83.2 114
100 65.1 256 130 106 146500 105 408 205 176 241
Table 6. Accuracy of peak-flow discharges predicted using flood-frequency regression equations for New Jersey.
Recurrence interval (years)
Average standard error Equivalent years of record
(years)Estimate (percent)
Prediction (percent)
2 49 50.3 15 49.4 50.9 2
10 50.5 52.2 325 52.6 54.5 450 54.7 56.8 5
100 57.1 59.5 5500 63.9 66.3 6

30 Methodology for Estimation of Flood Magnitude and Frequency for New Jersey Streams
log(log ) (log )
( )( ) ( )Q
N Q E QN ET w
e T o T r
e
=+
+
=
,
67 yyears ft /s years ft3 3(log , ) (log ,6 470 5 4 770+ //s ,
,
ft /s 3
)
.
,( )
67 5
3 801
6 330
+
=
=QT w ..
Estimation of Flood Frequency and Magnitude at Ungaged Sites
Estimation of flood frequency and magnitude for an ungaged site is computed using a regional regression equation. Flood frequency and magnitude can be computed for ungaged sites with a drainage-basin area outside the ratio of 1/3 to 3 times the area of the drainage basin of the nearest streamflow-gaging station on the same stream. If the drainage-basin area for the ungaged site lies in more than one flood-frequency region, the flood-frequency estimate will be weighted by the percentage of the drainage basin within each region. The computation of flood discharge at an ungaged site is illustrated with the following example.
The 100-year peak-flow discharge is computed for an ungaged site on a stream in Atlantic County in southern New Jersey. The drainage-basin characteristics are drainage area, 15.5 mi2; percentage of lakes and wetlands, 5.5 percent; chan-nel slope, 3.2 ft/mi; and population density, 75 persons/mi2.
All of Atlantic County is in flood-frequency region OC, according to figure 2. By using the appropriate regional regres-sion equation, the 100-year peak-flow discharge is
Q DA Storage Sr u1000 728 0 15865 1 1( )
. - .. ( ) ( ) ( = + llope PopDen) ( )
. ( . )
. .
.
0 271 0 062
0 7
1
65 1 15 5
+
=
,
228 0 158 0 271 0 0625 5 1 3 2 76
639
( . ) ( . ) ( ) ,- . . .+
=
ft /s 3 .
Estimation of Flood Frequency and Magnitude for an Ungaged Site Upstream or Downstream from a Gaged Site
For ungaged sites near streamflow-gaging stations on the same stream, the flood discharge can be estimated using a ratio of the drainage area for the ungaged site to the drainage area for the gaged site. The ungaged site must be on the same
outlined in Bulletin 17B (Interagency Advisory Committee on Water Data, 1982)). The weighted average flood discharge, QT(w), is based on the effective number of years of peak-flow record at the gaging station (table 1) and on the equivalent years of record from table 6. The equation used to compute the weighted average is as follows:
log(log ) (log )
( )( ) ( )Q
N Q E QN ET w
e T o T r
e
=+
+ , (14)
where QT(w) is the weighted peak-flow discharge, in cubic
feet per second, for recurrence interval T, in years;
QT(o) is the peak-flow discharge, in cubic feet per second, based on the log-Pearson Type III analysis of the gaging-station peak-flow record, for recurrence interval T, in years;
QT(r) is the peak-flow discharge, in cubic feet per second, from the regression equation for recurrence interval T, in years;
Ne is the effective number of years of gaged peak-flow record from table 1, which is equal to the years of peak-flow record, N, if no historical information is available; and
E is the equivalent number of years of record of the regression equation from table 6.
Equation 14 is equation (8.6) in Bulletin 17B (Inter-agency Advisory Committee on Water Data, 1982). The results of this computation for the stations used in this study are listed as the weighted estimate in Appendix 2.
The computation of a weighted peak-flow discharge can be illustrated by computing the weighted 100-year peak flow for the gaging station 01394500, Rahway near Springfield, NJ. For that gaged site, the basin characteristics are drainage area, 24.9 mi2; channel slope, 34.1 ft/mi; percentage of lakes and wetlands (storage), 2.73 percent; and population density, 3,980 persons/mi2. The gaging station is located in flood-fre-quency region GP (Glaciated Piedmont), according to table 1.
By using the appropriate regional regression equation, the 100-year peak-flow discharge is determined as follows:
Q DA Storage Sloper1000 728 0 158130 1( )
. .( ) ( ) (= + − )) ( ) ,
( . ) ( .
. .
.
0 271 0 062
0 728
1
130 24 9 2 73
PopDen+
= ++ +
=
−1 34 1 3 980 1
4 770
0 158 0 271 0 062) ( . ) ( , ) ,
,
. . .
fft /s .3
In Appendix 2, QT(o), the observed 100-year peak flow from the log-Pearson Type III analysis, is 6,470 ft3/s. By using equation 14 given at the beginning of this section, the observed peak flow and the peak-flow value estimated from the regional regression equation can be combined as follows:

Estimation of Flood Frequency and Magnitude for an Ungaged Site Upstream or Downstream from a Gaged Site 31
stream as the streamflow-gaging station, and the drainage area should be approximately between 1/3 and 3 times the area of the drainage basin (U.S. Geological Survey, 2002). Use of this method gives increasing weight to the flood estimates for the streamflow-gaging stations as the drainage-area ratio approaches 1 and full weight to the flood-frequency regression equations for ungaged sites with a drainage area less than 1/3 or greater than 3 times the drainage area of the streamflow-gaging station. The use of limits that are reciprocals of each other allows for equal transfers up- and downstream. Regional regression equations should be used for instances when the ratio of the ungaged drainage area to the drainage area of the streamflow-gaging station is outside the range 1/3 to 3.
To obtain a weighted peak-discharge estimate (QT(w)u) for the ungaged site for recurrence interval T, the weighted streamflow-gaging-station estimate from the upstream or downstream station (QT(w)g) must first be determined using equation (14). This estimate is then used to obtain a flood-discharge estimate (QT(u)g) for the selected flood frequency for the ungaged site by use of the following equation (Ries and Dillow, 2006):
QDADA
QT u gu
g
b
T w g( ) ( )=
, (15)
where QT(u)g is the estimated peak-flow discharge, in cubic
feet per second, for recurrence interval T, for the selected flood frequency for the ungaged site;
DAu is drainage area for the ungaged site; DAg is drainage area for the upstream or
downstream streamflow-gaging station; b is the exponent for drainage area for each
flood-frequency region (table 7), as determined by computing the mean of the drainage-area exponents for all recurrence intervals from regressions of flood frequencies against drainage area as the only explanatory variable; and
QT(w)g is the weighted peak-flow discharge, in cubic feet per second, for recurrence interval T, for the selected flood frequency for the gaged site, from equation (14) or Appendix 2.
The equivalent years of record at the ungaged site, Nu, relative to the gaged site can be computed using the following equations. If the value of Nu is a negative number, the drain-age-area ratio with the upstream or downstream station is out-side the range of 1/3 to 3; therefore, the regression equations should be used to calculate a peak-flow discharge estimate for the selected flood frequency for the ungaged site.
If the streamflow-gaging station is upstream from the ungaged site, then
N NDA DADAu g
g u
g
=−
−
33 1( ) , (16)
and if the streamflow-gaging station is downstream from the ungaged site, then
N NDA DADAu gu g
g
=−
−
0 331 0 33
.( . ) , (17)
where Ng is years of record at the station, Nu is equivalent years of record at the ungaged
site, DAg is drainage area for the upstream or
downstream streamflow-gaging station, and
DAu is drainage area for the ungaged site.
The weighted estimate for recurrence interval, T, at the ungaged site (QT(w)u) can be computed by following equation (14), where QT(u)g from equation (15) is substituted in place of QT(o); Nu from equation (16) or (17) is substituted in place of Ne, equivalent years of record, E, from table 6; and QT(r)u is calculated from the regional regression equation.
The following example illustrates the calculations for determining the weighted flow for a 100-year flood at an ungaged site that is near a streamflow-gaging station on Walnut Brook near Flemington, NJ (01397500). The ungaged site is downstream from the gaging station. The drainage area of the gaged site is 2.23 mi2. The drainage area of the ungaged site is 3.00 mi2. Both sites are in flood-frequency region Unglaciated Piedmont (UP).
Table 7. Value of exponent, b, for flood-frequency regions in New Jersey used in regional regression analysis.
[GP, Glaciated Piedmont flood-frequency region; IN, Inner Coastal Plain flood-frequency region; OC, Outer Coastal Plain flood-frequency region; UP, Unglaciated Piedmont flood-frequency region; VR, Valley and Ridge and New England flood-frequency region]
Flood-frequency region Exponent b
GP 0.68IN .66OC .73UP .58VR .59
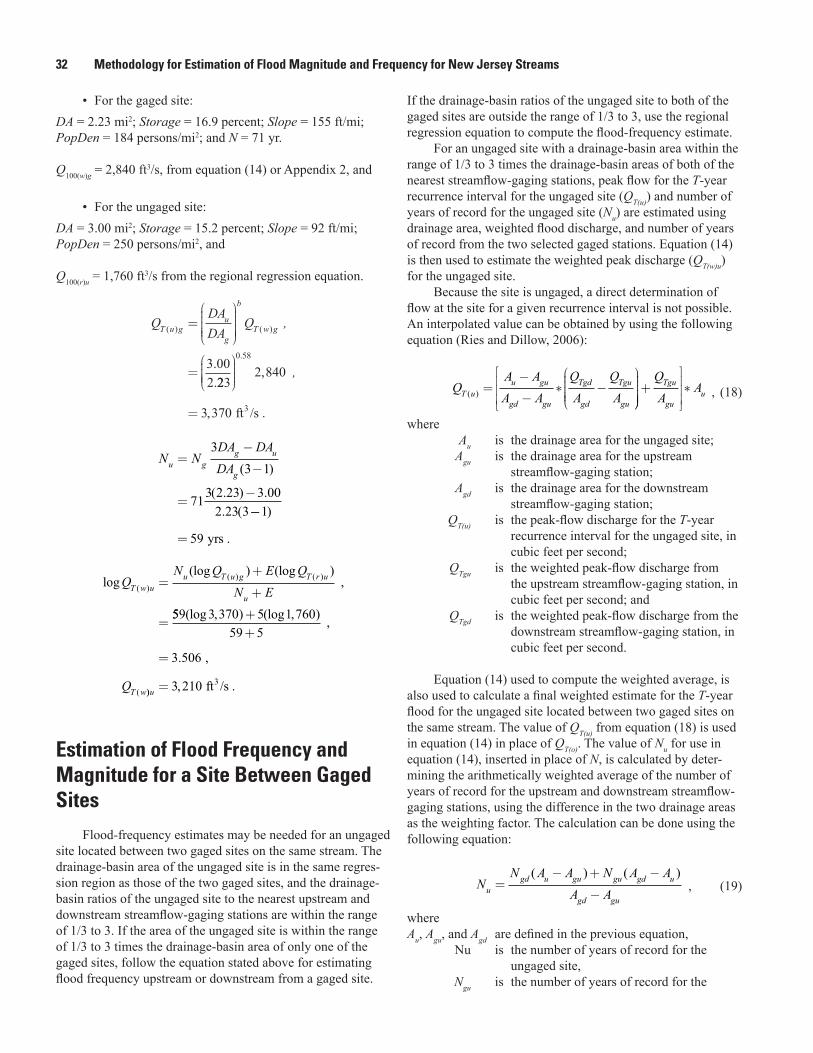
32 Methodology for Estimation of Flood Magnitude and Frequency for New Jersey Streams
• For the gaged site:DA = 2.23 mi2; Storage = 16.9 percent; Slope = 155 ft/mi; PopDen = 184 persons/mi2; and N = 71 yr. Q100(w)g = 2,840 ft3/s, from equation (14) or Appendix 2, and
• For the ungaged site:DA = 3.00 mi2; Storage = 15.2 percent; Slope = 92 ft/mi; PopDen = 250 persons/mi2, and Q100(r)u = 1,760 ft3/s from the regional regression equation.
QDADA
QT u gu
g
b
T w g( ) ( )
.
.
=
=
,
3 002 223
2 840 ,
3 370
0 58
=
.
,
,
ft /s .3
N NDA DADAu g
g u
g
=−
−
=−
33 1
713 2 23 3 002 23 3
( )
( . ) .. (
−−
=
1
59
)
yrs .
log(log ) (log )
( )( ) ( )Q
N Q E QN ET w u
u T u g T r u
u
=+
+
=
,
559 3 370 5 1 76059 5
3 506
(log , ) (log , )
.
(
++
=
,
,
QT w)) ,u = 3 210 ft /s .3
Estimation of Flood Frequency and Magnitude for a Site Between Gaged Sites
Flood-frequency estimates may be needed for an ungaged site located between two gaged sites on the same stream. The drainage-basin area of the ungaged site is in the same regres-sion region as those of the two gaged sites, and the drainage-basin ratios of the ungaged site to the nearest upstream and downstream streamflow-gaging stations are within the range of 1/3 to 3. If the area of the ungaged site is within the range of 1/3 to 3 times the drainage-basin area of only one of the gaged sites, follow the equation stated above for estimating flood frequency upstream or downstream from a gaged site.
If the drainage-basin ratios of the ungaged site to both of the gaged sites are outside the range of 1/3 to 3, use the regional regression equation to compute the flood-frequency estimate.
For an ungaged site with a drainage-basin area within the range of 1/3 to 3 times the drainage-basin areas of both of the nearest streamflow-gaging stations, peak flow for the T-year recurrence interval for the ungaged site (QT(u)) and number of years of record for the ungaged site (Nu) are estimated using drainage area, weighted flood discharge, and number of years of record from the two selected gaged stations. Equation (14) is then used to estimate the weighted peak discharge (QT(w)u) for the ungaged site.
Because the site is ungaged, a direct determination of flow at the site for a given recurrence interval is not possible. An interpolated value can be obtained by using the following equation (Ries and Dillow, 2006):
QA AA A
QA
QAT u
u gu
gd gu
Tgd
gd
Tgu
gu( ) =
−
−∗ −
+
∗
QA
ATgu
guu , (18)
where Au is the drainage area for the ungaged site; Agu is the drainage area for the upstream
streamflow-gaging station; Agd is the drainage area for the downstream
streamflow-gaging station; QT(u) is the peak-flow discharge for the T-year
recurrence interval for the ungaged site, in cubic feet per second;
QTgu is the weighted peak-flow discharge from the upstream streamflow-gaging station, in cubic feet per second; and
QTgd is the weighted peak-flow discharge from the downstream streamflow-gaging station, in cubic feet per second.
Equation (14) used to compute the weighted average, is also used to calculate a final weighted estimate for the T-year flood for the ungaged site located between two gaged sites on the same stream. The value of QT(u) from equation (18) is used in equation (14) in place of QT(o). The value of Nu for use in equation (14), inserted in place of N, is calculated by deter-mining the arithmetically weighted average of the number of years of record for the upstream and downstream streamflow-gaging stations, using the difference in the two drainage areas as the weighting factor. The calculation can be done using the following equation:
NN A A N A A
A Augd u gu gu gd u
gd gu
=− + −
−
( ) ( ) , (19)
where Au, Agu, and Agd are defined in the previous equation, Nu is the number of years of record for the
ungaged site, Ngu is the number of years of record for the

StreamStats 33
upstream streamflow-gaging station, and Ngd is the number of years of record for the
downstream streamflow-gaging station.
The following example illustrates the calculations for determining the peak flow for a 100-year flood for an ungaged site that is between two streamflow-gaging stations on Beden Brook. The ungaged site has a drainage area of 10.0 mi2, percentage of storage of 12.9 percent, 10–85 slope of 41.2 ft/mi, and population density of 430 persons/mi2. The upstream streamflow-gaging station is 01401520, Beden Brook near Hopewell, NJ; the drainage area is 6.60 mi2, Q100(gu) is 9,010 ft3/s, and the number of years of record Ngu is 19. The downstream streamflow-gaging station is 01401600, Beden Brook near Rocky Hill, NJ; the drainage area is 27.0 mi2, Q100(gd) is 15,200 ft3/s, and the number of years of record Ngd is 40. All three sites are in flood-frequency region Unglaci-ated Piedmont (UP). To estimate the flood frequency (Q100(u)) for the ungaged site, the regional regression equation is used, along with the basin characteristics from table 3.
Equation (19) is used to calculate Q100(u) with the drainage areas and peak-flood values as defined above; the data also can be found in table 3 and Appendix 2.
Q u10010 6 627 6 6
14 20027
7 8006 6( )
.
., ,
.=
−−
∗ −
+
∗
=
7 8006 6
10
10 700
,.
,
ft /s 3 ..
Equation (19) is used to calculate Nu with drainage areas and years of record as defined above; the data also can be found in tables 1 and 3.
Nu =− + −
−=
40 10 6 6 19 27 1027 6 6
22
( . ) ( ).
yr .
Using the regression-equation estimate for the ungaged site, Q100(u) = 3,600 ft3/s, and determining the associated equiv-alent years of record from table 6, the weighted peak flow is estimated for the ungaged site using equation (14).
log (log , ) (log , )( )Q w100
22 10 700 5 3 60022 5
3
=++
=
..
,( )
942
8 750100
ft /s .3Q w =
StreamStatsStreamStats is an interactive, map-based USGS Web
application that allows users to easily obtain streamflow statistics and basin characteristics for USGS streamflow-gaging stations as well as for ungaged sites along a stream. StreamStats was developed cooperatively by the USGS and
the Environmental Systems Research Institute, Inc. (ESRI) (can be accessed at http://www.esri.com), and was designed for national implementation. The application uses a GIS and digital map data, allowing the user to automatically determine flood magnitude and frequency and values of basin charac-teristics for gaged and ungaged sites. For ungaged sites on streams, the application calculates values of basin characteris-tics and estimates streamflow statistics using updated flood-frequency regression equations.
The flood-frequency regression equations formulated from this study for the State of New Jersey have been input into the USGS National Streamflow Statistics (NSS) (Turnip-seed and Ries, 2007) program and are used to solve peak-flow frequency estimates within the Web application. Using the updated flood-frequency regression equations, the user will be able to choose a point anywhere along a stream, and the GIS will automatically delineate the drainage-basin boundary, calculate values for selected basin characteristics, and obtain peak-flow frequency estimates. In cases where the drainage-basin area of the ungaged site is within the range of 1/3 to 3 times the drainage-basin area of the nearest streamflow-gaging station on the same stream, the application will use the area-weighted ratio to determine the peak-flow frequency estimate. The application uses the equation described in the section “Estimation of Flood Frequency and Magnitude for an Ungaged Site Upstream or Downstream from a Gaged Site.” The user can select existing USGS streamflow-gaging stations and obtain peak-flow frequency statistics and other flow data with a link to the National Water Information System Web interface (NWIS-WEB).
A StreamStats Web application has been developed and implemented for use in New Jersey. The basin characteristics available for data retrieval for a delineated drainage basin, gaged or ungaged, are drainage-basin area, in square miles; basin shape index; mean basin elevation, in feet; longest flow-path length, in miles; percentage of forest cover; 2000 population density, in persons per square mile (although 1990 population density was used for the development of the regres-sion equations in this study, the StreamStats application will offer the more current 2000 population-density data); 10–85 basin slope, in feet per mile; percentage of storage; sum of length of streams in basin, in miles; percentage of urban land cover; and percentage of wetland land cover. Tidal areas and highly regulated stream reaches on the Rockaway, Wanaque, Hackensack, Pequannock, and Delaware Rivers (fig. 6) have been excluded from basin delineation and statistics estimation on the StreamStats website.
A detailed description of the application can be found in the USGS fact sheet by Ries and others (2004). Complete StreamStats application user instructions are provided through the links on the StreamStats web site at http://streamstats.usgs.gov. The Web site also provides links to (1) general limitations of the application, (2) other State appli-cations, (3) definitions of terms, (4) downloadable presenta-tions and other technical information about the application, and (6) contact information.

34 Methodology for Estimation of Flood Magnitude and Frequency for New Jersey Streams
Figure 6. Highly regulated stream reaches on the Hackensack, Rockaway, Wanaque, and Pequannock Rivers and tidal areas excluded from basin delineation and statistics estimation on the StreamStats Web site.
MORRIS
BERGEN
ESSEX
UNION
MIDDLESEX
SOMERSET
PASSAIC
HUDSON
74°74°20'
41°
40°40'
NEW YORK
NEW YORK
RARITAN BAY
0 2.5 5 MILES
0 2.5 5 KILOMETERS
Raritan River
Pequannock River
Ro ckaway River
Wanaque River
Hackensack R iver
PENNSYLVANIA
DEL
AWA
RE
NEW YORK
ATLA
NTI
C OC
EAN
0 20 MILES
0 18 KILOMETERS
74°75°
41°
40°
39°
NEW JERSEY
Area ofdetail
DELAWARE
BAY
Delaware River
Base from U.S. Geological Survey digital line graph files, 1:24,000, Universal Transverse Mercator projection, Zone 18, NAD 83
EXPLANATION
REGULATED STREAMREACH—StreamStats streamflow estimates considered not valid
STREAMSTATS EXCLUSION POLYGON—Streamflow statistics and basin characteristics will not be calculated for siteswithin this area

References Cited 35
SummaryThis study was performed by the U.S. Geological Survey
in cooperation with the New Jersey Department of Environ-mental Protection and the U.S. Army Corps of Engineers. The report presents the flood-frequency statistics and basin characteristics used to develop regression equations to estimate flood magnitudes at the 2-, 5-, 10-, 25-, 50-, 100-, and 500-year recurrence intervals for unregulated or slightly regulated rural or urban streams in New Jersey with drain-age areas greater than 0.4 mi2. Multiple-regression analyses were used to define the relations between flood discharge and basin characteristics. Results of the analyses indicated that peak flow at a site is related to the drainage area, main chan-nel slope, percentage of lake and wetland area, population density, and flood-frequency region. The State was divided into five flood-frequency regions in order to refine the regres-sion equations. The standard errors of estimate ranged from 49 to 63.9 percent. Gaging-station data used in the analyses are listed in this report.
The regional regression equations provided in this report can be used to improve the estimates of flood magnitude and frequency at gaged sites by weighting together the log-Pearson Type III data and the estimated data from the regression equa-tions, according to their equivalent years of record. Weighted flood-frequency estimates are listed for all New Jersey gaged sites used in the regression analysis.
AcknowledgmentsThe authors thank the New Jersey Departments of Envi-
ronmental Protection (NJDEP) and Transportation (NJDOT); U.S. Army Corps of Engineers, New York and Philadelphia Districts; Bergen, Camden, Essex, Gloucester, Somerset, and Union Counties; Morris County Municipal Utilities Author-ity; New Jersey Water Supply Authority; North Jersey District Water Supply Commission; Passaic Valley Water Commission; and West Windsor Township for supporting the data-collection and -analysis efforts that greatly expanded the peak-flow database used in this study. Thanks to Mark A. Roland of the USGS Pennsylvania Water Science Center, William P. Bartlett of the USGS Eastern Region, John Moyle, Joseph Ruggeri, and John Scordato of the NJDEP for providing helpful col-league reviews. Jonathan J.A. Dillow of the USGS Maryland-Delaware-District of Columbia Water Science Center provided mentoring with GLSNet. Peter A. Steeves, John D. Guthrie, and the rest of the USGS National StreamStats team provided help with and work on the web application.
References Cited
Anderson, J.R., Hardy, E.E., Roach, J.T., and Witmer, R.E., 1976, A land use and land cover clas sification system for use with remote sensor data: U.S. Geological Survey Pro-fessional Paper 964, 28 p.
Dalrymple, Tate, 1960, Flood frequency analysis: U.S. Geo-logical Survey Water-Supply Paper 1543-A, 80 p.
Environmental Systems Research Institute, Inc., 2007, Hydro Data Model, accessed August 29, 2007, at http://support.esri.com/index.cfm?fa=downloads.dataModels.filteredGateway&dmid=15.
Federal Emergency Management Agency, 1995, Flood insurance study, Bergen County, New Jersey (All Jurisdic-tions): Washington, D.C., Federal Emergency Management Agency, v. 1–5, unpaginated.
Federal Emergency Management Agency, 2007, Flood insur-ance study, Passaic County, New Jersey: Washington, D.C., Federal Emergency Management Agency, v. 1–5, unpagi-nated.
Federal Emergency Management Agency, 1985, Flood insur-ance study, Morris County, New Jersey: Washington, D.C., Federal Emergency Management Agency.
Fenneman, N.M., 1938, Physiography of Eastern United States: New York, McGraw-Hill, 714 p.
Hardison, C.H., 1971, Prediction error of regression estimates of streamflow characteristics at ungaged sites, in Geologi-cal Survey research 1971, chap. C: U.S. Geological Survey Professional Paper 750-C, p. C228–C236.
Helsel, D.R., and Hirsch, R.M., 2002, Statistical methods in Water Resources: U.S. Geological Survey Techniques of Water-Resources Investigations, book 4, chap. A3, 510 p.
Interagency Advisory Committee on Water Data, 1982, Guide-lines for determining flood flow frequency: Hydrology Subcommittee Bulletin 17B (Distributed by U.S. Geological Survey, Office of Water Data Coordination, Reston, Va.), 183 p.
Lins, H.F., 2005, Streamflow trends in the United States…from the National Streamflow Information Program: U.S. Geological Survey Fact Sheet 2005–3017, 4 p.
Lumia, Richard, 1991, Regionalization of flood discharges for rural, unregulated streams in New York, excluding Long Island: U.S. Geological Survey Water-Resources Investiga-tions Report 90-4197, 119 p.

36 Methodology for Estimation of Flood Magnitude and Frequency for New Jersey Streams
Lumia, Richard, 2000, Development of a contour map show-ing generalized skew coefficients of annual peak discharges of rural, unregulated streams in New York, excluding Long Island: U.S. Geological Survey Water-Resources Investiga-tions Report 00-4022, 11 p.
Lumia, R., Freehafer, D.A., and Smith, M.J., 2006, Magnitude and frequency of floods in New York: U.S. Geological Sur-vey Scientific Investigations Report 2006–5112, 153 p.
McCall, J.E., and Lendo, A.C., 1970, A modified streamflow data program for New Jersey: U.S. Geological Survey Open-File Report, 46 p., 1 app.
Minitab, Inc., 2006, Minitab 15 Statistical Software: State College, PA, LEAD Technologies, Inc.
New Jersey Department of Environmental Protection and New Jersey Geological Survey, 2000, Watersheds (Subwater-sheds by name–DEPHUC14): Trenton, N.J.
New Jersey Department of Environmental Protection, 2007, NJDEP 2002 Landuse/Landcover by Watershed Manage-ment Area (WMA): Trenton, N.J.
Parker, G.G., Hely, A.G., Keighton, W.B., Olmstead, F.H., and others, 1964, Water resources of the Delaware River basin: U.S. Geological Survey Professional Paper 381, 200 p.
Quakenbush, G.A., and Tedrow, J.C.F., 1954, Land type areas of New Jersey: New Brunswick, New Jersey, New Jersey Agricultural Experiment Station, Rutgers University, 1 map, scale 1:506,880.
Ries, K.G., III, Steeves, P.A., Coles, J.D., Rea, A.H., and Stewart, D.W., 2004, StreamStats: A U.S. Geological Sur-vey web application for stream information: U.S. Geologi-cal Survey Fact Sheet 2004–3115, 4 p.
Ries, K.G., and Dillow, J.J.A., 2006, Magnitude and frequency of floods on nontidal streams in Delaware: U.S. Geological Survey Scientific Investigations Report 2006–5146, 59 p.
Roland, M.A., and Stuckey, M.H., 2008, Regression equations for estimating flood flows at selected recurrence intervals for ungaged streams in Pennsylvania: U.S. Geological Sur-vey Scientific Investigations Report 2008–5102, 57 p.
Sauer, V.B., 1974, Flood characteristics of Oklahoma streams: U.S. Geological Survey Water-Resources Investigations Report 52-73, 301 p.
Schopp, R.D., and Firda, G.D., 2008, Flood magnitude and frequency of the Delaware River in New Jersey, New York, and Pennsylvania: U.S. Geological Survey Open-File Report 2008–1203, 9 p.
Stankowski, S.J., 1972, Population density as an indirect indi-cator of urban and suburban land-surface modifications, in Geological Survey Research 1972, chap. B: U.S. Geological Survey Professional Paper 800-B, p. B219–B224.
Stankowski, S.J., 1974, Magnitude and frequency of floods in New Jersey with effects of urbanization: Trenton, N.J., New Jersey Department of Environmental Protection, Special Report 38, 45 p.
Steeves, P.A., 2002, NHD Watershed: Tools and applications, in Symposium on Terrain Analysis for Water Resources Applications, December 16–18, 2002, University of Texas, Austin, Texas, accessed July 9, 2007, at http://www.crwr.utexas.edu/terrainAnalysis/presentations/121802/track2%20(rm%20122)/steeves/NHD%20Watershed.ppt.
Stuckey, M.H., and Reed, L.A., 2000, Techniques for estimat-ing magnitude and frequency of peak flows for Pennsyl-vania streams: U.S. Geological Survey Water-Resources Investigations Report 00-4189, 43 p.
Tasker, G.D., and Stedinger, A.M., 1986, Regional skew with weighted LS regression: Journal of Water Resources Plan-ning and Management, v. 3, no. 2, p. 225–237.
Tasker, G.D., and Stedinger, A.M., 1989, An operational GLS model for hydrologic regression: Journal of Hydrology, v. 3, p. 361–375.
Thomas, D.M., 1964, Floods in New Jersey, magnitude and frequency: Trenton, N.J., New Jersey Department of Con-servation and Economic Development, Circular 13, 145 p.
Thomas, D.M., and Benson, M.A., 1970, Generalization of streamflow characteristics from drainage basin character-istics: U.S. Geological Survey Water-Supply Paper 1975, 55 p.
Tice, R.H., 1968, Magnitude and frequency of floods in the United States, part 1-B, North Atlantic slope basins, New York to York River: U.S. Geological Survey Water-Supply Paper 1672, 585 p.
Turnipseed, D.P., and Ries, K.G., III, 2007, The National Streamflow Statistics Program: Estimating high and low streamflow statistics for ungaged sites: U.S. Geological Survey Fact Sheet 2007–3010, 4 p.
U.S. Army Corps of Engineers, 1983, Generalized skew study for the Delaware River basin: Special projects memo no. 83-1, 43 p.
U.S. Census Bureau, 2007, Census 2000 summary file 1 technical documentation: Washington, D.C., U.S. Census Bureau, 637 p.

References Cited 37
U.S. Census Bureau, 2008, Census 2000 State and county quick facts, accessed on June 20, 2008, at http://www.census.gov/main/www/cen2000.html.
U.S. Geological Survey, 1999a, The national hydrography data set, accessed November 27, 2006, at http://nhd.usgs.gov/.
U.S. Geological Survey, 1999b, The national elevation data set, accessed November 27, 2006, at http://ned.usgs.gov/ .
U.S. Geological Survey, 2002, Low-flow statistics for Pennsylvania streams, documentation of statistics com-putation methodology: U.S. Geological Survey, New Cumberland, Pennsylvania, accessed June 1, 2009, at http://pa.water.usgs.gov/pc38/flowstats/.
Vermeule, C.C., 1894, Report on water-supply, water power, the flow of streams and attendant phenomena: Geological Survey of New Jersey, Volume III of the Final Report of the State Geologist: Trenton, N.J., 351 p., 2 app.
Water Resources Council, Hydrology Committee, 1967, A uniform technique for determining flood flow frequencies, Bulletin 15: Washington, D.C.
Workforce New Jersey Public Information Network, 2000, Table 6, New Jersey resident population by munici-pality: 1930–1990, accessed February 23, 2007, at http://www.wnjpin.state.nj.us/OneStopCareerCenter/LaborMarketInformation/lmi01/poptrd6.htm.
Yang, Limin, Huang, Chengquan, Homer, C.G., Wylie, B.K., and Coan, M.J., 2003, An approach for mapping large-area impervious surfaces: Synergistic use of Landsat 7 ETM+ and high spatial resolution imagery, accessed July 9, 2007, at http://landcover.usgs.gov/pdf/imppaperfinalwithall.pdf.

38 Methodology for Estimation of Flood Magnitude and Frequency for New Jersey Streams
This page intentionally left blank.

Appendixes 1–2

40 Methodology for Estimation of Flood Magnitude and Frequency for New Jersey Streams
Appendix 1. Results of skew analysis for 119 streamflow-gaging stations in New Jersey and surrounding States.—Continued
[USGS, U.S. Geological Survey; Hst. period, years specified for historic data adjustment; --, not applicable]
USGS station number
Station nameYears
of peak record
Hst. period
Station skew
Unbiased station skew
Skew region
01368000 Wallkill River near Unionville, NY 51 62 1.010 1.129 Non-Coastal Plain01368500 Rutgers Creek at Gardnerville, NY 41 -- 1.254 1.438 Non-Coastal Plain01369000 Pochuck Creek near Pine Island, NY 41 -- 0.488 0.559 Non-Coastal Plain01369500 Quaker Creek at Florida, NY 43 -- 0.242 0.276 Non-Coastal Plain01377500 Pascack Brook at Westwood, NJ 73 -- 0.641 0.694 Non-Coastal Plain01378385 Tenakill Brook at Closter, NJ 42 -- 0.239 0.273 Non-Coastal Plain01378590 Metzler Brook at Englewood, NJ 43 -- 0.482 0.549 Non-Coastal Plain01378690 Passaic River near Bernardsville, NJ 40 -- 0.407 0.468 Non-Coastal Plain01379000 Passaic River near Millington, NJ 89 -- 0.212 0.226 Non-Coastal Plain01379500 Passaic River near Chatham, NJ 70 -- 0.314 0.341 Non-Coastal Plain01380500 Rockaway River above Reservoir, at Boonton, NJ 69 -- 0.068 0.074 Non-Coastal Plain01381500 Whippany River at Morristown, NJ 86 -- -0.097 -0.104 Non-Coastal Plain01381900 Passaic River at Pine Brook, NJ 40 -- -0.301 -0.346 Non-Coastal Plain01383500 Wanaque River at Awosting, NJ 89 -- 0.354 0.378 Non-Coastal Plain01384000 Wanaque River at Monks, NJ 52 -- -0.536 -0.598 Non-Coastal Plain01384500 Ringwood Creek near Wanaque, NJ 64 -- 0.656 0.718 Non-Coastal Plain01386000 West Brook near Wanaque, NJ 49 72 0.222 0.249 Non-Coastal Plain01387500 Ramapo River near Mahwah, NJ 96 103 0.505 0.537 Non-Coastal Plain01387880 Pond Brook at Oakland, NJ 35 -- 0.733 0.859 Non-Coastal Plain01388000 Ramapo River at Pompton Lakes, NJ 85 -- 0.393 0.421 Non-Coastal Plain01389030 Preakness Brook near Preakness, NJ 29 -- 0.940 1.134 Non-Coastal Plain01389534 Peckman River at Ozone Avenue, at Verona, NJ 29 61 0.694 0.838 Non-Coastal Plain01389765 Molly Ann Brook at North Haledon, NJ 29 62 0.970 1.171 Non-Coastal Plain01389900 Fleischer Brook at Market Street, at Elmwood Park, NJ 39 -- 1.508 1.740 Non-Coastal Plain01390500 Saddle River at Ridgewood, NJ 53 62 1.005 1.119 Non-Coastal Plain01390900 Ramsey Brook at Allendale, NJ 33 -- 0.252 0.298 Non-Coastal Plain01391500 Saddle River at Lodi, NJ 42 -- -0.131 -0.150 Non-Coastal Plain01393450 Elizabeth River at Ursino Lake, at Elizabeth, NJ 55 -- -0.039 -0.043 Non-Coastal Plain01394500 Rahway River near Springfield, NJ 67 -- 1.144 1.246 Non-Coastal Plain01395000 Rahway River at Rahway, NJ 86 -- 0.426 0.456 Non-Coastal Plain01396000 Robinsons Branch at Rahway, NJ 66 69 0.337 0.368 Non-Coastal Plain01396500 South Branch Raritan River near High Bridge, NJ 90 111 0.317 0.338 Non-Coastal Plain01396582 Spruce Run at Main Street, at Glen Gardner, NJ 26 -- -0.126 -0.155 Non-Coastal Plain01396660 Mulhockaway Creek at Van Syckel, NJ 30 -- -0.314 -0.377 Non-Coastal Plain01397000 South Branch Raritan River at Stanton, NJ 92 -- 0.072 0.077 Non-Coastal Plain01397500 Walnut Brook near Flemington, NJ 71 -- 0.105 0.114 Non-Coastal Plain01398000 Neshanic River at Reaville, NJ 77 -- 0.689 0.743 Non-Coastal Plain01398045 Back Brook tributary near Ringoes, NJ 29 -- -0.185 -0.223 Non-Coastal Plain01398107 Holland Brook at Readington, NJ 26 -- 1.445 1.778 Non-Coastal Plain01398500 North Branch Raritan River near Far Hills, NJ 86 88 0.222 0.237 Non-Coastal Plain

Appendix 1 41
Appendix 1. Results of skew analysis for 119 streamflow-gaging stations in New Jersey and surrounding States.—Continued
[USGS, U.S. Geological Survey; Hst. period, years specified for historic data adjustment; --, not applicable]
USGS station number
Station nameYears
of peak record
Hst. period
Station skew
Unbiased station skew
Skew region
01399500 Lamington (Black) River near Pottersville, NJ 86 -- 0.382 0.409 Non-Coastal Plain01399510 Upper Cold Brook near Pottersville, NJ 25 -- 1.340 1.662 Non-Coastal Plain01399525 Axle Brook near Pottersville, NJ 29 -- -0.208 -0.251 Non-Coastal Plain01399670 South Branch Rockaway Creek at Whitehouse Station, NJ 30 -- 0.094 0.113 Non-Coastal Plain01400000 North Branch Raritan River near Raritan, NJ 85 111 0.534 0.572 Non-Coastal Plain01400500 Raritan River at Manville, NJ 96 111 0.654 0.695 Non-Coastal Plain01400730 Millstone River at Plainsboro, NJ 36 -- 0.039 0.046 Coastal Plain01400900 Stony Brook at Glenmoore, NJ 40 -- 0.257 0.296 Non-Coastal Plain01400930 Baldwins Creek at Pennington, NJ 48 -- -0.182 -0.205 Non-Coastal Plain01400950 Hart Brook near Pennington, NJ 39 -- -0.038 -0.044 Non-Coastal Plain01401000 Stony Brook at Princeton, NJ 54 -- 0.515 0.572 Non-Coastal Plain01401301 Millstone River at Carnegie Lake, at Princeton, NJ 50 84 -0.395 -0.442 Non-Coastal Plain01401595 Rock Brook near Blawenburg, NJ 40 -- 0.672 0.773 Non-Coastal Plain01401600 Beden Brook near Rocky Hill, NJ 40 -- 0.463 0.532 Non-Coastal Plain01401650 Pike Run at Belle Mead, NJ 28 197 1.038 1.260 Non-Coastal Plain01401870 Six Mile Run near Middlebush, NJ 40 -- 0.326 0.375 Non-Coastal Plain01402000 Millstone River at Blackwells Mills, NJ 87 -- 0.400 0.428 Non-Coastal Plain01402600 Royce Brook tributary near Belle Mead, NJ 29 195 1.621 1.956 Non-Coastal Plain01403060 Raritan River below Calco Dam, at Bound Brook, NJ 76 306 0.272 0.293 Non-Coastal Plain01403400 Green Brook at Seeley Mills, NJ 39 110 0.654 0.755 Non-Coastal Plain01403500 Green Brook at Plainfield, NJ 72 -- 0.701 0.759 Non-Coastal Plain01403540 Stony Brook at Watchung, NJ 33 110 0.953 1.126 Non-Coastal Plain01405400 Manalapan Brook at Spotswood, NJ 51 -- 0.166 0.186 Coastal Plain01405500 South River at Old Bridge NJ 49 -- -0.058 -0.065 Coastal Plain01407290 Big Brook near Marlboro, NJ 28 -- -0.921 -1.118 Coastal Plain01407705 Shark River near Neptune City, NJ 41 -- 0.555 0.636 Coastal Plain01407760 Jumping Brook near Neptune City, NJ 41 -- -0.430 -0.493 Coastal Plain01407830 Manasquan River near Georgia, NJ 27 -- -0.083 -0.101 Coastal Plain01408000 Manasquan River at Squankum, NJ 76 -- -0.320 -0.345 Coastal Plain01408015 Mingamahone Brook at Farmingdale, NJ 39 -- 0.357 0.412 Coastal Plain01408029 Manasquan River near Allenwood, NJ 39 -- -0.833 -0.961 Coastal Plain01408120 North Branch Metedeconk River near Lakewood, NJ 35 -- -0.364 -0.426 Coastal Plain01408500 Toms River near Toms River, NJ 79 -- -0.003 -0.003 Coastal Plain01409000 Cedar Creek at Lanoka Harbor, NJ 39 -- 0.648 0.748 Coastal Plain01409400 Mullica River near Batsto, NJ 50 -- 0.156 0.175 Coastal Plain01409500 Batsto River at Batsto, NJ 78 -- -0.198 -0.213 Coastal Plain01409810 West Branch Wading River near Jenkins, NJ 25 -- -0.879 -1.090 Coastal Plain01410000 Oswego River at Harrisville, NJ 77 -- 0.154 0.166 Coastal Plain01410150 East Branch Bass River near New Gretna, NJ 30 -- 1.313 1.576 Coastal Plain01411000 Great Egg Harbor River at Folsom, NJ 82 -- 0.373 0.400 Coastal Plain
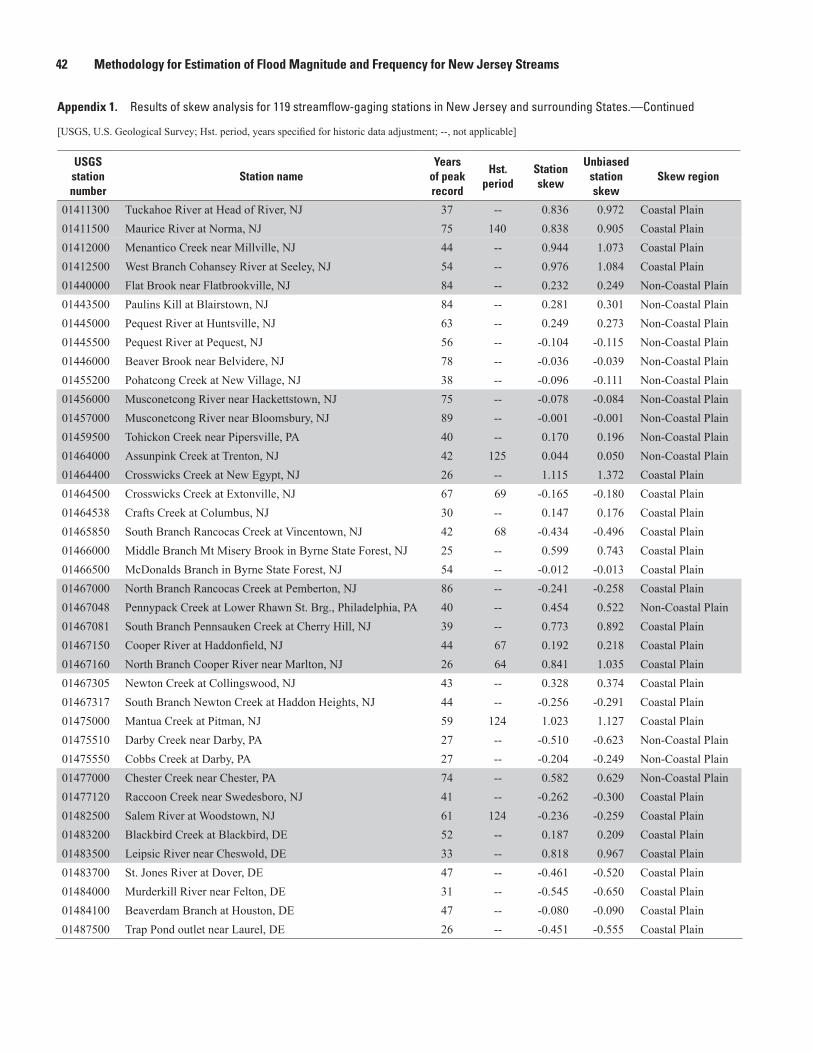
42 Methodology for Estimation of Flood Magnitude and Frequency for New Jersey Streams
Appendix 1. Results of skew analysis for 119 streamflow-gaging stations in New Jersey and surrounding States.—Continued
[USGS, U.S. Geological Survey; Hst. period, years specified for historic data adjustment; --, not applicable]
USGS station number
Station nameYears
of peak record
Hst. period
Station skew
Unbiased station skew
Skew region
01411300 Tuckahoe River at Head of River, NJ 37 -- 0.836 0.972 Coastal Plain01411500 Maurice River at Norma, NJ 75 140 0.838 0.905 Coastal Plain01412000 Menantico Creek near Millville, NJ 44 -- 0.944 1.073 Coastal Plain01412500 West Branch Cohansey River at Seeley, NJ 54 -- 0.976 1.084 Coastal Plain01440000 Flat Brook near Flatbrookville, NJ 84 -- 0.232 0.249 Non-Coastal Plain01443500 Paulins Kill at Blairstown, NJ 84 -- 0.281 0.301 Non-Coastal Plain01445000 Pequest River at Huntsville, NJ 63 -- 0.249 0.273 Non-Coastal Plain01445500 Pequest River at Pequest, NJ 56 -- -0.104 -0.115 Non-Coastal Plain01446000 Beaver Brook near Belvidere, NJ 78 -- -0.036 -0.039 Non-Coastal Plain01455200 Pohatcong Creek at New Village, NJ 38 -- -0.096 -0.111 Non-Coastal Plain01456000 Musconetcong River near Hackettstown, NJ 75 -- -0.078 -0.084 Non-Coastal Plain01457000 Musconetcong River near Bloomsbury, NJ 89 -- -0.001 -0.001 Non-Coastal Plain01459500 Tohickon Creek near Pipersville, PA 40 -- 0.170 0.196 Non-Coastal Plain01464000 Assunpink Creek at Trenton, NJ 42 125 0.044 0.050 Non-Coastal Plain01464400 Crosswicks Creek at New Egypt, NJ 26 -- 1.115 1.372 Coastal Plain01464500 Crosswicks Creek at Extonville, NJ 67 69 -0.165 -0.180 Coastal Plain01464538 Crafts Creek at Columbus, NJ 30 -- 0.147 0.176 Coastal Plain01465850 South Branch Rancocas Creek at Vincentown, NJ 42 68 -0.434 -0.496 Coastal Plain01466000 Middle Branch Mt Misery Brook in Byrne State Forest, NJ 25 -- 0.599 0.743 Coastal Plain01466500 McDonalds Branch in Byrne State Forest, NJ 54 -- -0.012 -0.013 Coastal Plain01467000 North Branch Rancocas Creek at Pemberton, NJ 86 -- -0.241 -0.258 Coastal Plain01467048 Pennypack Creek at Lower Rhawn St. Brg., Philadelphia, PA 40 -- 0.454 0.522 Non-Coastal Plain01467081 South Branch Pennsauken Creek at Cherry Hill, NJ 39 -- 0.773 0.892 Coastal Plain01467150 Cooper River at Haddonfield, NJ 44 67 0.192 0.218 Coastal Plain01467160 North Branch Cooper River near Marlton, NJ 26 64 0.841 1.035 Coastal Plain01467305 Newton Creek at Collingswood, NJ 43 -- 0.328 0.374 Coastal Plain01467317 South Branch Newton Creek at Haddon Heights, NJ 44 -- -0.256 -0.291 Coastal Plain01475000 Mantua Creek at Pitman, NJ 59 124 1.023 1.127 Coastal Plain01475510 Darby Creek near Darby, PA 27 -- -0.510 -0.623 Non-Coastal Plain01475550 Cobbs Creek at Darby, PA 27 -- -0.204 -0.249 Non-Coastal Plain01477000 Chester Creek near Chester, PA 74 -- 0.582 0.629 Non-Coastal Plain01477120 Raccoon Creek near Swedesboro, NJ 41 -- -0.262 -0.300 Coastal Plain01482500 Salem River at Woodstown, NJ 61 124 -0.236 -0.259 Coastal Plain01483200 Blackbird Creek at Blackbird, DE 52 -- 0.187 0.209 Coastal Plain01483500 Leipsic River near Cheswold, DE 33 -- 0.818 0.967 Coastal Plain01483700 St. Jones River at Dover, DE 47 -- -0.461 -0.520 Coastal Plain01484000 Murderkill River near Felton, DE 31 -- -0.545 -0.650 Coastal Plain01484100 Beaverdam Branch at Houston, DE 47 -- -0.080 -0.090 Coastal Plain01487500 Trap Pond outlet near Laurel, DE 26 -- -0.451 -0.555 Coastal Plain

Appendix 2 43A
ppen
dix
2.
Floo
d-fre
quen
cy e
stim
ates
com
pute
d fro
m o
bser
ved
stre
amflo
w-g
agin
g st
atio
n da
ta, p
redi
cted
from
regr
essi
on e
quat
ions
, and
a w
eigh
ted
aver
age
for
stre
amflo
w-g
agin
g st
atio
ns.—
Cont
inue
d
[USG
S, U
.S. G
eolo
gica
l Sur
vey;
dis
char
ges a
re in
cub
ic fe
et p
er se
cond
; O is
the
obse
rved
dat
a ca
lcul
ated
from
the
syst
emat
ic re
cord
at t
he st
ream
flow
-gag
ing
stat
ion,
R is
est
imat
ed fr
om th
e re
gres
sion
eq
uatio
n, a
nd W
is th
e w
eigh
ted
estim
ate;
GP,
Gla
ciat
ed P
iedm
ont P
hysi
ogra
phic
Pro
vinc
e; IN
, Inn
er C
oast
al P
hysi
ogra
phic
Pro
vinc
e; O
C, O
uter
Coa
stal
Phy
siog
raph
ic P
rovi
nce;
UP,
Ung
laci
ated
Pie
dmon
t Ph
ysio
grap
hic
Prov
ince
; VR
, Val
ley
and
Rid
ge P
hysi
ogra
phic
Pro
vinc
e.]
USG
S
stat
ion
nu
mbe
rRe
gion
Estim
ated
dis
char
ge fo
r rec
urre
nce
inte
rval
s, in
cub
ic fe
et p
er s
econ
d
2-ye
ar
5-ye
ar
10-y
ear
25-y
ear
50-y
ear
100-
year
50
0-ye
ar
OR
WO
RW
OR
WO
RW
OR
WO
RW
OR
W
0136
8000
VR
1,70
02,
010
1,71
02,
390
3,16
02,
420
2,93
04,
040
2,99
03,
740
5,27
03,
850
4,44
06,
200
4,58
05,
220
7,28
05,
410
7,43
09,
920
7,70
0
0136
8500
VR
1,55
01,
150
1,54
02,
380
1,95
02,
360
3,11
02,
600
3,08
04,
270
3,55
04,
210
5,35
04,
320
5,25
06,
630
5,21
06,
480
10,7
007,
560
10,3
00
0136
9000
VR
1,20
01,
820
1,22
01,
720
2,90
01,
780
2,11
03,
750
2,22
02,
690
4,94
02,
890
3,16
05,
860
3,43
03,
690
6,92
04,
060
5,12
09,
570
5,71
0
0136
9500
VR
370
371
370
551
619
554
689
818
698
885
1,10
090
41,
050
1,33
01,
080
1,22
01,
590
1,26
01,
700
2,26
01,
770
0137
0000
VR
4,03
04,
600
4,04
05,
620
7,26
05,
680
6,84
09,
340
6,97
08,
580
12,3
008,
840
10,0
0014
,600
10,4
0011
,600
17,2
0012
,100
16,0
0023
,800
16,8
00
0137
0500
VR
5,14
04,
930
5,13
06,
910
7,76
06,
970
8,18
09,
970
8,35
09,
910
13,1
0010
,300
11,3
0015
,500
11,9
0012
,700
18,3
0013
,500
16,5
0025
,300
18,0
00
0137
1000
VR
3,15
01,
720
3,08
04,
780
2,90
04,
640
5,95
03,
870
5,73
07,
520
5,31
07,
230
8,76
06,
480
8,42
010
,000
7,84
09,
650
13,3
0011
,400
12,9
00
0137
3690
VR
513
542
516
1,07
091
41,
050
1,59
01,
220
1,52
02,
430
1,67
02,
250
3,23
02,
030
2,92
04,
170
2,45
03,
690
7,07
03,
540
5,94
0
0137
4130
VR
225
360
238
315
630
362
380
857
475
468
1,19
064
953
81,
480
794
611
1,80
096
679
82,
670
1,43
0
0137
4250
VR
372
520
378
671
883
684
939
1,18
096
01,
370
1,62
01,
400
1,78
01,
970
1,80
02,
260
2,38
02,
280
3,76
03,
440
3,71
0
0137
7475
GP
328
271
325
582
423
568
801
538
769
1,14
069
51,
070
1,45
082
01,
340
1,80
095
11,
640
2,84
01,
270
2,50
0
0137
7490
GP
240
480
253
306
724
342
351
900
417
411
1,14
052
245
61,
320
602
503
1,51
069
262
01,
960
910
0137
7500
GP
849
1,56
086
11,
450
2,31
01,
470
1,98
02,
860
2,01
02,
830
3,60
02,
870
3,62
04,
170
3,65
04,
560
4,77
04,
570
7,51
06,
200
7,41
0
0137
8350
GP
168
488
195
196
772
271
213
995
351
232
1,31
047
124
51,
560
566
258
1,83
067
928
52,
510
961
0137
8385
GP
472
811
482
723
1,24
074
791
61,
560
959
1,19
01,
990
1,26
01,
420
2,33
01,
510
1,67
02,
690
1,78
02,
350
3,57
02,
500
0137
8590
GP
194
196
194
274
297
275
333
370
335
417
468
421
485
544
491
559
622
566
755
807
761
0137
8615
GP
397
287
391
546
423
536
642
521
628
762
647
745
850
744
833
937
843
920
1,14
01,
070
1,13
0
0137
8690
VR
740
369
728
1,36
061
81,
320
1,92
082
01,
840
2,83
01,
110
2,67
03,
680
1,35
03,
440
4,69
01,
620
4,34
07,
880
2,31
07,
140
0137
9000
VR
817
857
818
1,17
01,
320
1,17
01,
430
1,66
01,
440
1,79
02,
130
1,80
02,
070
2,47
02,
090
2,37
02,
860
2,40
03,
140
3,78
03,
180
0137
9500
VR
1,30
01,
100
1,30
01,
800
1,67
01,
800
2,15
02,
090
2,15
02,
630
2,65
02,
630
3,00
03,
050
3,00
03,
380
3,51
03,
390
4,35
04,
600
4,37
0
0137
9700
VR
408
679
433
654
1,10
071
686
01,
430
968
1,18
01,
900
1,35
01,
460
2,27
01,
670
1,78
02,
690
2,04
02,
740
3,74
03,
060
0137
9773
VR
116
256
123
182
423
201
234
553
268
308
736
367
371
879
449
440
1,04
054
262
91,
450
791
0137
9790
VR
208
376
217
321
620
345
410
810
454
538
1,08
061
564
61,
290
748
765
1,53
089
91,
090
2,14
01,
300
0138
0500
VR
2,02
01,
920
2,02
03,
030
2,98
03,
030
3,77
03,
780
3,77
04,
770
4,89
04,
780
5,57
05,
720
5,58
06,
410
6,68
06,
430
8,55
09,
000
8,59
0
0138
1400
VR
685
602
677
1,65
098
51,
550
2,69
01,
290
2,41
04,
660
1,73
03,
930
6,73
02,
070
5,46
09,
460
2,47
07,
380
19,4
003,
460
14,0
00
0138
1500
VR
929
1,04
093
11,
380
1,65
01,
390
1,70
02,
140
1,71
02,
120
2,82
02,
150
2,45
03,
360
2,50
02,
780
3,96
02,
850
3,61
05,
460
3,73
0
0138
1800
VR
793
1,45
086
31,
050
2,24
01,
240
1,23
02,
830
1,57
01,
470
3,64
02,
050
1,67
04,
240
2,42
01,
870
4,94
02,
840
2,39
06,
590
3,89
0
0138
1900
VR
3,42
04,
870
3,47
04,
700
7,35
04,
830
5,54
09,
210
5,80
06,
590
11,8
007,
060
7,37
013
,600
8,00
08,
140
15,8
009,
010
9,95
021
,000
11,4
00
0138
3500
VR
483
836
488
895
1,33
090
51,
270
1,71
01,
280
1,87
02,
250
1,89
02,
430
2,66
02,
440
3,09
03,
130
3,09
05,
170
4,29
05,
110
0138
4000
VR
1,03
01,
060
1,03
01,
730
1,69
01,
730
2,26
02,
180
2,26
03,
010
2,87
03,
000
3,62
03,
410
3,60
04,
280
4,02
04,
260
6,01
05,
530
5,96
0
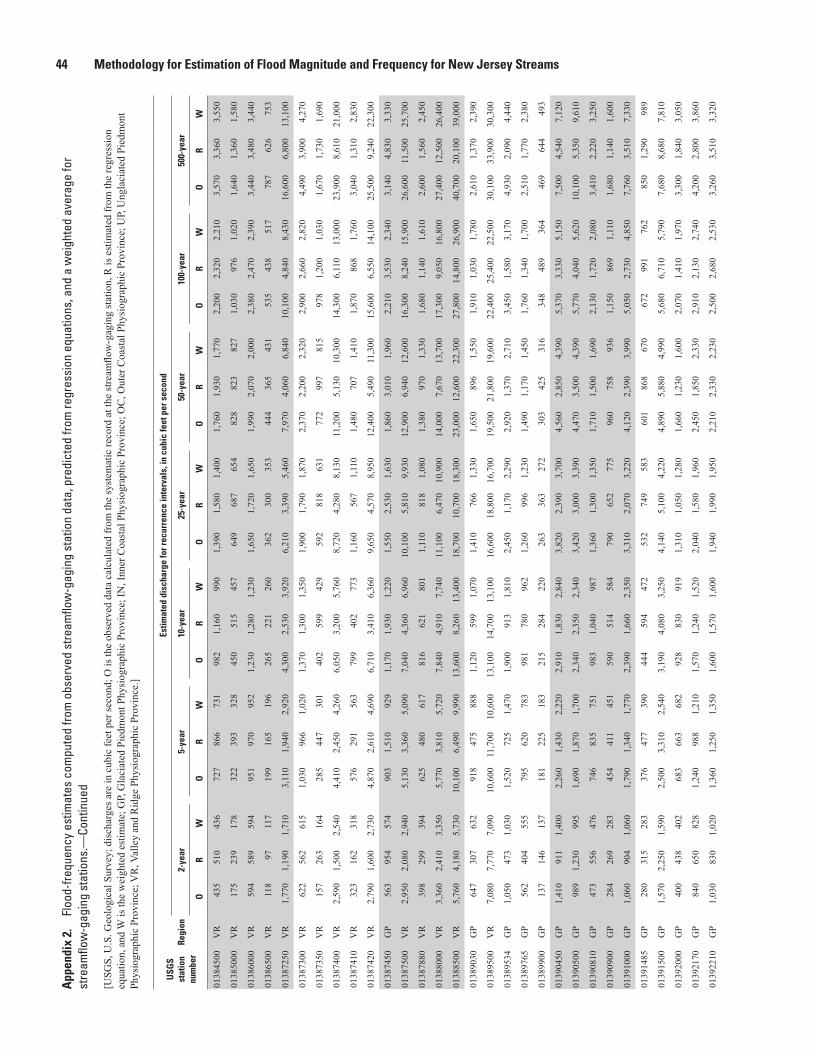
44 Methodology for Estimation of Flood Magnitude and Frequency for New Jersey StreamsA
ppen
dix
2.
Floo
d-fre
quen
cy e
stim
ates
com
pute
d fro
m o
bser
ved
stre
amflo
w-g
agin
g st
atio
n da
ta, p
redi
cted
from
regr
essi
on e
quat
ions
, and
a w
eigh
ted
aver
age
for
stre
amflo
w-g
agin
g st
atio
ns.—
Cont
inue
d
[USG
S, U
.S. G
eolo
gica
l Sur
vey;
dis
char
ges a
re in
cub
ic fe
et p
er se
cond
; O is
the
obse
rved
dat
a ca
lcul
ated
from
the
syst
emat
ic re
cord
at t
he st
ream
flow
-gag
ing
stat
ion,
R is
est
imat
ed fr
om th
e re
gres
sion
eq
uatio
n, a
nd W
is th
e w
eigh
ted
estim
ate;
GP,
Gla
ciat
ed P
iedm
ont P
hysi
ogra
phic
Pro
vinc
e; IN
, Inn
er C
oast
al P
hysi
ogra
phic
Pro
vinc
e; O
C, O
uter
Coa
stal
Phy
siog
raph
ic P
rovi
nce;
UP,
Ung
laci
ated
Pie
dmon
t Ph
ysio
grap
hic
Prov
ince
; VR
, Val
ley
and
Rid
ge P
hysi
ogra
phic
Pro
vinc
e.]
USG
S
stat
ion
nu
mbe
rRe
gion
Estim
ated
dis
char
ge fo
r rec
urre
nce
inte
rval
s, in
cub
ic fe
et p
er s
econ
d
2-ye
ar
5-ye
ar
10-y
ear
25-y
ear
50-y
ear
100-
year
50
0-ye
ar
OR
WO
RW
OR
WO
RW
OR
WO
RW
OR
W
0138
4500
VR
435
510
436
727
866
731
982
1,16
099
01,
390
1,58
01,
400
1,76
01,
930
1,77
02,
200
2,32
02,
210
3,57
03,
360
3,55
0
0138
5000
VR
175
239
178
322
393
328
450
515
457
649
687
654
828
823
827
1,03
097
61,
020
1,64
01,
360
1,58
0
0138
6000
VR
594
589
594
951
970
952
1,23
01,
280
1,23
01,
650
1,72
01,
650
1,99
02,
070
2,00
02,
380
2,47
02,
390
3,44
03,
480
3,44
0
0138
6500
VR
118
9711
719
916
519
626
522
126
036
230
035
344
436
543
153
543
851
778
762
675
3
0138
7250
VR
1,77
01,
190
1,71
03,
110
1,94
02,
920
4,30
02,
530
3,92
06,
210
3,39
05,
460
7,97
04,
060
6,84
010
,100
4,84
08,
430
16,6
006,
800
13,1
00
0138
7300
VR
622
562
615
1,03
096
61,
020
1,37
01,
300
1,35
01,
900
1,79
01,
870
2,37
02,
200
2,32
02,
900
2,66
02,
820
4,49
03,
900
4,27
0
0138
7350
VR
157
263
164
285
447
301
402
599
429
592
818
631
772
997
815
978
1,20
01,
030
1,67
01,
730
1,69
0
0138
7400
VR
2,59
01,
500
2,54
04,
410
2,45
04,
260
6,05
03,
200
5,76
08,
720
4,28
08,
130
11,2
005,
130
10,3
0014
,300
6,11
013
,000
23,9
008,
610
21,0
00
0138
7410
VR
323
162
318
576
291
563
799
402
773
1,16
056
71,
110
1,48
070
71,
410
1,87
086
81,
760
3,04
01,
310
2,83
0
0138
7420
VR
2,79
01,
600
2,73
04,
870
2,61
04,
690
6,71
03,
410
6,36
09,
650
4,57
08,
950
12,4
005,
490
11,3
0015
,600
6,55
014
,100
25,5
009,
240
22,3
00
0138
7450
GP
563
954
574
903
1,51
092
91,
170
1,93
01,
220
1,55
02,
530
1,63
01,
860
3,01
01,
960
2,21
03,
530
2,34
03,
140
4,83
03,
330
0138
7500
VR
2,95
02,
080
2,94
05,
130
3,36
05,
090
7,04
04,
360
6,96
010
,100
5,81
09,
930
12,9
006,
940
12,6
0016
,300
8,24
015
,900
26,6
0011
,500
25,7
00
0138
7880
VR
398
299
394
625
480
617
816
621
801
1,11
081
81,
080
1,38
097
01,
330
1,68
01,
140
1,61
02,
600
1,56
02,
450
0138
8000
VR
3,36
02,
410
3,35
05,
770
3,81
05,
720
7,84
04,
910
7,74
011
,100
6,47
010
,900
14,0
007,
670
13,7
0017
,300
9,05
016
,800
27,4
0012
,500
26,4
00
0138
8500
VR
5,76
04,
180
5,73
010
,100
6,49
09,
990
13,6
008,
260
13,4
0018
,700
10,7
0018
,300
23,0
0012
,600
22,3
0027
,800
14,8
0026
,900
40,7
0020
,100
39,0
00
0138
9030
GP
647
307
632
918
475
888
1,12
059
91,
070
1,41
076
61,
330
1,65
089
61,
550
1,91
01,
030
1,78
02,
610
1,37
02,
390
0138
9500
VR
7,08
07,
770
7,09
010
,600
11,7
0010
,600
13,1
0014
,700
13,1
0016
,600
18,8
0016
,700
19,5
0021
,800
19,6
0022
,400
25,4
0022
,500
30,1
0033
,900
30,3
00
0138
9534
GP
1,05
047
31,
030
1,52
072
51,
470
1,90
091
31,
810
2,45
01,
170
2,29
02,
920
1,37
02,
710
3,45
01,
580
3,17
04,
930
2,09
04,
440
0138
9765
GP
562
404
555
795
620
783
981
780
962
1,26
099
61,
230
1,49
01,
170
1,45
01,
760
1,34
01,
700
2,51
01,
770
2,38
0
0138
9900
GP
137
146
137
181
225
183
215
284
220
263
363
272
303
425
316
348
489
364
469
644
493
0139
0450
GP
1,41
091
11,
400
2,26
01,
430
2,22
02,
910
1,83
02,
840
3,82
02,
390
3,70
04,
560
2,85
04,
390
5,37
03,
330
5,15
07,
500
4,54
07,
120
0139
0500
GP
989
1,23
099
51,
690
1,87
01,
700
2,34
02,
350
2,34
03,
420
3,00
03,
390
4,47
03,
500
4,39
05,
770
4,04
05,
620
10,1
005,
350
9,61
0
0139
0810
GP
473
556
476
746
835
751
983
1,04
098
71,
360
1,30
01,
350
1,71
01,
500
1,69
02,
130
1,72
02,
080
3,41
02,
220
3,25
0
0139
0900
GP
284
269
283
454
411
451
590
514
584
790
652
775
960
758
936
1,15
086
91,
110
1,68
01,
140
1,60
0
0139
1000
GP
1,06
090
41,
060
1,79
01,
340
1,77
02,
390
1,66
02,
350
3,31
02,
070
3,22
04,
120
2,39
03,
990
5,05
02,
730
4,85
07,
760
3,51
07,
330
0139
1485
GP
280
315
283
376
477
390
444
594
472
532
749
583
601
868
670
672
991
762
850
1,29
098
9
0139
1500
GP
1,57
02,
250
1,59
02,
500
3,31
02,
540
3,19
04,
080
3,25
04,
140
5,10
04,
220
4,89
05,
880
4,99
05,
680
6,71
05,
790
7,68
08,
680
7,81
0
0139
2000
GP
400
438
402
683
663
682
928
830
919
1,31
01,
050
1,28
01,
660
1,23
01,
600
2,07
01,
410
1,97
03,
300
1,84
03,
050
0139
2170
GP
840
650
828
1,24
098
81,
210
1,57
01,
240
1,52
02,
040
1,58
01,
960
2,45
01,
850
2,33
02,
910
2,13
02,
740
4,20
02,
800
3,86
0
0139
2210
GP
1,03
083
01,
020
1,36
01,
250
1,35
01,
600
1,57
01,
600
1,94
01,
990
1,95
02,
210
2,33
02,
230
2,50
02,
680
2,53
03,
260
3,51
03,
320

Appendix 2 45A
ppen
dix
2.
Floo
d-fre
quen
cy e
stim
ates
com
pute
d fro
m o
bser
ved
stre
amflo
w-g
agin
g st
atio
n da
ta, p
redi
cted
from
regr
essi
on e
quat
ions
, and
a w
eigh
ted
aver
age
for
stre
amflo
w-g
agin
g st
atio
ns.—
Cont
inue
d
[USG
S, U
.S. G
eolo
gica
l Sur
vey;
dis
char
ges a
re in
cub
ic fe
et p
er se
cond
; O is
the
obse
rved
dat
a ca
lcul
ated
from
the
syst
emat
ic re
cord
at t
he st
ream
flow
-gag
ing
stat
ion,
R is
est
imat
ed fr
om th
e re
gres
sion
eq
uatio
n, a
nd W
is th
e w
eigh
ted
estim
ate;
GP,
Gla
ciat
ed P
iedm
ont P
hysi
ogra
phic
Pro
vinc
e; IN
, Inn
er C
oast
al P
hysi
ogra
phic
Pro
vinc
e; O
C, O
uter
Coa
stal
Phy
siog
raph
ic P
rovi
nce;
UP,
Ung
laci
ated
Pie
dmon
t Ph
ysio
grap
hic
Prov
ince
; VR
, Val
ley
and
Rid
ge P
hysi
ogra
phic
Pro
vinc
e.]
USG
S
stat
ion
nu
mbe
rRe
gion
Estim
ated
dis
char
ge fo
r rec
urre
nce
inte
rval
s, in
cub
ic fe
et p
er s
econ
d
2-ye
ar
5-ye
ar
10-y
ear
25-y
ear
50-y
ear
100-
year
50
0-ye
ar
OR
WO
RW
OR
WO
RW
OR
WO
RW
OR
W
0139
2500
GP
2,22
01,
030
2,16
03,
230
1,57
03,
100
3,97
01,
980
3,75
04,
970
2,55
04,
620
5,76
03,
000
5,32
06,
590
3,47
06,
040
8,71
04,
620
7,88
0
0139
3450
GP
1,70
01,
130
1,69
02,
460
1,66
02,
430
2,95
02,
040
2,90
03,
550
2,55
03,
480
3,98
02,
940
3,90
04,
390
3,34
04,
300
5,32
04,
280
5,22
0
0139
4000
GP
495
511
496
859
778
852
1,16
097
51,
140
1,59
01,
240
1,54
01,
970
1,44
01,
880
2,38
01,
660
2,24
03,
530
2,18
03,
240
0139
4500
GP
1,21
01,
500
1,22
02,
000
2,25
02,
010
2,72
02,
810
2,72
03,
920
3,56
03,
900
5,07
04,
150
5,01
06,
470
4,77
06,
350
11,1
006,
270
10,7
00
0139
5000
GP
1,38
01,
890
1,39
02,
260
2,79
02,
270
2,98
03,
440
3,00
04,
090
4,32
04,
100
5,06
04,
980
5,06
06,
170
5,69
06,
140
9,41
07,
370
9,27
0
0139
6000
GP
1,12
092
11,
120
1,75
01,
330
1,74
02,
240
1,62
02,
210
2,96
01,
990
2,90
03,
570
2,27
03,
490
4,25
02,
550
4,13
06,
140
3,21
05,
890
0139
6500
VR
1,89
01,
220
1,88
02,
920
1,92
02,
900
3,73
02,
450
3,69
04,
900
3,20
04,
830
5,89
03,
760
5,79
06,
980
4,41
06,
840
9,98
05,
990
9,73
0
0139
6582
VR
1,27
046
21,
230
1,80
076
41,
720
2,16
01,
000
2,04
02,
640
1,35
02,
470
3,00
01,
620
2,80
03,
380
1,93
03,
140
4,31
02,
730
4,01
0
0139
6660
UP
1,37
01,
110
1,36
02,
100
1,79
02,
080
2,62
02,
310
2,59
03,
320
3,04
03,
290
3,87
03,
610
3,84
04,
440
4,26
04,
410
5,85
05,
820
5,84
0
0139
7000
UP
4,47
06,
400
4,50
06,
980
9,74
07,
040
8,98
012
,200
9,08
011
,900
15,5
0012
,000
14,4
0017
,900
14,6
0017
,200
20,8
0017
,400
25,0
0027
,400
25,1
00
0139
7500
UP
375
407
376
765
663
762
1,13
085
61,
120
1,72
01,
130
1,69
02,
270
1,34
02,
210
2,93
01,
580
2,84
04,
950
2,15
04,
730
0139
8000
UP
3,24
01,
830
3,22
05,
490
2,87
05,
420
7,51
03,
650
7,37
010
,800
4,73
010
,500
13,8
005,
540
13,3
0017
,400
6,48
016
,700
28,9
008,
690
27,4
00
0139
8045
UP
761
332
743
1,10
055
01,
060
1,33
071
71,
270
1,63
095
31,
550
1,87
01,
140
1,77
02,
110
1,35
02,
000
2,70
01,
870
2,56
0
0139
8107
UP
887
884
887
1,37
01,
450
1,38
01,
770
1,89
01,
780
2,41
02,
510
2,42
02,
980
3,00
02,
980
3,65
03,
560
3,64
05,
680
4,94
05,
540
0139
8500
VR
1,39
088
81,
380
2,36
01,
460
2,34
03,
170
1,92
03,
130
4,39
02,
570
4,31
05,
460
3,10
05,
340
6,66
03,
700
6,49
010
,100
5,22
09,
780
0139
9190
VR
7736
910
611
559
318
614
476
626
818
81,
010
393
225
1,20
049
026
71,
410
608
383
1,93
090
5
0139
9200
VR
174
424
195
253
670
307
314
858
410
401
1,12
056
047
41,
320
679
554
1,54
081
777
22,
080
1,17
0
0139
9500
VR
723
750
723
1,22
01,
190
1,22
01,
640
1,52
01,
640
2,30
01,
990
2,29
02,
880
2,34
02,
850
3,55
02,
740
3,50
05,
520
3,73
05,
400
0139
9510
VR
185
163
184
374
281
367
575
379
554
955
522
895
1,36
063
91,
250
1,91
077
31,
720
4,01
01,
120
3,44
0
0139
9525
UP
449
257
441
670
460
656
827
629
808
1,04
088
31,
020
1,20
01,
100
1,19
01,
370
1,34
01,
370
1,80
02,
000
1,83
0
0139
9670
UP
1,01
01,
260
1,02
01,
410
2,03
01,
450
1,71
02,
600
1,79
02,
140
3,42
02,
290
2,50
04,
040
2,70
02,
890
4,77
03,
160
3,96
06,
490
4,39
0
0139
9700
UP
2,31
02,
750
2,34
02,
950
4,41
03,
100
3,38
05,
680
3,69
03,
950
7,49
04,
570
4,38
08,
890
5,24
04,
830
10,5
006,
030
5,93
014
,400
8,00
0
0139
9830
UP
8,44
07,
550
8,40
012
,900
11,7
0012
,800
16,6
0014
,700
16,4
0022
,500
18,9
0022
,100
27,7
0022
,100
26,9
0033
,800
25,9
0032
,600
52,3
0034
,600
49,1
00
0140
0000
UP
8,77
07,
970
8,76
013
,000
12,3
0013
,000
16,3
0015
,400
16,3
0021
,200
19,9
0021
,100
25,3
0023
,200
25,2
0029
,800
27,1
0029
,600
42,5
0036
,200
42,1
00
0140
0300
UP
839
609
824
1,04
096
01,
030
1,19
01,
220
1,19
01,
400
1,58
01,
430
1,57
01,
850
1,62
01,
760
2,16
01,
840
2,26
02,
870
2,41
0
0140
0350
UP
207
205
207
360
333
356
487
431
477
679
566
654
848
672
805
1,04
079
097
31,
590
1,07
01,
430
0140
0500
UP
15,6
0014
,100
15,6
0022
,100
21,2
0022
,100
27,0
0026
,300
27,0
0034
,100
33,4
0034
,100
40,1
0038
,500
40,0
0046
,700
44,6
0046
,600
64,8
0058
,500
64,4
00
0140
0630
IN79
781
679
81,
130
1,31
01,
140
1,34
01,
680
1,38
01,
620
2,18
01,
700
1,82
02,
560
1,94
02,
020
2,98
02,
190
2,50
03,
930
2,79
0
0140
0730
IN1,
340
1,22
01,
340
2,18
01,
940
2,17
02,
810
2,48
02,
780
3,71
03,
210
3,66
04,
440
3,76
04,
360
5,23
04,
370
5,12
07,
300
5,74
07,
070
0140
0775
IN43
423
642
476
138
473
11,
040
492
979
1,46
063
91,
340
1,82
075
11,
650
2,24
087
22,
000
3,46
01,
140
2,99
0

46 Methodology for Estimation of Flood Magnitude and Frequency for New Jersey StreamsA
ppen
dix
2.
Floo
d-fre
quen
cy e
stim
ates
com
pute
d fro
m o
bser
ved
stre
amflo
w-g
agin
g st
atio
n da
ta, p
redi
cted
from
regr
essi
on e
quat
ions
, and
a w
eigh
ted
aver
age
for
stre
amflo
w-g
agin
g st
atio
ns.—
Cont
inue
d
[USG
S, U
.S. G
eolo
gica
l Sur
vey;
dis
char
ges a
re in
cub
ic fe
et p
er se
cond
; O is
the
obse
rved
dat
a ca
lcul
ated
from
the
syst
emat
ic re
cord
at t
he st
ream
flow
-gag
ing
stat
ion,
R is
est
imat
ed fr
om th
e re
gres
sion
eq
uatio
n, a
nd W
is th
e w
eigh
ted
estim
ate;
GP,
Gla
ciat
ed P
iedm
ont P
hysi
ogra
phic
Pro
vinc
e; IN
, Inn
er C
oast
al P
hysi
ogra
phic
Pro
vinc
e; O
C, O
uter
Coa
stal
Phy
siog
raph
ic P
rovi
nce;
UP,
Ung
laci
ated
Pie
dmon
t Ph
ysio
grap
hic
Prov
ince
; VR
, Val
ley
and
Rid
ge P
hysi
ogra
phic
Pro
vinc
e.]
USG
S
stat
ion
nu
mbe
rRe
gion
Estim
ated
dis
char
ge fo
r rec
urre
nce
inte
rval
s, in
cub
ic fe
et p
er s
econ
d
2-ye
ar
5-ye
ar
10-y
ear
25-y
ear
50-y
ear
100-
year
50
0-ye
ar
OR
WO
RW
OR
WO
RW
OR
WO
RW
OR
W
0140
0795
IN41
131
240
378
450
975
01,
100
654
1,03
01,
580
853
1,43
02,
000
1,00
01,
770
2,47
01,
170
2,14
03,
800
1,54
03,
150
0140
0822
IN63
112
6688
190
9810
424
912
412
533
116
114
139
619
015
746
722
319
763
130
2
0140
0850
UP
290
261
288
530
434
520
757
566
731
1,15
075
31,
080
1,53
090
01,
410
2,00
01,
070
1,80
03,
590
1,47
03,
080
0140
0900
UP
2,41
01,
310
2,38
03,
230
2,08
03,
170
3,80
02,
650
3,72
04,
560
3,44
04,
460
5,15
04,
040
5,04
05,
760
4,74
05,
640
7,29
06,
370
7,17
0
0140
0930
UP
311
363
312
514
610
518
681
803
688
931
1,08
094
21,
150
1,30
01,
160
1,40
01,
550
1,41
02,
100
2,18
02,
110
0140
0947
UP
1,62
01,
810
1,64
03,
000
2,85
02,
980
4,11
03,
610
4,02
05,
720
4,67
05,
470
7,05
05,
460
6,64
08,
500
6,37
07,
900
12,3
008,
520
11,1
00
0140
0950
UP
117
9111
618
115
318
022
920
122
729
526
729
234
832
034
540
537
940
255
252
554
8
0140
0960
UP
320
215
308
700
344
638
1,08
044
093
21,
750
571
1,41
02,
420
670
1,88
03,
260
782
2,42
06,
090
1,04
04,
180
0140
0970
UP
845
433
798
1,45
069
41,
320
1,95
088
71,
700
2,68
01,
150
2,24
03,
310
1,35
02,
700
4,01
01,
580
3,19
05,
970
2,12
04,
510
0140
1000
UP
3,45
02,
590
3,43
04,
750
4,00
04,
720
5,72
05,
020
5,68
07,
060
6,43
07,
020
8,15
07,
480
8,10
09,
320
8,69
09,
270
12,4
0011
,500
12,3
00
0140
1160
IN11
710
711
618
017
618
022
722
722
729
429
629
434
734
934
740
540
640
555
653
455
1
0140
1200
UP
163
601
191
259
906
323
338
1,12
044
445
81,
390
621
564
1,59
076
168
51,
820
925
1,04
02,
310
1,35
0
0140
1301
UP
4,79
04,
980
4,79
07,
220
7,34
07,
230
8,86
08,
970
8,87
010
,900
11,1
0010
,900
12,5
0012
,700
12,5
0014
,000
14,4
0014
,000
17,7
0018
,300
17,8
00
0140
1520
UP
1,23
090
71,
210
2,29
01,
440
2,21
03,
320
1,84
03,
120
5,08
02,
390
4,61
06,
830
2,81
06,
060
9,01
03,
290
7,80
016
,400
4,42
013
,500
0140
1595
UP
1,07
097
21,
070
1,75
01,
550
1,74
02,
320
1,99
02,
300
3,22
02,
590
3,16
04,
040
3,05
03,
940
4,99
03,
570
4,83
07,
850
4,82
07,
450
0140
1600
UP
3,45
01,
850
3,40
05,
590
2,91
05,
460
7,36
03,
680
7,10
010
,100
4,75
09,
610
12,4
005,
550
11,7
0015
,200
6,48
014
,200
23,1
008,
650
21,2
00
0140
1650
UP
758
757
758
1,35
01,
200
1,34
01,
950
1,52
01,
910
3,02
01,
970
2,89
04,
120
2,31
03,
870
5,55
02,
700
5,11
010
,700
3,60
09,
430
0140
1870
UP
1,34
01,
180
1,33
02,
910
1,79
02,
850
4,50
02,
220
4,34
07,
320
2,80
06,
910
10,2
003,
230
9,49
013
,800
3,71
012
,700
26,1
004,
790
23,3
00
0140
2000
UP
5,89
07,
050
5,91
09,
390
10,4
009,
410
12,2
0012
,700
12,2
0016
,500
15,8
0016
,500
20,2
0017
,900
20,1
0024
,300
20,5
0024
,100
36,2
0026
,100
35,5
00
0140
2600
UP
275
165
270
443
266
430
605
342
579
884
447
828
1,16
052
81,
070
1,51
061
71,
370
2,74
082
82,
390
0140
3060
UP
20,2
0019
,800
20,2
0027
,700
29,2
0027
,700
33,0
0036
,000
33,1
0040
,000
45,1
0040
,300
45,5
0051
,700
45,8
0051
,300
59,6
0051
,800
65,9
0077
,200
66,7
00
0140
3150
UP
357
347
357
552
543
551
717
685
714
972
877
960
1,20
01,
020
1,18
01,
470
1,18
01,
430
2,26
01,
550
2,13
0
0140
3395
UP
251
482
261
440
771
463
627
988
662
958
1,29
099
91,
300
1,52
01,
330
1,73
01,
780
1,74
03,
300
2,40
03,
140
0140
3400
UP
612
738
616
1,11
01,
180
1,11
01,
580
1,51
01,
580
2,37
01,
980
2,33
03,
130
2,34
03,
050
4,08
02,
750
3,93
07,
180
3,71
06,
710
0140
3500
UP
854
1,10
085
81,
270
1,72
01,
280
1,61
02,
190
1,63
02,
110
2,85
02,
150
2,55
03,
350
2,60
03,
040
3,92
03,
100
4,46
05,
240
4,52
0
0140
3535
UP
303
369
306
614
624
615
939
828
928
1,54
01,
130
1,49
02,
180
1,37
02,
070
3,02
01,
640
2,81
06,
140
2,33
05,
460
0140
3540
UP
1,04
085
21,
030
1,88
01,
350
1,85
02,
700
1,73
02,
620
4,13
02,
260
3,93
05,
570
2,66
05,
220
7,39
03,
120
6,82
013
,800
4,20
012
,300
0140
3600
UP
2,17
01,
900
2,16
03,
400
2,91
03,
360
4,47
03,
660
4,38
06,
170
4,68
05,
960
7,72
05,
440
7,37
09,
560
6,31
09,
010
15,3
008,
280
13,9
00
0140
3900
UP
2,24
03,
680
2,29
03,
950
5,44
04,
040
5,49
06,
680
5,59
08,
000
8,34
08,
040
10,4
009,
530
10,3
0013
,200
10,9
0012
,900
22,0
0013
,900
20,8
00
0140
5030
UP
1,80
02,
130
1,82
03,
070
3,15
03,
080
4,13
03,
860
4,09
05,
730
4,79
05,
570
7,13
05,
450
6,81
08,
730
6,21
08,
200
13,3
007,
860
12,0
00

Appendix 2 47A
ppen
dix
2.
Floo
d-fre
quen
cy e
stim
ates
com
pute
d fro
m o
bser
ved
stre
amflo
w-g
agin
g st
atio
n da
ta, p
redi
cted
from
regr
essi
on e
quat
ions
, and
a w
eigh
ted
aver
age
for
stre
amflo
w-g
agin
g st
atio
ns.—
Cont
inue
d
[USG
S, U
.S. G
eolo
gica
l Sur
vey;
dis
char
ges a
re in
cub
ic fe
et p
er se
cond
; O is
the
obse
rved
dat
a ca
lcul
ated
from
the
syst
emat
ic re
cord
at t
he st
ream
flow
-gag
ing
stat
ion,
R is
est
imat
ed fr
om th
e re
gres
sion
eq
uatio
n, a
nd W
is th
e w
eigh
ted
estim
ate;
GP,
Gla
ciat
ed P
iedm
ont P
hysi
ogra
phic
Pro
vinc
e; IN
, Inn
er C
oast
al P
hysi
ogra
phic
Pro
vinc
e; O
C, O
uter
Coa
stal
Phy
siog
raph
ic P
rovi
nce;
UP,
Ung
laci
ated
Pie
dmon
t Ph
ysio
grap
hic
Prov
ince
; VR
, Val
ley
and
Rid
ge P
hysi
ogra
phic
Pro
vinc
e.]
USG
S
stat
ion
nu
mbe
rRe
gion
Estim
ated
dis
char
ge fo
r rec
urre
nce
inte
rval
s, in
cub
ic fe
et p
er s
econ
d
2-ye
ar
5-ye
ar
10-y
ear
25-y
ear
50-y
ear
100-
year
50
0-ye
ar
OR
WO
RW
OR
WO
RW
OR
WO
RW
OR
W
0140
5300
IN96
097
796
21,
350
1,55
01,
380
1,62
01,
970
1,69
01,
990
2,53
02,
130
2,27
02,
960
2,47
02,
570
3,43
02,
840
3,33
04,
460
3,73
0
0140
5400
IN61
682
262
11,
030
1,33
01,
040
1,36
01,
710
1,38
01,
850
2,24
01,
880
2,26
02,
630
2,29
02,
720
3,08
02,
750
3,96
04,
080
3,97
0
0140
5500
IN1,
680
1,73
01,
680
2,63
02,
740
2,63
03,
320
3,47
03,
330
4,26
04,
470
4,28
05,
010
5,21
05,
030
5,79
06,
040
5,81
07,
750
7,89
07,
770
0140
7000
IN48
334
147
580
556
278
41,
070
731
1,03
01,
470
966
1,39
01,
820
1,15
01,
710
2,21
01,
350
2,05
03,
340
1,81
03,
010
0140
7290
IN80
331
578
11,
100
522
1,06
01,
280
679
1,22
01,
470
897
1,40
01,
600
1,07
01,
530
1,72
01,
260
1,65
01,
970
1,69
01,
920
0140
7500
IN1,
360
1,18
01,
360
2,49
01,
920
2,48
03,
510
2,49
03,
480
5,17
03,
270
5,08
06,
710
3,87
06,
570
8,56
04,
550
8,33
014
,300
6,10
013
,800
0140
7705
OC
416
176
409
766
274
742
1,08
034
71,
030
1,61
044
41,
510
2,10
051
51,
940
2,69
059
42,
460
4,58
077
34,
090
0140
7760
OC
634
169
620
1,08
026
41,
040
1,40
033
61,
330
1,83
043
41,
710
2,16
050
72,
000
2,49
058
82,
280
3,30
077
02,
970
0140
7830
OC
584
206
567
756
319
724
864
404
818
998
517
936
1,09
060
01,
020
1,19
069
41,
110
1,41
090
21,
320
0140
8000
OC
1,03
049
31,
020
1,47
074
71,
450
1,74
093
41,
710
2,08
01,
180
2,03
02,
320
1,36
02,
270
2,56
01,
560
2,50
03,
100
1,99
03,
020
0140
8015
OC
190
9618
730
515
129
739
719
338
253
224
750
664
728
861
077
533
372
41,
130
435
1,04
0
0140
8029
OC
1,89
060
81,
850
2,70
091
72,
610
3,19
01,
140
3,04
03,
750
1,44
03,
540
4,13
01,
650
3,87
04,
480
1,89
04,
180
5,21
02,
420
4,83
0
0140
8120
OC
506
425
503
746
637
740
905
790
896
1,11
099
21,
100
1,25
01,
130
1,24
01,
400
1,30
01,
390
1,74
01,
640
1,73
0
0140
8500
OC
789
882
791
1,16
01,
350
1,16
01,
420
1,69
01,
430
1,75
02,
160
1,77
02,
020
2,49
02,
050
2,29
02,
870
2,33
02,
950
3,73
03,
010
0140
9000
OC
396
454
398
559
726
568
681
934
699
853
1,22
088
799
41,
440
1,04
01,
150
1,69
01,
210
1,55
02,
270
1,65
0
0140
9095
OC
114
107
114
198
183
197
273
245
269
393
332
383
504
402
485
637
481
605
1,05
068
096
4
0140
9280
OC
9817
610
214
829
516
118
638
921
024
152
028
428
762
334
433
674
041
247
11,
030
592
0140
9375
OC
3487
3948
138
6058
177
7970
228
105
7926
712
589
310
148
111
408
201
0140
9400
OC
481
313
477
776
481
764
1,00
060
397
81,
330
764
1,29
01,
600
878
1,54
01,
900
1,01
01,
820
2,69
01,
300
2,54
0
0140
9403
OC
1047
1315
7824
1910
335
2413
751
2816
563
3219
578
4126
911
4
0140
9500
OC
519
458
518
801
720
799
998
916
995
1,25
01,
180
1,25
01,
450
1,38
01,
450
1,65
01,
600
1,65
02,
130
2,12
02,
130
0140
9810
OC
709
457
697
1,04
073
71,
020
1,24
095
01,
210
1,48
01,
240
1,45
01,
640
1,46
01,
610
1,80
01,
710
1,79
02,
130
2,31
02,
170
0141
0000
OC
376
425
377
574
701
577
721
917
728
924
1,22
093
91,
090
1,45
01,
110
1,26
01,
720
1,29
01,
710
2,38
01,
760
0141
0150
OC
6810
069
146
172
148
232
230
232
400
312
390
584
378
557
838
452
782
1,84
063
91,
640
0141
0810
OC
9614
799
123
228
133
138
288
158
157
368
194
169
427
218
182
492
248
208
638
313
0141
1000
OC
302
525
305
468
794
476
597
990
611
784
1,25
080
694
21,
430
968
1,12
01,
640
1,15
01,
600
2,11
01,
630
0141
1120
OC
119
1118
1618
2221
2228
2828
3334
3337
4138
4757
50
0141
1122
OC
7450
7212
185
115
162
114
152
226
155
207
285
189
257
354
225
313
565
317
477
0141
1300
OC
214
270
216
344
441
349
455
573
464
628
755
640
784
893
796
967
1,05
097
71,
520
1,43
01,
510
0141
1456
OC
7315
478
132
241
142
170
305
188
220
392
249
258
455
294
296
526
343
388
687
458

48 Methodology for Estimation of Flood Magnitude and Frequency for New Jersey StreamsA
ppen
dix
2.
Floo
d-fre
quen
cy e
stim
ates
com
pute
d fro
m o
bser
ved
stre
amflo
w-g
agin
g st
atio
n da
ta, p
redi
cted
from
regr
essi
on e
quat
ions
, and
a w
eigh
ted
aver
age
for
stre
amflo
w-g
agin
g st
atio
ns.—
Cont
inue
d
[USG
S, U
.S. G
eolo
gica
l Sur
vey;
dis
char
ges a
re in
cub
ic fe
et p
er se
cond
; O is
the
obse
rved
dat
a ca
lcul
ated
from
the
syst
emat
ic re
cord
at t
he st
ream
flow
-gag
ing
stat
ion,
R is
est
imat
ed fr
om th
e re
gres
sion
eq
uatio
n, a
nd W
is th
e w
eigh
ted
estim
ate;
GP,
Gla
ciat
ed P
iedm
ont P
hysi
ogra
phic
Pro
vinc
e; IN
, Inn
er C
oast
al P
hysi
ogra
phic
Pro
vinc
e; O
C, O
uter
Coa
stal
Phy
siog
raph
ic P
rovi
nce;
UP,
Ung
laci
ated
Pie
dmon
t Ph
ysio
grap
hic
Prov
ince
; VR
, Val
ley
and
Rid
ge P
hysi
ogra
phic
Pro
vinc
e.]
USG
S
stat
ion
nu
mbe
rRe
gion
Estim
ated
dis
char
ge fo
r rec
urre
nce
inte
rval
s, in
cub
ic fe
et p
er s
econ
d
2-ye
ar
5-ye
ar
10-y
ear
25-y
ear
50-y
ear
100-
year
50
0-ye
ar
OR
WO
RW
OR
WO
RW
OR
WO
RW
OR
W
0141
1500
OC
506
843
512
831
1,29
084
41,
120
1,63
01,
140
1,59
02,
080
1,61
02,
030
2,40
02,
050
2,55
02,
780
2,56
04,
220
3,62
04,
180
0141
2000
OC
185
296
188
311
463
318
424
590
435
607
761
620
780
887
790
988
1,03
099
21,
650
1,35
01,
610
0141
2500
OC
117
6711
620
311
720
028
415
827
742
021
940
655
226
853
071
532
468
11,
260
466
1,18
0
0141
2800
OC
445
336
439
858
552
831
1,20
072
31,
140
1,69
096
41,
580
2,11
01,
150
1,95
02,
560
1,36
02,
330
3,76
01,
880
3,35
0
0144
0000
VR
1,61
01,
070
1,60
02,
620
1,81
02,
600
3,42
02,
420
3,39
04,
600
3,30
04,
540
5,60
04,
010
5,52
06,
720
4,85
06,
610
9,83
07,
040
9,64
0
0144
3280
VR
186
341
198
244
556
282
285
724
358
340
959
470
384
1,14
055
942
91,
350
663
544
1,87
092
7
0144
3500
VR
1,83
01,
470
1,82
02,
730
2,32
02,
720
3,42
02,
980
3,40
04,
380
3,89
04,
360
5,17
04,
580
5,14
06,
020
5,37
05,
980
8,31
07,
340
8,24
0
0144
5000
VR
272
579
278
416
929
433
527
1,20
055
768
51,
570
738
816
1,86
088
595
92,
180
1,05
01,
350
2,99
01,
500
0144
5430
VR
1,33
091
01,
300
1,78
01,
440
1,74
02,
110
1,84
02,
070
2,56
02,
390
2,53
02,
920
2,80
02,
890
3,30
03,
270
3,29
04,
310
4,43
04,
340
0144
5490
VR
131
223
139
214
374
236
287
495
326
401
669
464
507
808
584
631
966
725
1,01
01,
370
1,13
0
0144
5500
VR
919
1,07
092
21,
270
1,70
01,
290
1,51
02,
170
1,54
01,
800
2,82
01,
870
2,03
03,
310
2,13
02,
250
3,87
02,
390
2,78
05,
260
3,02
0
0144
6000
VR
505
707
508
768
1,17
077
995
81,
540
980
1,22
02,
070
1,26
01,
420
2,49
01,
480
1,63
02,
970
1,71
02,
170
4,20
02,
320
0144
6564
VR
143
5513
421
994
200
278
125
247
362
169
314
431
205
369
506
244
428
708
347
586
0144
6600
VR
459
425
457
811
728
805
1,13
097
71,
110
1,64
01,
340
1,60
02,
120
1,64
02,
050
2,70
01,
990
2,58
04,
520
2,90
04,
210
0145
1500
VR
1,50
01,
490
1,50
03,
440
2,44
03,
410
5,39
03,
210
5,29
08,
830
4,32
08,
550
12,2
005,
200
11,7
0016
,500
6,21
015
,700
30,7
008,
810
28,7
00
0145
2500
VR
569
1,13
058
11,
140
1,86
01,
170
1,70
02,
450
1,74
02,
710
3,31
02,
750
3,72
04,
000
3,74
05,
010
4,79
04,
990
9,50
06,
820
9,24
0
0145
5200
VR
790
899
794
1,22
01,
460
1,23
01,
580
1,90
01,
600
2,13
02,
530
2,17
02,
610
3,02
02,
650
3,18
03,
590
3,23
04,
850
5,01
04,
870
0145
6000
VR
745
1,47
075
71,
110
2,29
01,
140
1,37
02,
910
1,43
01,
710
3,76
01,
810
1,98
04,
400
2,12
02,
260
5,14
02,
440
2,95
06,
910
3,25
0
0145
7000
VR
1,95
02,
260
1,95
03,
140
3,53
03,
150
4,04
04,
510
4,06
05,
300
5,89
05,
330
6,33
06,
930
6,36
07,
440
8,13
07,
480
10,3
0011
,100
10,3
00
0145
9010
UP
191
249
196
335
422
346
477
558
491
729
751
734
986
906
966
1,32
01,
080
1,26
02,
500
1,52
02,
200
0145
9500
UP
6,30
04,
350
6,24
09,
430
6,84
09,
300
11,8
008,
700
11,6
0015
,200
11,3
0014
,800
17,9
0013
,300
17,4
0020
,900
15,6
0020
,300
29,0
0021
,100
28,0
00
0146
2197
UP
275
190
267
380
337
374
451
458
452
541
638
564
608
789
654
677
961
757
841
1,41
01,
020
0146
3620
IN33
570
235
363
11,
150
671
879
1,49
094
41,
250
1,95
01,
350
1,57
02,
300
1,68
01,
930
2,69
02,
060
2,94
03,
600
3,07
0
0146
3812
UP
249
8723
451
113
845
976
917
565
81,
220
225
986
1,66
026
41,
300
2,22
030
51,
680
4,09
040
02,
910
0146
4000
UP
1,34
03,
430
1,40
01,
920
4,99
02,
070
2,32
06,
040
2,57
02,
860
7,42
03,
260
3,27
08,
380
3,76
03,
700
9,49
04,
330
4,77
011
,900
5,67
0
0146
4400
OC
985
438
959
1,50
066
91,
440
1,93
083
91,
820
2,58
01,
070
2,38
03,
160
1,23
02,
870
3,82
01,
410
3,43
05,
790
1,82
05,
040
0146
4405
OC
5339
5277
6375
9482
9211
510
811
313
112
813
014
615
014
718
420
118
9
0146
4500
IN1,
600
1,17
01,
590
2,57
01,
900
2,55
03,
280
2,43
03,
240
4,23
03,
180
4,17
04,
970
3,74
04,
890
5,73
04,
370
5,63
07,
630
5,82
07,
480
0146
4515
IN46
144
246
073
675
173
794
398
994
81,
230
1,32
01,
240
1,47
01,
590
1,49
01,
720
1,89
01,
750
2,38
02,
590
2,42
0
0146
4520
IN94
258
290
71,
370
976
1,31
01,
690
1,28
01,
610
2,12
01,
700
2,01
02,
480
2,03
02,
360
2,85
02,
400
2,72
03,
850
3,27
03,
650

Appendix 2 49A
ppen
dix
2.
Floo
d-fre
quen
cy e
stim
ates
com
pute
d fro
m o
bser
ved
stre
amflo
w-g
agin
g st
atio
n da
ta, p
redi
cted
from
regr
essi
on e
quat
ions
, and
a w
eigh
ted
aver
age
for
stre
amflo
w-g
agin
g st
atio
ns.—
Cont
inue
d
[USG
S, U
.S. G
eolo
gica
l Sur
vey;
dis
char
ges a
re in
cub
ic fe
et p
er se
cond
; O is
the
obse
rved
dat
a ca
lcul
ated
from
the
syst
emat
ic re
cord
at t
he st
ream
flow
-gag
ing
stat
ion,
R is
est
imat
ed fr
om th
e re
gres
sion
eq
uatio
n, a
nd W
is th
e w
eigh
ted
estim
ate;
GP,
Gla
ciat
ed P
iedm
ont P
hysi
ogra
phic
Pro
vinc
e; IN
, Inn
er C
oast
al P
hysi
ogra
phic
Pro
vinc
e; O
C, O
uter
Coa
stal
Phy
siog
raph
ic P
rovi
nce;
UP,
Ung
laci
ated
Pie
dmon
t Ph
ysio
grap
hic
Prov
ince
; VR
, Val
ley
and
Rid
ge P
hysi
ogra
phic
Pro
vinc
e.]
USG
S
stat
ion
nu
mbe
rRe
gion
Estim
ated
dis
char
ge fo
r rec
urre
nce
inte
rval
s, in
cub
ic fe
et p
er s
econ
d
2-ye
ar
5-ye
ar
10-y
ear
25-y
ear
50-y
ear
100-
year
50
0-ye
ar
OR
WO
RW
OR
WO
RW
OR
WO
RW
OR
W
0146
4524
IN53
5853
7497
7890
127
9711
116
812
412
820
014
614
523
417
018
931
322
9
0146
4525
IN12
679
122
205
130
195
266
168
248
349
220
319
417
260
377
490
303
437
678
399
589
0146
4530
IN82
048
179
71,
540
814
1,46
02,
130
1,07
01,
980
3,01
01,
430
2,72
03,
760
1,71
03,
350
4,58
02,
030
4,02
06,
820
2,79
05,
800
0146
4533
IN28
4029
3971
4346
9555
5312
971
5915
684
6418
698
7526
013
4
0146
4538
IN22
319
522
240
833
140
356
443
555
280
458
077
81,
010
694
969
1,25
081
91,
190
1,94
01,
120
1,80
0
0146
4582
IN40
130
139
461
750
660
579
066
277
11,
050
877
1,02
01,
270
1,05
01,
220
1,52
01,
230
1,45
02,
220
1,67
02,
070
0146
5000
UP
4,48
06,
030
4,54
06,
080
9,52
06,
290
7,31
012
,200
7,73
09,
080
16,0
009,
850
10,6
0019
,000
11,6
0012
,200
22,4
0013
,600
16,6
0030
,600
18,8
00
0146
5500
UP
10,5
008,
280
10,5
0016
,700
12,9
0016
,600
21,8
0016
,400
21,6
0029
,400
21,4
0029
,000
36,1
0025
,200
35,4
0043
,600
29,6
0042
,700
65,4
0040
,200
63,4
00
0146
5785
UP
667
467
650
925
762
904
1,12
099
21,
100
1,38
01,
320
1,37
01,
590
1,58
01,
590
1,82
01,
870
1,83
02,
430
2,58
02,
470
0146
5790
UP
812
841
815
1,16
01,
320
1,18
01,
420
1,69
01,
470
1,79
02,
190
1,88
02,
110
2,58
02,
230
2,45
03,
020
2,61
03,
390
4,03
03,
600
0146
5798
UP
3,11
02,
050
3,08
04,
600
3,13
04,
530
5,72
03,
940
5,60
07,
300
5,04
07,
090
8,60
05,
870
8,32
010
,000
6,81
09,
640
13,8
008,
950
13,2
00
0146
5850
IN74
193
274
71,
170
1,52
01,
190
1,46
01,
960
1,49
01,
820
2,57
01,
880
2,09
03,
030
2,18
02,
360
3,54
02,
490
2,97
04,
730
3,19
0
0146
5880
IN1,
020
1,16
01,
030
1,62
01,
840
1,64
02,
120
2,34
02,
150
2,89
03,
030
2,92
03,
570
3,55
03,
570
4,37
04,
120
4,31
06,
750
5,40
06,
390
0146
6000
OC
1337
1422
6626
3190
3744
124
5556
151
7070
182
8911
326
314
2
0146
6500
OC
1038
1117
6819
2393
2731
130
3838
159
4846
193
5967
281
88
0146
7000
IN76
71,
640
780
1,11
02,
650
1,15
01,
350
3,39
01,
420
1,66
04,
420
1,78
01,
900
5,19
02,
060
2,14
06,
070
2,36
02,
730
8,06
03,
080
0146
7042
UP
2,60
03,
210
2,64
03,
570
5,05
03,
730
4,27
06,
460
4,60
05,
200
8,45
05,
820
5,94
010
,000
6,79
06,
720
11,8
007,
880
8,70
016
,000
10,6
00
0146
7048
UP
3,63
03,
780
3,63
05,
640
5,86
05,
650
7,29
07,
440
7,30
09,
770
9,65
09,
760
11,9
0011
,300
11,8
0014
,400
13,3
0014
,300
21,6
0017
,800
21,1
00
0146
7057
IN58
129
255
688
748
383
41,
100
629
1,02
01,
390
833
1,27
01,
610
993
1,46
01,
830
1,17
01,
650
2,38
01,
570
2,13
0
0146
7069
IN68
344
466
31,
050
718
1,01
01,
320
920
1,25
01,
700
1,20
01,
590
2,00
01,
410
1,86
02,
330
1,64
02,
150
3,18
02,
160
2,87
0
0146
7081
IN57
338
456
781
362
180
399
779
898
31,
260
1,04
01,
240
1,48
01,
230
1,45
01,
730
1,43
01,
700
2,40
01,
880
2,33
0
0146
7086
UP
2,37
02,
090
2,35
03,
380
3,28
03,
370
4,07
04,
200
4,09
04,
980
5,49
05,
060
5,67
06,
490
5,82
06,
380
7,63
06,
620
8,10
010
,300
8,60
0
0146
7087
UP
6,27
03,
430
6,12
08,
730
5,30
08,
450
10,4
006,
730
9,99
012
,600
8,73
012
,000
14,3
0010
,300
13,7
0016
,000
12,0
0015
,300
20,2
0016
,100
19,4
00
0146
7130
IN15
027
215
924
444
626
631
757
635
642
175
648
550
789
558
860
11,
050
704
850
1,39
099
2
0146
7150
IN80
263
879
71,
230
1,03
01,
220
1,57
01,
330
1,55
02,
070
1,75
02,
040
2,50
02,
070
2,46
02,
980
2,42
02,
920
4,31
03,
220
4,18
0
0146
7160
IN22
528
122
833
045
734
041
558
943
354
177
057
265
091
068
877
41,
060
821
1,13
01,
400
1,18
0
0146
7305
IN18
215
018
122
226
122
424
835
125
528
048
129
730
458
933
132
870
736
838
499
346
0
0146
7317
IN75
8475
158
146
157
231
197
229
342
269
336
439
328
429
548
393
532
847
548
811
0146
7330
IN45
083
347
283
91,
360
886
1,22
01,
760
1,29
01,
880
2,32
01,
950
2,54
02,
760
2,58
03,
380
3,25
03,
350
6,27
04,
360
5,84
0
0146
7351
IN28
742
629
942
570
146
151
591
258
562
61,
210
755
707
1,44
088
578
51,
690
1,03
096
22,
270
1,36
0

50 Methodology for Estimation of Flood Magnitude and Frequency for New Jersey StreamsA
ppen
dix
2.
Floo
d-fre
quen
cy e
stim
ates
com
pute
d fro
m o
bser
ved
stre
amflo
w-g
agin
g st
atio
n da
ta, p
redi
cted
from
regr
essi
on e
quat
ions
, and
a w
eigh
ted
aver
age
for
stre
amflo
w-g
agin
g st
atio
ns.—
Cont
inue
d
[USG
S, U
.S. G
eolo
gica
l Sur
vey;
dis
char
ges a
re in
cub
ic fe
et p
er se
cond
; O is
the
obse
rved
dat
a ca
lcul
ated
from
the
syst
emat
ic re
cord
at t
he st
ream
flow
-gag
ing
stat
ion,
R is
est
imat
ed fr
om th
e re
gres
sion
eq
uatio
n, a
nd W
is th
e w
eigh
ted
estim
ate;
GP,
Gla
ciat
ed P
iedm
ont P
hysi
ogra
phic
Pro
vinc
e; IN
, Inn
er C
oast
al P
hysi
ogra
phic
Pro
vinc
e; O
C, O
uter
Coa
stal
Phy
siog
raph
ic P
rovi
nce;
UP,
Ung
laci
ated
Pie
dmon
t Ph
ysio
grap
hic
Prov
ince
; VR
, Val
ley
and
Rid
ge P
hysi
ogra
phic
Pro
vinc
e.]
USG
S
stat
ion
nu
mbe
rRe
gion
Estim
ated
dis
char
ge fo
r rec
urre
nce
inte
rval
s, in
cub
ic fe
et p
er s
econ
d
2-ye
ar
5-ye
ar
10-y
ear
25-y
ear
50-y
ear
100-
year
50
0-ye
ar
OR
WO
RW
OR
WO
RW
OR
WO
RW
OR
W
0147
2198
VR
2,69
01,
070
2,61
04,
500
1,80
04,
280
5,88
02,
400
5,49
07,
830
3,28
07,
180
9,42
03,
990
8,56
011
,100
4,82
010
,000
15,6
006,
970
13,9
00
0147
2199
VR
1,45
067
01,
410
2,13
01,
140
2,05
02,
590
1,53
02,
470
3,17
02,
110
3,02
03,
620
2,59
03,
460
4,06
03,
130
3,90
05,
120
4,57
05,
010
0147
2500
UP
4,84
07,
210
4,94
06,
190
11,4
006,
540
7,18
014
,600
7,88
08,
530
19,2
009,
820
9,61
022
,700
11,4
0010
,800
26,8
0013
,200
13,8
0036
,700
17,8
00
0147
3000
UP
15,0
0011
,400
14,9
0023
,200
17,9
0023
,100
28,8
0022
,900
28,6
0035
,900
29,9
0035
,600
41,1
0035
,400
40,8
0046
,200
41,7
0046
,000
58,2
0057
,100
58,1
00
0147
3120
UP
5,76
03,
330
5,66
09,
450
5,27
09,
170
12,9
006,
740
12,3
0018
,700
8,82
017
,500
24,4
0010
,400
22,5
0031
,500
12,3
0028
,600
55,3
0016
,700
48,6
00
0147
5000
IN11
933
812
423
156
124
234
873
336
756
397
458
979
01,
170
817
1,09
01,
370
1,11
02,
220
1,86
02,
190
0147
5017
IN42
4942
6384
6677
112
8494
150
109
107
180
128
120
213
150
148
291
199
0147
5019
IN40
060
741
853
01,
000
591
610
1,30
073
270
41,
730
931
770
2,06
01,
080
833
2,43
01,
260
971
3,27
01,
670
0147
5033
IN33
7637
5213
565
6818
493
9225
413
511
231
317
013
537
721
220
153
632
1
0147
5300
UP
675
798
681
1,09
01,
320
1,11
01,
420
1,74
01,
450
1,88
02,
350
1,94
02,
250
2,84
02,
340
2,66
03,
390
2,78
03,
750
4,77
03,
940
0147
5510
UP
2,88
03,
380
2,90
04,
050
5,36
04,
140
4,88
06,
890
5,08
05,
980
9,07
06,
380
6,85
010
,800
7,41
07,
740
12,7
008,
530
9,99
017
,400
11,4
00
0147
5530
UP
813
1,11
083
31,
550
1,79
01,
580
2,27
02,
320
2,28
03,
510
3,08
03,
430
4,74
03,
680
4,53
06,
280
4,36
05,
860
11,5
006,
000
10,1
00
0147
5550
UP
2,48
02,
910
2,50
03,
530
4,51
03,
600
4,27
05,
740
4,42
05,
260
7,46
05,
540
6,03
08,
780
6,42
06,
840
10,3
007,
390
8,85
013
,800
9,76
0
0147
5850
UP
1,15
01,
630
1,17
01,
930
2,70
01,
980
2,59
03,
550
2,68
03,
590
4,80
03,
740
4,47
05,
800
4,65
05,
480
6,95
05,
700
8,40
09,
830
8,65
0
0147
6500
UP
1,29
02,
560
1,34
02,
190
4,18
02,
320
3,02
05,
470
3,24
04,
370
7,34
04,
710
5,66
08,
830
6,06
07,
220
10,6
007,
690
12,3
0014
,800
12,7
00
0147
7000
UP
2,97
04,
170
2,99
05,
310
6,59
05,
350
7,49
08,
450
7,53
011
,100
11,1
0011
,100
14,6
0013
,100
14,5
0018
,900
15,5
0018
,700
33,0
0021
,200
32,1
00
0147
7102
IN51
7354
8713
495
113
185
128
146
261
177
171
325
216
196
397
260
255
581
371
0147
7110
IN30
845
531
757
977
959
982
21,
030
851
1,21
01,
390
1,24
01,
580
1,69
01,
600
2,01
02,
010
2,01
03,
330
2,79
03,
200
0147
7120
IN75
267
174
91,
270
1,14
01,
260
1,66
01,
510
1,65
02,
190
2,03
02,
180
2,61
02,
450
2,59
03,
050
2,91
03,
030
4,14
04,
030
4,13
0
0147
7480
IN39
337
539
257
564
858
269
786
371
885
31,
170
904
969
1,42
01,
050
1,09
01,
690
1,21
01,
360
2,36
01,
590
0147
7500
IN65
946
663
71,
240
806
1,16
01,
810
1,07
01,
640
2,80
01,
460
2,42
03,
800
1,76
03,
170
5,06
02,
110
4,06
09,
450
2,95
06,
990
0147
7800
UP
1,61
01,
320
1,60
02,
720
2,16
02,
700
3,65
02,
820
3,61
05,
060
3,77
04,
980
6,31
04,
540
6,18
07,
730
5,41
07,
550
11,8
007,
530
11,4
00
0147
8000
UP
1,79
01,
880
1,79
02,
650
2,98
02,
660
3,29
03,
810
3,31
04,
150
4,99
04,
200
4,85
05,
900
4,92
05,
580
6,95
05,
690
7,47
09,
430
7,65
0
0147
8040
UP
2,15
02,
850
2,22
03,
510
4,41
03,
640
4,60
05,
560
4,79
06,
230
7,17
06,
460
7,62
08,
370
7,83
09,
190
9,76
09,
360
13,6
0013
,000
13,4
00
0148
2310
IN13
084
125
210
151
200
273
205
257
365
284
342
442
350
414
528
423
493
766
604
705
0148
2500
IN72
641
371
91,
370
719
1,35
01,
900
963
1,86
02,
650
1,31
02,
570
3,28
01,
600
3,16
03,
970
1,92
03,
810
5,76
02,
700
5,48
0
0148
3000
IN52
149
852
094
986
394
11,
300
1,15
01,
280
1,82
01,
560
1,78
02,
260
1,90
02,
190
2,75
02,
270
2,65
04,
080
3,18
03,
870
0148
3200
IN14
714
614
726
825
826
837
134
637
053
047
352
667
157
766
383
369
282
01,
300
975
1,27
0
0148
3290
IN13
858
129
220
105
200
290
142
256
402
197
343
504
242
423
625
292
513
1,00
041
877
9
0148
3400
IN24
3726
3266
3838
9050
4612
468
5215
383
5818
310
072
260
143

Appendix 2 51A
ppen
dix
2.
Floo
d-fre
quen
cy e
stim
ates
com
pute
d fro
m o
bser
ved
stre
amflo
w-g
agin
g st
atio
n da
ta, p
redi
cted
from
regr
essi
on e
quat
ions
, and
a w
eigh
ted
aver
age
for
stre
amflo
w-g
agin
g st
atio
ns.—
Cont
inue
d
[USG
S, U
.S. G
eolo
gica
l Sur
vey;
dis
char
ges a
re in
cub
ic fe
et p
er se
cond
; O is
the
obse
rved
dat
a ca
lcul
ated
from
the
syst
emat
ic re
cord
at t
he st
ream
flow
-gag
ing
stat
ion,
R is
est
imat
ed fr
om th
e re
gres
sion
eq
uatio
n, a
nd W
is th
e w
eigh
ted
estim
ate;
GP,
Gla
ciat
ed P
iedm
ont P
hysi
ogra
phic
Pro
vinc
e; IN
, Inn
er C
oast
al P
hysi
ogra
phic
Pro
vinc
e; O
C, O
uter
Coa
stal
Phy
siog
raph
ic P
rovi
nce;
UP,
Ung
laci
ated
Pie
dmon
t Ph
ysio
grap
hic
Prov
ince
; VR
, Val
ley
and
Rid
ge P
hysi
ogra
phic
Pro
vinc
e.]
USG
S
stat
ion
nu
mbe
rRe
gion
Estim
ated
dis
char
ge fo
r rec
urre
nce
inte
rval
s, in
cub
ic fe
et p
er s
econ
d
2-ye
ar
5-ye
ar
10-y
ear
25-y
ear
50-y
ear
100-
year
50
0-ye
ar
OR
WO
RW
OR
WO
RW
OR
WO
RW
OR
W
0148
3500
IN21
724
721
841
543
441
660
658
260
493
779
592
21,
260
968
1,22
01,
680
1,16
01,
610
3,08
01,
640
2,85
0
0148
3700
IN50
865
451
285
31,
080
863
1,11
01,
400
1,13
01,
480
1,85
01,
510
1,77
02,
190
1,81
02,
080
2,57
02,
130
2,87
03,
460
2,94
0
0148
3720
IN14
314
714
326
925
926
737
834
937
154
748
052
869
758
866
386
970
781
41,
370
999
1,23
0
0148
4000
IN30
730
430
757
552
057
279
068
778
11,
100
922
1,08
01,
360
1,11
01,
330
1,64
01,
320
1,59
02,
380
1,81
02,
290
0148
4002
IN19
5223
3297
4344
134
6566
189
101
8723
513
311
428
717
220
542
028
6
0148
4050
IN73
122
7915
522
116
723
630
325
237
642
439
051
552
551
868
763
867
01,
260
924
1,13
0
0148
8500
IN1,
040
568
1,03
01,
960
959
1,93
02,
710
1,25
02,
640
3,80
01,
670
3,66
04,
710
1,99
04,
520
5,69
02,
350
5,42
08,
290
3,21
07,
810
0148
9000
IN47
119
046
372
435
670
693
049
590
11,
240
706
1,19
01,
510
886
1,45
01,
820
1,09
01,
740
2,71
01,
630
2,57
0
0149
0600
IN22
119
221
831
532
931
839
443
440
351
258
053
161
869
564
273
982
276
71,
100
1,13
01,
110
0149
0800
IN17
713
217
227
824
227
235
233
334
845
246
745
653
158
154
761
470
864
682
31,
040
904
0149
1000
IN1,
850
1,22
01,
840
3,33
02,
030
3,28
04,
530
2,64
04,
440
6,28
03,
500
6,10
07,
770
4,17
07,
510
9,40
04,
920
9,04
013
,800
6,70
013
,100
0149
1010
IN63
5963
130
107
126
204
145
190
354
200
310
523
245
437
761
294
603
1,76
041
81,
250
0149
1050
IN63
113
6910
521
212
414
429
617
921
242
327
227
753
335
635
965
545
964
098
176
9
0149
5000
UP
2,90
02,
870
2,90
04,
800
4,72
04,
800
6,29
06,
170
6,29
08,
440
8,27
08,
430
10,2
009,
940
10,2
0012
,200
11,9
0012
,200
17,5
0016
,700
17,4
00

For additional information, write to:DirectorU.S. Geological SurveyNew Jersey Water Science Center810 Bear Tavern Road, Suite 206West Trenton, NJ 08628
or visit our Web site at:http://nj.usgs.gov/
Document prepared by the West Trenton Publishing Service Center

Watson and Schopp—
Methodology for Estim
ation of Flood Magnitude and Frequency for N
ew Jersey Stream
s—Scientific Investigations Report 2009–5167