Embed Size (px)
Citation preview
21
* To whom correspondence may be addressed
CT&F - Ciencia, Tecnología y Futuro - Vol. 4 Num. 2 Dec. 2010
METHODOLOGY TO DESIGN OF SYNTHETIC SONIC LOG (SSL), USING
ARTIFICIAL NEURAL NETWORKS. COLORADO FIELD APPLICATION
Carlos-Andrés Ayala Marín1* and Christiann-Camilo García-Yela2
1,2 Ecopetrol S. A. Instituto Colombiano del Petróleo (ICP), A.A. 4185, Bucaramanga, Santander, Colombia 1,2 Universidad Industrial de Santander, Santander, Bucaramanga, Colombia
e-mail: [email protected]
(Received, Sep. 16, 2010; Accepted, Dec. 9, 2010)
ABSTRACT
A method that allows the creation of the Synthetic Sonic Log (SSL) was developed from the Spontaneous Potential (SP) logs, the resistivity logs of the flushed zone (SN), and the resistivity zone of the uninvaded zone (ILD), using Artificial Neural Networks (ANN). The SSL was obtained with the created tool called
Generation of Synthetic Sonic Logs (GSSL).
The results obtained are presented hereinafter: in the Colorado 70 well, 90% of the generated SSL data present errors of less than 10%; in the Colorado 72 well; 53% of the SSL data obtained with the tool are below 5% error, in the Colorado 75 well, 80% of the SSL data present errors of less than 10%, and finally, the SSL generated for the Colorado 38 well follows the behavior of the original Sonic Logs of the well in an accurate manner. From the foregoing we conclude that the quality of the created tool is good and that the deviations are minimal in the times of transit of synthetic sonic profile.
Keywords: petrophysical properties, sonic logs, neural networks, spontaneous potential, porosity, permeability, saturation.
22 CT&F - Ciencia, Tecnología y Futuro - Vol. 4 Num. 2 Dec. 2010
RESUMEN
Se desarrolló una metodología que permite crear el Registro Sónico Sintético (RSS) a partir del registro de potencial espontáneo (SP), del registro de resistividad de la zona lavada (SN) y del registro de resistividad de la zona virgen (ILD), utilizando Redes Neuronales Artificiales (RNA). El RSS se obtuvo
con la herramienta creada llamada Generación del Registro Sónico Sintético (GERSS).
Los resultados que se obtuvieron se presentan a continuación: en el pozo Colorado 70 el 90% de los datos del RSS generado presentan errores menores del 10%; en el pozo Colorado 72 el 53% de los datos del RSS obtenidos con la herramienta están por debajo del 5% de error; en el pozo Colorado 75 el 80% de los datos del RSSS presentan errores menores del 10% y finalmente, el RSS generado para el pozo Colorado 38 sigue el comportamiento del Registro Sónico original del pozo de manera acertada. Visto lo anterior se concluye que la calidad de la herramienta creada es buena y que las desviaciones son mínimas en los tiempo de tránsito del perfil sónico sintético.
Palabras clave: propiedades petrofísicas, registros sónicos, redes neuronales, potencial espontáneo, porosidad, per-meabilidad, saturación.
23
METHODOLOGY TO DESIGN OF SYNTHETIC SONIC LOG (SSL), USING ARTIFICIAL NEURAL NETWORKS
CT&F - Ciencia, Tecnología y Futuro - Vol. 4 Num. 2 Dec. 2010
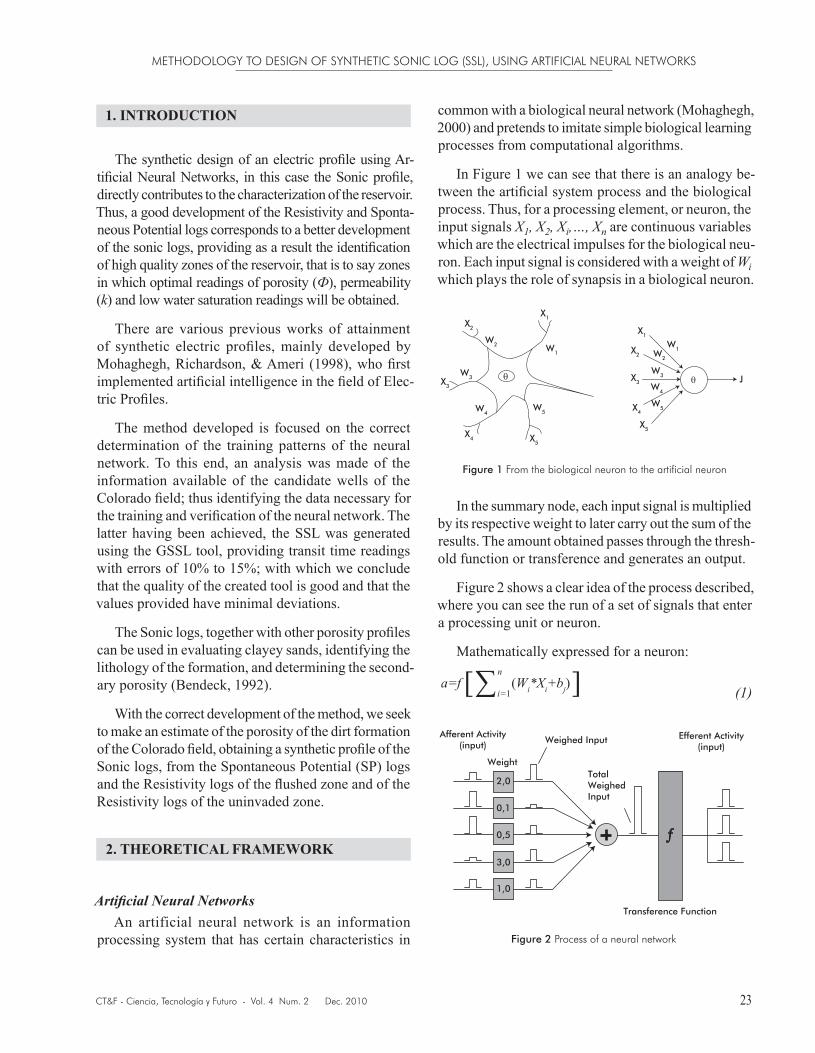
1. INTRODUCTION
The synthetic design of an electric profile using Ar-tificial Neural Networks, in this case the Sonic profile, directly contributes to the characterization of the reservoir. Thus, a good development of the Resistivity and Sponta-neous Potential logs corresponds to a better development of the sonic logs, providing as a result the identification of high quality zones of the reservoir, that is to say zones in which optimal readings of porosity (Ф), permeability (k) and low water saturation readings will be obtained.
There are various previous works of attainment of synthetic electric profiles, mainly developed by Mohaghegh, Richardson, & Ameri (1998), who first implemented artificial intelligence in the field of Elec-tric Profiles.
The method developed is focused on the correct determination of the training patterns of the neural network. To this end, an analysis was made of the information available of the candidate wells of the Colorado field; thus identifying the data necessary for the training and verification of the neural network. The latter having been achieved, the SSL was generated using the GSSL tool, providing transit time readings with errors of 10% to 15%; with which we conclude that the quality of the created tool is good and that the values provided have minimal deviations.
The Sonic logs, together with other porosity profiles can be used in evaluating clayey sands, identifying the lithology of the formation, and determining the second-ary porosity (Bendeck, 1992).
With the correct development of the method, we seek to make an estimate of the porosity of the dirt formation of the Colorado field, obtaining a synthetic profile of the Sonic logs, from the Spontaneous Potential (SP) logs and the Resistivity logs of the flushed zone and of the Resistivity logs of the uninvaded zone.
2. THEORETICAL FRAMEWORK
Artificial Neural NetworksAn artificial neural network is an information
processing system that has certain characteristics in Figure 2 Process of a neural network
Figure 1 From the biological neuron to the artificial neuron
X1
X2
X3
X4X5
W1W2
W3
W4
W5
J
X1X2
X3
X4 X5
W1
W2
W3
W4W5
θ θ
common with a biological neural network (Mohaghegh, 2000) and pretends to imitate simple biological learning processes from computational algorithms.
In Figure 1 we can see that there is an analogy be-tween the artificial system process and the biological process. Thus, for a processing element, or neuron, the input signals X1, X2, Xi,…, Xn are continuous variables which are the electrical impulses for the biological neu-ron. Each input signal is considered with a weight of Wi which plays the role of synapsis in a biological neuron.
Weight
Weighed Input
Total Weighed Input
Afferent Activity(input)
Efferent Activity(input)
Transference Function
2,0
0,1
0,5
3,0
1,0
In the summary node, each input signal is multiplied by its respective weight to later carry out the sum of the results. The amount obtained passes through the thresh-old function or transference and generates an output.
Figure 2 shows a clear idea of the process described, where you can see the run of a set of signals that enter a processing unit or neuron.
Mathematically expressed for a neuron:
(1)
CARLOS-ANDRÉS AYALA-MARÍN & CHRISTIANN-CAMILO GARCÍA-YELA
24 CT&F - Ciencia, Tecnología y Futuro - Vol. 4 Num. 2 Dec. 2010
Where:
a = network output
Wi, bj = connection weights
f = activation function
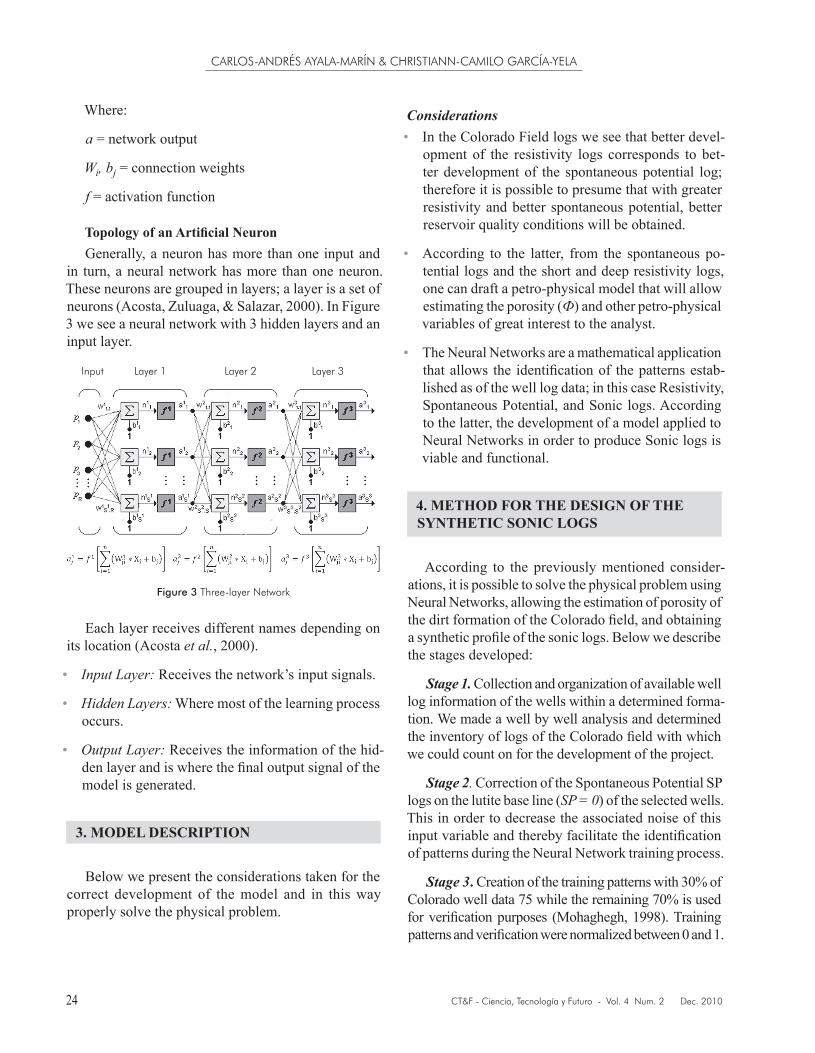
Topology of an Artificial NeuronGenerally, a neuron has more than one input and
in turn, a neural network has more than one neuron. These neurons are grouped in layers; a layer is a set of neurons (Acosta, Zuluaga, & Salazar, 2000). In Figure 3 we see a neural network with 3 hidden layers and an input layer.
Considerations• In the Colorado Field logs we see that better devel-
opment of the resistivity logs corresponds to bet-ter development of the spontaneous potential log; therefore it is possible to presume that with greater resistivity and better spontaneous potential, better reservoir quality conditions will be obtained.
• According to the latter, from the spontaneous po-tential logs and the short and deep resistivity logs, one can draft a petro-physical model that will allow estimating the porosity (Ф) and other petro-physical variables of great interest to the analyst.
• The Neural Networks are a mathematical application that allows the identification of the patterns estab-lished as of the well log data; in this case Resistivity, Spontaneous Potential, and Sonic logs. According to the latter, the development of a model applied to Neural Networks in order to produce Sonic logs is viable and functional.
4. METHOD FOR THE DESIGN OF THE SYNTHETIC SONIC LOGS
According to the previously mentioned consider-ations, it is possible to solve the physical problem using Neural Networks, allowing the estimation of porosity of the dirt formation of the Colorado field, and obtaining a synthetic profile of the sonic logs. Below we describe the stages developed:
Stage 1. Collection and organization of available well log information of the wells within a determined forma-tion. We made a well by well analysis and determined the inventory of logs of the Colorado field with which we could count on for the development of the project.
Stage 2. Correction of the Spontaneous Potential SP logs on the lutite base line (SP = 0) of the selected wells. This in order to decrease the associated noise of this input variable and thereby facilitate the identification of patterns during the Neural Network training process.
Stage 3. Creation of the training patterns with 30% of Colorado well data 75 while the remaining 70% is used for verification purposes (Mohaghegh, 1998). Training patterns and verification were normalized between 0 and 1.
Input Layer 1 Layer 2 Layer 3
Figure 3 Three-layer Network
Each layer receives different names depending on its location (Acosta et al., 2000).
• Input Layer: Receives the network’s input signals.
• Hidden Layers: Where most of the learning process occurs.
• Output Layer: Receives the information of the hid-den layer and is where the final output signal of the model is generated.
3. MODEL DESCRIPTION
Below we present the considerations taken for the correct development of the model and in this way properly solve the physical problem.
25
METHODOLOGY TO DESIGN OF SYNTHETIC SONIC LOG (SSL), USING ARTIFICIAL NEURAL NETWORKS
CT&F - Ciencia, Tecnología y Futuro - Vol. 4 Num. 2 Dec. 2010
Stage 4. Creation of several neural networks with differing topographies and different transference func-tions in each layer with Membrain Software. Training with the Backpropagation algorithm.
The output generated by each of the trained neural networks were evaluated in terms of the quadratic cor-relation (R2) coefficient, finding that the topography of the neural network that generated the best results was composed by three layers; an input layer, a hidden layer, and an output layer.
Stage 5. Generation of the SSL for wells that lack sonic logs, but that count on the SP logs and the two Resistivity logs (short and long).
5. RESULTS AND ANALYSIS
Quadratic Correlation CoefficientThe method used to generate the Synthetic
Sonic Logs was based on the relationship existing amongst the spontaneous potential, resistivity, and sonic logs (DT), through the quadratic R2 correla-tion coefficient.
This analysis is important for the development of the well’s SSL since it provides an estimate of the ease with which the Neural Network will find a relationship between the spontaneous potential logs and the resistiv-ity logs, to later generate the well’s synthetic sonic logs. Below we present the figures for each well:
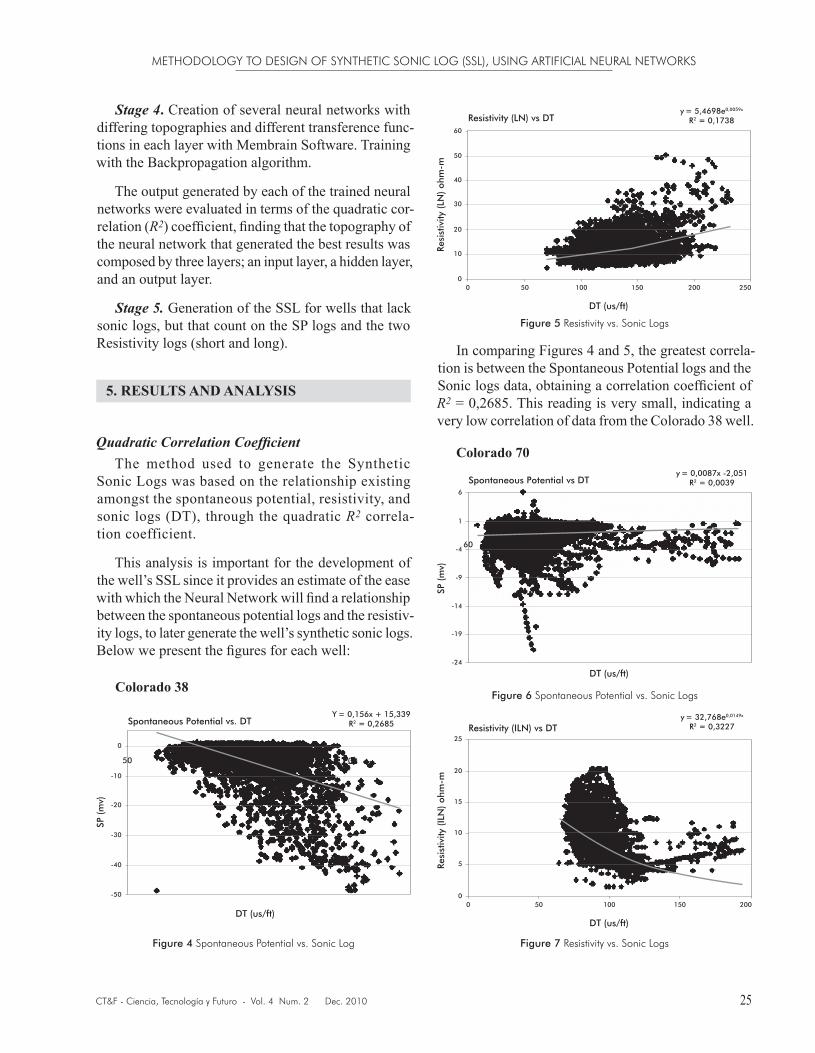
Colorado 38
In comparing Figures 4 and 5, the greatest correla-tion is between the Spontaneous Potential logs and the Sonic logs data, obtaining a correlation coefficient of R2 = 0,2685. This reading is very small, indicating a very low correlation of data from the Colorado 38 well.
Colorado 70
0
DT (us/ft)
Spontaneous Potential vs. DT
SP (
mv)
-10
-20
-30
-40
-50
Y = 0,156x + 15,339R2 = 0,2685
50 00
0
50
DT (us/ft)
Resistivity (LN) vs DT
Resi
stiv
ity (
LN)
ohm
-m
60
40
30
20
10
050 100 150 200 250
y = 5,4698e0,0059x
R2 = 0,1738
1
DT (us/ft)
Spontaneous Potential vs DT
SP (
mv)
6
-4
-9
-14
-19
-24
y = 0,0087x -2,051R2 = 0,0039
60
0
20
DT (us/ft)
Resistivity (ILN) vs DT
Resi
stiv
ity (
ILN
) oh
m-m
25
15
10
5
050 100 150 200
y = 32,768e0,0149x
R2 = 0,3227
Figure 4 Spontaneous Potential vs. Sonic Log
Figure 5 Resistivity vs. Sonic Logs
Figure 6 Spontaneous Potential vs. Sonic Logs
Figure 7 Resistivity vs. Sonic Logs
CARLOS-ANDRÉS AYALA-MARÍN & CHRISTIANN-CAMILO GARCÍA-YELA
26 CT&F - Ciencia, Tecnología y Futuro - Vol. 4 Num. 2 Dec. 2010
In the Colorado 70 well the best correlation is in the Resistivity data (ILD), as can be seen in Figures 6 and 7. By using an exponential tendency we obtain a cor-relation coefficient of R2 = 0,3227. The correlation coef-ficient of the Spontaneous Potential data is R2 = 0,0039.
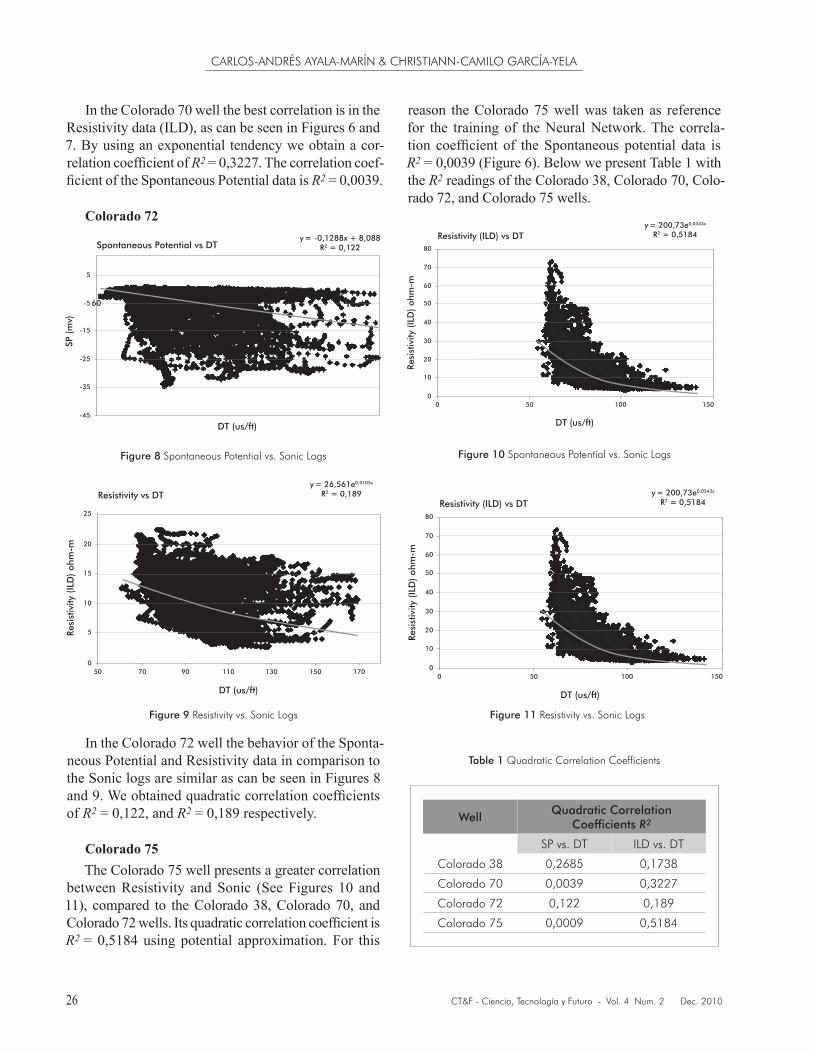
Colorado 72
reason the Colorado 75 well was taken as reference for the training of the Neural Network. The correla-tion coefficient of the Spontaneous potential data is R2 = 0,0039 (Figure 6). Below we present Table 1 with the R2 readings of the Colorado 38, Colorado 70, Colo-rado 72, and Colorado 75 wells.
5
DT (us/ft)
Spontaneous Potential vs DT
SP (
mv)
-5
-15
-25
-35
-45
y = -0,1288x + 8,088R2 = 0,122
60
Figure 8 Spontaneous Potential vs. Sonic Logs
Figure 9 Resistivity vs. Sonic Logs
20
DT (us/ft)
Resistivity vs DT
Resi
stiv
ity (
ILD
) oh
m-m
25
15
10
5
09050 70 110 130 150 170
y = 26,561e0,0103x
R2 = 0,189
In the Colorado 72 well the behavior of the Sponta-neous Potential and Resistivity data in comparison to the Sonic logs are similar as can be seen in Figures 8 and 9. We obtained quadratic correlation coefficients of R2 = 0,122, and R2 = 0,189 respectively.
Colorado 75The Colorado 75 well presents a greater correlation
between Resistivity and Sonic (See Figures 10 and 11), compared to the Colorado 38, Colorado 70, and Colorado 72 wells. Its quadratic correlation coefficient is R2 = 0,5184 using potential approximation. For this
Figure 11 Resistivity vs. Sonic Logs
70
DT (us/ft)
Resistivity (ILD) vs DT
Resi
stiv
ity (
ILD
) oh
m-m
80
50
30
10
0500 100 150
60
20
40
y = 200,73e0,0343x
R2 = 0,5184
Figure 10 Spontaneous Potential vs. Sonic Logs
70
DT (us/ft)
Resistivity (ILD) vs DT
Resi
stiv
ity (
ILD
) oh
m-m
80
50
30
10
0500 100 150
60
20
40
y = 200,73e0,0343x
R2 = 0,5184
Table 1 Quadratic Correlation Coefficients
WellQuadratic Correlation
Coefficients R2
SP vs. DT ILD vs. DT
Colorado 38 0,2685 0,1738
Colorado 70 0,0039 0,3227
Colorado 72 0,122 0,189
Colorado 75 0,0009 0,5184
27
METHODOLOGY TO DESIGN OF SYNTHETIC SONIC LOG (SSL), USING ARTIFICIAL NEURAL NETWORKS
CT&F - Ciencia, Tecnología y Futuro - Vol. 4 Num. 2 Dec. 2010
Topology of the Neural NetworkThe selection of the topology with which the best
Synthetic Sonic Logs results were obtained was based in the readings obtained from the quadratic R2 cor-relation coefficient. This coefficient was obtained by graphing the readings of the true sonic logs vs. readings of the synthetic sonic logs provided by the tool, choos-ing in this manner the topology presenting the greatest coefficient. The topology found is the following:
• Input Layer. Composed of four neurons that cor-respond to the Depth, Spontaneous Potential (SP), Resistivity of the flushed zone (SN), and Resistivity of the uninvaded zone (ILD) readings. The transfer-ence function of the input neurons is the identity function.
• Hidden Layer. The hidden layer is composed of 28 neurons. The sigmoidal transference function is present in each of them.
• Output Layer. The output layer is the Synthetic Sonic Log (DT) and is composed of one neuron. Its transference function is the identity function.
Obtained Synthetic Sonic LogsOnce the Neural Network topology was found, we
proceeded to generate the Synthetic Sonic Logs using GSSL with the verification data (70%), for the Colorado 70, Colorado 72, and Colorado 75 wells. The results obtained for each well are shown below:
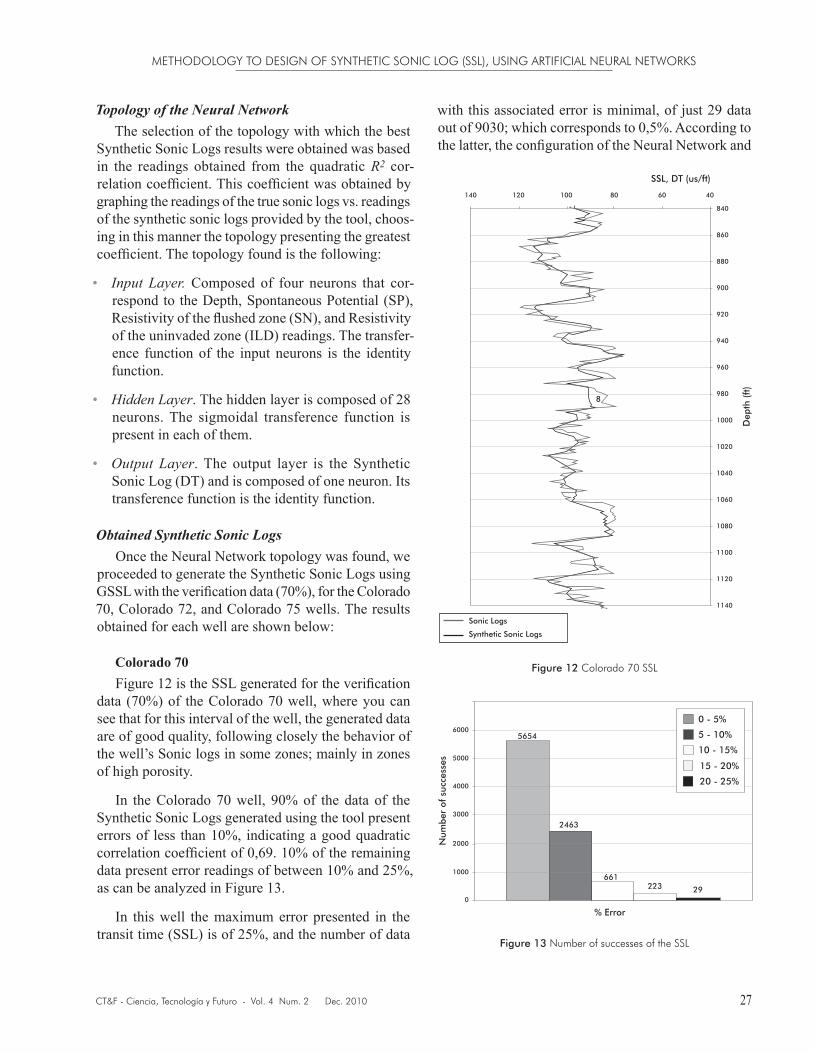
Colorado 70Figure 12 is the SSL generated for the verification
data (70%) of the Colorado 70 well, where you can see that for this interval of the well, the generated data are of good quality, following closely the behavior of the well’s Sonic logs in some zones; mainly in zones of high porosity.
In the Colorado 70 well, 90% of the data of the Synthetic Sonic Logs generated using the tool present errors of less than 10%, indicating a good quadratic correlation coefficient of 0,69. 10% of the remaining data present error readings of between 10% and 25%, as can be analyzed in Figure 13.
In this well the maximum error presented in the transit time (SSL) is of 25%, and the number of data
Figure 12 Colorado 70 SSL
Figure 13 Number of successes of the SSL
% Error
Num
ber
of s
ucce
sses
4000
3000
2000
1000
0
5000
60005654
2463
661
29223
0 - 5%
5 - 10%
15 - 20%
20 - 25%
10 - 15%
with this associated error is minimal, of just 29 data out of 9030; which corresponds to 0,5%. According to the latter, the configuration of the Neural Network and
SSL, DT (us/ft)
Sonic Logs
Synthetic Sonic Logs
Dep
th (
ft)
1140
1120
1100
1080
1060
1040
1020
1000
9808
960
940
920
900
880
860
840
140 120 100 80 60 40
CARLOS-ANDRÉS AYALA-MARÍN & CHRISTIANN-CAMILO GARCÍA-YELA
28 CT&F - Ciencia, Tecnología y Futuro - Vol. 4 Num. 2 Dec. 2010
the management of the explained data are helping to optimize the Synthetic Sonic Logs generation process in terms of calculated error.
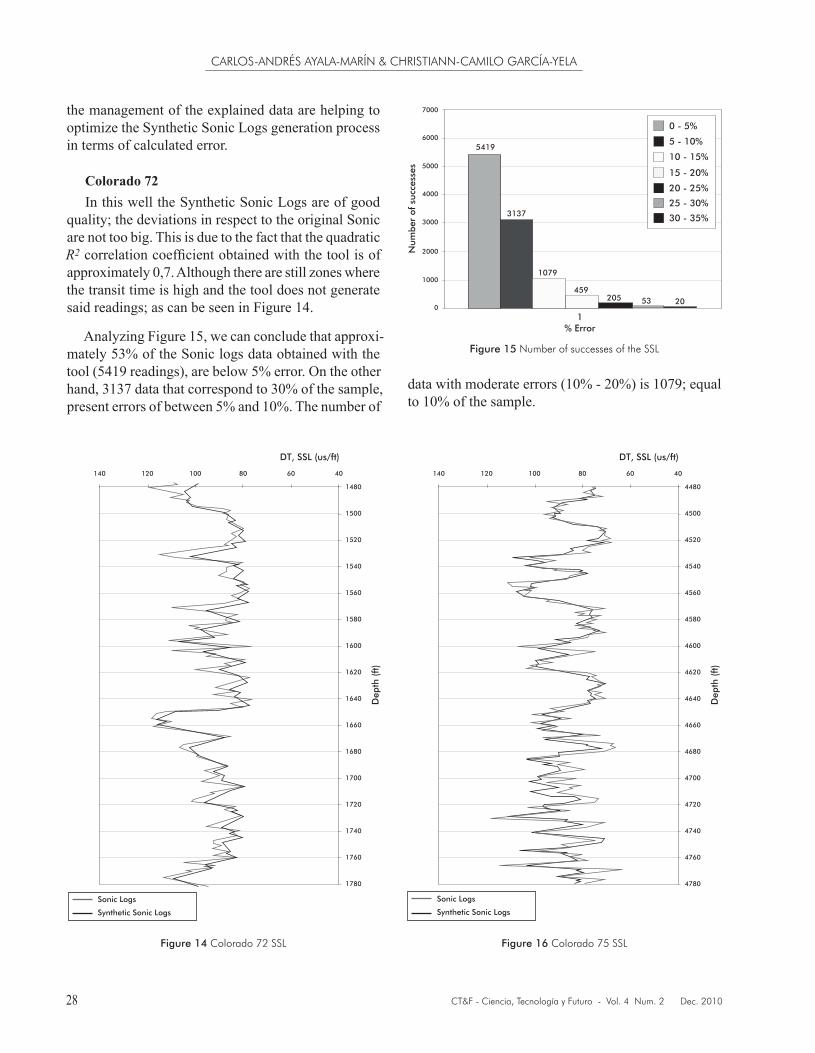
Colorado 72In this well the Synthetic Sonic Logs are of good
quality; the deviations in respect to the original Sonic are not too big. This is due to the fact that the quadratic R2 correlation coefficient obtained with the tool is of approximately 0,7. Although there are still zones where the transit time is high and the tool does not generate said readings; as can be seen in Figure 14.
Analyzing Figure 15, we can conclude that approxi-mately 53% of the Sonic logs data obtained with the tool (5419 readings), are below 5% error. On the other hand, 3137 data that correspond to 30% of the sample, present errors of between 5% and 10%. The number of
data with moderate errors (10% - 20%) is 1079; equal to 10% of the sample.
Figure 14 Colorado 72 SSL
Figure 15 Number of successes of the SSL
1% Error
Num
ber
of s
ucce
sses
4000
3000
2000
1000
0
5000
6000
7000
0 - 5%
5 - 10%
15 - 20%
20 - 25%
10 - 15%
25 - 30%
30 - 35%
5419
3137
1079
459205 53 20
Figure 16 Colorado 75 SSL
DT, SSL (us/ft)
Sonic Logs
Synthetic Sonic Logs
Dep
th (
ft)
1780
1760
1740
1720
1700
1680
1660
1640
1620
1600
1580
1560
1540
1520
1500
1480
140 120 100 80 60 40
DT, SSL (us/ft)
Sonic Logs
Synthetic Sonic Logs
Dep
th (
ft)
4780
4760
4740
4720
4700
4680
4660
4640
4620
4600
4580
4560
4540
4520
4500
4480
140 120 100 80 60 40
29
METHODOLOGY TO DESIGN OF SYNTHETIC SONIC LOG (SSL), USING ARTIFICIAL NEURAL NETWORKS
CT&F - Ciencia, Tecnología y Futuro - Vol. 4 Num. 2 Dec. 2010
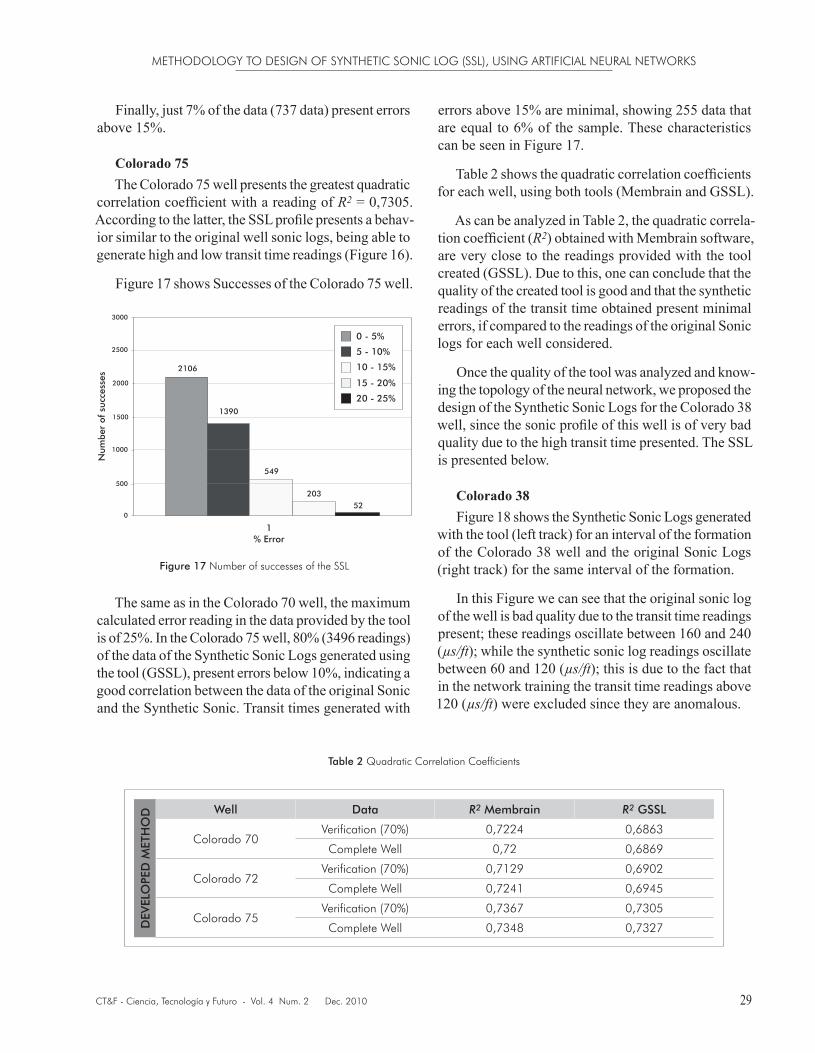
Finally, just 7% of the data (737 data) present errors above 15%.
Colorado 75The Colorado 75 well presents the greatest quadratic
correlation coefficient with a reading of R2 = 0,7305. According to the latter, the SSL profile presents a behav-ior similar to the original well sonic logs, being able to generate high and low transit time readings (Figure 16).
Figure 17 shows Successes of the Colorado 75 well.
errors above 15% are minimal, showing 255 data that are equal to 6% of the sample. These characteristics can be seen in Figure 17.
Table 2 shows the quadratic correlation coefficients for each well, using both tools (Membrain and GSSL).
As can be analyzed in Table 2, the quadratic correla-tion coefficient (R2) obtained with Membrain software, are very close to the readings provided with the tool created (GSSL). Due to this, one can conclude that the quality of the created tool is good and that the synthetic readings of the transit time obtained present minimal errors, if compared to the readings of the original Sonic logs for each well considered.
Once the quality of the tool was analyzed and know-ing the topology of the neural network, we proposed the design of the Synthetic Sonic Logs for the Colorado 38 well, since the sonic profile of this well is of very bad quality due to the high transit time presented. The SSL is presented below.
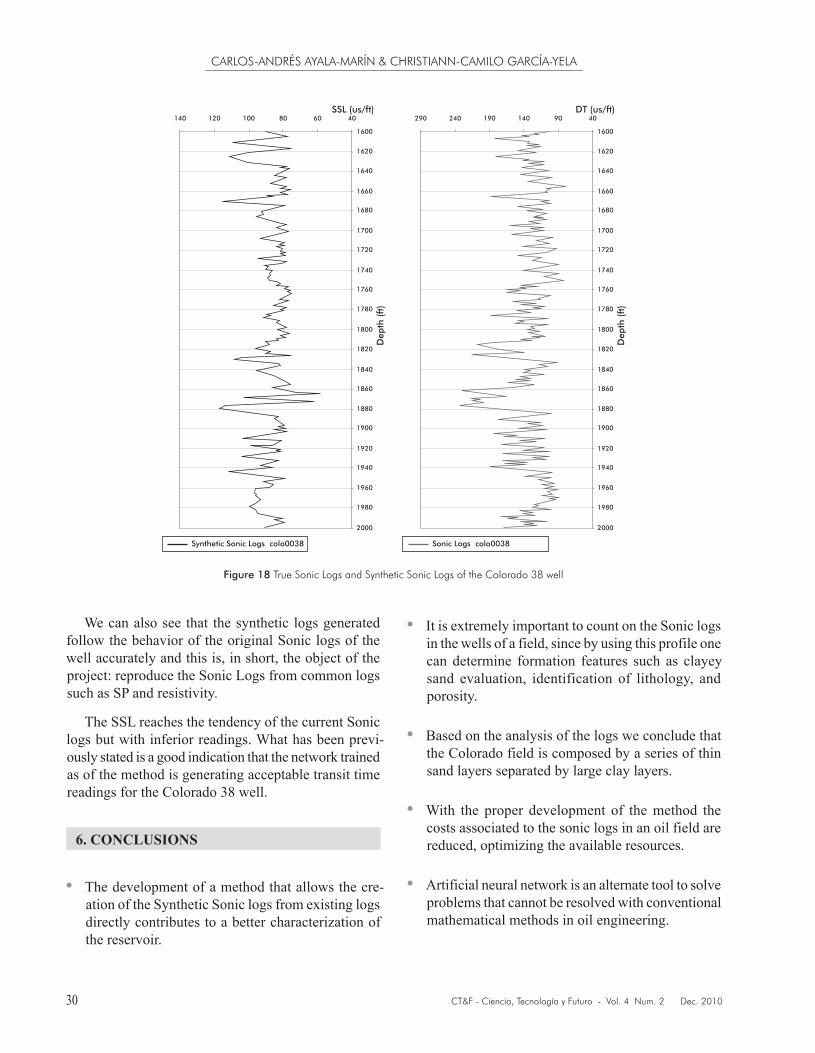
Colorado 38Figure 18 shows the Synthetic Sonic Logs generated
with the tool (left track) for an interval of the formation of the Colorado 38 well and the original Sonic Logs (right track) for the same interval of the formation.
In this Figure we can see that the original sonic log of the well is bad quality due to the transit time readings present; these readings oscillate between 160 and 240 (µs/ft); while the synthetic sonic log readings oscillate between 60 and 120 (µs/ft); this is due to the fact that in the network training the transit time readings above 120 (µs/ft) were excluded since they are anomalous.
Figure 17 Number of successes of the SSL
1% Error
Num
ber
of s
ucce
sses
2000
1500
1000
500
0
2500
3000
2106
1390
549
20352
0 - 5%
5 - 10%
15 - 20%
20 - 25%
10 - 15%
The same as in the Colorado 70 well, the maximum calculated error reading in the data provided by the tool is of 25%. In the Colorado 75 well, 80% (3496 readings) of the data of the Synthetic Sonic Logs generated using the tool (GSSL), present errors below 10%, indicating a good correlation between the data of the original Sonic and the Synthetic Sonic. Transit times generated with
Table 2 Quadratic Correlation Coefficients
DEV
ELO
PED
MET
HO
D Well Data R2 Membrain R2 GSSL
Colorado 70Verification (70%) 0,7224 0,6863
Complete Well 0,72 0,6869
Colorado 72Verification (70%) 0,7129 0,6902
Complete Well 0,7241 0,6945
Colorado 75Verification (70%) 0,7367 0,7305
Complete Well 0,7348 0,7327
CARLOS-ANDRÉS AYALA-MARÍN & CHRISTIANN-CAMILO GARCÍA-YELA
30 CT&F - Ciencia, Tecnología y Futuro - Vol. 4 Num. 2 Dec. 2010
We can also see that the synthetic logs generated follow the behavior of the original Sonic logs of the well accurately and this is, in short, the object of the project: reproduce the Sonic Logs from common logs such as SP and resistivity.
The SSL reaches the tendency of the current Sonic logs but with inferior readings. What has been previ-ously stated is a good indication that the network trained as of the method is generating acceptable transit time readings for the Colorado 38 well.
6. CONCLUSIONS
• The development of a method that allows the cre-ation of the Synthetic Sonic logs from existing logs directly contributes to a better characterization of the reservoir.
Figure 18 True Sonic Logs and Synthetic Sonic Logs of the Colorado 38 well
• It is extremely important to count on the Sonic logs in the wells of a field, since by using this profile one can determine formation features such as clayey sand evaluation, identification of lithology, and porosity.
• Based on the analysis of the logs we conclude that the Colorado field is composed by a series of thin sand layers separated by large clay layers.
• With the proper development of the method the costs associated to the sonic logs in an oil field are reduced, optimizing the available resources.
• Artificial neural network is an alternate tool to solve problems that cannot be resolved with conventional mathematical methods in oil engineering.
SSL (us/ft)
Synthetic Sonic Logs colo0038
Dep
th (
ft)
2000
1880
1860
1840
1820
1800
1780
1760
1740
1720
1700
1680
1660
1640
1620
1600
140 120 100 80 60 40
1900
1920
1940
1960
1980
DT (us/ft)
Sonic Logs colo0038
Dep
th (
ft)
2000
1880
1860
1840
1820
1800
1780
1760
1740
1720
1700
1680
1660
1640
1620
1600
290 240 190 140 90 40
1900
1920
1940
1960
1980
31
METHODOLOGY TO DESIGN OF SYNTHETIC SONIC LOG (SSL), USING ARTIFICIAL NEURAL NETWORKS
CT&F - Ciencia, Tecnología y Futuro - Vol. 4 Num. 2 Dec. 2010
• The generation of synthetic sonic logs with certain degree of precision is possible from the use of arti-ficial neural networks.
• The GSSL tool created is a significant contribu-tion to the hydrocarbon industry since it allows the creation of synthetic sonic logs of a well from the resistivity and spontaneous potential logs.
ACKNOWLEDGEMENTS
The authors wish to express their most sincere grati-tude to the group of Research on Alternative Technolo-gies for Hydrocarbons of the Universidad Industrial de Santander [Santander Industrial University], to the Universidad Industrial de Santander and to the Insti-tuto Colombiano del Petróleo (ICP), for their technical and economic support. Also to Engineers Aristóbulo Bejarano-Wallens, Fernando-Enrique Calvete, and Elkin-Rodolfo Santafe, for the time spent and trust bestowed during the development of our project.
REFERENCES
Acosta, M., Zuluga, C., & Salazar, H. (2000). Tutorial de Redes Neuronales. Facultad de Ingeniería Eléctrica, Universidad Tecnológica de Pereira, Colombia.
Bendeck, J. (1992). Perfiles Eléctricos, Una herramienta para la evaluación de yacimientos. Asociación Colombiana de Geólogos y Geofísicos del Petróleo. Bogotá, Colombia.
Mohaghegh, S., Richardson, M., & Ameri, S. (1998). Virtual Magnetic Imaging Logs: Generation of Synthetic MRI Logs from Conventional Well Logs, SPE 51075, 9-11 November 1998, Pittsburgh, Pennsylvania.
Mohaghegh, S. (2000). Virtual intelligence applications in Petroleum Engineering: Part 1 - Artificial Neural Net-works. SPE 58046, JPT, 52 (9): 64-73, September 2000.