Embed Size (px)
Citation preview

METHODS FOR ECOLOGICAL MONITORING OF CORAL REEFS
A RESOURCE FOR MANAGERS
JOS HILL AND CLIVE WILKINSON
VERSION 1

ii
This compendium of methods contains those known to be in common use for coral reef monitoring or were provided by coral reef resource managers and researchers from around the world. Much of the information is based on questionnaires distributed widely and from the coral reef literature. This should not be considered as a definitive list. Interested persons are invited to contact the authors for information or to indicate errors and omissions.
© Australian Institute of Marine Science, 2004
Australian Institute of Marine SciencePMB No 3Townsville MC Qld 4810AustraliaTelephone +61 7 4753 4444Facsimile +61 7 4772 [email protected]
Reef CheckC/o Institute of the Environment 1362 Hershey Hall, Box 951496 University of California at Los Angeles Los Angeles, CA 90095-1496 USA Telephone +1-310-794-4985 Facsimile +1-310-825-0758 email: [email protected] www.reefcheck.org
ISBN 0 642 322 376
AcknowledgementsSpecial thanks go to those people who provided method descriptions and assessments from a management perspective through discussions and responses to questionnaires. We are particularly grateful to those who provided financial support for the GCRMN and this publication: the US Department of State, the National Oceanographic and Atmospheric Administration, the Department of Environment, Food and Rural Affairs of the UK, through the International Coral Reef Initiative, IUCN The World Conservation Union, CRC Reef Research Centre, the Total Foundation and the International Coral Reef Action Network. Scientific and technical advice was received from AIMS, AGRRA (Atlantic Gulf Rapid Reef Assessment), CARICOMP, NOAA, ReefBase, Reef Check, CORAL The Coral Reef Alliance, The Nature Conservancy and the GCRMN Management Group (UNEP, IOC-UNESCO, IUCN, the World Bank, The Secretariat of the Convention on Biological Diversity). Personnel from IMPAC (International Marine Project Activities Centre), CRC Reef Research Centre and Alison Green provided advice and support. Tim Prior, Michael Phelan and Madeleine Nowak are thanked for their suggestions and proof reading. Finally special thanks go to the production staff at AIMS, Wendy Ellery and Tim Simmonds; again a very professional job under a tight schedule.
Cover photographs were provided by Jos Hill, Dean Miller and Katerina Kupcikova. Contact Jos Hill at [email protected]

iii
CONTENTSPreface. . . . . . . . . . . . . . . . . . . . . . . . . . . . . . . . . . . . . . . . . . . . . . . . . . . . . .11: Introduction to monitoring . . . . . . . . . . . . . . . . . . . . . . . . . . . . . . . . . . . . . . . . .22: What type of monitoring to use? . . . . . . . . . . . . . . . . . . . . . . . . . . . . . . . . . . . . . .43: General monitoring methods . . . . . . . . . . . . . . . . . . . . . . . . . . . . . . . . . . . . . . . 164: Mapping and Site Selection . . . . . . . . . . . . . . . . . . . . . . . . . . . . . . . . . . . . . . . . 21
Manta tow . . . . . . . . . . . . . . . . . . . . . . . . . . . . . . . . . . . . . . . . . . . . . . . 22Video towed diver (video manta tow) . . . . . . . . . . . . . . . . . . . . . . . . . . . . . . . . . . 24Random swim . . . . . . . . . . . . . . . . . . . . . . . . . . . . . . . . . . . . . . . . . . . . . . 26
5: Benthic communities . . . . . . . . . . . . . . . . . . . . . . . . . . . . . . . . . . . . . . . . . . . 27General observations . . . . . . . . . . . . . . . . . . . . . . . . . . . . . . . . . . . . . . . . . . 30Timed swims . . . . . . . . . . . . . . . . . . . . . . . . . . . . . . . . . . . . . . . . . . . . . . 31Line intercept transect . . . . . . . . . . . . . . . . . . . . . . . . . . . . . . . . . . . . . . . . . 33Point intercept transect (PIT) . . . . . . . . . . . . . . . . . . . . . . . . . . . . . . . . . . . . . 36Video transect . . . . . . . . . . . . . . . . . . . . . . . . . . . . . . . . . . . . . . . . . . . . . 38Visual quadrat. . . . . . . . . . . . . . . . . . . . . . . . . . . . . . . . . . . . . . . . . . . . . . 41Permanent photo quadrat . . . . . . . . . . . . . . . . . . . . . . . . . . . . . . . . . . . . . . . 43Coral health general observations . . . . . . . . . . . . . . . . . . . . . . . . . . . . . . . . . . . 45Bleaching general observations . . . . . . . . . . . . . . . . . . . . . . . . . . . . . . . . . . . . . 46Bleaching belt transect . . . . . . . . . . . . . . . . . . . . . . . . . . . . . . . . . . . . . . . . . 47Disease belt transect . . . . . . . . . . . . . . . . . . . . . . . . . . . . . . . . . . . . . . . . . . 49Line transect (Bleaching, Disease) . . . . . . . . . . . . . . . . . . . . . . . . . . . . . . . . . . . 51Tagging coral colonies . . . . . . . . . . . . . . . . . . . . . . . . . . . . . . . . . . . . . . . . . 53Chain intercept transect . . . . . . . . . . . . . . . . . . . . . . . . . . . . . . . . . . . . . . . . 54Coral recruitment tiles . . . . . . . . . . . . . . . . . . . . . . . . . . . . . . . . . . . . . . . . . 56Coral recruitment quadrats . . . . . . . . . . . . . . . . . . . . . . . . . . . . . . . . . . . . . . . 58
6: Macro-invertebrates . . . . . . . . . . . . . . . . . . . . . . . . . . . . . . . . . . . . . . . . . . . . 63Belt transect . . . . . . . . . . . . . . . . . . . . . . . . . . . . . . . . . . . . . . . . . . . . . . 64Diadema belt transect . . . . . . . . . . . . . . . . . . . . . . . . . . . . . . . . . . . . . . . . . . 68Collection of Diadema . . . . . . . . . . . . . . . . . . . . . . . . . . . . . . . . . . . . . . . . . . 70
7: Fishes . . . . . . . . . . . . . . . . . . . . . . . . . . . . . . . . . . . . . . . . . . . . . . . . . . . 73Towed diver (manta tow) . . . . . . . . . . . . . . . . . . . . . . . . . . . . . . . . . . . . . . . . 76Fish roving diver technique . . . . . . . . . . . . . . . . . . . . . . . . . . . . . . . . . . . . . . 78Fish belt transect . . . . . . . . . . . . . . . . . . . . . . . . . . . . . . . . . . . . . . . . . . . . 79Fish stationary plot survey . . . . . . . . . . . . . . . . . . . . . . . . . . . . . . . . . . . . . . . 86Fish rapid visual census . . . . . . . . . . . . . . . . . . . . . . . . . . . . . . . . . . . . . . . . 88Butterfly fish method . . . . . . . . . . . . . . . . . . . . . . . . . . . . . . . . . . . . . . . . . . 89Fish spawning aggregations methods. . . . . . . . . . . . . . . . . . . . . . . . . . . . . . . . . . 91
8: Monitoring physical parameters . . . . . . . . . . . . . . . . . . . . . . . . . . . . . . . . . . . . . 95Water quality . . . . . . . . . . . . . . . . . . . . . . . . . . . . . . . . . . . . . . . . . . . . . . 96Sedimentation traps . . . . . . . . . . . . . . . . . . . . . . . . . . . . . . . . . . . . . . . . . . 96
9: Monitoring programs . . . . . . . . . . . . . . . . . . . . . . . . . . . . . . . . . . . . . . . . . . . 98How do you put a monitoring program together? . . . . . . . . . . . . . . . . . . . . . . . . . . . . 98Major programs . . . . . . . . . . . . . . . . . . . . . . . . . . . . . . . . . . . . . . . . . . . . . 98 Global Coral Reef Monitoring Program. . . . . . . . . . . . . . . . . . . . . . . . . . . . 99 Reef Check . . . . . . . . . . . . . . . . . . . . . . . . . . . . . . . . . . . . . . . . . 100 Atlantic and Gulf Rapid Reef Assessment . . . . . . . . . . . . . . . . . . . . . . . . . 101 Caribbean Coastal Marine Productivity Program . . . . . . . . . . . . . . . . . . . . . 102 Coral Reef Degradation in the Indian Ocean . . . . . . . . . . . . . . . . . . . . . . . 103 Commission de l’Ocean Indien/Indian Ocean Commission . . . . . . . . . . . . . . . . . 104 Mesoamerican Barrier Reef System – Synoptic Monitoring Program . . . . . . . . . . . 105 Reef Condition (RECON) Monitoring Program . . . . . . . . . . . . . . . . . . . . . . . 106
Appendices . . . . . . . . . . . . . . . . . . . . . . . . . . . . . . . . . . . . . . . . . . . . . . . . . 1071: How to do a pilot study? . . . . . . . . . . . . . . . . . . . . . . . . . . . . . . . . . . . . . . 1072: Generic monitoring equipment . . . . . . . . . . . . . . . . . . . . . . . . . . . . . . . . . . . 107
References . . . . . . . . . . . . . . . . . . . . . . . . . . . . . . . . . . . . . . . . . . . . . . . . . . 112Glossary of terms . . . . . . . . . . . . . . . . . . . . . . . . . . . . . . . . . . . . . . . . . . . . . . 116

v

vi
Pot
enti
al m
etho
ds t
o us
e fo
r m
onit
orin
g di
stur
banc
e im
pact
s. I
t is
rec
omm
ende
d th
at m
onit
orin
g is
don
e of
the
dam
age
site
s an
d co
ntro
l sit
es, p
refe
rabl
y be
fore
the
dam
age,
dur
ing
and
afte
r da
mag
ing
impa
cts
have
cea
sed.
Mon
itor
ing
site
s fo
r su
cces
s of
rec
over
y is
a m
easu
re o
f the
suc
cess
of m
anag
emen
t in
terv
enti
on.
Thr
eat
Impa
cts
Wha
t to
mon
itor
(fe
w r
esou
rces
)P
ages
Ove
r-ex
ploi
tati
on o
f m
arin
e re
sour
ces
Ove
r-fis
hing
Hun
ting
e.g
. tur
tles
& d
ugon
g
m
Fish
erie
s - c
atch
per
uni
t ef
fort
– fi
sher
y de
pend
ent
mon
itor
ing;
m
Impa
cts
on p
opul
atio
ns o
f tar
get
spec
ies:
abu
ndan
ce &
siz
e - fi
sher
y in
depe
nden
t m
onit
orin
gm
For
susp
ecte
d ec
osys
tem
ove
r-fis
hing
, mon
itor
impa
cts
on n
on-t
arge
t sp
ecie
s - c
over
of
alga
e, c
oral
, pre
y sp
ecie
s et
c.
51, 6
4, 7
8,
79, 8
6, 8
8
Des
truc
tive
fish
ing
prac
tice
sm
Phy
sica
l dam
age
to h
abit
at -
brok
en c
oral
; liv
e an
d de
ad c
oral
cov
er;
m
Impa
cts
of o
ver-
fishi
ng -
see
abov
e.22
, 31,
33
Cora
l min
ing
See
habi
tat
dest
ruct
ion
belo
w—
Land
bas
ed im
pact
s
Hab
itat
des
truc
tion
: coa
stal
de
velo
pmen
t; d
redg
ing
& fi
lling
; cor
al
min
ing
m
Are
a of
hab
itat
lost
; m
Impa
cts
on a
djac
ent
cora
l com
mun
itie
s - c
over
, div
ersi
ty, a
nd h
ealt
h.22
, 27,
31,
33
Poi
nt s
ourc
e po
lluti
on: e
.g. s
ewag
e,
indu
stry
out
falls
etc
.m
Wat
er q
ualit
y - m
easu
re r
elev
ant
pollu
tant
e.g
. sed
imen
ts, n
utri
ents
, fer
tili
sers
, pes
tici
des
at s
ourc
e an
d re
ceiv
ing
wat
ers;
m
Impa
cts
on c
oral
com
mun
itie
s - c
over
, div
ersi
ty, a
nd h
ealt
h.22
, 31,
33,
95
Non
-poi
nt s
ourc
e po
lluti
on: l
and
clea
ring
, agr
icul
ture
, sep
tic
syst
ems
etc.
m
Wat
er q
ualit
y - m
easu
re r
elev
ant
poll
utan
t e.
g. s
edim
ents
, nut
rien
ts, f
erti
lise
rs, p
esti
cide
s in
del
iver
y m
echa
nism
(ri
vers
/st
ream
s du
ring
floo
ds)
and
rece
ivin
g w
ater
s;
m
Impa
cts
on c
oral
com
mun
itie
s - c
over
, div
ersi
ty, a
nd h
ealt
h.
22, 3
1, 3
3,
95
Ship
ping
bas
ed
impa
cts
Pol
luti
on e
.g. f
uel s
pills
m
Type
, qua
ntit
y an
d di
stri
buti
on o
f po
llut
ant;
m
Impa
cts
on b
enth
ic c
omm
unit
ies,
par
ticu
larl
y co
ver
of c
oral
and
alg
ae, d
iver
sity
and
hea
lth
of c
oral
com
mun
itie
s an
d ot
her
indi
cato
r sp
ecie
s e.
g. c
lam
s, u
rchi
ns.
33, 3
6, 5
1,
64
Gro
undi
ngs/
wre
cks
m
Phy
sica
l dam
age
to h
abit
at -
area
of
brok
en/s
mas
hed
cora
l; ch
ange
s to
hyd
rolo
gy o
f ar
ea e
.g. n
ew c
hann
els;
m
Type
, qua
ntit
y an
d di
stri
buti
on o
f pol
luta
nts
e.g.
oil
, die
sel,
anti
foul
ing
pain
t &
and
impa
cts
on b
enth
ic c
omm
unit
ies
(see
abo
ve).
22, 3
1, 5
1
Intr
oduc
ed s
peci
es in
bal
last
wat
er e
tc.
m
Div
ersi
ty, s
ize
and
abun
danc
e of
intr
oduc
ed s
peci
es;
m
Impa
cts
on n
ativ
e sp
ecie
s e.
g. d
ue t
o co
mpe
titi
on o
r pr
edat
ion;
31, 6
4, 6
8
Nav
igat
ion
aids
: lig
htho
uses
etc
.m
Phy
sica
l dam
age
to h
abit
at -
area
of
brok
en/s
mas
hed
cora
l; ar
ea o
f ha
bita
t lo
st; c
hang
es t
o lo
cal h
ydro
logy
; and
m
Im
pact
on
adja
cent
cor
al c
omm
unit
ies.
22, 3
1, 3
3
Tour
ism
&
Rec
reat
ion
Coas
tal d
evel
opm
ent:
res
orts
, mar
inas
, je
ttie
s et
c.Se
e ha
bita
t de
stru
ctio
n ab
ove
—
Off
shor
e st
ruct
ures
e.g
. pon
toon
sm
Phy
sica
l dam
age
to c
oral
com
mun
itie
s - b
roke
n co
ral;
area
of
habi
tat
lost
;m
Impa
cts
on a
djac
ent
cora
l ree
f com
mun
itie
s fr
om s
hadi
ng -
cora
l cov
er, d
iver
sity
, and
hea
lth;
m
Impa
cts
from
fish
feed
ing
– fi
sh a
bund
ance
, siz
e an
d di
vers
ity.
22, 3
1, 3
3,
79
Div
ing
and
snor
kelli
ngm
Bro
ken
cora
l and
cor
al c
over
at
key
site
s.33
Larg
e sc
ale
dist
urba
nces
Cora
l ble
achi
ng
m
Sea
surf
ace
tem
pera
ture
s;m
Ext
ent,
sev
erit
y an
d re
cove
ry o
f cor
al c
omm
unit
ies
- cov
er, d
iver
sity
, siz
e st
ruct
ure,
cha
nges
in r
elat
ive
abun
danc
e of
gro
wth
fo
rms;
m
Iden
tify
ble
achi
ng r
esili
ent
spec
ies
and
site
s.
22,
33,
51,
95
Maj
or s
torm
s, c
yclo
nes,
hur
rica
nes
and
typh
oons
m
Phy
sica
l dam
age
- bro
ken
cora
l; an
d ch
ange
s to
cor
al c
omm
unit
ies
- cov
er, d
iver
sity
and
rel
ativ
e ab
unda
nce
of g
row
th f
orm
s.22
, 33
Pop
ulat
ion
outb
reak
s of
cor
alliv
ores
: CO
Ts, D
rupe
lla e
tc.
m
Abu
ndan
ce a
nd s
ize
of c
oral
livo
res;
m
Impa
cts
of c
oral
com
mun
ity
- cor
al c
over
, div
ersi
ty, a
nd r
elat
ive
abun
danc
e of
gro
wth
for
ms.
22, 3
3,
51,6
4, 6
8
Geo
logi
c ac
tivi
ty: e
arth
quak
es,
volc
anoe
s, t
suna
mis
m
Are
a of
hab
itat
lost
or
dest
roye
d e.
g. b
urie
d by
lava
and
ash
;m
Phy
sica
l dam
age
- br
oken
cor
al in
cor
al c
omm
unit
ies;
m
Type
, qua
ntit
y an
d di
stri
buti
on o
f pol
luta
nts
e.g.
lava
, ash
, pum
ice
and
impa
cts
on c
oral
ree
f com
mun
itie
s - c
oral
cov
er, d
iver
sity
and
re
lati
ve a
bund
ance
of
grow
th f
orm
s.
22, 2
7, 3
3,
51
Pref
ace

1
The aim of this book is to help managers of coral reefs select appropriate ecological monitoring programs, protocols and methods for your coral reef management needs. This book was written in response to requests from coral reef managers for advice on monitoring, especially: m How monitoring can help management;m How to choose the best methods to suit your needs; andm The good and bad points and associated costs of a wide range of monitoring methods.
Monitoring can be specifi c or general. There are different management information needs for each coral reef area, so monitoring programs must be designed to include a selection of protocols and methods to meet those needs. The protocols and methods outlined in this book represent the ones most commonly used on coral reefs around the world. Our advice is to use the standard and frequently used methods to monitor your reefs because these have been extensively tested. Using standard methods also means that you will be able to compare the status of your coral reefs with other reefs at regional and global scales.
Coral reef managers around the world have similar problems and questions that monitoring can answer. For example, managers need to know if:m Coral reefs are healthy and improving;m Threats are damaging the corals or other organisms;m Fish populations are increasing in a protected area;m Management actions have been successful;m Economies of local communities are maintained or improved;m Communities understand the need for management and want to assist;m Tourism is a positive or negative benefi t for the coral reef area.
These questions and many others can be answered with an effective monitoring program, which will consist of a number of monitoring methods, often at a mix of scales from the whole reef to a small area. This reference book should be kept current. We invite you to recommend additional methods to be included as well as other suggested updates. Please write to us at [email protected].
SOME IMPORTANT DEFINITIONS
There are lots of terms used when talking about monitoring. We use the same defi nitions throughout There are lots of terms used when talking about monitoring. We use the same defi nitions throughout the book to make it simple to follow.the book to make it simple to follow.mm A A surveysurvey is collecting data and information about a coral reef site;is collecting data and information about a coral reef site;mm MonitoringMonitoring is when surveys (or parts of them) are repeated;is when surveys (or parts of them) are repeated;mm A A monitoring programmonitoring program consists of series of monitoring protocols that together provide a consists of series of monitoring protocols that together provide a
manager with the information needed to manage their reefs;manager with the information needed to manage their reefs;mm Protocols Protocols are the selections of methods and how they are used to gain information at a site. are the selections of methods and how they are used to gain information at a site.
This will include numbers of replicates, lengths of transect lines, specifi c information gathered, This will include numbers of replicates, lengths of transect lines, specifi c information gathered, e.g. animals or plants to be counted or measured;e.g. animals or plants to be counted or measured;
mm A A methodmethod is the description of how the information is collected, e.g. line or point intercept is the description of how the information is collected, e.g. line or point intercept transect or how to lay the transect;transect or how to lay the transect;
mm Ecological monitoringEcological monitoring is monitoring the natural environment, e.g. the fi sh or coral. This is monitoring the natural environment, e.g. the fi sh or coral. This Ecological monitoringEcological monitoring is monitoring the natural environment, e.g. the fi sh or coral. This Ecological monitoringEcological monitoringincludes both biological and physical monitoring;includes both biological and physical monitoring;
mm Socio-economic monitoringSocio-economic monitoring is monitoring the way humans use the natural resources, e.g. the is monitoring the way humans use the natural resources, e.g. the Socio-economic monitoringSocio-economic monitoring is monitoring the way humans use the natural resources, e.g. the Socio-economic monitoringSocio-economic monitoringmethods used to catch fi sh;methods used to catch fi sh;
mm A monitoring A monitoring site site is the area of coral reef selected for monitoring; is the area of coral reef selected for monitoring; mm A A samplesample is the area where you count the animals and plants e.g. along a transect or inside a is the area where you count the animals and plants e.g. along a transect or inside a
quadrat. The sample areas selected for monitoring will depend upon the type of information quadrat. The sample areas selected for monitoring will depend upon the type of information needed and the type of things you want to count. You will need to use a number of separate needed and the type of things you want to count. You will need to use a number of separate samples to survey one site. These are called samples to survey one site. These are called replicates.replicates.
PREFACE
Pref
ace

2
1: INTRODUCTION TO MONITORING
What is monitoring?Monitoring is the gathering of data and information on coral reef ecosystems or on those people who use coral reef resources. Monitoring should be repeated on a regular basis, preferably over an extended period of time.
Ideally a coral reef manager will perform a detailed baseline survey that includes many measures or parameters that may or may not change over time. These include: m Mapping the extent and location of major habitats, particularly coral reefs;m Understanding the status of coral communities, fish populations and fishing practises;m Measuring the size and structure of the human population using these resources;m Understanding government rules and regulations on coral reefs and conservation; andm Determining the decision making process in local communities.
The coral reef manager has to select which variables (things to measure) to be included into a monitoring program. In this book, the term monitoring includes both the initial baseline survey and continued monitoring.
How can monitoring help you?A major goal of a coral reef monitoring program is to provide the data to support effective management. As more Marine Protected Areas (MPAs) are established, it is becoming increasingly important to monitor whether they are achieving their management goals. Monitoring can assist with the effective management of coral reefs through the following tasks:
1. Resource assessment and mapping – what and where are the resources in your coral reef area that should be managed;
2. Resource status and long-term trends – what is the status of these resources and how are they changing over time (Monitoring large areas: Great Barrier Reef Marine Park, p 9;
3. Status and long-term trends of user groups – who are the major users and stakeholders of your coral reefs, what are their patterns of use and attitudes towards management, and how they are changing;
4. Impacts of large-scale disturbances - how do impacts like coral bleaching, crown-of-thorns starfish (Acanthaster planci or commonly known as COTS) outbreaks and tropical storms affect your coral reefs, p 63;
5. Impacts of human activities – how do the activities of people affect the coral reef and its resources. This includes fishing, land use practices, coastal developments, and tourism (see ‘reactive monitoring at Nelly Bay Harbour, Magnetic Island, North Queensland, Australia’, p 7);
6. Performance evaluation & adaptive management - how can monitoring be used to measure success of management goals and assist in adaptive management (Monitoring broad scale impacts on coral reefs: ‘how monitoring demonstrated effective control of blast fishing in Komodo National Park’, p 7);
7. Education and awareness raising – how to provide support for coral reef management through raising awareness and education of user communities, government, other stakeholders and management staff (‘Using Reef Check to stimulate community management of Gilutongan, Central Philippines’, p 6 and ‘How monitoring demonstrated effective control of blast fishing in Komodo National Park’, p 7);
8. Building resilience into MPAs - how to design MPAs so they are more resilient to large scale disturbances such as coral bleaching or outbreaks of COTS;
9. Contributing to regional and global networks – how to link up with and learn from other coral reef managers around the world and assist others manage their coral reefs (see ‘Global and regional programs’, p 98.
For more detail on how monitoring can help conserve reefs see Wilkinson et al. (2003).
Ecological and socio-economic monitoringThere are two main types of monitoring: m Ecological monitoring; and m Socio-economic monitoring.
Ecological and socio-economic parameters are often closely linked; therefore ecological monitoring and socio-economic monitoring should be done in the same place at the same time. For example, monitoring of fish populations should be directly linked to surveys of fish markets, fishermen and their catches. Similarly ecological parameters describe the natural state of the coral reef, which will have impacts on socio-economic factors such as income and employment.
Intr
oduc
tion

3
Biological parameters measure the status and trends in the organisms on coral reefs. Biological parameters focus on the major resources, and these parameters can be used to assess the extent of damage to coral reefs from natural and human disturbances. The most frequently measured ecological parameters include: m Percentage cover of corals (both live and dead) and sponges, algae and non-living material;m Species or genus composition and size structure of coral communities; m Presence of newly settled corals and juveniles; m Numbers, species composition, size (biomass) and structure of fi sh populations; m Juvenile fi shes, especially target species; populations of organisms of special interest such as giant clams,
COTS, sea urchins etc.; m Extent and nature of coral bleaching; andm Extent and type of coral disease.
Physical parameters measure the physical environment on and around the reefs. This provides a physical description of the environment surrounding reefs which assists in making maps, as well as measuring the change in the environment. Parameters include: m Depth, bathymetry and reef profi les; m Currents; m Temperature; m Water quality; m Visibility; and m Salinity.
Socio-economic monitoring: This aims to understand how people use, understand and interact with coral reefs. It is not possible to separate human activities and ecosystem health, especially when coral reefs are important to the livelihoods of local community members. Socio-economic monitoring can measure the motivations of resource users as well as the social, cultural, and economic conditions in communities near coral reefs. Socio-economic data can help mangers determine which stakeholder and community attributes provide the basis for successful management.
The most frequently used socio-economic parameters include: m Community populations, employment levels and incomes; m Proportion of fi shers, and where and how they fi sh; m Catch and price statistics for reef fi sheries; m Decision making structures in communities; m Community perceptions of reef management; m Tourist perceptions of the value of MPAs and willingness to pay for management etc.
This book is only about ecological monitoring methods. See Bunce et al. (2000); Wilkinson et al. (2003) for information on socio-economic methods
The ecological monitoring methods listed in this book fall under the following categories:Section 4: Mapping and site selection, p 21;Section 5: Benthic communities, p 27;Section 6: Invertebrates, p 63;Section 7: Fishes, p 73;Section 8: Physical parameters, p 95.
.
Ecological monitoringEcological monitoring includes the natural environment (biological and physical) e.g. the fi sh, coral or includes the natural environment (biological and physical) e.g. the fi sh, coral or Ecological monitoringEcological monitoring includes the natural environment (biological and physical) e.g. the fi sh, coral or Ecological monitoringEcological monitoringsedimentation. sedimentation.
Intr
oduc
tion

4
2: WHAT TYPE OF MONITORING TO USE?Your choice of monitoring program will depend on a number of factors. Our aim is to guide you through the following issues:
1. What information do you need to know? Is your question general or specifi c? (p 4);2. What do you need to monitor? (p 4);3. What resources do you have available? (p 5);4. What scale of monitoring program do you want? (p 6);5. What types of reef do you have in the area? (p 8);6. What methods should you use? (p 8);7. How often should you monitor? (p 12);8. Quality control and training? (p 13);9. Data handling and communicating results (p 14);10. The need to involve the public (p 14).
What information do you need to know? What is your question?The information you need to manage your reef will determine which monitoring protocols you use (see ‘how can monitoring help you’, p 2). If you want to determine the effect of particular impacts on your coral reef see table on page vi. Threats to coral reefs can be categorised as human, natural or climate-related, although some natural impacts may be exacerbated by human impacts. For example, global climate change may increase the severity and frequency of coral bleaching, while COTS outbreaks may be infl uenced by increased fertiliser pollution.
What do you need to monitor?You will need to consider the following:
1. What biological and physical variables (things on the reef) do you need to monitor?2. In what detail (taxonomic resolution for biological parameters) do you need to monitor these variables?3. At what scale do you want to collect information?
m Broad-scale (wide area);m Medium-scale (medium area);m Fine-scale (small area).
What variables should you measure?A variable is a component of the ecosystem, physical or biological, that has an effect on other components of the ecosystem. For monitoring, the variables are the components or species that we collect data on, e.g. percentage cover of hard coral. We cannot measure every variable on a coral reef, therefore we use ‘indicators’ to detect change or impacts, or show reef ‘health’. Indicators used for coral reef monitoring are either ecologically or economically important. Examples of ecological indicators include percent hard coral cover, which is an indicator of coral reef health because many other organisms rely on hard coral for their survival; and abundance of COTS, other predators or disease, because disease and predators may reduce coral cover and tourism potential.
WHAT ARE THE MAIN ECOLOGICAL MONITORING CATEGORIES?
1. Physical parameters;1. Physical parameters;2. Biological parameters;2. Biological parameters;
mm Benthic communities (living and non-living components); Benthic communities (living and non-living components);mm Invertebrates; Invertebrates;mm Fishes. Fishes.
Most managers use percent coral cover, and particularly changes over time in cover, as their main Most managers use percent coral cover, and particularly changes over time in cover, as their main indicator of coral reef health. Scientists usually want to know the coral species and how these change indicator of coral reef health. Scientists usually want to know the coral species and how these change with time to understand changes in coral cover, but this is not essential information for decision with time to understand changes in coral cover, but this is not essential information for decision making by coral reef managersmaking by coral reef managers..
Que
stio
ns

5
Economic indicators are species harvested by humans and important to the local economy e.g. conch, giant clams, trochus shells. Monitoring the abundance of these organisms and those that are closely linked to them is important for managing their sustainable use. Examples of economic indicators include percent hard coral cover (because tourists like to see beautiful coral), and size and abundance of fi shery species e.g. grouper and snapper and because tourists also like to see lots of colourful or large fi sh.
What detail to measure (e.g. taxonomic resolution)?Three levels of monitoring programs can be defi ned. These are:m Level 1 - Community monitoring is at a lower detail level, i.e. you cover a larger area in less time, for less
cost;m Level 2 - Management monitoring adds more detail, is more expensive, takes more time and covers less
area, but aims to provide the best information for MPA management; and m Level 3 - Research monitoring provides very detailed data, but it is expensive, takes more time, requires
more expertise to assess a smaller area, and is usually designed to answer a specifi c question.
Detail can be added by recording family, genus and species or sizes of animal groups. The highest level of detail (genus and species) usually requires Level 3 - research monitoring. Also more detail can be added to provide more accurate measures and reduce the uncertainty (i.e. reducing the variance in the estimate in ‘sample design’). It is important that the monitoring team only collect information at the level of detail that matches their training.
You may wish to combine level 2 or 3 monitoring at a small number of sites with level 1 monitoring over a larger area (see Monitoring large areas: Great Barrier Reef Marine Park, p 9).
What resources do you have available?Monitoring costs can vary on the basis of:m Expertise of the people to do the monitoring;m Cost of equipment and time.
Coral reef managers at a meeting in Manila in 2003 (ITMEMS2), recognised that monitoring programs should be designed in the context of limited resources and competition with other elements of management. Managers suggested that between 5 and 10% of the budget for the total coral reef or MPA management should be put into monitoring.
Costs will also be affected by the size of the reef area to be monitored, and therefore how many surveys are needed. You need to consider the resources available before you decide which monitoring program level you want to implement.
ExpertiseWho will do the monitoring? The task will include data collection as well as data analysis and interpretation. Monitoring staff could include:m Community members or volunteers (Level 1 program – Community monitoring);m Staff with some scientifi c training (tertiary or learned through work experience) (Level 1 or 2 programs -
Community or Management monitoring);m Staff with some tertiary scientifi c training (Level 2 program – Management monitoring);m Scientifi c researchers (Level 3 program – Research monitoring);
Level 1 – Community monitoring relies on using lesser-trained people (volunteers and community members) with some scientifi c supervision to gather broad-scale data at lower resolution. These data provide a cost-effective ‘early warning system’ of environmental changes over larger areas than is possible with more expensive level 2 or 3 programs. A Level 1 program will usually consist of:m Some broad scale surveys, e.g. random swims;m Point intercept transects assessing corals and other benthos using low detail categories;m Fish transects to count major target fi shes on the same transect line as the corals.
The most commonly used community monitoring program is Reef Check, which involves rapid and The most commonly used community monitoring program is Reef Check, which involves rapid and cost-effective collection of data by people without extensive training or experience. Reef Check cost-effective collection of data by people without extensive training or experience. Reef Check provides a low level of detail, but useful information on reef status and the causes of reef degradation. provides a low level of detail, but useful information on reef status and the causes of reef degradation. It is particularly useful as an ‘early warning system’ for managers of changes in coral reef resources. It is particularly useful as an ‘early warning system’ for managers of changes in coral reef resources. Reef Check is recommended for people with the lowest level of expertise and funding, and is Reef Check is recommended for people with the lowest level of expertise and funding, and is particularly useful for monitoring programs aimed at community education and awareness-raising by particularly useful for monitoring programs aimed at community education and awareness-raising by rewarding government agencies, companies and NGOs for their support, p 100.rewarding government agencies, companies and NGOs for their support, p 100.
Que
stio
ns

6
Community monitoring builds public support for management initiatives and ensures that the community understands the status of the resources and what is happening to them. Community monitoring methods, such as the Reef Check methods or REEF fi sh census methods, are not suffi cient to provide a complete picture of coral reef health, but they can illustrate long-term trends and indicate where more detailed monitoring is needed.
Ideally, a long-term monitoring program should include both community monitoring, such as Reef Check, and some more detailed surveys, such as identifying the major species (p 4 ‘what do you need to monitor?’). Unfortunately, detailed surveys require teams of highly trained scientists and are more time consuming and costly than community programs. In many countries, the initial goal of setting up a network of community monitoring sites at a few areas is a major challenge. Therefore, we recommend starting with a network of Reef Check-type sites as the fi rst step towards a local or national monitoring program, and then if this is successful, level 2 and 3 programs can be added later.
Level 2 – Management monitoring relies on staff with scientifi c training (tertiary or through work experience), e.g. environment or fi sheries government staff, to gather medium-scale data at medium to high resolution. A level 2 program will usually consist of: m Broad scale surveys to select monitoring sites and assess large areas using manta tow or timed swims;m Point intercept or line intercept transects. These methods assess corals and other benthos at a chosen level
of detail, e.g. shape categories or corals at genus level;m Fish transects to count fi shes on the same transect line as the corals with emphasis on size measurements of
target species.
The Global Coral Reef Monitoring Network (GCRMN) was specifi cally developed to assist managers gather useful data and requires a low to moderate level of funding and expertise. Further information is on www.gcrmn.org/ (p 99.) Other level 2 programs are CARICOMP (p 102), AGRRA (p 101) and MBRS SMP (p 105).
Level 3 – Research monitoring relies on experienced scientists (university researchers, experienced environment or fi sheries government staff) to gather specifi c, small-scale, high detail data. This level is often used to assess impacts of developments, e.g. building of a tourist resort.
USING REEF CHECK TO STIMULATE COMMUNITY MANAGEMENT OF GILUTONGAN, CENTRAL PHILIPPINES
Fishing pressure on the reefs was high around Cebu when an MPA was established in 1991 at Fishing pressure on the reefs was high around Cebu when an MPA was established in 1991 at Gilutongan, a small island near Cebu. However the fi shery regulations were not enforced, and the reefs Gilutongan, a small island near Cebu. However the fi shery regulations were not enforced, and the reefs continued to decline from overuse. continued to decline from overuse.
What was done?What was done?In 1998, a team of 20 local divers was trained to do Reef Check. The results were presented to In 1998, a team of 20 local divers was trained to do Reef Check. The results were presented to the community and the poor condition of the reef was widely discussed. The active participation the community and the poor condition of the reef was widely discussed. The active participation of community members in the surveys was considered to be an important factor in the community of community members in the surveys was considered to be an important factor in the community decision to start active management in the marine sanctuary. Previous monitoring had been carried decision to start active management in the marine sanctuary. Previous monitoring had been carried out by trained scientists, however little of the data or information was being presented to the local out by trained scientists, however little of the data or information was being presented to the local communities. Since the community became involved, the corals and fi sh stocks have improved and communities. Since the community became involved, the corals and fi sh stocks have improved and tourism is a major income source for the community. tourism is a major income source for the community.
Gilutongan marine sanctuary has been an outstanding success (Wilkinson Gilutongan marine sanctuary has been an outstanding success (Wilkinson et al.et al. 2003). Contact Mike 2003). Contact Mike Ross, [email protected] or Gregor Hodgson, [email protected], [email protected] or Gregor Hodgson, [email protected]
Advantages of community monitoringm Cost effective to cover large areas;m Very useful as an ‘early warning system’ of
changes in the coral reef;m Enhances education, awareness and local
stewardship of resources through the participation of community members.
Limitations of community monitoringm Data precision tends to be low;m A large amount of time must be spent on training
(ongoing) to ensure reliable data;m Reduced detail but managers often only use low
detail information e.g. percent coral cover.
Que
stio
ns

7
A Level 3 program will usually consist of:m Broad scale surveys to select monitoring sites and assess impacts using manta tow or timed swims;m Line intercept transects or video transects to assess coral and other benthos at genus or species level;m Fish transects to count all fi shes on the same transect line as the corals with emphasis on size measurements
of target species.
These programs tend to be the most expensive and require high levels of scientifi c expertise. The Australian Institute of Marine Science Long Term Monitoring Program provides a good example of a research monitoring program on the Great Barrier Reef (www.aims.gov.au). A similar program is operated for the Florida Keys National Marine Sanctuary (www.fl oridakeys.noaa.gov/research_monitoring). Research monitoring programs are only recommended where managers have a high level of technical expertise and adequate fi nancial resources.
MONITORING BROAD SCALE IMPACTS ON CORAL REEFS: HOW MONITORING DEMONSTRATED EFFECTIVE CONTROL OF BLAST FISHING IN KOMODO
NATIONAL PARK (KNP)
The coral reef communities of KNP were seriously threatened by blast fi shing, reef gleaning and over-The coral reef communities of KNP were seriously threatened by blast fi shing, reef gleaning and over-fi shing putting the Park’s function as a replenishment source for surrounding fi shing grounds at risk. fi shing putting the Park’s function as a replenishment source for surrounding fi shing grounds at risk. The Nature Conservancy set up a conservation program to reduce blast fi shing within the park. The The Nature Conservancy set up a conservation program to reduce blast fi shing within the park. The indicators of blast fi shing are rubble and hard coral cover, which is low detail information. KNP is indicators of blast fi shing are rubble and hard coral cover, which is low detail information. KNP is 219,322 ha and resources limited, therefore low detail, broad-scale methods were appropriate.219,322 ha and resources limited, therefore low detail, broad-scale methods were appropriate.
What was done?What was done?Park staff were trained to conduct simple timed swim surveys (p 31) to estimate the percentage of live Park staff were trained to conduct simple timed swim surveys (p 31) to estimate the percentage of live coral and blast scars. This method enabled useful information to be obtained over a large area at low coral and blast scars. This method enabled useful information to be obtained over a large area at low cost. Surveys were repeated every 2cost. Surveys were repeated every 2ndnd year and provided broad scale information on coral cover and year and provided broad scale information on coral cover and damage from blast fi shing. The results suggested that the conservation program successfully reduced damage from blast fi shing. The results suggested that the conservation program successfully reduced blast fi shing and that coral recovery was most rapid near protection and enforcement areas. The blast fi shing and that coral recovery was most rapid near protection and enforcement areas. The sharing of monitoring results with the community helped to build support for the park management.sharing of monitoring results with the community helped to build support for the park management.
Contact: Peter Mous, [email protected]: Peter Mous, [email protected]
REACTIVE MONITORING AT NELLY BAY HARBOUR, MAGNETIC ISLAND, AUSTRALIA TO MANAGE MARINE CONSTRUCTION ACTIVITIES
The fringing reef at Nelly Bay is highly valued by residents and tourists for diving, fi shing and The fringing reef at Nelly Bay is highly valued by residents and tourists for diving, fi shing and snorkelling. Construction plans for Nelly Bay raised concern that the coral reefs would be damaged. snorkelling. Construction plans for Nelly Bay raised concern that the coral reefs would be damaged. The development within Nelly Bay lasted 2 years and involved the construction of a commercial ferry The development within Nelly Bay lasted 2 years and involved the construction of a commercial ferry terminal, barge ramp, a canal/harbour estate with residential and tourism developments, a public boat terminal, barge ramp, a canal/harbour estate with residential and tourism developments, a public boat ramp and public areas.ramp and public areas.
What was done?What was done?Risks were identifi ed as sedimentation plumes from harbour dewatering and dredging. The monitoring Risks were identifi ed as sedimentation plumes from harbour dewatering and dredging. The monitoring program was designed to alert managers when sediment levels reached ‘unsafe’ levels. This allowed program was designed to alert managers when sediment levels reached ‘unsafe’ levels. This allowed managers to take managers to take action before excessive sediment levels could cause widespread damage to the action before excessive sediment levels could cause widespread damage to the Nelly Bay coral reef. Trigger levels were developed to help managers identify what ‘unsafe’ levels of Nelly Bay coral reef. Trigger levels were developed to help managers identify what ‘unsafe’ levels of sediment were, or when coral health had been affected. When monitoring showed that a trigger level sediment were, or when coral health had been affected. When monitoring showed that a trigger level had been reached, managers either called for more monitoring or shut down the activity causing the had been reached, managers either called for more monitoring or shut down the activity causing the problem until the sediment levels returned to ‘safe’ levels. problem until the sediment levels returned to ‘safe’ levels.
For more information contact Andrew ChinFor more information contact Andrew Chin, , [email protected]@[email protected]@[email protected]@gbrmpa.gov.a or Paul Marshall, or Paul Marshall, [email protected]@gbrmpa.gov.au
Que
stio
ns

8
Cost of equipment and timeThe equipment required to conduct various monitoring methods can range from snorkel gear and an underwater slate to expensive video equipment and boats. It is essential to include the cost of transport to and around the reef. To find out what equipment you will need to monitor your reefs, see Appendix 2, p 107. The time taken to monitor is also an expense. You will need to consider who you can afford to pay to monitor reefs and for how long.
What scale of monitoring program do you want?The program scale is the level of detail at which you want to collect information. This can be:m Broad scale;m Medium scale; orm Fine scale.
These scales are illustrated in Figure 3, p 15.
This is an important question. Monitoring a large area will require more resources than a small area, and so the level of monitoring will have to be considered carefully if resources are limited. Data collected from one site on a reef will not provide enough information about the entire reef; similarly data from one reef will not provide information about the reefs in the region. The sampling effort needs to be spread throughout the area of interest to be able to make general statements and conclusions about the area (Oxley 1997). You may choose to monitor a few select sites in detail and use broad-scale monitoring of the wider area (see manta tow, p 22). Coral reef managers should ask two questions as part of this balancing act to decide which level to use: m Do you want more detail over smaller areas or less detail over a larger area (or can you find more money for
monitoring)? m Will more detail provide more useful information to assist in management?
Also see ‘How many samples should you take’ (p 11). ‘Reactive monitoring at Nelly Bay Harbour, Magnetic Island, Australia to manage marine construction activities’ and ‘Using Reef Check to stimulate community management at Gilutongan, Central Philippines).
What types of reef do you have in the area?The type of reef will affect the type of monitoring method you select due to the accessibility and habitat types.
Accessibility: You may wish to monitor accessible reefs more frequently than less accessible ones. Methods that require frequent site visits, e.g. sedimentation traps (p 96) or coral recruitment plates (p 56) are cheaper to do at accessible sites.
Habitat type: Do you have patch reefs or continuous reefs? Long transects may not be suitable for patch reefs, but quadrats or a stationary fish census can be used (p 86). A continuous reef is better suited to most sampling methods, such as transects, which require tens of metres of area.
What methods should you use? Many methods have been developed to monitor the different reef components. Several major coral reef monitoring programs have refined and integrated protocols and we recommend using the standard methods to develop your program. This will enable comparisons with data collected by other monitoring teams in your region. See page 98 for information on major coral reef monitoring programs.
The first consideration: what type of reef habitat do you want to monitor? If you want to compare monitoring sites, they must be of the same habitat type. Coral reef habitats change with depth and position on the reef e.g. front reef, back reef and lagoonal reefs are distinct habitats (see figure 2). Many scientists select a particular depth at the front reef for their monitoring sites. The front reef is often easier to monitor because it is often more continuous than back reefs, which tend to be patchy. Most coral growth occurs on the front reef. However, front reefs may be difficult to get to due to rough weather, therefore you may select the side or back reef. It is usually necessary
Advantages of research monitoring Limitations of research monitoring
m Accurate and precise data collection;m Data are most reliable;m Collect high detail data, which are used by
scientists to understand trends or processes at a specific site;
m Used for environmental impact assessment
m Expensive. Many governments cannot afford to employ scientists to survey large areas of reef;
m Trained staff are often not available or are employed elsewhere;
m Can survey only small areas at one time.
Que
stio
ns

9
to conduct a broad survey, e.g. manta tow and some ground truth surveys (exploratory dives) to ensure that the selected sites are in a comparable habitat, p 21.
MONITORING LARGE AREAS: GREAT BARRIER REEF MARINE PARK
The Great Barrier Reef (GBR) is the world’s largest series of coral reefs stretching over 2000 km The Great Barrier Reef (GBR) is the world’s largest series of coral reefs stretching over 2000 km with more than 3000 reefs. The challenge was to design a program to monitor the GBR to assist with more than 3000 reefs. The challenge was to design a program to monitor the GBR to assist the management agency, the Great Barrier Reef Marine Park Authority (GBRMPA) assess localised the management agency, the Great Barrier Reef Marine Park Authority (GBRMPA) assess localised changes and develop effective management strategies.changes and develop effective management strategies.
What was done?What was done?The Australian Institute of Marine Science Long-term Monitoring Program was designed to provide The Australian Institute of Marine Science Long-term Monitoring Program was designed to provide both broad and medium scale information on the status of the GBR. Detailed medium scale transect-both broad and medium scale information on the status of the GBR. Detailed medium scale transect-based surveys are done at permanent monitoring sites on 48 reefs to assess the status and long-term based surveys are done at permanent monitoring sites on 48 reefs to assess the status and long-term trends on the coral reefs. Information gathered includes benthic communities: coral cover, species trends on the coral reefs. Information gathered includes benthic communities: coral cover, species richness, incidence and type of disease (p 38); and fi shes, species richness and abundance (p 79). richness, incidence and type of disease (p 38); and fi shes, species richness and abundance (p 79). Broad scale manta tow (p 22) and timed swims (p 31) are done annually at another 50 reefs to provide Broad scale manta tow (p 22) and timed swims (p 31) are done annually at another 50 reefs to provide general trend information on coral cover, COTS and bleaching.general trend information on coral cover, COTS and bleaching.
There are 2 community programs monitoring other sites on the GBR. The ‘Eye on the Reef’ program There are 2 community programs monitoring other sites on the GBR. The ‘Eye on the Reef’ program (p 30) and Reef Check (p 36) provide general, ‘early warning’ information to managers. Reef Check (p 30) and Reef Check (p 36) provide general, ‘early warning’ information to managers. Reef Check teams are supported by the dive industry, which assists with annual surveys to provide low detail, teams are supported by the dive industry, which assists with annual surveys to provide low detail, medium to broad scale information on coral reef health. Eye on the Reef is a GBRMPA/CRC Reef medium to broad scale information on coral reef health. Eye on the Reef is a GBRMPA/CRC Reef program with the Australian Marine Park Tourism Operators (AMPTO), the Queensland Parks and program with the Australian Marine Park Tourism Operators (AMPTO), the Queensland Parks and Wildlife Service (QPWS) and 10 dive operators provide weekly reports on the status and broad scale Wildlife Service (QPWS) and 10 dive operators provide weekly reports on the status and broad scale general descriptions of tourism dive sites. Both programs increase public awareness of coral reef general descriptions of tourism dive sites. Both programs increase public awareness of coral reef issues and involve the public in management of the GBR.issues and involve the public in management of the GBR.
AIMS LTMP contacts: Hugh Sweatman, AIMS LTMP contacts: Hugh Sweatman, [email protected]@[email protected]@[email protected]@aims.gov.a or David Wachenfeld, or David Wachenfeld, [email protected]@[email protected]@[email protected]@gbrmpa.gov.a ; Eye on the Reef contacts: Andrew Chin, ; Eye on the Reef contacts: Andrew Chin, [email protected]@[email protected]@[email protected]@gbrmpa.gov.a or Robin or Robin Aiello, Aiello, [email protected]@[email protected]@[email protected]@iig.com.a ; Reef Check contacts: ; Reef Check contacts: [email protected]@ucla.eduu
Another example of a multi-tier monitoring program is the Florida Keys Marine National Marine Another example of a multi-tier monitoring program is the Florida Keys Marine National Marine Sanctuary Coral Reef Monitoring Program that uses detailed research-level monitoring in combination Sanctuary Coral Reef Monitoring Program that uses detailed research-level monitoring in combination with community programs by trained recreational divers. For further information see:with community programs by trained recreational divers. For further information see:www.fknms.nos.noaa.gov/research_monitoring/zpr98.htmwww.fknms.nos.noaa.gov/research_monitoring/zpr98.htmll
Land
Internal zone
Lagoon withpatch reefs
Reef flat
Reef flat
Islandor Cay
Beach
Front reefor reef slope
Reef crest
Backreef
Figure 2. Cross section through a coral reef showing the major zones.
Que
stio
ns

10
How do you select your sites?The sites you choose should be:m Representative of the area of interest;m Contain the same habitat so that the different sites can be compared through time.
Site selection is a critical step in designing a monitoring program and will depend upon the objectives of your program e.g. if the objective is to determine if fi sh abundance is higher inside an MPA than outside, you should monitor both inside and outside your MPA (for an example, see ‘Using Reef Check to stimulate community management at Gilutongan, Central Philippines’, p 6). This is called an impact study (see ‘Impact studies’, p 13). The actual sites you choose for the surveys should be representative of the area of interest. Therefore, fi sh surveys should be conducted in an area of the MPA that is representative of the whole MPA and similar to the outside area.
To select a site, you may need to consider the following:m The degree of environmental degradation and/or recovery;m The level of management protection, e.g. no-take MPA;m The extent of wave exposure, i.e. can the monitoring team dive at that site under most conditions?m Which sites are representative of the coral reef area you want to monitor?
How do you select which type of monitoring method to use?1. First decide what method family to use, i.e. transects, quadrats or timed swims etc. This decision will depend
upon the scale of your monitoring area, the level of detail at which you want to monitor and the type of reef habitat you want to monitor, e.g. continuous front reef, or patch back reef;
2. Second, decide what method protocol to use, i.e. line intercept or point intercept transects; or visual or photo quadrats. This will depend upon the expertise of your monitoring team, the time you have available for monitoring and the detail and precision of the data you wish to obtain;
3. Third, decide what method size should you use, i.e. transect length or quadrat size. This will depend upon the type of reef habitat you want to monitor, the size of the area of interest that you monitoring area must represent, the size and spatial abundance of the animals and plants you wish to monitor and the level of precision you want from the data collected (precision is also affected by the number of replicates you use see page 11).
Because we cannot measure everything on a coral reef, we must measure a small part. The part of the Because we cannot measure everything on a coral reef, we must measure a small part. The part of the coral reef that is measured is called a coral reef that is measured is called a samplesample. To measure a part of the environment is called . To measure a part of the environment is called samplingsampling. . To repeat sampling through time is called To repeat sampling through time is called monitoringmonitoring. A sample is intended to be . A sample is intended to be representativerepresentative of the of the whole coral reef.whole coral reef.
The The methodmethod is the description of how the information is collected, e.g. line or point intercept transect is the description of how the information is collected, e.g. line or point intercept transect or how to lay the transect. The or how to lay the transect. The protocol protocol is the size and shape of the sampling method e.g. transect is the size and shape of the sampling method e.g. transect length and number, duration of a timed swim or quadrat size.length and number, duration of a timed swim or quadrat size.
Broad-scale Broad-scale methods will use large units that are defi ned by the time taken to swim them, e.g. ‘manta methods will use large units that are defi ned by the time taken to swim them, e.g. ‘manta tow’ (p 22) or ‘timed swim’ (p 31).tow’ (p 22) or ‘timed swim’ (p 31).
Medium-scaleMedium-scale methods may have units that are defi ned by a measured length of reef, e.g. line methods may have units that are defi ned by a measured length of reef, e.g. line transects (p 33) or belt transects (p 64).transects (p 33) or belt transects (p 64).
FineFine-scale-scale methods tend to measure smaller areas in more detail e.g. quadrats (p 41). methods tend to measure smaller areas in more detail e.g. quadrats (p 41).
Que
stio
ns

11
To detect coral reef changes through time or to compare reefs, it is important to use standard methods with standard sample method sizes. Methods of a specifi c and consistent size, i.e. defi ned by space or time, provide quantitative information. On the other hand, qualitative information is collected where there is no control over the sample size.
The sample method size you select will depend upon what you want to measure. An abundant organism can be sampled with a smaller sampling area, whereas rare organisms will need larger sample areas. It is important to realise that a very small sample area may not adequately represent your area of interest. However, a large sample area may be diffi cult to search carefully enough to provide accurate or precise results. The actual size of the habitat being surveyed may also determine the size of the sample method, e.g. patch reefs are not suitable for long transects. For more detailed information on ecological sampling see Kingsford (1988).
How many replicates should you survey?1. How many samples (called replicates) should you make?2. Where should you put your replicates?
The number of replicates needed to provide a representation of the area of interest is dependent upon its scale as well as the magnitude of change you want to be able to detect over time. The magnitude of change you can detect is related to how well your sample represents the coral reef area of interest, or its precision.
Where should you put your replicates?You should select sites that are representative of the coral reef area. Statisticians prefer that all sites are selected randomly, but this is often logistically diffi cult to achieve. In the real world the best method of choosing where to put your sample methods is stratifi ed haphazard selection. This means you fi rst select the reef habitat (reef zone and depth) that you want to monitor, then haphazardly select suitable sample sites within this area. For repeat surveys, you can go back to the same site and haphazardly re-lay the transect in approximately the same area as on the previous visit.
It is also important that replicates do not overlap with each other because the statistics used to analyse your monitoring information rely upon each replicate sample being independent of, or not associated with, the other replicates. Replicates that are not independent are called pseudoreplicates.
Quantitative informationQuantitative information (from ‘quantity’) is when the subject of interest (e.g. coral cover) is (from ‘quantity’) is when the subject of interest (e.g. coral cover) is expressed as a number (e.g. 32% coral cover). Quantitative information is standardised and therefore expressed as a number (e.g. 32% coral cover). Quantitative information is standardised and therefore comparable.comparable.
Qualitative informationQualitative information (from ‘quality’) is a subjective description of the object of interest (e.g. (from ‘quality’) is a subjective description of the object of interest (e.g. medium coral cover) and is diffi cult to use for comparative studies because one observer’s idea of medium coral cover) and is diffi cult to use for comparative studies because one observer’s idea of ‘medium’ coral cover may be very different to that of another observer. Qualitative information can ‘medium’ coral cover may be very different to that of another observer. Qualitative information can be useful to support quantitative information e.g. photographs of reef change can support trends be useful to support quantitative information e.g. photographs of reef change can support trends illustrated on a graph. The general public will relate better to photographs than graphs.illustrated on a graph. The general public will relate better to photographs than graphs.
Coral reefs are variable in both space and time. To understand the extent of this variability, and Coral reefs are variable in both space and time. To understand the extent of this variability, and therefore collect information that is representative of the coral reef area of interest, you need to take therefore collect information that is representative of the coral reef area of interest, you need to take more than one sample at a survey site. Additional samples are called more than one sample at a survey site. Additional samples are called replicates. replicates. Use of replicates is Use of replicates is calledcalled replication. replication.
Large-scaleLarge-scale studies involve sampling across large areas, which are widely spaced. Within each area, studies involve sampling across large areas, which are widely spaced. Within each area, replicate samples should be taken and the level of variation should be established for each area before replicate samples should be taken and the level of variation should be established for each area before trying to compare with other areas. This is called a trying to compare with other areas. This is called a nestednested (or hierarchical) sampling design where (or hierarchical) sampling design where successively smaller spatial (or temporal) scales e.g. one reef, are nested within the scale above e.g. successively smaller spatial (or temporal) scales e.g. one reef, are nested within the scale above e.g. group of coral reefs (Oxley 1997).group of coral reefs (Oxley 1997).
PrecisionPrecision is important if you want to be able to detect environmental change in space and time. is important if you want to be able to detect environmental change in space and time. Collecting data from enough samples is important to ensure the Collecting data from enough samples is important to ensure the precisionprecision (smallest standard error (smallest standard error — SE) of the surveys because this will tell you if your sample is representative of the local area.— SE) of the surveys because this will tell you if your sample is representative of the local area.
Que
stio
ns

12
Permanent versus haphazard sampling unitsTo measure change over time, you can either measure the same part of reef each time, called fi xed or permanent survey sites, or you can use the stratifi ed haphazard selection method each time you survey. When you re-survey permanent sites, differences in the results e.g. percent coral cover, between the two survey periods can be attributed to environmental change. When you re-survey random or haphazard sites, only the change beyond the variance in your sample set can be interpreted as environmental change. There are advantages and disadvantages with using either of these methods of survey site selection so you have to consider which method to use. Note that there will always be some human error when monitoring coral reefs. This means that some of the change in your results from one year to the next will be caused by human error rather than environmental change. See ‘Quality control and training’ below to fi nd out how to minimise this.
Permanent or fi xed survey sitesPermanent sites are generally recommended for long-term monitoring because they offer the greatest amount of information, consistency, repeatability and reliability. Managers usually prefer permanent sites because they are more comfortable with comparisons of a fi xed sample of the environment rather than relying upon the statistics of random sampling, which are more diffi cult to understand. Permanent sites should always be selected using a random or stratifi ed haphazard selection process to ensure they are representative.
How do you mark permanent sites?Permanent sites must be marked so that the transect tapes, quadrats or photographic equipment can be placed as close as possible to the same position on each visit. Stainless steel stakes or reinforcing rods or star pickets should be hammered into the reef at 5 to 10 m intervals along a transect line (p 33) or to mark out the corners of a permanent quadrat (p 43). Observers can wrap the tape measure around these stakes to ensure that the transect is in the same position.
How do you fi nd permanent sites?Maps, global positioning systems (GPS) and surface or subsurface-buoys can help you to fi nd these sites again.
1. Maps are rarely useful on their own and must include triangulated references (line of sight objects) both above and below the water;
2. A hand-held GPS is very useful to re-locate permanent sites and is accurate within a few tens of metres, however, they are expensive. It is essential that you record which GPS datum system you have used, e.g. WGS 84, because you will need to use the same datum system to fi nd your monitoring location again;
3. Surface or subsurface buoys should be used to mark the start of a series of transects or quadrats. Sub-surface buoys are more appropriate than surface buoys because they are less likely to be stolen or wrenched off the reef by rough weather. You must ensure they are well below the surface so that they don’t get caught in boat propellers. If you don’t have access to a hand-held GPS, surface buoys may be necessary.
We recommend you use all 3 methods to fi nd your sites. For more information see www.aims.gov.au
How often should you monitor?There is a trade-off between the frequency of monitoring and the number of locations to monitor, e.g. a large monitoring effort at a small number of sites in a large reef area may give a biased picture of the overall reef health. To represent a large area, several monitoring locations will be necessary. To be useful, monitoring surveys should be carried out every year or at least every second year. However, more frequent monitoring may be required to answer some management questions, such as ‘what is the abundance of highly mobile fi sh?’ and so quarterly surveys at one location may be better (Hodgson 2003).
SHOULD I DO A PILOT STUDY?
Pilot studies can help you decide what Pilot studies can help you decide what sizesize of sample method to use (e.g. length of transect or quadrat of sample method to use (e.g. length of transect or quadrat size) and size) and how manyhow many replicates are needed. The monitoring methods described in ‘section three’ of replicates are needed. The monitoring methods described in ‘section three’ of how manyhow many replicates are needed. The monitoring methods described in ‘section three’ of how manyhow manythis book recommend the size and number of replicates. For this book recommend the size and number of replicates. For researchresearch monitoring where you want to monitoring where you want to detect fi ne-scale environmental changes, you will need to conduct a pilot study. However, if you wish to detect fi ne-scale environmental changes, you will need to conduct a pilot study. However, if you wish to reduce the number of replicates suggested by a standard monitoring method (maybe to save costs) we reduce the number of replicates suggested by a standard monitoring method (maybe to save costs) we recommend you conduct a pilot study to determine the resolution of environmental changes you will be recommend you conduct a pilot study to determine the resolution of environmental changes you will be able to detect. For more information on pilot studies see Appendix p 112.able to detect. For more information on pilot studies see Appendix p 112.
Que
stio
ns

13
Impact studiesHuman impacts on coral reefs must be distinguished from background effects that are often extremely variable in space and time. This means we need to monitor the resources many times and at many sites (with replicate samples taken at each site) both before and after an impact to control spatial variability. The Beyond Before, After, Control Impact (Beyond BACI) design should be used for impact studies. This design monitors both an impact and at least 2 control sites at many times before and after an impact. An impact is indicated by a greater environmental change at the impact site compared to the controls.
For further information on Beyond BACI designs see Underwood (1994); Underwood (1995); Russ (1996); Russ and Alcala (1996); Kaly and Jones (1997); Russ (2002).
Quality control and trainingHuman error in monitoring will reduce the precision of the information collected. Although human error can never be eliminated entirely, it can be reduced through regular training and testing, and knowledge reviews of team members. It is essential that initial training, ongoing training, and a review of skills, are built into the cost of the program. Training must include both how to collect precise data on surveys as well as use of equipment, e.g. how to use a GPS.
Survey training and review sessions should include comparisons with known standards e.g. photographic or video reference material or collected specimens. Training will generally involve fi eld trips dedicated to training and laboratory studies. For example, fi sh size estimation training can be done by asking observers to estimate the size of fi sh models underwater (English et al. 1997). This training should be repeated at 6 monthly intervals. Fish abundance and identifi cation training must be done by observers together in the fi eld.
The training the team requires depends upon their previous experience and the monitoring level selected. Examples on how to train observers are provided in many of the major program manuals (See ‘Section four: monitoring programs’, p 98). GCRMN/Reef Check provide regional training workshops in recommended methods. For more information see www.gcrmn.org/ or www.reefcheck.org.
PERMANENT SITES
Advantages:Advantages:mm Once set up, repeat monitoring is easy; Once set up, repeat monitoring is easy;mm Interpreting results from fi xed transects Interpreting results from fi xed transects
is much easier for the general public and is much easier for the general public and resource managers to comprehend;resource managers to comprehend;
mm More precise information is produced than More precise information is produced than for random sites because you don’t have to for random sites because you don’t have to account for spatial variability.account for spatial variability.
Limitations:Limitations:mm Time consuming and can be expensive to Time consuming and can be expensive to
set up;set up;mm Can be diffi cult to fi nd, which can waste Can be diffi cult to fi nd, which can waste
survey time;survey time;If not marked properly they are no better than random If not marked properly they are no better than random transects.transects.
NON-PERMANENT (STRATIFIED HAPHAZARD) SITES
Advantages:Advantages:mm Quick and easy to choose the sample site Quick and easy to choose the sample site
if you are familiar with the habitat in the if you are familiar with the habitat in the area, e.g. from maps made after previous area, e.g. from maps made after previous surveys.surveys.
Limitations:Limitations:mm Cannot compare results from one study Cannot compare results from one study
to those at another location if different to those at another location if different habitats (e.g. depth) are surveyed.habitats (e.g. depth) are surveyed.
Que
stio
ns

14
Data handling and communicating resultsAfter monitoring, somebody must record the data as soon as possible (e.g. entered into a spreadsheet), analyse them, interpret the analysis and report the findings.
Data entryData should be recorded in a format for easy analysis as well as stored for comparisons with data collected in later years. It is essential that data be organised in a way, which makes them easily accessible for future reference. These data should be recorded in columns as in the example below.
DateObserver name
Site name
Depth Latitude LongitudeReplicate No.
No. of grouper
No. of snapper
etc
12.08.04 Sally SmithPink Reef
5 m19.48.67 S
149.03.83 E 1 5 2
Data storageA database is used to store data. A computer spreadsheet is the ideal way to store your data if you have access to a computer and the relevant software. It is essential to use systematic methods to store and retrieve data using computer-based management systems. All data should be stored in two safe places immediately after collection to avoid loss. Microsoft Excel is commonly used to store information and can also be used to make graphs and to do basic statistical analysis. For more advanced databases, Microsoft Access is recommended.
Data analysisAnalysis of data allows interpretation of the changes that are occurring on the coral reef and may help answer questions e.g. are increasing nutrient levels correlated with decreases in coral cover.
There are many ways to analyse data. It is important that you decide what level of analysis you can achieve before starting to monitor. Analysis of data essentially means calculating the numbers of each of your variables counted during surveys. For example, the average percentage cover of hard coral or the average number of target fish from replicate samples at a particular site. The average grouper count on 4 replicate transects is the total count divided by 4.
Graphs or bar charts are often needed to report the analysis; these can be hand drawn or made on Excel. For more advanced statistical analysis, we recommend SPS or SPSS software and a talk with a scientist with statistical experience in analysis. Some programs, such as Reef Check, provide Excel data sheets to enter data. Once data are entered, basic statistics (e.g. averages and standard deviations) are automatically calculated. So all you have to do is make a graph! In addition, ReefBase and the GCRMN are designing a data entry and analysis package based on Access software to help managers analyse the data they collect (see www.reefbase.org). For more information on statistical analyses see English et al., (1997). For advanced information on experimental design and statistical power see Cohen (1988); Kingsford (1988); Underwood (1994); Zar (1999).
Data reportingAfter monitoring has been completed, it is important to present the results in a format that is most useful to key stakeholders. The actual monitoring data and analyses on paper are more appropriate for scientific audiences, but open meetings may be more appropriate for community groups who may communicate more by talking than reading. It is essential to involve the community leaders, as they are the ones that most people listen to (e.g. traditional owners, chiefs, religious leaders), and who can interpret the results of monitoring and explain the value of management actions to the broader community. The steps in this process should include identifying:m The target audience;m The key messages you want to get across and when; andm The communication products that will best suit your needs (many products may be required for different
audiences).
For example, scientists read scientific papers and reports; resource managers mostly read status report; and the general public attend meetings, use radio and television, read newspapers, read websites, look at posters etc.
The need to involve the publicMonitoring is a powerful tool to raise awareness of the problems facing coral reefs and the need for management among local communities, tourists and management staff. To ensure that management staff understand the resources they are managing, it is important that all managers and staff participate in some monitoring, whenever possible. Therefore, we recommend that all coral reef management staff undertake basic one day training in
Que
stio
ns

15
monitoring, e.g. Reef Check (p 100). This ensures that managers understand monitoring methods and the data they produce, and keeps them in touch with user communities.
Involving community volunteers and tourists in monitoring not only provides basic scientific data over a wider area, but also ensures that the wider community understands the need for coral reef management. It also creates a sense of awareness and stewardship for the resource amongst user groups. This is particularly true for repeat visitors who are usually interested in learning about the reef as well as in participating in its management. Volunteer monitoring programs are usually low cost, more frequent and cover a larger scale, and the data may complement research programs. They can also provide comparison data from other areas the volunteers and tourists have visited (‘community monitoring’, p 5).
Reef slope
Transect Coral recruitmenttiles
Quadrat
TransectsMPABoundary
Transects
Medium Scale Monitoring
Fine ScaleMonitoring
Broad Scale Monitoring Manta tow
Reef slope
Reef flat
11 2 3 4 5
2 3 4 5
Que
stio
nsFigure 3. An illustration of the three scales of monitoring: broad-scale covering large areas at lower resolution, e.g.
with manta tow; medium-scale for higher resolution at medium scales e.g. line transects; and fine-scale for gathering high resolution data at small scales.

16
3: GENERAL MONITORING METHODS
The purpose of this section is to introduce you to the different method families as a guide you on when to use them. The different method families can be classifi ed as follows:m Manta tow;m Timed swim;m Transects;m Quadrats.
Manta tow and timed swimsThese are the best methods for obtaining a broad scale, general description of a reef site and involve either towing a diver behind a boat around a reef or a diver swimming for a set time or distance (p 22 for the protocols).
TransectsTransects provide medium scale information. They are lines put on the reef fl oor where corals and other objects are counted underneath. Lines can be tape measures, ropes or chains of different lengths with measurements made under fi xed points or where something happens e.g. counting chain links or where benthic species change.
Transects can vary in length. Common lengths used are 10 m, 20 m, 30 m and 50 m. The length you should use depends upon the abundance and spatial distribution of the variable to be monitored as well as the spatial heterogeneity of the site. Spatial heterogeneity is where the types of animals and plants found on your reef vary in space. If spatial heterogeneity is high (e.g. patch reefs or spur and groove habitat), a long transect (e.g. 50 m) will encompass too much of this spatial variation (e.g. coral, sand and rock) and the power of your surveys to detect change will be reduced (Brown et al. 2000).
Transects are generally positioned parallel to the reef crest along a constant depth contour. A transect laid perpendicular to shore may be appropriate if you want to include different reef zones (or depths) in the same transects. Surveying a range of zones may be useful to ground truth remote data on habitat types (see ‘Mapping and site selection’ p 21).
There are 4 ways to survey transects:1. Line transects (includes line intercept transects and chain transects under a line);2. Point intercept transects which measure things at specifi c intervals either below the line or below and to the
side of the transect tape; 3. Belt transects measure things in a belt beside the transect; and4. Chain intercept transects.
1. Line intercept transectMeasurements on line transects are taken along the entire length of the line. Commonly used line transects are called ‘line intercept transects’ (LIT), which focus on the horizontal plane of the reef (LIT; p 33), and ‘chain intercept transects’ (CIT), which measure the benthic cover in 3-dimensional terms as the chain follows the contour of the reef (CIT; p 54). CIT enable the collection of information on reef rugosity (structural complexity) and are often used with LIT. The rugosity can provide information on the ‘spatial index’ of the reef, which is the ratio of reef surface contour distance to linear distance. As part of a long-term monitoring program, the spatial index provides a way to quantify changes in the topographical complexity of the reef.
Advantages of transects:Advantages of transects:mm Easy to use; Easy to use;mm Tape measures are easy to carry in the water. Tape measures are easy to carry in the water.
Limitations of transects:Limitations of transects:mm Transects are not suitable where hard corals or target invertebrates are widely spaced and Transects are not suitable where hard corals or target invertebrates are widely spaced and
small. Manta tow is better for widely spaced organisms (p 22);small. Manta tow is better for widely spaced organisms (p 22);
Transects are not suitable for patchy reefs because they require suffi cient continuous reef over which Transects are not suitable for patchy reefs because they require suffi cient continuous reef over which to lay the transect replicates. Quadrats or stationary fi sh counts (p 86) are better suited for patchy reef to lay the transect replicates. Quadrats or stationary fi sh counts (p 86) are better suited for patchy reef habitats. habitats.
Mon
itorin
g

17
2. Point intercept transectPoint intercept transects (PIT) measure objects at specific intervals either below the transect tape, or below and to the side of the transect tape. With sufficient points they can provide comparable information to LIT.
For discussions on point and line intercept techniques see: Carleton and Done (1995); Vogt et al. (1997); Aronson (2001); Segal and Castro (2001).
3. Belt transectsBelt transects are the same as line transects but wider and are often used for surveying specific impacts to the benthos, such as bleaching or disease, or counting invertebrates (p 64) and fishes (p 67). The appropriate width depends upon what you are measuring. For small species or fish recruits, narrow belt transects (e.g. 2 m wide) are often used (see English et al. fish recruits belt transects p 84), for impacts such as coral disease and Drupella snails, 4 m width is used (see invertebrate belt transects used by AIMS p 65). For other key macro-invertebrates wider transects may be used, e.g. 5 m (see the invertebrate belt transect used by Reef Check p 64).
4. Chain transectsBefore fibreglass tapes were available, chains were commonly used to mark transects. Chains can be difficult as only short lengths can be carried underwater by divers. This means that longer transects must be made up of several lengths of chain placed in succession.
Another variation is timed swims where the ‘transect’ length is measured by the swim time.
Do transects cause damage to the reef? Damage to the reef can be avoided if transects are laid carefully. However, it is difficult to avoid damaging the reefs when using chain transects.
Achievable precision for transects: High (but not as high as permanent quadrats).
Generic equipment for transects:How do you mark out transects?m Tape measures (waterproof fibreglass in a spool with a winding handle);m Rope (with coloured markers or knots to indicate distance);m Chain – plastic (chain links of known length used to calculate distance; 1 cm links are easiest).
We recommend using a tape measure as these are the most widely used to mark transects and can be used to measure distance and size. We recommend placing a hook or elastic loop at the end of the tape measure to attach it to the substrate. To learn how to mark permanent transects, see the section on ‘permanent transects’ (p 33).
How do you measure the belt transect width?Transect width can be measured or estimated, and there are several methods to measure the width: m PVC pole or T-bar;m Body length estimation;m Tape measure (or equivalent).
1. The PVC pole or T-bar should be half the width of the path. Wide poles can be difficult to use underwater. T-bars for narrow transects (e.g. 2 m) are commonly used;
2. The stretched distance from your fin-tip to your hand is a useful body length measure to check your estimations of transect width throughout the survey;
4. Tape measures can be laid out at the start of each replicate to provide a reference for belt estimations. Another way to test your ability to estimate belt width is by fixing on a point you think is the required width and measuring that distance.
QuadratsA quadrat is a square or rectangular sampling unit in which organisms are counted or measured. The appropriate quadrat size is dependent upon the size and spatial abundance of the organism being counted. Generic quadrat sizes that are used include:m 0.5-1m2 or larger quadrats to assess species diversity. This is the most common size for general benthic
community surveys (see ‘visual quadrat’ by COI p 41);m 25 cm by 25 cm to measure coral recruits and other small organisms like algae species, Diadema or Drupella
(see the AGRRA coral condition, algal and Diadema methods p 58).
Mon
itorin
g

18
There are 3 ways to survey quadrats:1. Visual estimation;2. Visual point sampling (grid quadrats);3. Photo quadrats where images are digitised or point sampled to determine percent cover.
Quadrats provide precise information for fi ne scale, species-specifi c questions. Permanent quadrats are useful for observing specifi c coral colonies over time.
Do quadrats cause damage to the reef?m Permanent quadrats – Damage to the reef can be avoided if quadrats are set carefully;m Random quadrats - Some potential carrying these underwater; placing them on fragile corals.
Types of data obtained from quadrats:m Estimations of percent cover (visual quadrats);m Precise measure of percentage cover (point intercept methods either done manually in the fi eld or from
photographs);m Frequency of occurrence (calculated from the number of quadrats in which a species occurs);m Species diversity, relative abundance, density, size and interactions between corals.
Advantages of quadrats:Advantages of quadrats:mm Quadrats can be made with inexpensive equipment; Quadrats can be made with inexpensive equipment;mm Useful for fi ne-scale monitoring. Useful for fi ne-scale monitoring.
Percent cover estimationsPercent cover estimationsRare or uncommon species are less frequently overlooked in comparison to the point intersect method.Rare or uncommon species are less frequently overlooked in comparison to the point intersect method.
Point intercept in quadratsPoint intercept in quadratsReasonably accurate measures of percent cover, species diversity, relative abundance, density and size Reasonably accurate measures of percent cover, species diversity, relative abundance, density and size can be obtained.can be obtained.
Photo-quadratsPhoto-quadratsPhoto-quadrats provide a permanent record of the benthic communities, can be analysed using random Photo-quadrats provide a permanent record of the benthic communities, can be analysed using random or set points (p 43) or the images can be digitised to provide very accurate percentage cover estimates. or set points (p 43) or the images can be digitised to provide very accurate percentage cover estimates. Digitised images can be used to compare fi ne-scale changes in benthic communities through time.Digitised images can be used to compare fi ne-scale changes in benthic communities through time.
Limitations of quadrats:Limitations of quadrats:mm Quadrats provide data from the projected surface area only and cannot be used to measure Quadrats provide data from the projected surface area only and cannot be used to measure
rugosity. This is a problem on complex reef surfaces. Plate-shaped corals tend to be over-rugosity. This is a problem on complex reef surfaces. Plate-shaped corals tend to be over-represented relative to columnar shaped corals (linear transects are more appropriate in these represented relative to columnar shaped corals (linear transects are more appropriate in these situations);situations);
mm Diffi cult to use in areas dominated by fragile branching corals. Diffi cult to use in areas dominated by fragile branching corals.
Percent cover estimations:Percent cover estimations:mm Estimations are the least precise method to measure percent cover or abundance because of Estimations are the least precise method to measure percent cover or abundance because of
observer bias;observer bias;mm Time-intensive, which limits the number of replicate quadrats that can be searched on a dive. Time-intensive, which limits the number of replicate quadrats that can be searched on a dive.
Point intercept in quadrats:Point intercept in quadrats:mm Rare and uncommon species are frequently overlooked.Rare and uncommon species are frequently overlooked.
Photo-quadrats:Photo-quadrats:mm Digitising of photographs from photo-quadrats is time consuming and requires access to Digitising of photographs from photo-quadrats is time consuming and requires access to
computers and specifi c software. Comparisons of digitised images are also time-consuming;computers and specifi c software. Comparisons of digitised images are also time-consuming;
mm The use of random dots is also time consuming but less so than digitising. The use of random dots is also time consuming but less so than digitising.
Mon
itorin
g

19
Achievable precision for quadrats:m Visual estimations provide reasonable precision if done by the same person each time or if observers are
trained together;m Point intercept is more precise than visual estimations.
Generic equipment for quadratsQuadrats can be made from a variety of materials, such as iron re-bar, stainless steel or PVC pipes. PVC is good for larger quadrats as they are easier to handle but it is important to drill holes in the pipe to avoid buoyancy problems. When used on relatively fl at substrates, it is possible to create a grid on the quadrat using nylon string to use for point intercept methods. It is useful to put similar grids on the top and bottom of the quadrat frame to avoid parallax error and remove bias. Observers should line up the grids to ensure they are looking directly down at the substrate (Hallacher and Tissot 1999). For irregular surfaces, grid positions can be estimated from painted reference marks at known distances (e.g. 10 cm) along the quadrat frame. Collapsible quadrats are useful to make entry into the water easier. References for quadrats: Rogers et al. 1994; English et al. 1997; Hallacher and Tissot 1999.
Photography and video monitoringThe use of digital equipment in coral reef monitoring has become more popular recently. These methods can greatly reduce fi eld expense and time because they require less time under water compared to visual methods, and they can be used by experienced divers who may not be scientists.
For information on how to attach still cameras to avoid movement, or to ensure the cameras are in the same position on repeated surveys, see Rogers et al. (1994); English et al. (1997).
How do you analyse photographs or video frames?m Dot Grid – this involves placing random or sequenced dots over the photograph or frame. The benthos
beneath is identifi ed (see ‘point intercept transects’ p 36); m Digitising – this involves manually drawing the different benthic items on a digital image with digitising
software. The software can be used to calculate very precise percentage cover. Although this is the most accurate method, the equipment required is expensive, expertise is necessary and it is the most time-consuming method.
When is videography better than photography?Video footage of the general reef area can provide useful qualitative information. For quantitative studies, videos are more appropriate for ecological monitoring of a large area, e.g. using belt transects. The distance the video is held from the coral reef benthos determines the width of the belt. Reproducing the exact path, speed and distance from the substrate for repeated sampling of a video transect is diffi cult. Lasers positioned on the video underwater housing to cross at a fi xed distance from the substrate can help observers to maintain a constant distance but this is expensive, and therefore impractical in most situations (see NOWRAMP http://hawaiianatolls.org/research/NOWRAMP2002/features/rea.php).
The camera, underwater housing and computer software analysis equipment are expensive to buy The camera, underwater housing and computer software analysis equipment are expensive to buy and maintain. We recommend that photography and video methods only be used for research level and maintain. We recommend that photography and video methods only be used for research level monitoring. See p 20 for advantages and limitations of these methods.monitoring. See p 20 for advantages and limitations of these methods.
Mon
itorin
g

20
ADVANTAGES AND LIMITATIONS OF VISUAL COUNTS AND PHOTOGRAPHY/VIDEO
Underwater visual countsUnderwater visual countsAdvantages:Advantages:mm Data are ready to be analysed immediately following the survey. Data are ready to be analysed immediately following the survey.
Limitations:Limitations:mm More time spent underwater. More time spent underwater.
Digital/video surveysDigital/video surveysAdvantages:Advantages:mm Observers need not be trained scientists, only experienced divers; Observers need not be trained scientists, only experienced divers;mm Less time is spent in the fi eld, which reduces the cost of fi eld work; Less time is spent in the fi eld, which reduces the cost of fi eld work;mm Provides a permanent record; Provides a permanent record;mm Footage can be analysed to provide quantitative information as well as provide a visual image of Footage can be analysed to provide quantitative information as well as provide a visual image of
data. Visual images can be more powerful than statistics and certainly a useful combination to data. Visual images can be more powerful than statistics and certainly a useful combination to demonstrate reef change to non scientists;demonstrate reef change to non scientists;
mm Relatively easy to use; Relatively easy to use;mm It takes up to 4 hours underwater to collect data from a 20 m chain transect, or 2-5 minutes to It takes up to 4 hours underwater to collect data from a 20 m chain transect, or 2-5 minutes to
collect the video images.collect the video images.
Limitations:Limitations:mm Photographs or video frames must be analysed using digital equipment, which is expensive to Photographs or video frames must be analysed using digital equipment, which is expensive to
buy and maintain. This often makes use of photography or video unsuitable for programs with buy and maintain. This often makes use of photography or video unsuitable for programs with limited budgets;limited budgets;
mm Requires a trained team of people in the laboratory to analyse images (otherwise the images Requires a trained team of people in the laboratory to analyse images (otherwise the images remain in fi ling cabinets and are never analysed);remain in fi ling cabinets and are never analysed);
mm Organisms under coral plates or rock ledges are not visible; Organisms under coral plates or rock ledges are not visible;mm Field observations are necessary to distinguish some species. Small organisms such as coral Field observations are necessary to distinguish some species. Small organisms such as coral
recruits and macro algae cannot be distinguished;recruits and macro algae cannot be distinguished;mm It is diffi cult to obtain quantitative information from photographs where soft corals are It is diffi cult to obtain quantitative information from photographs where soft corals are
abundant because they overshadow other organisms;abundant because they overshadow other organisms;mm Photographs or videos provide a 2-Dimensional view of the reef, therefore, these methods Photographs or videos provide a 2-Dimensional view of the reef, therefore, these methods
are not suitable to estimate spatial relief. Although stereo-photography will provide 3-D are not suitable to estimate spatial relief. Although stereo-photography will provide 3-D photographs it is technically more complex and requires sophisticated analytical systems;photographs it is technically more complex and requires sophisticated analytical systems;
mm To accurately detect small changes within a small area, you must photograph the area from To accurately detect small changes within a small area, you must photograph the area from exactlyexactly the same spot each time. Shifts in coral heads or rubble due to storms or bio-erosion can the same spot each time. Shifts in coral heads or rubble due to storms or bio-erosion can make this almost impossible. This problem can be minimised by use of monopod frames (Rogers make this almost impossible. This problem can be minimised by use of monopod frames (Rogers et al.et al. 1994); 1994);
mm Corals may be damaged if you place frames over them, especially in topographically complex Corals may be damaged if you place frames over them, especially in topographically complex areas;areas;
mm Photo coverage of large areas is problematic. If a photo is taken from a long distance, the Photo coverage of large areas is problematic. If a photo is taken from a long distance, the resolution and water clarity may not be suffi cient to identify organisms. An alternative is to resolution and water clarity may not be suffi cient to identify organisms. An alternative is to take a series of overlapping photos and create a photo-mosaic. Under optimal conditions, it is take a series of overlapping photos and create a photo-mosaic. Under optimal conditions, it is possible to make a repeatable and accurate mosaic.possible to make a repeatable and accurate mosaic.
Mon
itorin
g

21
4: MAPPING AND SITE SELECTION
Mapping coral reef areas is the essential first step to management and can be done with a range of techniques. Habitat maps can be made using maps of the area, local knowledge, and manta tows for broad scale surveys, or snorkel or scuba transects for medium scale surveys to confirm the location of major habitat types.
If considerable scientific and financial resources are available, you can map the reefs using satellite imagery and/or aerial photographs and GIS technology (to prepare spatially referenced images showing the location and size of major habitat types). This process involves obtaining the images of the area, interpreting them to identify where major habitats appear to occur (between coral reef and other tropical coastal habitats such as seagrass beds), and checking these predictions (ground-truthing) using local knowledge and transects or manta tow. The major habitat types can be located on the images using GIS technology, however, remote techniques should always be used in combination with field survey techniques to ‘ground truth’ the data.
The most cost-effective satellite sensors for habitat mapping are Landsat TM for areas greater than 60 km in any direction and SPOT XS for areas less than 60 km in any direction. Colour aerial photography can resolve slightly more detailed ecological information on reef habitats but, for general purpose mapping, satellite imagery is more effective because it has slightly more accuracy, is cheaper and uses less staff time. Low altitude, infra-red aerial photography can be used to estimate live-coral cover over shallow (<1 m deep) reef flats, however, this is only appropriate for small areas as the low altitude restricts the area covered in each photograph.
The most accurate, but expensive, means of making detailed reef habitat maps is use of airborne multi-spectral instruments such as CASI (Compact Airborne Spectrographic Imager). In the Caribbean, CASI was used to map assemblages of benthic species and substrata with an accuracy of >80% (Green et al. 2000).
For more information on how remote sensing can help coral reef monitoring and management, see Green et al. (2000) at: http://www.unesco.org/csi/pub/source/rs.htm. To obtain detailed maps of your coral reef area go to www.ReefBase.org. The next major step after mapping is site selection for monitoring. We describe two broad-scale ways of selecting sites: towing a snorkel or scuba diver behind a boat e.g. manta tow; and random or timed swims, either by a snorkel or scuba diver.
Which mapping and site selection method should you choose?
Broad scale Choose this method for mapping, site selection and to cover a large area quickly. Page
Random swimUseful to determine site suitability but limited to the areas surveyed; large areas of reef are not covered; greater depths can be examined if scuba used.
26
Manta tow or video towed diver
Useful to determine site suitability; can cover large areas quickly; limited to shallow depths if done on snorkel; scuba can be used for deep reefs.
2224
Map
ping

22
MANTA TOW
Programs that use this method:m Australian Institute of Marine Science Long-term Monitoring Program (AIMS LTMP);m English et al. is the GCRMN recommended method.
Method description:This involves towing a snorkeller behind a boat at a constant speed with regular stops to record data (e.g. every 2 minutes). This is the best method to obtain a general description of large reef areas or measures of broad changes in abundance and distribution of organisms and large-scale disturbance (cyclones, COTS, bleaching). This method is good for variables seen over long distances and for site selection. Information obtained:For site selection, the diver can only determine where there is continuous reef, and can provide an estimate of hard coral cover (collected as a % hard coral cover); see figure below.
Manta tow can be used to monitor changes in coral cover, determine abundance of impacts, such as bleaching and disease, count giant clams or COTS. Observers must be trained to estimate these abundance categories to ensure that estimations are consistent among observers.
Manta tow can also provide broad scale information on benthic communities especially specific impacts, such as bleaching or destructive fishing practices; and key macro-invertebrates, such as COTS, Diadema or giant clams. Usually 50-60 tows provide sufficient power to detect a 20% change in COTS abundance. Manta tow tends to underestimate abundance, but data can easily be calibrated using scuba surveys to produce more accurate results (see ‘belt transects’ used by the AIMS LTMP). Scuba benthic monitoring and manta tow techniques should ideally be combined. To obtain broad data on benthic communities you can assess the following parameters:m Percent hard and soft coral;m Percent dead coral, rubble and sand;
Equipment required:m 17 m long, 10 mm diameter towing rope; m Rope harness to attach to the rear of the boat;m Mantaboard with fitted harness and attached pencil;m Aerial map of the reef to be surveyed;m Marker buoy (to mark where you stopped if the reef survey is not done at one time);m Waterproof watch for timing each survey. It is useful if this has a countdown function.
Map
ping
Figure 4. Visual estimation categories for percent coral cover from Dahl (1981) in English et al. (1997).

23
Field personnel:m 1 boat driver/surface watch who is trained to maintain the boat at a constant speed;m 2 trained observers (boat drivers and observers can be interchangeable).
Lab personnel:m Data entry, analysis, interpretation and reporting.
General procedures:m Divide the whole reef survey into 2 minute surveys.
At the end of each tow, stop the boat to allow the observer to record the data on the data sheet on the manta board. The boat driver marks the tow number and position of the boat on the aerial photograph. The process is repeated when the observer signals ‘go’ until the whole reef perimeter or a long length is surveyed;
m Tow path is parallel to the reef crest over a 5-10 m depth so the maximum amount of slope is visible;
m Tow speed is a constant 3-5 km per hour (1.5 knots). Factors such as currents and sea conditions may require a change in tow speed;
m The observer scans a width of 10-12 m depending upon visibility, reef gradient, distance from the bottom and the distribution and density of the organisms being counted;
m Survey direction is determined by factors such as wind, currents and the angle of the sun. The survey direction should be standardised to avoid the need to correct data for re-surveys.
Advantages:m A large area is covered in a short time, which reduces the chance of overlooking population changes or
occasional disturbances (e.g. dynamite fi shing, COTS, bleaching, disease and storm damage);m Easy to use following minimal fi eld training;m Cheap equipment with mantaboards easily manufactured locally;m Suitable for remote locations with minimum support (can be done on snorkel);m Large distances covered with minimal observer fatigue;m Relatively accurate (when calibrated with a scuba search) and a cost effective way to determine the
abundance of non-cryptic COTS and corals over large areas in clear water;m Excellent for an overview of the site and assessing the type of reef and the resources.
Limitations:m Boat driver controls the tow route, so inappropriate sections e.g. sand or deep reef slopes, may be covered;m Cryptic animals are easily overlooked e.g. juvenile COTS, or COTS underneath plate corals, small giant clams
(Tridacna); therefore real abundances are underestimated. Results should be calibrated with medium scale surveys e.g. AIMS scuba search, p 50;
m Includes few variables because the observer must remember all observations during each 2 minute tow;m Can survey shallow reef only, especially in poor visibility;m Precision is limited by the diffi culty of visually assessing the dominant reef organisms;m Can only measure coral cover in large categories e.g. 0-10%, 11-30%, 31-50%, 51-75% and 76-100%m Care is needed in turbid environments where there may be sharks or other potentially vicious fi sh!
Training required:m Boat driving at a constant speed;m Minimal identifi cation, skills required;m Abundance estimates; these should be calibrated among observers
Contact: Hugh Sweatman, [email protected]
Reference: English et al. (1997); Bass and Miller (1998); www.aims.gov.au/pages/research/reef-monitoring/ltm/mon-sop1/mon-sop1-10.html and www.oneocean.org/download/_index.html; Uychiaoco et al. (2001).
Parameters that can be surveyed Parameters that can be surveyed using this method:using this method:
✓ Benthic communities Benthic communities ✓ Key macro-invertebrates Key macro-invertebrates
Monitoring levelMonitoring level::✓ ResearchResearch✓ ManagementManagement✓ CommunityCommunity
Scale:Scale:✓ BroadBroad
Level of detailLevel of detail::✓ Semi-quantitative Semi-quantitative
Causes damage to the reefCauses damage to the reef??✓ NoNo
Achievable precisionAchievable precision::✓ Low Low
Map
ping

24
VIDEO TOWED DIVER (VIDEO MANTA TOW)
Programs that use this method:m NOAA Fisheries Pacifi c Islands Fisheries Science Center Coral Reef Ecosystem Division (CRED)
Method description:This method involves towing two SCUBA divers behind a boat at a constant speed (~1.5 knots). One diver manoeuvres the ‘benthic towboard’ (another name for manta board) equipped with either a downward-facing video camera or a still camera to photograph the benthos at selected intervals. The other diver manoeuvres the ‘fi sh towboard’ (p 76) equipped with a forward-facing video camera to record fi sh and general reef topography. Towed-diver surveys are good to obtain a general description of a large reef area, assess large-scale disturbance e.g. bleaching, and assess general distribution and abundance patterns of selected macro-invertebrates e.g. COTS or giant clams. They are best for covering large distances at low levels of taxonomic resolution.
Information obtained:Percent cover estimations of benthic communities recorded by the diver can be used for rapid, preliminary analyses. The habitat types recorded can be used to geo-reference coral reef habitats. More precise quantitative data must be extracted from recorded imagery by trained analysts using digital image analysis software. In obtaining broad data on benthic communities, the percentage cover of the following parameters can be assessed: m Coral (sub-categories by taxon or colony morphology depend
on the biogeographic area surveyed);m Macroalgae and turf algae;m Coralline algae;m Other macro-invertebrates;m Non-encrusted (recently dead) coral;m Sand, rubble, and pavement (rock).
Field equipment required:m 60 m long, 9.5 mm diameter, low-stretch towing rope;m Towing bridle affi xed to towboard;m Towboard with fi tted cut-outs or mounts to attach cameras and other instruments (data sheets and pencils);m Housed digital video camera, or housed still camera;m 2 strobes and slave sensors (when using housed still camera);m 2 lasers calibrated to project dots 20 cm apart on recorded imagery;m Depth/temperature recorder e.g. SBE 39;m Waterproof watch with countdown function to signal intervals for visual assessment;m Separate waterproof watch as backup and to monitor dive time;m Depth gauge bottom timer (UWATEC);m GPS unit(s) in towing boat to geo-rectify survey track e.g. Garmin 76;m Depth sounder in towing boat to maintain constant towing depth.
Lab equipment reguired:m Video player and s-video cable (for imagery recorded on digital video);m Software to play video through computer and grabbing still frames from digital video e.g. DVRaptor;
image thumbnails colour correction e.g. ACDSee; quantitative whole-image analysis e.g. SigmaScan; data compilation e.g. Excel;
m Digitizing tablet e.g. WACOM;m High-resolution monitor e.g. PELCO desirable;m ArcView GIS.
Field personnel:m Effi ciency is enhanced when there are 4 fi eld people in two teams of 2 scuba divers, so that the surface team
(driver and data recorder) can switch at the end of each tow survey.
Lab personnel:m Analysts experienced in the identifi cation of coral reef benthos and trained in specifi c analysis protocols;m Experienced ArcView GIS user.
Map
ping
Parameters that can be surveyed Parameters that can be surveyed using this method:using this method:
✓ Benthic communities Benthic communities ✓ invertebrates invertebrates
Monitoring levelMonitoring level::✓ ResearchResearch
Scale:Scale:✓ BroadBroad
Level of detailLevel of detail::✓ Quantitative Quantitative
Causes damage to the reefCauses damage to the reef::✓ NoNo
Achievable precisionAchievable precision::✓ LowLow

25
General field procedures:m Maintain constant tow speed of ~1.5 knots. Currents and sea conditions may require a change in tow speed;m Benthic diver begins video (or still camera) after reaching bottom and coordinating start time with fish
towboard diver (see section on assessing fish populations for discussion of coordination of GPS tracking signals between divers and surface personnel p 76);
m Benthic diver attempts to manoeuvre towboard 1 m above bottom;m Each minute the benthic diver marks the habitat type on the data sheet;m At 5 minute intervals (alerted by countdown watch timer), benthic diver estimates percent cover of major
components on data sheet;m Macro-invertebrates are recorded when observed in each 5 minute segment on the data sheet;m A standard survey lasts 50 minutes.
Advantages:m A large area is covered in a short time;m Different habitats e.g. patch reef, sand flats, rubble zones can be observed during a single tow, as well as the
transitions between them;m Suitable for remote locations that can only be visited infrequently;m Towed divers can survey areas that are unsuitable for roving divers due to strong current, surge, or poor
anchorage;m Divers can work to limits of conventional scuba (30 m);m Use of alternating surface and dive teams increases the number of surveys per day;m An archived visual record can be re-sampled or re-analysed;m A GPS receiver on the tow boat allows geo-referencing the survey path, linking imagery to location;m Provides a spatial link between remote sensing data and local, site-specific surveys.
Limitations:m Requires experienced divers trained in specific hazards of manoeuvring towboards;m Field equipment is expensive and requires regular maintenance, therefore this method is only suited to
research projects with large budgets;m Lab equipment needed to analyse imagery is expensive;m Image analysis is time-consuming;m Preliminary results from diver estimations of percent cover involve subjective evaluations that are difficult to
standardize or replicate;m Time required to record diver estimations while being towed overlaps with ongoing observations;m Taxonomic resolution of analysed imagery is low compared to roving diver benthic survey methods;m Cryptic animals are easily overlooked e.g. COTS hiding under plate corals, juvenile COTS, and small giant
clams; therefore real abundances are underestimated, so results should be calibrated with finer-scale surveys, or used only for comparison with other areas and times surveyed with the same method (belt transects p 64).
Field training required:m Certified scuba divers trained in safely manoeuvring towboards;m Operation of small boats and driving at a constant speed, GPS units, digital video and still camera;m Recognition and percent cover estimation of major benthic categories.
Lab training required:m Coordinated use of hardware e.g. digitising tablet and software e.g. DVRaptor, SigmaScan, ACDSee, Excel in
analysing digital imagery;m Arcview GIS.
Contact:Jean Kenyon, [email protected] Brainard, [email protected] Timmers, [email protected]
Reference:Maragos and Gulko (2002)crei.nmfs.hawaii.edu/eco/tow_board.html www.hawaiianatolls.org/research/NOWRAMP2002
For information on the fish monitoring method that can be done by the buddy of the observer who does either this benthic towed diver method, or the ‘Manta tow’, (p 22). The validity of towed-diver surveys as a monitoring technique is still under development.
Map
ping

26
RANDOM SWIM
Programs that use this method:m Community monitoring programs may use the random swim for monitoring;m Management or research monitoring programs may use the random swim for site selection.
Method description:For site selection, this involves a snorkel or scuba diver buddy pair selecting suitable sites for monitoring e.g. checking if there is suffi cient continuous reef for transects.
Random swims can also be used for monitoring various coral reef parameters (‘Eye on the Reef’ p 30).
Information obtained:General description of the site with semi-quantitative counts of various coral reef variables.
Equipment required:No special equipment.
Field personnel:m 1 boat driver/surface watch;m 2 trained observers.
Lab personnel:m Data analysis, interpretation and reporting.
General procedures:m Swim around the general reef area to determine
suitability for monitoring methods selected, or make a species list to decide which parameters to count during monitoring.
Advantages:m Useful to determine site suitability;m Useful to decide on the type of monitoring methods to use e.g. transects work well for continuous reef areas
(p 33), whereas quadrats are more suitable for patch reefs (p 43); and the level of detail required e.g. species or genus level.
Limitations:m The area covered is limited to where the divers look and this may not be the best location. We recommend
using manta tow to select sites, and then random swims for more detail and to make species lists.
Training required:Site selectionm Knowledge of the type of site to select and the possible target monitoring methods.
To determine level of detail for monitoring programBasic coral reef identifi cation expertise in order to decide what things to count.
Map
ping
Parameters that can be surveyed Parameters that can be surveyed using this method:using this method:
✓ Benthic communitiesBenthic communities✓ Macro-invertebratesMacro-invertebrates✓ FishesFishes
Scale:Scale:✓ BroadBroad
Monitoring level:Monitoring level:✓ CommunityCommunity✓ Management Management ✓ Research Research
Level of detailLevel of detail::✓ Qualitative Qualitative
Causes damage to the reefCauses damage to the reef??✓ NoNo
Achievable precisionAchievable precision::✓ LowLow

27
5: BENTHIC COMMUNITIES
Coral reef managers need information on the status and trends in benthic communities to effectively manage the resources. Most focus is on hard corals, but managers also need data on soft corals, algae, sponges and other invertebrates (see ‘Section 6: Invertebrates’, p 63). Therefore the emphasis in these methods is to assess corals by monitoring diversity, coral cover, coral health and disease, growth and recruitment.
Coral species diversityAssessing coral diversity is easier where there are fewer species, e.g. the Caribbean, or where a few species are very dominant. In the Indo-Pacific, it often necessary to assess coral growth form as a substitute for diversity. Other ‘species diversity’ measures are for fish, p 73.
Percent coverPercent cover of hard coral is the information most frequently used by managers to assess reef health. Percent cover of various benthic animals and plants, as well as rock and rubble, is easy to measure and understand.
Coral healthMonitoring various indicators of coral health is important to determine and understand the causes of coral death. Coral bleaching has become a major concern in coral reef management over the last few years (Wilkinson 2002) and coral diseases are apparently increasing in frequency and distribution (Bruckner and Bruckner 1997; Bruckner 2002).
Broad scale surveys can provide information on the general health of corals and causes of death at a large number of sites; medium scale surveys can provide more detailed information on the abundance and type of coral disease, bleaching or mortality; and permanent fine scale surveys can provide more information on how different species and specific coral colonies are affected. Questions might include:m Are there coral diseases at our sites, if so what is the type and abundance? m How has coral bleaching affected corals?
Coral bleaching specific methodsTo further understanding of the ecological implications of mass coral bleaching, detailed information on the amount and patterns of coral mortality from bleaching is required. Broad scale surveys will provide information on the extent of bleaching, whereas medium and fine scale monitoring provide more precise information about the percentage and types of corals that bleach, and then subsequently die or survive.
All of the methods described previously for percentage cover or coral health can be used to monitor bleaching. However, the methods described below have been designed specifically for bleaching.
Disease-specific methodsThe occurrence of disease in corals is apparently increasing. Disease-specific surveys are useful in regions where this is a particular problem.
Structural complexity (rugosity)Monitoring the rugosity of the reef is useful to determine how the coral reef structure changes over time. Chain intercept transect methods (CIT) provide a good measure of rugosity, but are more time consuming and cumbersome. An alternative to the chain methods are line intercept transect (LIT) methods where the collection of growth form (coral shape) information can be used to determine how reef topography changes through time. Note growth form data provide less detailed information on topography than CIT.
Coral growthSee ‘Permanent photo quadrats’ for use to collect growth information, p 43. Other coral growth measuring methods are presented in Rogers et al. (1994).
Coral recruitmentInformation on coral cover or coral mortality over the long-term is not sufficient to determine whether a reef is healthy. A healthy reef must have young recruits, and monitoring coral recruitment is important to identify coral reef areas that function as a source or sink of larvae. Such information can determine recovery potential of a reef after disturbance. Coral recruitment can be measured using either settlement plates, which provide information on
Ben
thic
com
mun
ities

28
new recruits that are too small to observe in the field; or visual or photographic searches, usually in quadrats. Field searches look for successful recruits i.e. those that have survived for their first year. At this point they are visible to observers in the field. Methods detailed here include:m English et al. coral recruitment settlement plates;m MBRS SMP Coral recruitment settlement plates;m AGRRA coral recruitment quadrats.
Other benthic communitiesPercent cover of algaeIncreases in algae often occur when coral reefs are impacted by increased nutrients or removal of herbivores. It is important to monitor the abundance and type of algae if you suspect that the reef could be severely affected by algal increases. Otherwise methods to measure percent cover are sufficient. The methods of AGRRA, CARICOMP and Rogers et al. (1994) provide specific methods for monitoring algae. These include quadrats and the collection of algae to determine biomass.
Key macro-invertebrates can be monitored using methods described on p 63.
Ben
thic
com
mun
ities

29
Table 1. Which benthic communities monitoring method should you choose?
Monitoring Category & Scale
When should you choose this method? Page
Broad scale Site selection and to cover a large area in short time
Manta tow or video towed diver
Percent cover: Estimates percent coral cover over large areas in short time, at low detail; limited to shallow, snorkel depths;Coral health: Estimates only bleaching % cover of live or dead coral.
22
General observations
Percent cover: Estimates of reef change. Good for dive tourism staff to keep an eye on the reef during frequent visits. General information only, low precision.Coral health: Recreational divers and researchers can make observations on coral health; some training required; many sites covered at low cost. Coral bleaching: Less instruction required.
30
Timed swim
Percent cover: Estimates coral cover or large invertebrate abundance of a large area, and at various depths if scuba used; not as quick and cost effective as manta tow, but more detailed. Disease specific: Easy to do; information on extent of bleaching and types of corals affected; lower precision than belt transects.
31
Medium scaleSmaller area, more detailed and more precise than broad scale methods. More time consuming and expensive than broad-scale methods.
Timed swim Species diversity: The highest level of expertise is required. 31
Line Transects LIT & PIT
Percent cover: LIT - experienced staff, low to high detail, precise information; time consuming. PIT - less experienced staff needed, quick and easy; can have similar precision as LIT.Coral health: High detail and precise, but expertise required and time consuming.Disease specific: Detailed information, time consuming.Structural complexity: Size information collected along lines provides estimates of rugosity (MBRS SMP and Line transect by AGRRA).
33
36
51
Belt Transect
Coral health: Medium detail and fairly quick; low to high expertise required depending on level of detail wanted (Reef Check or AIMS LTMP);Coral bleaching: Easy to do, but expertise is required; detailed information on the extent of bleaching and types of corals affected. Disease specific: As above.
64
47
49
Chain transect
Percent cover: experienced staff, low to high detail, precise information; more time consuming than LIT. Disease specific: Difficult to do; experience required; detailed information on extent of bleaching and types of corals affected.Structural Complexity: Difficult to do; experience required.
54
Video transectPercent cover: High precision, medium detail; permanent record; experienced divers to collect data and experienced scientists for analysis; expensive equipment to buy and maintain; do not use unless suitable resources available.
38
Fine scale Useful for asking detailed, small-scale questions. More time consuming and expensive than medium-scale surveys.
Visual quadrat
Percent cover High precision and detail, but lower precision than permanent photo quadrats. Smaller animals, e.g. coral recruits can be recorded more reliably with visual methods than photo quadrats.Disease specific: Very high detail and time consuming. Information on the extent of bleaching and the types of corals affected.Coral recruitment: Provides information on coral recruits that have survived their first year on the reef.
41
Permanent photo quadrat
Percent cover High precision and detail; permanent record; experienced divers to collect data; experienced scientists to analyse; expensive equipment to buy and maintain; do not use unless suitable resources are available.
43
Tagging coral colonies
Disease specific: Highest detail and most time consuming; provides precise information on specific coral colonies and how these are affected by disease.
53
Recruitment tiles or plates
Coral recruitment: Collects information on coral recruits that are newly arrived on a reef. 56
Ben
thic
com
mun
ities

30
GENERAL OBSER VATIONS
(e.g. Eye on the Reef.)
Programs that use this method: m GBRMPA/CRC Reef (in collaboration with Australian Marine Park Tourism Operators (AMPTO), the Queensland
Parks and Wildlife Service (QPWS) and 10 Dive Operators).
Method description:Broad scale rapid early warning system that involves the dive tourism industry on a voluntary basis.
Information obtained:Presence/absence of target organisms or impacts through time. The data are highly subjective.
Equipment required:No special equipment.
Field personnel:m Can be conducted by dive professionals on tourist
operations.
Lab personnel:m Data entry, analysis, interpretation and reporting (all
performed by program coordinator in Queensland).
General procedures:m Diver observes the reef whilst on a tourist dive (no
control on time, depth or direction) and records on a daily or weekly basis the presence and abundance of target organisms on data sheets.
Advantages:m Encourages dive operator staff to participate in monitoring
coral reef health;m Fosters stewardship amongst marine tourism operators and their staff;m Early warning indicator of potential environmental changes;m Development of nature diaries, which are useful for tourism interpretation;m Documentation of sporadic events.
Limitations:m Qualitative data only;m Very low precision because there is no control of data quality;m Requires coordinator to continue to motivate participants.
Training required:m Minimal. Very easy for non-trained personnel; designed for professional divers who have experience on reefs
and can identify the major reef organisms
Contact:Andrew Chin, [email protected] or Robin Aiello, [email protected]
Parameters that can be surveyed Parameters that can be surveyed using this method:using this method:
✓ Benthic communitiesBenthic communities✓ Key macro-invertebratesKey macro-invertebrates✓ FishFish
Monitoring level:Monitoring level:✓ CommunityCommunity
Level of detail:Level of detail:✓ QualitativeQualitative
Causes damage to the reef?Causes damage to the reef?✓ NoNo
Achievable precision:Achievable precision:✓ LowLow
Ben
thic
com
mun
ities

31
TIMED SWIMS
Programs that use this method:m The Nature Conservancy (species diversity);m World Wide Fund for Nature (species diversity);m World Wide Fund for Nature; Great Barrier Reef
Marine Park Authority; ReefBase Global Bleaching Survey Program;
m Komodo National Park Coral Reef Status Monitoring — Marine Conservation Program of The Nature Conservancy, Indonesia;
m Indian Ocean Commission (COI);m AIMS Long-term Monitoring Program.
Method description:This involves observers swimming at a constant depth and speed for a set amount of time. This is a broad scale, rapid early warning system of impacts such as change in coral cover, dynamite fi shing, bleaching, COTS.
Information obtained:Estimated percent cover of basic benthic community categories: hard coral, soft coral, macroalgae. Estimations of overall site characteristics can be used to help site selection. For bleaching surveys use taxonomic groups such as: m Acropora;m Pocillopora;m Favia.
Equipment required:No special equipment.
Field personnel:m 2 observers (scuba divers);m 1 boat driver/surface watch.
Lab personnel:m Data entry, analysis, interpretation and reporting.
General procedures:Species diversitym Swim along a depth contour for a specifi c length of time (e.g. 30 minutes to 1 hour) and make lists of all
species encountered. Abundance estimates can be made for each species.
Bleaching programm 2 depth profi les, 1-4 m and 5–10 m;m 2 divers swim randomly around an area of 25 m diameter for a period of 2 minutes;m One diver is the primary observer.
Komodo National Parkm Observers make repeated swims of 4 minutes duration at 4 m, 8 m and 12 m depths;m After each swim the observer stops and records cover estimates of benthic organisms and substrates.
Monitoring level:Monitoring level:✓ ManagementManagement
Parameters that can be surveyed Parameters that can be surveyed using this method:using this method:
✓ Benthic communitiesBenthic communities✓ Key macro-invertebratesKey macro-invertebrates✓ FishFish
Monitoring level:Monitoring level:✓ ManagementManagement
Scale:Scale:✓ BroadBroad✓ MediumMedium
Monitoring level:Monitoring level:✓ CommunityCommunity✓ Management Management ✓ Research (when used for Research (when used for
species diversity)species diversity)
Level of detail:Level of detail:✓ Semi-quantitativeSemi-quantitative
Causes damage to the reef?Causes damage to the reef?✓ NoNo
Achievable precision:Achievable precision:✓ LowLow
Ben
thic
com
mun
ities

32
COIm Observers (on scuba or snorkel) swim randomly for 5 minutes for 9 replicates per site;m Record assessment of coral cover using 5 abundance categories (Manta Tow p 22).
Advantages:m Provide greater accuracy than manta tow since the observer can spend more time in a particular area and get
closer to the substrate to ensure optimal visual resolution;m Minimal training required;m Large areas can be covered in little time;m Useful to acquire lists of species present.
Limitations:m Low precision when used for monitoring percent cover; limited ability to detect small amounts of
environmental change.
Training required:m Low if basic categories measured, medium if coral families are included;m Tertiary scientific training and research experience if species diversity counts are required.
Contact: m Species diversity: Donnelly et al. (2003); m www.komodonationalpark.org/ or contact one of the major NGOs: The Nature Conservancy at www.nature.
org; the World Wide Fund for Nature, www.wwf.org; and Conservation International, www.conservation.org.m Bleaching: Naneng Setjasih at WWF Indonesia: [email protected], Paul Marshall at GBRMPA:
[email protected] or Jamie Oliver at ReefBase, [email protected] Dynamite damage: Komodo National Park www.komodonationalpark.org: Andreas H Muljadi, amuljadi@cbn.
net.id, [email protected] or Peter Mous, [email protected] m Site selection: COI (p 104) COI Secrétariat Général, [email protected]
Also see ‘coral bleaching’ p 47 for use of timed swim surveys to monitor the extent and effects of coral bleaching.
Ben
thic
com
mun
ities
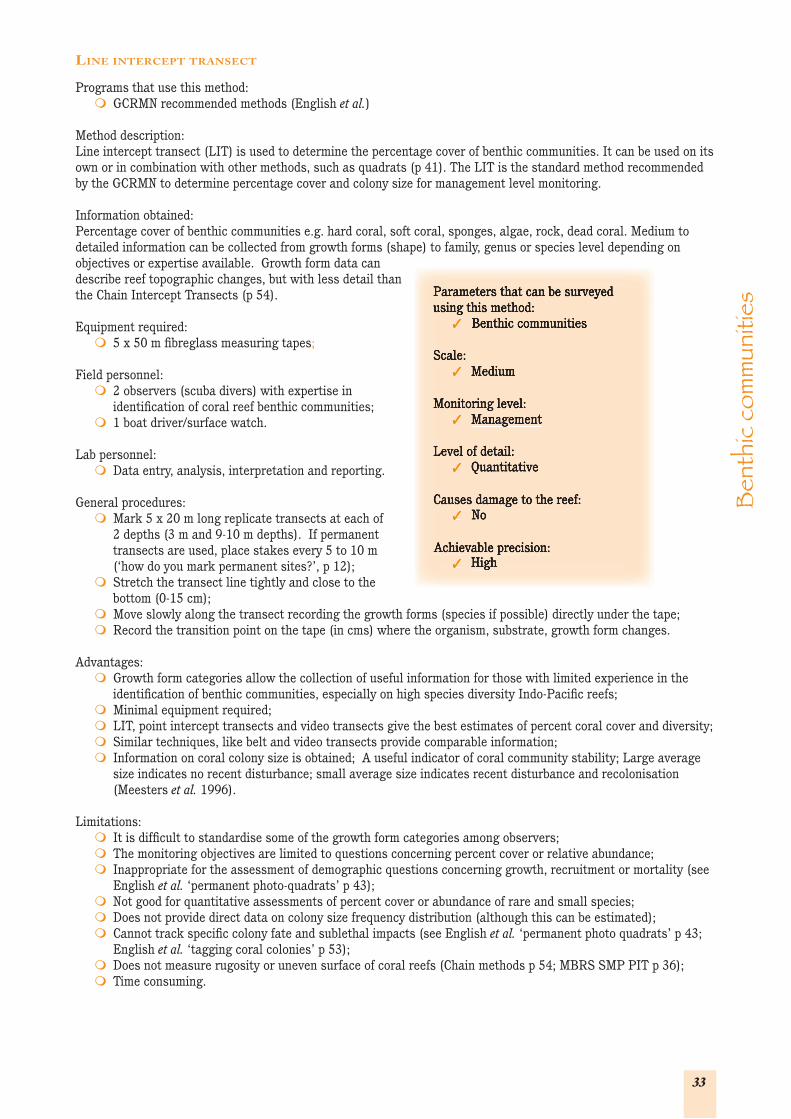
33
LINE INTERCEPT TRANSECT
Programs that use this method:m GCRMN recommended methods (English et al.)
Method description:Line intercept transect (LIT) is used to determine the percentage cover of benthic communities. It can be used on its own or in combination with other methods, such as quadrats (p 41). The LIT is the standard method recommended by the GCRMN to determine percentage cover and colony size for management level monitoring.
Information obtained:Percentage cover of benthic communities e.g. hard coral, soft coral, sponges, algae, rock, dead coral. Medium to detailed information can be collected from growth forms (shape) to family, genus or species level depending on objectives or expertise available. Growth form data can describe reef topographic changes, but with less detail than the Chain Intercept Transects (p 54).
Equipment required:m 5 x 50 m fi breglass measuring tapes;
Field personnel:m 2 observers (scuba divers) with expertise in
identifi cation of coral reef benthic communities;m 1 boat driver/surface watch.
Lab personnel:m Data entry, analysis, interpretation and reporting.
General procedures:m Mark 5 x 20 m long replicate transects at each of
2 depths (3 m and 9-10 m depths). If permanent transects are used, place stakes every 5 to 10 m (‘how do you mark permanent sites?’, p 12);
m Stretch the transect line tightly and close to the bottom (0-15 cm);
m Move slowly along the transect recording the growth forms (species if possible) directly under the tape; m Record the transition point on the tape (in cms) where the organism, substrate, growth form changes.
Advantages:m Growth form categories allow the collection of useful information for those with limited experience in the
identifi cation of benthic communities, especially on high species diversity Indo-Pacifi c reefs; m Minimal equipment required;m LIT, point intercept transects and video transects give the best estimates of percent coral cover and diversity;m Similar techniques, like belt and video transects provide comparable information;m Information on coral colony size is obtained; A useful indicator of coral community stability; Large average
size indicates no recent disturbance; small average size indicates recent disturbance and recolonisation (Meesters et al. 1996).
Limitations:m It is diffi cult to standardise some of the growth form categories among observers;m The monitoring objectives are limited to questions concerning percent cover or relative abundance;m Inappropriate for the assessment of demographic questions concerning growth, recruitment or mortality (see
English et al. ‘permanent photo-quadrats’ p 43);m Not good for quantitative assessments of percent cover or abundance of rare and small species;m Does not provide direct data on colony size frequency distribution (although this can be estimated);m Cannot track specifi c colony fate and sublethal impacts (see English et al. ‘permanent photo quadrats’ p 43;
English et al. ‘tagging coral colonies’ p 53);m Does not measure rugosity or uneven surface of coral reefs (Chain methods p 54; MBRS SMP PIT p 36);m Time consuming.
Parameters that can be surveyed Parameters that can be surveyed using this method:using this method:
✓ Benthic communitiesBenthic communities
Scale:Scale:✓ MediumMedium
Monitoring level:Monitoring level:✓ ManagementManagement
Level of detail:Level of detail:✓ QuantitativeQuantitative
Causes damage to the reef:Causes damage to the reef:✓ NoNo
Achievable precision:Achievable precision:✓ HighHigh
Ben
thic
com
mun
ities

34
LIT is the most rigorous method to determine percent cover of benthic communities, but is more time consuming than PIT. Recommend LIT if underwater time is not a problem; however, if time is a problem, PIT may be more appropriate (p 36).
Training required:m Medium to advanced benthic community identification;m Regular comparisons between observers is required to reduce inter-observer error. This is important if
meaningful temporal data are required.
Contact:Sue English, [email protected]
Reference:English et al. (1997); www.aims.gov.au
Variations on this method:LIT can be varied by using a chain to calculate rugosity (CIT p 54) or can be combined with other methods (p 79).
Ben
thic
com
mun
ities

35
Tabl
e 2.
Com
pari
son
betw
een
Ree
f Che
ck, M
BR
S SM
P a
nd R
eefK
eepe
r P
IT m
etho
ds.
Met
hod
Ree
f C
heck
MB
RS
SM
PR
eefK
eepe
rP
acifi
c po
int
inte
rcep
t
Cate
gori
es
1.
Har
d co
ral
2.
Soft
cor
al3.
Sp
onge
4.
Nut
rien
t in
dica
tor
alga
e5.
R
ecen
tly
kille
d co
ral
6.
Roc
k7.
Si
lt8.
Sa
nd9.
R
ubbl
e10
. O
ther
1.
Cora
lline
alg
ae2.
Tu
rf a
lgae
3.
Mac
ro a
lgae
4.
Spon
ges
5.
Gor
goni
ans
6.
Spec
ific
gene
ra o
f har
d co
rals
7.
Bar
e ro
ck8.
Sa
nd
9.
Dea
d co
ral
1.
Har
d co
ral
2.
Soft
cor
al3.
P
alyt
hoa
4.
Bar
e ro
ck5.
Sa
nd6.
Sp
onge
7.
Alg
ae (
cove
red
rock
)8.
O
ther
1.
Cora
l (lif
efor
m)
2.
Mis
cella
neou
s (h
ydro
zoan
, spo
nge,
cla
m,
zooa
nthi
d, s
oft
cora
l, as
cidi
an, e
chin
oder
m)
3.
Mac
roal
gae
(enc
rust
ing
cora
lline
alg
ae,
bran
chin
g co
ralli
ne a
lgae
, fles
hy m
acro
alga
e,
halim
eda,
blu
e gr
een
alga
e, e
ncru
stin
g al
gae)
4.
N
onliv
ing
(mat
rix,
roc
k, s
and,
rub
ble,
cre
vice
/ho
le)
Tran
sect
leng
th4
x 20
m s
epar
ated
by
5 m
5 x
30 m
2 x
50 m
5 x
50 m
Surv
ey d
epth
m
Shal
low
(2-
6 m
)m
D
eep
(6-1
2 m
)m
B
ack
reef
(1-
5 m
)m
Fo
re r
eef (
1-5
& 8
-15
m)
m
Insh
ore
(3 m
)m
Te
rrac
e (7
m)
m
Shel
f-edg
e (1
0 m
)Si
te s
peci
fic
Poi
nt in
terv
al50
cm
25 c
m50
cm
3 po
ints
eve
ry 2
m (
1 on
eit
her
side
of t
he li
ne &
1 di
rect
ly b
elow
)
Num
ber
of
poin
ts p
er
tran
sect
4012
010
075
Tota
l poi
nts
used
160
600
200
375
Add
itio
nal
info
rmat
ion
colle
cted
If p
ossi
ble,
Ree
f Che
ck a
dvis
es t
akin
g si
te p
hoto
grap
hs o
r vi
deo
tran
sect
(p
38)
for
perm
anen
t re
cord
.
Cora
l con
diti
on o
f 50
cora
ls p
er s
ite
is
also
col
lect
ed (
cora
l hea
lth
p 45
); c
oral
si
ze p
rovi
des
rugo
sity
info
rmat
ion
1.
Still
pho
to t
aken
eve
ry 4
m &
con
tinu
ous
vide
o tr
anse
ct; s
ee ‘p
hoto
grap
hy a
nd v
ideo
in
mon
itor
ing’
p 2
0.2.
P
erce
nt o
f str
esse
d co
rals
per
tra
nsec
t is
ca
lcul
ated
to
give
the
cor
al s
tres
s in
dex
Oth
er
com
men
ts
Reg
iona
l and
glo
bal d
escr
ipti
ons
on
cora
l ree
f hea
lth.
Up
to 3
full
Ree
f Ch
eck
(4 x
20
m)
tran
sect
s re
quir
ed t
o de
tect
env
iron
men
tal c
hang
e at
a lo
cal
scal
e on
1 k
m lo
ng r
eef
Pre
cise
to
dete
ct 1
0% c
hang
e w
hen
test
ed a
t va
riou
s lo
cati
ons
in t
he P
acifi
c.
Ben
thic
com
mun
ities

36
POINT INTERCEPT TRANSECT (PIT)
Some programs that use this method:m Reef Check;m MBRS SMP; m ReefKeeper; m Pacifi c point intercept.
Method description:A scuba diver or snorkeller swims along a transect line and records the benthic category that is directly below the transect line at specifi c points (distances) along the transect.
Information obtained:Percent cover of benthic communities. Reef Check data can be entered quickly into Reef Check Excel spreadsheets and percent cover and basic statistics are calculated. For MBRS SMP, percent cover can be calculated using the formula (# records/120)*100.
Equipment required:m Tape measures; m Plumb line (small metal object tied to 1 m of string);m Tape measure, string or PVC pole to measure the width of
the belt transect.
Additional equipment required for MBRS SMP:m Underwater cards to aid species identifi cation.m A 1 m long measuring device (PVC piping).m Small plastic ruler on underwater slate or writing cylinder.
Additional equipment required for ReefKeeper:m Still camera and underwater housing.
Additional equipment for Pacifi c point intercept:m 1 x 2 m line that is marked at 1 m.
Field personnel:m 1 dive buddy team lays the transect tape and conducts the substrate survey.
Lab personnel:m Data entry, analysis, interpretation and reporting.
General procedures:m Lay the transects at each depth contour; m Observers swim along the transect and record the substrate or benthos that is directly below the line. The
plumb line removes bias and parallax error. The plumb line is used to determine the benthos directly below the line at the point interval required by the methods, e.g. Reef Check data are recorded every 50 cm.
Advantages:m LIT, PIT and video transects give the best estimates of percent coral cover and diversity as long as PIT has
suffi cient points (e.g. fewer points required for broad categories, e.g. hard coral cover (Reef Check) rather than genus/species cover; and for coral reefs that are less variable spatially);
m Quick to learn;m Easy for recreational divers to learn and implement well;m Provides education and public awareness benefi ts p 14);m Photographs provide a permanent record (Reef Keeper);m MBRS SMP survey provides some information on structural complexity (‘structural complexity’ p 27)
Limitations:m The number of points required for high precision will depend upon the spatial variability of the reef;m Not good for rare species on a reef;m Information on the size of coral colonies, a useful indicator of coral community stability, is not obtained.
Parameters that can be surveyed Parameters that can be surveyed using this method:using this method:
✓ Benthic communitiesBenthic communities
Scale:Scale:✓ MediumMedium
Monitoring level:Monitoring level:✓ Management Management ✓ Community Community
Level of detail:Level of detail:✓ QuantitativeQuantitative
Causes damage to the reef:Causes damage to the reef:✓ NoNo
Achievable precision:Achievable precision:✓ HighHigh
Ben
thic
com
mun
ities

37
Training required:m Identification and calibration between observers.m 1 day of training required for the full Reef Check survey. These observers can collect data with sufficient
precision for the regional/global comparisons and for use as an early warning system; m To detect environmental change at a local level with higher precision, additional training and testing for
multiple observers, is recommended. To increase the power to detect local change, up to 3 surveys per 1 km of coral reef are needed.
For a variation on this method for research monitoring see video transects p 38.
Contact:Reef Check: [email protected]: Alexander Stone, [email protected] SMP: Alejandro Arrivillaga, [email protected] or [email protected] point intercept: Alison Green, [email protected]
Reference:www.reefcheck.org; www.reefkeeper.org; www.mbrs.org.bz; Choat and Bellwood (1985); Green (1996b); Green (1996a); Green (2002).
Ben
thic
com
mun
ities

38
VIDEO TRANSECT
Major programs using this method:m GCRMN (English et al.);m Australian Institute of Marine Science Long-term Monitoring Program (AIMS LTMP);m Hawai’i Coral Reef Assessment and Monitoring Program (CRAMP);m Florida Keys National Marine Sanctuary Coral Reef Monitoring Program (FKNMS CRMP).
Method description:A video camera is used for a permanent record of transects. Video transects are analysed in the laboratory using point sampling techniques.
Information obtained:A permanent record of percent cover and a visual record of the site. The video is analysed on a TV screen, and data are reported as percent cover. The footage can also be used as qualitative information in monitoring reports to reinforce trends illustrated by graphs.
Field equipment required:m Tape measures (for 5 x 50 m transects – LIT English et al. and AIMS LTMP);m Digital video camera and underwater housing (including lenses) with instruction manuals;m Appropriate colour fi lter;m Mini DV tapes;m Cleaning equipment for camera and housing, including O-
ring kit and O-ring grease;m Video head cleaning cassette;
Lab equipment:m Television monitor with 5 points arranged in a face-centred
cube on the screen;m Video recorder/player with counter/time code display and
the ability to display a ‘jitter free’ clear still picture when paused;
m Personal computer;m Database software for data entry.
Field personnel:m 2 experienced scuba divers to collect the fi eld data and lay
the transect tape;m 1 boat driver/surface watch.
Lab personnel:m 2 observers experienced in the identifi cation of coral reef benthos off video should work together to eliminate
observer biases in data analyses.
General procedures:m Prior to fi eld work prepare camera and check it is functioning corectly.m Record videos between 08.30 and 15.30 hours for best lighting conditions;m Set the zoom to wide angle and camera on automatic focus;m Record replicate transect number on the data sheet and video the completed data sheet for 3-5 seconds to
help identify the transects when analysing the videos in the laboratory. Information recorded should include the date, location, site and transect numbers and any irregularities during recording;
m First record a panorama of the site and counter code on the data sheet;m Position the camera above and parallel to the substrate and to one side of the transect tape to avoid glare on
the video image from the tape;m Swim along the transect at a constant speed;m At the end of the tape, record the tape marker for a few seconds then stop the video;m Record the counter time and swim to the next transect;m Repeat the process for the remaining transects.
Parameters that can be surveyed Parameters that can be surveyed using this method:using this method:
✓ Benthic communitiesBenthic communities
Monitoring level:Monitoring level:✓ ResearchResearch
Level of detail:Level of detail:✓ Quantitative Quantitative
Causes damage to the reef?Causes damage to the reef?✓ NoNo
Achievable precision:Achievable precision:✓ High High
Ben
thic
com
mun
ities

39
Table 3. Comparison between AIMS LTMP, English et al., Virgin Islands, CRAMP and FKNMS video transect methods.
Method AIMS LTMP English et al. CRAMP FKNMS
Camera distance from substrate
15-20 cm 25 cm50 cm (2 lasers cross at 50 cm maintain constant distance)
40 cm (lasers used as with CRAMP)
Swim speed 10 m / minute 10 m / minute 10 m / 4 minutes 4 m / minute
Transect number & length 5 x 50 m 5 x 50 m 10 x 10 m 10 x 10 m
Survey depth 9-12 m 9-12 m 3 m and 10 m 14-17 m and 6-9 m
Number of points analysed 200 20050 – 60 frames per transect; 50 points analysed per frame
The larger distance the video is from the bottom, the more benthos is included. Short video distances, e.g. 15-20 cm are recommended for the identification of coral and other benthos species; larger distances, e.g. 40-50 cm include more benthos, which is useful when observing less detail, e.g. the effects of bleaching, p 47).
Labm Label the tape and its case with a description of the information on the tape; m Analyse the tape by stopping at fixed time intervals; considerable software has been developed for video
analysis. AIMS use AVTAS; the US Virgin Ids Program uses WinBatch for Windows (download from www.winbatch.com); CRAMP uses PhotoShop Photo DV to grab frames and analysed using PointCount99;
m A pilot study is recommended to determine the number of points required to sample the video; 40-80 pauses (200-400) points on each 50 m transect are recommended for the Great Barrier Reef;
m Enter the data and information into a database and the identification codes for the substrate under each of the 5 points on each frame;
m Convert the video data to percentage cover data for each transect;m Data entry, analysis, interpretation and reporting.
Storage of tapesm Do not leave tapes in the VCR for an extended period of time;m Store the tapes in their cases and store these vertically;m Avoid storing the tapes in places where there is dust, excessive heat, moisture or magnetic fields. A fireproof
cabinet is recommended;m If possible store the tapes in a data cabinet designed for magnetic media;m Fast forward the tapes every two years to prevent them sticking;m To protect from erasure, ensure that the copy protect switch on each tape is placed ON after recording;m Duplicate copies of tapes should be made and stored separately. Tapes will last about 10 years if they are
maintained. DVDs are good for storing data but care should be used in selecting appropriate computer software to transfer these data, as image quality can be lost with low quality software.
Advantages:m Can be implemented by experienced divers without expertise in the identification of marine organisms;m Faster than still photography; quick to implement in the field therefore useful if sampling a large area is a
priority;m Provides a permanent record; m High precision, e.g. 2.5 – 5% change in coral cover can be detected using the FKNMS CRMP methods;m Useful in most diving conditions including limited visibility;m Allows comparison between observers (correction for observer bias) at a later date;m Use of lasers help to standardise video belt size, but add to the expense;m Statistical power of the transects can be increased in the lab by increasing the number of points or frames
analysed. Studies suggest that increasing the number of frames per transect increases statistical power more than increasing the number of points per frame.
Limitations:m Still photos offer higher resolution than earlier videos, but newer high resolution video is adequate for benthic
monitoring;m Software is expensive, but easily accessible; costly and time consuming to analyse;m Expensive equipment and requires regular maintenance;m Results are not immediate as tapes must first be analysed;
Ben
thic
com
mun
ities

40
m Requires safe storage space for video equipment and tapes;m Only organisms 5 cm diameter or larger can be identified consistently;m Species identification is only possible if the characteristics required to distinguish them are large, or if the
organism has distinguishing features. Therefore, the video method cannot measure coral species diversity accurately;
m There is a risk of low quality or missing data as poor video technique will result in inadequate images which may not be discovered until after the field trip;
m Substrates with higher rugosity (roughness, corrugation) have lower resolution in a video image;m Very complex substrates (many small or overlapping biota) have lower resolution in a video image;m Separating growth form categories consistently with a two dimensional image is not always possible;
therefore the power to detect temporal change of percentage cover of individual growth forms may be low in some environments;
m Information on the size of coral colonies, a useful indicator of coral community stability, is not routinely obtained.
Training required:m Regular training and recalibration between observers is required for consistent analysis of the video footage;m Camera use and care.
Contact:English et al. and AIMS LTMP: Hugh Sweatman, [email protected]: Dr Paul Jokiel, [email protected]
FKNMS: John Ogden, [email protected]
Reference: m English et al.: English et al. (1997);m www.gcrmn.org, www.aims.gov.aum AIMS LTMP: Page et al. (2001); www.aims.gov.au/pages/research/reef-monitoring/ltm/mon-sop7/sop7-2001a.
html. m CRAMP: cramp.wcc.hawaii.edu/Overview/3._Methods/3._Site_Survey_Protocol/Benthic_Monitoring/3._
video_transects/default.asp;m FKNMS: John Ogden, [email protected], www.fknms.nos.noaa.gov/research_monitoring/zpr98.html;m Also see: Virgin Islands U.S. Geological Survey, Biological Resources Division: www.cpacc.org/c5wn.html.
This manual gives good step-wise details on camera care, software and data analysis;m Other references on video monitoring: Carleton and Done (1995); Tomkins et al. (1999).
Ben
thic
com
mun
ities

41
VISUAL QUADRAT
Major programs using this method:m Commission de l’Ocean Indien (COI);m Atlantic and Gulf Rapid Reef Assessment (AGRRA).
Method description:Involves random set quadrats. and the observer estimates percentage cover of categories of benthic communities and coral recruits.
Information obtained:Percent cover estimation.
Field personnel:m 1 boat driver/surface watch;m 2 observers (scuba divers).
Lab personnel:m Data analysis, interpretation and reporting.
Example 1: COI method Equipment required:m 1 m2 PVC quadrat divided into 25 cm squares;m Transect tape.
General procedures:m Place a quadrat on the benthos at random intervals along the LIT transect tape (‘English et al. p 33);m Count the life forms (percentage cover of various benthic communities, coral recruits and key macro-
invertebrates) within the quadrat, making separate estimates for each 25 cm square (to make location and counting organisms easier), then total the results for each 1 m2 quadrat;
m Repeat for 8 replicates;m Note the location of the quadrat along each transect for repeated monitoring of coral colonies.
Example 2: AGRRA method (algal survey)Equipment required:m 10 m transect line marked at 1, 3, 5, 7 and 9 m intervals;m Plastic ruler;m A 25 cm2 quadrat.
General procedures:m Use the same transect as the AGRRA coral assessment. Following the coral survey, re-swim the transect
with the 25 x 25 cm quadrat to estimate relative algal abundance (at 1,3, 5, 7 and 9 m). Place the quadrat every 2 meters directly below the transect line starting at 1 m. If a suitable area is not available at this mark, the quadrat should be placed within a 1 m radius. If this is not possible, go to the next 2 m mark. A suitable place should have greater than 80% of the area covered by algae and no more than 20% of other benthic cover. A minimum of 5 quadrats should be measured along each 10 m transect;
m For each quadrat, record the following:l Substrate type;l An estimation of percent abundance of crustose coralline algae;l An estimation of percent abundance of living fl eshy macroalgae;l Measure approximate the average canopy height of fl eshy and calcareous macroalgae in the
quadrat (cm);l An estimation of percent abundance of living calcareous macroalgae;l Count and record the number of all small stony corals. Identify to genus level if possible;l Within a 1 m radius at 1, 5 and 9 m intervals along the transect, measure maximum reef relief as
the difference between the highest and lowest point;l Repeat for at least 30 quadrats per site.
Advantages:m Cost effective;m Less likely to overlook small, rare or cryptic species in small quadrats;m Detailed information on algae type and abundance.
Parameters that can be surveyed Parameters that can be surveyed using this method:using this method:
✓ Benthic communitiesBenthic communities✓ InvertebratesInvertebrates
Monitoring level:Monitoring level:✓ ManagementManagement✓ ResearchResearch
Scale:Scale:✓ FineFine
Level of detail:Level of detail:✓ QuantitativeQuantitative
Causes damage to the reef?Causes damage to the reef?✓ Potential for some damagePotential for some damage
Achievable precision:Achievable precision:✓ Medium to highMedium to high
Ben
thic
com
mun
ities

42
Limitations:m Time consuming;m Estimations can vary between observers. We recommend standard training for all observers but precision is
still not as high as point quadrats which have less human error. Also see ‘English et al. photo quadrat’ p 43.
Training required:m Calibration of identification and estimation skills.
Contact:COI: Secrétariat Général, [email protected]: Robert Ginsburg, [email protected]
Reference:COI: coi.intnet.mu/; Conand et al. (1999); Conand et al. (2000);AGRRA: http://www.coral.aoml.noaa.gov/agra/
Ben
thic
com
mun
ities

43
PERMANENT PHOTO QUADRAT
Major programs using this method:m GCRMN; English et al.;m FKNMS; ‘coral recruitment’.
Method description:This involves taking still photographs of a fi xed quadrat that are analysed in the lab. This method is useful to determine temporal change in shallow macrobenthos communities. Permanent photo-quadrats complement LIT and are suitable for small-scale questions and to follow the fate of individual colonies. For use of permanent photo quadrats to monitor coral recruitment.
Information obtained:Detailed temporal change can be determined for individual corals for:m Biological condition;m Growth;m Mortality;m Recruitment;m Data can be used to estimate percent cover, species
diversity, relative abundance, density and size.
Percentage cover of target organisms can be determined in the lab by either point sample methods by placing a grid over the quadrat or by digitising the image (digitising is more expensive, time-consuming, requires special software and expertise). Precision depends on apparatus used and ability to take photo from exactly the same spot as well as observer differences for analysis. If observers train together, precision can be reasonable.
Equipment required:m Permanent quadrat markers (e.g. stainless steel stakes; see ‘how do you mark permanent sites’ p 33);m Portable quadrat 1 m2 divided by string to 16 equal squares;m Flexible architect’s ruler and callipers;m Digital camera with a 15 mm lens, fl ash or strobe, and underwater housing;m Stable tetrapod frame to hold the camera a fi xed distance (0.8 m) from the bottom;m Tags to label the coral;m Cable ties to attach the tags.
Field personnel:m 2 observers (scuba divers)m 1 boat driver/surface watch
Lab personnel:m Experience in coral taxonomy;m Data entry, analysis, interpretation and reporting.
General procedures:m Mark the position of a 2 m2 quadrat with steel rods hammered deep into the substratum;m Divide marked site in 4 x 1 m2 sections.
Repeat the following every 6 months:m Securely tag a selection of coral colonies within each 1 m2 section of the quadrat to allow individual
identifi cation for temporal monitoring;m Draw a detailed map of the type, position and size of the colonies in each section and record the position of
the tagged colonies;m Measure the length and width of the tagged colonies;m Measure the maximum length and width of the live non-branching corals;m Tag the individual branches that are measured on branching corals;m Secure the camera on the tetrapod at right angles to the substratum;m The tetrapod frame should cover a 1 m2 area. Four photographs are taken per quadrat. Reduce the
photograph frame size in poor visibility.
Monitoring level:Monitoring level:✓ ResearchResearch
Scale:Scale:✓ FineFine
Level of detail:Level of detail:✓ QuantitativeQuantitative
Causes damage to the reef?Causes damage to the reef?✓ Potential for some damagePotential for some damage
Achievable precision:Achievable precision:✓ HighHigh
Ben
thic
com
mun
ities

44
Advantages:m Detailed and careful observation, photography and mapping provide a good record of temporal change;m Fixed photo quadrats provide the highest statistical power (as compared to visual quadrats or video
transects) for the least effort;m Permanent record. Photos can also be used as qualitative information to support the information presented in
graphs;m Good for small-scale questions;m Field work can be done by non-specialists.
Limitations:m Time-intensive;m Requires specific computer software;m Equipment intensive and expensive to buy and maintain;m Cumbersome equipment, especially in currents;m The reef may get damaged in areas with delicate coral forms;m Relatively flat areas are required for photography;m Only small areas are examined which makes inference on general reef condition difficult;m Curved images between the photo quadrat edges makes it difficult to join them together;m Does not take into account the rugosity or uneven surface of many coral reefs (Chain intercept transect’, p
54; PIT MBRS SMP p 36);m Cannot be used to measure spatial relief;m Data are only obtained for the projected surface area;m Unsuited to areas with large or abundant soft corals that conceal other species;m Measurements cannot be determined until the photographs have been digitised or analysed using point
sampling.
Training required:m Methods training; m Experienced personnel with tertiary qualifications necessary for data analysis.
Contact:Sue English, [email protected]
Reference: English et al. (1997);FKNMS CRMP: www.fknms.nos.noaa.gov/research_monitoring/zpr98.html
Ben
thic
com
mun
ities

45
CORAL HEALTH GENERAL OBSER VATIONS
Programs that use this method:m Reef Condition Monitoring Program (RECON) – The Ocean Conservancy
Method description:Volunteer coral reef assessment program for recreational divers. The data provide information on hard coral health as an early warning system
Equipment required:m Underwater slate with ruler attached and data sheet;m 10 m survey line for algae survey.
Field personnel:m 2 observers (scuba divers);m 1 boat driver/surface watch.
Lab personnel:m Data entry, analysis, interpretation and reporting done by
RECON coordinator
General procedures:Coral healthm Swim to pre-established RECON survey site;m Swim 4 kick cycles in a direction that will maintain the
desired depth for the survey site (selected between 3 and 18 m);m Stop at the closest colony of pre-selected coral and ensure
it is at least 25 cm long when viewed from above with some live polyps and distinct borders;
m Measure the maximum projected length and width of the colony in cm;
m Estimate the percent of dead coal and the percent of bleached coral;m Note physical damage or disease;m Count any coral recruits, Diadema, conch or lobsters;m Repeat until you have surveyed 10 colonies or when a maximum of 1/2 the bottom dive time or 1/2 your air
supply used.
Reef algaem Make 8 kick cycles; m Unreel the 10 m survey line;m Estimate horizontal visibility;m Use the ruler to estimate the amount of line that lies over mud or sand patches, live stony corals and macro
algae;m Return along the 10 m line and survey a 2 m belt and estimate abundance of turf algae, cyanobacteria,
macroalgae and coralline algae;m Note the presence of disease and bleaching; m Note presence of Diadema, lobster, conch, megafauna;m Note human physical damage, e.g. anchor damage, fi sh traps or nets etc.
Advantages:m Recreational divers with minimal training;m Can be performed as a part of a recreational dive;m Very basic.
Limitations:m Low precision.
Training required:m Completion of RECON course.
Contact: [email protected] www.oceanconservancy.org/dynamic/getInvolved/events/coral/coral.htm
Parameters that can be surveyed Parameters that can be surveyed using this method:using this method:
✓ Benthic communitiesBenthic communities✓ InvertebratesInvertebrates
ScaleScale✓ BroadBroad
Monitoring level:Monitoring level:✓ CommunityCommunity
Level of detail:Level of detail:✓ QualitativeQualitative
Information obtained:Information obtained:✓ Description of hard coral Description of hard coral
healthhealth
Causes damage to the reef?Causes damage to the reef?✓ NoNo
Achievable precision:Achievable precision:✓ LowLow B
enth
ic c
omm
uniti
es

46
BLEACHING GENERAL OBSER VATIONS
Programs that use this method:m Great Barrier Reef Marine Park Authority BleachWatch Program;m Coral Watch.
Great Barrier Reef Marine Park Authority BleachWatch ProgramMethod description:This involves divers estimating the extent of coral bleaching during a random swim of a site. Useful to determine the extent and severity of bleaching over a wide area.
Information obtained:Estimations of bleaching and the growth form (shape) and family (if known) of corals affected.
Equipment required:No special equipment
Field personnel:m 2 observers (scuba divers);m 1 boat driver/surface watch.
Lab personnel:m Data entry, analysis, interpretation and reporting.
General procedures:m Record estimates of the amount of hard coral at a site
using the same categories as the manta tow (p 22);m Estimate the amount of hard coral that is bleached
using the same categories;m Record water temperature;m Record the 3 most prevalent coral growth forms at
the site and which were bleached;m Record the bleached coral families (if known);m Record the minimum and maximum depth limits of
the corals and any other comments.
Advantages:m Recreational divers as well as professionals can do
this while on a recreational or other survey dive;m Quick and easy to do;m Large areas can be covered by using a wide range of data collectors.
Limitations:m Low precision.
Training required:m None.
Contact:Jessica Hoey, [email protected]
Reference:www.gbrmpa.gov.au/corp_site/info_services/science/bleaching/bleach_watch.html‘Bleaching belt transect’ is an example of how BleachWatch fi ts in a coral bleaching monitoring program (p 47).
Coral WatchCoral Watch has developed the Coral Health ChartTM, to monitor the health of corals around the world using scientists and the public. Observers match the colour on the charts with the coral to determine an index of health. For more information see www.vthrc.uq.edu.au/ecovis/CurrentRes.html#Prawns or contact Justin Marshall, [email protected]
Parameters that can be surveyed Parameters that can be surveyed using this method:using this method:
✓ Benthic communitiesBenthic communities
Scale:Scale:✓ BroadBroad
Monitoring level:Monitoring level:✓ CommunityCommunity✓ ManagementManagement
Level of detail:Level of detail:✓ QualitativeQualitative✓ Semi-quantitativeSemi-quantitative
Causes damage to the reef?Causes damage to the reef?✓ NoNo
Achievable precision:Achievable precision:✓ LowLow
Ben
thic
com
mun
ities

47
BLEACHING BELT TRANSECT
Programs that use this method:m Great Barrier Reef Marine Park Authority Coral Bleaching Response Program (GBRMPA CBRP); m This program has been modifi ed for international use by WWF/ReefBase/GBRMPA.
GBRMPA CBRP methodMethod description:This is a 2-tier monitoring program to assess the spatial extent and severity of coral bleaching and determine the direct ecological impacts (coral mortality) from bleaching. The fi rst tier is a broad-scale aerial survey to obtain a overview of where bleaching is occurring over spatial scales relevant to management (on the GBR this is hundreds to thousands of kilometres). For smaller reefs, random swims (p 26) or manta tow (p 22) can be used for the broad scale survey.
Confi rmation of extensive bleaching from aerial surveys triggers the second tier of the monitoring program: fi ne-scale ecological impact assessment (below). This involves rapid visual assessment (RVA), which records observations on the condition of corals and other benthos; and more detailed video transect methods. If video is not available, line intercept transects (LIT; p 33) or point intercept transects (PIT; p 36) can be used.
Information obtained:Percentage and types of corals that bleach, and then subsequently die or survive. Percent cover estimations follow manta tow method (p 22). Bleaching is categorised in the table below.
RVA site assessment:Reef zone and exposure. Percent benthic community cover: live hard coral; live soft coral; algae; dead coral (pre-bleaching); bleached corals; degree of bleaching; evidence of coral disease; COTS scars etc.; evidence of bleaching in other organisms, e.g. clams.
Percent cover, proportion bleached (percentage of population) and degree of bleaching (bleaching categories below) of:m Pocillopora;m Acropora (branching);m Acropora (plate);m Monitpora;m Porites (massive);m Favia;m Soft corals.
Site bleaching categories (for the RVA).
Index Percent Description Visual assessment
0 <1 No bleachingNo bleaching observed, or only very occasional, scattered bleached colonies (1 or 2 per dive)
1 1-10 Low or mild bleachingBleached colonies seen occasionally and conspicuous; vast majority of colonies not bleached
2 10-50 Moderate bleaching Bleached colonies frequent but less than half of all colonies
3 50-90 High bleaching Bleaching very frequent and conspicuous, most corals bleached
4 >90 Extreme bleachingBleaching dominates the landscape, unbleached colonies not common. The whole reef looks white
Ben
thic
com
mun
ities
Parameters that can be surveyed Parameters that can be surveyed using this method:using this method:
✓ Physical parametersPhysical parameters✓ Benthic communitiesBenthic communities
Scale:Scale:✓ MediumMedium
Monitoring level:Monitoring level:✓ ManagementManagement✓ ResearchResearch
Level of detail:Level of detail:✓ QuantitativeQuantitative
Causes damage to the reef?Causes damage to the reef?✓ NoNo
Achievable precisionAchievable precision✓ HighHigh

48
Colony bleaching (for use in LIT, PIT or video transect).
Category Description
0 No bleaching evident
1 Partially bleached (surface/tips) or pale but not white
2 White
3 Bleached and partly dead
4 Recently dead
Over the long-term, this program will enable the direction and rate of benthic community recovery to be evaluated.
Equipment required:m 50 m tape measure;m Video equipment.
Field personnel:m 2 observers (scuba divers);m 1 boat driver/surface watch.
Lab personnel:m Data entry, analysis, interpretation and reporting.
General procedures:m Lay 4 x 50 m transects (haphazard) at 3 separate reefs at 2 depth zones: reef crest and upper slope (1 – 4 m)
and lower reef slope (5-10 m). Survey shallow depths where water is turbid, or reef development is poor; survey deeper sites if water is clear;
m Two divers swim along the transect, 1 doing a RVA and the other doing a video transect;m The RVA involves recording 3 sets of information along a 5 m belt transect: station information; percent cover
of coral and bleaching category; and detailed information for selected coral groups;m The video transect is held 40 cm above the substrate at a speed of 10 m per minute (video transect, p 38).
Advantages:m The 2-tier design enables broad and medium-scale information to be collected by one diver pair;m RVA is easy and cost effective to do;m Video provides a permanent record.
Limitations:m See ‘video transects’ (p 38);
Training required:m Percentage estimations and coral identification.
Contact:Paul Marshall, [email protected]
References:GBRMPA Coral Bleaching Response Program (CBRP): www.gbrmpa.gov.au/corp_site/info_services/science/bleaching/response_program.htmlThe Great Barrier Reef Marine Park Authority/ReefBase/World Wide Fund for Nature have developed a Global Bleaching Survey Program, which is a modification of the GBRMPA CBRP for international use. See ‘timed swim’ p 31 and www.reefbase.org for details.
For further information on how to respond to and monitor coral bleaching see Marshall and Schuttenberg (2004).
Ben
thic
com
mun
ities

49
DISEASE BELT TRANSECT
Programs that use this method:m Caribbean Coastal Marine Productivity Program (CARICOMP) – Coral communities – Coral-Octocoral Disease
Survey – Protocol Level 1 and 2;m Australian Institute of Marine Science Long-term Monitoring Program.
CARICOMP methodMethod description:This method will work with many different sampling methods to include:m Quadrats (fi ne scale; p 41);m Chain transects (medium scale; p 54);m Belt transects (medium scale; p 64);
We describe its use with a belt transect.
Information obtained:m Percentage of healthy and non-healthy hard and soft
(octocoral) corals;m Description of health and coral identifi cation.
Equipment required:Level 1:m Standard disease ID cards (developed by Bruckner
et al.);m Transect belt measuring device, e.g. PVC pole or
string.
Level 2:m Stakes for permanent markers;m 1 m long PVC pipe that is marked in cm.
Field personnel:m 2 observers (scuba divers);m 1 boat driver/surface watch.
Lab personnel:m Data entry, analysis, interpretation and reporting.
General procedures:Level 1m Standard disease ID cards in Spanish and English are available to identify disease and mortality in the
Caribbean; m Lay 10 x 10 m long transects using a chain at each locality and survey along a 2 m wide belt transect;m Count and categorise all hard and soft colonies within the belt as healthy, or un-healthy. A non-healthy colony
is put into one of three categories: bleached; injured; or diseased. The diseases must be further categorised;m Corals should be identifi ed to species if possible, genus at minimum as well as recording the growth form and
soft corals should be categorised into growth forms.
Level 2m Select a minimum of 2 sites that are at least 5 km apart. Preferably one near and the other far from
anthropogenic impact areas;m Conduct a preliminary qualitative survey to determine levels of disease and distribution within the 2 site
areas;m At each of 3 depth intervals (0 – 5 m, 6 – 15 m and 16 – 30 m if suffi cient reef slope) set up a minimum of 3 x
20 m permanent belt transects 2 m wide. These transects should be separated by a minimum of 10 m;m Use the PVC pipe to judge the distance either side of the line. Conduct the survey as in protocol level 1.
Measure the surface area of diseased colonies of hard coral and Goniopora spp.; m Identifi cation of colonies should be to growth form (shape), genus and species level if possible.
Ben
thic
com
mun
ities
Parameters that can be surveyed Parameters that can be surveyed using this method:using this method:
✓ Benthic communitiesBenthic communities✓ InvertebratesInvertebrates
Scale:Scale:✓ MediumMedium
Monitoring level:Monitoring level:✓ ManagementManagement
Level of detail:Level of detail:✓ Quantitative Quantitative
Causes damage to the reef?Causes damage to the reef?✓ Potential for some damagePotential for some damage
Achievable precision:Achievable precision:✓ MediumMedium

50
Advantages:m Using a belt transect enables more area to be searched per shorter transect distance. This is advantageous if
the reef is patchy or small;m Permanent belt transects enable more precise estimates of temporal change (‘permanent or fixed sites’, p 13).
Limitations:m It can be difficult to carry PVC poles and write at the same time – especially in currents;m Permanent transects can be difficult to re-locate (‘permanent or fixed sites’ p 13).
Training required:m Survey methods and coral identification.
Contact:Dulcie Linton, [email protected]; John Ogden, [email protected]
Reference:For a copy of the manual see: www.ccdc.org.jm/caricomp_main.html
Timed swimPrograms that use this method:m Australian Institute of Marine Science Long-term monitoring program (AIMS LTMP);m A full description and variation of timed swim for bleaching surveys and blast fishing surveys is on p 31
Method description:This involves 3 divers randomly swimming along a specific depth contour and recording incidences of coral disease, bleaching and predation. This is a medium scale survey conducted at non-permanent monitoring sites in conjunction with the broad scale manta tow technique to assess coral reef health.
General procedures:m Each reef is manta towed to select sites for the presence of disease, feeding scars and COTS. Sites noted
during the manta tow are marked with a buoy and the position recorded using a GPS. Divers should search 3 to 6 sites if possible on a reef;
m Ideally 3 divers each swim parallel to the reef slope along 3 separate depth contours (4 m, 8 m and 12 m). This will depend on the topography of the reef slope; if the slope is less than 12 m, divers should swim parallel to each other, 4 m apart covering the maximum practicable depth range between the crest and the base of the reef slope;
m Each diver swims for 20 minutes and scans approximately 1 m either side of the swim path looking for evidence of coral mortality. Areas of recently dead coral should be examined to determine the cause of mortality, and observations are recorded on the data sheet.
Contact:Hugh Sweatman, [email protected]
Reference:Bass and Miller (1998); www.aims.gov.au
The Commission de l’Ocean Indien (p 104) use a variation of this technique with 5 minute swims for coral cover and general reef health.
Ben
thic
com
mun
ities

51
LINE TRANSECT (BLEACHING, DISEASE)
Programs that use this method:m Atlantic and Gulf Rapid Reef Assessment (AGRRA) – Coral condition, algae and Diadema;m Mesoamerican Barrier Reef System – Synoptic Monitoring Program (MBRS SMP) – used with the MBRS
SMP point intercept transect.
The combination of quadrats and LIT provide percentage cover and coral health information of benthic communities. AGRRA combine this method with algae quadrats and Diadema abundance (p 51 and p 68). This method can also be used to detect bleaching during mass bleaching events.
Information obtained:High taxonomic detail (can be simplifi ed). Coral health is described for corals identifi ed by species and size. Coral condition is defi ned as the ratio of living, recently killed and long dead coral. Severity of bleaching in mass bleaching events is graded using the following categories: m P - Pale (discoloration of coral tissue);m PB - Partly bleached (patches of fully bleached or white tissue);m BL - Bleached (tissue is totally white, no zooxanthellae visible).
Type of disease m BB - Black band;m WB - White band;m WS - White spots, patches or pox;m WP - White plague;m YB - Yellow blotch (sometimes called yellow band);m RB - Red band;m UK – Unknown.
Quantifi cation of the extent of damage to corals related to the size of the colony provides information on likely recovery. Small colonies either have no mortality or total mortality, whereas larger coral are likely to survive partial mortality.
Equipment:Coral conditionm 10 m transect line marked at 1, 3, 5, 7 and 9 m
intervals;m 1 m long PVC stick or measuring tape marked in 10
cm intervals.
Field personnel:m 1 boat driver/surface watch;m 2 observers (scuba divers). One must have experience in using the method and the required level of coral
identifi cation.
Lab personnel:m Data entry, analysis, interpretation and reporting.
Example 1: AGRRA methodGeneral procedures for coral conditionm Haphazardly lay the 10 m line at each of 2 depths in the fore reef (1-5 m and 8-15 m) parallel to the reef;m To estimate live coral cover, swim along the transect line with the 1 m measuring stick and estimate how
many metres (to the nearest 10 cm) of line lies over living coral. Record the area of sand or rock patches;m Return to the start of the transect, swim along and stop at the fi rst coral head, cluster or thicket directly
under the line, which is at least 10 cm wide and in original growth position. For colonies that have been displaced, only assess ones that have reattached to the substratum or are too large to move. For each record the following:
l Genus (or species if possible);l Water depth at the top of the coral at the beginning and end of each transect. Where bottom
topography is very irregular, or the size of the individual coral is very variable, record the water depth at the top of each coral beneath the transect line at any major change in depth (> 1m);
Parameters that can be surveyed Parameters that can be surveyed using this method:using this method:
✓ Benthic communitiesBenthic communities✓ InvertebratesInvertebrates
Level of detail:Level of detail:✓ QuantitativeQuantitative
Causes damage to the reef:Causes damage to the reef:✓ Potential for some damage.Potential for some damage.
Achievable precision:Achievable precision:✓ HighHigh
Monitoring level:Monitoring level:✓ ResearchResearch✓ ManagementManagement
Ben
thic
com
mun
ities

52
l Measure the maximum projected colony diameter (live + dead areas) in plan view and maximum height to the nearest cm;
l Estimate the % of the colony that is recently dead (very recent, recent and older recent are combined together) and long dead;
l Scan the surviving parts of the entire colony and note any disease or bleaching. Characterise the diseases and severity of bleaching;
l Record any other sources of recent mortality that can be unambiguously identified;l While examining the coral head, count and record the number of territorial gardening damselfish or
the total number of damselfish algal gardens on each coral head;m Go to the next coral (over 10 cm wide) and repeat this process;m After you complete a transect, collect the line and haphazardly reset the next transect line, at least 1 m
laterally away from its previous position. Remember to avoid other lines, and whenever possible, abrupt changes in slope, large areas of sand and rubble, and any other unusual reef features. Try to ensure that the transects are distributed around the site, not concentrated together.
m Repeat the above steps for each transect.
You can continue to reset transects in new positions until you survey a minimum of 6 transects per site. However, a bare minimum of 50 coral heads (and 30 algae quadrats, see AGGRA manual for details) should be assessed at each site. Appropriate sample sizes will depend on the variance in the local habitats, so we cannot prescribe ‘a one size fits all protocol’.
Example 2: MBRS SMP methodGeneral procedures:m Following the point intercept survey, swim back along the transect and stop at the first coral head, cluster or
thicket directly beneath the transect line, least 10cm in diameter in original growth position. If it has been displaced, only assess reattached corals. For each coral surveyed, record the following:
l Genus (or species if possible);l Depth at the top of the colony at the beginning and end of each transect or for each coral colony
recorded where topography is irregular and creates a depth change of > 1 m;l Measure to the nearest cm the maximum colony projected diameter (live + dead areas), in plan view
and maximum height;l Estimate the % of the colony that is recently (very recent, recent and older recent) and long dead;l Scan the surviving portions of the entire colony and note any diseases or bleaching. Characterise the
diseases;l Record any other sources of recent mortality that can be unambiguously identified;
m Go to the next colony and repeat the process. The SMP requires a minimum sample of 50 colonies per site.
Advantages:m Quantitative assessment of coral colonies showing recent mortality, which also provides colony size. This is
useful because larger colonies are usually more able to survive partial mortality than smaller ones, therefore, this method can calculate size–frequency distributions as well as size related-size mortality patterns.
Limitations:m Individual coral descriptions are time consuming and require expertise.
Training required:m Taxonomic identification and calibration between observers.
Contact:AGRRA: Robert Ginsburg, [email protected] SMP: Alejandro Arrivillaga, [email protected] or [email protected]
Reference:AGRRA: www.coral.aoml.noaa.gov/agra/MBRS SMP: Almada-Villela et al. (2003a); http://www.mbrs.org.bz
Ben
thic
com
mun
ities

53
TAGGING CORAL COLONIES
Programs that use this method:m GCRMN (English et al.)
Method description:Monitoring of tagged colonies is an excellent way to precisely measure mortality or recovery after bleaching and for examining issues such as susceptibility of bleached colonies to disease or subsequent bleaching.
Information obtained:Specifi c to individual colonies.
Equipment required:m Plastic tags, such as cow tags that are numbered for identifi cation;m Cable ties or plastic coated wire for attaching tags to branching colonies;m Galvanised roofi ng nails for attaching tags to massive colonies.
Field personnel:m 2 observers (scuba divers);m 1 boat driver/surface watch.
Lab personnel:m Data entry, analysis, interpretation and reporting.
General procedures:m Tag 2—50 colonies for each species of interest.
Select colonies from a range of sizes;m For bleaching studies, select species from the most
abundant families (Pocilloporidae, Acroporidae, Faviidae, Poritidae for the Indo-Pacifi c);
m Once per year measure the length, height and width as well as its condition, such as bleaching, disease and other damage;
m Map the area in which the tagged colonies are found to assist fi nding them again for future surveys.
Advantages:m Provides size frequency data on a number of
colonies;m Monitoring a colony from the onset of bleaching
to mortality or full recovery provides the best measure of mortality that can be unambiguously related to bleaching;
m Investigation of coral adaptation to bleaching. This is the relationship between the severity of coral bleaching and subsequent mortality/recovery, or the susceptibility of coral which have previously bleached and recovered in subsequent years;
m Time-series studies of physiological aspects of bleaching or disease.
Limitations:m Time consuming;m Can be diffi cult to relocate colonies if not clearly marked.
Training required:m Coral identifi cation.
Reference:English et al. (1997)www.aims.gov.au; www.gcrmn.orgFor other similar methods see: Rogers et al. (1994).For the radial arc transect method contact Deborah Santavy, [email protected]; Santavy et al. (2001).
For further information on disease see: Bruckner (2002); www.icriforum.org/docs/man_priorities_coral_diseases.pdfwww.coral.noaa.gov/coral_disease/cdhc.shtml
Parameters that can be surveyed Parameters that can be surveyed using this methodusing this method
✓ Benthic communitiesBenthic communities
Monitoring level:Monitoring level:✓ ResearchResearch✓ Management Management
Scale:Scale:✓ FineFine
Level of detail:Level of detail:✓ QuantitativeQuantitative
Causes damage to the reef?Causes damage to the reef?✓ Potential for some damage.Potential for some damage.
Achievable precision:Achievable precision:✓ HighHigh
Ben
thic
com
mun
ities

54
CHAIN INTERCEPT TRANSECT
Programs that use this method:m Caribbean Coastal Marine Productivity Program (CARICOMP) – coral communities methods.
Method description:The use of chains to implement an LIT provides information on rugosity as well as percent cover.
Information obtained:m Percentage cover (growth form and genus or species level depending on the skill of the observers);m Spatial index.
Equipment required:m 2 x 30 m tape measure;m 1 x 10 m line marked at 1 m intervals;m 2 x nylon line, 12 m-long;m 1 x light chain with 1 cm link size and marked every 10
links;m 20 x stakes;m 100 nails;m 1 x 2 kg hammer;m 4 x star drills;m 1 x underwater compass;m 1 x 1 m rod.
Field personnel:m 1 boat driver m 2 observers (scuba divers). One must be experienced with
this method.
Lab personnel:m Data entry, analysis, interpretation and reporting.
General procedures:Coral reef community line intercept transectm Lay 5 x permanently marked 10 m transects at 10 m depth at each of 2 areas of reef;m Lay out a taught nylon line between stakes marking the start and end points of the transects. Lay out the
chain so that it follows the contour of the reef. Hammer 2-3 inch nails at 1 m intervals along the chain to mark the position of the chain for future reference;
m Note the substratum and benthos at start and end points (by link number) along the transect. If a 2-3 m chain is used, re-deploy it as you move along the transect;
m Calculate the rugosity (length of chain used per 10 m transect).
Gorgonian surveym Lay a tape measure along each 10 m transect and count and record the holdfast position of gorgonians whose
branches or fronds cross above or below the transect line with the normal surge conditions on the reef.
Advantages:m LIT and PIT give the best estimates of percent coral cover and diversity;m Use of the chain enables rugosity or ‘spatial index’ of the reef, which is the ratio of reef surface contour
distance to linear distance. As part of a long-term monitoring program, the spatial index provide a way to quantify changes in the structural complexity of the reef;
m Provides better estimates of live coral cover in shallow areas where tops of coral may be dead and counted as dead coral for LIT or PIT methods (p 33 and 36), otherwise CIT, LIT and PIT have been shown to provide comparable estimates of benthic cover (Rogers and Miller 1999);
m Information on the size of coral colonies is obtained. This is useful as an indicator of the stability of a coral community. A large average size indicates no recent disturbance, a small average size indicates recent disturbance and recolonisation (Meesters et al. 1996).
Parameters that can be surveyed Parameters that can be surveyed using this method:using this method:
✓ Benthic communitiesBenthic communities
ScaleScale::✓ MediumMedium
Monitoring level:Monitoring level:✓ ManagementManagement
Level of detail:Level of detail:✓ QuantitativeQuantitative
Causes damage to the reef?Causes damage to the reef?✓ Potential for some damagePotential for some damage
Ben
thic
com
mun
ities

55
Limitations:m Equipment intense;m Even well-trained divers find it difficult to avoid causing some damage especially in areas with branching
corals;m Must be done by specially trained divers;m Cannot be used to directly measure species density or colony size;m Not suited to areas where stony corals are widely spaced and small;m Impossible in areas dominated by delicate branching corals;m Tedious and time consuming. It is not unusual to spend over an hour on a 10 m transect;m It is impossible to position the chain in exactly the same location each time.
Training required:m Must be done by observers who are trained in the method
Contact:Dulcie Linton, [email protected] Ogden, [email protected]
Reference:For a copy of the manual see www.ccdc.org.jm/caricomp_main.html
Also see: CRAMP: cramp.wcc.hawaii.edu and Rogers et al. (1994) for similar chain intercept methods and Tim Mcclanahan at the Wildlife Conservation Society East Africa, [email protected], for the line transect method (www.wcs.org).
Chainintercepttransect
Lineintercepttransect
Pointintercepttransect
(a) (b) (c)Tapemeasure
Platehard coral
Sand Sand
Branchinghard coral
Boldercoral
Branchinghard coral
Platehard coral
Branchinghard coral
Boldercoral
Branchinghard coral
Ben
thic
com
mun
ities
Figure 4. A comparison of point intercept transect (PIT), line intercept transect (LIT) and chain intercept transect (CIT) on the same area of coral reef. PIT records objects under set points on the tape measure; LIT
records the width of every object under the tape by noting the length where there is a change; and LIT records the number of chain links covering each object (or substrate type).

56
CORAL RECRUITMENT TILES
Major programs using this method:m GCRMN (English et al.);m Meso-American Barrier Reef System – Synoptic Monitoring Program (MBRS SMP).
Example 1. English et al.Method description:This involves placing frames of ceramic tiles onto the reef. These tiles are collected and newly settled coral recruits are identifi ed.
Information obtained:Abundance of new corals (identifi ed to species or genus where possible) settling on the reef. Detail is less than the MBRS SMP method because it is diffi cult to identify all coral species or families.
Equipment required:m Labelled, unglazed terracotta, fl at tiles which are uniform
on each surface; each approximately 12 cm2 and 1 cm thick;m Racks of wire mesh to hold tiles;m Stainless steel wire or cable ties to attach tiles to racks;m Binocular dissecting microscope.
Field personnel:m Minimum of 2 experienced scuba divers (more may be
required for heavy frames and tiles); m 1 boat driver/surface watch.
Lab personnel:m Observers trained by people experienced in monitoring coral
recruitment;m Data entry, analysis, interpretation and reporting.
General procedures:m Attach the racks securely to the bottom at 5 m depth.
Avoid sand and rubble areas;m Position racks so the tiles are inclined at 45° with the top facing the predominant swell or current;m Attach 2-4 tiles to each rack approximately 20 cm above the bottom;m 20-30 tiles are recommended for each site and each rack should be 0.5 to 1 m apart from other racks;m Tiles must be labelled with an identifi cation number prior to deployment and the location must be recorded;m Tiles must be collected carefully and transported so that the surfaces do not rub;m At the lab, tiles must be washed, dried in the sun and stored.
Advantages:m Sampling of newly settled coral larvae using tiles reduces the effect of post-settlement mortality on observed
recruitment;m Racks to hold settlement plates are more easily relocated;m Attachment and removal of plates onto racks is easier and quicker.
Limitations:m Identifi cation of juvenile coral to species level is diffi cult and sometimes not possible;m Expensive and time consuming;m Cumbersome equipment.
Training required:m Lab identifi cation experience.
Parameters that can be surveyed Parameters that can be surveyed using this method:using this method:
✓ Benthic communitiesBenthic communities
Monitoring level:Monitoring level:✓ ManagementManagement✓ ResearchResearch
Scale:Scale:✓ FineFine
Level of detail:Level of detail:✓ QuantitativeQuantitative✓ DetailedDetailed
Causes damage to the reef?Causes damage to the reef?✓ Potential for some damage Potential for some damage
Achievable precision:Achievable precision:✓ HighHigh
Ben
thic
com
mun
ities

57
Contact:Clive Wilkinson, [email protected]
Reference:English et al. (1997); www.aims.gov.au, www.gcrmn.orgFor other references for recruitment methods see Rogers et al. (1994).
Example 2. MBRS SMP methodMethod description:This involves placing terracotta plates onto the coral reef. These plates are collected throughout the year, with coral recruits settled on them identified. This method forms part of category 2 for MBRS SMP. It is recommended that this level be conducted 4 times per year at high priority monitoring sites.
Information obtained:Abundance of newly settled coral recruits. These can be identified to species level for some, but not all, species.
Equipment required:m 100 (10 x 10 cm, and 1 cm thick) unglazed, individually numbered terracotta tiles with 50 at each depth per
site;m Pneumatic drill running off a scuba tank, with approx 4 cm masonry bit;m Plastic wall anchors which are ~4 cm x 2 cm PVC plate that will hold ~5 mm screws. Into the wall anchor,
screw a ~5 cm stainless steel hex-head bolt. The bolt with a flat and lock washer goes through a ~5 mm hole drilled into the plate. Below the plate, there should be a 1 cm long piece of ~12 mm PVC pipe;
m Plastic trays;m Dissecting microscope.
Field and lab personnel:See English et al. method
General procedures:m Mount 50 tiles onto the wall anchors at each depth (2 and 10m) at the fore reef;m Tiles should be placed 6 months prior to the main spawning event and collected soon after.
Advantages:m Sampling of newly settled coral larvae using tiles will minimise the effect of post-settlement mortality on
observed recruitment;m Tiles mounted on base plates leaves the places affixed horizontally with a distinct upper surface that mimics
the upper surface of the reef and an under-surface (separated from the base plate by spacers) that mimics cryptic space.
Limitations:m Identification of juvenile coral to species level is difficult;m Expensive and time consuming;m Cumbersome equipment.
Training required:m Experienced divers;m Lab identification experience.
Contact:Alejandro Arrivillaga, [email protected] or [email protected]
Reference:Almada-Villela et al. (2003a); www.mbrs.org.bz
Ben
thic
com
mun
ities

58
CORAL RECRUITMENT QUADRATS
Major programs using this method:Atlantic and Gulf Rapid Reef Assessment (AGRRA);Florida Keys National Marine Sanctuary Coral Reef Monitoring Program (FKNMS CRMP).
Method description:The AGRRA method involves searching for new coral recruits within quadrats. The FKNMS CRMP method photographs the quadrats to map coral recruits in the lab. See quadrats p 41, and permanent photo quadrats p 43.Information obtained:Abundance and identification of coral recruits. The level of detail collected is dependent upon personnel capacity.
Equipment required:m AGRRA uses 25 x 25 cm quadrat;m FKNMS CRMP uses 90 x 70 cm quadrats (‘quadrats’ p 19
for how to make them); and still camera equipment (English et al. permanent photo quadrat p 43).
Field personnel:m 1 boat driver/surface watch; m 2 observers (scuba divers). One must be experienced in the
method.
Lab personnel:m Data entry, analysis, interpretation and reporting.
General procedures:AGRRA methodm Following the benthic survey, swim in a haphazard fashion
around the reef and place the quadrat on the substratum in areas lacking large (>25 cm diameter) sessile invertebrates;
m Count all small (maximum diameter 2 cm) stony corals within the quadrat. Record to genus if possible;
m Repeat 80 times.
FKNMS CRMP methodm Photograph 16 permanent quadrats beside the 30 m transect used for video monitoring method (p 38);m Photographs are digitised in the lab (p 20 on ‘photography and video in monitoring’).
Advantages:m No cumbersome tiles to set and collect;m Provides abundance estimates of recruits that have survived the first year, thus giving a more reliable
estimate of future coral species composition than recruitment tiles that look at newly settled recruits.
AGRRA methodsm Visual techniques are more reliable than photographic methods as recruits are cryptic (Edmunds et al. 1998).
FKNMS CRMP methodm Permanent record;m The survivorship of individual recruits can be followed.
Limitations:AGRRA methodm Experienced personnel with appropriate identification skills are necessary;m Time consuming in the field.
Monitoring level:✓ Management✓ Research
Scale:✓ Fine
Level of detail:✓ Quantitative
Causes damage to the reef?✓ Potential for some damage
Achievable precision:✓ HighB
enth
ic c
omm
uniti
es
59
FKNMS CRMP methodm Expensive equipment to buy and maintain;m Time consuming and expensive in the lab;m New recruits can be missed or difficult to identify from photographs.
Training required:m Proper training and good eyesight are essential.
Contact:AGRRA: Robert Ginsburg, [email protected] CRMP: John Ogden, [email protected]
Reference:AGRRA: www.coral.aoml.noaa.gov/agraFKNMS CRMP: www.fknms.nos.noaa.gov/research_monitoring/zpr98.html#contents
Ben
thic
com
mun
ities

60
Ben
thic
com
mun
ities
Tabl
e 4
. Sum
mar
y of
the
mai
n m
onit
orin
g m
etho
ds u
sed
in t
he C
arib
bean
and
Atl
anti
c fo
r be
nthi
c co
mm
unit
ies.
Mon
itor
ing
leve
lP
aram
eter
s m
easu
red
Met
hod
nam
eR
efer
ence
and
con
tact
Pag
e
Com
mun
ity
Bro
ad S
cale
Per
cent
alg
al
cove
r G
ener
al c
oral
hea
lth
- RE
CON
met
hods
RE
CON
, The
Oce
an C
onse
rvan
cy: w
ww
.oce
anco
nser
vanc
y.or
g/dy
nam
ic/g
etin
volv
ed/e
vent
s/co
ral/
cora
l.ht
ml
45
Gen
eral
cor
al
heal
th
Cora
l Wat
ch H
ealt
h Ch
art
Cora
l Wat
ch: w
ww
.vth
rc.u
q.ed
u.au
/eco
vis/
Curr
entR
es.h
tml#
Pra
wns
46
Cora
l ble
achi
ngB
leac
hing
ob
serv
atio
nsR
eefB
ase:
ww
w.r
eefb
ase.
org
31
Com
mun
ity
Med
ium
Sca
le
Per
cent
cov
erP
oint
inte
rcep
t tr
anse
ct
Ree
f Che
ck: w
ww
.ree
fche
ck.o
rgR
eefK
eepe
r: w
ww
.ree
fkee
per.o
rg36
Gen
eral
cor
al
heal
thIn
vert
ebra
te b
elt
tran
sect
Ree
f Che
ck: w
ww
.ree
fche
ck.o
rg64
Man
agem
ent
Med
ium
Sca
le
Per
cent
cov
erP
oint
inte
rcep
t tr
anse
ctM
esoa
mer
ican
Bar
rier
Ree
f Sys
tem
Syn
opti
c M
onit
orin
g P
rogr
am: A
lmad
a-Vi
llela
et a
l., 2
003,
mbr
s.or
g.bz
36
Gen
eral
cor
al
heal
thCo
ral c
ondi
tion
line
tr
anse
ctM
esoa
mer
ican
Bar
rier
Ree
f Sys
tem
Syn
opti
c M
onit
orin
g P
rogr
am: A
lmad
a-Vi
llela
et a
l., 2
003,
mbr
s.or
g.bz
51
Cora
l ble
achi
ngR
apid
vis
ual
asse
ssm
ent
Ree
fBas
e: w
ww
.ree
fbas
e.or
g47
Cora
l dis
ease
Cora
l-oct
ocor
al
dise
ase
surv
eyCa
ribb
ean
Coas
tal M
arin
e P
rodu
ctiv
ity:
ww
w.c
cdc.
org.
jm/c
aric
omp_
mai
n.ht
ml
49
Stru
ctur
al
com
plex
ity
(rug
osit
y)
Chai
n in
terc
ept
tran
sect
Cari
bbea
n Co
asta
l Mar
ine
Pro
duct
ivit
y: w
ww
.ccd
c.or
g.jm
/car
icom
p_m
ain.
htm
l R
oger
s et
al.
1994
: ca
rs.e
r.usg
s.go
v/Co
ral_
Ree
f_E
colo
gy/c
oral
_ree
f_ec
olog
y.ht
ml
54
Man
agem
ent
Fine
Sca
le
Per
cent
cov
er o
f al
gae
Cora
l con
diti
on,
alga
e; D
iade
ma
surv
ey (
visu
al
quad
rat)
Atl
anti
c an
d G
ulf R
apid
Ree
f Ass
essm
ent:
ww
w.c
oral
.aom
l.noa
a.go
v/ag
ra/
51 41
Alg
al b
iom
ass
Alg
al b
iom
ass
surv
eyCa
ribb
ean
Coas
tal M
arin
e P
rodu
ctiv
ity:
ww
w.c
cdc.
org.
jm/c
aric
omp_
mai
n.ht
ml R
oger
s et
al.
1994
: ca
rs.e
r.usg
s.go
v/Co
ral_
Ree
f_E
colo
gy/c
oral
_ree
f_ec
olog
y.ht
ml
51
Gen
eral
cor
al
heal
thCo
ral c
ondi
tion
LIT
an
d qu
adra
tA
tlan
tic
and
Gul
f Rap
id R
eef A
sses
smen
t: w
ww
.cor
al.a
oml.n
oaa.
gov/
agra
/51
Cora
l gro
wth
Rog
ers
met
hods
Rog
ers
et a
l. 19
94: c
ars.
er.u
sgs.
gov/
Cora
l_R
eef_
Eco
logy
/cor
al_r
eef_
ecol
ogy.
htm
l53
Cora
l re
crui
tmen
tCo
ral r
ecru
itm
ent
tile
sM
esoa
mer
ican
Bar
rier
Ree
f Sys
tem
Syn
opti
c M
onit
orin
g P
rogr
am: A
lmad
a-Vi
llela
et a
l., 2
003,
mbr
s.or
g.bz
; Rog
ers
et a
l. 19
94: c
ars.
er.u
sgs.
gov/
Cora
l_R
eef_
Eco
logy
/cor
al_r
eef_
ecol
ogy.
htm
l56
Cora
l re
crui
tmen
tVi
sual
qua
drat
sA
tlan
tic
and
Gul
f Rap
id R
eef A
sses
smen
t: w
ww
.cor
al.a
oml.n
oaa.
gov/
agra
41
Res
earc
h M
ediu
m S
cale
Per
cent
cov
erVi
deo
tran
sect
Flor
ida
Key
s M
arin
e N
atio
nal S
anct
uary
Cor
al R
eef M
onit
orin
g P
rogr
am: w
ww
.fknm
s.no
s.no
aa.g
ovVi
rgin
Isl
ands
met
hods
: ww
w.c
pacc
.org
38
Bio
dive
rsit
yTi
med
sw
imT
he N
atur
e Co
nser
vanc
y: w
ww
.nat
ure.
org;
Wor
ld W
ide
Fund
for
Nat
ure:
ww
w.w
wf.o
rg; C
onse
rvat
ion
Inte
rnat
iona
l: w
ww
.con
serv
atio
n.or
g 31

61
Tabl
e 4
. Sum
mar
y of
the
mai
n m
onit
orin
g m
etho
ds u
sed
in t
he C
arib
bean
and
Atl
anti
c fo
r be
nthi
c co
mm
unit
ies.
Mon
itor
ing
leve
lP
aram
eter
s m
easu
red
Met
hod
nam
eR
efer
ence
and
con
tact
Pag
e
Com
mun
ity
Bro
ad S
cale
Per
cent
alg
al
cove
r G
ener
al c
oral
hea
lth
- RE
CON
met
hods
RE
CON
, The
Oce
an C
onse
rvan
cy: w
ww
.oce
anco
nser
vanc
y.or
g/dy
nam
ic/g
etin
volv
ed/e
vent
s/co
ral/
cora
l.ht
ml
45
Gen
eral
cor
al
heal
th
Cora
l Wat
ch H
ealt
h Ch
art
Cora
l Wat
ch: w
ww
.vth
rc.u
q.ed
u.au
/eco
vis/
Curr
entR
es.h
tml#
Pra
wns
46
Cora
l ble
achi
ngB
leac
hing
ob
serv
atio
nsR
eefB
ase:
ww
w.r
eefb
ase.
org
31
Com
mun
ity
Med
ium
Sca
le
Per
cent
cov
erP
oint
inte
rcep
t tr
anse
ct
Ree
f Che
ck: w
ww
.ree
fche
ck.o
rgR
eefK
eepe
r: w
ww
.ree
fkee
per.o
rg36
Gen
eral
cor
al
heal
thIn
vert
ebra
te b
elt
tran
sect
Ree
f Che
ck: w
ww
.ree
fche
ck.o
rg64
Man
agem
ent
Med
ium
Sca
le
Per
cent
cov
erP
oint
inte
rcep
t tr
anse
ctM
esoa
mer
ican
Bar
rier
Ree
f Sys
tem
Syn
opti
c M
onit
orin
g P
rogr
am: A
lmad
a-Vi
llela
et a
l., 2
003,
mbr
s.or
g.bz
36
Gen
eral
cor
al
heal
thCo
ral c
ondi
tion
line
tr
anse
ctM
esoa
mer
ican
Bar
rier
Ree
f Sys
tem
Syn
opti
c M
onit
orin
g P
rogr
am: A
lmad
a-Vi
llela
et a
l., 2
003,
mbr
s.or
g.bz
51
Cora
l ble
achi
ngR
apid
vis
ual
asse
ssm
ent
Ree
fBas
e: w
ww
.ree
fbas
e.or
g47
Cora
l dis
ease
Cora
l-oct
ocor
al
dise
ase
surv
eyCa
ribb
ean
Coas
tal M
arin
e P
rodu
ctiv
ity:
ww
w.c
cdc.
org.
jm/c
aric
omp_
mai
n.ht
ml
49
Stru
ctur
al
com
plex
ity
(rug
osit
y)
Chai
n in
terc
ept
tran
sect
Cari
bbea
n Co
asta
l Mar
ine
Pro
duct
ivit
y: w
ww
.ccd
c.or
g.jm
/car
icom
p_m
ain.
htm
l R
oger
s et
al.
1994
: ca
rs.e
r.usg
s.go
v/Co
ral_
Ree
f_E
colo
gy/c
oral
_ree
f_ec
olog
y.ht
ml
54
Man
agem
ent
Fine
Sca
le
Per
cent
cov
er o
f al
gae
Cora
l con
diti
on,
alga
e; D
iade
ma
surv
ey (
visu
al
quad
rat)
Atl
anti
c an
d G
ulf R
apid
Ree
f Ass
essm
ent:
ww
w.c
oral
.aom
l.noa
a.go
v/ag
ra/
51 41
Alg
al b
iom
ass
Alg
al b
iom
ass
surv
eyCa
ribb
ean
Coas
tal M
arin
e P
rodu
ctiv
ity:
ww
w.c
cdc.
org.
jm/c
aric
omp_
mai
n.ht
ml R
oger
s et
al.
1994
: ca
rs.e
r.usg
s.go
v/Co
ral_
Ree
f_E
colo
gy/c
oral
_ree
f_ec
olog
y.ht
ml
51
Gen
eral
cor
al
heal
thCo
ral c
ondi
tion
LIT
an
d qu
adra
tA
tlan
tic
and
Gul
f Rap
id R
eef A
sses
smen
t: w
ww
.cor
al.a
oml.n
oaa.
gov/
agra
/51
Cora
l gro
wth
Rog
ers
met
hods
Rog
ers
et a
l. 19
94: c
ars.
er.u
sgs.
gov/
Cora
l_R
eef_
Eco
logy
/cor
al_r
eef_
ecol
ogy.
htm
l53
Cora
l re
crui
tmen
tCo
ral r
ecru
itm
ent
tile
sM
esoa
mer
ican
Bar
rier
Ree
f Sys
tem
Syn
opti
c M
onit
orin
g P
rogr
am: A
lmad
a-Vi
llela
et a
l., 2
003,
mbr
s.or
g.bz
; Rog
ers
et a
l. 19
94: c
ars.
er.u
sgs.
gov/
Cora
l_R
eef_
Eco
logy
/cor
al_r
eef_
ecol
ogy.
htm
l56
Cora
l re
crui
tmen
tVi
sual
qua
drat
sA
tlan
tic
and
Gul
f Rap
id R
eef A
sses
smen
t: w
ww
.cor
al.a
oml.n
oaa.
gov/
agra
41
Res
earc
h M
ediu
m S
cale
Per
cent
cov
erVi
deo
tran
sect
Flor
ida
Key
s M
arin
e N
atio
nal S
anct
uary
Cor
al R
eef M
onit
orin
g P
rogr
am: w
ww
.fknm
s.no
s.no
aa.g
ovVi
rgin
Isl
ands
met
hods
: ww
w.c
pacc
.org
38
Bio
dive
rsit
yTi
med
sw
imT
he N
atur
e Co
nser
vanc
y: w
ww
.nat
ure.
org;
Wor
ld W
ide
Fund
for
Nat
ure:
ww
w.w
wf.o
rg; C
onse
rvat
ion
Inte
rnat
iona
l: w
ww
.con
serv
atio
n.or
g 31
Res
earc
h Fi
ne
Scal
e
Per
cent
cov
erP
erm
anen
t ph
oto
quad
rat
Flor
ida
Key
s M
arin
e N
atio
nal S
anct
uary
Cor
al R
eef M
onit
orin
g P
rogr
am: w
ww
.fknm
s.no
s.no
aa.g
ov o
r R
oger
s et
al.,
199
443
Gen
eral
cor
al
heal
thCo
ral c
ondi
tion
LIT
&
qua
drat
Atl
anti
c an
d G
ulf R
apid
Ree
f Ass
essm
ent:
ww
w.c
oral
.aom
l.noa
a.go
v/ag
ra/
51,4
1
Cora
l ble
achi
ngP
erm
anen
t ph
oto
quad
rat
Flor
ida
Key
s M
arin
e N
atio
nal S
anct
uary
Cor
al R
eef M
onit
orin
g P
rogr
am: w
ww
.fknm
s.no
s.no
aa.g
ov43
Cora
l gro
wth
Per
man
ent
phot
o qu
adra
tFl
orid
a K
eys
Mar
ine
Nat
iona
l San
ctua
ry C
oral
Ree
f Mon
itor
ing
Pro
gram
: ww
w.fk
nms.
nos.
noaa
.gov
58
Cora
l re
crui
tmen
t
Cora
l rec
ruit
men
t ti
les
Ref
eren
ce 1
:Mes
oam
eric
an B
arri
er R
eef S
yste
m S
ynop
tic
Mon
itor
ing
Pro
gram
: Alm
ada-
Ville
la e
t al.,
20
03, m
brs.
org.
bz56
Visu
al a
nd p
hoto
qu
adra
ts
Visu
al: A
tlan
tic
and
Gul
f Rap
id R
eef A
sses
smen
t: w
ww
.cor
al.a
oml.n
oaa.
gov/
agra
Pho
to: F
lori
da K
eys
Mar
ine
Nat
iona
l San
ctua
ry C
oral
Ree
f Mon
itor
ing
Pro
gram
: ww
w.fk
nms.
nos.
noaa
.gov
58
Tabl
e 5
. Sum
mar
y of
the
mai
n m
onit
orin
g m
etho
ds u
sed
to a
sses
s be
nthi
c co
mm
unit
ies
in t
he I
ndo
Pac
ific
regi
on
(Mid
dle
Eas
t, W
este
rn I
ndia
n O
cean
, Sou
th A
sia,
Sou
thea
st a
nd E
ast
Asi
a, W
ider
Pac
ific
Oce
an).
Mon
itor
ing
leve
lP
aram
eter
s m
easu
red
Met
hod
nam
eR
efer
ence
and
con
tact
Pag
e
Com
mun
ity
Bro
ad
Scal
e
Per
cent
cov
er
& G
ener
al
cora
l hea
lth
Man
ta t
owG
loba
l Cor
al R
eef M
onit
orin
g N
etw
ork:
Eng
lish
et a
l. 19
97; w
ww
.gcr
mn.
org,
ww
w.a
ims.
gov.
auP
hilip
pine
s m
etho
ds: (
Uyc
hiao
co e
t al.
2001
) w
ww
.one
ocea
n.or
g/do
wnl
oad/
_ind
ex.h
tml
22 30
Gen
eral
obs
erva
tion
sG
reat
Bar
rier
Ree
f Mar
ine
Par
k A
utho
rity
– E
ye o
n th
e R
eef.
Con
tact
: And
rew
Chi
n, a
.chi
n@gb
rmpa
.go
v.au
or
Rob
in A
iello
, rob
in.a
iello
@iig
.com
.au
Gen
eral
cor
al
heal
th
Cora
l Wat
ch H
ealt
h Ch
art
Cora
l Wat
ch: w
ww
.vth
rc.u
q.ed
u.au
/eco
vis/
Curr
entR
es.h
tml#
Pra
wn s
46
Com
mun
ity
Med
ium
Sca
le
Per
cent
cov
erP
oint
inte
rcep
t tr
anse
ctR
eef C
heck
: ww
w.r
eefc
heck
.org
Gen
eral
cor
al
heal
thIn
vert
ebra
te b
elt
tran
sect
Cora
l bl
each
ing
Ble
achi
ng
obse
rvat
ions
Ree
f Che
ck: w
ww
.ree
fche
ck.o
rg; G
reat
Bar
rier
Ree
f Mar
ine
Par
k A
utho
rity
ww
w.g
brm
pa.g
ov.a
u;
Ree
fBas
e: w
ww
.ree
fbas
e.or
g47
Man
agem
ent
Bro
ad S
cale
Per
cent
cov
er
Man
ta t
owE
nglis
h et
al.
1997
22
Tim
ed s
wim
Ree
fBas
e: w
ww
.ree
fbas
e.or
g; C
omm
issi
on d
e l’O
cean
Ind
ien:
Con
and
et a
l. 19
99, C
onan
d et
al.
2000
, w
ww
.coi
.intn
et.m
u/31
Ben
thic
com
mun
ities
36 64

62
Man
agem
ent
Med
ium
Sca
le
Per
cent
cov
er
Line
inte
rcep
t tr
anse
ctE
nglis
h et
al.
1997
33
Poi
nt in
terc
ept
tran
sect
The
Nat
ure
Cons
erva
ncy:
ww
w.n
atur
e.or
g; A
lison
Gre
en, a
gree
n@tn
c.or
g36
Cora
l bl
each
ing
Rap
id v
isua
l as
sess
men
tR
eefB
ase:
ww
w.r
eefb
ase.
org
47
Stru
ctur
al
com
plex
ity
(rug
osit
y)
Line
tra
nsec
t m
etho
dCh
ain
inte
rcep
t tr
anse
ct
Wild
life
Cons
erva
tion
Soc
iety
Eas
t A
fric
a: w
ww
.wcs
.org
Haw
aii C
oral
Ree
f Ass
essm
ent
and
Mon
itor
ing
Pro
gram
: cra
mp.
wcc
.haw
aii.e
du33 54
Man
agem
ent
Fine
Sca
le
Per
cent
cov
erVi
sual
qua
drat
Com
mis
sion
de
l’Oce
an I
ndie
n: C
onan
d et
al.
1999
, Con
and
et a
l. 20
00, w
ww
.coi
.intn
et.m
u/41
Gen
eral
cor
al
heal
th
Tagg
ing
cora
ls
Eng
lish
et a
l. 19
97:
53 56 22
Cora
l re
crui
tmen
tCo
ral r
ecru
itm
ent
tile
sR
esea
rch
Bro
ad S
cale
Per
cent
cov
erM
anta
tow
Res
earc
h M
ediu
m
Scal
e
Vide
o tr
anse
ctE
nglis
h et
al.
1997
; Aus
tral
ian
Inst
itut
e of
Mar
ine
Scie
nce:
ww
w.a
ims.
gov.
au, P
age
et a
l. 20
01H
awai
i Cor
al R
eef A
sses
smen
t an
d M
onit
orin
g P
rogr
am: w
ww
.cra
mp.
wcc
.haw
aii.e
du38 24
Bio
dive
rsit
yTi
med
sw
im
The
Nat
ure
Cons
erva
ncy:
ww
w.n
atur
e.or
gW
orld
Wid
e Fu
nd fo
r N
atur
e: w
ww
.ww
f.org
Cons
erva
tion
Int
erna
tion
al: w
ww
.con
serv
atio
n.or
gA
ustr
alia
n In
stit
ute
of M
arin
e Sc
ienc
e: w
ww
.aim
s.go
v.au
31
Cora
l bl
each
ing
Vide
o tr
anse
ctG
reat
Bar
rier
Ree
f Mar
ine
Par
k A
utho
rity
: ww
w.g
brm
pa.o
rgR
eefB
ase:
ww
w.r
eefb
ase.
org
47
Cora
l dis
ease
Bel
t tr
anse
ct &
ti
med
sw
imA
ustr
alia
n In
stit
ute
of M
arin
e Sc
ienc
e: (
Bas
s an
d M
iller
199
8), w
ww
.aim
s.go
v.au
31 38St
ruct
ural
co
mpl
exit
yCh
ain
inte
rcep
t tr
anse
ctH
awai
i Cor
al R
eef A
sses
smen
t an
d M
onit
orin
g P
rogr
am: C
RA
MP
: cra
mp.
wcc
.haw
aii.e
du54
Res
earc
h Fi
ne
Scal
e
Per
cent
cov
erP
erm
anen
t ph
oto
quad
rat
Eng
lish
et a
l. 19
97
43 53 43 56
Gen
eral
cor
al
heal
thTa
ggin
g co
rals
Cora
l bl
each
ing
Per
man
ent
phot
o qu
adra
tCo
ral g
row
th
Cora
l re
crui
tmen
tCo
ral r
ecru
itm
ent
tile
s
Ben
thic
com
mun
ities

63
6: MACRO-INVERTEBRATES
INVERTEBRATE SPECIES DIVERSITY
See ‘species diversity’ on fish page 88.
Key macro-invertebratesCommercial speciesReef managers find it useful to monitor both target invertebrates (that are fished for food or curios to determine if fishing pressure on the reef is sustainable), and coral predators. Special surveys are available to monitor aquarium species.
Keystone speciesIt is also useful to monitor keystone species, which can have ecological impacts on the reef. These include the crown-of-thorns starfish (Acanthaster planci or COTS) and Diadema. There are specific broad to medium scale methods to assess urchins and damselfish on Caribbean reefs. For more information contact Brian Keller, [email protected]. Drupella are coral predatory gastropods that may occur in high enough numbers to considerably reduce coral cover.
Table 6. Which invertebrate monitoring method should you choose?Monitoring category & scale
When should you choose this method? Page
Broad scale Site selection and to cover a large area in short time
General observationsCommercial inverts: Estimates general abundance of invertebrates; provide low precision but valuable data to raise awareness of recreational divers.
22, 30
Manta towKeystone and commercial species: To count large species e.g. COTS, Diadema or giant clams; cost-effective as covers large areas in short time.
22
Medium scaleSmaller area, more detail and more precise than broad scale methods. More time consuming and expensive than broad-scale methods.
Timed swim Species diversity: To count all the obvious species to decide ones to include in visual census. 31
Invertebrate belt transect
Commercial inverts: information on population structure of target species; experienced observers of abundance; more experience and repeated training required for size estimations.
Special MAQTRAC method was designed for aquarium trade species; requires experienced observers of abundance, with special training for size estimations.
Keystone species: COTS, Drupella and Diadema counted on belt transects for coral health e.g. disease, bleaching and general invertebrates; Reef Check for non-professionals; or Lincoln-Smith for management and research. If Diadema populations are particularly important i.e. populations recovering after mass disease in Caribbean, specific methods may be appropriate.
64, 68
Fine scale Useful for asking detailed, small-scale questions about small invertebrates, e.g. Drupella snails. More time consuming and expensive than medium-scale surveys.
QuadratsKeystone species: To get precise abundance estimates Drupella if these are major coral predators; these snails are small and hard to get precise estimates on larger belt transects, which provide indications of numbers only.
43
Collection and CITKeystone species – Diadema: To get precise size structure of urchin populations that is related to habitat complexity with urchin population size structure.
70
Mac
ro-i
nver
tebr
ates

64
BELT TRANSECT
Programs that use this method:m Reef Check;m Australian Institute of Marine Science Long-term Monitoring Program (AIMS LTMP);m Various Pacifi c monitoring programs (Lincoln-Smith transect);m Reef Check MAQTRAC Program.
Example 1. Reef Check methodMethod description:This involves a pair of observers swimming along the belt transect and counting the target invertebrate species as well as special features on the reef, such as coral health or physical damage.
Information obtained:Abundance estimates of key macro-invertebrates as well as a measure of physical damage and coral health. A single survey provides a snapshot of the status of target key macro-invertebrates and impacts on a regional/global scale. To achieve higher precision to detect local changes, teams can make more replicates and increase the monitoring frequency (e.g. 4 x per year).
Equipment required:m Transect tape (100 m). See Reef Check PIT p 36;m 5 m cross lines or PVC poles to help estimate belt
width.
Field personnel:m 2 observers (scuba or snorkel divers;m 1 boat driver/surface watch.
Lab personnel:m Observers should enter data into Excel spreadsheet immediately after the dive and send the data to Reef m Check Headquarters. Results should also be interpreted and reported locally.
General procedures:m See Reef Check point intercept transect for method to lay the transect;m A buddy pair swims along each of the 4 x 20 m transect segments and records target invertebrates as well
as coral health characteristics and the presence other coral damage or trash along a 5 m belt transect. Each observer surveys half of the belt (2.5 m wide);
m 3 options for checking belt width are: observers carry a 2.5 m long PVC pipe; lay cross lines at the start of each replicate to provide a reference to estimate belt width; measure the distance from your fl ipper to your fi ngertips (approx. 2 to 2.5 m) to judge the belt width.
Advantages:m Cost effective, especially when using volunteer observers;m Education and raises awareness at same time;m Provides a global snapshot of coral reef health;m Repeat surveys can be done as a local monitoring program.
Limitations:m Surveys should ideally be repeated up to 4 times per site and up to 4 times per year for meaningful data for
local comparisons. This adds to the expense.
Training required:m Experienced recreational divers can learn the methods in a single day.
Contact: [email protected]
Reference: www.reefcheck.org/methods/instructions.aspOther similar invertebrate surveys
Monitoring level:Monitoring level:✓ CommunityCommunity
Scale:Scale:✓ Broad Broad ✓ MediumMedium
Level of detail:Level of detail:✓ Quantitative Quantitative ✓ Semi-quantitativeSemi-quantitative
Causes damage to the reef?Causes damage to the reef?✓ NoNo
Achievable precision:Achievable precision:✓ Low Low ✓ MediumMedium
Mac
ro-i
nver
tebr
ates

65
For a modifi cation of the Reef Check belt transect for Philippines coral reefs see Uychiaoco et al. (2001); www.oneocean.org/download/_index.html
Example 2. AIMS LTMP methodMethod description:This is a 2 m belt transect that observers search for disease, predation scars, predators and bleaching.
Information obtained:Total counts are made of the following:m Crown-of-thorns starfi sh (COTS; total count in 3 size classes) and feeding scars;m Drupella and feeding scars; m White syndrome disease scars;m Blackband disease scars;m Incidence of other disease and unknown scars;m Estimate of bleaching as a percentage of live coral cover on
the transect.
Equipment:m 50 m transect tapes;m Digital underwater camera if possible.
Field personnel:m 1 Observer experienced with this method plus a buddy (scuba
divers);m 1 boat driver/surface watch.
Lab personnel:m Data entry, analysis, interpretation and reporting.
General procedures:Fixed transect searchesm This survey follows the fi sh census along the 5 x 50 m long transects (AIMS LTMP fi sh visual census, p 79).
The observer pairs the video transect diver (AIMS video transect p 38) and swims along each transect searching a 2 m belt for coral mortality, disease, COTS and Drupella. Photographs are taken of unidentifi able diseases for identifi cation later.
See p 31 for ‘AIMS timed swim’ for how to conduct this method on non-permanent monitoring sites.
Advantages:m Quick and easy assessment of key macro-invertebrates and coral health indicators;m Can be performed at the same time as a benthic line transect so the buddy is not redundant.
Limitations:m Observers must be able to search quickly to keep up with the video photographer when surveys are done
together (AIMS LTMP video transect p 38).
Training required:m Identifi cation of target species and coral health indicators
Contact:Hugh Sweatman, [email protected]
Reference: Bass and Miller (1998); www.aims.gov.au/pages/research/reef-monitoring/ltm/mon-sop1/mon-sop1-11.html
Monitoring level:Monitoring level:✓ ResearchResearch
Level of detail:Level of detail:✓ QuantitativeQuantitative
Causes damage to the reef?Causes damage to the reef?✓ NoNo
Achievable precision:Achievable precision:✓ HighHigh
Mac
ro-n
vert
ebra
tes

66
Example 3. Lincoln-Smith transectMethod description:This method is widely used in the Pacifi c to determine the abundance of key macro-invertebrates that are harvested for food.
Information obtained:Abundance estimates of key invertebrate species e.g. giant clams, sea cucumbers, pearl oysters, trochus and false trochus to give a comparison with abundances of harvested species.
Equipment required:m 50 m transect tapem 2 m wide T-bar
Field personnel:m 2 observers trained (1 to lay the transect and 1 to count);m 1 boat driver/surface watch.
Lab personnel:Data entry, analysis, interpretation and reporting.
General procedures:m Haphazardly lay 6 x 50 m long transects at 2 depths of
shallow reef fl ats of 0.5 to 3.5 m, deep slopes at 15 to 22 m;m The tape is laid into the existing current so that the survey
is easier to conduct.
Shallow habitatm Count and estimate the length of target invertebrates along a 2 m belt, which is measured using the T-bar.
Sea cucumbers are measured from the mouth to the anus, clams are measured along the top of the shell and trochus are measured across the widest point of the shell base and pearl oysters from the apex to the hinge of the shell;
m Replicates are placed 10 to 15 m apart.
Deep habitatm Transects are laid along coral, rubble and sand slopes. Sea cucumbers and goldlip and blacklip pearl oysters
are counted and measured along a 50 m long and 5 m wide belt transect.
Advantages:m Easy to do;m Transect depths and widths take account of the preferred habitats of the different target invertebrates, and
their size and abundance.
Limitations:m Experienced divers should be used because of the depth of the deep transect.
Training required:m Identifi cation of target invertebrates and measurements.
Reference:Lincoln-Smith et al. (2001); www.gbrmpa.gov.au/corp_site/info_services/publications/research_publications/rp69/
Monitoring level:Monitoring level:✓ ManagementManagement✓ Scientifi cScientifi c
Scale:Scale:✓ MediumMedium
Level of detail:Level of detail:✓ QuantitativeQuantitative
Causes damage to the reef?Causes damage to the reef?✓ NoNo
Achievable precision:Achievable precision:✓ MediumMedium
Mac
ro-i
nver
tebr
ates

67
Example 4. MAQTRAC methodPrograms that use this method:m Reef Check’s MAQTRAC program
Method description:This involves a pair of observers swimming along the belt transect and counting and measuring the target invertebrate species as well as noting impacts on the reef, such as coral health or physical damage.
Information obtained:Counts and size measurements of target invertebrates
Equipment required:Underwater slate with attached rulerTape measures
Field personnel:m 2 observers trained in the methods; one observer
can conduct the substrate survey (Reef Check PIT p 36), while the other conducts the invertebrate survey;
m 1 boat driver/surface watch.
Lab personnel:m Data entry, analysis, interpretation and reporting.
General procedures:m A pilot study should be done to determine the
required number of replicates for adequate precision;m Surveys conducted along the same belt transect as the MAQTRAC fi sh transect (5 m wide);m Count all target species of key macro-invertebrates and coral species;m Make length estimates for all individuals, this includes a measurement along the longest part, and the aspect
perpendicular to this for species with radial symmetry. An additional measurement should be made of the height of coral colonies;
m Record a qualitative estimate of the percentage of the coral colony that is dead;m Identify and measure scars along the longest aspect and perpendicular to the longest aspect. Grade the scars
with the following criteria:l ‘1’ for fresh scars with no re-growth; l ‘2’ for scars covered with moderate re-colonisation by algae and/or sessile invertebrates; andl ‘3’ for a previously known scar that is completely overgrown and diffi cult to differentiate from the
surrounding habitat.
Advantages:m Detailed and precise assessment of the impacts of the aquarium trade if suffi cient replicates are monitored.
Limitations:m Time consuming;m May require many replicates for rare species or complex communities;m High level of expertise.
Training required:m Advanced species identifi cation.
Contact:[email protected] p 82, 100 for more information on MAQTRAC
Monitoring level:Monitoring level:✓ ResearchResearch
Scale:Scale:✓ Medium Medium ✓ FineFine
Level of detail:Level of detail:✓ QuantitativeQuantitative
Causes damage to the reef?Causes damage to the reef?✓ NoNo
Achievable precision:Achievable precision:✓ HighHigh
Mac
ro-i
nver
tebr
ates

68
DIADEMA BELT TRANSECT
Status of populations of Diadema antillarum
Programs that use this method:m Atlantic and Gulf Rapid Reef Assessment (AGRRA);m Caribbean Coastal Marine Productivity Program (CARICOMP).
Method description:These methods involve counting the abundance and measuring the size of the Diadema antillarum along a belt transect. We recommend these surveys are done at the same sites as benthic communities surveys.
Information obtained:m Abundance of Diadema;m Density ;m Size structure.
Equipment required:m 1 m PVC stick or transect tape marked each 10 cm.
Field personnel:m 2 observers (scuba divers);m 1 boat driver/surface watch.
Lab personnel:m Data entry, analysis, interpretation and reporting.
Example 1. AGRRA methodGeneral proceduresm This belt transect is conducted with the AGRRA coral
condition, algae and Diadema survey; p 51.m Using the 1 m measuring device for scale, swim a belt
transect along each of the 6 x 10 m lines. Count every Diadema within 0.5 m either side of the line.
Example 2. basic CARICOMP method General procedures:m This belt transect is conducted with the CARICOMP coral communities method; p 49;m Mark the rod so that you can measure 50 cm either side of the transect line;m Swim back along the transect and record the total number of Diadema and other urchins encountered.
Example 3. CARICOMP Diadema status method (more detailed than the basic method)This method consists of a snorkel survey followed by a scuba survey.a. Snorkel methodm Count the number of urchins in 2 x 15 minute snorkel surveys per reef;m Separate urchins into 2 size classes: < 5 cm test diameter (juveniles) and > 5 cm test diameter (adults);m Record observations about the spatial heterogeneity of the habitats.
b. Scuba survey. Select 3 sitesm Divide the front reef and slope, and also if there is a well-developed back reef, into 3 depth intervals (0-5 m, 5-10 m and >10 m); m At each depth, place at least fi ve 10 x 2 m belt transects. Use random number tables to select the exact
transect placements;m Count the number of urchins in each size category along the belt transect.
Advantages:m Easy to implement.
Limitations:m Random number tables can be logistically diffi cult to use because coral reefs have irregular shapes (see
‘permanent versus haphazard sample methods’ p 13).
Parameters that can be surveyed Parameters that can be surveyed using this method:using this method:
✓ InvertebratesInvertebrates
Monitoring level:Monitoring level:✓ ManagementManagement
Scale:Scale:✓ MediumMedium
Level of detail:Level of detail:✓ QuantitativeQuantitative
Causes damage to the reef?Causes damage to the reef?✓ NoNo
Achievable precision:Achievable precision:✓ MediumMedium
Mac
ro-i
nver
tebr
ates

69
Training required:m Implementation of this method
Contact:AGRRA: Robert Ginsburg, [email protected]: Dulcie Linton, [email protected] and John Ogden, [email protected]
Reference:AGRRA: http://www.coral.aoml.noaa.gov/agra/CARICOMP: www.ccdc.org.jm/caricomp_main.htmlCARICOMP have a method for collecting and measuring Diadema which is recommended if Diadema have been depleted and precise information on population structure is required.
Mac
ro-i
nver
tebr
ates

70
COLLECTION OF DIADEMA
Programs that use this method:m Caribbean Coastal Marine Productivity Program (CARICOMP).
Method description: This is conducted after the Diadema snorkel and scuba belt transects and involves collecting and measuring urchins at sites where chain intercept transects have been conducted.
Information obtained:m Size structure of different urchin populations m Relates habitat complexity with urchin population
size structure
Equipment required:m Large plastic basket;m Barbeque tongs and fork;m Two pointed compass;m Ruler glued to a slate or another measuring
devise;m Chain 2-3 m in length.
Field personnel:m 2 observers (scuba divers);m 1 boat driver/surface watch.
Lab personnel:m Data entry, analysis, interpretation and reporting.
General procedures:m Following the CARICOMP belt transect urchin
survey (p 68), determine the rugosity of each transect (see CIT p 54);
m Collect a minimum of 200 urchins of all sizes along each depth interval;m Using the tongs, pick individual urchins from the basket, turn them upside down and measure the oral test
diameter using a two-pointed compass. Measure the compass distance using the metric scale on your slate.
Advantages:m Precise estimate of urchin abundance and size (measurements of size are more precise than estimates).
Limitations:m Time consuming;m Ecological impact of urchin collection;m Some coral damage is unavoidable with the use of a chain, more so in branching coral habitats. The
ecological impact of collecting urchins is unavoidable (see chain transects for limitations related to chain use).
Training required:m Chain transects require specialist training
Contact:Dulcie Linton, [email protected] and John C. Ogden, [email protected]
Reference:http://www.ccdc.org.jm/caricomp_main.html
Parameters that can be surveyed Parameters that can be surveyed using this method:using this method:
✓ InvertebratesInvertebrates
Monitoring level:Monitoring level:✓ ManagementManagement
Scale:Scale:✓ FineFine
Level of detailLevel of detail✓ QuantitativeQuantitative
Causes damage to the reef?Causes damage to the reef?✓ YesYes
Achievable precision:Achievable precision:✓ Medium to highMedium to highM
acro
-inv
erte
brat
es

71
Tabl
e 7.
Sum
mar
y of
the
mai
n m
onit
orin
g m
etho
ds u
sed
in t
he I
ndo-
Pac
ific
regi
on fo
r In
vert
ebra
tes
(M
iddl
e E
ast,
Wes
tern
Ind
ian
Oce
an, S
outh
A
sia,
Sou
thea
st a
nd E
ast
Asi
a, W
ider
Pac
ific
Oce
an).
Mon
itor
ing
leve
lP
aram
eter
s m
easu
red
Met
hod
nam
eR
efer
ence
and
con
tact
Pag
e
Com
mun
ity
Bro
ad S
cale
COT
S sp
ecifi
c m
etho
ds (
or g
iant
cl
ams)
Man
ta t
owG
loba
l Cor
al R
eef M
onit
orin
g N
etw
ork:
Eng
lish
et a
l., 1
997,
ww
w.g
crm
n.or
g,
Phi
lippi
ne m
etho
ds: U
ychi
aoco
et a
l. 20
01; w
ww
.one
ocea
n.or
g/do
wnl
oad/
_ind
ex.h
tml
22
Com
mun
ity
Med
ium
Sca
leG
ener
al
abun
danc
eB
elt
tran
sect
Ree
f Che
ck: w
ww
.ree
fche
ck.o
rgP
hilip
pine
met
hods
: Uyc
hiao
co e
t al.
2001
; ww
w.o
neoc
ean.
org/
dow
nloa
d/_i
ndex
.htm
l62
Man
agem
ent
Bro
ad S
cale
COT
S sp
ecifi
c m
etho
ds &
gia
nt
clam
sM
anta
tow
Glo
bal C
oral
Ree
f Mon
itor
ing
Net
wor
k: E
nglis
h et
al.,
199
7, w
ww
.gcr
mn.
org,
22
Man
agem
ent
Med
ium
Sca
leP
acifi
c be
lt
met
hods
Bel
t tr
anse
ctLi
ncol
n Sm
ith
et a
l. 20
01: w
ww
.gbr
mpa
.gov
.au/
corp
_sit
e/in
fo_s
ervi
ces/
publ
icat
ions
/res
earc
h_pu
blic
atio
ns/r
p69/
62
Res
earc
h B
road
Sc
ale
COT
S sp
ecifi
c m
etho
dsM
anta
tow
Glo
bal C
oral
Ree
f Mon
itor
ing
Net
wor
k: E
nglis
h et
al.,
199
7, w
ww
.gcr
mn.
org,
Aus
tral
ian
Inst
itut
e of
M
arin
e Sc
ienc
e: B
ass
and
Mill
er, 1
998,
ww
w.a
ims.
gov.
au22
Res
earc
h M
ediu
m S
cale
Gen
eral
ab
unda
nce
Bel
t tr
anse
ctA
ustr
alia
n In
stit
ute
of M
arin
e Sc
ienc
e: B
ass
and
Mill
er, 1
998,
ww
w.a
ims.
gov.
au62
Aqu
ariu
m
inve
rteb
rate
ab
unda
nce
Aqu
ariu
m
inve
rteb
rate
bel
t tr
anse
ct
MA
QT
RA
C (R
eef C
heck
): w
ww
.ree
fche
ck.o
rg65
Dru
pella
spe
cific
Scub
a se
arch
Aus
tral
ian
Inst
itut
e of
Mar
ine
Scie
nce:
Bas
s an
d M
iller
, 199
8, w
ww
.aim
s.go
v.au
63
Pac
ific
belt
m
etho
dsB
elt
tran
sect
Linc
oln
Smit
h et
al.,
200
1: w
ww
.gbr
mpa
.gov
.au/
corp
_sit
e/in
fo_s
ervi
ces/
publ
icat
ions
/re
sear
ch_p
ublic
atio
ns/r
p69/
62
Res
earc
h Fi
ne
Scal
eD
rupe
lla s
peci
ficVi
sual
qua
drat
Com
mis
sion
de
l’Oce
an I
ndie
n: C
onan
d et
al.
1999
, Con
and
et a
l. 20
00, c
oi.in
tnet
.mu/
41
Mac
ro-i
nver
tebr
ates

72
Tab
le 8
. Sum
mar
y of
the
mai
n m
onit
orin
g m
etho
ds u
sed
in t
he C
arib
bean
and
Atl
anti
c fo
r In
vert
ebra
tes.
Mon
itor
ing
leve
lP
aram
eter
s m
easu
red
Met
hod
nam
eR
EF
ER
EN
CE A
ND C
ON
TAC
TP
age
Com
mun
ity
Bro
ad S
cale
Gen
eral
ab
unda
nce
Cora
l hea
lth
surv
eyR
ECO
N, T
he O
cean
Con
serv
ancy
: ww
w.o
cean
cons
erva
ncy.
org/
dyna
mic
/get
invo
lved
/eve
nts/
cora
l/co
ral.
htm
l45
Com
mun
ity
Med
ium
Sca
leG
ener
al
abun
danc
eIn
vert
ebra
te
belt
tra
nsec
tR
eef C
heck
: ww
w.r
eefc
heck
.org
64
Man
agem
ent
Med
ium
Sca
leD
iade
ma
spec
ific
met
hods
Dia
dem
a be
lt
tran
sect
A
tlan
tic
and
Gul
f Rap
id R
eef A
sses
smen
t: w
ww
.cor
al.a
oml.n
oaa.
gov/
agra
/; Ca
ribb
ean
Coas
tal M
arin
e P
rodu
ctiv
ity
Pro
gram
: ww
w.c
cdc.
org.
jm/c
aric
omp_
mai
n.ht
ml
68
Res
earc
h M
ediu
m S
cale
Gen
eral
ab
unda
nce
Aqu
ariu
m
inve
rteb
rate
be
lt t
rans
ect
Sugg
est:
MA
QT
RA
C (R
eef C
heck
): w
ww
.ree
fche
ck.o
rg65
Mac
ro-i
nver
tebr
ates

73
7: FISHES
A coral reef manager must know what is happening to the fi shes and other targeted species harvested from reefs, because the purpose of management is to safeguard the fi sheries of the local people and the associated biodiversity. However, monitoring the fi shes is probably the hardest task as many of them are highly mobile and counts can vary enormously from day to day. There are many methods to assess fi sh populations. Other target species are covered in the section on ‘Invertebrates’ p 63.
Fisheries monitoring methods include monitoring both the fi sheries and their impacts on fi sh populations, including target and non-target species. Fisheries monitoring usually focuses on monitoring catch, effort, catch per unit effort and biological characteristics of the key fi sheries species. This is called fi shery dependent monitoring and the information can be used to monitor trends in the fi shery and expected yield under different types of fi shing pressure; see Samoilys (1997); Russ (2002) for more information. Another important assessment is to monitor fi sh catches at local ports or markets; these methods are not covered here and can be found in the Socio-economic manuals of Bunce et al. (2000) and (2002).
In this section we focus on visual census methods. These types of methods are used to monitor fi shing impacts on target species, called fi shery independent monitoring. The specifi c methods you should use will depend on the size and mobility of the target species you want to monitor.
Obtaining reliable estimates of fi sh populations is diffi cult so observers need extensive and on going training. Populations of fi shes may fl uctuate widely because recruitment of young fi sh into the adult population is highly variable and because many fi sh are highly mobile. This means that estimates of abundance are usually highly variable (estimates have high variance). Schooling species are particularly diffi cult to estimate as they may either be present in large numbers or absent. The structural complexity of coral reefs and the mobility, diversity and abundance of reef fi shes also makes censusing diffi cult. While qualitative observations may be possible on large numbers of species, fewer species should be recorded for quantitative observations (Wells 1995). Likewise less experienced observers should be expected to count fewer target fi sh than more experienced observers. The best way to reduce the variance in complex areas is to perform more counts, e.g. many small samples, rather than trying to improve the precision of a few large counts (Bohnsack and Bannerot 1986).
It is possible to do a fi sh census on snorkel, but scuba allows surveys to be done at more depth ranges and many of the key fi sheries species may be more abundant in deeper water. Although it is diffi cult to obtain reliable information on abundance and population size-structure, presence - absence data can be useful to determine if fi sh are moving away from impacted areas to more favourable places.
Fish monitoring methodsFish species diversityYou may want to survey species diversity as a part of a baseline study when commencing a monitoring program or to monitor them continuously. Surveys of species diversity may also help decide which species to include in the monitoring program. Questions include:m What fi sh species occur at this site?m What is the relative abundance of key target species at this site?
Monitoring coral reef species diversity requires a high level of technical expertise, i.e. a different expert is required for each taxon. If you do not have the technical expertise, it may be necessary to fund overseas experts to
What aff ects accuracy and precision of fi sh counts?What aff ects accuracy and precision of fi sh counts?m m Diver movements;Diver movements;m m Diver visual capabilities e.g. water visibility;Diver visual capabilities e.g. water visibility;m m Spatial scale of sample methods relative to extent of fi sh movements, or the size of the area being Spatial scale of sample methods relative to extent of fi sh movements, or the size of the area being
counted compared to the movement range of many fi shes; counted compared to the movement range of many fi shes; m m The range of ecologically different fi sh species counted in a census;The range of ecologically different fi sh species counted in a census;m m Swimming speed - more fi sh will be seen by a diver who swims slowly.Swimming speed - more fi sh will be seen by a diver who swims slowly.
Fish
es

74
conduct these surveys. Standard methods for species diversity have been developed and are used by a number of international non-government organisations (NGOs). See Donnelly et al. (2003) at http://www.komodonationalpark.org/ or contact one of the major NGOs: The Nature Conservancy at www.nature.org, the World Wide Fund for Nature at www.wwf.org and Conservation International at www.conservation.org.
General fi sh monitoringFood fi sh or target speciesMonitoring fi sh that are important for food is useful to determine if fi sheries are sustainable. This is called fi shery independent monitoring and is valuable if done in conjunction with fi shery dependent monitoring (see above).
Fish spawning aggregationsMonitoring spawning aggregations helps to: m Determine how populations of target fi sh respond to seasonal or total closures;m Measure impacts of management regulations (such as closures);m Assess trends (declines/recovery) in aggregation populations;m Provide predictive power for other sites/species;m Provide some insight into reproductive biology;m Maintain fi eld presence to deter poaching; andm Defi ne multi-species versus single species aggregation sites.
Fish recruitmentRecruitment of coral reef fi sh is highly variable, which means that the number of new adults entering the population each year is variable. Counting the number of new recruits can help you estimate future adult populations.
Indicators of reef healthButterfl yfi sh (Chaetodontidae) are easily recognised by experienced and less-experienced observers. Many species rely on healthy coral to live, therefore the abundance of those that eat coral (coralivores, e.g. Chaetodon fascialis) provide a general indication of coral reef health. The usefulness of this approach has been questioned by some scientists who argue that if you want to detect changes in coral cover, then monitor coral cover directly (Jones and Kaly 1995).
How often should you conduct a visual fi sh census?How often should you conduct a visual fi sh census?The frequency of fi sh monitoring will depend on your program objectives. If you want to detect The frequency of fi sh monitoring will depend on your program objectives. If you want to detect seasonal changes, doing a census every month or every 3 months is necessary. Monthly surveys are seasonal changes, doing a census every month or every 3 months is necessary. Monthly surveys are useful to establish a baseline. If the aim is to detect long-term changes, we recommend you conduct useful to establish a baseline. If the aim is to detect long-term changes, we recommend you conduct these censuses annually and in the same month each year. However at the start, you may want to these censuses annually and in the same month each year. However at the start, you may want to census fi sh over several consecutive days to establish the short-term variability.census fi sh over several consecutive days to establish the short-term variability.
What types of fi sh census methods are available?What types of fi sh census methods are available?1. Belt transects1. Belt transects provide diversity estimates and cover a large area per census; (widely used for provide diversity estimates and cover a large area per census; (widely used for
abundance and size estimation);abundance and size estimation);2. Stationary visual census2. Stationary visual census focuses on the relative abundance and frequency of occurrence of all focuses on the relative abundance and frequency of occurrence of all
species at the site (widely used on patch reefs);species at the site (widely used on patch reefs);3. Plotless methods3. Plotless methods (rapid visual census) involve a roving diver swimming randomly and (rapid visual census) involve a roving diver swimming randomly and
counting fi sh to provide more compete information on total species richness.counting fi sh to provide more compete information on total species richness.
Fish
es
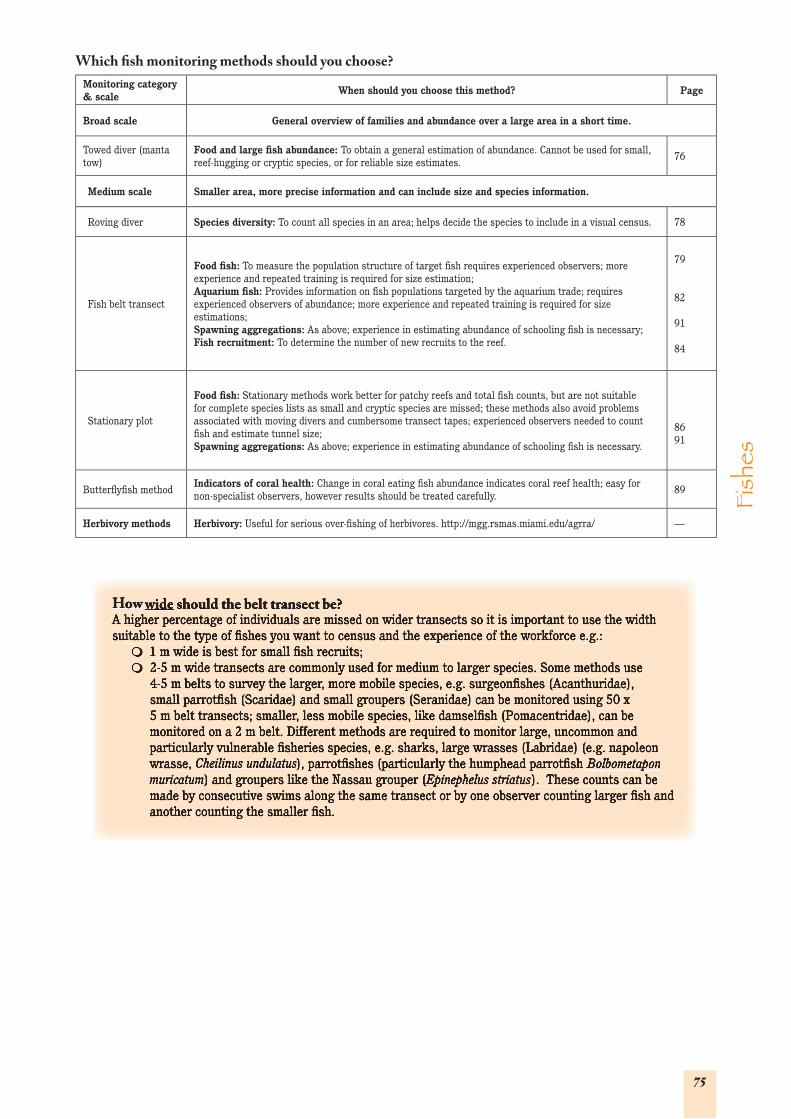
75
Which fi sh monitoring methods should you choose?Monitoring category & scale
When should you choose this method? Page
Broad scale General overview of families and abundance over a large area in a short time.
Towed diver (manta tow)
Food and large fi sh abundance: To obtain a general estimation of abundance. Cannot be used for small, reef-hugging or cryptic species, or for reliable size estimates.
76
Medium scale Smaller area, more precise information and can include size and species information.
Roving diver Species diversity: To count all species in an area; helps decide the species to include in a visual census. 78
Fish belt transect
Food fi sh: To measure the population structure of target fi sh requires experienced observers; more experience and repeated training is required for size estimation;Aquarium fi sh: Provides information on fi sh populations targeted by the aquarium trade; requires experienced observers of abundance; more experience and repeated training is required for size estimations;Spawning aggregations: As above; experience in estimating abundance of schooling fi sh is necessary;Fish recruitment: To determine the number of new recruits to the reef.
79
82
91
84
Stationary plot
Food fi sh: Stationary methods work better for patchy reefs and total fi sh counts, but are not suitable for complete species lists as small and cryptic species are missed; these methods also avoid problems associated with moving divers and cumbersome transect tapes; experienced observers needed to count fi sh and estimate tunnel size;Spawning aggregations: As above; experience in estimating abundance of schooling fi sh is necessary.
8691
Butterfl yfi sh methodIndicators of coral health: Change in coral eating fi sh abundance indicates coral reef health; easy for non-specialist observers, however results should be treated carefully.
89
Herbivory methods Herbivory: Useful for serious over-fi shing of herbivores. http://mgg.rsmas.miami.edu/agrra/ —
How How widewide should the belt transect be? should the belt transect be?A higher percentage of individuals are missed on wider transects so it is important to use the width A higher percentage of individuals are missed on wider transects so it is important to use the width suitable to the type of fi shes you want to census and the experience of the workforce e.g.:suitable to the type of fi shes you want to census and the experience of the workforce e.g.:m m 1 m wide is best for small fi sh recruits;1 m wide is best for small fi sh recruits;m m 2-5 m wide transects are commonly used for medium to larger species. Some methods use 2-5 m wide transects are commonly used for medium to larger species. Some methods use
4-5 m belts to survey the larger, more mobile species, e.g. surgeonfi shes (Acanthuridae), 4-5 m belts to survey the larger, more mobile species, e.g. surgeonfi shes (Acanthuridae), small parrotfi sh (Scaridae) and small groupers (Seranidae) can be monitored using 50 x small parrotfi sh (Scaridae) and small groupers (Seranidae) can be monitored using 50 x 5 m belt transects; smaller, less mobile species, like damselfi sh (Pomacentridae), can be 5 m belt transects; smaller, less mobile species, like damselfi sh (Pomacentridae), can be monitored on a 2 m belt. Different methods are required to monitor large, uncommon and monitored on a 2 m belt. Different methods are required to monitor large, uncommon and particularly vulnerable fi sheries species, e.g. sharks, large wrasses (Labridae) (e.g. napoleon particularly vulnerable fi sheries species, e.g. sharks, large wrasses (Labridae) (e.g. napoleon wrasse, wrasse, Cheilinus undulatusCheilinus undulatus), parrotfi shes (particularly the humphead parrotfi sh ), parrotfi shes (particularly the humphead parrotfi sh Bolbometapon Bolbometapon muricatummuricatum) and groupers like the Nassau grouper () and groupers like the Nassau grouper (Epinephelus striatusEpinephelus striatus) and groupers like the Nassau grouper () and groupers like the Nassau grouper (Epinephelus striatus) and groupers like the Nassau grouper () and groupers like the Nassau grouper ( ). These counts can be ). These counts can be made by consecutive swims along the same transect or by one observer counting larger fi sh and made by consecutive swims along the same transect or by one observer counting larger fi sh and another counting the smaller fi sh.another counting the smaller fi sh.
Fish
es

76
TOWED DIVER (MANTA TOW)
Programs that use this method:m NOAA Fisheries Pacific Islands Fisheries Science Center Coral Reef Ecosystem Division (CRED)
Method description:Towed-diver surveys involve towing two scuba divers behind a boat at a constant speed (~1.5 knots). Each diver manoeuvres a towboard connected to the boat by a bridle and towline and outfitted with survey equipment including digital still or video cameras. The towed-diver fish surveys can be used to conduct rapid assessments of large areas of reef in a short period of time, which can be critical when working at remote sites. Compared to traditional dive surveys, which have limited spatial coverage, the towed-diver surveys are more effective at estimating abundance and density of large mobile fishes. We recommend that the video component of this method only be used for research level monitoring with sufficient funding to buy and maintain equipment. Management and community level monitoring can use the visual part of this method for rapid or large fish surveys. We recommend that habitat type be noted during visual surveys where video is not used.
Information obtained:m Fishes larger than 50 cm total length during the in situ diver surveys;m Fishes larger than 20 cm total length during the digital video analysis; m Fish habitat classification (physiographic zone, habitat type, and rugosity);m Fish diversity (larger, more mobile fishes only).
Field equipment:m 60 m long, 10 mm diameter low-stretch towing line;m Towing bridle affixed to towboard;m Towboard with fitted cut outs or mounts to attach cameras
and other instruments (data sheets and pencil are attached to the towboard);
m Digital video camera;m Depth and temperature recorder (e.g. SBE39);m Waterproof watch with countdown function to signal
intervals for visual assessment;m Separate waterproof watch as backup and to monitor dive
time;m Depth gauge bottom timer (e.g UWATEC); m Magnetic switch telegraph system;m GPS unit in boat to geo-rectify survey track (e.g. Garmin 76); m Depth sounder in boat to maintain constant towing depth.
Lab equipment:m Video player and s-video cable;m High-resolution professional monitor; m ArcView GIS.
Field personnel:m Efficiency is improved when there are two teams so that surface team and dive team can switch roles at the
end of each survey.
Lab personnel:m Analysts experienced in the identification of coral reef fishes to species level, and estimating size class and
abundance.
Field general procedures:m Deploy divers and start surface GPS recording;m After the divers reach the bottom, they coordinate the start of the survey with each other using hand signals
and with the surface support team using the telegraph; m The start entails activating the stopwatch and camera, recording the time on the datasheet, and commencing
the survey (if a camera is used);m The boat coxswain maintains tow speed of ~1.5 knots; currents and sea conditions may require a change in
vessel speed;m Divers attempt to manoeuvre the towboard 1 meter above bottom;
Fish size classes used.
Code Length category (cm)
1 20-34
2 35-49
3 50-74
4 75-99
5 100-149
6 150-199
7 200-249
8 250-299
9 300 and over
Fish
es

77
m The survey is divided into 5 minute segments, which include a 1 minute circle survey and a 4 minute transect. During the circle survey, all fi shes larger than 50 cm total length are recorded in a 360° scan. During the tow survey the diver visually surveys fi shes in a 5 m belt and 10 m in front;
m At the end of the survey (50 minutes, which is ~2 km), the diver with the telegraph alerts the surface support team and divers ascend to begin the safety stop.
Lab general procedures:m View 40% of the tape for fi shes 20-50 cm total length and view 100% of the tape for fi shes > 50 cm total
length;m Tapes are viewed in 10 x 5 minute segments and fi shes are recorded within a 10 m wide belt;m Fishes are identifi ed to species level, where possible and sizes are estimated in size categories;m Habitat classifi cation and rugosity are classifi ed from each 1 minute segment.
Advantages:m A large area is covered in a short time;m Fishes occupying different habitats, e.g. patch reef, sand
fl ats, rubble zones and the transitions between them are observed in a single tow;
m Compared to traditional dive surveys, which have limited spatial coverage, the towed-diver surveys are more effective at estimating abundance and density of large mobile fi shes;
m Rare or uncommon fi shes not encountered during conventional surveys are more likely to be observed during towed-diver surveys because of the larger area;
m The towed-diver video analysis permits more detailed assessment of larger fi shes, including the ability to count the numbers of individuals better within large aggregations of fi shes observed during the in situ surveys;
m Towed-diver surveys are suitable for remote locations that can be visited infrequently;
m Towed divers can survey areas that are unsuitable for roving divers due to strong current, surge, or poor anchorage;
m Use of alternating surface and dive teams increases surveys per day;
m An archived visual record can be re-sampled or re-analysed. This video is also useful to describe benthic characteristics i.e. physiographic zones, habitat types, and rugosity;
m A GPS receiver on the towing boat allows geo-referencing the survey track, linking imagery to location.
Limitations:m Requires experienced divers trained in specifi c hazards of manoeuvring towboards;m Field equipment is expensive and requires regular maintenance, therefore this method is only suited to
research projects with large budgets;m Costly and time-consuming to analyse imagery;m Reduced taxonomic resolution of analysed imagery relative to free-swimming diver fi sh survey methods;m Cryptic fi shes are easily overlooked.
Field training required:m Certifi ed scuba divers trained in safely manoeuvring towboards;m Operation of small boats, GPS units, digital video;m Size determination and identifi cation of fi shes to species; m ArcView GIS
Contact: Ed DeMartini, [email protected]; Stephani Holzwarth, [email protected];Joseph Laughlin, [email protected]; or Brian Zgliczynski, [email protected]
Reference:www.crei.nmfs.hawaii.edu/eco/tow_board.html
Parameters that can be surveyed Parameters that can be surveyed using this method:using this method:
✓ FishesFishes
Monitoring levelMonitoring level::✓ ResearchResearch✓ ManagementManagement✓ CommunityCommunity
Scale: Scale: ✓ BroadBroad
Level of detailLevel of detail::✓ Quantitative and Qualitative.Quantitative and Qualitative.
Causes damage to the reefCauses damage to the reef::✓ NONO
Achievable precisionAchievable precision::✓ LowLow
Fish
es

78
FISH ROVING DIVER TECHNIQUE
Programs that use this method:m Reef Education and Environmental Foundation (REEF); m Atlantic and Gulf Rapid Reef Assessment (AGRRA);m Mesoamerican Barrier Reef System Synoptic Monitoring Program (MBRS SMP);m Caribbean Coastal Marine Productivity Program (CARICOMP).
Information obtained:m Information on abundance of all fi sh species recognised and presented as Log10 index of abundance;m Species presence/absence and frequency of occurrence (among observers);m Relative abundance per site can be obtained by multiplying the index score by frequency of abundance.
Field personnel:m 1 boat driver/surface watchm Minimum of 2 observers (scuba divers). At least 1 diver
must be able to identify all fi sh species in the area.
General procedures:m Usually conducted between 10.00 and 14.00 hours
following belt transects (or concurrently if suffi cient observers);
m One survey conducted per site;m Swim around the site (keeping to a 200 m diameter of the
start) for 30 minutes and record all fi sh species observed;m Approximate the density of each species using logarithmic
categories: Single (1 fi sh), Few (2-10), Many (11-100), or Abundant (>100 fi shes).
Advantages:m Rapid;m Minimal equipment required;m Wide spatial area coverage is possible;m Cumulative frequency data are statistically useful;m Plotless methods are good for species lists;m Particularly useful for large fi sh that are wary of divers,
cryptic species and roving pelagic fi shes that require an intensive search of the reef;
m Length estimations helped by use of two laser beams (if this is within your budget); 4 laser pointers positioned 10 cm apart and project red laser dots outwards (Colin et al. 2003).
Limitations:m Limited by the diver identifi cation skill and effort; requires searching all potential fi sh habitats;m Each dive is the sampling unit and may cover a wide range of depths, and habitats depending on site
topography and habit patchiness. Volunteers concentrate on popular dive sites and are not randomly distributed among habitats. Therefore, there is no control for the following:
l Spatial area covered per sample (diffi cult to compare abundances/sightings between surveys);l Number of micro-habitats covered per sample;l Site selection;l Time of sampling.
m Diver training and skill vary greatly between novices and experts, although REEF tests divers and categorises them into skill levels so that data are sorted by skill levels;
m Abundance estimates constitute an index that requires large numbers of samples for comparative studies and cannot be converted into absolute abundance estimates.
Training required:m Random swims are necessary to ensure the observer is familiar with all fi sh species in the area;m Observers who are part of the REEF program must perform tests that categorise them into skill levels;m Observers must have detailed knowledge of different fi sh habits and habitats.
Reference: REEF: www.reef.org/; MBRS SMP: www.mbrs.org.bz; AGRRA: www.coral.aoml.noaa.gov/agra/CARICOMP: www.ccdc.org.jm/caricomp_main.htmlAlso see Jones and Thompson (1978); Kimmel (1985); Rogers et al. (1994); Almada-Villela et al. (2003).
Parameters that can be surveyed Parameters that can be surveyed using this method:using this method:
✓ FishesFishes
Monitoring level:Monitoring level:✓ CommunityCommunity✓ ManagementManagement
Scale:Scale:✓ Medium Medium ✓ FineFine
Level of detail:Level of detail:✓ Semi-quantitative.Semi-quantitative.
Causes damage to the reef?Causes damage to the reef?✓ NoNo
Achievable precision:Achievable precision:✓ MediumMedium
Fish
es

79
FISH BELT TRANSECT
Programs using this method:m Australian Institute of Marine Science Long-term Monitoring Program of the Great Barrier Reef;m Global Coral Reef Monitoring Network, English et al.;m Reef Check;m Reef Check program’s MAQTRAC method;m Large fi sh belt transect method;m English et al. fi sh recruitment method.
Method description:These methods aim to count (quantify) the abundance and community composition of fi sh on a transect (for more information see ‘belt transects’ p 75). Since fi sh move, it is diffi cult to achieve a uniform sampling method along the transect. Observers should swim at a constant speed and be careful to not count the same fi sh or group of fi sh twice as they can move away from the diver along the transect. Care must also be taken to spend the same amount of time observing each part of the transect.
Field personnel for all belt surveys:m 1 observer and 1 tape layer;m 1 surface watch/boat driver.
Lab personnel:m Data entry, analysis, interpretation and reporting.
Example 1: AIMS LTMP method (research monitoring)Method description:The aim is to instantaneously estimate the abundance of fi sh within a given area (belt transect). Size estimations can be added to this method if desired.
Information obtained:Abundance of target fi sh populationsPhysical parameters:m Cloud cover is measured using the Beaufort scale;m Wind strength (p 79):m Sea state (p 95);m Underwater visibility.
Equipment required:m Tape measures (5 x 50 m);m Spare tape measure to calibrate estimates of belt width.
General procedures:m Conduct this survey between 09.00 and 16.30 hours in the winter and between 08.30 and 17.00 in summer;m First the cloud cover, wind and sea state are recorded (see information obtained above);m Surveys are conducted along the 5 x 50 m permanent transects used for the AIMS LTMP. These transects are
set between 6 and 9 m on the reef slope;m Horizontal water visibility is recorded on entry;m The observer swims ahead of the tape layer and uses the permanent stakes that are positioned every 10 m to
guide their direction. Swim the transect twice; the fi rst time count more mobile, larger fi sh on a 5 m belt; the team swims back along the transect counting less mobile fi sh (e.g. Pomacentridae) in a 1 m belt;
m Observers must look ahead to the next stake and count the fi sh by spending the same amount of time on each part of the transect for each group of target fi sh. The mobile fi sh should be counted fi rst, followed by smaller, slower more cryptic species;
m Only fi sh in the 1+ year age class are counted because of the temporal variability in the 0+ age class.
Fish
es
Parameters measured using this Parameters measured using this method:method:
✓ FishesFishes
Monitoring level:Monitoring level:✓ Community Community ✓ Management Management ✓ Research Research
Scale:Scale:✓ MediumMedium
Causes damage to the reef?Causes damage to the reef?✓ NoNo
Achievable precision:Achievable precision:✓ MediumMedium

80
Advantages:m Laying the tape behind the fish counter reduces the disturbance to fish.
Limitations:m Observers cannot collect adequate data on species composition, abundance, frequency of occurrence and
biomass at the same time;m Transects are impossible to use on some reefs due to complex habitat features, governmental regulations or
accidental interference from other divers;m Some fish are attracted to moving divers; some are repulsed. This biases the results;m Transects are not suitable for sampling small, restricted areas, e.g. some reef microhabitats and areas
damaged by ship groundings, or reefs with different habitat types and habitat heterogeneity (patchiness), characteristic of Caribbean reefs.
Bohnsack and Bohnsack (1986) designed the ‘stationary visual method’ to solve problems with belt transect methods p 86).
Training required:m Fish identification and abundance estimates and detailed knowledge of different fish habits and habitats; size
estimation training if required.
Contact:Hugh Sweatman, [email protected]
Reference: Halford and Thompson (1994); www.aims.gov.auOther references: Brock (1954); Brock (1982); Jokiel et al. (2001); www.cramp.wcc.hawaii.edu/Overview/3._Methods/3._Site_Survey_Protocol/Reef_Fish_Monitoring/
Example 2: Global Coral Reef Monitoring Network, English et al. method (management and research monitoring)Method description:The aim is to simultaneously estimate the abundance and size of fish in a given area (belt transect).
Information obtained:A reconnaissance dive is used to detect differences in reef fish assemblages at different sites using abundance categories. This provides baseline data for zoning, management and monitoring. The visual fish census on the belt transect provides abundance counts and size estimations of individual fish to determine the standing stock and population size structure of specific species. Experienced observers can make actual counts, but for less experienced observers or for numerically abundant fish, abundance categories should be used.
Abundance categories used for counting fishes.
Log 4 Abundance Category Number of fishes
1 1
2 2-4
3 5-16
4 17-64
5 65-256
6 257-1024
7 1025-4096
8 4097-16384
Equipment required:m Tape measures (5 x 50 m);m Spare tape measure to calibrate estimates of belt width;m Fish models to practice fish length estimations (English et al. 1997).
Fish
es

81
General procedures:Reconnaissance divem Conducted during daylight hours;m List the dominant species for inclusion in belt transect counts. This minimises the time needed to write
species names on data sheets, thereby improving the observer’s ability to record fishes continually. The species for inclusion should be selected using the following criteria:
l Visually and numerically dominant, without cryptic behaviour;l Easily identified underwater;l Associated with the reef slope.
m A core group of species appropriate for coral reef assessment should be used to:l Quantitatively estimate abundance and size structure of species that are favoured ‘targets’ of
fishermen, e.g. Serranids, Siganids, Acanthurids, Lutjanids, Lethrinids, Haemulids, Balistids;l Quantitatively estimate the abundance of fishes along the same 50 m line used for the line intercept
transect (p 33); l Semi-quantitatively estimate the relative abundance of other species belonging to major trophic
categories (planktivores, algal grazers, and coral feeders), e.g. Pomacentrids, Acanthurids, Caesionids, Scarids, Siganids, Labrids, Mullids and other species that are ‘visually obvious’, e.g. Chaetodontids.
Belt transectm Conducted during daylight hours along 3 of the same transects as the line intercept (p 33) but the fish census
transects must be 50 m long at 2 depths (3-5 m and 8-10 m);m Wait for 5 to 15 minutes after laying the line before counting to allow fishes to resume normal behaviour;m Swim slowly along the transect recording fish encountered in a 5 m belt and 5 m tunnel above the transect;m Count the actual numbers of target species seen within the transect strip and estimate the size (in cms) of
each of these fish;Do not compromise getting a good overview of the community by trying to count all individuals of some taxa, at the expense of missing estimates of abundance for others.m One diver makes the census within the transect area while the dive buddy swims behind the observer and
makes general observations of the reef environment and fish assemblages;m In areas of high fish diversity and abundance, we recommend that the tasks be separated. This can either be
done in 2 or more passes where different groups of species are counted on each pass, e.g. larger mobile fish on the first pass, and smaller territorial fish on the second pass; or the task can be split up between divers.
Advantages:m Visual census of fishes is one of the most common quantitative and qualitative sampling methods used;m Rapid, non-destructive and inexpensive;m Minimum personnel and specialised equipment required;m The information obtained is useful for management and stock assessment.
Limitations:m Observers must be very well-trained;m Fish may be attracted towards the divers, or actively swim away from the divers;m Observer error and biases occur in estimating numbers and sizes;m There is low statistical power to detect change in rare species;m The use of abundance categories reduces the power to detect small changes.
Training required:m Fish identification, counting and length estimation. See English et al. (1997) for details on training to estimate
length of fishes. This should be repeated every 6 months.
Contact: Sue English, [email protected]
Reference: English et al. (1997);
Fish
es

82
Example 3. Reef Check method (community monitoring)Method description:This method is designed for use by volunteer divers or snorkellers.
Data obtained:Abundance of key target fish.
Equipment required:m Transect tape (100 m);m PVC pole to estimate belt width (optional).
General procedures:m Lay out a 100 m transect tape at each of 2 depths, 2-6 m and 6-12 m;m Wait for 15 minutes;m Transects are 20 m by 5 m wide and 5 m high;m Observer swims slowly along the transect line and stop every 5 m to count target species. The observer then
waits for 1-3 minutes before continuing to the next stop point. This process is repeated 3 times until 20 m of the transect has been surveyed. Here the observer skips a 5 m section before beginning a new 20 m section of transect. One complete transect consist of 4 replicate 20 m segments for a total survey length of 80 m.
Advantages:m Simple to use by a non-professional workforce, therefore cost-effective;m One full survey is sufficient to gain a snapshot of target fish abundance when compared on a regional or
global scale. Increased surveys in time and space are required to gain a more precise picture of abundance and changes through time at the local site scale.
Limitations:m More replicates and more frequent surveys are required to acquire a more reliable indication of local fish
abundance and changes. Increased replication increases cost.
Training required:m Identification of target species (to family and species level for the most common species). Training can be done
in one day.
Contact:[email protected]
Reference:www.reefcheck.org
Example 4. Reef Check Program’s MAQTRAC method (research monitoring)Method description:This method is designed to determine the impact of the aquarium trade on fish populations. The objective is to obtain a sufficient sample size of fish indicator species to be able to compare statistically and distinguish differences between fish collection and control sites.
Data obtained:Species level abundance and size information.
Equipment required:m Transect tape (100 m).
General procedures:The number of transects necessary is dependent upon the density of fish in the area, size of sampling area and spatial heterogeneity of the sampling area. This usually means that a minimum of 5 and as many as 15 transects will be needed to achieve a sufficient sample size for most species.m See Reef Check belt transect method above. The survey depth varies depending on where target fish are
collected;m To record abundance: if individuals of a size class in a group of fish are between 1-50 individuals, count every
fish in that size class. Break the counts up by size classes. When there is a large school of fish, abundance estimates should be made by fitting an imaginary quadrat to the school that is a third or quarter of the size of the school and estimating the abundance of fish in the imaginary quadrat.
Fish
es

83
Timed swimm Timed swims can be conducted beyond the 100 m transect (which is also used for Reef Check PIT and
MAQTRAC invertebrate belt transects) instead of laying out another tape measure. Timed swims should be conducted as the primary survey technique when a species is not sufficiently abundant in belt transect surveys or in habitats that do not allow for a belt transect. Where a timed swim is the only means of obtaining abundance data, it is imperative to estimate the distance swum and record the time accurately.
m The survey is along the same 5 m belt path, but the transect length is measured by the time of the swim instead of a transect tape;
m Note the start and stop time (this is essential);m Maintain a constant swim speed;m When a stop is made to count a large school or to look into crevices, the clock must be stopped and then
restarted when swimming recommences. This is an important step because density measurements may be obtained from the sample time and swim speed;
m Count all individuals of the target species and size in the same manner as on the transect surveys.
Advantages:m The method is statistically robust if there are sufficient replicates. It therefore can be used to detect the
impact of the aquarium trade on fish populations;m The method is designed as a more detailed version of the Reef Check community monitoring method;
therefore, data can be compared with community data.
Limitations:m Difficult to determine if a statistically significant impact is ecologically significant;m Time consuming and costly if many replicates are required.
Training required:m Highly trained to species identification level and fish size estimation. Must have detailed knowledge of fish
habitats to perform searches appropriately.
Contact:[email protected]
Reference:www.reefcheck.org
Other fish methods can easily be altered for aquarium fish, however, many species are very small there is need to determine the optimum sample method size (p 107). See Russ and Choat (1988) for details on experimental design and analysis of fishery data.
Example 5. Large fish belt transect method (any monitoring level)Method description:Observers estimate the abundance of large, mobile fish along belt transects, e.g. grouper and napoleon wrasse.
Data obtained:Abundance estimates of target species.
Equipment required:m No special equipment.
General procedures:Both these surveys are timed swims. It is helpful to estimate the distance the observers cover during survey times so that density estimates can be calculated and compared over time and between sites. Groupers tend to have cryptic behaviour and stay close to the bottom, or hide in caves or under overhangs and ledges. To ensure these are not overlooked, slower swimming speeds are required for visual censuses.
Long-swim technique for larger, mobile reef fishesm Swim for 20 minutes at a standard speed at a constant 5 m depth along the reef front just below the crest (the
crest must be visible);m Record the number and size of all individuals of large target species observed within 10 m on either side of
observer;m For very large mobile species the appropriate transect dimension are 400 m x 20 m. For smaller fish, such as
steephead parrotfish narrower transects (5 m either side) are required.
Fish
es

84
Grouper surveym Swim at a speed of 6 metres per minute for 30 minutes;m Search the substratum thoroughly, count and estimate the size of all individuals within a 5 m belt;m A second observer should follow behind and record the numbers and sizes of any larger mobile groupers
that are within 10 m either side.
Advantages:m Long-swims enable larger areas to be covered in a limited dive time compared to small transects;m Disturbance of fish by divers is minimised as no tapes are used before counting;m These techniques are better suited to fishes that are sensitive to diver activity;m Wider transects for conspicuous species are useful for counting larger fishes that do not allow close
approach;m Slower swim speeds with increased search intensity within a 5 m belt produces higher counts than other
methods for more cryptic groupers;m Long-swim methods are logistically simple and provide useful data in addition to the more established visual
survey methods.
Limitations:m Observers can be trained to swim at constant speeds but it is difficult in a current which alters the area
covered.
Training required:m Identification;m Swimming at a constant speed.
Contact:Rachael Pears, [email protected] or Howard Choat, [email protected]
Reference:Samoilys (1997); Wilkinson et al. (2003).
Example 5. Fish recruitment method (management and research monitoring)Method description:This involves swimming along a narrow belt transect and counting newly settled fish recruits. This provides information on the composition of the new recruits, and the distribution and abundance of reef fish stock (species with conspicuous sedentary juveniles). This is used to predict the future abundance of adult populations as well as provide a temporal picture of changes in recruitment.
Equipment required:m 50 m long fibreglass tape measure;m 1 metre yardstick for a reference length. It is easier if this is attached to a handle making a T-bar.
Field personnel:m 1 boat driver/surface watch;m 2 observers (scuba divers). At least 1 of the divers must be able to identify the fish recruits in the area and be
familiar with the size limits that discriminate the recruits from other year-classes.
Lab personnel:m Data entry, analysis, interpretation and reporting.
General procedures:m 3 x 50 m long transects should be laid randomly at a depth between 6-9 m below the reef crest;m Transects should not overlap and must be separated by 10-20 m;m Lay the transects in a straight line;m If LIT is used at the recruitment sites, it is recommended that it is conducted along the entire 50 m length.
The fish transects must be completed first;m Wait 5-15 minutes before starting the counts to allow fish to resume to normal behaviour;m Swim slowly along the transect and record fish seen within 1 m either side of the transect line;m Count recruits by careful searching habitats along the transect. Count schooling species ahead of the diver;m Transects should not be broken into smaller units as many species are uncommon to rare.
Fish
es

85
Advantages:m Rapid and non-destructive;m Simple and inexpensive;m Minimal number of personnel and equipment.
Limitations:m Requires well-trained and experienced observers;m Visual census of fish recruits is limited to species with conspicuous sedentary juveniles;m Not useful for pelagic species.
Training required:m Detailed training and experience.
Contact:Sue English, [email protected]
Reference:English et al. (1997).
Fish
es

86
FISH STATIONAR Y PLOT SUR VEY
Programs that use this method:m Atlantic and Gulf Reef Rapid Assessment (AGRRA);m Florida Keys National Marine Sanctuary Coral Reef Monitoring Program (FKNMS CRMP).
Method description:Fish inside an imaginary tube are counted by a diver who is observing from outside the area. This method was designed to estimate fi sh community structure and is used to do stock assessments in USA along with traditional fi shery-dependent data.
Information obtained:Species diversity and community size structure.
Equipment required:No special equipment.
Field personnel:m 2 observers (1 of these must be trained in the
methods, the other is a buddy);m 1 boat driver/surface watch.
Lab personnel:m Data entry, analysis, interpretation and reporting.
General procedures:m One observer counts the number of fi sh visually in
an estimated 7.5 m radius tunnel for 5 minutes;m Estimate and record the lengths for each fi sh
counted.
Advantages:Key advantages over transect methods include:m It is easy to use and collect a large sample size;m Minimal equipment is required;m Minimum ‘edge effect’ error;m No time wasted in laying out lines;m Maximum bottom time (due to minimum air consumption);m Provides spatial integrity if multiple habitat types are covered; m Behavioural avoidance and attraction problems are minimised compared to a swimming diver because fi shes
tend to habituate to stationary divers and act more normally;m Bias between observers swimming at different speeds and distances from the substrate is eliminated;m Bias between observers looking in particular hiding places based on special personal knowledge about the
fi sh is eliminated;m Maximum size data are more sensitive to fi shing and adult mortality effects while minimum sizes are
sensitive to recruitment effects;m Data are collected simultaneously on species composition, abundance, frequency of occurrence and individual
lengths for all visually detectable species. These data on all major community parameters can be collected practically with this method;
m The methods of data collection have been extensively tested, refi ned, and are unchanged for the last 25 years;m These techniques are particularly useful for discrete patch reefs or artifi cial reefs.
Parameters that can be surveyed Parameters that can be surveyed using this methodusing this method
✓ FishesFishes
Monitoring level:Monitoring level:✓ ManagementManagement✓ ResearchResearch
Scale:Scale:✓ Medium Medium ✓ FineFine
Level of detail:Level of detail:✓ QuantitativeQuantitative
Causes damage to the reef?Causes damage to the reef?✓ NoNo
Achievable precision:Achievable precision:✓ MediumMediumFi
shes

87
Limitations:m This method is not suitable for crevice-dwelling, cryptic and very secretive fish and inefficient for studies
concerning a few species or genera; m It does not work well under high surge conditions, in strong currents, and under low visibility although
correction factors can be applied to correct for low visibility. However, the method provides consistent and reliable data under a range of visibility conditions normally found on coral reefs;
m An index of abundance (density per sample) can be obtained from the data and is suitable for relative comparisons, however the precision of this method is subject to the ability of observers to estimate the tunnel diameter. If absolute abundance is required, empirically derived habitat-specific correction factors would need to be determined and applied. This is not a problem for most studies that only need to show relative changes or differences;
m The precision achieved is highly dependent on the skills of the diver to estimate the 7.5 m radius.
Improvements to stationary visual census methodm Significant improvements in estimates of the coefficient of variation (an estimate of precision) have been
achieved by using a two stage random stratification for selecting 200 x 200 m sampling sites. These statistical improvements are described in detail in Ault et al. (2001); Ault et al. (2002). Major improvements in precision were achieved by not over sampling individual sites but distributing sample effort over more sites;
m Auto correlation of buddy pairs (who often see the same fish) is reduced and individual difference reduced by combining data from a buddy pair. Replication is provided by having a sample method sampled by a second buddy pair;
m A population size distribution can be generated using mean, maximum, and minimum sized as described by Meester et al. (1999).
Training required:m Fish identification, counting, size estimation and tunnel estimation.
Contact:Robert Ginsburg, [email protected] or Phil Kramer, [email protected]
Reference:AGRRA www.coral.aoml.noaa.gov/agra/FKNMS CRMP: http://www.fknms.nos.noaa.gov/research_monitoring/
The publications cited above can be viewed and downloaded at:www.sefsc.noaa.gov/articlesandpublications.jsp. Also see Kimmel (1985); Bohnsack and Bannerot (1986).
Fish
es

88
FISH RAPID VISUAL CENSUS
Used to determine species diversity. Useful to determine which species to include in long-term monitoring.
Method description:Observers conduct this survey at a constant speed for a fi xed time instead of measuring the area with transect tapes. The method is useful to estimate relative abundance and is based on the assumption that the probability of encountering a species increases with its abundance. Therefore, the more common the species, the sooner the observer is likely to encounter it.
Information obtained:Species diversity and relative abundance presented as frequency of occurrence.
How do you analyse and interpret the data?m Species scores indicate the relative abundance of
different species seen to each other;m Species lists provide an estimation of the species
diversity in an area.
Field personnel:m 1 observer and 1 buddym 1 boat driver/surface watch
Lab personnel:m Data entry, analysis, interpretation and reporting.
General procedures:m The observer swims randomly around a reef to
locate and record as many fi sh species as possible;m The swim should be limited to the specifi c habitat
(depth, reef zone) to determine species richness;m Species are only recorded once when fi rst seen in
the specifi c 10 minute time interval, for a total of fi ve 10 minute intervals. The 10 minute search intervals allows the diver to obtain estimates of the relative abundance of each species in addition to presence or absence data derived from the species lists. The assumption is that the species occurring in early time intervals are the most abundant in the community;
m Fishes occurring in the fi rst 10 minute interval receive a score of 5, those in the second interval 4, and so on with the fi fth interval fi sh scoring 1. Species scores are summed to indicate frequency of occurrence;
m Repeat these counts 8 times per site.
Advantages:m Simple with low equipment requirements;m Avoids time-consuming transecting methods;m Useful for initial surveys of species diversity, and to select species to include in long-term monitoring
according to their abundance; this will affect the reliability of data from the chosen transect length;m Can be implemented on patch reefs if time intervals are stopped when swimming between reef areas.
Limitations:m Data cannot be directly compared with coral cover or key macro-invertebrates data as different areas are
examined;m As with all fi sh census methods, species diversity is estimated as many cryptic species may be overlooked;m The method over-emphasises the importance of widespread though rarer species (common for fi sh on coral
reefs), while under-estimates patchy but abundant fi shes.
Training required:m Species identifi cation and detailed knowledge of different fi sh habits and habitats.
Reference:Jones and Thompson (1978); Kimmel (1985).
Parameters that can be surveyed Parameters that can be surveyed using this method?using this method?
✓ FishesFishes
Monitoring level:Monitoring level:✓ ManagementManagement✓ ResearchResearch
Scale:Scale:✓ Medium Medium ✓ FineFine
Level of detail:Level of detail:✓ QuantitativeQuantitative
Causes damage to the reef?Causes damage to the reef?✓ NoNo
Achievable precision:Achievable precision:✓ Medium Medium
Fish
es

89
BUTTERFLY FISH METHOD
Major programs using this method:This method is used by researches in Hawaii. No major programs use this method.
Method description:This method involves observing butterfl y fi sh chasing and feeding behaviour to determine the abundance of food and habitat per butterfl y fi sh pair. Percentage cover of benthic communities should also be determined. The concept is based on the assumption that coral-feeding butterfl yfi sh will move away from a reef area when coral health deteriorates.
Equipment required:m 30 m long brightly coloured propylene line approximately 1
cm in diameter and marked every metre;m Underwater slate with 20 cm ruler attached.
General procedures:m Should be implemented at a minimum of 2 study sites
where one site is a control (no known anthropogenic disturbances);
m The basic level estimates fi sh abundance; the advanced level measures fi sh behaviour and territory size (resource dependent).
Abundance estimatesm Place up to 4 x 30 m transects on areas of high coral cover
(not haphazardly);m Swim slowly at 6 m per minute along the transect and
record target butterfl y fi sh abundance along a 10 m wide belt transect.
Percentage cover of benthic communitiesSee ‘percentage cover of benthic communities’ (p 16). We recommend use of point intercept transect method as the easiest method for non-professionals (p 36).
Chasing behaviour (expected to increase as food becomes limited)m Implemented after the abundance survey;m This survey is conducted during 5 x 10 minute observation periods. The diver swims along the transect to the
fi rst pair of butterfl y fi sh;m The boundary of their territory is marked out (furthest edges where they move);m Observe the fi sh behaviour for 10 minutes;m Note each time the target pair chases a fi sh in an adjacent territory;m Repeat for the same pair for 50 minutes of observations; m These observations do not need to be implemented during one dive, but consecutive dives should be
implemented as soon as safety requirements allow;m Estimate the size of the target fi sh by noting the position of their beak and rear eyespot or tail on a coral
when they are feeding, when they move away, measure the area with a ruler attached to the slate.
Feeding behaviour (to determine preferred food)m Observe feeding behaviour for 3 x 10 minute periods;m Note the number of bites on a particular species of coral;m Calculate the numbers of bites per 10 minutes for each coral species.
Measuring territory size (expected to increase with food shortage)m Mark the territory boundary (circular or oval) with colour-tagged nails; m Stretch a measuring tape across the longest axis of the territory and anchor it at both ends with a small
weight;m While one diver holds one end of the second tape at each meter interval along the fi rst tape, the second diver
measures the distance to the boundary of the territory;m The territory size is calculated by adding up all the values on the data sheet.
Fish
es
Monitoring level:Monitoring level:✓ CommunityCommunity✓ ManagementManagement✓ ResearchResearch
Scale:Scale:✓ Broad Broad ✓ MediumMedium
Level of detail:Level of detail:✓ Quantitative Quantitative
Causes damage to the reef?Causes damage to the reef?✓ No No
Achievable precision:Achievable precision:✓ MediumMedium

90
Field personnel:m 2 observers;m 1 boat person/surface watch.
Lab personnel:m Calculate feeding behaviour and territory size measurements;m Data analysis, interpretation and reporting.
Advantages:m Simple and inexpensive;m Can be implemented by individuals with no previous technical training;m Sensitive to slowly changing conditions on the reef; coral-eating butterflyfish will enlarge their territory if the
density of their food decreases, therefore observing territory size can indicate gradual coral decline that might not be significant from direct observations of coral cover;
m Stepwise design where more information can be added where resources and personnel capacity allow.
Limitations:m It is easier to measure coral cover directly i.e. by doing the point intercept transect.
Training required:m No formal scientific training is required but 1 or 2 key coralivores must be recognised per geographic location.
Reference:Crosby and Reese (1996).
Fish
es
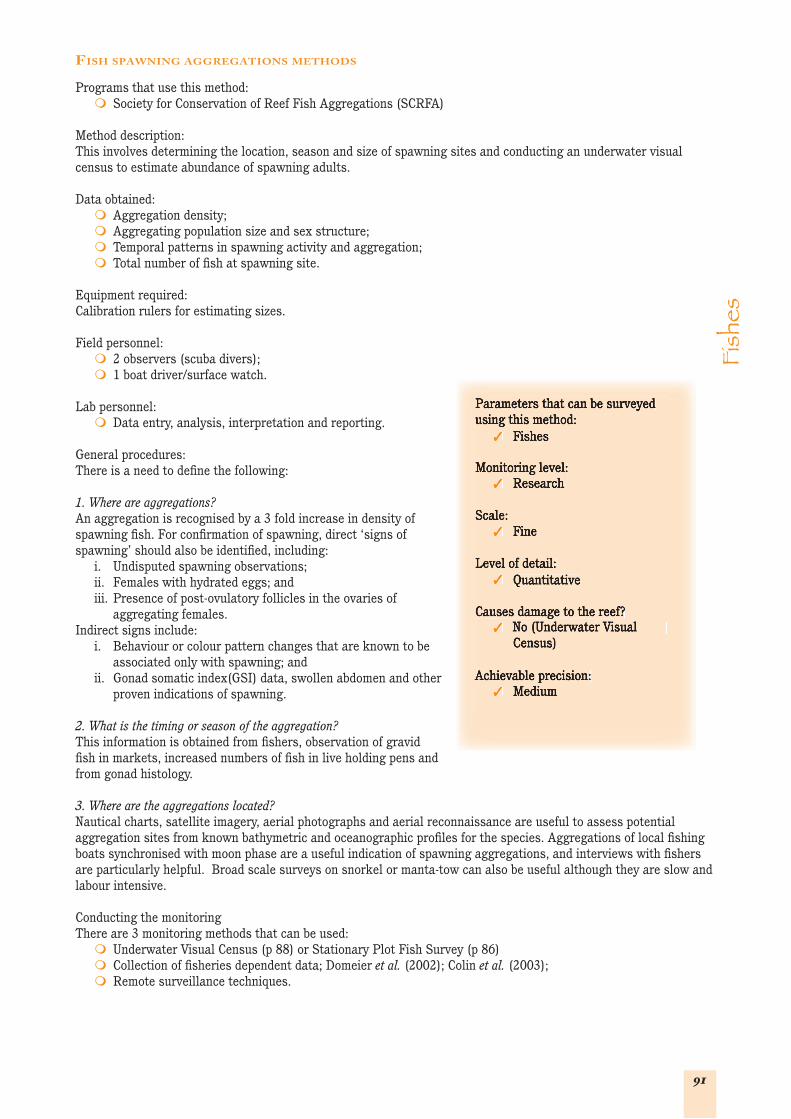
91
FISH SPAWNING AGGREGATIONS METHODS
Programs that use this method:m Society for Conservation of Reef Fish Aggregations (SCRFA)
Method description:This involves determining the location, season and size of spawning sites and conducting an underwater visual census to estimate abundance of spawning adults.
Data obtained:m Aggregation density;m Aggregating population size and sex structure;m Temporal patterns in spawning activity and aggregation;m Total number of fi sh at spawning site.
Equipment required:Calibration rulers for estimating sizes.
Field personnel:m 2 observers (scuba divers);m 1 boat driver/surface watch.
Lab personnel:m Data entry, analysis, interpretation and reporting.
General procedures:There is a need to defi ne the following:
1. Where are aggregations?An aggregation is recognised by a 3 fold increase in density of spawning fi sh. For confi rmation of spawning, direct ‘signs of spawning’ should also be identifi ed, including:
i. Undisputed spawning observations; ii. Females with hydrated eggs; and iii. Presence of post-ovulatory follicles in the ovaries of
aggregating females. Indirect signs include:
i. Behaviour or colour pattern changes that are known to be associated only with spawning; and
ii. Gonad somatic index(GSI) data, swollen abdomen and other proven indications of spawning.
2. What is the timing or season of the aggregation?This information is obtained from fi shers, observation of gravid fi sh in markets, increased numbers of fi sh in live holding pens and from gonad histology.
3. Where are the aggregations located?Nautical charts, satellite imagery, aerial photographs and aerial reconnaissance are useful to assess potential aggregation sites from known bathymetric and oceanographic profi les for the species. Aggregations of local fi shing boats synchronised with moon phase are a useful indication of spawning aggregations, and interviews with fi shers are particularly helpful. Broad scale surveys on snorkel or manta-tow can also be useful although they are slow and labour intensive.
Conducting the monitoring There are 3 monitoring methods that can be used:m Underwater Visual Census (p 88) or Stationary Plot Fish Survey (p 86)m Collection of fi sheries dependent data; Domeier et al. (2002); Colin et al. (2003);m Remote surveillance techniques.
Fish
es
Parameters that can be surveyed Parameters that can be surveyed using this method:using this method:
✓ FishesFishes
Monitoring level:Monitoring level:✓ ResearchResearch
Scale:Scale:✓ FineFine
Level of detail:Level of detail:✓ QuantitativeQuantitative
Causes damage to the reef?Causes damage to the reef?✓ No (Underwater Visual No (Underwater Visual
Census)Census)
Achievable precision:Achievable precision:✓ MediumMedium

92
Underwater Visual Census for spawning aggregationsVisual surveys within a path that traverses the aggregation site are recommended. For diver-shy species, stationary counts are recommended. Timed swims are not recommended because they do not provide quantitative data. The following criteria will determine which methods are applicable:m Site depth;m Density of fish;m Currents (when strong currents or when fish may be wary of divers in close proximity. Stationary plots may be
more appropriate here with a tethered observer to save energy).
Parameters measured:m Number of fish per unit area;m Size;m Sex ratios;m Behaviour;m Location on site (mapping).m Measure aggregation areas. Mark the border of the site while doing the survey and return to measure this
later. Marks can include placing painted rocks or weights with floats;m If possible, video the transect during the visual assessment in order to determine accurate abundance
estimates; remote videos are useful for fish that avoid humans.
Advantages:m Non-destructive method;
Limitations:m Monitoring more than one aggregation site can require several teams of observers if aggregations occur at the
same time, which is frequent with transient spawning fishes;m Due to inherent variation in spawning aggregation location and timing both seasonally and during the
aggregation itself, it is not possible to visit a site only once and expect survey data to be meaningful. Careful planning is essential;
m Because every spawning site is different, the survey methods suggested here should only be taken as guidelines;
m Since most aggregations occur where there is significant coral cover, often with an abundance of hiding places, fish that are hidden in crevices or under ledges will cause an underestimate of the actual numbers;
m Very difficult to validate the accuracy of any fish counts in aggregations so any interpretations must be made carefully. Repeated analysis of video is one option, but not without error and not suitable for all fish species;
m Size data must be interpreted with care, because estimates of minimum and maximum sizes are approximate;m Determining sex is only possible for species that have obvious size or colour differences.
Training required:m Trained for aggregation monitoring; contact the Society for Conservation of Reef Fish Aggregations (SCRFA);m Observer bias, training in length estimation, recognition of species and spawning behaviour, disruption of
fish behaviour by divers are factors to consider. Whenever possible, fishers and other stakeholders should be involved in observer training programs.
Reference:See Domeier et al. (2002); Colin et al. (2003) for fisheries dependent data and remote surveillance techniques; www.scrfa.org/
The Nature Conservancy is developing a manual for monitoring grouper spawning aggregations in the Indo Pacific. See www.nature.org
Fish
es

93
Fish
es
Tabl
e 9.
Sum
mar
y of
the
mai
n m
onit
orin
g m
etho
ds u
sed
for
fishe
s in
the
Ind
o-P
acifi
c re
gion
(M
iddl
e E
ast,
Wes
tern
Ind
ian
Oce
an, S
outh
Asi
a,
Sout
heas
t an
d E
ast
Asi
a, W
ider
Pac
ific
Oce
an).
Mon
itor
ing
leve
lP
aram
eter
s m
easu
red
Met
hod
nam
eR
efer
ence
and
con
tact
Pag
e
Com
mun
ity
Med
ium
Sc
ale
Gen
eral
fish
abu
ndan
ceFi
sh v
isua
l bel
t ce
nsus
Ree
f Che
ck: w
ww
.ree
fche
ck.o
rg82
Larg
e fis
h La
rge
fish
belt
tra
nsec
tSa
moi
lys
1997
; Wilk
inso
n et
al.
2003
83
But
terfl
y fis
hB
utte
rfly
fish
as r
eef h
ealt
h in
dica
tors
Cros
by a
nd R
eese
199
6: w
ww
.cor
al.n
oaa.
gov/
them
es/b
utte
rfl.p
df89
Man
agem
ent
Med
ium
Sc
ale
Bio
dive
rsit
y &
gen
eral
ab
unda
nce
Fish
vis
ual b
elt
cens
us &
Rov
ing
dive
r te
chni
que
Glo
bal C
oral
Ree
f Mon
itor
ing
Net
wor
k, E
nglis
h et
al.,
199
7, w
ww
.gcr
mn.
org
Jone
s an
d T
hom
pson
197
8; K
imm
el 1
985;
Rog
ers
et a
l. 19
94; A
lmad
a-Vi
llela
et a
l. 20
0379 78
Larg
e fis
h La
rge
fish
belt
tra
nsec
tSa
moi
lys
1997
; Wilk
inso
n et
al.
2003
83
Bio
dive
rsit
yR
apid
vis
ual b
elt
cens
usJo
nes
and
Tho
mps
on, 1
978;
Kim
mel
198
5; R
oger
s et
al.
1994
: car
s.er
.usg
s.go
v/Co
ral_
Ree
f_E
colo
gy/c
oral
_ree
f_ec
olog
y.ht
ml
78
Fish
rec
ruit
men
tFi
sh r
ecru
itm
ent
belt
tr
anse
ctG
loba
l Cor
al R
eef M
onit
orin
g N
etw
ork,
Eng
lish
et a
l., 1
997,
ww
w.g
crm
n.or
g79
Gen
eral
fish
abu
ndan
ce &
si
zeFi
sh v
isua
l bel
t ce
nsus
Glo
bal C
oral
Ree
f Mon
itor
ing
Net
wor
k, E
nglis
h et
al.,
199
7, w
ww
.gcr
mn.
org
79
But
terfl
y fis
hB
utte
rfly
fish
reef
hea
lth
indi
cato
rsCr
osby
and
Ree
se 1
996:
ww
w.c
oral
.noa
a.go
v/th
emes
/but
terfl
89
Fish
spa
wni
ng a
ggre
gati
ons
Fish
spa
wni
ng a
ggre
gati
ons
visu
al c
ensu
sSo
ciet
y fo
r Co
ral R
eef F
ish
Agg
rega
tion
s, D
omei
er e
t al.
2002
; Col
in e
t al.
2003
: ww
w.s
crfa
.org
/91
Man
agem
ent
Fine
Sc
ale
Fish
her
bivo
ryFi
sh h
erbi
vory
imag
inar
y qu
adra
tsSu
gges
t: A
tlan
tic
and
Gul
f Rap
id R
eef A
sses
smen
t, S
tene
ck 1
985:
htt
p://
mgg
.rsm
as.m
iam
i.edu
/agr
ra/
-
Res
earc
h M
ediu
m
Scal
e
Aqu
ariu
m fi
shA
quar
ium
fish
bel
t tr
anse
ctM
AQ
TR
AC
(Ree
f Che
ck):
ww
w.r
eefc
heck
.org
82
Larg
e fis
hLa
rge
fish
belt
tra
nsec
tSa
moi
lys
1997
; Wilk
inso
n et
al.
2003
83
Bio
dive
rsit
yR
apid
vis
ual c
ensu
sJo
nes
and
Tho
mps
on, 1
978;
Kim
mel
198
5; R
oger
s et
al.
1994
: car
s.er
.usg
s.go
v/Co
ral_
Ree
f_E
colo
gy/c
oral
_ree
f_ec
olog
y.ht
ml
26, 8
8
Fish
rec
ruit
men
tFi
sh r
ecru
itm
ent
belt
tr
anse
ctG
loba
l Cor
al R
eef M
onit
orin
g N
etw
ork,
Eng
lish
et a
l., 1
997,
ww
w.g
crm
n.or
g84
Res
earc
h Fi
ne S
cale
Fish
spa
wni
ng a
ggre
gati
ons
Fish
spa
wni
ng a
ggre
gati
ons
visu
al c
ensu
sSo
ciet
y fo
r Co
ral R
eef F
ish
Agg
rega
tion
s, D
omei
er e
t al.
2002
; Col
in e
t al.
2003
: ww
w.s
crfa
.org
/91

94
Fish
es
Tabl
e 10
. Su
mm
ary
of t
he m
ain
mon
itor
ing
met
hods
use
d in
the
Car
ibbe
an a
nd A
tlan
tic
for
fishe
s.
Mon
itor
ing
leve
lP
aram
eter
s m
easu
red
Met
hod
nam
eR
efer
ence
and
con
tact
Pag
e
Com
mun
ity
Med
ium
Sc
ale
Spec
ies
dive
rsit
y &
gen
eral
ab
unda
nce
Rov
ing
dive
r te
chni
que
Ree
f Env
iron
men
tal E
duca
tion
Fou
ndat
ion:
ww
w.r
eef.o
rg/
78
Gen
eral
fish
abu
ndan
ceFi
sh v
isua
l bel
t ce
nsus
Ree
f Che
ck: w
ww
.ree
fche
ck.o
rg79
Larg
e fis
h La
rge
fish
belt
tra
nsec
tSu
gges
t: S
amoi
lys
1997
; Wilk
inso
n et
al.
2003
83
Man
agem
ent
Med
ium
Sc
ale
Spec
ies
dive
rsit
y &
gen
eral
ab
unda
nce
Rov
ing
dive
r te
chni
que
Mes
oam
eric
an B
arri
er R
eef S
yste
m S
ynop
tic
Mon
itor
ing
Pro
gram
: ww
w.m
brs.
org.
bz; A
tlan
tic
and
Gul
f Rap
id R
eef
Ass
essm
ent:
ww
w.c
oral
.aom
l.noa
a.go
v/ag
ra/;
Cari
bbea
n Co
asta
l Mar
ine
Pro
duct
ivit
y P
rogr
am: w
ww
.ccd
c.or
g.jm
/ca
rico
mp_
mai
n.ht
ml
Jone
s an
d T
hom
pson
197
8; K
imm
el 1
985;
Rog
ers
et a
l. 19
94; A
lmad
a-Vi
llela
et a
l. 20
03
78
Gen
eral
fish
abu
ndan
ce &
si
zeSt
atio
nary
plo
t vi
sual
cen
sus
Atl
anti
c an
d G
ulf R
apid
Ree
f Ass
essm
ent:
ww
w.c
oral
.aom
l.noa
a.go
v/ag
ra/
Flor
ida
Key
s M
arin
e N
atio
nal S
anct
uary
Cor
al R
eef M
onit
orin
g P
rogr
am: fl
orid
akey
s.no
s.no
aa.g
ov/;
Rog
ers
et a
l. 19
94:
cars
.er.u
sgs.
gov/
Cora
l_R
eef_
Eco
logy
/cor
al_r
eef_
ecol
ogy.
htm
lK
imm
el 1
985;
Boh
nsac
k an
d B
anne
rot
1986
86
Larg
e fis
h La
rge
fish
belt
tra
nsec
tSu
gges
t: S
amoi
lys
1997
; Wilk
inso
n et
al.
2003
83
Spec
ies
dive
rsit
yR
apid
vis
ual c
ensu
sJo
nes
and
Tho
mps
on, 1
978;
Kim
mel
198
5; R
oger
s et
al.
1994
: car
s.er
.usg
s.go
v/Co
ral_
Ree
f_E
colo
gy/c
oral
_ree
f_ec
olog
y.ht
ml
88
Man
agem
ent
Fine
Sc
ale
Fish
her
bivo
ryFi
sh h
erbi
vory
imag
inar
y qu
adra
tsA
tlan
tic
and
Gul
f Rap
id R
eef A
sses
smen
t, S
tene
ck 1
985:
ww
w.c
oral
.aom
l.noa
a.go
v/ag
ra/
—
Res
earc
h M
ediu
m
Scal
eG
ener
al fi
sh a
bund
ance
&
size
Stat
iona
ry p
lot
visu
al c
ensu
s
Atl
anti
c an
d G
ulf R
apid
Ree
f Ass
essm
ent:
ww
w.c
oral
.aom
l.noa
a.go
v/ag
ra/;
Flor
ida
Key
s M
arin
e N
atio
nal S
anct
uary
Co
ral R
eef M
onit
orin
g P
rogr
am: fl
orid
akey
s.no
s.no
aa.g
ov/;
Rog
ers
et a
l. 19
94: c
ars.
er.u
sgs.
gov/
Cora
l_R
eef_
Eco
logy
/co
ral_
reef
_eco
logy
.htm
lK
imm
el 1
985;
Boh
nsac
k; B
anne
rot
1986
86
Larg
e fis
h La
rge
fish
belt
tra
nsec
tSu
gges
t: S
amoi
lys
1997
; Wilk
inso
n et
al.
2003
83
Spec
ies
dive
rsit
yR
apid
vis
ual c
ensu
sJo
nes
and
Tho
mps
on, 1
978;
Kim
mel
198
5; R
oger
s et
al.
1994
: car
s.er
.usg
s.go
v/Co
ral_
Ree
f_E
colo
gy/c
oral
_ree
f_ec
olog
y.ht
ml
88
Fish
spa
wni
ng a
ggre
gati
ons
Fish
spa
wni
ng a
ggre
gati
ons
visu
al c
ensu
sSo
ciet
y fo
r Co
ral R
eef F
ish
Agg
rega
tion
s, D
omei
er e
t al.
2002
; Col
in e
t al.
2003
: ww
w.s
crfa
.org
/91

95
8: MONITORINGPHYSICAL PARAMETERS
Monitoring physical parameters complements ecological monitoring where direct changes to the reef are measured. Monitoring the physical environment of coral reefs helps managers to determine the cause of reef degradation or recovery.
Categories discussed here are:m Water and air temperature;m Salinity;m Wind strength and sea state;m Water quality;
l Turbidity;l Sedimentation.
WATER AND AIR TEMPERATURE
Corals require a water temperature range between18 to 32°C. Temperatures above or below the local range can cause stress to corals. Global Climate Change is causing high sea surface temperatures in El Niño and also La Niña years, which stress corals and cause them to bleach. It is important to monitor water temperature fluctuations to help understand what temperature changes cause corals to bleach and eventually whether they recover or die.
Water temperatures are measured using a mercury thermometer enclosed in protective casing. Temperature readings should be taken in the air, and the water temperature just below the surface and at the depth of your survey. See the GCRMN recommended methods (English et al. 1997).
SALINITY
Corals prefer a salinity range of 3.2% to 4.2%, and surface salinity can decrease when fresh water is added e.g. floods or pollution from industry, or increase if surface water evaporates. Changes may cause stress to corals therefore it is useful to monitor salinity using a refractometer. Water samples from the surface and survey depth can be collected in sealed plastic containers and the salinity measured on the surface. See GCRMN recommended methods (English et al. 1997).
WIND STRENGTH AND SEA STATE
This is useful when monitoring fish, as abundance of fish at a site changes according to the weather conditions. Categories for measurements are below.
Wind strength category Wind strength (knots)
0 01 0-52 6-103 11-154 16-205 21-25
Sea state Description
Calm Mirror-like to small ripples
Slight Large wavelets, crests breaking
Moderate Many white caps forming
Rough Large waves, 2-3 m, white caps
Phys
ical

96
WATER QUALITY
Water pollution from human land-use is a serious threat to coral reefs around the world, however water quality monitoring can be expensive and requires measuring those pollutants that are released into your area. These may include suspended sediment (below), nutrients (nitrogen and phosphorus compounds), toxic metals (e.g. lead, cadmium and copper), petroleum hydrocarbons (lubrication oils and fuels), pesticides, organochlorine wastes and organic matter.
TurbidityTurbidity is the amount of suspended sediment and plankton in the water column. Turbidity is often higher following storms when sediments are resuspended in the water column or washed onto the reef from land. Secchi discs are commonly used to measure turbidity. The disc is split into 2 white and 2 black sections and attached to a length of rope with knots at metre distances. The disc is lowered into the water column and the turbidity is measured by the distance at which you can no longer see the disc. Secchi disc measurements should be taken on a clear day within 2 hours of noon (English et al. 1997).
SedimentationSedimentation is the sediment load that arrives onto the reef. Sedimentation rates are measured using sediment traps. You can also look at the content of the sediments to determine infl ux of zooplankton (food for corals etc.).
SEDIMENTATION TRAPS
Programs that use this method:m English et al. is the GCRMN recommended method;m Meso-American Barrier Reef System – Synoptic Monitoring Program (MBRS SMP).
Method description:This involves attaching a PVC sediment trap to the reef and left for up to 3 months to collect sediments settling on the reef. This method can be used to detect temporal change, for example, impact assessment.
Information obtained:Measure of sedimentation rates. This is presented as weight of sediment (g) per unit time.
Equipment required:m PVC pipe with a 5 cm internal diameter, 11.5 cm length and sealed at one end;m Lid to seal the sediment trap before removal;m 2-6 baffl es at the top of the pipe to stop unwanted animals or objects getting into the tube;m Drying oven (to 60°C);m Balance to 1 mg sensitivity.
Field personnel:m 1 boat driver/surface watchm 2 scuba divers
Phys
ical
Water quality monitoring is technical and requires a high level of expertise. These methods are not Water quality monitoring is technical and requires a high level of expertise. These methods are not described here; see MBRS SMP manual described here; see MBRS SMP manual www.www.mbrs.org.bmbrs.org.bzz for more information or Wilkinson for more information or Wilkinson et al.et al. 2003 2003 for explanation.for explanation.
Monitoring level: Monitoring level: ✓ ManagementManagement✓ ResearchResearch
Parameters that can be surveyed Parameters that can be surveyed using this methodusing this method
✓ Physical parametersPhysical parameters
Scale:Scale:✓ FineFine
Level of detail:Level of detail:✓ QuantitativeQuantitative
Causes damage to the reef?Causes damage to the reef?✓ NoNo
Achievable precision:Achievable precision:✓ HighHigh

97
Lab personnel:m Lab technician to process samples;m Data entry, analysis, interpretation and reporting.
General procedures:m Hammer steel rods deep into the substratum; m Attach 3 sedimentation traps to each rod 20 cm above the substrate;m 4 sets are recommended at 3 m depth. If desired, place 2 additional sets either side of permanent benthic
transects or quadrats (‘monitoring benthic communities’ p 27);m Seal the traps before removal;m Remove on a 1-3 monthly basis;m In the lab, filter, dry (at 60°C) and weigh the sample to obtain the dry weight to the nearest milligram.
Advantages:m Equipment is fairly cheap;m Quantitative temporal data on sedimentation rates;m Simple to deploy, collect and process.
Limitations:m Traps cannot be left for long periods (over 3 months);m Inefficient in currents with water velocity over 20 cm / second;m Frequent visits to field sites to collect and replace traps.
Training required:m Minimal field and lab training
Contact:Sue English, [email protected]
Reference:English et al. 1997;See: www.aims.gov.au and www.gcrmn.org
Also see the MBRS SMP protocol by Almada-Villela et al. 2003a; www.mbrs.org.bz and Rogers et al. (1994).
Phys
ical

98
9: MONITORING PROGRAMS
HOW DO YOU PUT A MONITORING PROGRAM TOGETHER?
A program consists of a selection of monitoring protocols structured around methods that together provide information for effective reef management. The actual protocols and methods that you choose will depend upon the information needed for the specific reef, the size of the area, and the available resources of people, time, equipment and money. There are a number of major programs that use a selection of methods. It may help you to decide by looking at the methods in the major programs.
MAJOR PROGRAMS
There are major international efforts underway to conserve the coral reefs of the world against a range of damaging threats. These efforts include providing funds and expertise aimed at improving monitoring for all types of coral reefs. The International Coral Reef Initiative (ICRI) started in 1994 and formed the Global Coral Reef Monitoring Network (GCRMN) in 1995 to improve and implement coral reef monitoring in all parts of the coral reef world. One task of the GCRMN is to assist developing countries implement monitoring of reefs, especially in MPAs. Reef Check was formed in 1997 to facilitate volunteer and community monitoring. Another ICRI network is ICRAN (International Coral Reef Action Network) which is stimulating coral reef management, again with a focus on MPAs. They are focusing on key demonstration sites where there is already effective management and monitoring with the aim of assisting nearby regions. There are also regional monitoring programs: CORDIO; AGRRA; CARICOMP.
Data from all monitoring programs can be lodged in the global database, ReefBase, which contains data and considerable information on reefs all over the world (www.reefbase.org). This information is reported in the GCRMN ‘Status of Coral Reefs of the World’ reports every 2 years. The use of either Reef Check or GCRMN methodology provides the added advantage of obtaining assistance from these global coral reef monitoring programs, as well as better recognition as part of a global program. Thus it is possible for all MPA managers to link into global and regional networks and gain the benefit of the experience in monitoring methods, protocols, database analyses and reporting in these programs. In turn, your data and experience can contribute to the global effort to conserve coral reefs.
Global Coral Reef Monitoring Programsm Global Coral Reef Monitoring Network – Management and Research monitoring, p 99;m Reef Check – Community Monitoring, p 100.
Major regional coral reef monitoring programsm Atlantic and Gulf Rapid Reef Assessment (AGRRA)m Caribbean Coastal Marine Productivity Program (CARICOMP)m Coral Reef Degradation in the Indian Ocean (CORDIO)m Commission de l’Ocean Indien (COI)m Mesoamerican Barrier Reef System – Synoptic Monitoring Program (MBRS SMP)m Florida Keys National Marine Sanctuary Program (FKNMSP)m NOAA Fisheries Pacific Islands Fisheries Science Center Coral Reef Ecosystem Division (CRED)m RECON (Reef Condition) of the Ocean Conservancy
The tables on pages 108 to 111 describe the methods used in the major global programs and many of the regional and national monitoring programs.
Prog
ram
s

99
The Global Coral Reef Monitoring Network Program description:The Global Coral Reef Monitoring Network (GCRMN) is an operational unit of the International Coral Reef Initiative (ICRI) reporting on the status of coral reefs and raising awareness on the need for urgent action. The GCRMN is in partnership with ReefBase, Reef Check, and consists of people, governments, institutes and NGOs monitoring coral reefs in 80 countries. It is also a partnership of other monitoring programs including: m Reef Check;m Coral Reef Degradation in the Indian Ocean (CORDIO); m Caribbean Coastal Marine Productivity Program
(CARICOMP); m Atlantic and Gulf Rapid Reef Assessment (AGRRA); andm Other monitoring programs.
The GCRMN seeks to encourage and coordinate three overlapping levels of monitoring: community, management and research; and functions as a network of independent Regional Nodes that coordinate training, monitoring and databases within participating countries and institutes in regions based on the UNEP Regional Seas Programme.
Protocols used:m English et al. for the Indo-Pacifi c region (English et al. 1997);m Protocols used by GCRMN partners.
An example of a GCRMN recommended program:Benthic communities:m Line intercept transect, 5 x 20 m transects at 3-5 m depth per site; for percent cover estimates, p 33;m Tagging coral colonies; for detailed information on specifi c corals affected by bleaching, disease or to measure
growth, p 53;m Coral recruitment tiles; to obtain information on the recovery potential of a reef, p 58.
Invertebratesm Manta tow, minimum of 9 x 2 minute tows per site; measures the abundance of large invertebrates, such as
COTS, giant clams or Diadema over a large area; also useful for bleaching studies and site selection, p 22.
Fishesm Fish belt transects 3 x 50 m in tunnel 5 m wide and 5 m high; for abundance and size estimates of target and
ecologically important species p 79;
Physical parameters:m Sedimentation traps; p 96;m Water quality. p 96
Scope of programm Program support;m Regional database; data are submitted to ReefBase www.reefbase.orgm Standard database format recommended; English et al. 1997;m Standard coding system and data sheet template;m Data analysis and publication.
Public participation, education and awarenessHigh. This is achieved at all levels, communities through Reef Check, to managers and scientists through the GCRMN network.
Management support:The GCRMN assists monitoring by providing manuals, some equipment, databases, training, problem solving and help with fi nding funds for monitoring. A major product of the GCRMN is the ‘Status of Coral Reefs of the World’ report that is produced every 2 years; www.aims.gov.au/pages/research/coral-bleaching/scr2002/scr-00.html.
Contact details: Clive Wilkinson, [email protected]
Reference: www.gcrmn.org
Monitoring level:Monitoring level:✓ Management Management ✓ ResearchResearch
Prog
ram
s

100
Reef CheckProgram description:Reef Check was developed in 1996 as a volunteer, community-based monitoring protocol designed to measure the health of coral reefs on a global scale. The aims of Reef Check are to:m Educate the public and governments about the value of coral reefs and the crises facing them;m Create a global network of volunteer teams, trained and led
by scientists, that regularly monitor and report on reef health using standard methods;
m Facilitate collaborative use of reef health information by community groups, governments, universities and businesses to design and implement ecologically sound and economically sustainable solutions;
m Stimulate local action to protect remaining pristine reefs and rehabilitate damaged reefs worldwide.
Reef Check is the only global-scale, volunteer-based organisation that measures reef health using standard methods. Teams that can only survey one site should chose the ‘best’ site with few human impacts; if several sites can be surveyed, they should include representative of the most impacted, moderate and least impacted
Protocols used:m Reef Check (community monitoring)m MAQTRAC (research monitoring of the aquarium trade)
An example of a Reef Check programAny anecdotal information (site description survey).
Benthic communitiesm Reef Check point intercept transect; measures the percent cover of benthic communities, p 36;
Key macro-invertebratesm Reef Check belt transect; measures the abundance of key invertebrates and impacts such as coral
bleaching, disease, physical damage and trash.Fishes m Reef Check fi sh belt transect; measures the abundance of key families and species, p 79.
Scope of program:Global; active in over 60 tropical countries and territories
Program supportm Regional database; m Standard database m Standard coding system and data sheet templatem Data analysis and publication
Public participation, education and awareness: High. Participants in Reef Check programs develop a sense of stewardship, and the programs focus on building a global community of reef stakeholders at the grass roots level for better reef management.
Management support:Reef Check is creating a web-based interactive database with ReefBase to assist teams and coral reef managers with data entry and compare with previous data submitted by other teams. The database will also include management recommendations based on local and regional Reef Check data.
Additional information:Reef Check and the Marine Aquarium Council (MAC) designed an intensive monitoring protocol called ‘MAQTRAC’ (p 82) to study the effects of aquarium collection on reef health. This monitoring aims to improve collection practices and fi sh survival rates from the point of collection through to retail sale, and raise awareness among marine aquarium fi shermen.
Contact details:[email protected], www.reefcheck.org
Monitoring level:Monitoring level:✓ CommunityCommunity
Prog
ram
s

101
Atlantic and Gulf Rapid Reef Assessment Program description:The Atlantic and Gulf Rapid Reef Assessment (AGRRA) has developed the most extensive regional database on coral reef condition at 720 reef sites in 34 areas in the western Atlantic (Caribbean, Gulf of Mexico, Florida, Bahamas, Brazil). The goals of the AGRRA Project are to: m Complete a regional assessment of the health of coral reefs throughout the Western Atlantic; m Analyse the results and develop a database to establish a practical scale of comparative reef condition at
multiple spatial scales; m Promote the transfer of this information to a wider audience including the general public, resource managers,
government offi cials, policy makers, tourist operators, and students;m Collaborate with colleagues throughout the
western Atlantic to establish periodic monitoring of representative reef sites.
Initially, the AGRRA program protocols were not intended to distinguish between cause and effect of reef condition but designed to develop hypotheses on trends of reef decline, particularly across large spatial scales. AGRRA was intended to be a one-time assessment, but now many sites are being re-assessed using these methods as part of regional monitoring. These protocols have been adopted in on-going monitoring programs with the results being widely used by reef scientists and managers. Protocols of AGRRA:Benthic communitiesm Many line transects for cover, size and condition of coral species (≥25 cm maximum diameter) especially
disease, bleaching, predation, overgrowth and mortality, p 33, 51;m Multiple quadrats on transects for algal abundance (macroalgae, crustose corallines), p 41;
Invertebratesm Belt transect for Diadema abundance (useful in Caribbean following disease with increased algal populations),
p 68.Fishesm Multiple belt transects for abundance and size of target fi shes, number of damselfi sh lawns;m Roving diver survey for inventory of most common species, p 78;
Program support:Standard database templatem Regional database for results of AGRRA surveysm Standard coding systemm Standard data sheet templatem Data analysis and publication
Public participation, education and awareness:Formal and informal reporting and publication of results; training of foreign participants in monitoring, report writing, translating educational materials, fi nancial support for fi eld work, outreach with school children and talks; presentations at scientifi c meetings.
Management support:Regional training workshops provided
Contact details:Robert Ginsburg, [email protected] http://mgg.rsmas.miami.edu/agrra
Monitoring level:Monitoring level:✓ CommunityCommunity✓ ManagementManagement
Prog
ram
s

102
Caribbean Coastal Marine Productivity Program
Program summary:Two-tier, long-term monitoring of the productivity, structure and functions of coastal ecosystems.
Program description:The Caribbean Coastal Marine Productivity (CARICOMP) Programme is a regional scientifi c study of land-sea interaction processes, to monitor for change, and provide appropriate scientifi c information for management. The Program focuses on understanding the productivity, structure and functions of 3 important coastal ecosystems: mangroves; seagrasses; and reefs. Scientifi c monitoring of these ecosystems is performed on a daily, weekly and twice annual basis throughout the region using the same monitoring protocol. The long-term monitoring capability of CARICOMP can provide base-line data on Caribbean coastal biodiversity and also document threshold responses of ecosystems to global change including human impact and climate change.
An example of a CARICOMP program:Benthic communitiesm Chain Intercept Transect; CIT, p 54; ;m Belt transect; to determine the incidence and type of coral
disease, p 49;
Invertebratesm Belt transect; to determine the abundance of Diadema, p 68;m Collecting Diadema; to determine the size-frequency distribution, p 70.
Fish m Roving Diver Technique; to determine species abundance,p 78.
Program support:Standard database templatem Regional database for CARICOMPm Standard coding systemm Standard data sheet templatem Data analysis and publication
Public participation, education and awareness:Low; principally through reporting of scientifi c results: operates in marine stations.
Management support:Reporting of results
Contact detailsDulcie Linton, [email protected]
John C. Ogden, [email protected], www.ccdc.org.jm/caricomp_main.html
Prog
ram
s
Monitoring level:Monitoring level:✓ CommunityCommunity

103
Coral Reef Degradation in the Indian OceanProgram description:Coral Reef Degradation in the Indian Ocean (CORDIO) is a regional, multidisciplinary program developed to investigate the ecological and socio-economic consequences of the mass coral bleaching in 1998 and subsequent degradation of coral reefs in the Indian Ocean. This program also coordinates the East African and South Asian Nodes of the GCRMN.
Methods used:Survey manual for tropical marine resources (English et al. 1997)Reef CheckCommission de l’Ocean Indien (COI).
Program support:m Regional databasem Standard database m Standard coding systemm Standard data sheet templatem Data analysis and publication
Public participation, education and awareness:Medium; considerable community involvement in other projects.
Management support:Provision of guidance for management and public awareness
Contact details:www.cordio.org
Program Co-ordination: Olof Linden, [email protected] and David Souter, [email protected]
East Africa: David Obura, [email protected]
Islands States: Rolph Payet, [email protected]
South Asia: Jerker Tamelander, [email protected]
Monitoring level:Monitoring level:✓ CommunityCommunity✓ ManagementManagement✓ ResearchResearch
Prog
ram
s

104
Commission de l’Ocean Indien/Indian Ocean CommissionProgram description:Commission de l’Ocean Indien (COI) established a regional network in 1998 to monitor coral reefs in the South West Indian Ocean islands (Comoros, Madagascar, Mauritius, Réunion and Seychelles). IOC acts as the regional node of the GCRMN for the South West Indian Ocean.
Methods used:English et al. with local adaptations.
Rapid assessmentsSnorkel timed swims – broad-medium scale p 31, and Reef Check methods.
Program supportm Regional database(CoReMo II)m Standard database (CoReMo II)m Standard coding systemm Standard data sheet templatem Data analysis and publication
Public participation, education and awareness:m Low. Achieved through reporting of results. Currently planning new stakeholder training in community level
monitoring.
Management support:Provision of regional-scale information on reef health, Low at the local level
Contact details:COI Secrétariat Général, [email protected]
References:coi.intnet.mu/Conand et al. 1999; Conand et al. 2000.
Prog
ram
s
Monitoring level:Monitoring level:✓ ManagementManagement✓ ResearchResearch

105
Mesoamerican Barrier Reef System – Synoptic Monitoring Program Program summary:Long-term, four-tier regional monitoring program
Program description:The Mesoamerican Barrier Reef System – Synoptic Monitoring Program (MBRS SMP) was designed for long-term monitoring to include physical and biological components refl ected in the core themes of: Coral reef ecology; Marine pollution; and Physical oceanography
The MBRS SMP has 4 categories with different detail collected by each method:m Category 1 is baseline level monitoring, using the
smallest set of parameters of all program categories. It is expected that more sites can be monitored using these techniques and these sites can be monitored more frequently e.g. between 2 and 6 times per year;
m Category 2 is medium-term analyses to track changes in coral mortality and water quality over short time scales; more sites are being added;
m Category 3 is annual monitoring designed to track long-term changes;m Category 4 is rapid assessment designed to assess the affects of specifi c disturbances at impact sites.
An example of an MBRS SMP program:Benthic communities:m Point intercept transect; to determine % cover of benthic organisms below every 25 cm; records coralline algae,
turf algae, macroalgae, sponges, gorgonians, specifi c coral genera, dead corals (recent and long dead), bleached and diseased coral, p 36;
m Recruitment plates; to determine the recovery potential of a reef, p 56;
Invertebrates:m Diadema survey; to determine the abundance of Diadema, based on AGRRA methods, p 68.
Fishes:m Fish belt transect, based on AGRRA methods, p 79.
Physical parameters:m Sedimentation traps; to determine sedimentation rates, p 96;m Water quality, sediment and tissue pesticide levels; PAH metabolites in bile; cholinesterase activity in muscle;
nutrient concentration and total and faecal coliform concentration in water.
Program support:m Data managementm Standard web-based database templatem Regional database for MBRS SMP Regional Environmental Information System REISm Standard coding system and data sheet templatem Data analysis and publication
Public participation, education and awareness:Low. Achieved through reporting of results.
Management support:Reporting of results
Contact details: Alejandro Arrivillaga, [email protected] or [email protected], www.mbrs.org.bz;
Methods www.mbrs.org.bz/dbdocs/tech/SMPMan03.pdf
Prog
ram
s
Monitoring level:Monitoring level:✓ ManagementManagement✓ ResearchResearch

106
Reef Condition (RECON) Monitoring Program.Program description:The Ocean Conservancy developed Reef Condition (RECON), a volunteer, low-tech, rapid monitoring program, to document overall reef status and the health of key reef organisms in the tropical Western Atlantic. RECON is focused on important stressors (e.g. diseases, algal overgrowth) in the wider Caribbean region, and was designed to allow high spatial and temporal coverage. Survey sites are selected by experienced RECON divers and classifi ed by reef type, orientation, structural complexity and dominant framework corals to facilitate between-site comparisons. RECON complements the REEF fi sh program, Reef Check, and other reef monitoring programs. When RECON divers work in small teams, repeat dives are needed to provide suffi cient data for statistical analysis. The goal is for rapid reporting of fi ndings to reef managers or scientists.
RECON volunteers monitor:m size, percent mortality, and bleaching in large (> 25 cm) coral colonies; m identity of major stresses to these corals; m % cover of corals and macroalgae; m relative abundance of algal functional groups and identity of major macroalgae; m density of Diadema sea urchins, spiny lobsters (Panulirus spp.) and queen conch (Strombus gigas);m relative density of new coral recruits; m obvious stresses to corals, gorgonians, zoanthids, sponges (bleaching, disease, algal overgrowth); andm obvious human impacts (abandoned fi shing gear, other debris, and anchor scars).
Protocols of RECON:Preselected massive stony coralsm Size and condition of colonies (≥25 cm maximum diameter) especially partial mortality, bleaching, disease,
predation, and overgrowth, p 45.
Benthic communities and Invertebratesm Line transects for stony coral and macroalgal cover,
p 45;m Belt transects for Diadema abundance, spiny
lobsters and queen conch, abundance of macroalgae, information on bleaching, disease and obvious human impacts, p 68.
Program support:m Standard training materials (currently print; CD in revision)m Standard database template (in revision);m Standard coding system;m Standard data sheet template;m Data analysis, publication and website (in development).
Public participation, education and awareness:m Medium in Caribbean
Management support:Local diver and instructor training workshops provided
Contact details:Email: Seba Sheavly [email protected] www.oceanconservancy.com/recon
Prog
ram
s
Monitoring level:Monitoring level:✓ Community by volunteersCommunity by volunteers

107
APPENDICES
1: HOW TO DO A PILOT STUDY?
What sample size and number do you need to gain maximum precision at least cost? Andrew and Mapstone 1987 suggest that a minimum of 3 sampling-unit sizes should be assessed in a pilot study. If multiple habitats or locations are to be sampled, the procedure should be repeated in more than one area to account for spatial variation (Mapstone and Ayling 1993).
To determine your optimum sample method you could follow a similar procedure to that provided in the example below:
To determine sample method size:m Select a number of sites on your reef of interest;m Select a number of random locations within this site to place your sample method (e.g. a transect);m Conduct your sampling using a range of sample method sizes. If you are using a transect, conduct the
sampling with a long transect (e.g. 50 m) then take the data from the first 10 m, 20 m and so on to compare the precision between different sample method sizes; avoid taking multiple contiguous small units from the sample large transects (pseudoreplication) because samples must be independent for statistical analyses;
m Calculate the mean precision and standard error (SE) for your data from the range of transect lengths;m Plot the mean precision +/-SE against transect length;m The transect size with the highest precision (lowest number) is the best for sampling length;
To determine how many replicates to use:m Sample a few more replicates than you think you will use; (the standard methodsin this book give an idea of
how many replicates might be enough). Calculate the SE or P for your replicates in cumulatively increasing number. Plot a graph to show the number of transects against a range of precision (e.g. 0.5, 0.2, 0.1, 0.05 and 0.01). You should aim for a precision of 0.05;
m The point where the slope of the graph levels out is the least cost for maximum precision.
SE = s xP = s √n
SE = standard error; s = standard deviation; x = mean; n = sample size; P = precision (as P gets smaller, precision increases); From Kingsford 1988
In addition to sample method size and number of replicates, the shape may need to be assessed in some situations. Concerns include the influence of border effects, for example with round versus square units and where broad areas are being searched, organisms may be missed and this is a major concern in transect counts for fish and other cryptic or mobile animals (Kingsford 1988).
Other useful references:Sale and Sharp 1983; Downing and Anderson 1985; Andrew and Mapstone 1987; Oxley 1997
2: GENERIC MONITORING EQUIPMENT
Typical monitoring equipment:m Tide tables;m Underwater slates (large enough to fix data sheets onto them e.g. A4);m Data sheets (printed on underwater paper). These can be attached to the slate using electrical tape or rubber
bands;m Several pencils;m Scuba gear or Snorkel gear;m Radio;m First Aid equipment that is suitable for snorkel or scuba diving;m Boat, outboard engine;m GPS (it is essential to note the system your GPS uses e.g. WGS 84);m Dive flag and surface marker buoy.
App
endi
ces

108
Tabl
e 11
. T
he m
ajor
cor
al r
eef m
onit
orin
g pr
ogra
ms
and
the
met
hods
em
ploy
ed in
reg
ions
(m
ore
than
one
cou
ntry
).
Geo
grap
hic
regi
onP
rogr
am n
ame
Met
hods
use
dR
efer
ence
Con
tact
Pag
e
Glo
bal
Glo
bal C
oral
Ree
f Mon
itor
ing
Net
wor
k (G
CRM
N)
GCR
MN
rec
omm
ende
d m
etho
ds
incl
ude
Eng
lish
et a
l. &
oth
er
maj
or p
rogr
ams
belo
ww
ww
.gcr
mn.
org
Cliv
e W
ilkin
son,
c.w
ilkin
son@
aim
s.go
v.au
99
Glo
bal
Ree
f Che
ck
Ree
f Che
ck m
etho
dsw
ww
.ree
fche
ck.o
rgG
rego
r H
odgs
on, g
rego
rh@
ucla
.edu
101
Glo
bal
Ree
fBas
eR
epos
itor
y fo
r al
l cor
al r
eef
mon
itor
ing
met
hods
ww
w.r
eefb
ase.
org
Jam
ie O
liver
, j.o
liver
@cg
iar.o
rg-
Indi
an O
cean
Cora
l Ree
f Deg
rada
tion
in t
he
Indi
an O
cean
(CO
RD
IO)
Ree
f Che
ck, C
OI,
GCR
MN
re
com
men
ded
Eng
lish
et a
l. m
etho
dsw
ww
.cor
dio.
org
olof
.lind
en@
cord
io.o
rg; d
avid
.sou
ter@
cord
io.o
rg;
Rol
ph P
ayet
, rol
ph@
seys
helle
s.sc
; jea
npas
cal.
quod
@co
rdio
.org
103
Indi
an O
cean
Com
mis
sion
de
l’Oce
an I
ndie
n (C
OI)
COI
met
hods
and
*E
nglis
h et
al.
met
hods
ww
w. c
oi.in
tnet
.mu/
COI
Secr
étar
iat
Gén
éral
, Rec
if_m
embe
rs@
coi.
intn
et.m
u10
4
Cari
bbea
nA
tlan
tic
and
Gul
f Rap
id R
eef
Ass
essm
ent
(AG
RR
A)
AG
RR
A m
etho
dsw
ww
.cor
al.a
oml.n
oaa.
gov/
agra
/R
ober
t G
insb
urg,
rgi
nsbu
rg@
rsm
as.m
iam
i.edu
; ag
rra@
rsm
as.m
iam
i.edu
101
Cari
bbea
nCa
ribb
ean
Coas
tal M
arin
e P
rodu
ctiv
ity
Pro
gram
(C
AR
ICO
MP
)CA
RIC
OM
P m
etho
dsw
ww
.ccd
c.or
g.jm
/car
icom
p_m
ain.
htm
lD
ulci
e Li
nton
, dm
linto
n@uw
imon
a.ed
u.jm
;Jo
hn O
gden
, jog
den@
mar
ine.
usf.e
du10
2
Cari
bbea
nM
esoa
mer
ican
Bar
rier
Ree
f Sy
stem
Syn
opti
c M
onit
orin
g P
rogr
am (
MB
RS
SMP
)
MB
RS
SMP
met
hods
(si
mila
r to
CA
RIC
OM
P a
nd A
GR
RA
)w
ww
.mbr
s.or
g.b z
Ale
jand
ro A
rriv
illag
a, a
arri
villa
ga@
mbr
s.or
g.bz
or
mbr
s@bt
l.net
105
App
endi
ces

109
Tabl
e 12
. A
sel
ecti
on o
f Nat
iona
l cor
al r
eef m
onit
orin
g pr
ogra
ms
and
the
met
hods
as
prov
ided
by
resp
onde
nts
to t
he Q
uest
ionn
aire
Geo
grap
hic
regi
on/c
ount
ryP
rogr
am n
ame
Mon
itor
ing
leve
lM
etho
ds u
sed
Ref
eren
ce a
nd c
onta
ct
Tanz
ania
Chum
be I
slan
d Co
ral
Par
k m
onit
orin
g pr
ogra
m
Com
mun
ity
Ree
f Che
ck m
etho
dsw
ww
.ree
fche
ck.o
rg
Caro
l Dan
iels
, inf
o@ch
umbe
isla
nd.c
omM
anag
emen
tm
Eng
lish
et a
l.E
nglis
h et
al.,
199
7; w
ww
.gcr
mn.
org
Res
earc
hG
ener
al c
oral
hea
lth:
Rad
ial a
rc m
etho
dSa
ntav
y et
al.
2001
Fron
tier
Com
mun
ity
Fron
tier
met
hods
ww
w.fr
onti
er.a
c.uk
fron
tier
@ra
ha.c
om
Wild
life
Cons
erva
tion
So
ciet
yR
esea
rch
WCS
line
tra
nsec
t &
cir
cula
r in
vert
ebra
te m
etho
dw
ww
.wcs
.or g
Ti
m M
cCla
naha
n, t
mcc
lana
han@
wcs
.org
or
crc
p@af
rica
onlin
e.co
.ke
Indi
aSt
atus
sur
veys
of c
oral
re
efs
in I
ndia
Man
agem
ent
m
Eng
lish
et a
l.E
nglis
h et
al.,
199
7, w
ww
.gcr
mn.
org
K. V
enka
tara
man
, dug
ong@
md2
.vsn
l.net
.id
, ven
kysz
i@ho
tmai
l.com
Iran
Mon
itor
ing
of t
he
Iran
ian
Cora
l Ree
fs in
N
Per
sian
Gul
fCo
mm
unit
yR
eef C
heck
met
hods
&M
anta
tow
ww
w.r
eefc
heck
.or g
; Eng
lish
et a
l., 1
997,
Moh
amm
ad R
eza
Shok
ri,
mrs
hok@
hotm
ail.c
om
Indo
nesi
a
COR
EM
AP
Com
mun
ity
Ree
f Che
ck m
etho
dsw
ww
.cor
emap
.or.i
d
Kom
odo
Nat
iona
l Par
k Co
ral R
eef S
tatu
s M
onit
orin
gM
anag
emen
tB
enth
os: K
omod
o ti
med
sw
im
and
poin
t in
terc
ept
tran
sect
ww
w.k
omod
onat
iona
lpar
k.or
gA
ndre
as M
ulja
di, a
mul
jadi
@cb
n.ne
t.id
, ah
_Mul
jadi
@ya
hoo.
com
P
eter
Mou
s, p
mou
s@tn
c.or
g
Phi
lipp
ines
Coas
tal R
esou
rce
Man
agem
ent
Pro
ject
(C
RM
P)
Com
mun
ity
CRM
P a
nd R
eef C
heck
met
hods
Uyc
hiao
co e
t al.
2001
ww
w.o
neoc
ean.
org/
dow
nloa
d/_i
ndex
.htm
l
Cora
l Cay
Con
serv
atio
n (C
CC)
Com
mun
ity
CCC
and
Ree
f Che
ck m
etho
dsw
ww
.cor
alca
y.or
gw
ww
.ree
fche
ck.o
rg
Mal
aysi
a (S
abah
)Co
ral R
eef M
onit
orin
g of
Tun
ku A
bdul
Rah
man
P
ark
Man
agem
ent
Ben
thos
: T
RA
P t
rans
ects
and
qua
drat
sSi
mon
Wils
on, s
imon
.wils
on@
adel
phi-e
nv.c
o m
Taiw
an
Surv
ey o
n th
e St
atus
of
cora
l Ree
fs in
Tai
wan
Com
mun
ity
Ree
f Che
ck m
etho
dsw
ww
.ree
fche
ck.o
rgCh
ang-
feng
Dai
, cor
alla
b@cc
ms.
ntu.
edu.
tw
Stat
us o
f the
cor
al r
eefs
in
the
Gul
f of T
haila
nd
and
the
And
aman
Sea
Ree
f Che
ck m
etho
dsw
ww
.ree
fche
ck.o
rgCh
ang-
feng
Dai
, cor
alla
b@cc
ms.
ntu.
edu.
tw
Man
agem
ent
m
Eng
lish
et a
l. m
etho
dsE
nglis
h et
al.,
199
7, w
ww
.gcr
mn.
org
Saka
nan
Pla
thon
g, p
saka
nan@
ratr
ee.
psu.
ac.t
h
Sam
oa
Long
-ter
m M
onit
orin
g P
rogr
am fo
r th
e Co
ral
Ree
fs o
f Am
eric
an
Sam
oa
Res
earc
h an
d m
anag
emen
t
Ben
thos
: Pac
ific
poin
t in
terc
ept
tran
sect
Choa
t an
d B
ellw
ood
1985
; Gre
en 1
996b
; Gre
en 1
996a
; G
reen
200
2
Sam
oa p
rogr
am: A
lison
Gre
en,
agre
en@
tnc.
org
or F
ishe
s m
etho
ds:
How
ard
Choa
t, h
owar
d.ch
oat@
jcu.
edu.
au
Inve
rteb
rate
s:B
elt
tran
sect
Gre
en 1
996b
Fish
es: a
.Sam
oan
fish
visu
al
cens
us;
b.La
rge
fish
belt
tra
nsec
t;
c.Fi
sh r
ecru
itm
ent
a. G
reen
199
6b; b
.Sam
oily
s 19
97; W
ilkin
son
et a
l. 20
03; c
.Gre
en 1
996b A
ppen
dice
s

110
Cen
tral
Pac
ific
Res
earc
h an
d m
anag
emen
tA
s ab
ove
As
abov
eD
ave
Fisk
, dav
efisk
@ip
asifi
ka.n
et
Haw
aii
Haw
aii C
oral
Ree
f A
sses
smen
t an
d M
onit
orin
g P
rogr
am
(CR
AM
P)
Res
earc
h
Bro
ad s
cale
: Rap
id A
sses
smen
t te
chni
que
(RAT
)
Joki
el e
t al.
2001
w
ww
.cra
mp.
wcc
.haw
aii.e
du
Ben
thos
:P
hoto
qua
drat
sVi
deo
tran
sect
s
Fish
es: V
isua
l cen
sus
Nor
thw
este
rn
Haw
aiin
Isl
ands
NO
WR
AM
P R
emot
e A
rea
RE
A P
roto
col
Res
earc
hN
OW
RA
MP
met
hods
Mar
agos
and
Gul
ko 2
002
ww
w.h
awai
iana
tolls
.org
/res
earc
h/N
OW
RA
MP
2002
Jim
Mar
agos
Jim
_Mar
agos
@r1
.fws.
gov
Nor
ther
n M
aria
na
Isla
nds
CNM
I N
ears
hore
Co
ral R
eef M
onit
orin
g P
rogr
amR
esea
rch
Ben
thos
:CN
MI
phot
o po
int
inte
rcep
t tr
anse
ct
Hou
k 20
01w
ww
.deq
.gov
.mp/
MM
T/R
eef.h
tmP
eter
Hou
k, d
eq.b
iolo
gist
@sa
ipan
.com
Inve
rteb
rate
s:CN
MI
belt
tra
nsec
tFi
shes
:CN
MI
belt
tra
nsec
tP
hysi
cal p
aram
eter
s: C
NM
I se
dim
ent
trap
s
Mar
ine
Sanc
tuar
ies
Mon
itor
ing
and
Ass
essm
ent
Man
agem
ent
*Eng
lish
et a
l. m
etho
dsE
nglis
h et
al.,
199
7, w
ww
.gcr
mn.
org
Mic
heal
Tri
anni
, mst
dfw
@it
ecnm
i.com
New
Cal
edon
iaM
inin
g im
pact
m
onit
orin
g pr
ogra
mM
anag
emen
t*E
nglis
h et
al.
met
hods
Eng
lish
et a
l., 1
997,
ww
w.g
crm
n.or
gSa
rram
egna
Seb
asti
en,
ssar
ram
egna
@fa
lcon
brid
ge.n
c
Fij
iCo
ral C
ay C
onse
rvat
ion
(CCC
)Co
mm
unit
yCC
C &
Ree
f Che
ck m
etho
dsw
ww
.cor
alca
y.or
gw
ww
.ree
fche
ck.o
rg
US
A (
Flo
rida
)
Flor
ida
Key
s M
arin
e N
atio
nal S
anct
uary
Co
ral R
eef M
onit
orin
g P
rogr
am
Com
mun
ity
Ben
thos
:Co
ral s
paw
ning
&R
eefK
eepe
r po
int
inte
rcep
t
Spaw
ning
: ww
w.fk
nms.
nos.
noaa
.gov
Poi
nt in
terc
ept:
ww
w.r
eefk
eepe
r.org
Poi
nt in
terc
ept:
Ale
xand
er S
tone
, re
efke
eper
@ea
rthl
ink.
net
Spaw
ning
: Alin
a Sz
man
t,
szm
anta
@un
cwil.
edu
Inve
rteb
rate
s:Sp
iny
lobs
ter
mon
itor
ing
Que
en c
onch
Sea
urch
ins
Lobs
ter:
Joh
n H
unt,
john
.hun
t@fw
c.st
ate.
fl.us
Conc
h: B
ob G
laze
r bo
b.gl
azer
@fw
c.st
ate.
fl.us
Urc
hins
: Bri
an K
elle
r (S
ea S
tew
ards
), b
rian
.kel
ler@
noaa
.gov
Fish
es: R
ovin
g D
iver
Tec
hniq
ue
(Ree
f Env
iron
men
tal E
duca
tion
Fo
unda
tion
)w
ww
.ree
f.org
reef
hq@
reef
.org
Res
earc
h
Ben
thos
:Vi
deo
tran
sect
John
Ogd
en, j
ogde
n@m
arin
e.us
f.edu
Inve
rteb
rate
s:U
rchi
n an
d da
mse
lfish
Bri
an K
elle
r, br
ian.
kelle
r@no
aa.g
ov
Fish
es:
Fish
cle
aner
sta
tion
met
hods
Bri
an K
elle
r, br
ian.
kelle
r@no
aa.g
ov
App
endi
ces
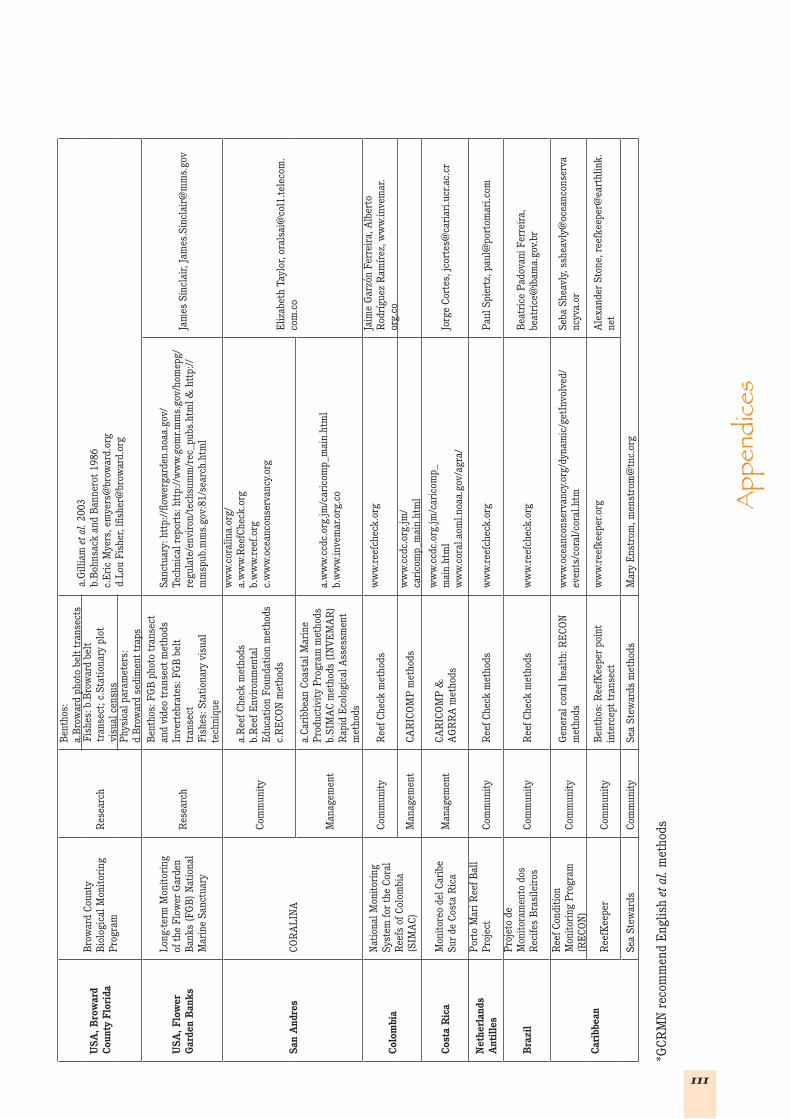
111
US
A, B
row
ard
Cou
nty
Flo
rida
Bro
war
d Co
unty
B
iolo
gica
l Mon
itor
ing
Pro
gram
Res
earc
h
Ben
thos
:a.
Bro
war
d ph
oto
belt
tra
nsec
tsa.
Gill
iam
et a
l. 20
03b.
Boh
nsac
k an
d B
anne
rot
1986
c.E
ric
Mye
rs, e
mye
rs@
brow
ard.
org
d.Lo
u Fi
sher
, lfis
her@
brow
ard.
org
Fish
es: b
.Bro
war
d be
lt
tran
sect
; c.S
tati
onar
y pl
ot
visu
al c
ensu
sP
hysi
cal p
aram
eter
s:d.
Bro
war
d se
dim
ent
trap
s
US
A, F
low
er
Gar
den
Ban
ks
Long
-ter
m M
onit
orin
g of
the
Flo
wer
Gar
den
Ban
ks (
FGB
) N
atio
nal
Mar
ine
Sanc
tuar
y
Res
earc
h
Ben
thos
: FG
B p
hoto
tra
nsec
t an
d vi
deo
tran
sect
met
hods
Inve
rteb
rate
s: F
GB
bel
t tr
anse
ctFi
shes
: Sta
tion
ary
visu
al
tech
niqu
e
Sanc
tuar
y: h
ttp:
//flo
wer
gard
en.n
oaa.
gov/
Tech
nica
l rep
orts
: htt
p://
ww
w.g
omr.m
ms.
gov/
hom
epg/
regu
late
/env
iron
/tec
hsum
m/r
ec_p
ubs.
htm
l & h
ttp:
//m
msp
ub.m
ms.
gov:
81/s
earc
h.ht
ml
Jam
es S
incl
air,
Jam
es.S
incl
air@
mm
s.go
v
San
And
res
COR
ALI
NA
Com
mun
ity
a.R
eef C
heck
met
hods
b.R
eef E
nvir
onm
enta
l E
duca
tion
Fou
ndat
ion
met
hods
c.R
ECO
N m
etho
ds
ww
w.c
oral
ina.
org/
a.w
ww
.Ree
fChe
ck.o
rgb.
ww
w.r
eef.o
rgc.
ww
w.o
cean
cons
erva
ncy.
org
Eliz
abet
h Ta
ylor
, ora
lsai
@co
l1.t
elec
om.
com
.co
Man
agem
ent
a.Ca
ribb
ean
Coas
tal M
arin
e P
rodu
ctiv
ity
Pro
gram
met
hods
b.SI
MA
C m
etho
ds (
INV
EM
AR
)R
apid
Eco
logi
cal A
sses
smen
t m
etho
ds
a.w
ww
.ccd
c.or
g.jm
/car
icom
p_m
ain.
htm
lb.
ww
w.in
vem
ar.o
rg.c
o
Col
ombi
a
Nat
iona
l Mon
itor
ing
Syst
em fo
r th
e Co
ral
Ree
fs o
f Col
ombi
a (S
IMA
C)
Com
mun
ity
Ree
f Che
ck m
etho
dsw
ww
.ree
fche
ck.o
rgJa
ime
Gar
zón
Ferr
eira
, Alb
erto
R
odrí
guez
Ram
írez
, ww
w.in
vem
ar.
org.
co
Man
agem
ent
CAR
ICO
MP
met
hods
ww
w.c
cdc.
org.
jm/
cari
com
p_m
ain.
htm
l
Cos
ta R
ica
Mon
itor
eo d
el C
arib
e Su
r de
Cos
ta R
ica
Man
agem
ent
CAR
ICO
MP
&A
GR
RA
met
hods
ww
w.c
cdc.
org.
jm/c
aric
omp_
mai
n.ht
ml
ww
w.c
oral
.aom
l.noa
a.go
v/ag
ra/
Jorg
e Co
rtes
, jco
rtes
@ca
riar
i.ucr
.ac.
cr
Net
herl
ands
A
ntil
les
Por
to M
ari R
eef B
all
Pro
ject
Com
mun
ity
Ree
f Che
ck m
etho
dsw
ww
.ree
fche
ck.o
rgP
aul S
pier
tz, p
aul@
port
omar
i.com
Bra
zil
Pro
jeto
de
Mon
itor
amen
to d
os
Rec
ifes
Bra
sile
iros
Com
mun
ity
Ree
f Che
ck m
etho
dsw
ww
.ree
fche
ck.o
rgB
eatr
ice
Pad
ovan
i Fer
reir
a,
beat
rice
@ib
ama.
gov.
br
Car
ibbe
an
Ree
f Con
diti
on
Mon
itor
ing
Pro
gram
(R
ECO
N)
Com
mun
ity
Gen
eral
cor
al h
ealt
h: R
ECO
N
met
hods
ww
w.o
cean
cons
erva
ncy.
org/
dyna
mic
/get
Invo
lved
/ev
ents
/cor
al/c
oral
.htm
Seba
She
avly
, ssh
eavl
y@oc
eanc
onse
rva
ncyv
a.or
Ree
fKee
per
Com
mun
ity
Ben
thos
: Ree
fKee
per
poin
t in
terc
ept
tran
sect
ww
w.r
eefk
eepe
r.org
Ale
xand
er S
tone
, ree
fkee
per@
eart
hlin
k.ne
t
Sea
Stew
ards
Com
mun
ity
Sea
Stew
ards
met
hods
M
ary
Ens
trom
, men
stro
m@
tnc.
org
*GCR
MN
rec
omm
end
Eng
lish
et a
l. m
etho
ds
App
endi
ces

REFERENCES
Almada-Villela, PC, PF Sale, G Gold-Bouchot and B Kjerfve (2003a). Conservation and Sustainable Use of the Mesoamerican Barrier Reef Systems Project (MBRS). In Manual of methods for the MBRS Synoptic Monitoring Program: Selected methods for monitoring physical and biological parameters for use in the mesoamerican region. Belize City, Belize City, MBRS Coordination Unit: pp. 155.
Almada-Villela, PC, PF Sale, G Gold-Bouchot and B Kjerfve (2003b). Manual of Methods for the MBRS Synoptic Monitoring Program: Selected Methods for Monitoring Physical and Biological Parameters for Use in the Mesoamerical Region. Belize City, MBRS Coordination Unit: pp. 155.
Andrew, NL and BD Mapstone (1987). Sampling and the Description of Spatial Patterns in Marine Ecology. Oceanographic Marine Biology Annual Review 25: 39-90.
Aronson, RB (2001). The Limits of Detectability: Short-Term Events and Short-Distance Variation in the Community Structure of Coral Reefs. Bulletin of Marine Science 69: 331-332.
Ault, JS, SG Smith, GA Meester, J Luo and JA Bohnsack (2001). Site Characteristics for Biscayne National Park: Assessment of Fisheries Resources and Habitats. NOAA Technical Memorandum NMFS-SEFSC-468: pp.165.
Ault, JS, SJ Smith, GA Meester, J Luo, JA Bohnsack and SL Miller (2002). Baseline Multispecies Coral Reef Fish Stock Assessment for Dry Tortugas. NOAA Technical Memorandum NMFS-SEFSC-487: pp. 117.
Bass, DK and IR Miller (1998). Crown-of-Thorns Starfish and Coral Surveys Using the Manta Tow and Scuba Search Techniques. Long-term Monitoring of the Great Barrier Reef. Standard Operations Procedure Number 1, www.aims.gov.au/pages/research/reef-monitoring/methods.html.
Bohnsack, JA and SP Bannerot (1986). A Stationary Visual Census Technique for Quantitatively Assessing Community Structure of Coral Reef Fishes. NOAA Technical Report NMFS 41: 1-15.
Brock, RE (1982). A Critique of the Visual Census Method for Assessing Coral Reef Fish Populations. Bulletin of Marine Science 18: 297-276.
Brock, VE (1954). A Preliminary Report on a Method of Estimating Reef Fish Populations. Journal of Wildlife Management 18: 297-308.
Brown, E, E Cox, BN Tissot, K Rodgers, W Smith, P Jokiel and S Coles (2000). Evaluation of Benthic Sampling Methods Considered for the Coral Reef Assessment and Monitoring Program (CRAMP) in Hawai’i, http://cramp.wcc.hawaii.edu/overview/3._methods.
Bruckner, AW (2002). Priorities for Effective Management of Coral Diseases, U.S. Department of Commerce. NOAA Technical Memorandum NMFS-OPR-22: pp. 49.
Bruckner, AW and RJ Bruckner (1997). The Persistence of Black-Band Disease in Jamaica: Impact on Community Structure. Proceedings, 8th International Coral Reef Symposium, Panama, 601-606.
Bunce, L, P Townsley, R Pomeroy and R Pollnac (2000). Socioeconomic Manual for Coral Reef Management, Global Coral Reef Monitoring Network and Australian Institute of Marine Science Townsville Australia: pp. 251.
Carleton, JH and TJ Done (1995). Quantitative Video Sampling of Coal Reef Benthos: Large Scale Application. Coral Reefs 14; 35-46.
Choat, JH and DR Bellwood (1985). Interactions Amongst Herbivorous Fishes on a Coral Reef: Influence of Spatial Variation. Marine Biology 89: 221-234.
Cohen, J (1988). Statistical Power Analysis for the behavioural sciences (2nd Edition). Hillsdale. New Jersey: L. Erlbaum Association.
Colin, PL, YJ Sadovy and ML Domeier (2003). Manual for the Study and Conservation of Reef Fish Spawning Aggregations, Society for the Conservation of Reef Fish Aggregations Special Publication No. 1 (Version 1.0).
Refe
renc
es
112

Conand, C, P Chabanet, J-P Quod and L Bigot (1999). Guidelines: Coral Reef Monitoring in the South-West Region of the Indian Ocean. Indian Ocean Commission and the Regional Environmental Programme, Mauritius: pp. 27.
Conand, C, P Chabanet, J-P Quod and L Bigot (2000). Manuel Methodologique Pour Le Suivi De L’etat De Sante Des Recifs Coralliens Du Sud-Ouest De L’ocean Indien. Commission Ocean Indien, Mauritius: pp. 27.
Crosby, MP and ES Reese (1996). A Manual for Monitoring Coral Reefs with Indicator Species: Butterflyfishes as Indicators of Change on Indo-Pacific Reefs. Silver Spring, MD, Office of Ocean and Coastal Resource Management, National Oceanic and Atmospheric Administration: pp. 45.
Domeier, ML, PL Colin, TJ Donaldson, WD Heyman, JS Pet, M Russell, Y Sadavoy, MA Samoilys, A Smith, BM Yeeting and S Smith (2002). Transforming Coral Reef Conservation: Reef Fish Spawning Aggregations Component. Working Group Report: pp. 85.
Donnelly, R, D Neville and PJ Mous, Eds. (2003). Report on a Rapid Ecological Assessment of the Raja Ampat Islands, Papua, Eastern Indonesia, held October 30 - November 22, 2002, The Nature Conservancy Southeast Asia Center for Marine Protected Areas, Sanur, Bali Indonesia: pp. 249, www.komodonationalpark.org
Downing, JA and MR Anderson (1985). Estimating the Standing Biomass of Aquatic Macrophytes. Canadian Journal of Fisheries and Aquatic Science 42: 1860-1869.
Edmunds, PJ, RB Aronson, DW Swanson, DR Levitan and WF Precht (1998). Photographic Versus Visual Census Techniques for the Quantification of Juvenile Corals. Bulletin of Marine Science 62: 937-947.
English, S, C Wilkinson and V Baker (1997). Survey Manual for Tropical Marine Resources. Townsville, Australia, Australian Institute of Marine Science, Townsville Australia: pp. 378
Gilliam, DS, RE Dodge, RE Spieler, MS Jordan and AV Jaime (2003). Marine Biological Monitoring in Broward County, Florida. Year 3 Annual Report. Prepared for Broward County Board of County Commissioners., Department of Planning and Environmental Protection, Biological Resources Division. Fort Lauderdale, Florida: pp. 62.
Green, AL (1996a). Spatial, Temporal and Ontogenetic Patterns of Habitat Use by Coral Reef Fishes (Family Labridae). Marine Ecology Progress Series 133: 1-11.
Green, AL (1996b). Status of the Coral Reefs of the Samoan Archipelago. Report to the Department of Marine and Wildlife Resources. PO Box 3730, Pago Pago, American Samoa. 96799: 120.
Green, AL (2002). Status of Coral Reef on the Main Volcanic Islands of American Samoa: A Resurvey of Long-term Monitoring Sites (Benthic Communities, Fish Communities, and Key Macroinvertebrates). A Report Prepared for the Dept of Marine and Wildlife Resources. Pago Pago, American Samoa. 96799: 133.
Green, EP, PJ Mumby, AE Edwards and CD Clark (2000). Remote Sensing: Handbook for Tropical Coastal Management. Paris, UNESCO Publishing: pp. 316, http://www.unesco.org/csi/pub/source/rs.htm
Halford, AR and AA Thompson (1994). Visual Census Surveys of Reef Fish. Standard Operational Procedure Number 3. Long-term Monitoring of the Great Barrier Reef. Townsville, Australian Institute of Marine Science. Townsville Australia: pp 22, http://www.aims.gov.au/pages/research/reef-monitoring/ltm/mon-sop3/fishsop.pdf
Hallacher, L. E. and B. N. Tissot, 1999. Quantitative Underwater Ecological Survey Techniques: A coral reef
monitoring workshop. Chapter13 in: Maragos, J. E. and R. Grober-Dunsmore (eds.). Proceedings of the Hawai’i Coral Reef Monitoring Workshop, Dept. of Land and Natural Resources, Honolulu, HI. http://www.coralreefnetwork.com/quest/methods.htm
Hodgson, G (2003). Reef Check Instruction Manual, Reef Check Foundation, http://www.reefcheck.org/infocenter/publications.asp
Houk, P (2001). State of the Reef Report for Saipan Island, Commonwealth of the Northern Mariana Islands. Saipan, CNMI, Division of Environmental Quality. http://www.deq.gov.mp/MMT/Saipan%20Final%20Report.pdf
Refe
renc
es
113

114
Jokiel, PL, EK Brown, A Friedlander, SK Rodgers and WR Smith (2001). Hawaii Coral Reef Initiative Coral Reef Assessment and Monitoring Program (Cramp) Final Report 1999-2000. HCRI and NOAA Technical Report. Silver Spring, MD: pp. 66.
Jones, GP and UL Kaly (1995). Criteria for Selecting Marine Organisms in Biomonitoring Studies. Detecting Ecological Impacts: Concepts and Applications in Coastal Habitats. RJ Schmitt and CW Osenberg. San Diego, Academic Press: pp. 39-56.
Jones, RS and MJ Thompson (1978). Comparison of Florida Reef Fish Assemblages Using a Rapid Visual Technique. Bulletin of Marine Science 28: 159-172.
Kaly, UL and GP Jones (1997). Minimum Sampling Design for Detecting the Magnitude and Scale of Human Impacts on Coral Reefs. Proceedings, Eighth International Coral Reef Symposium, Panama: pp. 1479-1484.
Kimmel, JJ (1985). A New Species-Time Method for Visual Assessment of Fishes and Its Comparison with Established Methods. Environmental Biology of Fishes 12: pp. 23-32.
Kingsford, MJ (1988). Analytical Aspects of Sampling Design. Studying Temperate Marine Environments: A Handbook for Ecologists. MJ Kingsford and C Battershill. Canterbury, Canterbury University Press: pp. 49.
Lincoln-Smith, MP, J Bell, P Ramohia and KA Pitt (2001). Testing the Use of Marine Protected Areas to Restore and Manage Tropical Multispecies Invertebrate Fisheries at the Arnavon Islands, Solomon Islands: Termination Report. Great Barrier Reef Marine Park Authority Research Publication No. 69; ACIAR Project No. FIS/1994/117; ICLARMN Contribution No. 1609: pp. 72.
Mapstone, BD and AM Ayling (1993). An Investigation of Optimum Methods and Unit Sizes for the Visual Estimation of Abundances of Some Coral Reef Organisms. A report to the Great Barrier Reef Marine Park Authority, Townsville Australia: pp. 71.
Maragos, J and D Gulko (2002). Coral Reef Ecosystems of the Northwestern Hawaiian Islands: Interim Results Emphasizing the 2000 Surveys. U.S. Fish and Wildlife Service and the Hawai’i Department of Land and Natural Resources. Honolulu, Hawai’i. www.hawaii.edu/ssri/hcri/files/nwhi_report_1of4.pdf
Marshall, P and H Schuttenberg, Eds. (2004). A Reef Managers Guide to Coral Bleaching, National Oceanic and Atmospheric Administration (NOAA), Great Barrier Reef Marine Park Authority (GBRMPA) and The World Conservation Union (IUCN). (in press).
Meester, GA, JS Ault and JA Bohnsack (1999). Visual Censusing and the Extraction of Average Length as a Biological Indicator of Stock Health. Naturalista sicil XX111 (Suppl.)(205-222).
Meesters, EH, I Wesseling and RPM Bak (1996). Partial Mortality in Three Species of Reef-Building Corals and the Relation with Colony Morphology. Bulletin of Marine Science 58: 838-852.
Oxley, WG (1997). Sampling Design and Monitoring. In: English et al, Survey Manual for Tropical Marine Resources. Townsville, Australian Institute of Marine Science: pp. 307-326.
Page, C, G Coleman, R Ninio and K Osborne (2001). Long-term Monitoring of the Great Barrier Reef Standard Operational Procedure Number 7, Australian Institute of Marine Science, Townsville Australia pp. 45. http://www.aims.gov.au/pages/research/reef-monitoring/ltm/mon-sop7/sop7-2001a.html
Rogers, CS, G Garrison, R Grober, ZM Hillis and MA Franke (1994). Coral Reef Monitoring Manual for the Caribbean and Western Atlantic. St. John, USVI, Virgin Islands National Park: pp. 106.
Rogers, CS and J Miller (1999). Coral Bleaching, Hurricane Damage, and Benthic Cover on Coral Reefs in St John, U.S. Virgin Islands: A Comparison of Surveys with the Chain Transect Method and Videography. Proceedings of the International Conference on Scientific Aspects of Coral Reef Assessment, Monitoring and Restoration. Bulletin of Marine Science 69: 459-470.
Russ, GR (1996). Do Marine Reserves Export Adult Fish Biomass? Evidence from Apo Island, Central Philippines. Marine Ecology Progress Series 132: 1-9.
Russ, GR (2002). Marine Reserves as Reef Fisheries Management Tools: Yet Another Review. San Diego, Academic Press. pp. 421-443.
Refe
renc
es

115
Russ, GR and AC Alcala (1996). Marine Reserves: Rates and Patterns of Recover and Decline in Abundance of Large Predatory Fish. Ecological Applications 6: 947-961.
Russ, GR and JH Choat (1988). Reef Resources: Survey Techniques and Methods of Study, South Pacific Commission/Inshore Fishery Research/WP.10.
Sale, PF and BJ Sharp (1983). Correction for Bias in Visual Transect Censuses of Coral Reef Fishes. Coral Reefs 2: 37-42.
Samoilys, MA (1997). Manual for Assessing Fish Stocks on Pacific Coral Reefs, Department of Primary Industries, Queensland.
Santavy, DL, E Mueller, EC Peters, L MacLaughlin, JW Porter, KL Patterson and J Campbell (2001). Quantitative Assessment of Coral Reef Diseases in the Florida Keys: Strategy and Methodology. Hydrobiologia 460: 39-52.
Segal, PF and CB Castro (2001). A Proposed Method for Coal Cover Assessment: A Case Study in Abrolhos, Brazil. Bulletin of Marine Science 69: 487-496.
Steneck, RS (1985). Adaptations of Crustose Coralline Algae to Herbivory: Patterns in Space and Time, Pages 352-366. In Toomy D and M. Nitecki (eds). Paleoalgology. Springer - Verlag. Berlin.
Tomkins, PA, DK Bass, DA Ryan and H Sweatman (1999). Video Identification of Benthic Organisms: How Accurate Is It? Proceedings of the International Conference on Science. Aspects of coral reef assessment and monitoring, and rest., April 14-16, 1999, Ft Lauderdale, FL.
Underwood, AJ (1994). On Beyond BACI: Sampling Designs That Might Reliably Detect Environmental Disturbances. Ecological Applications 4: pp. 3-15.
Underwood, AJ (1995). Detection and Measurement of Environmental Impacts. In: Coastal Marine Ecology of Temperate Australia, University of NSW Press.
Uychiaoco, AJ, SJ Green, MT Dela Cruz, PA Gaite, HO Arceo, PM Alino and AT White (2001). Coral Reef Monitoring for Management, University of the Philippines Marine Science Institute, United Nations Development Programme Global Environment Facility-Small Grants Program, Guiuan Development Foundation, Inc., Voluntary Service Overseas, University of the Philippines Center for Integration and Development Studies, Coastal Resource Management Project, and Fisheries Resource Management Project: pp. 110
Vogt, H, ARF Montebon and MLR Alcala (1997). Underwater Video Sampling: An Effective Method for Coral Reef Surveys? Proceedings, 8th International Coral Reef Symposium, Smithsonian Tropical Research Institute, Panama: 2, pp. 1447-1452
Wells, SM (1995). Reef Assessment and Monitoring Using Volunteers and Non-Professionals. Publication of Rosenstiel School of Marine and Atmospheric Science, University of Miami, USA: pp. 57.
Wilkinson, C (2002). The Status of the Coral Reefs of the World: 2002. Townsville, Australia, Australian Institute of Marine Science and the Global Coral Reef Monitoring Network: pp. 378.
Wilkinson, C, A Green, J Almany and S Dionne (2003). Monitoring Coral Reef Marine Protected Areas. A Practical Guide on How Monitoring Can Support Effective Management of MPAs. Townsville, Australia, Australian Institute of Marine Science and the IUCN Marine Program: pp. 68
Zar, J (1999). Biostatistical Analysis, Upper Saddle River, New Jersey: Prentice-Hall.
Refe
renc
es
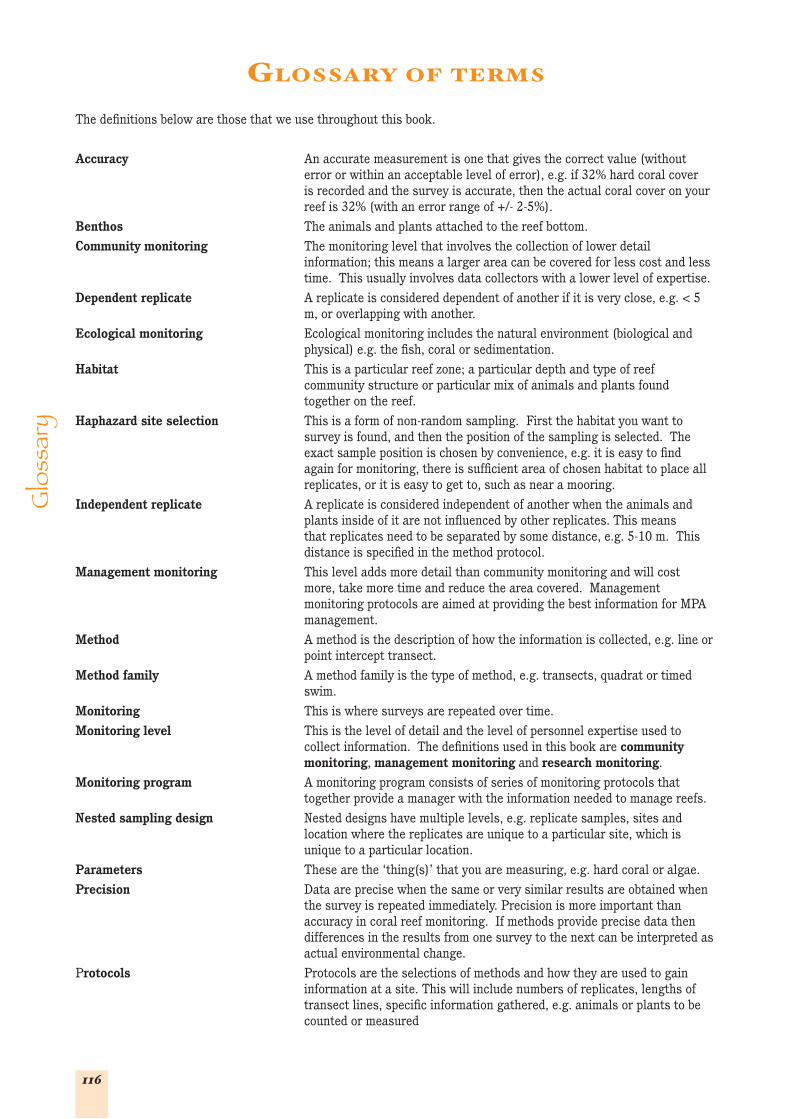
116
GLOSSARY OF TERMS
The definitions below are those that we use throughout this book.
Accuracy An accurate measurement is one that gives the correct value (without error or within an acceptable level of error), e.g. if 32% hard coral cover is recorded and the survey is accurate, then the actual coral cover on your reef is 32% (with an error range of +/- 2-5%).
Benthos The animals and plants attached to the reef bottom.
Community monitoring The monitoring level that involves the collection of lower detail information; this means a larger area can be covered for less cost and less time. This usually involves data collectors with a lower level of expertise.
Dependent replicate A replicate is considered dependent of another if it is very close, e.g. < 5 m, or overlapping with another.
Ecological monitoring Ecological monitoring includes the natural environment (biological and physical) e.g. the fish, coral or sedimentation.
Habitat This is a particular reef zone; a particular depth and type of reef community structure or particular mix of animals and plants found together on the reef.
Haphazard site selection This is a form of non-random sampling. First the habitat you want to survey is found, and then the position of the sampling is selected. The exact sample position is chosen by convenience, e.g. it is easy to find again for monitoring, there is sufficient area of chosen habitat to place all replicates, or it is easy to get to, such as near a mooring.
Independent replicate A replicate is considered independent of another when the animals and plants inside of it are not influenced by other replicates. This means that replicates need to be separated by some distance, e.g. 5-10 m. This distance is specified in the method protocol.
Management monitoring This level adds more detail than community monitoring and will cost more, take more time and reduce the area covered. Management monitoring protocols are aimed at providing the best information for MPA management.
Method A method is the description of how the information is collected, e.g. line or point intercept transect.
Method family A method family is the type of method, e.g. transects, quadrat or timed swim.
Monitoring This is where surveys are repeated over time.
Monitoring level This is the level of detail and the level of personnel expertise used to collect information. The definitions used in this book are community monitoring, management monitoring and research monitoring.
Monitoring program A monitoring program consists of series of monitoring protocols that together provide a manager with the information needed to manage reefs.
Nested sampling design Nested designs have multiple levels, e.g. replicate samples, sites and location where the replicates are unique to a particular site, which is unique to a particular location.
Parameters These are the ‘thing(s)’ that you are measuring, e.g. hard coral or algae.
Precision Data are precise when the same or very similar results are obtained when the survey is repeated immediately. Precision is more important than accuracy in coral reef monitoring. If methods provide precise data then differences in the results from one survey to the next can be interpreted as actual environmental change.
Protocols Protocols are the selections of methods and how they are used to gain information at a site. This will include numbers of replicates, lengths of transect lines, specific information gathered, e.g. animals or plants to be counted or measured
Glo
ssar
y

117
Pseudoreplication This is where the area contained within the replicate samples is not sufficiently distant in space to be considered independent.
Qualitative information This is a subjective description of the object of interest and is difficult to use for comparative studies e.g. coral cover is described as ‘medium’ by one observer and ‘low’ by another because their concepts of ‘medium’ and ‘low’ are different. Qualitative information is useful to support quantitative information e.g. photographs of reef change can support trends illustrated on a graph. The public will relate better to photographs than graphs.
Quantitative information This is when the subject of interest (e.g. coral cover) is expressed as a number (e.g. 32% coral cover). Quantitative information is standardised and therefore comparable.
Random site selection This is where bias is completely removed from the selection process and sites are selected by chance. Different sites should have equal chance of being selected using random selection methods. Random methods can be logistically difficult to implement because of the complex and spatially variable nature of coral reefs. We recommend you use stratified haphazard methods.
Replicates Replicates are the number of separate samples used to survey one site. Scientists are interested in the mean number of animals or plants from all replicates surveyed at one site as well as the variability between the replicates.
Representative This means characteristic or typical. A representative sample includes an area of reef that is characteristic of the area of reef being described with monitoring information.
Research monitoring This level provides very detailed data, but it is expensive, takes more time, requires more expertise to assess a smaller area, and is usually designed to answer a specific question.
Rugosity This is a measure of the amount of coral surface area in relation to linear area. Branching coral reef habitats will have a higher rugosity (structural complexity) than encrusting coral reef habitats.
Sample A sample is the area in which you count the animals and plants e.g. along a transect or inside a quadrat. The sample areas chosen for monitoring will depend on what type of information required and the parameters being counted.
Sample method This is the size and shape of the sampling method e.g. transect length and number, duration of a timed swim or quadrat size.
Sampling Measuring a part of the environment.
Scale This is either broad (low detail), medium (medium detail) or fine (high detail).
Site A monitoring site is the area of coral reef selected for monitoring and where data are required i.e. where the methods are used to gather sample data.
Socio-economic monitoring This is monitoring the way humans use and interact with natural resources e.g. fish catch statistics in a particular area; fish prices in the markets; or community perceptions on resource management.
Spatial heterogeneity This is where the reef (animal and plant) community and substrate is variable in space.
Spatial index This is the ratio of reef surface contour distance to linear distance. A high index indicate a surface of high rugosity.
Structural complexity This is a measure of the amount of coral surface area in relation to linear area. Branching coral reef habitats will have a higher structural complexity (rugosity) than encrusting coral reef habitats.
Substrate This includes the animals and plants that are attached to the reef bottom, as well as the non-living parts of the reef, e.g. rock or dead coral.
Survey This is data collection at a monitoring site on one occasion.
Variables These are the ‘thing(s)’ that you are measuring, e.g. hard coral or algae.
Zone This is a particular reef habitat, i.e. a particular depth and type of reef community structure or particular mix of animals and plants found together on the reef.
Glo
ssar
y