Embed Size (px)
Citation preview
METHODS FOR ANALYZING WALL SLIP IN THE DIE OF A
CAPILLARY RHEOMETER AT VARYING OIL CONTENTS
by
Alyssa Christoffer
A Thesis
Submitted to the Faculty of Purdue University
In Partial Fulfillment of the Requirements for the degree of
Master of Science in Agricultural and Biological Engineering
School of Agricultural and Biological Engineering
West Lafayette, Indiana
December 2019

2
THE PURDUE UNIVERSITY GRADUATE SCHOOL
STATEMENT OF COMMITTEE APPROVAL
Dr. Martin Okos, Chair
Department of Agricultural and Biological Engineering
Dr. Joezef Kokini
Department of Food Science
Dr. Ganesan Narsimhan
Department of Agricultural and Biological Engineering
Approved by:
Dr. Nathan Mosier

3
To God who makes all things possible.

4
ACKNOWLEDGMENTS
I would like to thank Dr. Okos for his guidance and support throughout my time as both a graduate
and an undergraduate student at Purdue. I would also like the thank my committee members Dr.
Kokini and Dr. Narsimhan for their well-versed advice on my thesis project.
Thank you to my lab mate Troy for being my right-hand man in the lab and in the office. Thank
you to all the ABE faculty and staff, especially Nikki, for always being there to listen and give
advice. Thank you also to Bhavesh Patel for sharing his knowledge of the rheology lab.
A special thanks to Agricor in Marion, Indiana for donating the corn meal used throughout this
study. Thank you for your generous donation.
I would also like to thank my family. To my mom and brother for always believing in me. To my
fiancé Nick for his endless support.

5
TABLE OF CONTENTS
LIST OF TABLES .......................................................................................................................... 7
LIST OF FIGURES ........................................................................................................................ 8
ABSTRACT .................................................................................................................................. 10
INTRODUCTION ................................................................................................................. 11
1.1 Extrusion ........................................................................................................................... 11
1.2 Single Screw Extruder Scale Down .................................................................................. 11
1.3 Wall Slip ........................................................................................................................... 12
1.4 Problem Statement and Objectives ................................................................................... 13
LITERATURE REVIEW ...................................................................................................... 14
2.1 Extrusion ........................................................................................................................... 14
2.2 Entrance Effects ................................................................................................................ 15
2.2.1 Bagley Correction ...................................................................................................... 15
2.3 Wall Effect and the Importance of Slip ............................................................................ 16
2.3.1 Product Quality .......................................................................................................... 17
2.4 Mooney Slip Analysis Method ......................................................................................... 19
2.4.1 Assumptions .............................................................................................................. 19
2.5 Other Slip Analysis Methods ............................................................................................ 20
2.6 Conclusion ........................................................................................................................ 21
MATERIALS AND METHODS .......................................................................................... 22
3.1 Materials ........................................................................................................................... 22
3.2 Sample Preparation ........................................................................................................... 22
3.3 Capillary Rheometer ......................................................................................................... 23
3.3.1 Pressure Calibration ................................................................................................... 24
3.3.2 Procedure ................................................................................................................... 24
3.3.3 Data Collection .......................................................................................................... 25
3.4 Analysis Methods.............................................................................................................. 25
3.4.1 Bagley Correction ...................................................................................................... 25
3.4.2 Mooney Slip Analysis................................................................................................ 26
RESULTS AND DISCUSSION ............................................................................................ 28
6
4.1 Bagley Correction ............................................................................................................. 28
4.2 Flow Behavior Index......................................................................................................... 31
4.3 Mooney Slip Analysis ....................................................................................................... 33
4.4 Empirical Model ............................................................................................................... 38
CONCLUSION...................................................................................................................... 40
5.1 Conclusion ........................................................................................................................ 40
5.2 Future Work ...................................................................................................................... 40
REFERNCES ......................................................................................................................... 41
APPENDIX A ........................................................................................................................ 44
APPENDIX B ........................................................................................................................ 48
APPENDIX C ........................................................................................................................ 50

7
LIST OF TABLES
Table 2.2: Procedure for Bagley correction (Morrison, 2001) ..................................................... 16
Table 3.1 Proximate composition of cornmeal used in this study. ............................................... 22
Table 3.2 Particle size of cornmeal used in this study based on ability to pass through sieve size.
....................................................................................................................................................... 22
Table 3.3 Length and diameter of dies used in this study. The Bagley correction requires different
L/D at constant sheer rate (Morrison, 2001). Die with the same L/D at constant sheer stress are
required for the Mooney slip analysis method (Morrison, 2001). ................................................ 24
Table 4.1: Comparison of Bagley correction at a shear rate of 0.009 s-1 ...................................... 31
8
LIST OF FIGURES
Figure 1.1: Small scale singe-screw extruder schematic (Hauersperger, Tonner, & Okos, 2017).
....................................................................................................................................................... 11
Figure 1.2: Wall slip causes a decrease in wall shear rate (Morrison, 2001). .............................. 12
Figure 2.1: Example of a Bagley plot used to correct for entrance effects (Tonner, 2018). ........ 16
Figure 2.2: No slip during extrusion of polyethylene (Pudjijanto & Denn, 1994). ...................... 18
Figure 2.3: Stick-slip during extrusion of polyethylene (Pudjijanto & Denn, 1994). .................. 18
Figure 2.4: Shark skin during extrusion of polyethylene (Pudjijanto & Denn, 1994). ................. 18
Figure 3.1: Capillary rheometer (Malvern Panalytical, 2019) ...................................................... 23
Figure 3.2: Example of a Bagley correction plot. ......................................................................... 26
Figure 4.1: Bagley plot for 0% added oil. ..................................................................................... 29
Figure 4.2: Bagley plot for 2.5% added oil ................................................................................... 29
Figure 4.3: Bagley plot for 5% added oil ...................................................................................... 30
Figure 4.4: Bagley plot of all oil contents at a shear rate of 0.009 s^-1 ....................................... 30
Figure 4.5: Log-log plot of apparent viscosity versus shear rate at 0% oil added. ....................... 31
Figure 4.6: Log-log plot of apparent viscosity versus shear rate at 2.5% oil added. .................... 32
Figure 4.7: Log-log plot of apparent viscosity versus shear rate at 5% oil added. ....................... 32
Figure 4.8: Plotting change in pressure versus diameter shows slip is happening even at 0% added
oil content...................................................................................................................................... 33
Figure 4.9: Plotting change in pressure versus diameter shows slip is happening at 2.5% added oil
content. .......................................................................................................................................... 34
Figure 4.10: Plotting change in pressure versus diameter shows slip is happening at 5% added oil
content. .......................................................................................................................................... 34
Figure 4.11: Plug removed from capillary rheometer after 2.5% oil content added run. Oil
collection near the bottom of the plug is apparent. ....................................................................... 35
Figure 4.12: Plug removed from capillary rheometer after 2.5% oil content added run. There is a
visible ring of higher oil content near the outside of the plug. ..................................................... 35
Figure 4.13: Shark-skin effect on extrudate. Piau, El Kissi, & Tremblay (1990) attribute this
phenomena to slip. ........................................................................................................................ 36
Figure 4.14: Plot example to find shear stress values for the Mooney analysis. .......................... 36
Figure 4.15: Mooney plot for an added oil content of 5% and L/R=4. Shear stress is in Pa-s. .... 37

9
Figure 4.16: Mooney plot for an added oil content of 0%. Shear stress is in Pa-s. ...................... 38
Figure 4.17: Empirical model relating viscosity to oil content. .................................................... 39

10
ABSTRACT
Wall slip in the die of a capillary rheometer was investigated. Corn meal and water were mixed to
a moisture content of 35% wet basis. Oil was then added at 0%, 2.5%, and 5% of the total mass.
A capillary rheometer was used to extrude the mixture at 100C. Three die diameters were studied:
2mm, 4mm, and 8mm. Two length to diameter ratios were studied: L/D=4 and L/D=8. Pressure
and flow rate in grams per 30 seconds were collected from the capillary rheometer to perform the
Bagley correction, determine the flow behavior index, and correct for slip using the Mooney slip
analysis method. Several slip analysis methods were considered prior to the selection of the
Mooney method. Overall, the Bagley correction was successful for all die diameters except 2mm.
The Mooney method was successful for the 5% added oil content samples. An increase slip
velocity was observed as shear stress increased. Mooney plots for 0% and 2.5% resulted in
negative shear rate values. An empirical model was developed to predict apparent viscosity of the
mixture as a function of total oil content

11
INTRODUCTION
1.1 Extrusion
Extrusion is when a product is pushed or forced through a die opening. The first extruder
patent was reported in 1797 for the fabrication of a lead pipe using a ram to force the lead through
a die (Kazemzadeh, 2012). In the food industry extrusion is used for mixing, cooking, forming,
and many other processing steps (Berk, 2012). Two major types of extruders used in food
production are single-screw and twin-screw.
1.2 Single Screw Extruder Scale Down
A small-scale single screw extruder was developed by Purdue University (West Lafayette,
Indiana) in partnership with Insta-Pro International (Des Moies, Iowa). The throughput of the
smaller scale extruder was designed to be 30kg/hr and was scaled down from a 300 kg/hr extruder.
Originally, the project was developed for NASA to process seeds during Advance Life Support
systems missions, which occur beyond Low Orbit Earth (Ponrajan, 2015). More recently, Ponrajan
(2015) investigated the application of the 30kg/hr single screw extruder for food processing in
developing nations. Figure 1.1 shows the extruder screw design used to obtain a throughput of
30kg/hr.
Figure 1.1: Small scale singe-screw extruder schematic (Hauersperger, Tonner, & Okos, 2017).
This work is a continuation of the work done by Penner (2008), Ponrajan (2015), and Tonner
(2018) to further develop the understanding of the smaller scale single screw extruder. Penner
(2008) reported on geometries and ratios used for the scale down procedure. Ponrajan (2015)
12
focused on finding workable operating conditions and using a capillary rheometer to predict
operating conditions for the scaled down extruder. Interest in using an off-line capillary rheometer
to predict rheological outcomes of a full-scale extruder continues. A capillary rheometer uses a
relatively small amount of product in comparison to a single screw extruder. Tonner (2018) began
the development of a finite element model of the extruder and investigated the effect of extrusion
conditions on melt viscosity. Both Tonner (2018) and Ponrajan (2015) reported on the rheology of
a mixture of corn meal and water. Tonner (2018) and Ponrajan (2015) also both reported a
difference between shear rate reported by the rheometer and the actual shear rate as a potential
cause of error in their results. Further investigation into the slip occurring in this product is needed
to further the development of the finite element extruder model.
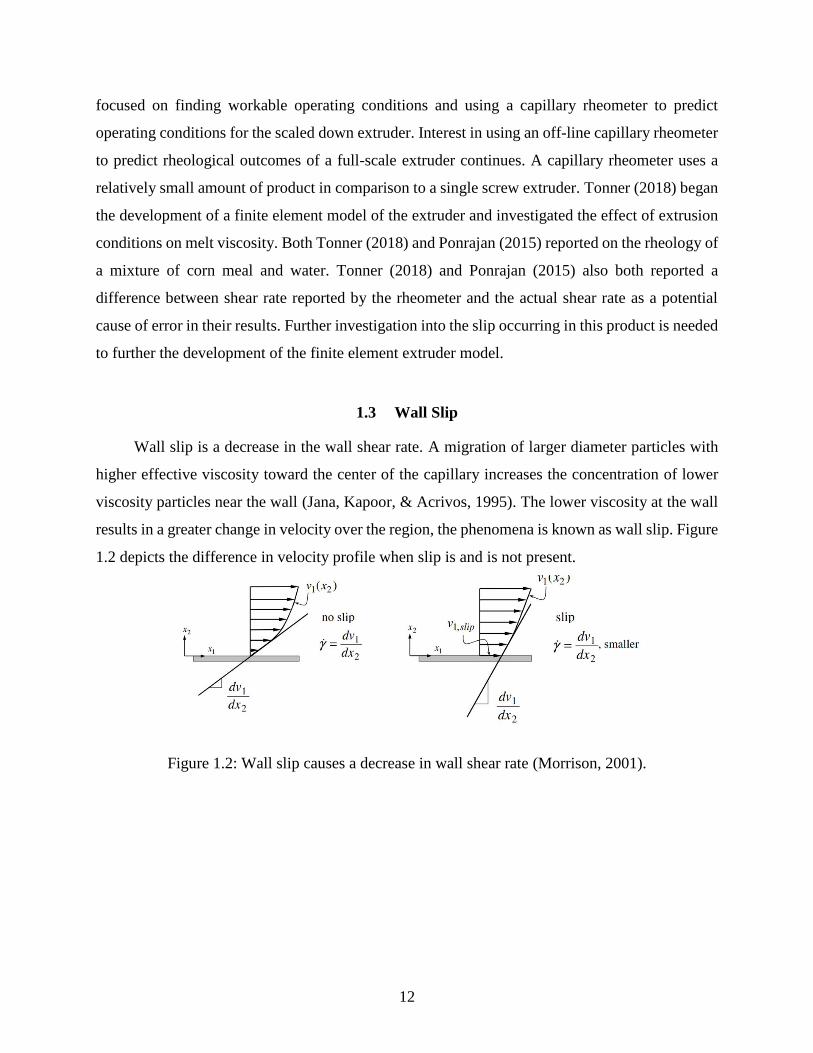
1.3 Wall Slip
Wall slip is a decrease in the wall shear rate. A migration of larger diameter particles with
higher effective viscosity toward the center of the capillary increases the concentration of lower
viscosity particles near the wall (Jana, Kapoor, & Acrivos, 1995). The lower viscosity at the wall
results in a greater change in velocity over the region, the phenomena is known as wall slip. Figure
1.2 depicts the difference in velocity profile when slip is and is not present.
Figure 1.2: Wall slip causes a decrease in wall shear rate (Morrison, 2001).

13
1.4 Problem Statement and Objectives
Wall slip in the die of an extruder can cause large discrepancies between actual shear rate
values and those calculated from force. An understanding of the correct method for slip correction
is desired. Shear rate correction values for a range of die lengths and diameters at varying operating
conditions are needed for the continued development of a finite element model of the 30kg/hr
single screw extruder.
Objectives:
1. Determine the appropriate method for wall slip correction.
2. Find shear rate correction for the previously studied mixture of corn meal and water using
varying oil contents.

14
LITERATURE REVIEW
2.1 Extrusion
Extrusion is extensively used in many industries including the production of food and feed.
Early examples of extrusion in the food industry consist of forming extrusion to produce pasta or
sausage (Levine & Miller, 2007). More recently, extrusion is used for many unit operations such
as mixing, puffing, separation, moisture reduction, and cooking (Guy, 2001). Many of the modern
uses for extrusion occur under high shear rate and pressure conditions. High shear rate and pressure
can cause large changes in structure such as gelatinization and crystallization of starches. An in
line rheometer should be used to capture how these structural changes influence the rheological
properties of a product (Campanella, Li, Ross, & Okos, 2002). Capillary rheometers are useful for
determining viscosities of material at high shear rates similar to those experienced in an extruder.
When using a capillary rheometer, the product experiences pressure induced laminar flow through
the die (Karnis, Goldsmith, & Mason, 1966). Pressure induced laminar flow is known as Poiseuille
flow. For Poiseuille flow in a capillary there are seven main assumptions which can be found in
Table 2.1 (Morrison, 2001).
Table 2.1: Assumptions for Poiseuille flow in a capillary (Morrison, 2001)
Poiseuille Flow in a Capillary
1. Flow only occurs in one direction
2. Incompressible fluid
3. Symmetry across the middle of the capillary
4. Variation in the z-direction is negligible
5. Stress tensor is symmetric
6. Pressure change in the z-direction is constant
7. Finite stress at the center of the capillary
In order to obtain an accurate viscosity from capillary rheometer experiments corrections
must be made to data based on the assumptions stated in Table 2.1. This includes corrections for
non-Newtonian fluids, entrance effects, and wall effects.

15
2.2 Entrance Effects
Entrance effects are caused by sudden changes to the velocity profile of the fluid as it is
extruded from the large diameter reservoir through the much smaller diameter capillary die
(Jastrzebski, 1967). The change in velocity profile results in a pressure loss. Change in pressure is
used to calculate shear stress. Shear stress is calculated by Equation 2.1 where 𝜏𝑤 is the wall shear
stress in MPa, ∆𝑃 is the change in pressure in MPa, D is the die diameter in mm, and L is the die
length in mm. The total applied pressure to the piston can be much greater than the actual pressure
drop along the length of the die (Jastrzebski, 1967). If left uncorrected, entrance effects cause
elevated shear stress calculations. The Bagley correction is widely used to correct for entrance
effects and can be used to calculate both the pressure change due to entrance effects and the
theoretical length of the die after entrance effects are considered. Equation 2.1 is applicable to both
Newtonian and non-Newtonian fluids.
𝜏𝑤 =∆𝑃∗𝐷
4∗𝐿 Equation 2.1
2.2.1 Bagley Correction
The Bagley correction adjusts for inaccuracies in calculated wall shear stress by accounting
for the pressure losses due to entrance effects (Bagley, 1957). Table 2.2 gives the method for
performing the Bagley correction as outlined by Morrison (2001) where �̇�𝑎 is the apparent wall
shear rate in s-1, Q is the volumetric flow rate in mm3/s, R is the radius of the capillary in mm, 𝜏𝑟𝑧
is shear stress in MPa, ∆𝑃 is the change in pressure in MPa, and L is the die length in mm. Pojaran
(2015) and Tonner (2018) both found that the Bagley correction can produce erroneous results if
product leaks past the rheometer piston back to the capillary reservoir. Tonner (2018) reported that
1 mm of product slip past the piston back to the capillary reservoir can cause a 30% decrease in
the wall shear rate. The Bagley correction is performed by plotting the change in pressure versus
the length to radius ratio at various shear rates. Each line requires a constant shear rate and a
constant capillary die radius. An example of a Bagley plot is shown in Figure 2.1.

16
Table 2.1: Procedure for Bagley correction (Morrison, 2001)
1. Calculate γ̇a =4Q
πR3
2. Plot ΔP vs. L/R at constant γ̇a
3. Find the y-intercept = ΔPend effects
4. ΔPcorrected = ΔP − ΔPend effects
5. τrz =ΔPcorrectedR
2L
Figure 2.1: Example of a Bagley plot used to correct for entrance effects (Tonner, 2018).
2.3 Wall Effect and the Importance of Slip
The assumption of a no-slip boundary condition is prominent in fluid mechanics. Kokini and
Derisoglu (1990) showed that rheological data uncorrected for slip can contain errors in the shear
rate values that are as large as 70-80%. When dealing with food products, especially those with
high moisture and oil contents, slip must be accounted for. When glass capillaries were used to
view Poiseuille flow a radial migration of particles towards the center of the capillary was observed
(Karnis, Goldsmith, & Mason, 1966). The radial migration of particles caused a concentration of
the liquid phase near the wall, which in turn caused a change in velocity profile near the wall

17
(Karnis, Goldsmith, & Mason, 1966). The change of velocity profile near the wall is the
phenomena known as slip.
A significant number of studies have been done on slip during the extrudate of polymers.
While polymers are different from food products, these studies can be used to draw conclusions
about the causes of slip in a capillary. Benbow and Lame (1963) concluded that instability at the
wall originates very near to the entrance of the die and this instability causes slip. They also
concluded that the die material plays an important role in development of slip (Benbow & Lamb,
1963). Another contributing factor to slip velocity is the geometry of the die. Several studies have
concluded that slip velocity is dependent on the length to diameter ratio of the rheometer die
(Hatzikiriakos & Dealy, 1992) (Kalika & Denn, 1987).
2.3.1 Product Quality
Consistent product quality is important in all manufacturing processes. Wall slip during
extrusion changes the physical appearance of the extrudate. Without the presence of slip, extrudate
appears smooth. Stick-slip is caused by the extrusion of a non-homogeneous mixture ( Rodríguez-
González, Pérez-González, Marín-Santibáñez, & de Vargas, 2009). Stick-slip is visibly
characterized by intermixed areas of shark-skin and smooth extrudate. Slip causes the surface of
extrudate to become visibly rough, often known as the shark skin effect (Denn, 2001). Both the
stick -slip and the shark skin effects must be studied immediately after product exits the die (Piau,
El Kissi, & Tremblay, 1990). Product relaxation or shrinking long after it exits the die can also
cause extrudate to take on the appearance of stick-slip or shark skin (Piau, El Kissi, & Tremblay,
1990). Figure 2.2 shows product with no slip, figure 2.3 shows product experiencing stick-slip,
and figure 2.4 shows the full shark skin effect that is caused by wall slip. Figures 2.2-2.4 were
taken from Pudjijanto and Denn (1994).

18
Figure 2.2: No slip during extrusion of polyethylene (Pudjijanto & Denn, 1994).
Figure 2.3: Stick-slip during extrusion of polyethylene (Pudjijanto & Denn, 1994).
Figure 2.4: Shark skin during extrusion of polyethylene (Pudjijanto & Denn, 1994).

19
2.4 Mooney Slip Analysis Method
Apparent shear rate is calculated by Equation 2.2 where �̇�𝑎 is the apparent wall shear rate in
s-1, Q is the volumetric flow rate in mm3/s, and R is the radius of the capillary in mm. Slip at the
wall causes a disparity between the Q value calculated from piston velocity and the actual flow
rate coming out of the capillary rheometer. Mooney (1931) was the first to propose a method to
correct shear rate values for slip occurring at the wall. He proposed that slip is caused by a larger
velocity gradient in a layer at the wall that is small in comparison to the diameter of the capillary
(Mooney, 1931). The Mooney slip analysis method plots shear rate versus the inverse of the
squared radius. Each line on the plot must be at a constant shear stress and consist of data from
dies with the same length to diameter ratios (Morrison, 2001).
�̇�𝑎 =4∗𝑄
𝜋∗𝑅3 Equation 2.2
2.4.1 Assumptions
The method published by Mooney (1931) makes the broad assumption that only fluidity
and slip affect the measurements. Mooney (1931) also did not account for entrance or exit effects
and assumed a Newtonian fluid. The Mooney-Rabinowitsch relation was developed in 1929 as a
correction for the Newtonian assumption made in many rheological models (Rabinowitsch, 1929).
The Mooney-Rabinowitsch relation uses the slope from a log-log plot of shear stress versus shear
rate to determine the behavior index of the material (Rabinowitsch, 1929). However, this relation
assumes a time independent laminar flow and that there is no slippage at the wall (Jastrzebski,
1967). It is common practice to perform a correction to the shear rate, that is a slip correction, prior
to correction for the Newtonian fluid assumption.
Jastrzebski’s (1967) execution of the Mooney slip analysis method uses the Bagley
correction for entrance effect, compares dies of the same length to diameter ratio, and also
performs the correction for non-newtonian velocity profiles. The well executed application of all
the mentioned corrections means the study can be used as a model for experimental and data
analysis procedures.

20
2.5 Other Slip Analysis Methods
The Mooney slip analysis method requires a high quantity of experiments meaning it is very
time intensive. Because of the time intensive nature of performing the Mooney slip analysis
procedure, many studies have been done to try and find alternative ways to correct for slip with
varying levels of success. Many studies also obtain physically impossible negative shear rates from
the Mooney slip correction and search for alternatives for that reason (Chuan & Zara, 2014).
A simple variation on the Mooney procedure was proposed by Ren, Huang and Liu (2016).
They proposed that by having a fixed die diameter and correcting for length the large experimental
load from the traditional Mooney technique can be overcome (Ren, Huang, & Liu, 2016). The
proposition that performing experiments at different length to diameter ratios goes against the
geometric dependency of the Mooney correction as reported by Morrison (2001). Adding an
additional correction for die geometry adds a layer of complexity to the already significant amount
of corrections needed to obtain rheological values from capillary rheometer experiments on non-
Newtonian fluids. Hatzikiriakos and Dealy (1991) attempted to study slip without the influences
of entrance effects or a pressure gradient. They accomplished this using a sliding plate rheometer
at steady shear and a critical shear stress for the slippage of polyethylene was found (Hatzikiriakos
& Dealy, 1991). Rapid and unpredictable deformations led them to conclude a dynamic model was
needed for the evolution of slip throughout the process (Hatzikiriakos & Dealy, 1991). A finite
element model of a capillary rheometer was developed by Chuan and Zara (2014) to analyze wall
slip. As a result of the finite element wall it became apparent that at high levels of slip the Cox-
Mertz rule provides shear viscosity that is higher than complex viscosity (Chuan & Zara, 2014).
This highlights another important reason to correct for slip prior to calculating viscosity. However,
their study did not account for back mixing that happens at the rapid diameter change from the
reservoir to the capillary die or for potential slippage on the sides of the piston. Further
development of the finite element model would need to be done in order to have a true predictor
for slip analysis.
Potentially the most accurate way to obtain the velocity profile inside a capillary rheometer
is with Nuclear Magnetic Resonance (NMR). Gibbs et al. (1996) used a phase-based NMR
technique to track the velocity of different slices within the capillary. Slip velocities obtained from
the NMR technique matched those from performing the Mooney slip analysis (Gibbs, et al., 1996).
NMR would be a good alternative to the Mooney slip analysis method if an NMR is available.

21
Although some studies obtained physically impossible negative shear rates from the Mooney
correction, it appears that, as long as assumptions are met, the Mooney method is an appropriate
method for calculating slip velocity and correcting for wall shear rate.
2.6 Conclusion
While others have tried to develop their own methods for analyzing slip, the Mooney slip
method outlined by Jastrzebski (1967) is the most mathmatically sound. Many have struggled to
perform the Mooney slip analysis method and have left the correction out of their calculations.
While performing a correction for slip is experimentally tedious, the large impact of the correction
on rheolocigal calulations makes it necessary. Slip correction values for a mixture of corn meal,
oil, and water have not been found in literature and are necessary for the development of a reliable
model of an extruder.

22
MATERIALS AND METHODS
3.1 Materials
Degermed, dehulled fine yellow cornmeal (M77 fine yellow cornmeal) donated by Agricor,
Inc. was used in this study. The proximate composition and particle size provided in the certificate
of analysis can be found in Table 2.1.1 and Table 2.1.2. Mazola corn oil was purchased and used
to vary the oil content of the cornmeal.
Table 3.1 Proximate composition of cornmeal used in this study.
Component Percentage
Moisture 12.60%
Fat 0.94%
Protein 5.83%
Table 3.2 Particle size of cornmeal used in this study based on ability to pass through sieve size.
Granulation Percentage
Held on US #30 0.00%
Held on US #40 30.12%
Held on US #80 66.10%
Through US #80 3.76%
3.2 Sample Preparation
Cornmeal was removed from the storage cooler and allowed to come to room temperature.
A rapid moisture analyzer (Mettler Toledo) was used to determine the moisture content of the
cornmeal. Water was then added using a benchtop laboratory mixer (KitchenAid Mixer) to
increase the moisture content to 35% wet basis. The moisture content of 35% wet basis was chosen
based on previous work by Ponrajan, 2016 and Tonner, 2018. Corn oil was added after sample
was increased to 35% w.b. moisture content. Oil was added at 0%, 2.5%, and 5% of the moisture
adjusted mass. Prepared samples were placed in large plastic storage bags with the air pressed out
and allowed to equilibrate in the storage cooler overnight. Samples were removed from the cooler
and allowed to return to room temperature before running them through the capillary rheometer.
23
Moisture content was verified using a rapid moisture analyzer after sample had equilibrated to
room temperature.
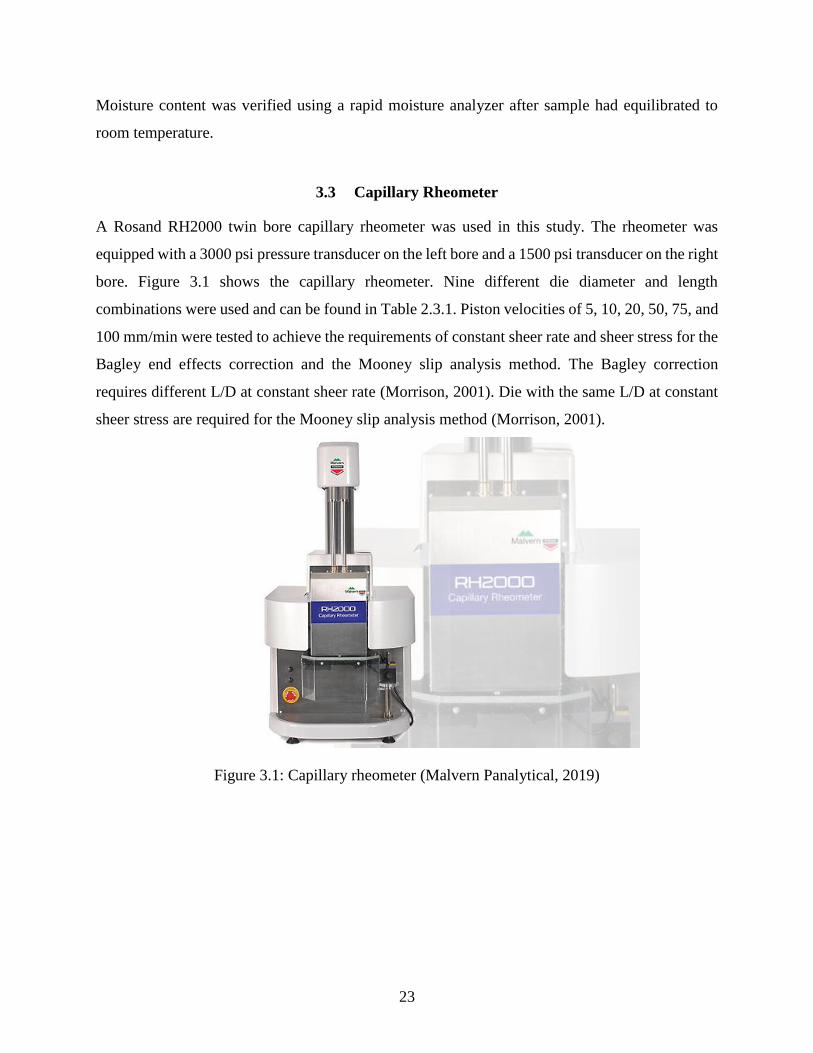
3.3 Capillary Rheometer
A Rosand RH2000 twin bore capillary rheometer was used in this study. The rheometer was
equipped with a 3000 psi pressure transducer on the left bore and a 1500 psi transducer on the right
bore. Figure 3.1 shows the capillary rheometer. Nine different die diameter and length
combinations were used and can be found in Table 2.3.1. Piston velocities of 5, 10, 20, 50, 75, and
100 mm/min were tested to achieve the requirements of constant sheer rate and sheer stress for the
Bagley end effects correction and the Mooney slip analysis method. The Bagley correction
requires different L/D at constant sheer rate (Morrison, 2001). Die with the same L/D at constant
sheer stress are required for the Mooney slip analysis method (Morrison, 2001).
Figure 3.1: Capillary rheometer (Malvern Panalytical, 2019)

24
Table 3.3 Length and diameter of dies used in this study. The Bagley correction requires
different L/D at constant sheer rate (Morrison, 2001). Die with the same L/D at constant sheer
stress are required for the Mooney slip analysis method (Morrison, 2001).
Length Diameter L/D
0.25 2 0.13
0.25 4 0.06
0.25 8 0.03
4 2 2
8 4 2
16 8 2
8 2 4
16 4 4
32 8 4
3.3.1 Pressure Calibration
Prior to running any experiments, the rheometer needed calibration. Calibration was
accomplished using a dead weight tester over the range of 0 psi to 1500 psi. Due to load restrictions
on the dead weight tester higher pressures could not be calibrated. The rheometer was set to stop
the experiment if the pressure reached a value higher than the calibration limit.
3.3.2 Procedure
Sample was removed from the cooler three hours before running any experiments to allow
adequate time for it to reach room temperature. At the same time point, the capillary rheometer
was turned on and set to 100°C. Once equilibrium had been reached, dies were attached, and each
bore was filled with sample. A plug and hammer were used to lightly compact the sample to assure
there were no major air gaps.
To prevent the buildup of product from interfering with results, the rheometer was
thoroughly cleaned with a solution of soap and water between each run. The water was allowed to
boil inside each bore and a brush was used to dislodge any particles. After the soapy water was
drained, the bores were dried, and new dies were attached.

25
3.3.3 Data Collection
Each run was performed at a constant piston velocity, which gives a constant shear rate.
Pressure was recorded by the rheometer every two seconds for the duration of the run. The flow
rate was calculated based on the piston velocity and diameter of the capillary. Flow rate was also
measured by massing extrudate over a time period of 30 seconds.
3.4 Analysis Methods
Sheer stress was calculated with the recorded pressure data using Equation 3.1 where 𝜏𝑤 is
the wall shear stress, ∆𝑃 is the change in pressure, D is the die diameter, and L is the die length.
Apparent wall shear rate was calculated using Equation 3.2 where �̇�𝑎 is the apparent wall shear
rate, Q is the volumetric flow rate, and R is the radius of the capillary. Pressure readings for each
run were averaged over the duration extrudate was flowing from the capillary rheometer.
𝜏𝑤 =∆𝑃∗𝐷
4∗𝐿 Equation 3.1
�̇�𝑎 =4∗𝑄
𝜋∗𝑅3 Equation 3.2
To account for the material being non-Newtonian, the Weissenberg-Rabinowitsch
correction was applied using Equation 3.3 where �̇�𝑤 is the wall shear rate and the power law index
n is as defined in Equation 3.4.
�̇�𝑤 = (3𝑛+1
4𝑛) ∗ �̇�𝑎 Equation 3.3
𝑛 =𝑑(ln(𝜏𝑤))
𝑑(ln(�̇�𝑎)) Equation 3.4
Apparent viscosity was then calculated as wall shear stress divided by wall shear rate, as
shown in Equation 3.5 where 𝜂 is apparent viscosity.
𝜂 =𝜏𝑤
�̇�𝑤 Equation 3.5
3.4.1 Bagley Correction
The capillaries used in this study were too short to ignore velocity variations that come
with developing flow. Therefore, the Bagley correction was used to correct for the entrance and
exit effects caused by the development of flow. Pressure transducers in the capillary rheometer
were located at the bottom of the reservoir right before the entrance to the die. The location of the

26
pressure transducers inside the capillary eliminates the need to account for a change in pressure
over the barrel (Morrison, 2001). Bagley plots were made by plotting the change in pressure versus
the length to radius ratio of the capillary. Each line in the plot is required to be at a constant shear
rate. The y-intercept of the line is the pressure correction for the end effects and was subtracted
from the measured change in pressure. The corrected change in pressure was used to calculate
shear stress. An example of a Bagley plot for 0% oil added can be seen in Figure 3.2. A pressure
correction of 1.2408MPa is needed for a shear rate of 0.0096 s-1 and a correction of 2.7782 MPa
is needed for a shear rate of 0.048 s-1
Figure 3.2: Example of a Bagley correction plot.
3.4.2 Mooney Slip Analysis
A no-slip condition was assumed at the capillary wall in the Weissenberg-Rabinowitsch
correction. However, slip does occur throughout this study and the Mooney slip analysis method
was performed to correct the changes in apparent shear rate due to slip velocity. Correcting the
wall shear rate is necessary to obtain the apparent viscosity.
Mooney slip analysis was done using the shear stress calculated from the Bagley corrected
change in pressure. Apparent shear rate was plotted versus the inverse of the capillary radius. Each
line is required to be at a constant shear stress. Since it is difficult to obtain a constant shear stress
under the operating conditions, a small range was used for each line. De Vargas, 1993 found slip
y = 0.1722x + 1.2408
y = 0.2209x + 2.7782
0
1
2
3
4
5
6
0 2 4 6 8 10
dP
L/R
SR=0.0096
SR=0.048
Linear (SR=0.0096)
Linear (SR=0.048)

27
velocity also changed with capillary length to diameter ratio. Many other studies also found a
similar result (Morrison, 2001), so analysis was performed using dies of the same length to
diameter ratio. The y-intercept of the plot is the apparent shear rate corrected for slip. An example
of the plot used to obtain slip corrected shear rate can be seen in Figure 3.3.
Figure 3.3: Example of a plot for Mooney slip analysis.
28
RESULTS AND DISCUSSION
4.1 Bagley Correction
The Bagley correction was applied to correct for entrance effects by adjusting the change in
pressure over the capillary die. End effects occur because of the sudden and rapid change in
diameter from the reservoir to the die. At long die lengths the Bagley correction becomes negligible.
Because of the location of the pressure transducers, and the short die length, the Bagley correction
had to be performed at each oil content. Figures 4.1-4.3 show the Bagley plots used. Figure 4
shows a comparison of the Bagley plots for all three different oil contents at the same shear rate.
The Bagley correction for each shear rate consistently increased as oil content increased. Meaning,
as oil content increases it takes longer for flow to become fully developed.
Ponrajan (2015) and Tonner (2018) both reported issues with obtaining negative viscosities
after performing the Bagley correction. In this study, only did the smallest die diameter, 2mm, had
issues with the Bagley correction. Sometimes the correction to the pressure was greater than the
actual pressure drop over the die. It should be noted that the smaller diameter dies only had a failed
Bagley correction at the highest piston speeds tested, 50, 75, 100 mm/min. Highest piston speeds
in combination with the lowest diameter created the highest pressures obtained in this study (3-5
Mpa). When the pressure in the capillary rheometer reach that level the standard issue O-rings
shred throughout the process. When this happens product can migrate back up the piston causing
a difference between calculated shear rate and actual. The compromised seal also lowers the
pressure change reported by the rheometer. According to Tonner (2018), the pseudo shear rate can
be lowered by as much as 30% by as little as 1mm of product slippage back up the capillary. In
the future, a softer O-ring should be used. The silicone O-ring used in this study had a hardness of
70. Harder O-rings tend to shred and break at lower pressures than the softer ones.

29
Figure 4.1: Bagley plot for 0% added oil.
Figure 4.2: Bagley plot for 2.5% added oil

30
Figure 4.3: Bagley plot for 5% added oil
Figure 4.4: Bagley plot of all oil contents at a shear rate of 0.009 s^-1
31
Table 4.1: Comparison of Bagley correction at a shear rate of 0.009 s-1
Oil Content [%] Bagley Correction
0 0.1278
2.5 0.1974
5 0.2177
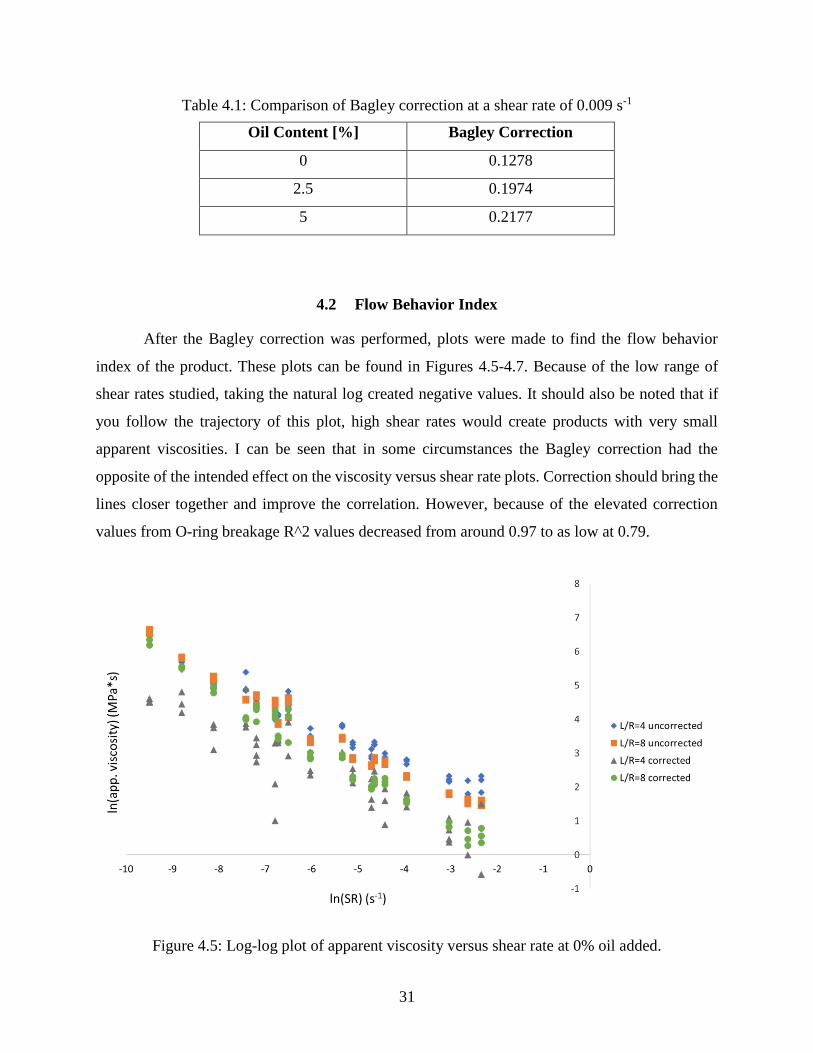
4.2 Flow Behavior Index
After the Bagley correction was performed, plots were made to find the flow behavior
index of the product. These plots can be found in Figures 4.5-4.7. Because of the low range of
shear rates studied, taking the natural log created negative values. It should also be noted that if
you follow the trajectory of this plot, high shear rates would create products with very small
apparent viscosities. I can be seen that in some circumstances the Bagley correction had the
opposite of the intended effect on the viscosity versus shear rate plots. Correction should bring the
lines closer together and improve the correlation. However, because of the elevated correction
values from O-ring breakage R^2 values decreased from around 0.97 to as low at 0.79.
Figure 4.5: Log-log plot of apparent viscosity versus shear rate at 0% oil added.

32
Figure 4.6: Log-log plot of apparent viscosity versus shear rate at 2.5% oil added.
Figure 4.7: Log-log plot of apparent viscosity versus shear rate at 5% oil added.
33
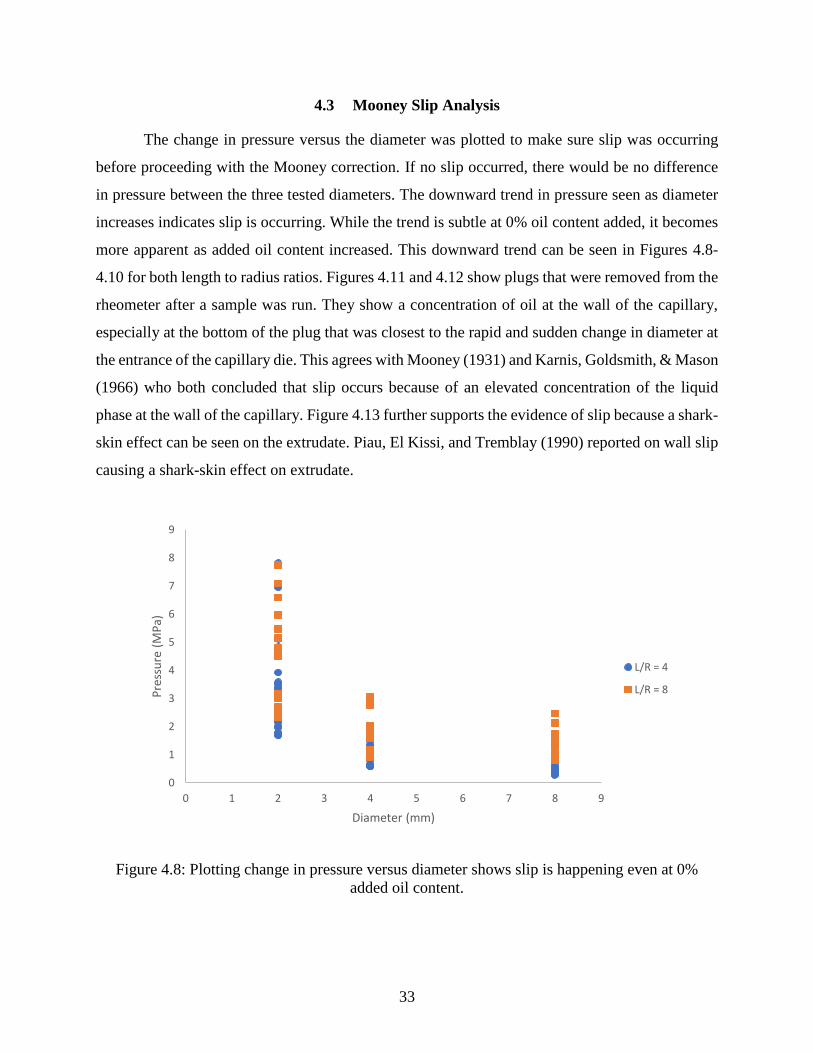
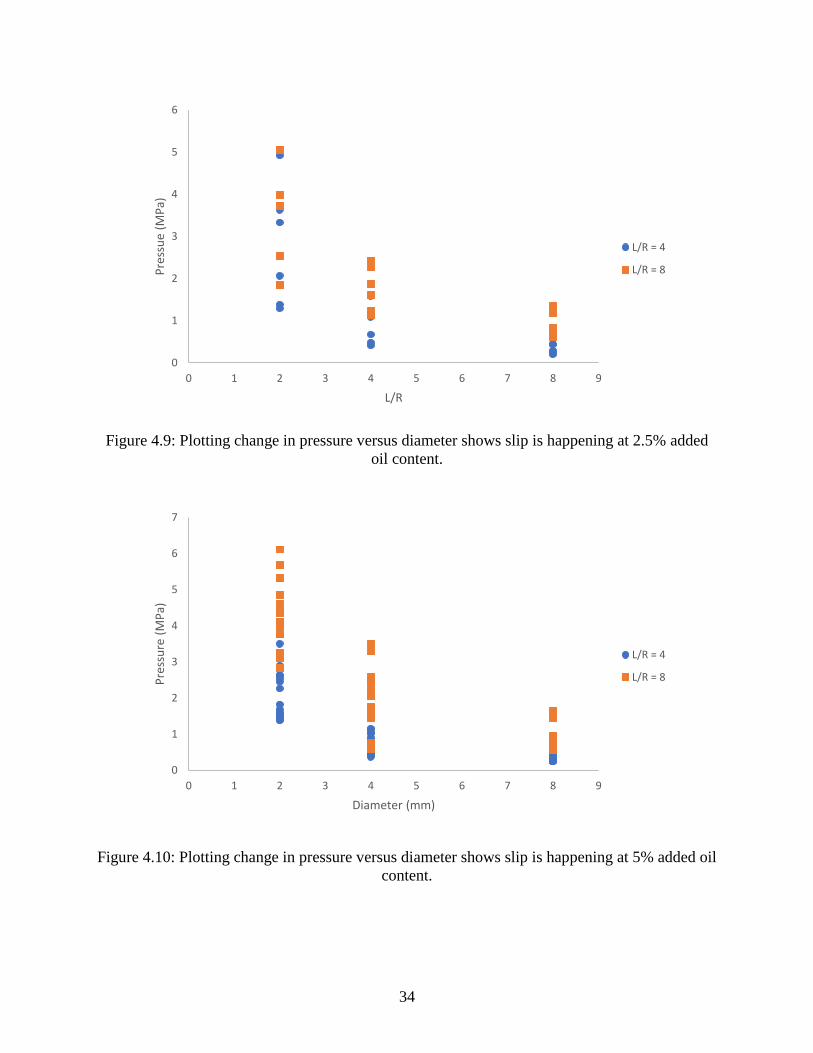
4.3 Mooney Slip Analysis
The change in pressure versus the diameter was plotted to make sure slip was occurring
before proceeding with the Mooney correction. If no slip occurred, there would be no difference
in pressure between the three tested diameters. The downward trend in pressure seen as diameter
increases indicates slip is occurring. While the trend is subtle at 0% oil content added, it becomes
more apparent as added oil content increased. This downward trend can be seen in Figures 4.8-
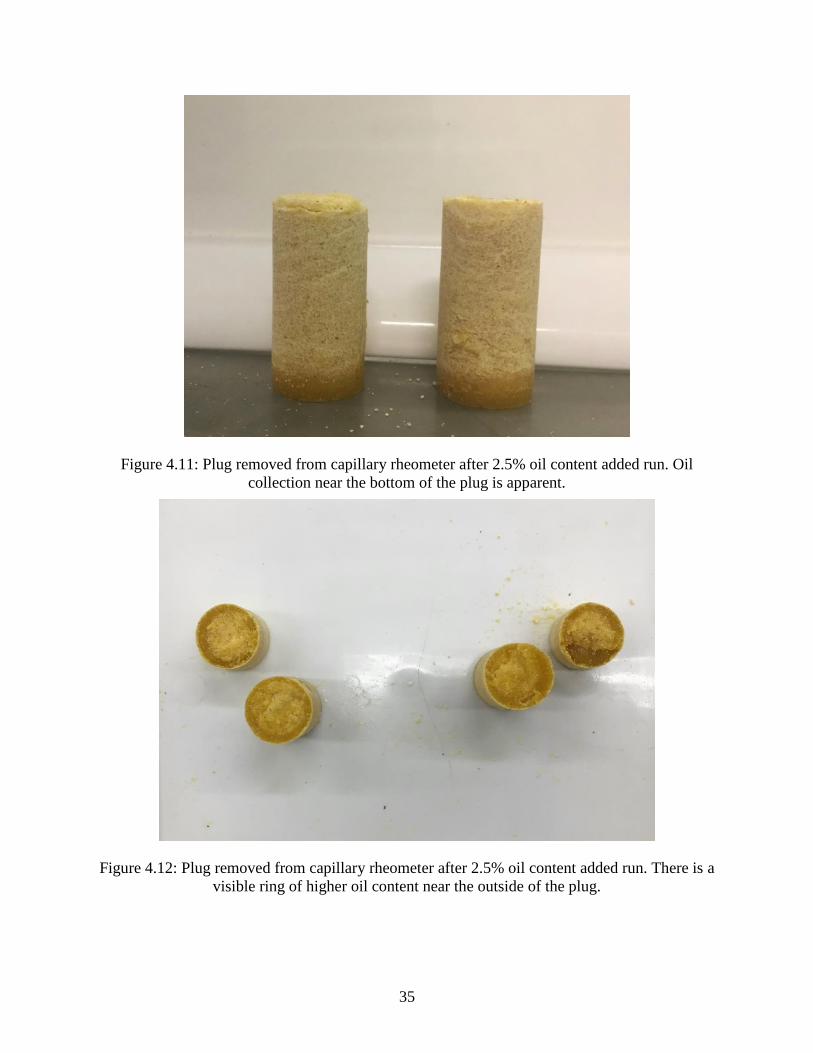
4.10 for both length to radius ratios. Figures 4.11 and 4.12 show plugs that were removed from the
rheometer after a sample was run. They show a concentration of oil at the wall of the capillary,
especially at the bottom of the plug that was closest to the rapid and sudden change in diameter at
the entrance of the capillary die. This agrees with Mooney (1931) and Karnis, Goldsmith, & Mason
(1966) who both concluded that slip occurs because of an elevated concentration of the liquid
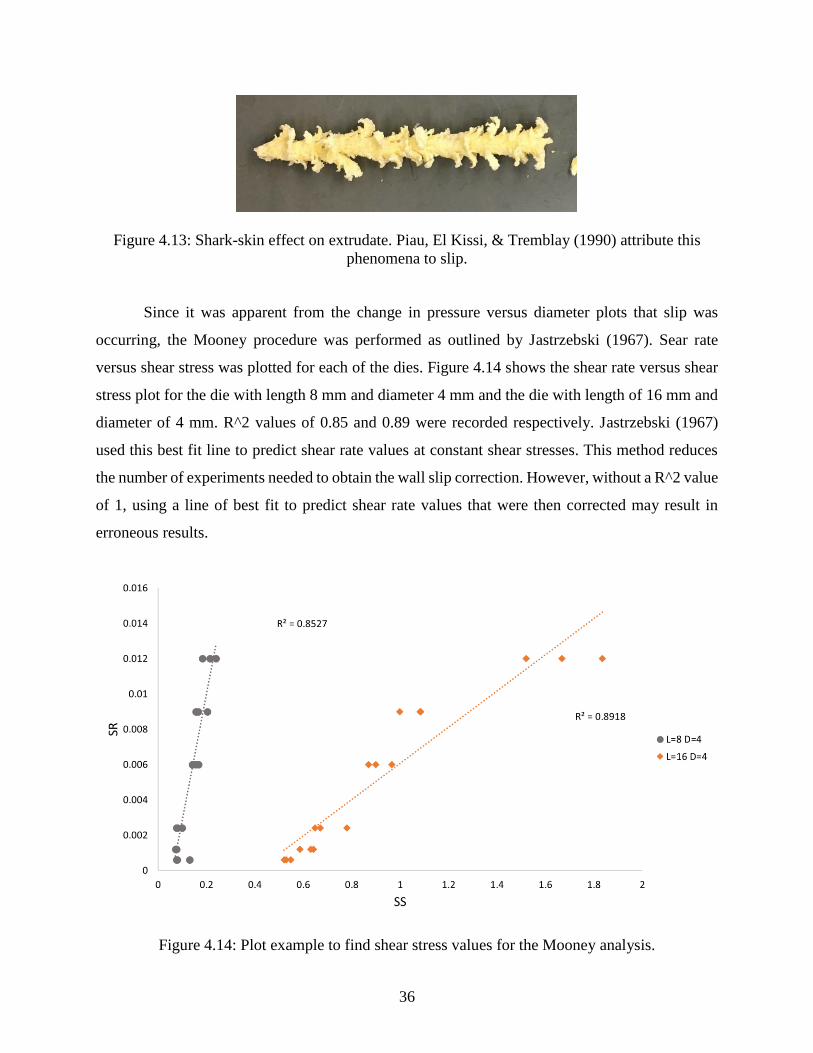
phase at the wall of the capillary. Figure 4.13 further supports the evidence of slip because a shark-
skin effect can be seen on the extrudate. Piau, El Kissi, and Tremblay (1990) reported on wall slip
causing a shark-skin effect on extrudate.
Figure 4.8: Plotting change in pressure versus diameter shows slip is happening even at 0%
added oil content.
0
1
2
3
4
5
6
7
8
9
0 1 2 3 4 5 6 7 8 9
Pre
ssu
re (
MP
a)
Diameter (mm)
L/R = 4
L/R = 8
34
Figure 4.9: Plotting change in pressure versus diameter shows slip is happening at 2.5% added
oil content.
Figure 4.10: Plotting change in pressure versus diameter shows slip is happening at 5% added oil
content.
0
1
2
3
4
5
6
0 1 2 3 4 5 6 7 8 9
Pre
ssu
e (M
Pa)
L/R
L/R = 4
L/R = 8
0
1
2
3
4
5
6
7
0 1 2 3 4 5 6 7 8 9
Pre
ssu
re (
MP
a)
Diameter (mm)
L/R = 4
L/R = 8
35
Figure 4.11: Plug removed from capillary rheometer after 2.5% oil content added run. Oil
collection near the bottom of the plug is apparent.
Figure 4.12: Plug removed from capillary rheometer after 2.5% oil content added run. There is a
visible ring of higher oil content near the outside of the plug.
36
Figure 4.13: Shark-skin effect on extrudate. Piau, El Kissi, & Tremblay (1990) attribute this
phenomena to slip.
Since it was apparent from the change in pressure versus diameter plots that slip was
occurring, the Mooney procedure was performed as outlined by Jastrzebski (1967). Sear rate
versus shear stress was plotted for each of the dies. Figure 4.14 shows the shear rate versus shear
stress plot for the die with length 8 mm and diameter 4 mm and the die with length of 16 mm and
diameter of 4 mm. R^2 values of 0.85 and 0.89 were recorded respectively. Jastrzebski (1967)
used this best fit line to predict shear rate values at constant shear stresses. This method reduces
the number of experiments needed to obtain the wall slip correction. However, without a R^2 value
of 1, using a line of best fit to predict shear rate values that were then corrected may result in
erroneous results.
Figure 4.14: Plot example to find shear stress values for the Mooney analysis.

37
Once lines of best fit were obtained for each die values of shear stress were chosen, and the lines
of best fit were used to calculate shear rate. The intercept of each line is the shear rate correction
for the specified die at the chosen shear stress. The slope of each line is 4 times the slip velocity at
the given conditions. Data for dies with a 2mm diameter was left out of the Mooney calculation
for 5% oil added samples. The line of best fit for shear rate versus shear stress gave a negative
slope. Meaning shear rate decreased as shear stress increased. When pressure increases the amount
of flow should also increase, they should not have an inverse relationship for this material. This
issue may have been caused by problems with the shortest 2mm die. Product would get caught in
narrow exit region causing the die to behave like a 6mm die that had a 2mm opening. Most likely
this occurred due to die swell.
Figure 4.15: Mooney plot for an added oil content of 5% and L/R=4. Shear stress is in Pa-s.
The Mooney correction for 0% and 2.5% oil added returned negative values for shear rate
correction. Similar issues were reported by Rides et al. (2007), Chaun and Zara (2014), and Lanteri
et al. (1996). Cornfield et al. (1999) reported that small inaccuracies in die measurements can have

38
a monumental impact on the Mooney correction. The roughness of the material can also impact
the slip velocity (Halliday & Smith, 1995). Both die dimensions and roughness of material could
have had an impact on the Mooney slip analysis. Not all of the dies used were cut with precision
machinery and some were made out of different types of metal.
Figure 4.16: Mooney plot for an added oil content of 0%. Shear stress is in Pa-s.
4.4 Empirical Model
Since the ratio of water to corn meal was held constant, differences in the viscosity can be
attributed to oil content. Yanniotis, Skaltsi, & Karaburnioti (2006) used an Arrhenius type equation
to predict the viscosity of honey at different temperatures. A similar approach was taken to predict
viscosity from oil content using an empirical model. After both the Bagley and Mooney corrections
were performed, apparent viscosity was calculated by Equation 4.1 where 𝜂𝑎𝑝𝑝 is apparent
viscosity in MPa·s, �̇� is shear rate in s-1, and 𝜏 in shear stress in MPa.
𝜂𝑎𝑝𝑝 =�̇�
𝜏 (Equation 4.1)
The apparent viscosities at each oil content were averaged. Data points from failed
Mooney corrections were excluded because of the resulting negative viscosities. Potential
reasons for failed Mooney corrections were discussed in previous sections.
39
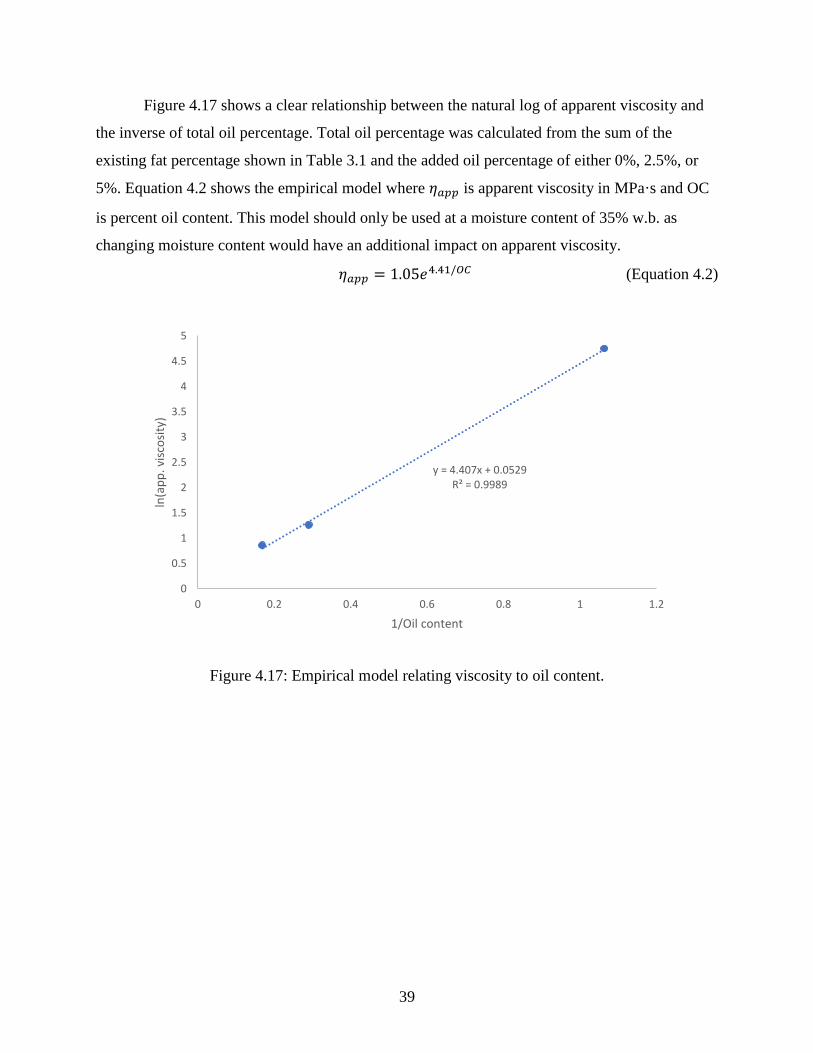
Figure 4.17 shows a clear relationship between the natural log of apparent viscosity and
the inverse of total oil percentage. Total oil percentage was calculated from the sum of the
existing fat percentage shown in Table 3.1 and the added oil percentage of either 0%, 2.5%, or
5%. Equation 4.2 shows the empirical model where 𝜂𝑎𝑝𝑝 is apparent viscosity in MPa·s and OC
is percent oil content. This model should only be used at a moisture content of 35% w.b. as
changing moisture content would have an additional impact on apparent viscosity.
𝜂𝑎𝑝𝑝 = 1.05𝑒4.41/𝑂𝐶 (Equation 4.2)
Figure 4.17: Empirical model relating viscosity to oil content.
y = 4.407x + 0.0529R² = 0.9989
0
0.5
1
1.5
2
2.5
3
3.5
4
4.5
5
0 0.2 0.4 0.6 0.8 1 1.2
ln(a
pp
. vis
cosi
ty)
1/Oil content
40
CONCLUSION
5.1 Conclusion
Overall, the Mooney slip analysis was successful for the sample with 5% oil added. Figure
4.15 provides the shear rate correction for dies with a length to diameter ratio of 4. Slip velocity
increased with increasing shear stress. At the lower oil contents of 0% and 2.5% oil added the
Mooney slip analysis produced negative shear rates. Obtaining negative shear rates from the
Mooney slip correction is a common issue with more complex fluids. These issues stem from the
assumptions made over the development of the Mooney method. There is still confidence that the
Mooney method is mathematically sound. However, a full understanding of the product being
extruded is needed in order to ensure assumptions are met. Small errors in measurements have a
large impact on the outcome of the Mooney method and it is therefore necessary to use precision
equipment for die measurement. Accurate pressure transducers and flow measurements are also
necessary. Despite obtaining negative shear rates for 0% and 2.5% added oil content, an empirical
model was developed to predict apparent viscosity of the mixture as a function of total oil content.
The developed model should only be used at 35% w.b. moisture because a change in moisture
would have an impact on apparent viscosity.
5.2 Future Work
• Have the die with a 2mm diameter and 0.25 mm length reworked to prevent sample
expansion from causing error in results.
• Determine the time and temperature effect of sample spending a lengthy time in the
reservoir during experimentation.
• Determine if lipid-amylose complexes are forming and changing the material the material
in the reservoir and during extrusion.

41
REFERNCES
Rodríguez-González, F., Pérez-González, J., Marín-Santibáñez, B. M., & de Vargas, L. (2009).
Kinematics of the stickoslip capillary flow of high-density polyethylene. Chemical
Engineering Science, 4675-4683.
Bagley, E. B. (1957). End corrections in the capillary flow of polyethylene. Journal of Applied
Physics, 624-627.
Benbow, J. J., & Lamb, P. (1963). New Aspects of Melt Fracture. Polymer Engineering and
Science.
Berk, Z. (2012). Food Process Engineering and Technology.
Campanella, O. H., Li, P. X., Ross, K. A., & Okos, M. M. (2002). The Role of Rheology in
Extrusion. In Engineering and Food in the 21st Century (pp. 393-413).
Chuan, Y., & Zara, L. (2014). A study of wall slip in the capillary flow of a filled rubber compound.
Polymer Testing, 45-50.
Cornfield, G. M., Adams, M. J., Briscoe, B. J., Fryer, P., & Lawrence, C. J. (1999). A critical
examination of capillary rheometry for foods. IChemE.
Denn, M. M. (2001). Extrusion instabilities and wall slip. Annual Review Fluid Mechanics, 265-
287.
Gibbs, S. J., James, K. L., Hall, L. D., Haycock, D. E., Frith, W. J., & Ablett, S. (1996). Rheometry
and detection of apparent wall slip for Poiseuille flow of polymer solutions and particulate
dispersions be nuclear magnetic resonance valecimetry. Journal of Rheology.
Guy, R. (2001). Introduction. In Extrusion Cooking (pp. 1-2). Woodhead Publishing.
Halliday, P. J., & Smith, A. C. (1995). Estimation of the wall slip velocity in the capillary flow of
potato granule paste. Journal of Rheology.
Hatzikiriakos, S. G., & Dealy, J. M. (1991). Wall slip of molten high density polyethylene. I.
sliding plate rheometer studies. Journal of Rheology, 497-523.
Hatzikiriakos, S. G., & Dealy, J. M. (1992). Wall slip of molten high density polyethylenes II.
Capillary rheometer studies. Journal of Rheology, 703-741.

42
Hauersperger, D., Tonner, T., & Okos, M. (2017). Analysis of the Flow Behaviors of Corn Meal
during Extrusion. The Summer Undergraduate Research Fellowship (SURF) Symposium,
(p. Paper 131). West Lafayette. Retrieved from The Summer Undergraduate Research
Fellowship (SURF) Symposium.
Jana, S. C., Kapoor, B., & Acrivos, A. (1995). Apparent wall slip velocity coefficients in
concentrated suspensions of noncollidal properties. Journal of Rheology, 1123-1132.
Jastrzebski, Z. D. (1967). Entrance effects and wall effects in an extrusion rheometer during the
flow of concentrated suspensions. I&EC Fundamentals, 445-454.
Kalika, D. S., & Denn, M. M. (1987). Wall slip and extrudate distortion in linear low density
polyethylene. Journal of Rheology.
Karnis, A., Goldsmith, H. L., & Mason, S. G. (1966). THe flow of suspensions through tubes. THe
Cancadina Journal of CHemical Engineering, 181-193.
Kazemzadeh, M. (2012). Introduction to Extrusion Technology. In Advances in Food Extrusion
Technology (pp. 1-22).
Kokini, J. L., & Dervisoglu, M. (1990). Wall effects in the laminar pipe flow of four semi-solid
foods. Journal of Food Engineering, 29-42.
Lanteri, B., Burlet, H., Poitou, A., & Campion, I. (1996). Rheological behavior of a polymer-
ceramic b lendused for injection moulding. Journal of Materials Science, 1751-1760.
Levine, L., & Miller, R. C. (2007). Extrusion Processes. In Handbook of Food Engineering (pp.
799-846). Taylor and Francis Group.
Malvern Panalytical. (2019). Rosand RH2000.
Mooney, M. (1931). Explicit formulas in slip and fluidity. Journal of Rheology, 210-222.
Morrison, F. A. (2001). Understanding Rheology. New York: Oxford University Press.
Penner, A. L. (2008). An evaluation of extrusion parameters and application to the scaling of
extruders. ProQuest Thesis and Dissertations.
Piau, J. M., El Kissi, N., & Tremblay, B. (1990). Influence of upstream instabilities and wall slip
on melt fracture and sharskin phenomena during silicones extrusion through orifice dies.
Journal of non-Newtonian Fluid Mechanics, 145-180.
Ponrajan, A. (2015). Investigating rheological techniques to model and predict operating
conditions of a single screw extruder with internal restrictions. ProQuest Thesis and
Dissertations.
43
Pudjijanto, S., & Denn, M. M. (1994). A stable island in the slip-stick region of linear low-density
polyethylene. Journal of Rheology, 1735-1744.
Rabinowitsch. (1929). About the viscosity and elasticity of sols. Physical Chemistry.
Ren, Z., Huang, X., & Liu, H. (2016). Wall slip velocity measurement of molten polypropylene in
capillary flow based on length corrected mooney technique. Journal of Applied Polymer
Science.
Rides, M., Allen , C., Flemming, D., Haworth, B., & Kelly, A. (2007). Intercomparison of slip
flow velocity measurements of filled polymers by capillary extrusion rheometry. Polymer
Testing, 308-320.
Tonner, T. (2018). Understanding the effect of extrusion conditions on melt viscosity to aid in
modeling of a single screw extruder when internal restrictions for scale-up purposes.
ProQuest Thesis and Dissertations.
Yanniotis, S., Skaltsi, S., & Karaburnioti, S. (2006). Effect of moisture content on the viscosity of
honey at different temperatures. Journal of Food Engineering, 327-377.

44
APPENDIX A
Data for 0% oil content added
Run # Bagley
Correction Speed
mm/min Length
mm Diameter
mm L/R dP
average Corrected
dP
1 0.238254 5 0.25 8 0.0625 0.364114 0.12586
2 0.238254 5 0.25 8 0.0625 0.345957 0.107703
3 0.238254 5 0.25 8 0.0625 0.323102 0.084848
1 0.203592 10 0.25 8 0.0625 0.287873 0.084281
2 0.203592 10 0.25 8 0.0625 0.277152 0.07356
3 0.203592 10 0.25 8 0.0625 0.293747 0.090156
1 0.258334 20 0.25 8 0.0625 0.306948 0.048614
2 0.258334 20 0.25 8 0.0625 0.355696 0.097362
3 0.258334 20 0.25 8 0.0625 0.401485 0.143151
1 0.390365 50 0.25 8 0.0625 0.599689 0.209324
2 0.390365 50 0.25 8 0.0625 0.529316 0.138951
3 0.390365 50 0.25 8 0.0625 0.462087 0.071721
1 0.459783 75 0.25 8 0.0625 0.729263 0.26948
2 0.459783 75 0.25 8 0.0625 0.673875 0.214092
3 0.459783 75 0.25 8 0.0625 0.554601 0.094818
1 0.71526 100 0.25 8 0.0625 0.672961 -0.0423
2 0.71526 100 0.25 8 0.0625 0.804231 0.08897
3 0.71526 100 0.25 8 0.0625 0.82305 0.10779
1 0.403354 5 0.25 4 0.125 0.332657 -0.0707
2 0.403354 5 0.25 4 0.125 0.424653 0.0213
3 0.403354 5 0.25 4 0.125 0.36466 -0.03869
1 0.314578 10 0.25 4 0.125 0.330277 0.015699
2 0.314578 10 0.25 4 0.125 0.344525 0.029947
3 0.314578 10 0.25 4 0.125 0.335766 0.021188
1 0.409962 20 0.25 4 0.125 0.439713 0.029751
2 0.409962 20 0.25 4 0.125 0.456636 0.046674
3 0.409962 20 0.25 4 0.125 0.459218 0.049256
1 0.723424 50 0.25 4 0.125 0.739486 0.016061
2 0.723424 50 0.25 4 0.125 0.869444 0.14602
3 0.723424 50 0.25 4 0.125 0.541056 -0.18237
1 0.954563 75 0.25 4 0.125 1.059475 0.104912
2 0.954563 75 0.25 4 0.125 1.028675 0.074112
3 0.954563 75 0.25 4 0.125 0.924675 -0.02989
1 1.236578 100 0.25 4 0.125 1.951592 0.715013
2 1.236578 100 0.25 4 0.125 1.00824 -0.22834
3 1.236578 100 0.25 4 0.125 1.2818 0.045222
1 0.981969 5 0.25 2 0.25 0.720255 -0.26171
2 0.981969 5 0.25 2 0.25 1.171825 0.189856
3 0.981969 5 0.25 2 0.25 1.130486 0.148517
1 1.240846 10 0.25 2 0.25 1.216379 -0.02447
2 1.240846 10 0.25 2 0.25 1.215619 -0.02523
3 1.240846 10 0.25 2 0.25 1.2559 0.015054
1 1.59266 20 0.25 2 0.25 1.5962 0.00354
2 1.59266 20 0.25 2 0.25 1.832233 0.239573

45
3 1.59266 20 0.25 2 0.25 1.411928 -0.18073
1 2.778175 50 0.25 2 0.25 3.057649 0.279475
2 2.778175 50 0.25 2 0.25 2.826111 0.047936
3 2.778175 50 0.25 2 0.25 2.841818 0.063643
1 3.625396 75 0.25 2 0.25 3.071075 -0.55432
2 3.625396 75 0.25 2 0.25 5.294557 1.669161
3 3.625396 75 0.25 2 0.25 3.448258 -0.17714
1 4.387154 100 0.25 2 0.25 4.544925 0.157771
2 4.387154 100 0.25 2 0.25 4.003969 -0.38318
3 4.387154 100 0.25 2 0.25 3.942675 -0.44448
1 0.238254 5 16 8 4 0.291981 0.053727
2 0.238254 5 16 8 4 0.293533 0.055279
3 0.238254 5 16 8 4 0.298675 0.060421
1 0.203592 10 16 8 4 0.282891 0.079299
2 0.203592 10 16 8 4 0.349613 0.146021
3 0.203592 10 16 8 4 0.306199 0.102607
1 0.258334 20 16 8 4 0.31163 0.053296
2 0.258334 20 16 8 4 0.360693 0.102359
3 0.258334 20 16 8 4 0.370916 0.112583
1 0.403354 5 8 4 4 1.047162 0.643808
2 0.403354 5 8 4 4 0.610618 0.207265
3 0.403354 5 8 4 4 0.632309 0.228955
1 0.390365 50 16 8 4 0.579263 0.188898
2 0.390365 50 16 8 4 0.503734 0.113368
3 0.390365 50 16 8 4 0.54459 0.154225
4 0.390365 50 16 8 4 0.483561 0.093196
1 0.459783 75 16 8 4 0.701875 0.242092
2 0.459783 75 16 8 4 0.532468 0.072685
3 0.459783 75 16 8 4 0.484444 0.024661
1 0.314578 10 8 4 4 0.607274 0.292696
2 0.314578 10 8 4 4 0.57542 0.260842
3 0.314578 10 8 4 4 0.595776 0.281199
1 0.71526 100 16 8 4 0.936294 0.221034
2 0.71526 100 16 8 4 1.494092 0.778831
3 0.71526 100 16 8 4 1.317475 0.602215
1 0.409962 20 8 4 4 0.638369 0.228407
2 0.409962 20 8 4 4 0.798001 0.388039
3 0.409962 20 8 4 4 0.610844 0.200882
1 0.981969 5 4 2 4 1.685535 0.703565
2 0.981969 5 4 2 4 1.71134 0.72937
3 0.981969 5 4 2 4 1.779285 0.797315
1 0.723424 50 8 4 4 1.331119 0.607695
2 0.723424 50 8 4 4 1.12408 0.400656
3 0.723424 50 8 4 4 1.238675 0.515251
1 0.954563 75 8 4 4 1.322521 0.367959
2 0.954563 75 8 4 4 1.630758 0.676196
3 0.954563 75 8 4 4 1.244327 0.289765
1 1.240846 10 4 2 4 1.97159 0.730744
2 1.240846 10 4 2 4 2.146518 0.905672
3 1.240846 10 4 2 4 1.988432 0.747586
1 1.236578 100 8 4 4 1.910342 0.673763
2 1.236578 100 8 4 4 1.470342 0.233763

46
3 1.236578 100 8 4 4 1.711028 0.47445
1 1.59266 20 4 2 4 2.224107 0.631447
2 1.59266 20 4 2 4 2.448485 0.855824
3 1.59266 20 4 2 4 2.53575 0.94309
1 2.778175 50 4 2 4 3.575342 0.797167
2 2.778175 50 4 2 4 3.334848 0.556673
3 2.778175 50 4 2 4 3.914704 1.13653
4 2.778175 50 4 2 4 3.385104 0.606929
1 3.625396 75 4 2 4 5.118675 1.493279
2 3.625396 75 4 2 4 3.50044 -0.12496
3 3.625396 75 4 2 4 3.219075 -0.12496
1 4.387154 100 4 2 4 4.817675 0.430521
2 4.387154 100 4 2 4 7.813119 3.425966
3 4.387154 100 4 2 4 6.958675 2.571521
1 0.238254 5 32 8 8 0.817759 0.579505
2 0.238254 5 32 8 8 0.925183 0.686929
3 0.238254 5 32 8 8 0.827652 0.589398
1 0.203592 10 32 8 8 0.794249 0.590657
2 0.203592 10 32 8 8 0.817008 0.613416
3 0.203592 10 32 8 8 0.822177 0.618585
1 0.258334 20 32 8 8 0.830926 0.572592
2 0.258334 20 32 8 8 0.935756 0.677422
3 0.258334 20 32 8 8 0.913675 0.655341
1 0.403354 5 16 4 8 0.931649 0.528295
2 0.403354 5 16 4 8 0.92359 0.520236
3 0.403354 5 16 4 8 0.95174 0.548386
1 0.390365 50 32 8 8 1.259389 0.869024
2 0.390365 50 32 8 8 1.340726 0.950361
3 0.390365 50 32 8 8 0.996349 0.605984
1 0.459783 75 32 8 8 1.728305 1.268521
2 0.459783 75 32 8 8 1.602961 1.143177
3 0.459783 75 32 8 8 1.480156 1.020373
1 0.314578 10 16 4 8 0.899907 0.585329
2 0.314578 10 16 4 8 0.945564 0.630986
3 0.314578 10 16 4 8 0.956075 0.641497
1 0.71526 100 32 8 8 2.46677 1.75151
2 0.71526 100 32 8 8 1.375175 0.659915
3 0.71526 100 32 8 8 2.129786 1.414526
1 0.409962 20 16 4 8 1.07984 0.669878
2 0.409962 20 16 4 8 1.188953 0.778991
3 0.409962 20 16 4 8 1.058585 0.648623
1 0.981969 5 8 2 8 2.324547 1.342578
2 0.981969 5 8 2 8 2.470263 1.488294
3 0.981969 5 8 2 8 2.342309 1.36034
1 0.723424 50 16 4 8 1.592961 0.869536
2 0.723424 50 16 4 8 1.622265 0.89884
3 0.723424 50 16 4 8 1.688425 0.965001
1 0.954563 75 16 4 8 2.039475 1.084912
2 0.954563 75 16 4 8 2.036675 1.082112
3 0.954563 75 16 4 8 1.952008 0.997446
1 1.240846 10 8 2 8 2.461846 1.221
2 1.240846 10 8 2 8 2.553119 1.312273
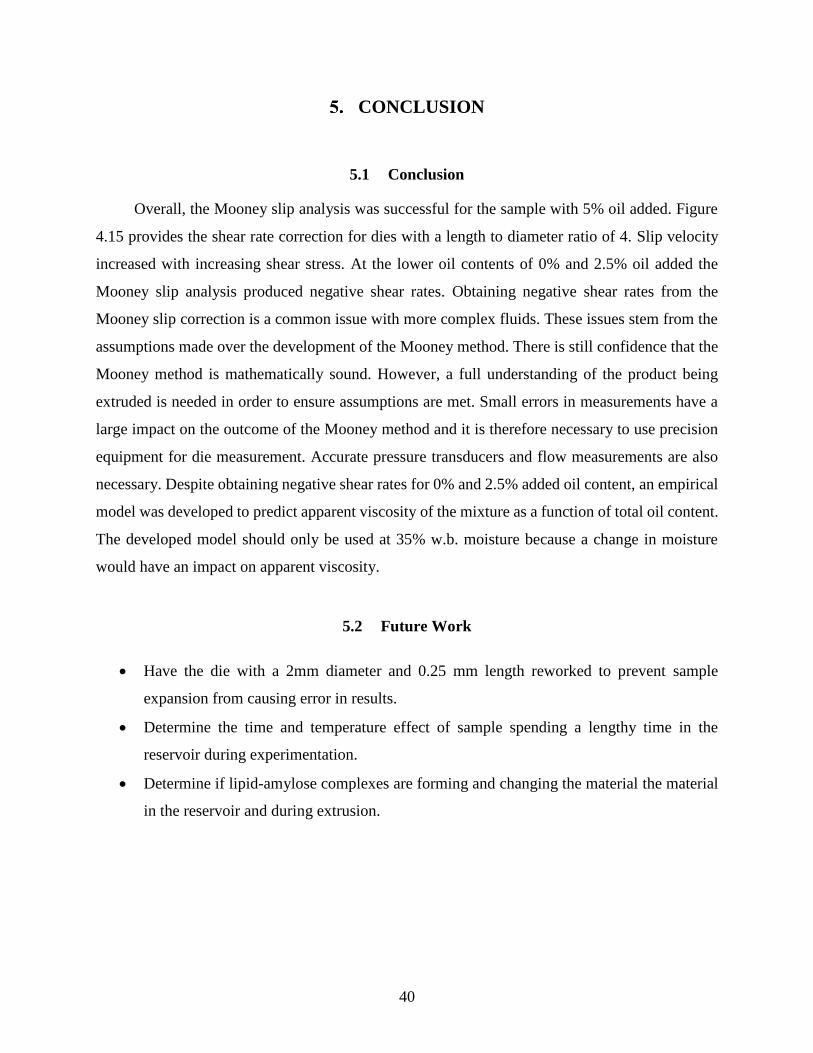
47
3 1.240846 10 8 2 8 2.687269 1.446423
1 1.236578 100 16 4 8 2.904444 1.667866
2 1.236578 100 16 4 8 2.756936 1.520358
3 1.236578 100 16 4 8 3.071075 1.834497
1 1.59266 20 8 2 8 3.080967 1.488307
2 1.59266 20 8 2 8 3.168378 1.575718
3 1.59266 20 8 2 8 3.00509 1.41243
1 2.778175 50 8 2 8 4.537766 1.759591
2 2.778175 50 8 2 8 4.505992 1.727817
3 2.778175 50 8 2 8 4.803087 2.024912
1 3.625396 75 8 2 8 5.969475 2.344079
2 3.625396 75 8 2 8 5.136402 1.511006
3 3.625396 75 8 2 8 5.461475 1.836079
1 4.387154 100 8 2 8 7.082961 2.695807
2 4.387154 100 8 2 8 6.583119 2.195966
3 4.387154 100 8 2 8 7.751175 3.364021
48
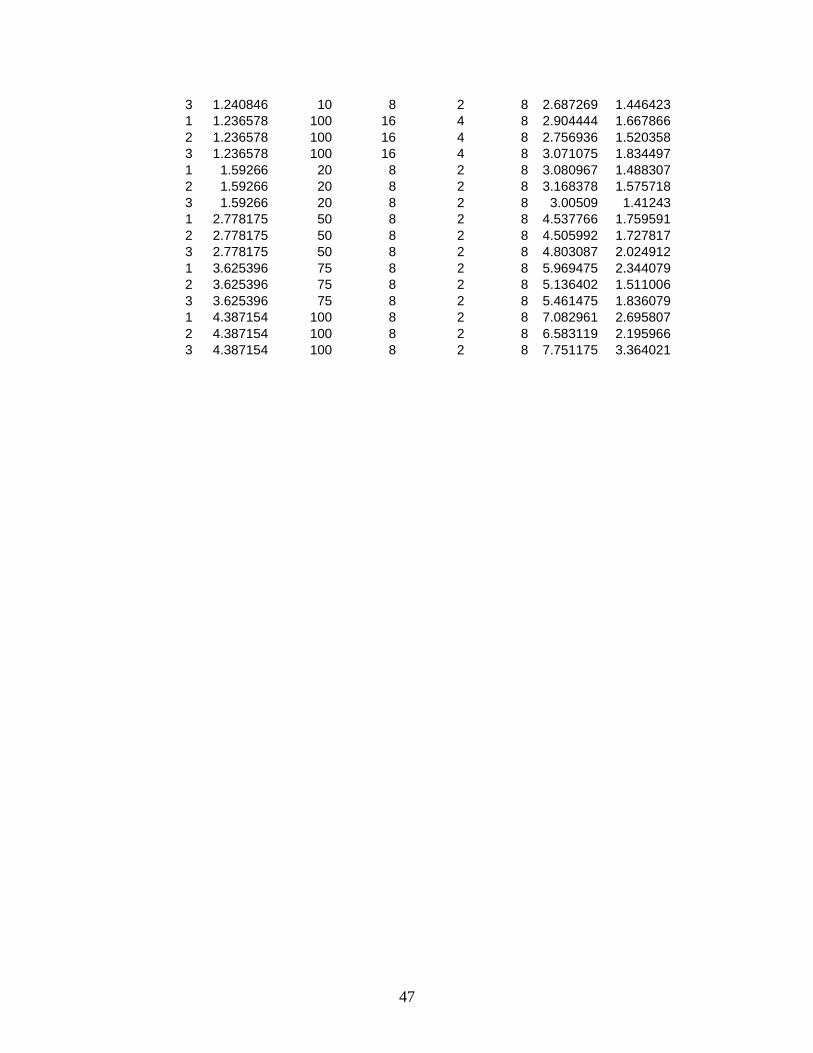
APPENDIX B
Data for 2.5% oil content added
Run # Bagley Correction
Speed mm/min
Length mm
Diameter mm L/R
dP average
Corrected dP
1 0.050386 5 0.25 8 0.0625 0.105373 0.054987
1 -0.01781 10 0.25 8 0.0625 0.026441 0.044249
1 0.005701 20 0.25 8 0.0625 0.062611 0.05691
1 #NUM! 50 0.25 8 0.0625 0.237246 #NUM!
1 0.169523 75 0.25 8 0.0625 0.266094 0.096571
1 0.236453 100 0.25 8 0.0625 0.288175 0.051722
1 0.163054 5 0.25 4 0.125 0.246989 0.083935
1 0.10446 10 0.25 4 0.125 0.221428 0.116968
1 0.25012 20 0.25 4 0.125 0.372983 0.122863
1 0.575242 50 0.25 4 0.125 0.625614 0.050372
1 0.56815 75 0.25 4 0.125 0.727342 0.159192
1 0.842647 100 0.25 4 0.125 0.886402 0.043755
1 0.85514 5 0.25 2 0.25 0.874557 0.019418
1 1.682673 10 0.25 2 0.25 1.872258 0.189584
1 1.426056 20 0.25 2 0.25 1.426598 0.000542
1 4.003959 50 0.25 2 0.25 4.088448 0.084488
1 3.865801 75 0.25 2 0.25 4.107296 0.241494
1 5.64348 100 0.25 2 0.25 5.417499 -0.22598
2 5.64348 100 0.25 2 0.25 6.000414 0.356934
1 0.050386 5 16 8 4 0.242623 0.192237
1 -0.01781 10 16 8 4 0.204112 0.221921
1 0.005701 20 16 8 4 0.288132 0.282431
1 0.163054 5 8 4 4 0.482589 0.319535
1 #NUM! 50 16 8 4 0.447611 #NUM!
1 0.169523 75 16 8 4 0.44805 0.278527
1 0.10446 10 8 4 4 0.415456 0.310996
1 0.236453 100 16 8 4 0.685598 0.449145
1 0.25012 20 8 4 4 0.675264 0.425145
1 0.85514 5 4 2 4 1.383215 0.528075
1 0.575242 50 8 4 4 1.152008 0.576766
1 0.56815 75 8 4 4 1.092961 0.524811
1 1.682673 10 4 2 4 1.299725 -0.38295
1 0.842647 100 8 4 4 1.590342 0.747694
1 1.426056 20 4 2 4 2.0618 0.635744
1 4.003959 50 4 2 4 3.633065 -0.37089
1 3.865801 75 4 2 4 3.333503 -0.5323
1 5.64348 100 4 2 4 4.921616 -0.72186
1 0.050386 5 32 8 8 0.684598 0.634212
1 -0.01781 10 32 8 8 0.621954 0.639762
1 0.005701 20 32 8 8 0.822769 0.817069
1 0.163054 5 16 4 8 1.143911 0.980857
1 #NUM! 50 32 8 8 1.214327 #NUM!
1 0.169523 75 32 8 8 1.169613 1.000089
1 0.10446 10 16 4 8 1.222145 1.117685
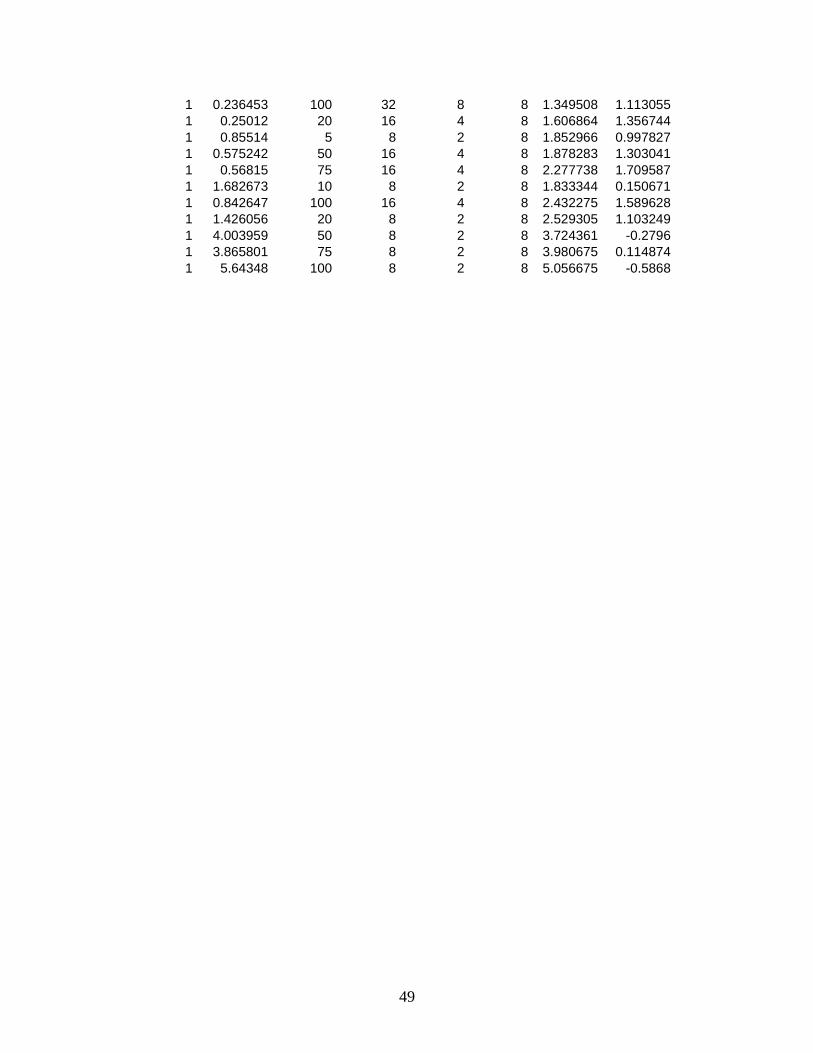
49
1 0.236453 100 32 8 8 1.349508 1.113055
1 0.25012 20 16 4 8 1.606864 1.356744
1 0.85514 5 8 2 8 1.852966 0.997827
1 0.575242 50 16 4 8 1.878283 1.303041
1 0.56815 75 16 4 8 2.277738 1.709587
1 1.682673 10 8 2 8 1.833344 0.150671
1 0.842647 100 16 4 8 2.432275 1.589628
1 1.426056 20 8 2 8 2.529305 1.103249
1 4.003959 50 8 2 8 3.724361 -0.2796
1 3.865801 75 8 2 8 3.980675 0.114874
1 5.64348 100 8 2 8 5.056675 -0.5868

50
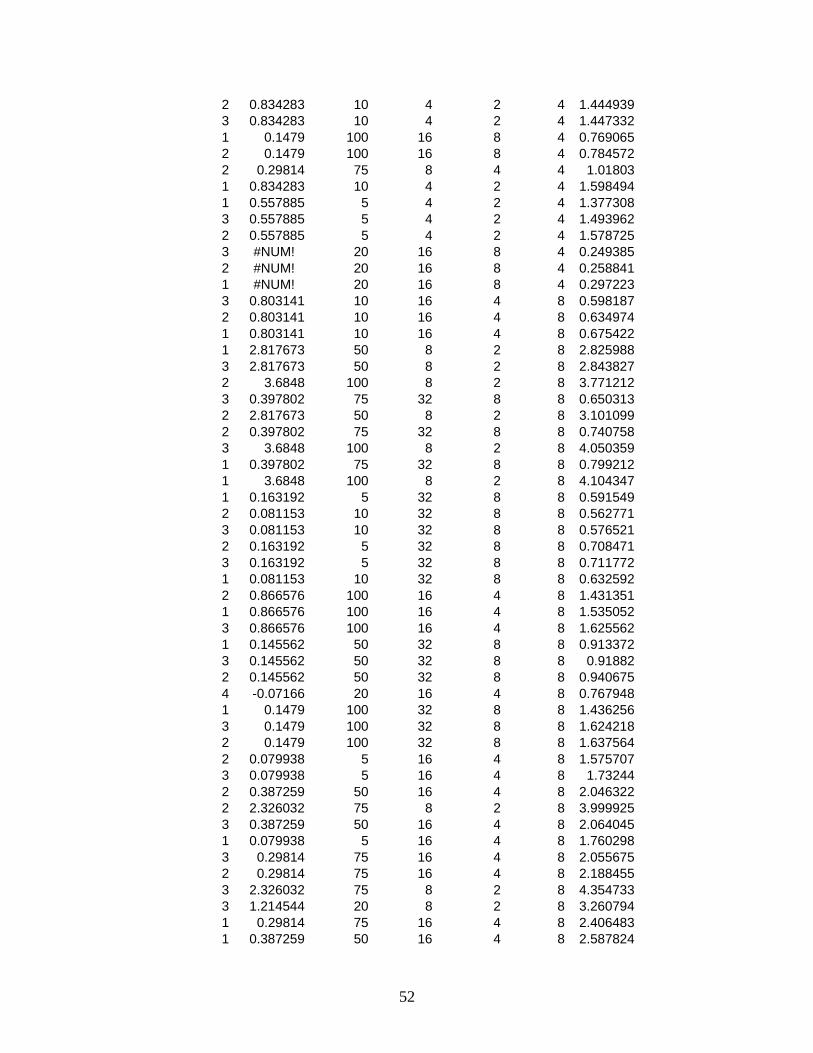
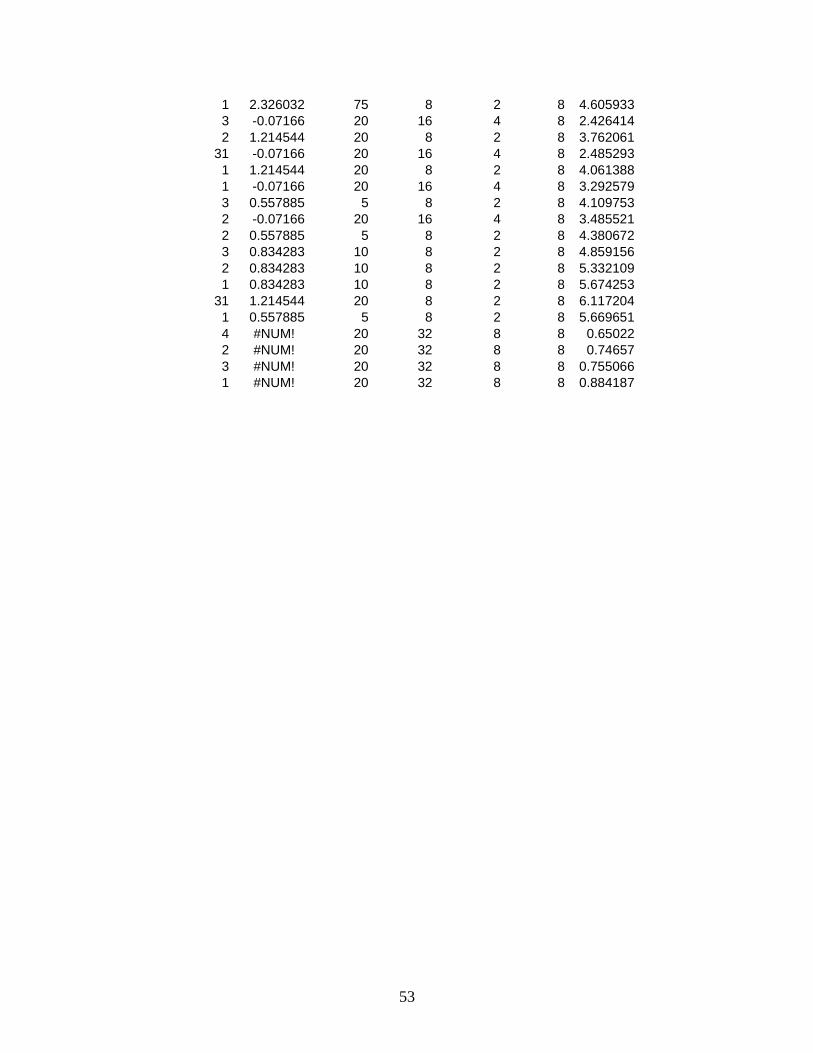
APPENDIX C
Data for 5% oil content added
Run # Bagley Correction
Speed mm/min
Length mm
Diameter mm L/R
dP average
1 0.397802 75 0.25 8 0.0625 0.314845
3 0.081153 10 0.25 8 0.0625 0.069842
1 0.081153 10 0.25 8 0.0625 0.072113
2 0.081153 10 0.25 8 0.0625 0.082503
3 0.163192 5 0.25 8 0.0625 0.181254
2 0.163192 5 0.25 8 0.0625 0.191349
3 0.1479 100 0.25 8 0.0625 0.178104
1 0.145562 50 0.25 8 0.0625 0.185093
3 0.397802 75 0.25 8 0.0625 0.444845
2 0.1479 100 0.25 8 0.0625 0.201496
2 0.397802 75 0.25 8 0.0625 0.451694
3 0.145562 50 0.25 8 0.0625 0.217649
2 0.145562 50 0.25 8 0.0625 0.220081
1 0.1479 100 0.25 8 0.0625 0.230342
1 0.163192 5 0.25 8 0.0625 0.334257
2 #NUM! 20 0.25 8 0.0625 0.18942
1 #NUM! 20 0.25 8 0.0625 0.259088
3 #NUM! 20 0.25 8 0.0625 #NUM!
3 0.866576 100 0.25 4 0.125 0.847053
3 0.803141 10 0.25 4 0.125 0.807938
3 0.387259 50 0.25 4 0.125 0.408137
2 0.866576 100 0.25 4 0.125 0.937906
1 0.866576 100 0.25 4 0.125 0.959508
2 0.803141 10 0.25 4 0.125 0.905779
1 0.29814 75 0.25 4 0.125 0.461554
3 0.29814 75 0.25 4 0.125 0.484185
1 0.079938 5 0.25 4 0.125 0.271169
1 0.803141 10 0.25 4 0.125 1.016464
2 0.079938 5 0.25 4 0.125 0.298825
3 0.079938 5 0.25 4 0.125 0.31984
2 0.29814 75 0.25 4 0.125 0.579613
3 -0.07166 20 0.25 4 0.125 0.249369
1 0.387259 50 0.25 4 0.125 0.721687
2 0.387259 50 0.25 4 0.125 0.723149
1 -0.07166 20 0.25 4 0.125 0.277721
2 -0.07166 20 0.25 4 0.125 0.322922
3 2.326032 75 0.25 2 0.25 1.018675
1 3.6848 100 0.25 2 0.25 3.696066
3 2.817673 50 0.25 2 0.25 2.923564
1 2.817673 50 0.25 2 0.25 2.940133
2 0.557885 5 0.25 2 0.25 0.779432
2 2.817673 50 0.25 2 0.25 3.10677
2 3.6848 100 0.25 2 0.25 4.050342
3 3.6848 100 0.25 2 0.25 4.081342
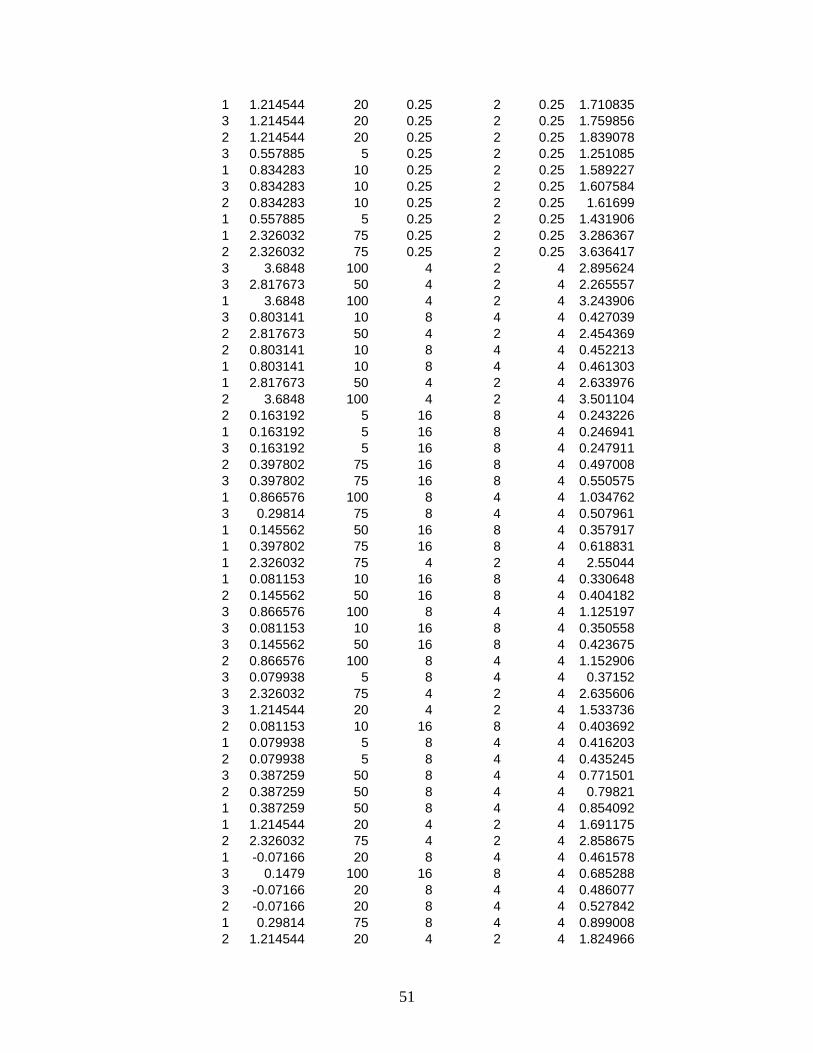
51
1 1.214544 20 0.25 2 0.25 1.710835
3 1.214544 20 0.25 2 0.25 1.759856
2 1.214544 20 0.25 2 0.25 1.839078
3 0.557885 5 0.25 2 0.25 1.251085
1 0.834283 10 0.25 2 0.25 1.589227
3 0.834283 10 0.25 2 0.25 1.607584
2 0.834283 10 0.25 2 0.25 1.61699
1 0.557885 5 0.25 2 0.25 1.431906
1 2.326032 75 0.25 2 0.25 3.286367
2 2.326032 75 0.25 2 0.25 3.636417
3 3.6848 100 4 2 4 2.895624
3 2.817673 50 4 2 4 2.265557
1 3.6848 100 4 2 4 3.243906
3 0.803141 10 8 4 4 0.427039
2 2.817673 50 4 2 4 2.454369
2 0.803141 10 8 4 4 0.452213
1 0.803141 10 8 4 4 0.461303
1 2.817673 50 4 2 4 2.633976
2 3.6848 100 4 2 4 3.501104
2 0.163192 5 16 8 4 0.243226
1 0.163192 5 16 8 4 0.246941
3 0.163192 5 16 8 4 0.247911
2 0.397802 75 16 8 4 0.497008
3 0.397802 75 16 8 4 0.550575
1 0.866576 100 8 4 4 1.034762
3 0.29814 75 8 4 4 0.507961
1 0.145562 50 16 8 4 0.357917
1 0.397802 75 16 8 4 0.618831
1 2.326032 75 4 2 4 2.55044
1 0.081153 10 16 8 4 0.330648
2 0.145562 50 16 8 4 0.404182
3 0.866576 100 8 4 4 1.125197
3 0.081153 10 16 8 4 0.350558
3 0.145562 50 16 8 4 0.423675
2 0.866576 100 8 4 4 1.152906
3 0.079938 5 8 4 4 0.37152
3 2.326032 75 4 2 4 2.635606
3 1.214544 20 4 2 4 1.533736
2 0.081153 10 16 8 4 0.403692
1 0.079938 5 8 4 4 0.416203
2 0.079938 5 8 4 4 0.435245
3 0.387259 50 8 4 4 0.771501
2 0.387259 50 8 4 4 0.79821
1 0.387259 50 8 4 4 0.854092
1 1.214544 20 4 2 4 1.691175
2 2.326032 75 4 2 4 2.858675
1 -0.07166 20 8 4 4 0.461578
3 0.1479 100 16 8 4 0.685288
3 -0.07166 20 8 4 4 0.486077
2 -0.07166 20 8 4 4 0.527842
1 0.29814 75 8 4 4 0.899008
2 1.214544 20 4 2 4 1.824966
52
2 0.834283 10 4 2 4 1.444939
3 0.834283 10 4 2 4 1.447332
1 0.1479 100 16 8 4 0.769065
2 0.1479 100 16 8 4 0.784572
2 0.29814 75 8 4 4 1.01803
1 0.834283 10 4 2 4 1.598494
1 0.557885 5 4 2 4 1.377308
3 0.557885 5 4 2 4 1.493962
2 0.557885 5 4 2 4 1.578725
3 #NUM! 20 16 8 4 0.249385
2 #NUM! 20 16 8 4 0.258841
1 #NUM! 20 16 8 4 0.297223
3 0.803141 10 16 4 8 0.598187
2 0.803141 10 16 4 8 0.634974
1 0.803141 10 16 4 8 0.675422
1 2.817673 50 8 2 8 2.825988
3 2.817673 50 8 2 8 2.843827
2 3.6848 100 8 2 8 3.771212
3 0.397802 75 32 8 8 0.650313
2 2.817673 50 8 2 8 3.101099
2 0.397802 75 32 8 8 0.740758
3 3.6848 100 8 2 8 4.050359
1 0.397802 75 32 8 8 0.799212
1 3.6848 100 8 2 8 4.104347
1 0.163192 5 32 8 8 0.591549
2 0.081153 10 32 8 8 0.562771
3 0.081153 10 32 8 8 0.576521
2 0.163192 5 32 8 8 0.708471
3 0.163192 5 32 8 8 0.711772
1 0.081153 10 32 8 8 0.632592
2 0.866576 100 16 4 8 1.431351
1 0.866576 100 16 4 8 1.535052
3 0.866576 100 16 4 8 1.625562
1 0.145562 50 32 8 8 0.913372
3 0.145562 50 32 8 8 0.91882
2 0.145562 50 32 8 8 0.940675
4 -0.07166 20 16 4 8 0.767948
1 0.1479 100 32 8 8 1.436256
3 0.1479 100 32 8 8 1.624218
2 0.1479 100 32 8 8 1.637564
2 0.079938 5 16 4 8 1.575707
3 0.079938 5 16 4 8 1.73244
2 0.387259 50 16 4 8 2.046322
2 2.326032 75 8 2 8 3.999925
3 0.387259 50 16 4 8 2.064045
1 0.079938 5 16 4 8 1.760298
3 0.29814 75 16 4 8 2.055675
2 0.29814 75 16 4 8 2.188455
3 2.326032 75 8 2 8 4.354733
3 1.214544 20 8 2 8 3.260794
1 0.29814 75 16 4 8 2.406483
1 0.387259 50 16 4 8 2.587824
53
1 2.326032 75 8 2 8 4.605933
3 -0.07166 20 16 4 8 2.426414
2 1.214544 20 8 2 8 3.762061
31 -0.07166 20 16 4 8 2.485293
1 1.214544 20 8 2 8 4.061388
1 -0.07166 20 16 4 8 3.292579
3 0.557885 5 8 2 8 4.109753
2 -0.07166 20 16 4 8 3.485521
2 0.557885 5 8 2 8 4.380672
3 0.834283 10 8 2 8 4.859156
2 0.834283 10 8 2 8 5.332109
1 0.834283 10 8 2 8 5.674253
31 1.214544 20 8 2 8 6.117204
1 0.557885 5 8 2 8 5.669651
4 #NUM! 20 32 8 8 0.65022
2 #NUM! 20 32 8 8 0.74657
3 #NUM! 20 32 8 8 0.755066
1 #NUM! 20 32 8 8 0.884187


![Analytical solutions for wall slip channel flows in porous ... EUROPEAN PHYSICAL JOURN… · Magneto-viscoelastic slip flow has been studied by Zheng et al. [39] with the fractional](https://img.pdfslide.net/doc/110x75/5f97b080e47761016913bd63/analytical-solutions-for-wall-slip-channel-flows-in-porous-european-physical.jpg)