Embed Size (px)
Citation preview
Strock, J.*, Brown, A.J., “Methods for Naval Ship Concept and Propulsion System Technology Exploration in a CGX Case Study”, Naval Engineers Journal, Vol. 120, No. 4, pp. 95-122, 2008. Winner of ASNE Jimmy Hamilton Award for best naval engineering paper in 2008.
LT Justin Strock and Dr. Alan Brown Methods for Naval Ship Concept and Propulsion Technology
Exploration in a CGX Case Study ABSTRACT
In response to the Fiscal Year 2006 National Defense Authorization Act, the US Navy conducted an Alternative Propulsion Study (APS) for surface combatants and amphibious warfare ships. The study looked at current and future propulsion technology and propulsion alternatives for three sizes of warships. In their analyses they developed 23 ship concepts, 7 of which were considered Medium Surface Combatants (MSCs). The report to Congress was based on cost analyses and operational effectiveness analyses of these variants. Their conclusions did not consider a true representative sample of feasible, non-dominated designs in the design space.
This paper revisits the APS for a fossil-fueled MSC. It applies automated design methods with a variety of design tools, including ASSET, a Simplified Ship Synthesis Model (SSSM), and Model Center to improve the APS approach. It examines a range of power and propulsion alternatives using operational profiles and requirements similar to the APS in a notional MSC (CGXBMD). The automated process and tools presented in this paper provide a rational and thorough method to search a design space for non-dominated concepts. These non-dominated concepts represent the best basis for assessing technologies over a range of possibilities considering effectiveness, cost and risk. This automated approach and new tools are evaluated in the context of a CGXBMD case study. A number of conclusions relative to APS propulsion technologies are made. Most support the APS results.
MOTIVATION & INTRODUCTION NAVSEA completed the Alternative Propulsion Study (APS) in March 2007 [1,2]. Methods for reducing fuel consumption and increasing fuel efficiency were assessed in small/medium surface combatants and amphibious warfare ships. The seven MSC ships studied included two nuclear-powered ships, two fossil-fueled mechanical drive ships and three fossil-fueled Integrated Power Systems (IPS) ships. In this paper we only consider an MSC powered by a fossil-fueled IPS. Our notional warship is designed to function as a Ballistic Missile Defense cruiser (CGXBMD).
To narrow the design space, the Navy made a few key assumptions prior to starting their investigations. Only two energy sources, diesel fuel marine (DFM) and nuclear power were considered. An assessment of other sources of energy (coal, wind and wave) was completed, but
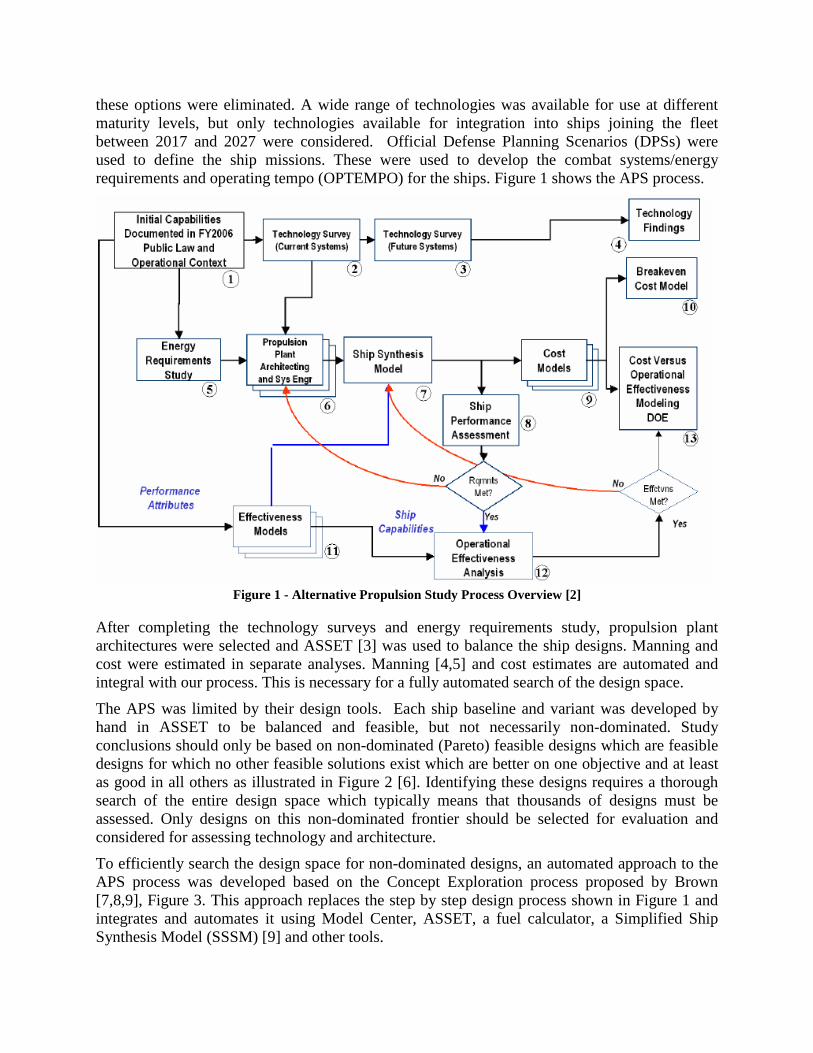
these options were eliminated. A wide range of technologies was available for use at different maturity levels, but only technologies available for integration into ships joining the fleet between 2017 and 2027 were considered. Official Defense Planning Scenarios (DPSs) were used to define the ship missions. These were used to develop the combat systems/energy requirements and operating tempo (OPTEMPO) for the ships. Figure 1 shows the APS process.
Figure 1 - Alternative Propulsion Study Process Overview [2]
After completing the technology surveys and energy requirements study, propulsion plant architectures were selected and ASSET [3] was used to balance the ship designs. Manning and cost were estimated in separate analyses. Manning [4,5] and cost estimates are automated and integral with our process. This is necessary for a fully automated search of the design space.
The APS was limited by their design tools. Each ship baseline and variant was developed by hand in ASSET to be balanced and feasible, but not necessarily non-dominated. Study conclusions should only be based on non-dominated (Pareto) feasible designs which are feasible designs for which no other feasible solutions exist which are better on one objective and at least as good in all others as illustrated in Figure 2 [6]. Identifying these designs requires a thorough search of the entire design space which typically means that thousands of designs must be assessed. Only designs on this non-dominated frontier should be selected for evaluation and considered for assessing technology and architecture.
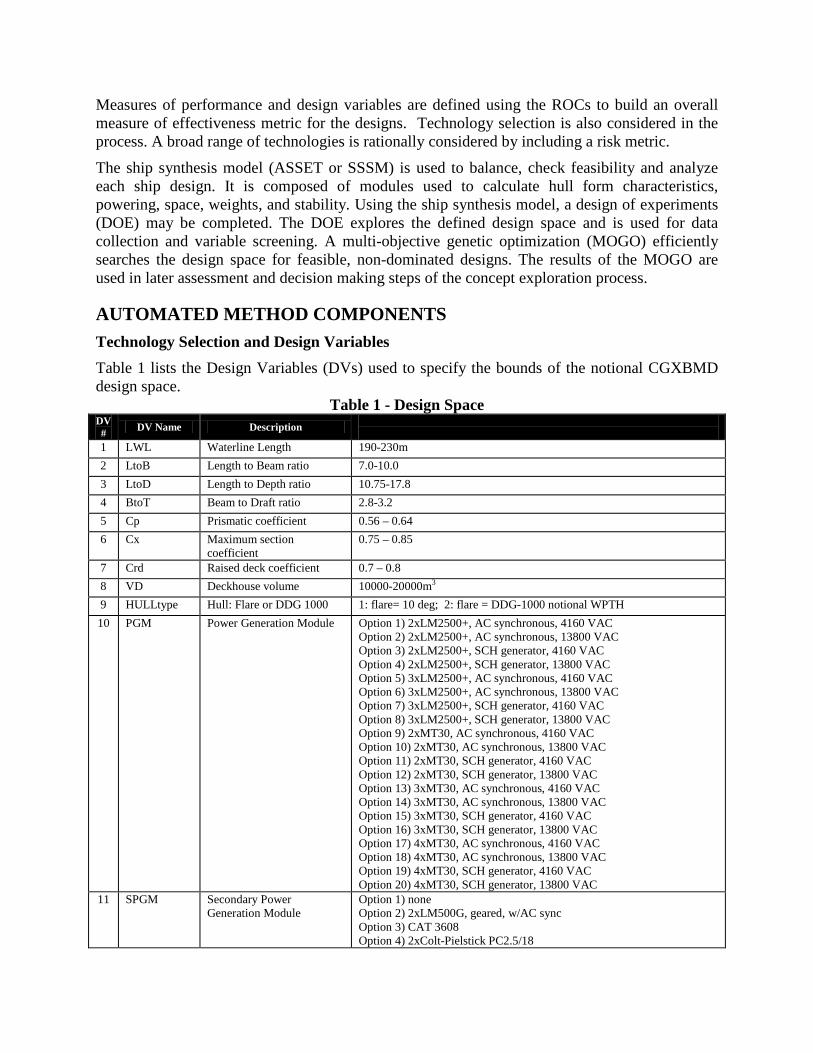
To efficiently search the design space for non-dominated designs, an automated approach to the APS process was developed based on the Concept Exploration process proposed by Brown [7,8,9], Figure 3. This approach replaces the step by step design process shown in Figure 1 and integrates and automates it using Model Center, ASSET, a fuel calculator, a Simplified Ship Synthesis Model (SSSM) [9] and other tools.
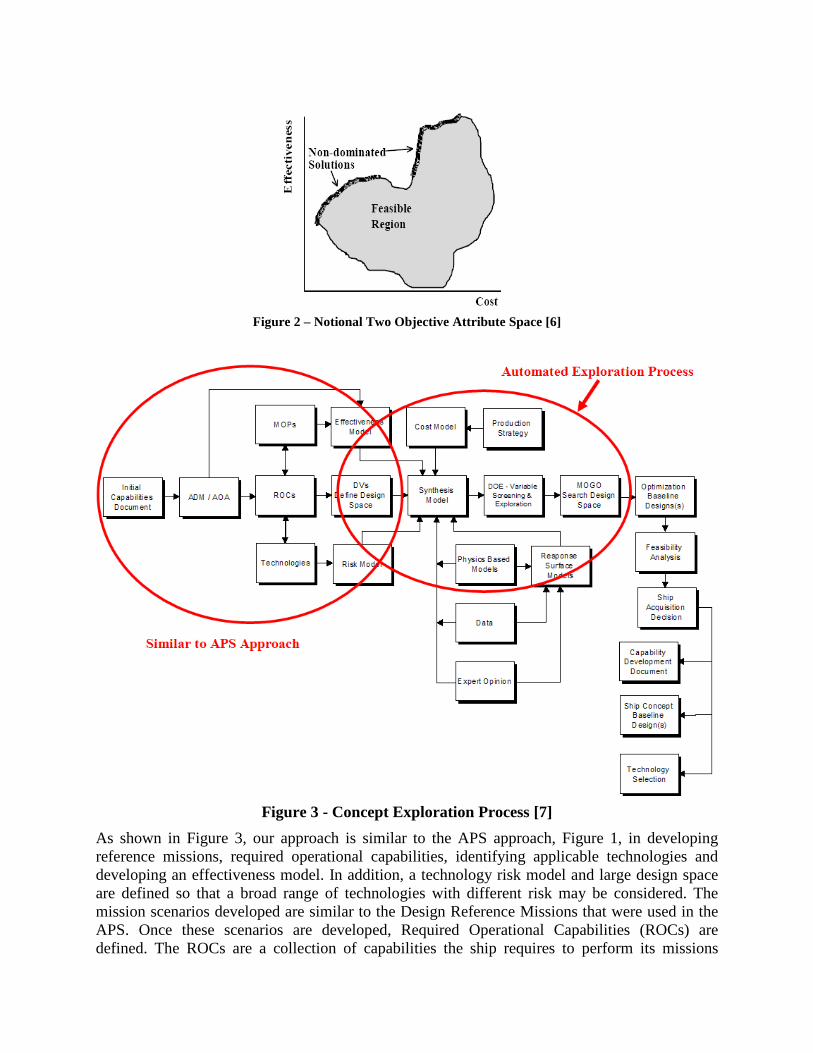
Figure 2 – Notional Two Objective Attribute Space [6]
Figure 3 - Concept Exploration Process [7]
As shown in Figure 3, our approach is similar to the APS approach, Figure 1, in developing reference missions, required operational capabilities, identifying applicable technologies and developing an effectiveness model. In addition, a technology risk model and large design space are defined so that a broad range of technologies with different risk may be considered. The mission scenarios developed are similar to the Design Reference Missions that were used in the APS. Once these scenarios are developed, Required Operational Capabilities (ROCs) are defined. The ROCs are a collection of capabilities the ship requires to perform its missions
Measures of performance and design variables are defined using the ROCs to build an overall measure of effectiveness metric for the designs. Technology selection is also considered in the process. A broad range of technologies is rationally considered by including a risk metric.
The ship synthesis model (ASSET or SSSM) is used to balance, check feasibility and analyze each ship design. It is composed of modules used to calculate hull form characteristics, powering, space, weights, and stability. Using the ship synthesis model, a design of experiments (DOE) may be completed. The DOE explores the defined design space and is used for data collection and variable screening. A multi-objective genetic optimization (MOGO) efficiently searches the design space for feasible, non-dominated designs. The results of the MOGO are used in later assessment and decision making steps of the concept exploration process.
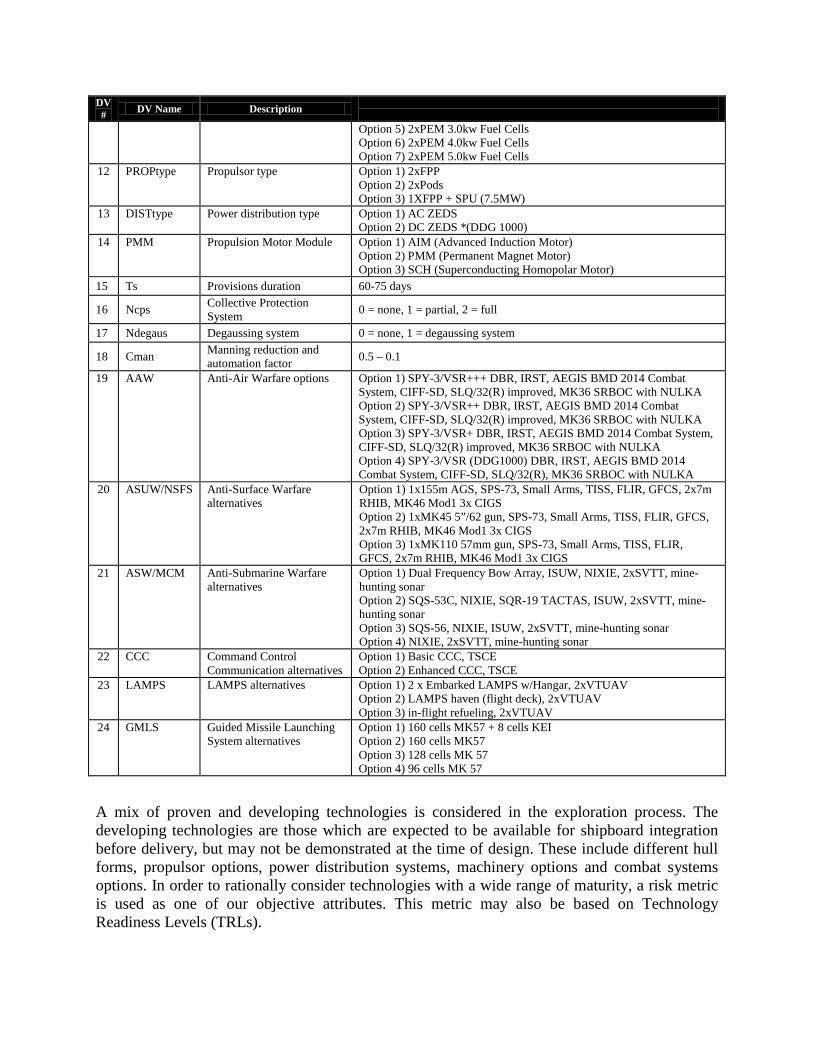
AUTOMATED METHOD COMPONENTS Technology Selection and Design Variables Table 1 lists the Design Variables (DVs) used to specify the bounds of the notional CGXBMD design space.
Table 1 - Design Space DV # DV Name Description
1 LWL Waterline Length 190-230m 2 LtoB Length to Beam ratio 7.0-10.0 3 LtoD Length to Depth ratio 10.75-17.8 4 BtoT Beam to Draft ratio 2.8-3.2 5 Cp Prismatic coefficient 0.56 – 0.64 6 Cx Maximum section
coefficient 0.75 – 0.85
7 Crd Raised deck coefficient 0.7 – 0.8 8 VD Deckhouse volume 10000-20000m3 9 HULLtype Hull: Flare or DDG 1000 1: flare= 10 deg; 2: flare = DDG-1000 notional WPTH 10 PGM Power Generation Module Option 1) 2xLM2500+, AC synchronous, 4160 VAC
Option 2) 2xLM2500+, AC synchronous, 13800 VAC Option 3) 2xLM2500+, SCH generator, 4160 VAC Option 4) 2xLM2500+, SCH generator, 13800 VAC Option 5) 3xLM2500+, AC synchronous, 4160 VAC Option 6) 3xLM2500+, AC synchronous, 13800 VAC Option 7) 3xLM2500+, SCH generator, 4160 VAC Option 8) 3xLM2500+, SCH generator, 13800 VAC Option 9) 2xMT30, AC synchronous, 4160 VAC Option 10) 2xMT30, AC synchronous, 13800 VAC Option 11) 2xMT30, SCH generator, 4160 VAC Option 12) 2xMT30, SCH generator, 13800 VAC Option 13) 3xMT30, AC synchronous, 4160 VAC Option 14) 3xMT30, AC synchronous, 13800 VAC Option 15) 3xMT30, SCH generator, 4160 VAC Option 16) 3xMT30, SCH generator, 13800 VAC Option 17) 4xMT30, AC synchronous, 4160 VAC Option 18) 4xMT30, AC synchronous, 13800 VAC Option 19) 4xMT30, SCH generator, 4160 VAC Option 20) 4xMT30, SCH generator, 13800 VAC
11 SPGM Secondary Power Generation Module
Option 1) none Option 2) 2xLM500G, geared, w/AC sync Option 3) CAT 3608 Option 4) 2xColt-Pielstick PC2.5/18
DV # DV Name Description
Option 5) 2xPEM 3.0kw Fuel Cells Option 6) 2xPEM 4.0kw Fuel Cells Option 7) 2xPEM 5.0kw Fuel Cells
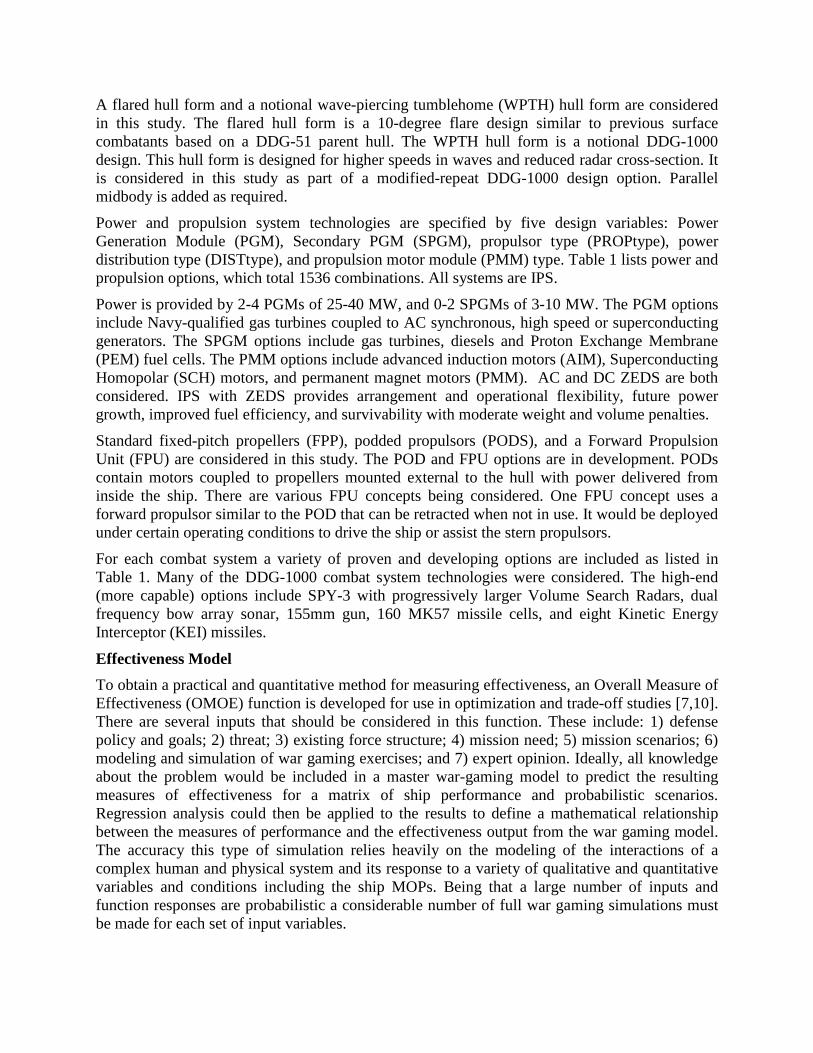
12 PROPtype Propulsor type Option 1) 2xFPP Option 2) 2xPods Option 3) 1XFPP + SPU (7.5MW)
13 DISTtype Power distribution type Option 1) AC ZEDS Option 2) DC ZEDS *(DDG 1000)
14 PMM Propulsion Motor Module Option 1) AIM (Advanced Induction Motor) Option 2) PMM (Permanent Magnet Motor) Option 3) SCH (Superconducting Homopolar Motor)
15 Ts Provisions duration 60-75 days
16 Ncps Collective Protection System 0 = none, 1 = partial, 2 = full
17 Ndegaus Degaussing system 0 = none, 1 = degaussing system
18 Cman Manning reduction and automation factor 0.5 – 0.1
19 AAW
Anti-Air Warfare options Option 1) SPY-3/VSR+++ DBR, IRST, AEGIS BMD 2014 Combat System, CIFF-SD, SLQ/32(R) improved, MK36 SRBOC with NULKA Option 2) SPY-3/VSR++ DBR, IRST, AEGIS BMD 2014 Combat System, CIFF-SD, SLQ/32(R) improved, MK36 SRBOC with NULKA Option 3) SPY-3/VSR+ DBR, IRST, AEGIS BMD 2014 Combat System, CIFF-SD, SLQ/32(R) improved, MK36 SRBOC with NULKA Option 4) SPY-3/VSR (DDG1000) DBR, IRST, AEGIS BMD 2014 Combat System, CIFF-SD, SLQ/32(R), MK36 SRBOC with NULKA
20 ASUW/NSFS Anti-Surface Warfare alternatives
Option 1) 1x155m AGS, SPS-73, Small Arms, TISS, FLIR, GFCS, 2x7m RHIB, MK46 Mod1 3x CIGS Option 2) 1xMK45 5”/62 gun, SPS-73, Small Arms, TISS, FLIR, GFCS, 2x7m RHIB, MK46 Mod1 3x CIGS Option 3) 1xMK110 57mm gun, SPS-73, Small Arms, TISS, FLIR, GFCS, 2x7m RHIB, MK46 Mod1 3x CIGS
21 ASW/MCM Anti-Submarine Warfare alternatives
Option 1) Dual Frequency Bow Array, ISUW, NIXIE, 2xSVTT, mine-hunting sonar Option 2) SQS-53C, NIXIE, SQR-19 TACTAS, ISUW, 2xSVTT, mine-hunting sonar Option 3) SQS-56, NIXIE, ISUW, 2xSVTT, mine-hunting sonar Option 4) NIXIE, 2xSVTT, mine-hunting sonar
22 CCC Command Control Communication alternatives
Option 1) Basic CCC, TSCE Option 2) Enhanced CCC, TSCE
23 LAMPS LAMPS alternatives Option 1) 2 x Embarked LAMPS w/Hangar, 2xVTUAV Option 2) LAMPS haven (flight deck), 2xVTUAV Option 3) in-flight refueling, 2xVTUAV
24 GMLS Guided Missile Launching System alternatives
Option 1) 160 cells MK57 + 8 cells KEI Option 2) 160 cells MK57 Option 3) 128 cells MK 57 Option 4) 96 cells MK 57
A mix of proven and developing technologies is considered in the exploration process. The developing technologies are those which are expected to be available for shipboard integration before delivery, but may not be demonstrated at the time of design. These include different hull forms, propulsor options, power distribution systems, machinery options and combat systems options. In order to rationally consider technologies with a wide range of maturity, a risk metric is used as one of our objective attributes. This metric may also be based on Technology Readiness Levels (TRLs).
A flared hull form and a notional wave-piercing tumblehome (WPTH) hull form are considered in this study. The flared hull form is a 10-degree flare design similar to previous surface combatants based on a DDG-51 parent hull. The WPTH hull form is a notional DDG-1000 design. This hull form is designed for higher speeds in waves and reduced radar cross-section. It is considered in this study as part of a modified-repeat DDG-1000 design option. Parallel midbody is added as required.
Power and propulsion system technologies are specified by five design variables: Power Generation Module (PGM), Secondary PGM (SPGM), propulsor type (PROPtype), power distribution type (DISTtype), and propulsion motor module (PMM) type. Table 1 lists power and propulsion options, which total 1536 combinations. All systems are IPS.
Power is provided by 2-4 PGMs of 25-40 MW, and 0-2 SPGMs of 3-10 MW. The PGM options include Navy-qualified gas turbines coupled to AC synchronous, high speed or superconducting generators. The SPGM options include gas turbines, diesels and Proton Exchange Membrane (PEM) fuel cells. The PMM options include advanced induction motors (AIM), Superconducting Homopolar (SCH) motors, and permanent magnet motors (PMM). AC and DC ZEDS are both considered. IPS with ZEDS provides arrangement and operational flexibility, future power growth, improved fuel efficiency, and survivability with moderate weight and volume penalties.
Standard fixed-pitch propellers (FPP), podded propulsors (PODS), and a Forward Propulsion Unit (FPU) are considered in this study. The POD and FPU options are in development. PODs contain motors coupled to propellers mounted external to the hull with power delivered from inside the ship. There are various FPU concepts being considered. One FPU concept uses a forward propulsor similar to the POD that can be retracted when not in use. It would be deployed under certain operating conditions to drive the ship or assist the stern propulsors.
For each combat system a variety of proven and developing options are included as listed in Table 1. Many of the DDG-1000 combat system technologies were considered. The high-end (more capable) options include SPY-3 with progressively larger Volume Search Radars, dual frequency bow array sonar, 155mm gun, 160 MK57 missile cells, and eight Kinetic Energy Interceptor (KEI) missiles.
Effectiveness Model To obtain a practical and quantitative method for measuring effectiveness, an Overall Measure of Effectiveness (OMOE) function is developed for use in optimization and trade-off studies [7,10]. There are several inputs that should be considered in this function. These include: 1) defense policy and goals; 2) threat; 3) existing force structure; 4) mission need; 5) mission scenarios; 6) modeling and simulation of war gaming exercises; and 7) expert opinion. Ideally, all knowledge about the problem would be included in a master war-gaming model to predict the resulting measures of effectiveness for a matrix of ship performance and probabilistic scenarios. Regression analysis could then be applied to the results to define a mathematical relationship between the measures of performance and the effectiveness output from the war gaming model. The accuracy this type of simulation relies heavily on the modeling of the interactions of a complex human and physical system and its response to a variety of qualitative and quantitative variables and conditions including the ship MOPs. Being that a large number of inputs and function responses are probabilistic a considerable number of full war gaming simulations must be made for each set of input variables.
An alternative to running these simulations and models is to use expert opinion to directly integrate the diverse inputs, assess the value of the ship MOPs, and combine these in a single OMOE function, Equation (1).
( )∑=i
iii wMOPVOPOMOE (1)
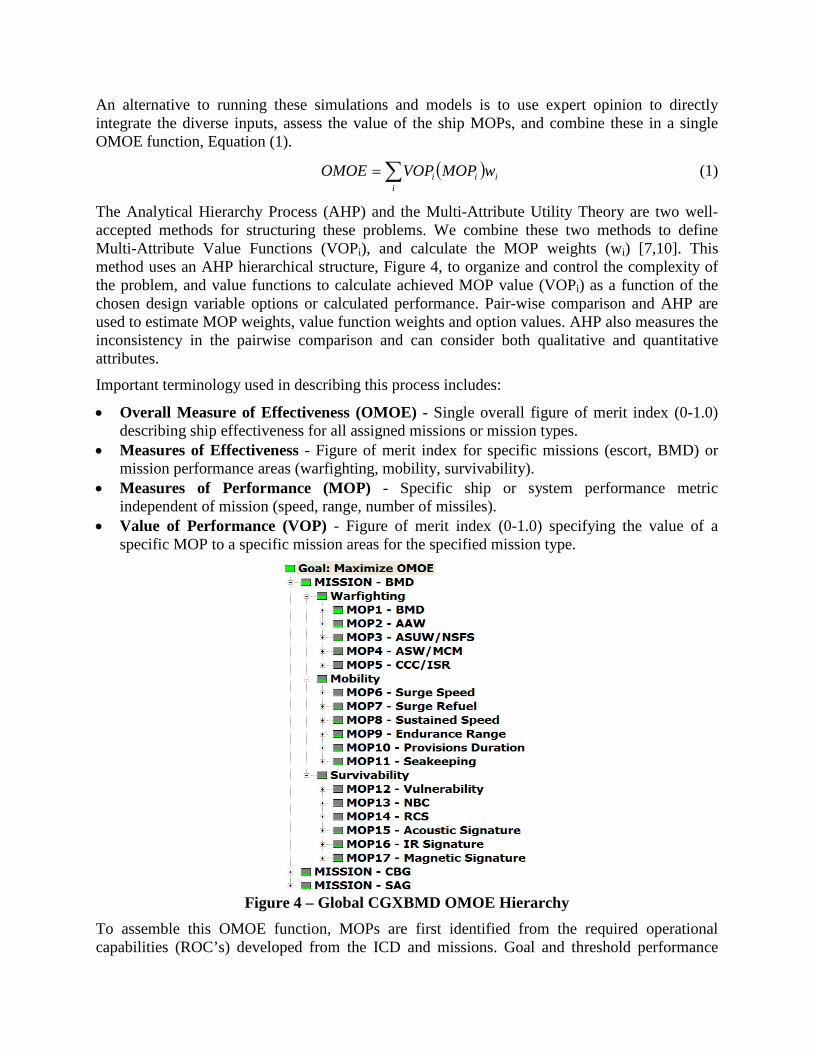
The Analytical Hierarchy Process (AHP) and the Multi-Attribute Utility Theory are two well-accepted methods for structuring these problems. We combine these two methods to define Multi-Attribute Value Functions (VOPi), and calculate the MOP weights (wi) [7,10]. This method uses an AHP hierarchical structure, Figure 4, to organize and control the complexity of the problem, and value functions to calculate achieved MOP value (VOPi) as a function of the chosen design variable options or calculated performance. Pair-wise comparison and AHP are used to estimate MOP weights, value function weights and option values. AHP also measures the inconsistency in the pairwise comparison and can consider both qualitative and quantitative attributes.
Important terminology used in describing this process includes:
• Overall Measure of Effectiveness (OMOE) - Single overall figure of merit index (0-1.0) describing ship effectiveness for all assigned missions or mission types.
• Measures of Effectiveness - Figure of merit index for specific missions (escort, BMD) or mission performance areas (warfighting, mobility, survivability).
• Measures of Performance (MOP) - Specific ship or system performance metric independent of mission (speed, range, number of missiles).
• Value of Performance (VOP) - Figure of merit index (0-1.0) specifying the value of a specific MOP to a specific mission areas for the specified mission type.
Figure 4 – Global CGXBMD OMOE Hierarchy
To assemble this OMOE function, MOPs are first identified from the required operational capabilities (ROC’s) developed from the ICD and missions. Goal and threshold performance
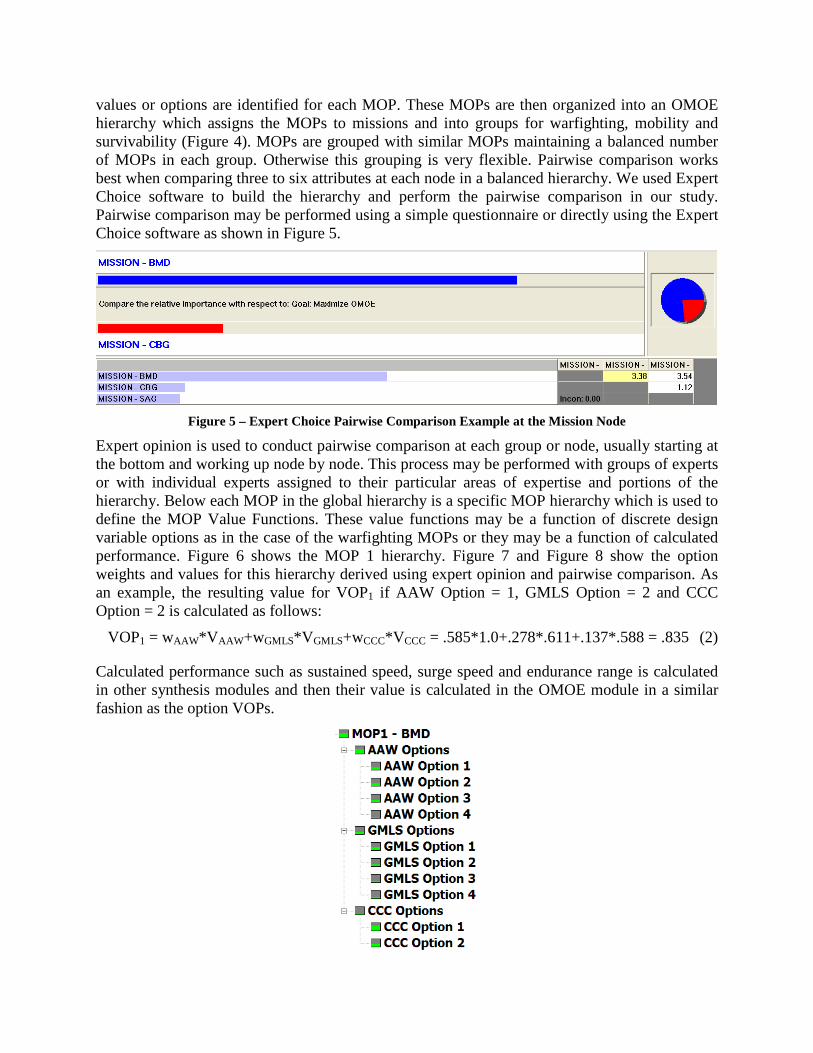
values or options are identified for each MOP. These MOPs are then organized into an OMOE hierarchy which assigns the MOPs to missions and into groups for warfighting, mobility and survivability (Figure 4). MOPs are grouped with similar MOPs maintaining a balanced number of MOPs in each group. Otherwise this grouping is very flexible. Pairwise comparison works best when comparing three to six attributes at each node in a balanced hierarchy. We used Expert Choice software to build the hierarchy and perform the pairwise comparison in our study. Pairwise comparison may be performed using a simple questionnaire or directly using the Expert Choice software as shown in Figure 5.
Figure 5 – Expert Choice Pairwise Comparison Example at the Mission Node
Expert opinion is used to conduct pairwise comparison at each group or node, usually starting at the bottom and working up node by node. This process may be performed with groups of experts or with individual experts assigned to their particular areas of expertise and portions of the hierarchy. Below each MOP in the global hierarchy is a specific MOP hierarchy which is used to define the MOP Value Functions. These value functions may be a function of discrete design variable options as in the case of the warfighting MOPs or they may be a function of calculated performance. Figure 6 shows the MOP 1 hierarchy. Figure 7 and Figure 8 show the option weights and values for this hierarchy derived using expert opinion and pairwise comparison. As an example, the resulting value for VOP1 if AAW Option = 1, GMLS Option = 2 and CCC Option = 2 is calculated as follows:
VOP1 = wAAW*VAAW+wGMLS*VGMLS+wCCC*VCCC = .585*1.0+.278*.611+.137*.588 = .835 (2)
Calculated performance such as sustained speed, surge speed and endurance range is calculated in other synthesis modules and then their value is calculated in the OMOE module in a similar fashion as the option VOPs.
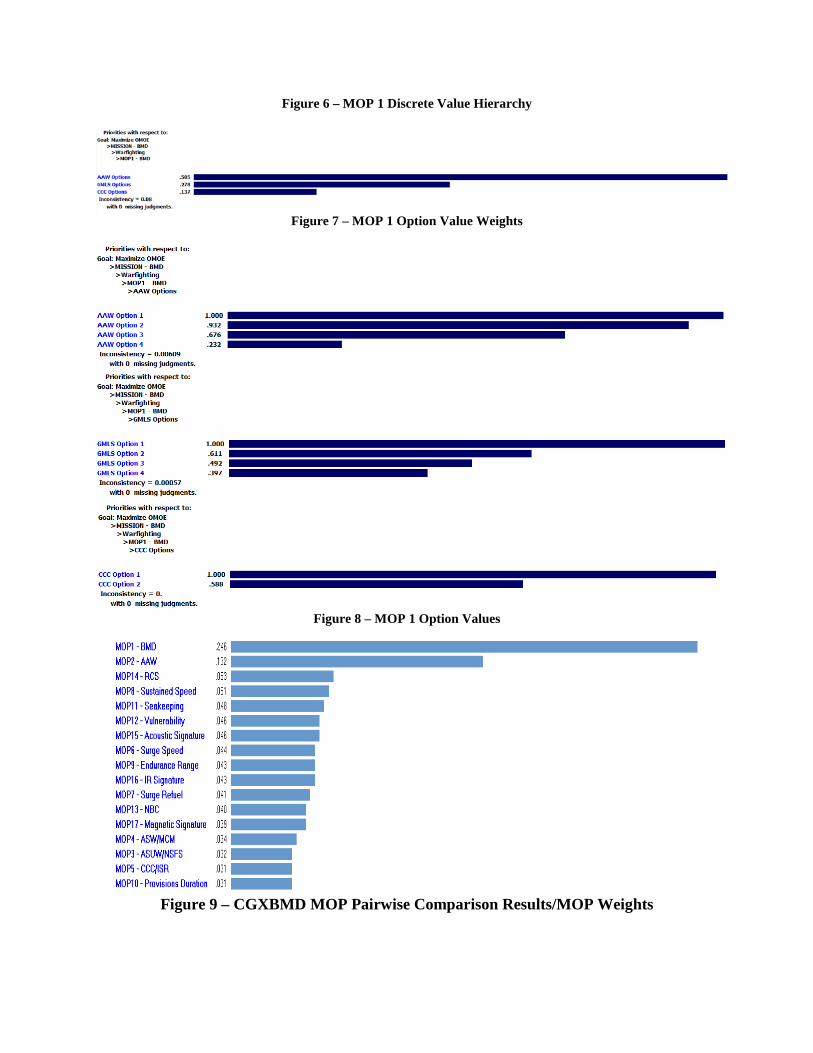
Figure 6 – MOP 1 Discrete Value Hierarchy
Figure 7 – MOP 1 Option Value Weights
Figure 8 – MOP 1 Option Values
Figure 9 – CGXBMD MOP Pairwise Comparison Results/MOP Weights
AHP pairwise comparison results are rolled up to a single set of weights for each MOP as shown in Figure 9. The sum of these weights is equal to one. The OMOE Equation (1) and VOP Equations (2) are coded in the OMOE module and are combined to calculate the single OMOE value for a particular design given its selected design options and calculated performance.
The APS Design Reference Mission and Operational Effectiveness processes are consistent with the OMOE approach used here. The APS also breaks out the mission, mobility and vulnerability (Warfighting, Mobility, and Survivability) measures of effectiveness (MOE’s) from the OMOE as a means of comparison. The APS introduced new mobility MOPs that had not been typically used in the past, Surge Speed and Surge Refuel, which were also included in our model.
Cost Model A modified weight-based method with manning and fuel cost is used to estimate acquisition and life cycle cost. Complexity and producibility factors take into consideration technology selection for a particular design, including hull, machinery and combat system technologies [7,11].
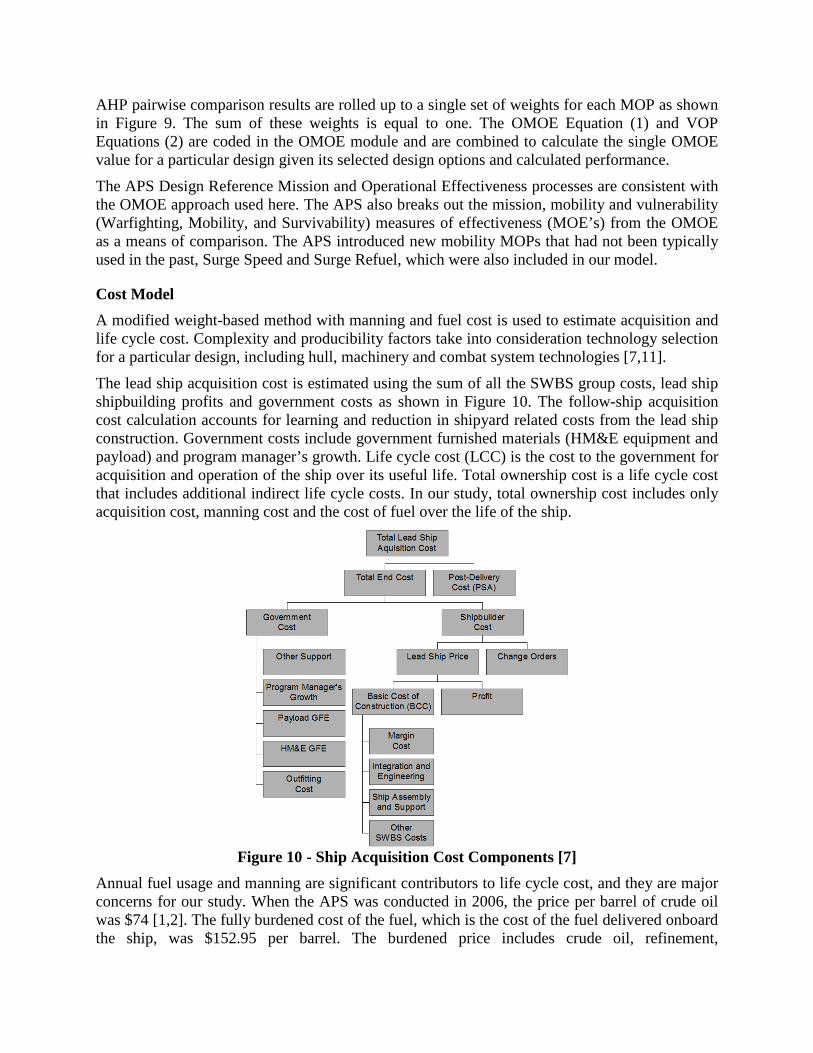
The lead ship acquisition cost is estimated using the sum of all the SWBS group costs, lead ship shipbuilding profits and government costs as shown in Figure 10. The follow-ship acquisition cost calculation accounts for learning and reduction in shipyard related costs from the lead ship construction. Government costs include government furnished materials (HM&E equipment and payload) and program manager’s growth. Life cycle cost (LCC) is the cost to the government for acquisition and operation of the ship over its useful life. Total ownership cost is a life cycle cost that includes additional indirect life cycle costs. In our study, total ownership cost includes only acquisition cost, manning cost and the cost of fuel over the life of the ship.
Figure 10 - Ship Acquisition Cost Components [7]
Annual fuel usage and manning are significant contributors to life cycle cost, and they are major concerns for our study. When the APS was conducted in 2006, the price per barrel of crude oil was $74 [1,2]. The fully burdened cost of the fuel, which is the cost of the fuel delivered onboard the ship, was $152.95 per barrel. The burdened price includes crude oil, refinement,
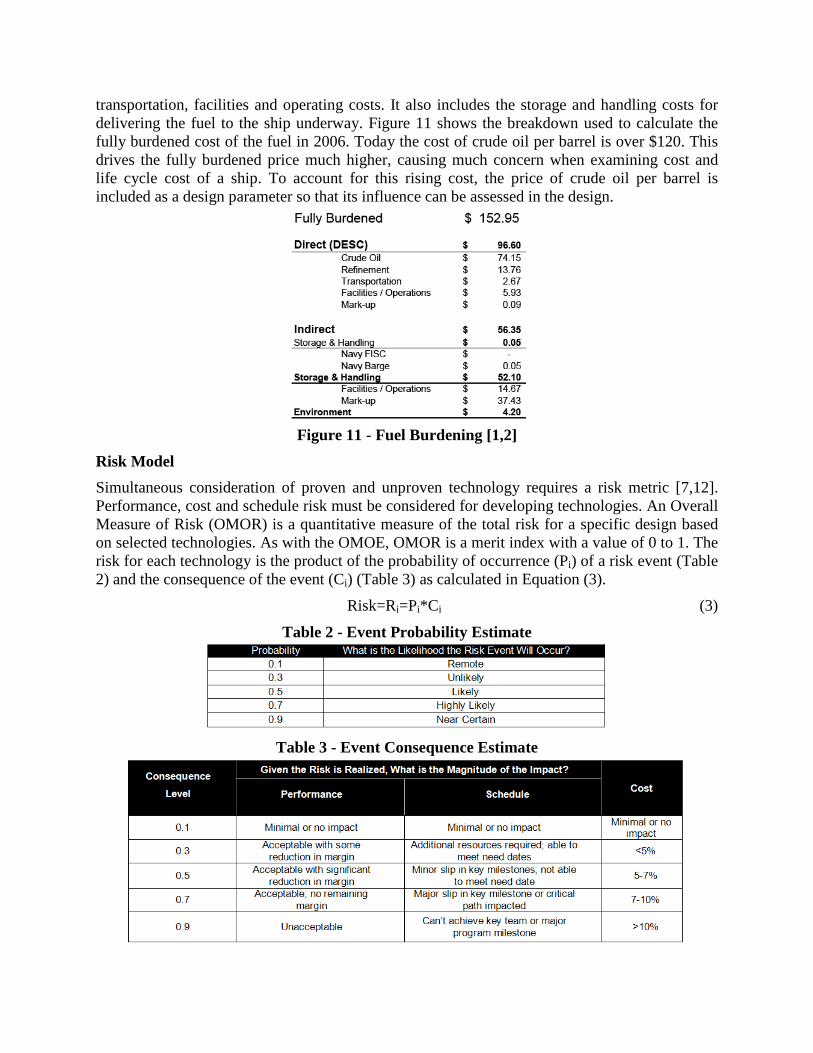
transportation, facilities and operating costs. It also includes the storage and handling costs for delivering the fuel to the ship underway. Figure 11 shows the breakdown used to calculate the fully burdened cost of the fuel in 2006. Today the cost of crude oil per barrel is over $120. This drives the fully burdened price much higher, causing much concern when examining cost and life cycle cost of a ship. To account for this rising cost, the price of crude oil per barrel is included as a design parameter so that its influence can be assessed in the design.
Figure 11 - Fuel Burdening [1,2]
Risk Model Simultaneous consideration of proven and unproven technology requires a risk metric [7,12]. Performance, cost and schedule risk must be considered for developing technologies. An Overall Measure of Risk (OMOR) is a quantitative measure of the total risk for a specific design based on selected technologies. As with the OMOE, OMOR is a merit index with a value of 0 to 1. The risk for each technology is the product of the probability of occurrence (Pi) of a risk event (Table 2) and the consequence of the event (Ci) (Table 3) as calculated in Equation (3).
Risk=Ri=Pi*Ci (3)
Table 2 - Event Probability Estimate
Table 3 - Event Consequence Estimate
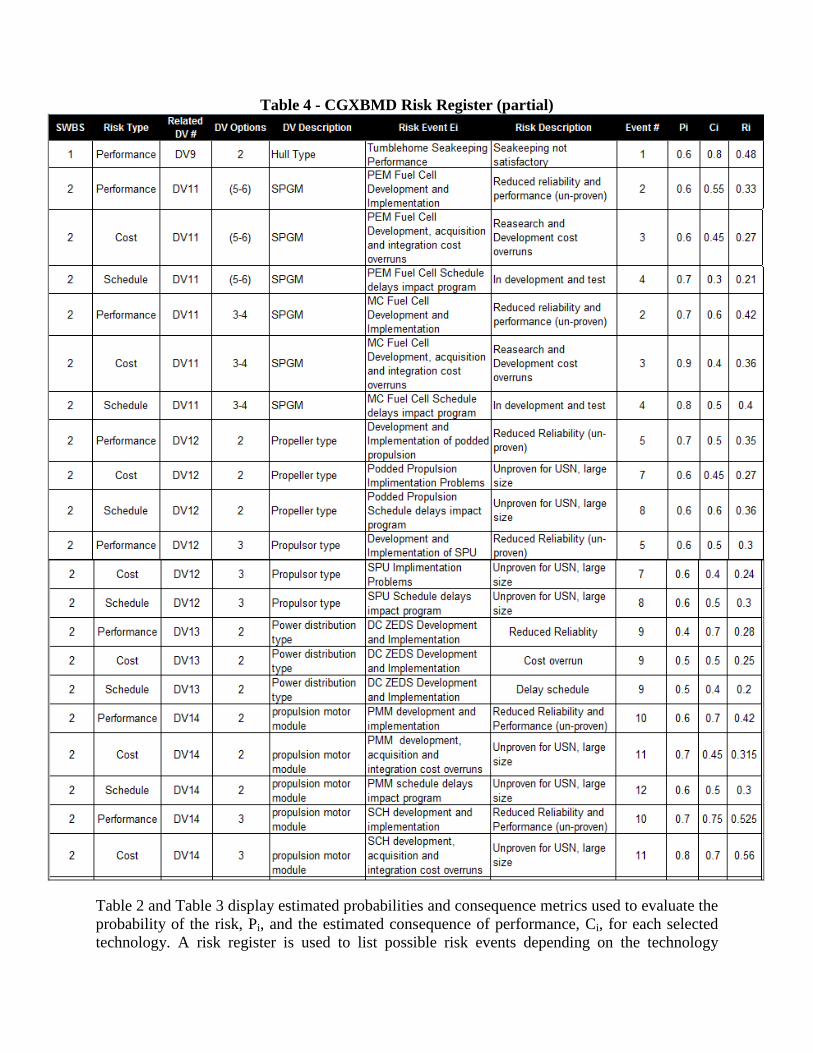
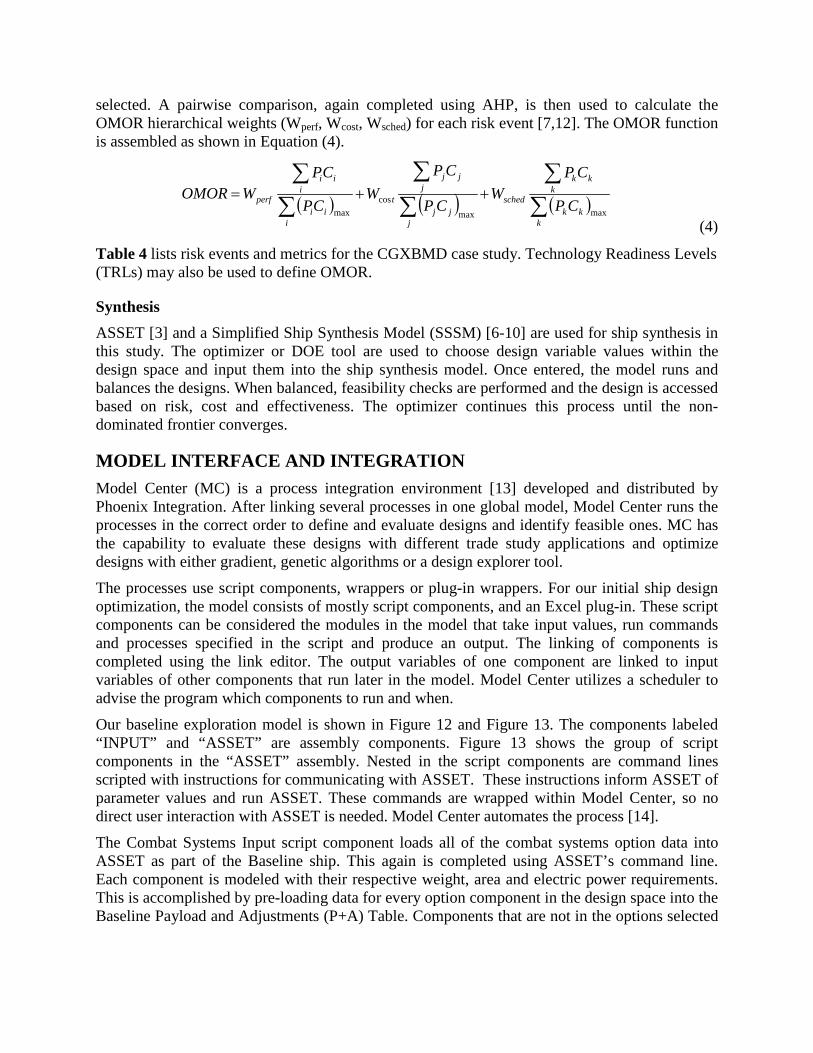
Table 4 - CGXBMD Risk Register (partial)
Table 2 and Table 3 display estimated probabilities and consequence metrics used to evaluate the probability of the risk, Pi, and the estimated consequence of performance, Ci, for each selected technology. A risk register is used to list possible risk events depending on the technology
selected. A pairwise comparison, again completed using AHP, is then used to calculate the OMOR hierarchical weights (Wperf, Wcost, Wsched) for each risk event [7,12]. The OMOR function is assembled as shown in Equation (4).
( ) ( ) ( )∑∑
∑∑
∑∑
++=
kkk
kkk
sched
jjj
jjj
t
iii
iii
perf CP
CPW
CP
CPW
CP
CPWOMOR
maxmaxcos
max
(4)
Table 4 lists risk events and metrics for the CGXBMD case study. Technology Readiness Levels (TRLs) may also be used to define OMOR.
Synthesis ASSET [3] and a Simplified Ship Synthesis Model (SSSM) [6-10] are used for ship synthesis in this study. The optimizer or DOE tool are used to choose design variable values within the design space and input them into the ship synthesis model. Once entered, the model runs and balances the designs. When balanced, feasibility checks are performed and the design is accessed based on risk, cost and effectiveness. The optimizer continues this process until the non-dominated frontier converges.
MODEL INTERFACE AND INTEGRATION
Model Center (MC) is a process integration environment [13] developed and distributed by Phoenix Integration. After linking several processes in one global model, Model Center runs the processes in the correct order to define and evaluate designs and identify feasible ones. MC has the capability to evaluate these designs with different trade study applications and optimize designs with either gradient, genetic algorithms or a design explorer tool.
The processes use script components, wrappers or plug-in wrappers. For our initial ship design optimization, the model consists of mostly script components, and an Excel plug-in. These script components can be considered the modules in the model that take input values, run commands and processes specified in the script and produce an output. The linking of components is completed using the link editor. The output variables of one component are linked to input variables of other components that run later in the model. Model Center utilizes a scheduler to advise the program which components to run and when.
Our baseline exploration model is shown in Figure 12 and Figure 13. The components labeled “INPUT” and “ASSET” are assembly components. Figure 13 shows the group of script components in the “ASSET” assembly. Nested in the script components are command lines scripted with instructions for communicating with ASSET. These instructions inform ASSET of parameter values and run ASSET. These commands are wrapped within Model Center, so no direct user interaction with ASSET is needed. Model Center automates the process [14].
The Combat Systems Input script component loads all of the combat systems option data into ASSET as part of the Baseline ship. This again is completed using ASSET’s command line. Each component is modeled with their respective weight, area and electric power requirements. This is accomplished by pre-loading data for every option component in the design space into the Baseline Payload and Adjustments (P+A) Table. Components that are not in the options selected
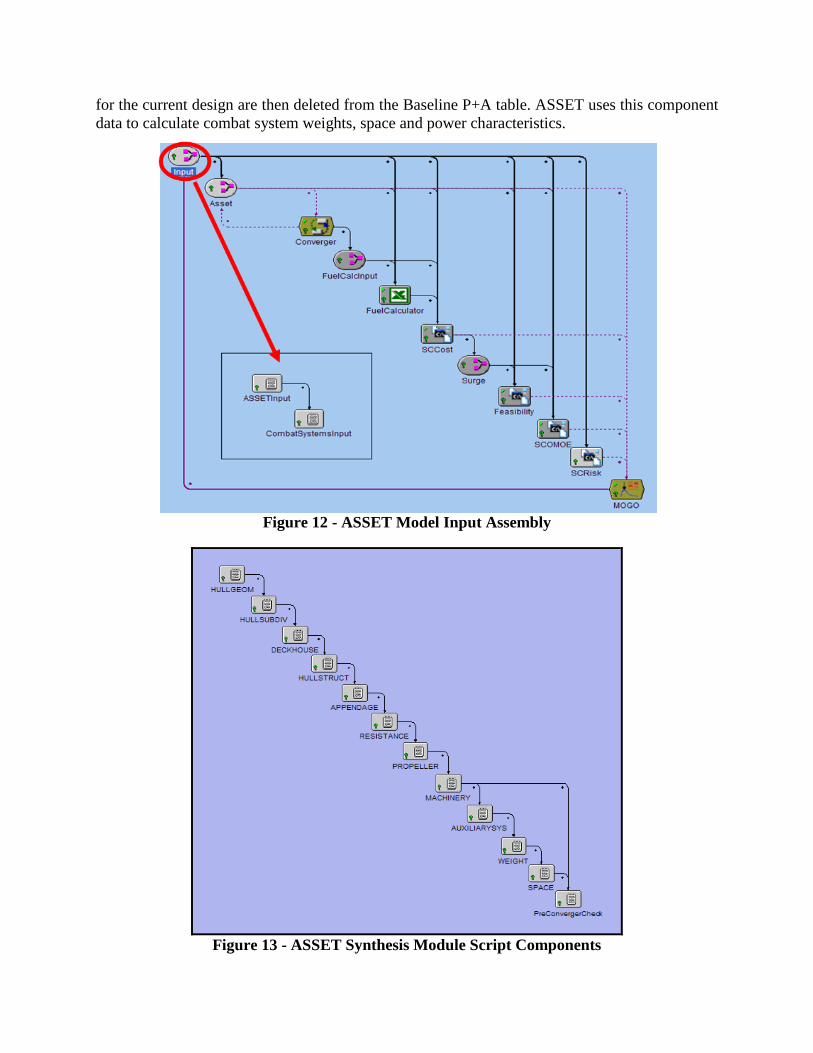
for the current design are then deleted from the Baseline P+A table. ASSET uses this component data to calculate combat system weights, space and power characteristics.
Figure 12 - ASSET Model Input Assembly
Figure 13 - ASSET Synthesis Module Script Components
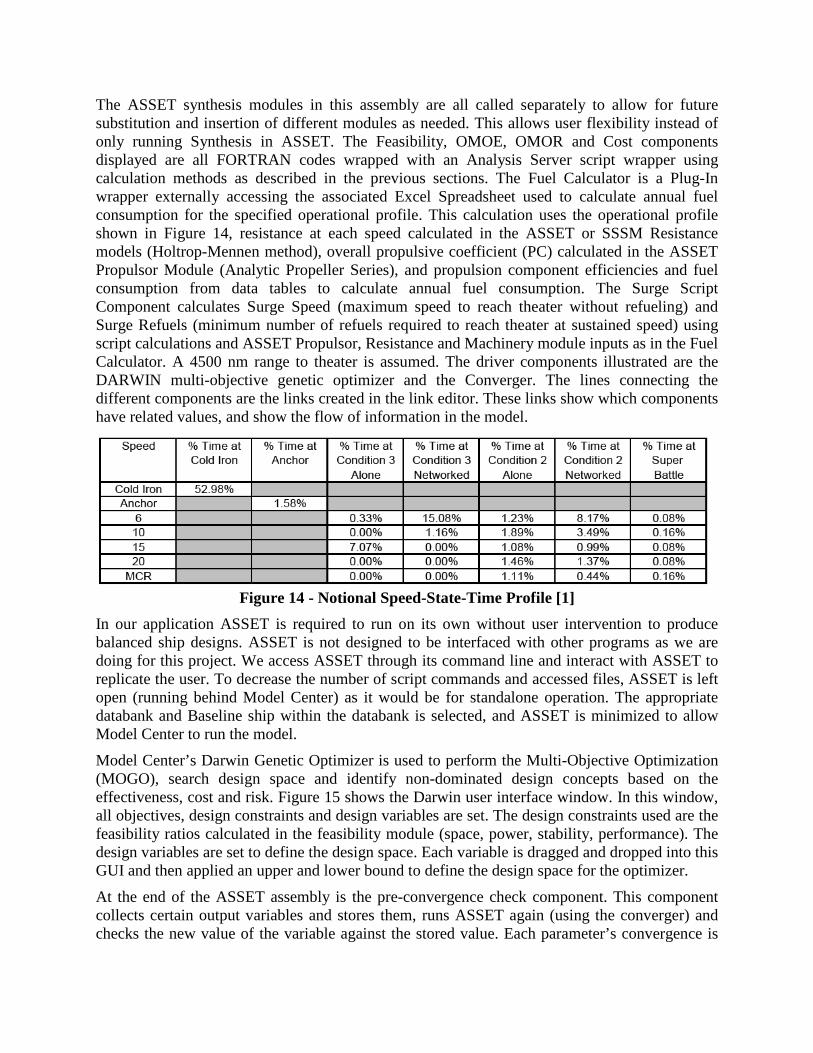
The ASSET synthesis modules in this assembly are all called separately to allow for future substitution and insertion of different modules as needed. This allows user flexibility instead of only running Synthesis in ASSET. The Feasibility, OMOE, OMOR and Cost components displayed are all FORTRAN codes wrapped with an Analysis Server script wrapper using calculation methods as described in the previous sections. The Fuel Calculator is a Plug-In wrapper externally accessing the associated Excel Spreadsheet used to calculate annual fuel consumption for the specified operational profile. This calculation uses the operational profile shown in Figure 14, resistance at each speed calculated in the ASSET or SSSM Resistance models (Holtrop-Mennen method), overall propulsive coefficient (PC) calculated in the ASSET Propulsor Module (Analytic Propeller Series), and propulsion component efficiencies and fuel consumption from data tables to calculate annual fuel consumption. The Surge Script Component calculates Surge Speed (maximum speed to reach theater without refueling) and Surge Refuels (minimum number of refuels required to reach theater at sustained speed) using script calculations and ASSET Propulsor, Resistance and Machinery module inputs as in the Fuel Calculator. A 4500 nm range to theater is assumed. The driver components illustrated are the DARWIN multi-objective genetic optimizer and the Converger. The lines connecting the different components are the links created in the link editor. These links show which components have related values, and show the flow of information in the model.
Figure 14 - Notional Speed-State-Time Profile [1]
In our application ASSET is required to run on its own without user intervention to produce balanced ship designs. ASSET is not designed to be interfaced with other programs as we are doing for this project. We access ASSET through its command line and interact with ASSET to replicate the user. To decrease the number of script commands and accessed files, ASSET is left open (running behind Model Center) as it would be for standalone operation. The appropriate databank and Baseline ship within the databank is selected, and ASSET is minimized to allow Model Center to run the model.
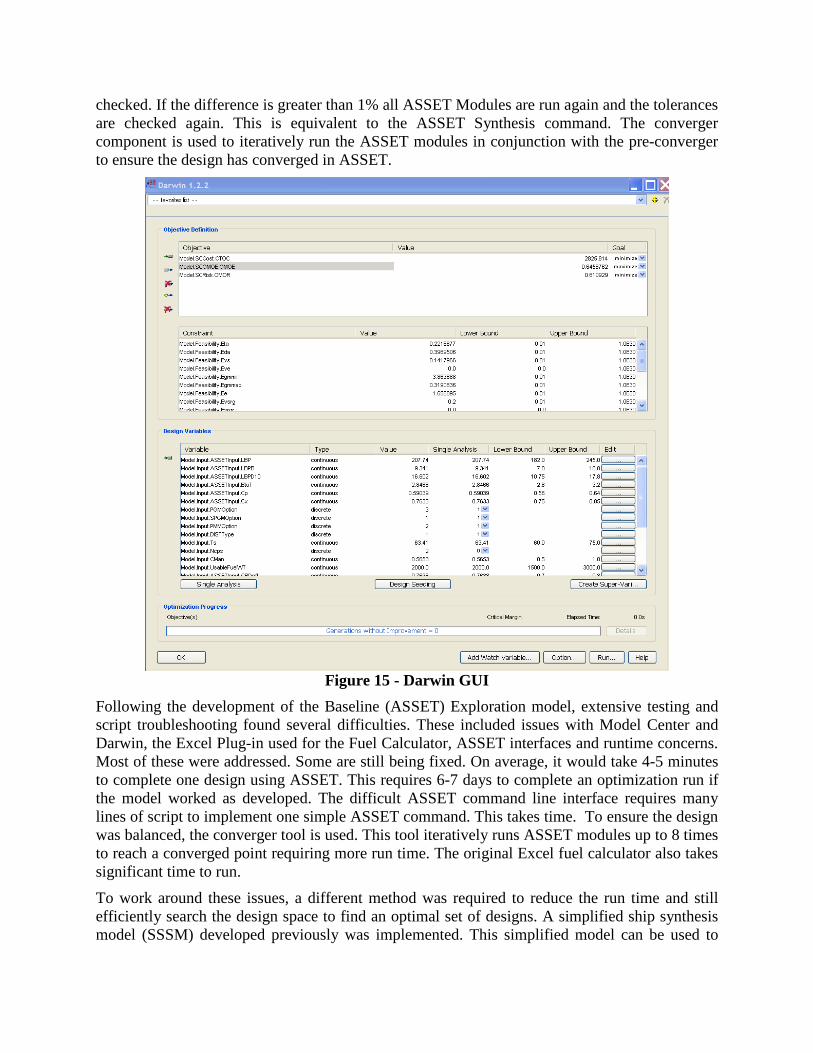
Model Center’s Darwin Genetic Optimizer is used to perform the Multi-Objective Optimization (MOGO), search design space and identify non-dominated design concepts based on the effectiveness, cost and risk. Figure 15 shows the Darwin user interface window. In this window, all objectives, design constraints and design variables are set. The design constraints used are the feasibility ratios calculated in the feasibility module (space, power, stability, performance). The design variables are set to define the design space. Each variable is dragged and dropped into this GUI and then applied an upper and lower bound to define the design space for the optimizer.
At the end of the ASSET assembly is the pre-convergence check component. This component collects certain output variables and stores them, runs ASSET again (using the converger) and checks the new value of the variable against the stored value. Each parameter’s convergence is
checked. If the difference is greater than 1% all ASSET Modules are run again and the tolerances are checked again. This is equivalent to the ASSET Synthesis command. The converger component is used to iteratively run the ASSET modules in conjunction with the pre-converger to ensure the design has converged in ASSET.
Figure 15 - Darwin GUI
Following the development of the Baseline (ASSET) Exploration model, extensive testing and script troubleshooting found several difficulties. These included issues with Model Center and Darwin, the Excel Plug-in used for the Fuel Calculator, ASSET interfaces and runtime concerns. Most of these were addressed. Some are still being fixed. On average, it would take 4-5 minutes to complete one design using ASSET. This requires 6-7 days to complete an optimization run if the model worked as developed. The difficult ASSET command line interface requires many lines of script to implement one simple ASSET command. This takes time. To ensure the design was balanced, the converger tool is used. This tool iteratively runs ASSET modules up to 8 times to reach a converged point requiring more run time. The original Excel fuel calculator also takes significant time to run.
To work around these issues, a different method was required to reduce the run time and still efficiently search the design space to find an optimal set of designs. A simplified ship synthesis model (SSSM) developed previously was implemented. This simplified model can be used to
pre-screen variables and to study responses. A FORTRAN-coded Fuel Calculator was also developed to provide the same annual fuel consumption calculation capability as the Excel-based calculator, but running much faster and without error. An ASSET model with the new fuel calculator could then be used to complete the final optimization runs.
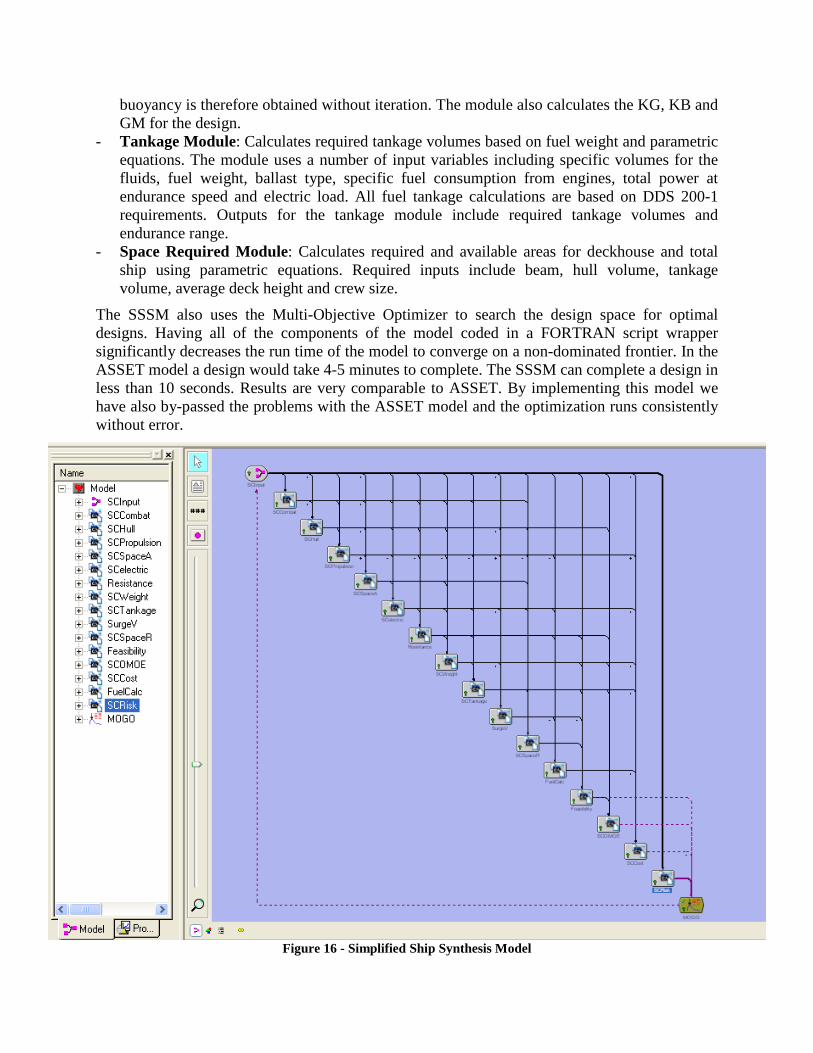
The SSSM is used to eliminate the convergence loop, decrease run time and improve reliability. It uses a parametric hull form vice 3-D hull geometry and parametric equations to estimate single digit SWBS weights and space requirements. This model does not use ASSET, or explicitly produce 3D arrangements. This allows a much faster run time. The components of this model are basically the same as those in the ASSET model, but use a simpler approach with less explicit detail. The SSSM is illustrated in Figure 16.
The following is a description of each of the ship synthesis modules in the SSSM:
- Input Module: Inputs all design variables and parameter values. Provides inputs to other modules.
- Combat Systems: Extracts combat systems data from the combat systems data tables as specified by the selected combat systems design variables. Calculates payload SWBS weights, VCGs, areas and electric power requirements.
- Propulsion Module: Extracts propulsion system data from propulsion system data tables as specified by the selected propulsion system design variables. These tables are generated by modeling similar power plants in ASSET using a single baseline design. The module calculates the characteristics of the propulsion and power generation systems using this data.
- Hull Form Module: Inputs hull form principle characteristics and provides them to other modules. Algorithms are based on parent hull geosims, or simple prismatic and section coefficient relationships and appendage volumes. This module calculates displacement, area and volume characteristics.
- Space Available Module: Uses simple geometric equations to estimate areas and volumes of the submerged hull, hull above the waterline and deckhouse. Also calculates the minimum required depth, hull cubic number, and the height and volume requirements of the machinery box.
- Electric Module: Calculates the maximum marginal electric load (KWMFLM), required generator power (KWGREQ), required 24 hour average electic power (KW24AVG), and the required auxiliary machinery room volume (VAUX). The module estimates the system’s power requirements using known values or parametric equations, sums and applies margins. Also uses response surface models to determine manning numbers.
- Resistance Module: Calculates the hull resistance, sustained speed and shaft horsepower and endurance and maximum speed. The resistance is calculated using the Holtrop-Mennen regression-based method. The module calculates the effective bare hull power, appendage drag and air drag for various speeds as required by other modules.
- Weight Module: Calculates single digit SWBS weights, total weight and full load weights and VCG’s. The module uses a combination of known weights and parametric equations to calculate the SWBS weights. This module uses fuel as a slack variable meaning that the fuel weight is calculated as the difference of the total displacement on the design waterline and the sum of all other weights except fuel. This fuel weight is used to calculate Endurance range in the Tankage module which is then evaluated for feasibility in the Feasibility module and used to calculate OMOE in the OMOE module. The balancing of ship weight and
buoyancy is therefore obtained without iteration. The module also calculates the KG, KB and GM for the design.
- Tankage Module: Calculates required tankage volumes based on fuel weight and parametric equations. The module uses a number of input variables including specific volumes for the fluids, fuel weight, ballast type, specific fuel consumption from engines, total power at endurance speed and electric load. All fuel tankage calculations are based on DDS 200-1 requirements. Outputs for the tankage module include required tankage volumes and endurance range.
- Space Required Module: Calculates required and available areas for deckhouse and total ship using parametric equations. Required inputs include beam, hull volume, tankage volume, average deck height and crew size.
The SSSM also uses the Multi-Objective Optimizer to search the design space for optimal designs. Having all of the components of the model coded in a FORTRAN script wrapper significantly decreases the run time of the model to converge on a non-dominated frontier. In the ASSET model a design would take 4-5 minutes to complete. The SSSM can complete a design in less than 10 seconds. Results are very comparable to ASSET. By implementing this model we have also by-passed the problems with the ASSET model and the optimization runs consistently without error.
Figure 16 - Simplified Ship Synthesis Model
RESULTS AND DISCUSSION To further investigate the findings and conclusions of the Alternative Propulsion Study, and contrast results with those obtained using our automated approach, a CGXBMD case study was completed using the following data-collection approaches: • SSSM MOGO - A multi-objective optimization using the Simplified Ship Synthesis Model
(SSSM) and Fuel Calculator to find a set of non-dominated Medium-sized surface combatant (MSC) designs. This optimization was run with the full set of design variables defining the design space (Table 1).
• SSSM MOGO DDG Parent Only - A multi-objective optimization using the Simplified Ship Synthesis Model (SSSM) and Fuel Calculator to find a set of non-dominated Medium-sized surface combatant designs. The design space was limited to the DDG-51 parent hullform without the modified-repeat DDG-1000. This optimization was run primarily for comparison to the ASSET MOGO DDG Parent optimization (next).
• ASSET MOGO DDG Parent Only - A multi-objective optimization using ASSET and the simplified Fuel Calculator. The design space was limited to the DDG-51 parent hullform without considering the modified-repeat DDG-1000 hullform alternative. It is intended to demonstrate the results of linking Model Center with ASSET, but was limited in scope due to ASSET run-time.
MOGO Results As the multi-objective optimization is run in Model Center, searching for non-dominated designs, the data for each design assessed in the search is collected. The data is generated by the various modules discussed in the previous section. The optimization presented here assessed 8,841 designs while searching for non-dominated designs. Of these designs, there were many non-feasible designs. These designs either did not converge or they did not meet weight/displacement, area, volume, power, speed or other operational requirements and thresholds specified in the study.
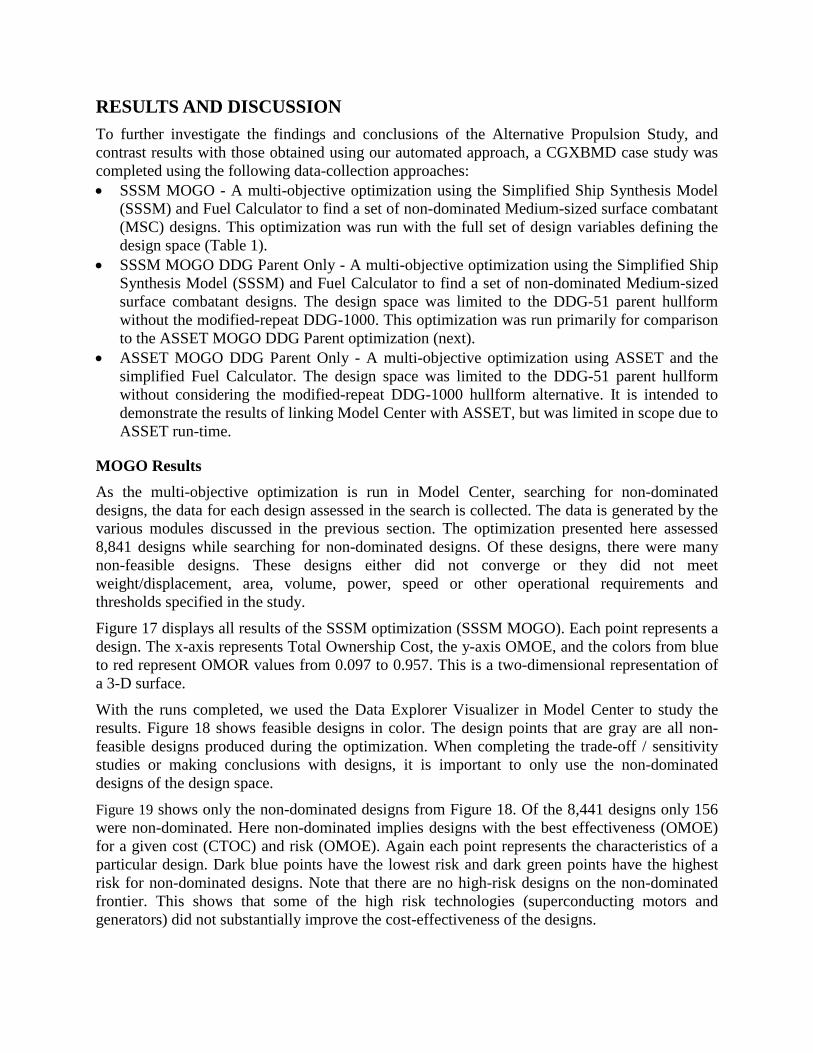
Figure 17 displays all results of the SSSM optimization (SSSM MOGO). Each point represents a design. The x-axis represents Total Ownership Cost, the y-axis OMOE, and the colors from blue to red represent OMOR values from 0.097 to 0.957. This is a two-dimensional representation of a 3-D surface.
With the runs completed, we used the Data Explorer Visualizer in Model Center to study the results. Figure 18 shows feasible designs in color. The design points that are gray are all non-feasible designs produced during the optimization. When completing the trade-off / sensitivity studies or making conclusions with designs, it is important to only use the non-dominated designs of the design space.
Figure 19 shows only the non-dominated designs from Figure 18. Of the 8,441 designs only 156 were non-dominated. Here non-dominated implies designs with the best effectiveness (OMOE) for a given cost (CTOC) and risk (OMOE). Again each point represents the characteristics of a particular design. Dark blue points have the lowest risk and dark green points have the highest risk for non-dominated designs. Note that there are no high-risk designs on the non-dominated frontier. This shows that some of the high risk technologies (superconducting motors and generators) did not substantially improve the cost-effectiveness of the designs.
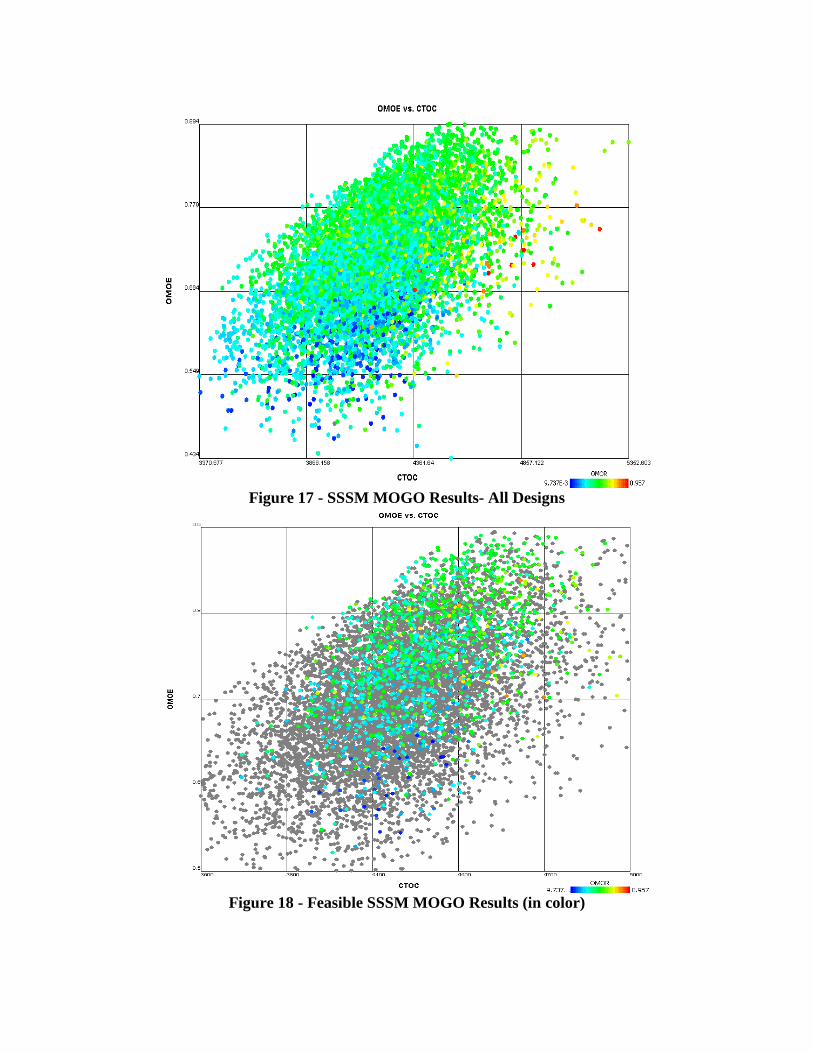
Figure 17 - SSSM MOGO Results- All Designs
Figure 18 - Feasible SSSM MOGO Results (in color)
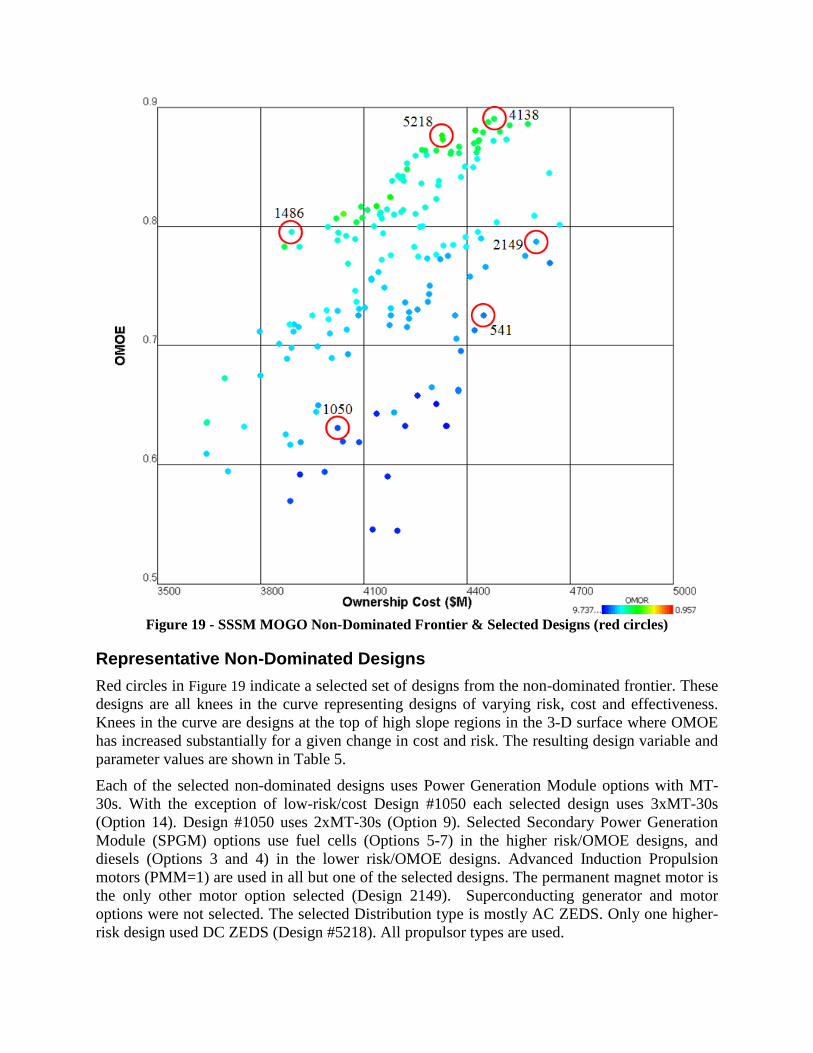
Figure 19 - SSSM MOGO Non-Dominated Frontier & Selected Designs (red circles)
Representative Non-Dominated Designs Red circles in Figure 19 indicate a selected set of designs from the non-dominated frontier. These designs are all knees in the curve representing designs of varying risk, cost and effectiveness. Knees in the curve are designs at the top of high slope regions in the 3-D surface where OMOE has increased substantially for a given change in cost and risk. The resulting design variable and parameter values are shown in Table 5.
Each of the selected non-dominated designs uses Power Generation Module options with MT-30s. With the exception of low-risk/cost Design #1050 each selected design uses 3xMT-30s (Option 14). Design #1050 uses 2xMT-30s (Option 9). Selected Secondary Power Generation Module (SPGM) options use fuel cells (Options 5-7) in the higher risk/OMOE designs, and diesels (Options 3 and 4) in the lower risk/OMOE designs. Advanced Induction Propulsion motors (PMM=1) are used in all but one of the selected designs. The permanent magnet motor is the only other motor option selected (Design 2149). Superconducting generator and motor options were not selected. The selected Distribution type is mostly AC ZEDS. Only one higher-risk design used DC ZEDS (Design #5218). All propulsor types are used.
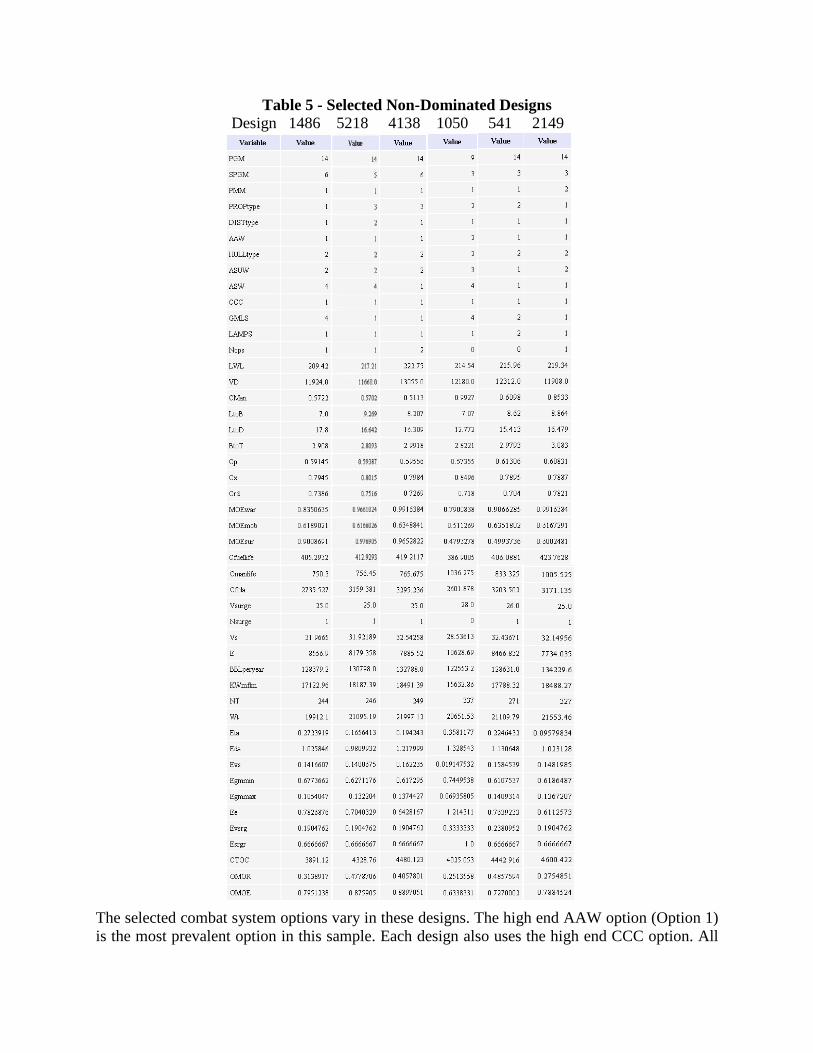
Table 5 - Selected Non-Dominated Designs Design 1486 5218 4138 1050 541 2149
The selected combat system options vary in these designs. The high end AAW option (Option 1) is the most prevalent option in this sample. Each design also uses the high end CCC option. All
but one design uses the high end LAMPS option with hangar supporting embarked helicopters. Higher risk designs use the most automation keeping total manning fewer than 250.
Each selected design also uses a modified repeat DDG-1000 notional WPTH hull form with parallel midbody rather than the 10 degree flared hull form (DDG-51 parent) option. Reductions in cost and risk in the modified repeat design greatly favor this hullform. Selected designs have a length between 209 and 222 meters. The deckhouse volumes are all optimized to values close to the DDG-1000 deckhouse volume. The optimized values range from 11,600 to 13,000 cubic meters.
Except for the design with 2xMT-30 (Design #1050), all selected designs have a sustained speed above 30 knots. 28 knots is the threshold. Design #1050 is a very fuel efficient design, and the only design with zero Surge Refuels and a Surge Speed almost equal to its’ Sustained Speed.
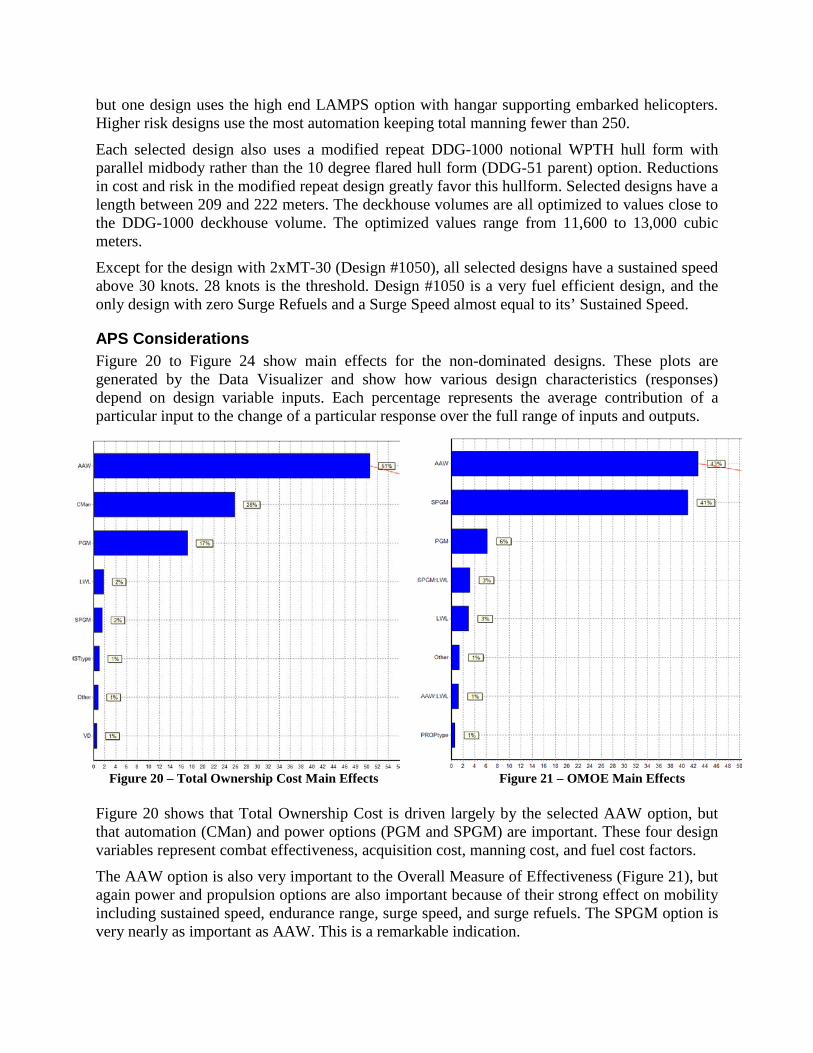
APS Considerations Figure 20 to Figure 24 show main effects for the non-dominated designs. These plots are generated by the Data Visualizer and show how various design characteristics (responses) depend on design variable inputs. Each percentage represents the average contribution of a particular input to the change of a particular response over the full range of inputs and outputs.
Figure 20 – Total Ownership Cost Main Effects Figure 21 – OMOE Main Effects Figure 20 shows that Total Ownership Cost is driven largely by the selected AAW option, but that automation (CMan) and power options (PGM and SPGM) are important. These four design variables represent combat effectiveness, acquisition cost, manning cost, and fuel cost factors.
The AAW option is also very important to the Overall Measure of Effectiveness (Figure 21), but again power and propulsion options are also important because of their strong effect on mobility including sustained speed, endurance range, surge speed, and surge refuels. The SPGM option is very nearly as important as AAW. This is a remarkable indication.
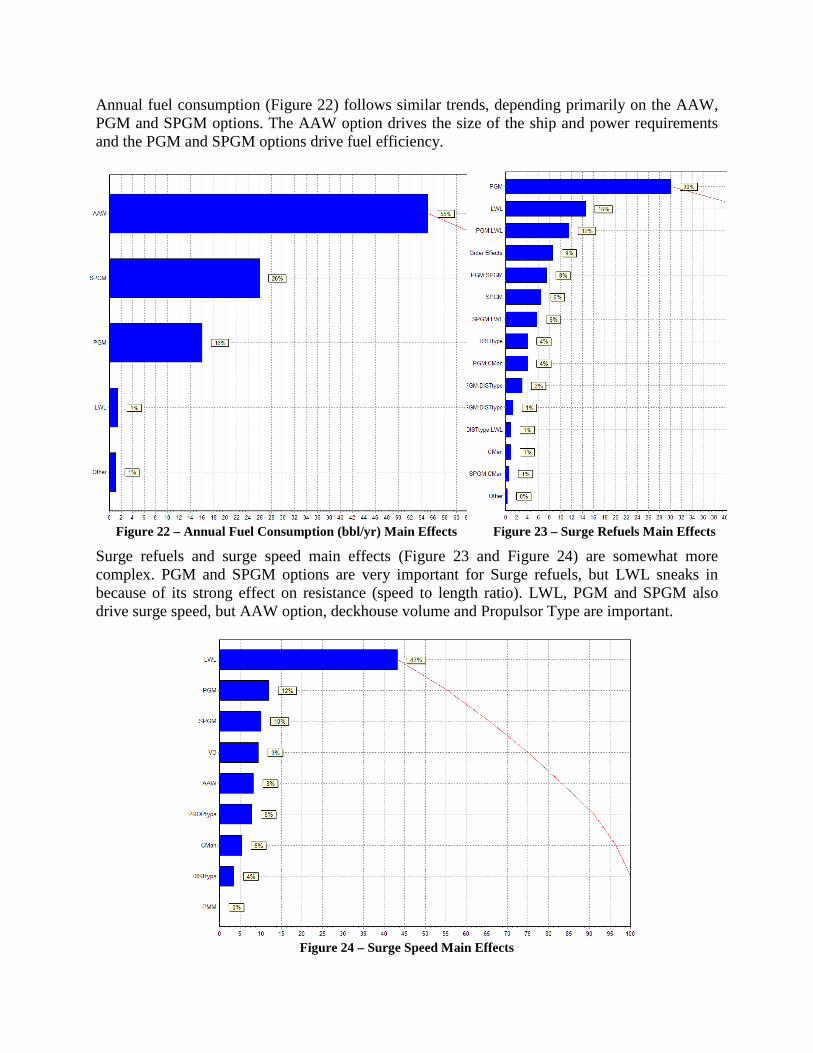
Annual fuel consumption (Figure 22) follows similar trends, depending primarily on the AAW, PGM and SPGM options. The AAW option drives the size of the ship and power requirements and the PGM and SPGM options drive fuel efficiency.
Figure 22 – Annual Fuel Consumption (bbl/yr) Main Effects Figure 23 – Surge Refuels Main Effects
Surge refuels and surge speed main effects (Figure 23 and Figure 24) are somewhat more complex. PGM and SPGM options are very important for Surge refuels, but LWL sneaks in because of its strong effect on resistance (speed to length ratio). LWL, PGM and SPGM also drive surge speed, but AAW option, deckhouse volume and Propulsor Type are important.
Figure 24 – Surge Speed Main Effects
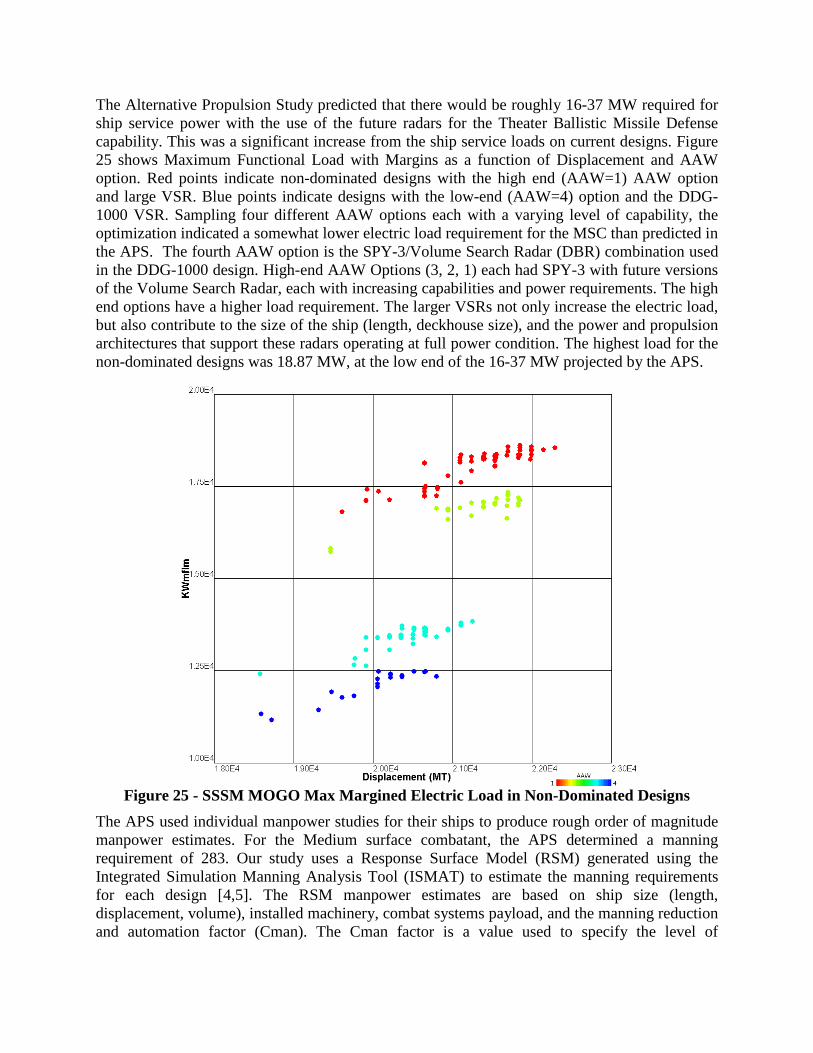
The Alternative Propulsion Study predicted that there would be roughly 16-37 MW required for ship service power with the use of the future radars for the Theater Ballistic Missile Defense capability. This was a significant increase from the ship service loads on current designs. Figure 25 shows Maximum Functional Load with Margins as a function of Displacement and AAW option. Red points indicate non-dominated designs with the high end (AAW=1) AAW option and large VSR. Blue points indicate designs with the low-end (AAW=4) option and the DDG-1000 VSR. Sampling four different AAW options each with a varying level of capability, the optimization indicated a somewhat lower electric load requirement for the MSC than predicted in the APS. The fourth AAW option is the SPY-3/Volume Search Radar (DBR) combination used in the DDG-1000 design. High-end AAW Options (3, 2, 1) each had SPY-3 with future versions of the Volume Search Radar, each with increasing capabilities and power requirements. The high end options have a higher load requirement. The larger VSRs not only increase the electric load, but also contribute to the size of the ship (length, deckhouse size), and the power and propulsion architectures that support these radars operating at full power condition. The highest load for the non-dominated designs was 18.87 MW, at the low end of the 16-37 MW projected by the APS.
Figure 25 - SSSM MOGO Max Margined Electric Load in Non-Dominated Designs
The APS used individual manpower studies for their ships to produce rough order of magnitude manpower estimates. For the Medium surface combatant, the APS determined a manning requirement of 283. Our study uses a Response Surface Model (RSM) generated using the Integrated Simulation Manning Analysis Tool (ISMAT) to estimate the manning requirements for each design [4,5]. The RSM manpower estimates are based on ship size (length, displacement, volume), installed machinery, combat systems payload, and the manning reduction and automation factor (Cman). The Cman factor is a value used to specify the level of
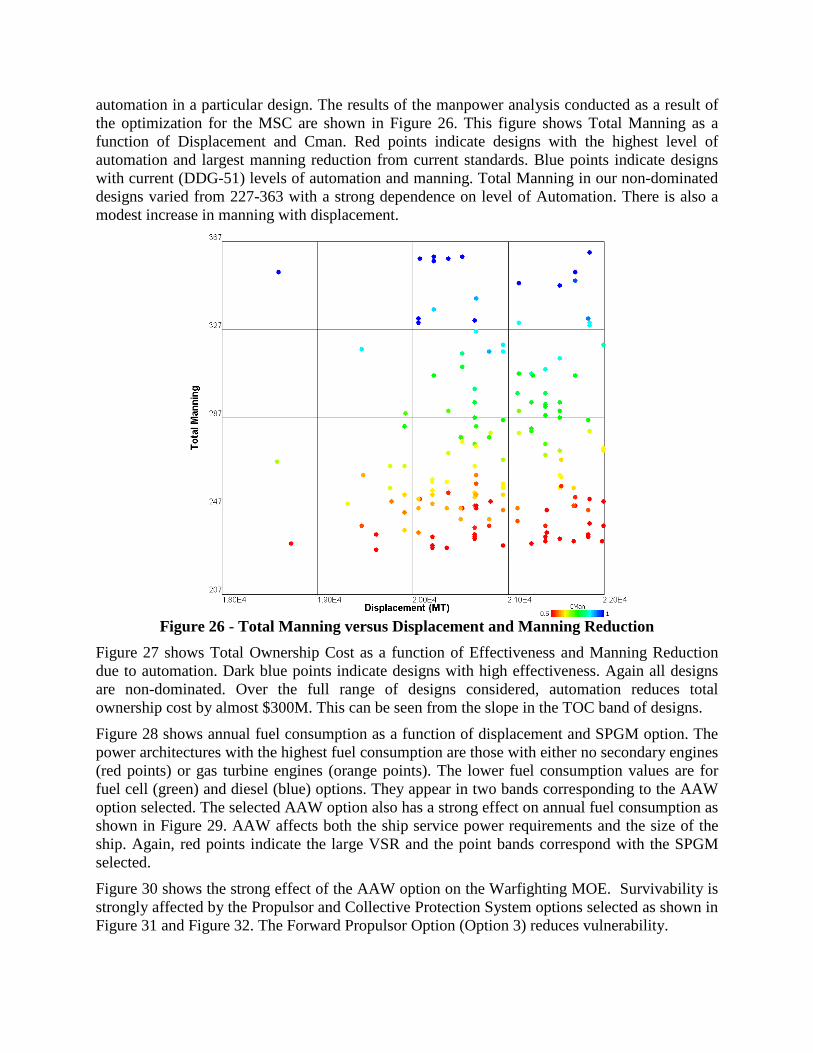
automation in a particular design. The results of the manpower analysis conducted as a result of the optimization for the MSC are shown in Figure 26. This figure shows Total Manning as a function of Displacement and Cman. Red points indicate designs with the highest level of automation and largest manning reduction from current standards. Blue points indicate designs with current (DDG-51) levels of automation and manning. Total Manning in our non-dominated designs varied from 227-363 with a strong dependence on level of Automation. There is also a modest increase in manning with displacement.
Figure 26 - Total Manning versus Displacement and Manning Reduction
Figure 27 shows Total Ownership Cost as a function of Effectiveness and Manning Reduction due to automation. Dark blue points indicate designs with high effectiveness. Again all designs are non-dominated. Over the full range of designs considered, automation reduces total ownership cost by almost $300M. This can be seen from the slope in the TOC band of designs.
Figure 28 shows annual fuel consumption as a function of displacement and SPGM option. The power architectures with the highest fuel consumption are those with either no secondary engines (red points) or gas turbine engines (orange points). The lower fuel consumption values are for fuel cell (green) and diesel (blue) options. They appear in two bands corresponding to the AAW option selected. The selected AAW option also has a strong effect on annual fuel consumption as shown in Figure 29. AAW affects both the ship service power requirements and the size of the ship. Again, red points indicate the large VSR and the point bands correspond with the SPGM selected.
Figure 30 shows the strong effect of the AAW option on the Warfighting MOE. Survivability is strongly affected by the Propulsor and Collective Protection System options selected as shown in Figure 31 and Figure 32. The Forward Propulsor Option (Option 3) reduces vulnerability.
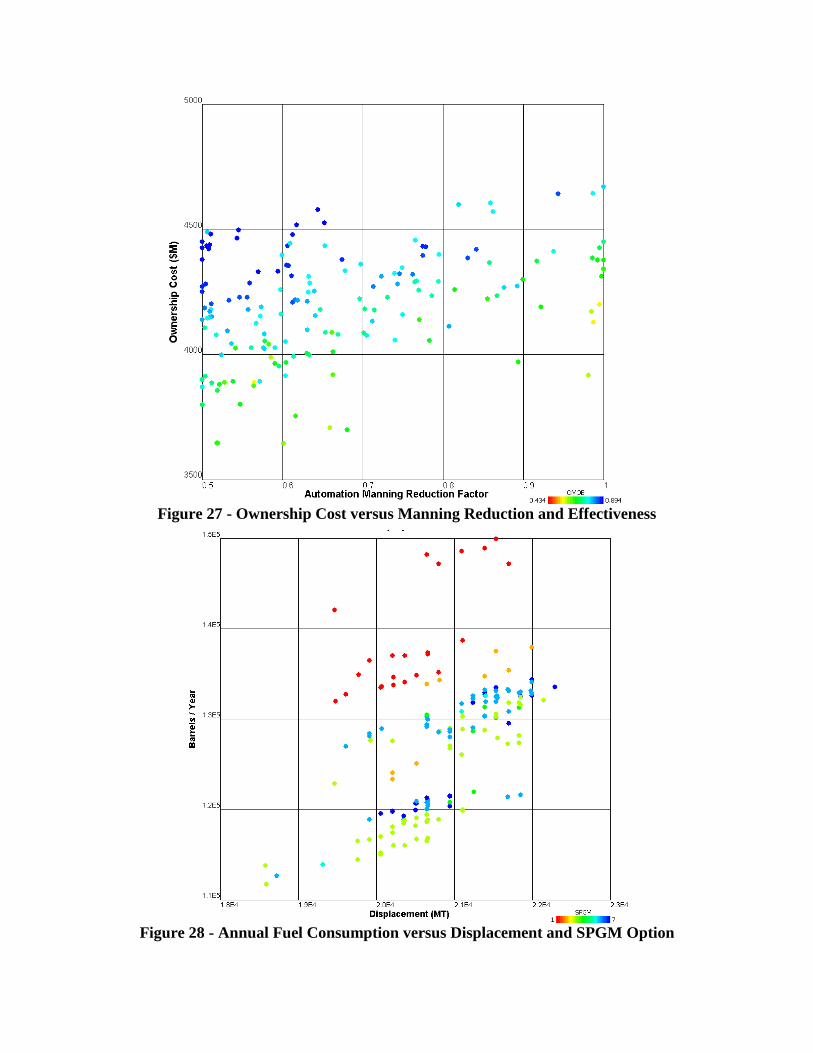
Figure 27 - Ownership Cost versus Manning Reduction and Effectiveness
Figure 28 - Annual Fuel Consumption versus Displacement and SPGM Option
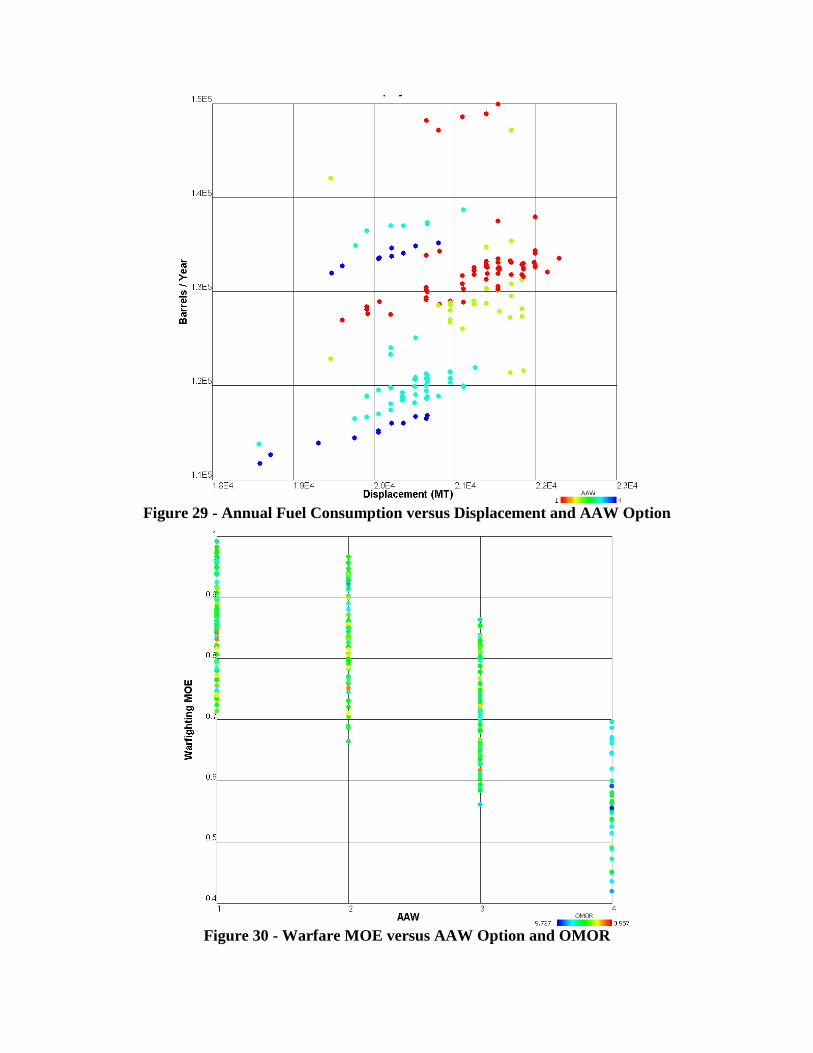
Figure 29 - Annual Fuel Consumption versus Displacement and AAW Option
Figure 30 - Warfare MOE versus AAW Option and OMOR
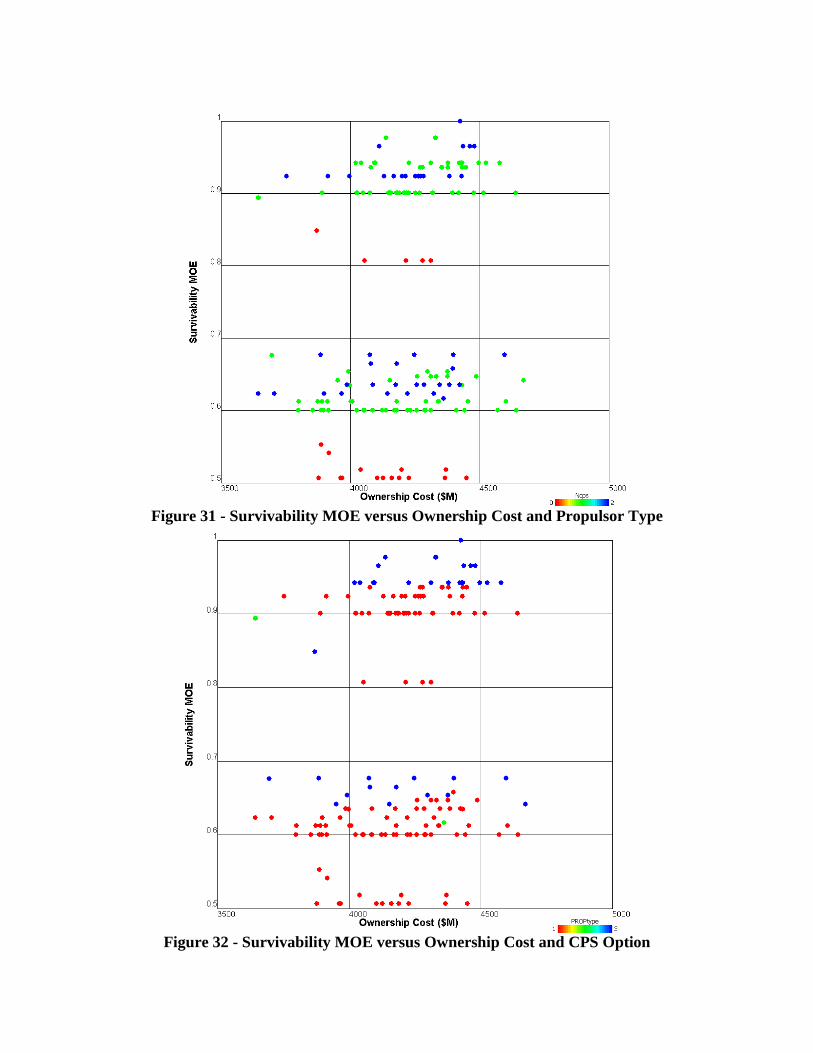
Figure 31 - Survivability MOE versus Ownership Cost and Propulsor Type
Figure 32 - Survivability MOE versus Ownership Cost and CPS Option
CONCLUSIONS The automated concept study process and tools presented in this paper provide a rational and thorough method to search design space for non-dominated concepts. These non-dominated concepts represent the best basis for assessing technologies over a range of possibilities considering effectiveness, cost and risk.
The Simplified Synthesis Model with Fuel Calculator functioned reliably and quickly when coupled with the Darwin Genetic Optimizer. 9000 designs were assessed in less than 12 hours in an efficient, exponentially converging search of the design space. The non-dominated frontier is well-populated, and spread over the full range of the design space. Results are complete and reasonable. Conclusions can be drawn from this data with confidence. Model Center optimization and visualization tools are useful and effective for decision making given this data.
The ASSET interface with Model Center is operational, but it is very slow and not robust. Generation of just a few hundred designs can take more than 24 hours. Because ASSET attempts to balance each of these designs, the assessed designs are more frequently feasible than in the genetic search and this somewhat reduces the impact of long run times. ASSET provides more detail in its results including 3D geometry, subdivision, structures and machinery arrangements which could be used to perform a more correct and thorough vulnerability analysis. ASSET lacks its own cost model and manning model.
The CGXBMD case study performed for this paper represents a much more thorough examination of the future MSC design space than can be accomplished with a few good point designs. It is essential in such a study that only non-dominated designs are considered and that necessary metrics be established to properly consider cost, effectiveness and risk. Based on the SSSM optimization the following conclusions can be drawn related to Alternative Propulsion Study issues:
• A modified-repeat DDG-1000 hullform with parallel midbody is consistently more cost effective than a new design despite its seakeeping risk because of the modified-repeat cost savings. All hull types in Table 5 and most of the non-dominated designs use the DDG-1000 hullform (HULLtype=2). Parallel midbody in non-dominated designs for the CGXBMD case study ranged from 26-39 meters.
• Given the current technology performance predicted for superconducting generators and motors and the high level of risk, this technology does not currently provide sufficient efficiency advantages in a total ship design to overcome, weight, volume, cost and risk considerations. There are no non-dominated high-risk SC designs (Figure 19 and Table 5).
• The combination of primary power generation (2 or 3 MT30s) and fuel-efficient secondary power generation (fuel cells or diesels) are extremely effective and important in providing life-cycle cost-effective performance to reduce fuel consumption, improve sustained speed, surge speed and reduce surge refuels. Most non-dominated designs and all selected designs shown in Table 5 and Figure 19 use 2 or 3 MT30s. Figure 28 and Table 5 show the importance of the SPGM selection on fuel efficiency and surge.
• Rational combat, power, auxiliary and damage control system automation, as modeled using ISMAT for this paper, has the potential to reduce MSC life cycle cost by $300-350M with crew sizes in higher risk designs less than 250, in most cases a reduction of almost 50 percent from today’s levels. This reduction is achieved considering the performance, cost, risk and total ship impact of automation. (Figure 26 and Figure 27)
• The Forward Propulsor Unit has the potential to greatly improve ship vulnerability when developed and can operate effectively as part of an IPS. (Figure 31)
Most of these findings were consistent with the APS, but this process provides a much more robust, complete and rational basis for conclusions.
Future Work The following future work is considered a valuable continuation of the process presented in this paper: • Validate the SSSM implemented in Model Center as a preliminary tool for screening design
variables, identifying an initial non-dominated population, selecting system options, and setting initial key performance and cost requirements.
• Continue to develop the ASSET/LEAPS/Model Center interface. • Develop and perform a multi-stage evolutionary optimization process starting with the SSSM
and moving to the ASSET/LEAPS environment including system architecture, survivability, and reliability considerations in an evolving environment optimization. This would include an evolving population product model.
• Incorporate modeling, cost and performance uncertainty in the optimization process to identify robust designs with acceptable probabilities of success.
REFERENCES [1] NAVSEA Concept Study Report, “US Navy Report Alternative Propulsion Methods for Surface
Combatants and Amphibious Warfare Ships”, March 2007. [2] Webster, J., Fireman, H., Allen, D., Mackenna, A.J., Hootman, J.C., “Alternative Propulsion
Methods for Surface Combatants and Amphibious Warfare Ships”, SNAME Annual Meeting, 2007.
[3] NSWCCD, Advanced Ship & Submarine Evaluation Tool (ASSET), “ASSET Help”, Version 5.3. [4] Scofield, T., “Manning and Automation Model for Naval Ship Analysis and Optimization”, MS
Thesis, Virginia Polytechnic and State University, May 2006. [5] Scofield, T., Brown, A.J., “Manning and Automation Model for Naval Ship Analysis and
Optimization”, ASNE Human Systems Integration Symposium, Philadelphia, PA, March 2007. [6] Brown A.J., Salcedo J., “Multiple Objective Genetic Optimization In Naval Ship Design”, Naval
Engineers Journal, Vol.115, No.4, pp. 49-61, Fall 2003. [7] Brown A.J., “Ship Design Lecture Notes”, Virginia Tech AOE Department, 2007. [8] Brown A.J., Thomas M, “Reengineering the Naval Ship Concept Design Process”, From Research
to Reality in Ship Systems Engineering Symposium, ASNE, September 1998. [9] Stepanchick, J., Brown, A.J., “Revisiting DDGX/DDG-51 Concept Exploration”, Naval
Engineers Journal, Vol. 119, No. 3, 67-88, 2007. [10] Demko, D., “Tools for Multi-Objective and Multi-Disciplinary Optimization in Naval Ship
Design”, MS Thesis, Virginia Polytechnic and State University, May 2005. [11] Brown, A.J., Barentine, J., "The Impact of Producibility on Cost and Performance in Naval
Combatant Design", paper presented to NE Section of SNAME, November, 1996. [12] Mierzwicki, T., Brown, A.J., “Risk Metric for Multi-Objective Design of Naval Ships”, Naval
Engineers Journal, Vol. 116, No. 2, pp 55-71, 2004. [13] Phoenix Integration, MODEL CENTER “Model Center help”, version 7.1. [14] Neti, S., “Ship Design Optimization Using ASSET”, MS Thesis, Virginia Polytechnic and State
University, February 2005.
1) 1st Contact:
Dr. Alan Brown NAVSEA Professor of Ship Design CAPT USN(ret) Department of Aerospace and Ocean Engineering 215 Randolph Hall Virginia Polytechnic Institute and State University Blacksburg, VA 24061 (540) 231-4950 Fax (540) 231-9632 email: [email protected] http//www.aoe.vt.edu/
Dr. Alan Brown, Capt USN (ret) is currently NAVSEA Professor of Naval Ship Design, Department of Aeronautics and Ocean Engineering, Virginia Tech. He was Professor of Naval Architecture, and directed the Naval Construction and Engineering Program at MIT from 1993 to 1997. As an Engineering Duty Officer he served in ships, fleet staffs, shipyards, NAVSEA and OPNAV. While at MIT and since retirement he served as technical advisor to US delegations at the International Maritime Organization (IMO) in tanker design, oil outflow, intact stability, damaged stability and tanker risk. His current research is in naval ship design, survivability and underwater explosion effects. He is past-chairman of the SNAME Ad Hoc Panel on Structural Design and Response in Collision and Grounding. He is a member of the SNAME Ship Design Committee and SNAME Panel O-44, Marine Safety and Pollution Prevention. He served as Northeast Regional Vice President of SNAME, as a member of the ASNE Council and is a Past Chairman of the New England Section of SNAME. He received a PhD, Marine Engineering, 1986; MS, Ocean Engineering, 1973; MS, Shipping and Shipbuilding Management, 1973; BS, Naval Architecture and Marine Engineering, 1971; all from MIT. He is a professional mechanical engineer registered in the State of California.
2) 2nd Contact
LT Justin Strock Graduate Student Department of Aerospace and Ocean Engineering 215 Randolph Hall Virginia Polytechnic Institute and State University Blacksburg, VA 24061 email: [email protected]
Justin Strock graduated from the United States Merchant Marine Academy with a BS is Marine Engineering and was commissioned an Ensign in the United States Coast Guard in 2004. His first assignment was to the USCGC VENTUROUS (WMEC 625) in St. Petersburg, FL as the Damage Control Assistant and Assistant Engineer Officer. He recently graduated with an MS in Ocean Engineering from Virginia Tech.