Embed Size (px)
Citation preview
METHODS MANUAL FOR FOREST SOIL AND
PLANT ANALYSIS
Y.P. Kalra and D.C. Maynard
INFORMATION REPORT NOR-X-319
FORESTRY CANADA NORTHWEST REGION
NORTHERN FORESTRY CENTRE 1991
ii
© Minister of Supply and Services Canada 1991, reprinted 1994 Catalogue No. Fo46-12/319E
ISBN 0-662-18665-6 ISSN 0704-7673
This publication is available at no charge from: Natural Resources Canada
Canadian Forest Service Northwest Region
NortheJ:Il Forestry Centre 5320 � 122 Street
Edmonton, Alberta T6H 3S5
A microfiche edition of this publication may be purchased from: Micromedia Ltd. Place du Portage
165, Hotel-de-Ville Hull, Quebec
J8X 3X2
Printed in Canada
CeUe publication est egalement disponible en fran�ais sous Ie titre Methodes d' analyse des sols jarestiers et des tissus vegetaux.
®. This report has been printed on recycled paper.
In! Rep. NOR-X·319
Kalra, Y.P.; Maynard, D.G. 1991. Methods manual for forest soil and plant analysis. For. Can., Northwest Reg., North. For. Cent., Edmonton, Alberta. Inf. Rep. NOR-X-319.
ABSTRACT
This manual is a compilation of methods used for soil and plant analysis at the Analytical Services Laboratory of the Northern Forestry Centre (NoFC) of Forestry Canada's Northwest Region. The intent of this manual is not so much to recommend certain procedures over others, but to indicate methods used in our laboratory, why these methods are used, their expected precision and accuracy, and their strengths and weaknesses.
RESUME
Sont reunies dans Ie present guide les methodes utilisees pour l'analyse des plantes et des sols au Laboratoire des services d' analyse du Centre de foresterie du Nord de Forets Canada (region du Nord-Ouest). L' objectif de ce guide n' est pas tant de recommander certaines methodes de preference a d'autres, mais d'indiquer celles qui sont utilisees dans notre laboratorre, la raison de leur utilisation, I' exactitude et la precision que I' on peut attendre de leurs resultats, leurs points forts et leurs points faibles.
/nf. Rep. NOR-X-3/9 iii

iv In! Rep. NOR-X-319
CONTENTS
INTRODUCTION ... . . .
GENERAL PRINCIPLES . . 1. Laboratory Safety ... . . . . . . . . . . 2. Quality Assurance of Analytical Data ... .
Quality Control and Assessment Procedures . 3. Analytical Techniques ... . ...... . . . . .
(i) Atomic Absorption Spectrophotometry . . . . . . . . . . . . . (ii) Continuous Flow AnalYSis . . . . . . . . . . . . . . . . . . . . .
(iii) Ion Chromatography . . . . . . . . . . . . . . . . . . . . . . . . (iv) Inductively Coupled Plasma- Atomic Emission Spectroscopy
SOIL ANALYSIS. . . . . . . . . . . .
1
2 2 5 5 9 9
10 13 14
17 4. Preparation . . . . . . . . . . . . . . . . . . . . . 17 5 . Moisture. . . . . . . . . . . . . . . . . . . . . . . . . . . 19
(i) Moisture Content . . . . . . . . . . . . . . . . . . . . . 19 (ii) Moisture Retention Curve at 0--1500 kPa Pressure . . . . 21
6. Organic Matter And Organic Carbon . . . . . . . . . . . . . . . . 25 (i) Direct Estimation of Organic Matter by Loss-on-Ignition 25
(ii) Organic Carbon by Wet Digestion. . . . . . . . . . . . . . . 27 7. pH in Water or CaCI, . . . . . . . . . . . . . . . . . . . . . . . . . . 30
(i) pH of Saturated Paste . . . . . . . . . . . . . . . . . . . . . . . . 30 (ii) pH of Soil-to-Solution Ratio of 1:2 Using CaCl, Solution or
H,O as the Suspension Medium . . . . . . . . . . . . . . . 31 (iii) pH of Field-moist Organic Samples . . . . . . . . 31
8. Electrical Conductivity And Soluble Salts . . . . . . . . 35 (i) Saturation Extract Method for EC . . . . . . . . . . . . 35
(ti) 1:2 Soil-to-Water Extraction Method for EC 37 (iii) 1 :5 Soil-to-Water Extraction Method for EC 37 (iv) Soluble Individual Ions . . . . . . . . . . . . . . . 38
9. Particle-size Analysis . . . . . . . . . . . . . . . . . . . . . . . . 42 (i) Bouyoucos Hydrometer Method . . . . . . . . . . . . . 42
(ti) Pipet Method. . . . . . . . . . . . . . . . . . . . . . . . . . . . . 46 10. Carbonates: Calcite And Dolomite . . . . . . . . . . . . . . . . . . . . 54 11. Nitrogen. . . . . . . . . . . . . . . . . . . . . . . . . . . . . . . . . . . . 5 7
(i) Total Nitrogen . . . . . . . . . . . . . . . . . . . . . . . . . . . . 57 (ti) Extraction of NH,-N and N03-N with 2 M KCl . . . . . . . . . 62
(iii) Determination of NH,-N in 2 M KCl Extracts by Autoanalyzer 63 (iv) Determination of N03-N in 2 M KCI Extracts by Autoanalyzer 66 (v) Extraction of N03-N with 0.01 M CuSO, and Manual
Determination Colorimetrically ...... . . . . . . . . . 68 12. Mixed Acid Oigestion For Total Elements In Soils . . . . . . . . . 71 13. Easily Extractable Phosphorus . . . . . . . . . . . . . . . . . . . . . . . 74
(i) Bray 1 Procedure .. . .... . .. . .. . . . . . . .. . . . . . 74 (ti) Olsen Method . . . . . . . . . . . . . . . . . . . . . . . 77
14. Sulfate and Total Extractable Sulfur . . . . . . . . . . . . . . . . . . . . 79 (i) Organic Soils . . . . . . . . . . . . . . . . . . . . . . . . . . . . . 79
(ii) Mineral Soils . . . . . . . . . . . . . . . . . . . . . . . . . . . . . 82 15. Cation Exchange Capacity And Exchangeable Cations . . . . . . . . . 84
(i) Manual Leaching Method Using Vacuum Extraction. . . . . . 84 (ii) Automatic Extraction Procedure . . .. . . . . . . . . . . . . . 86
1 6. Pyrophosphate Extractable Al and Fe . . . . . . . . . . . . . . . . . . . 94
Inf Rep. NOR-X-319 v
vi
PLANT ANALYSIS . . . . . . . . . . . . . .... . . . 17. Preparation . . . . . . . . . . . . . . . . . . . . . . . . . . . . . . . . . 18. Total Nitrogen . . . . . . .. . .. . . . . . . . . . . . . . . . . . 19. Microwave Digestion For Ca, Mg, K, Na, Mn, Fe, AI, P, and S . 20. Dry Ashing for Ca, Mg, K, P, Cu, Na, Ni, Zn, Mn, Fe, and AI . 21. Chloride . . . . . . . . . . . . . . . . . . . . . . . . . . . . . 22. Total P . . . . . . . . . . . . . . . . . . . . . . . . . . . . . . 23. Inorganic Sulfate-Sulfur . . . . . . . . . . . . . . . . . . . .
97 97 98 98
101 103 106 108
APPENDIXES
1. Common Commercial Concentrations of Acids and Ammonium Hydroxide.. 111
2. Reporting of Analytical Data . . ' . . . . . . . . . . . . 112
3. Bulk Density . . . . . . . . . . . . . . . . . . . . . . 113
4. Plant-available Micronutrients in Soils and Total Elements in Foliage . . 114
FIGURES
9-1. Textural triangle . . . . . . . . . . . . . . _ . _ . . . . . . . . . . . . . . 52
11- 1. Flow diagram for the determination ofNH,-N for TKN in soil digests 61
11-2. Flow diagram for the determination of NH,-N in 2 M KCl extracts by autoanalyzer . . . . . . . . . . . _ . . . . . . . . . . . . _ . . . . . . . 65
11-3. Flow diagram for the determination of N03-N in KCl extracts by cadmium reduction . . . . . . . . . _ . . _ . _ . . . . _ . . _ . 67
15-1. Mechanical vacuum extractor . . . . . . . . . . 87
15- 2. Flow diagram for the determination of NH,-N in NaCl leachates (for CEC determination) by autoanalyzer _ . . . . . . _ . . . . . . . . . 90
TABLES
3-1. Wavelengths, concentration ranges, and detection limits of various elements in ARL 3560 ICP instrument . _ . . . _ . . . . . . . . . _ . . . 16
8- 1. Specific conductivity values of 0.01 M KCl solution _ . . . . . . . . . . 35
In! Rep. NOR-X-319
B-2. Factors for converting conductivity values to 2 5°C . . . . 36
9-1. Settling time for 0.002 -mm clay at various temperatures. 48
9-2 . Sieve opening versus meshes per inch . . . . . . . . . . . 49
9-3. Precision and accuracy data for the hydrometer method 52
9-4. Precision and accuracy data for the pipet method . . . . 53
12-1. Results obtained on Canada Soil Survey Committee 7 and 8 soil samples . . . . . . . . . . . . . . . . . . . . . . . . . . . . . . . . . . 73
12-2 . Results obtained on a National Institute of Standards and Technology SRM 1646 estuarine sediment sample . . . . . . . . . . . . . . . . . 74
14-1. Mean, standard deviation, and coefficient of variation of the SO ,-S concentrations in the surface organic horizons . . . . . . . . . . . . 81
14-2 . Mean, standard deviation, and coefficient of variation of the total extractable S concentrations in the surface organic horizons . . . 82
15-1. CEC by different methods of determining NH,-N in Canada Soil Survey Committee samples . . . . . . . . . . . . . . . . . . . . . . 90
15-2. CEC results obtained at NoFC compared to the Expert Committee on Soil Survey data . . . . . . . . . . . . . . . . . . . . . . . . 91
15-3. CEC results obtained at NoFC compared to the LABEX data 92
15-4. Precision and accuracy data (manual leaching with NH.oAc, pH 7.0 and distillation procedure) . . . . . . . . . . . . 92
15- 5. Precision data (mechanical vacuum extractor) 93
19-1. Results obtained by microwave digestion method compared with National Institute of Standards and Technology (NIST) values . 101
2 1-1. Precision for various ranges of Cl concentration . . . . . . . . . 105
NOTE
The exclusion of certain manufactured products does not necessarily imply disapproval nor does the mention of other products necessarily
imply endorsement by Forestry Canada.
There are hazards associated with some of the methods outlined in this manual. This manual is to be used in correlation with the Workplace Hazardous Materials
Information System (WHMIS) Employee Handbook. Forestry Canada assumes no responsibility for losses or damages due to negligence or otherwise.
Inf. Rep. NOR-X-319 vii

viii Inj Rep. NOR-X-319
INTRODUCTION
Analysis of soil and plant material has been used extensively in agriculture to assess the ability of soil to provide adequate nutrition for crops. Over the years, soil and plant analysis has developed and is now routinely used to characterize forest ecosystems. Unfortunately, many analytical techniques developed for agricultural purposes have been applied indiscriminately to forest soils without proper assessment of their suitability. Of particular concern is the analysis of surface organic horizons. There are currently only a few reference manuals specifically for analysis of forest soils and vegetation (e.g., Heffernan 1985) .
This manual is a compilation of soil and plant analysis methods used in the Analytical Services Laboratory of the Northern Forestry Centre (NoFC) of Forestry Canada's Northwest Region and has been developed over the past 3-4 years. A previous NoFC manual (Kalra 1971) outlined the analyses carried out by the Analytical Services Laboratory at that time. Considerable changes and improvements have taken place since 1971, particularly in instrumentation, and this publication is a complete revision of the earlier manual. It provides an outline of principles involved, details of technique, apparatus required, and notes on each method indicating suitability for given circumstances. An important addition to this manual is the inclusion of quality control! quality assurance protocols and data on expected preCision and accuracy on various standard samples.
Many published reports fail to proVide adequate information on the details of the procedures used and information on the accuracy and precision of these techniques using standard reference material Gones, Jr. 1988). With increasing interest in intensive forest management practices and in environmental concerns, there is need for accurate and reliable data.
The intent of this manual is not so much to recommend certain procedures over others, but to indicate methods used in our laboratory and why these methods are used, and to outline their strengths and weaknesses. It is only a guide and reference should be made to original sources (provided at the end of each section) to assist in determining the appropriateness of a method to a given situation.
The specific objectives of this manual are:
1. to provide a reference to the users of the Analytical Services Laboratory of NoFC on the analysiS of forest soils and vegetation;
2. to provide clear and complete descriptions of methods used with specific details on the modifications that have been developed at NoFC; and
3. to provide data on accuracy and precision using standard reference materials, interlaboratory comparison results, and long-term results on laboratory samples.
The authors would like to thank various individuals for their contributions. The methods were tested by M.W. Ali, F.G. Radford, and J. Shuya. Valuable assistance was provided by summer students, particularly J. Crumbaugh, C. Dunn, and C. Koski. The authors also thank the reviewers from the analytical laboratories of forestry centers in the Newfoundland and Labrador Region, 51. John's; the Maritimes Region, Fredericton; the Quebec Region, Ste-Foy; the Ontario Region, Sault Ste. Marie; and the Pacific and Yukon Region, Victoria; the Petawawa
2
National Forestry Institute; A. Neary, Ontario Ministry of Environment; and LK. Edwards, Northern Forestry Centre. Support and encouragement from S5. Malhotra and S5. Sidhu were greatly appreciated. Word processing was done by Shamy Ratansi, editing by Gordon Turtle, typesetting by Elaine Schiewe, and graphics by Dennis Lee. Publishing coordination was done by Brenda Laishiey.
Forestry Canada's Group of Analytical Laboratories (GOAL) contributed funds toward the printing of this publication.
References
Heffernan, B. 1985. A handbook of methods of inorganic chemical analysis for forest soils, foliage and water. Commonw. Sci. Ind. Res. Organ. Div. For. Res., Canberra, Australia.
Jones, J.B., Jr. 1988. Comments on the accuracy of analytical data in the published scientific literature. Soil Sci. Soc. Am. J. 52:1203-1204.
Kalra, Y.P. 1971., Methods used for soil, plant, and water analysiS at the soils laboratory of the Manitoba-Saskatchewan region, 1967-1970. Environ. Can., Can. For. Serv., North. FOf. Res. Cent., Edmonton, Alberta. Inf. Rep. NOR-X-l1.
GENERAL PRINCIPLES
1 . LABORATORY SAFETY
The following points provide guidance to all laboratory workers in ensuring that analyses are performed safely.
L All employees must receive and understand safety instructions in the Workplace Hazardous Materials Information System (WHMIS) (Workers' Compensation Board of British Columbia 1988 ) . This system has been implemented in workplaces across Canada since October 31, 1988. Bill C-70 is the federal statute designed to implement the aspects of WHMIS that fall under federal jurisdiction (Queen's Printer 1987).
Chemicals should be stored according to color coding. WHMIS regulations supersede all other regulations for storage and compatibility. Oxidizing and reducing agents should not be stored together. Do not store chemicals in alphabetical order. Acids should not be stored with organic solutions.
WHMIS legislation requires that all chemicals be labeled. Read labels before opening a chemical container. Use workplace labels for all prepared reagents.
WHMIS also requires that there be a Material Safety Data Sheet (MSDS) for each chemicaL These sheets provide comprehensive information for hazardous chemicals.
2. Develop a positive attitude toward laboratory safety.
3. Observe normal laboratory safety practices.
4. Good housekeeping is extremely important. Maintain a safe, clean work environment.
In! Rep. NOR·X·319

5. Follow the safety precautions provided by the manufacturer when operating instrument�.
6. Monitor instruments while they are operating.
7. Get periodic physical examinations to help protect against insidious poisoning.
8. Avoid working alone. If you must work alone, have someone contact you periodically.
9. Learn what to do in case of emergencies (e.g., fire, chemical spill).
10. Learn emergency first aid.
11. Seek medical attention immediately if affected by chemicals and use first aid until medical aid is available.
12. Report all accidents and near-misses.
13. Access to eye-wash fountains and safety showers must not be blocked. Fountains and showers should be checked periodically for proper operation. (Safety showers are used for chemical spill or fire victims.)
14. Use forceps, tongs, or heat-resistant gloves to remove containers from hot ovens or muffle furnaces.
15. Do not eat, drink, or smoke in the laboratory. Smoking is prohibited by law.
16. Do not use laboratory glassware for eating or drinking. Do not use food containers to hold chemicals.
17. Do not store food in the laboratory.
18. All electrical, plumbing, and instrument maintenance work should be done by qualified personnel.
19. Routinely check for radiation leaks from microwave ovens using an electromagnetic monitor.
20. Use fume hoods when handling concentrated acids, bases, and other hazardous chemicals. Fume hoods should be checked routinely for operating efficiency. Do not use them for storage.
21. Muffle furnaces must be vented to the atmosphere.
22. Atomic absorption spectrophotometers must be vented to atmosphere. Ensure that the drain trap is filled with water prior to igniting the burner.
23. Use personal safety equipment as described below.
(i) Body protection: lab coat and chemical-resistant apron.
(ii) Hand protection: gloves, particularly when handling concentrated acids, bases, and other hazardous chemicals.
In! Rep. NOR·X·3I9 3
4
(iii) Dust mask: when grinding soil samples, etc.
(iv) Eye protection: safety glasses with side shields. Persons wearing contact lenses should always wear safety glasses in the laboratory. Make sure that your colleagues know that you wear contact lenses. Contact lenses should never be worn around corrosives.
(v) Full face shield: wear face shields over safety glasses in experiments involving corrosive chemicals.
(vi) Foot protection: proper footwear should be used. Sandals should not be worn in the laboratory.
24. Cylinders of compressed gases should be secured at all times.
25. Never open a centrifuge cover until machine stops completely.
26. Acids, hydroxides, and other liquid reagents should be in plastic-coated bottles and carried in rubber bottle carriers.
27. Do not pipet by mouth.
28. When diluting, always add acid to water, not water to acid.
29. Many metal salts are extremely toxic and may be fatal if swallowed. Wash hands thoroughly after handling such salts.
30. For chemicals cited for waste disposal. write down contents on the label.
31. Dispose of chipped or broken glassware in specially marked containers.
32. Extreme care is required when using perchloric acid, otherwise fires or explosions may occur. Work must be performed in special fume hoods, certified as perchioric acid-safe, with a duct washdown system and no exposed organic coating, sealing compound, or lubricant. Safety glasses, face shield, and gloves must be used. When wet-digesting soil or foliage samples, treat the sample first with nitric acid to destroy easily oxidizable matter. Oxidizable substances (e.g., foliage, filter paper, etc.) should never be allowed to come in contact with hot perchloric acid without preoxidation with nitric acid. Do not wipe spillage with flammable material. Do not store on wooden shelves. Do not let perchloric acid come into contact with rubber.
References
Armour, M.A.; Browne, L.M.; Weir, C.L. 1984. Hazardous chemicals: information and disposal guide. Oep. Chern., Univ. Alberta, Edmonton, Alberta.
Baker Chemical Company 1984. Hazardous chemical safety. Phillipsburg, New Jersey.
Baker Chemical Company 1985. Hazardous chemicals spill response workshop. Phillipsburg, New Jersey.
Bretherick, L., editor. 19B!. Hazards in the chemical laboratory. The Royal Society of Chemistry, London, U.K.
Freeman, N.T; Whitehead, J" editors. 1982. Introduction to safety in the chemical laboratory. Academic Press, New York, N.Y.
In/ Rep. NOR-X·jI9
Fuscaldo, A.A.; Erlick, 8.J.; Hindman, B., editors. 1980. Laboratory safety, theory and practice. Academic Press, New York, N.Y.
Green, M.; Turk, A 1978. Safety in working with chemicals. Macmillan Publishing Company, Inc., New York, N.Y.
Intemational Technical Information Institute. 1976. Toxic and hazardous industrial chemicals safety manual for handling and disposal with toxicity and hazard data. Tokyo, Japan.
Queen's Printer. 1987. Bill C-70. Can. Gov. PubL Cent., Sup. Serv. Can., Ottawa, Ontario.
Robinson, J.5., editor. 1979. Hazardous chemical spi1l cleanup. Noyes Publications, Park Ridge, New Jersey.
Sax, N.; Lewis, R. 1987. Hazardous chemicals desk reference. Van Nostrand Reinhold, New York, N.V.
Steere, N.V. 1967. Handbook of laboratory safety. The Chemical Rubber Company, Cleveland, Ohio.
Workers' Compensation Board of British Columbia. 1988. Workplace hazardous materials information system: WHMIS core material; a resource manual for the application and implementation of WHMIS. Richmond, B.C.
2. QUALITY ASSURANCE OF ANALYTICAL DATA
Quality Assurance principles are followed to ensure reliability of results. They consist of two parts:
1. Quality control: guidelines, procedures, and practices developed and implemente<! to produce high quality results. These are implemented on a daily basis.
2. Quality assessment: procedures and activities to verify the effectiveness of quality control procedures and to evaluate quality of data.
QUALITY CONTROL AND ASSESSMENT PROCEDURES
1. Good laboratory practices (e.g., housekeeping, storage of chemicals, laboratory techniques) and good management practices (e.g., calibration, maintenance of equipment) are integral parts of quality control. The laboratory is maintained in a clean and organized manner. All chemicals are dated on receipt and disposed of when shelf life is exceeded.
2. Methods are documented and followed.
3. Specific conductance of distilled water' is routinely checked. Double distilled water is used for trace element analysis.
4. Dilute working standards are prepared daily.
5. Certain analyses (e.g., pyrophosphate-extractable Fe and Al) are determined within 48 hours of extraction.
1 Throughout this manual, "water" means water of distilled or demineralized quality un1�ssotherwise stated.
In! Rep. NOR·X-3I9 5
6. Matrix match is important in calibration.
7. Glassware and plasticware are rinsed with tap water immediately after use. For most analyses, rinsing with tap water followed by distilled water is sufficient. For certain analyses, however, washing with dilute HCl followed by thorough rinsing with distilled water is required.
8. Glassware is stored in dust-free cabinets.
9. Care is exercised in sampling and sample handling. Sample integrity is ensured. Samples are stored according to their analytical requirements.
10. Operation and service manuals for all instrumentation are strictly followed. Preventive maintenance is essential. For example, balances are checked and serviced annually by trained service personnel. Records of downtime and service on equipment are maintained to assist in projecting repair and replacement needs.
11. Calibration is important. The pH meters are calibrated against two buffers bracketing the expected pH of the samples. Atomic absorption spectrophotometers, inductively coupled plasma spectrometers and other such instruments are calibrated with standard solutions for every batch of samples. Standards are checked every 20-50 samples, and at the end of each batch. After standardization of the instrument, l!ccepted deviation of analytical results must range within 0-4% of the true value.
12. All details of the analytical work (worksheets) are filed as permanent records.
13. Number of significant integers: Only the last figure reported should be in doubt.
14. Samples received for analysis are checked for acceptability (e.g., sample condition, appropriate documentation) and lab numbers are assigned and noted in a log book. The log book records names of submitters, consecutive serial (lab) numbers, date samples were received, date samples were analyzed, date of sample disposition, and name of analyst.
15. Method blanks are required to correct for contamination in reagents and other materials (e.g., filter paper, acids, water). Method blanks are run for each group of samples analyzed. This involves repetition of the entire procedure without including the sample. Blanks containing the matrix of the calibration standards are analyzed at the beginning of each batch, after every 20-50 samples, and at the end of each batch.
16. Duplicate samples are used to determine within-run precision. To duplicate means to repeat the whole procedure. If an analysis is repeated because the first result appears anomalous, this should not be �onsidered a duplicate. For routine analysis, one duplicate sample is run for every 20 samples to monitor the precision or reproductivity of the method. All relative standard deviations calculated from duplicate sample analysis should be within acceptable limits (5-15%, depending upon parameter and analyte concentration). No further samples are analyzed unless duplicate results are acceptable. The total withinlaboratory standard deviation includes between-run (between-batch) and within-run (within-batch) variations.
6 In! Rep. NOR-X-319
17. Internal (performance) audits are performed using "blind" check samples. These are samples of known composition that are given to the analyst without his or her knowledge. Blind samples are intermingled with and indistinguishable from actual samples to ensure that they do not receive special treatment.
18. Recovery (%) of added elements: Samples are "spiked" with a known amount of pure analyte. "Spikes" are added to unprocessed samples (e.g., soil, foliage), extracts, digests or other solutions. The level of spike should be approximately equal to the endogenous level or lO times the instrumental detection limit, whichever is greater. Percent recovery of the added element is calculated as follows:
concentrationof concentration of analyte in analyte in
% 'k spiked sample unspiked sample 100 o Spl e recovery =
concentration of spike x
Recoveries should be within acceptable limits (100±lO%). High recoveries may indicate variable blank and contamination.
This is a useful procedure for "total" analysis but not for extractables on soil because the form of the spike addition (Le., compound added) may be fully recovered, which does not necessarily indicate whether the extractant recovers lOO% of the fraction (e.g., Fe by pyrophosphate) that it is thought to recover.
19. To ensure valid data, known reference materials are run with each batch of samples. If results are not acceptable, corrective measures are taken before performing analYSis on actual samples. Also, if the results are questionable, the analysis is repeated on those samples. Reference materials include the following:
(i) Internal reference materials: Samples collected, prepared, and analyzed by several analysts within the Analytical Services Laboratory of the Northern Forestry Centre.
(ii) External reference materials: Samples analyzed by different laboratories. To ensure that laboratories produce credible data, it is important to participate in interlaboratory comparison studies. The authors have collaborated in regional, national, and international check sample programs. Regional studies were carried out by the Western Enviro-Agricultural Laboratory Association, Edmonton, Alberta, and the Alberta Institute of Pedology, Alberta Agriculture, Edmonton, Alberta, both using soils from Alberta. The laboratory participates in two national inter-laboratory comparison studies: a soil study conducted by the E�pert Committee on Soil Survey, Land Resource Research Centre, Agriculture Canada, Ottawa, Ontario, and a foliage study coordinated by the Quality Assurance Subgroup of the Research and Monitoring Coordinating Committee of the Federal Provincial Long Range Transport of Air Pollutants program, conducted from the Great Lakes Forestry Centre, Sault Ste. Marie, Ontario. The authors have also participated in an international foliage check sample program coordinated by the International Union of Forestry Research Organizations (IUFRO), Wageningen, The Netherlands, and two international, round-robin soil check sample programs: inter-laboratory comparison for the National Acid Precipitation Assessment Program of the U.S. Environmental Protection Agency, Las Vegas, Nevada
In! Rep. NOR·X·319 7
8
(Direct/Delayed Response Project, DDRP); and The Laboratory Exchange Program (LABEX), coordinated by the International Soil Reference and Information Centre, Wageningen, The Netherlands. NoFC is one of two Canadian laboratories that participated in the LABEX program.
(iii) Standard reference materials (SRM): Of particular importance are foliage reference materials such as those dealing with citrus leaves (SRM 1572) and pine needles (SRM 1575), produced by the National Institute of Standards and Technology (NIST), formerly National Bureau of Standards (NBS), Gaithersburg, Maryland. These have certified and noncertified results. Internal reference materials used on a day-to-day basis should be calibrated against standard reference materials. All reference materials are used to determine accuracy.
(iv) Certified reference materials (CRM): These include light sandy soil sample reference materials (CRM 142) certified by the Community Bureau of Reference and distributed by NIST. Accuracy is determined by reference against and on certified reference materials.
20. The results are reviewed and checked for calculation and transposition errors before they are released. The same care is exercised in checking data that is exercised in doing the analytical work. The calculation check includes the entire process and a check of arithmetic.
References
Bartz, J.K.; Drouse, 5.K.; Cappo, K.A.; Papp, M.L.; Raab, G.A.; Blume, L.J.; Stapanian, M.A.; Gamer, F.C; Coffey, D.S. 1987. Direct/delayed response project: quality assurance plan for soil sampling, preparation and analysis. U.S. Environ. Prot. Agency, Washington, D.C.
Cappo, K.A.; Blume, L.J.; Raab, G.A.; Bartz, J.K.; Engels, J.L. 1987. Analytical methods manual for the direct/delayed response project soil survey. U.S. Environ. Prot. Agency, Washington, D.C.
de Wit, M. 1973. International methods for chemical analysis (report on activities, 1971-73) IUFRO Subject Group 51.02, Working Party 3, For. Res. Stn. De Dorschkamp, Wageningen, The Netherlands.
Garfield, F.M. 1991. Quality assurance principles for analytical laboratories. Assoc. Off. Anal. Chern., Arlington, Virginia.
Garfield, F.M.; Palmer, N.; Schwartzman, G., editors. 1980. Optimizing chemical laboratory performance through the application of quality assurance principles. Proc. Symp., Assoc. Off. Anal. Chern., Washington, D.C.
l:Ieaney, D.J.; McGill, W.B.; Nguyen, C. 1988. Soil test quality assurance program. Final report. Dep. Soil SeL, Univ. Alberta, Edmonton, Alberta.
Jones, J.B., Jr. 1988. Comments on the accuracy of analytical data in the published scientific literature. Soil Sci. Soc. Am. J. 52:1203-1204:
Kalra, YP.; Edwards, 1.K. 1974. Possible sources of errors in chemical analyses ofIUFRO plant samples. IUFRO News 7:10-11.
Kalra, Y.P.; Maynard, D.G. 1987. Northern Forestry Centre's participation in soil and plant check sample programs. Pages 4-5 in Univ. B.C., Vancouver, S.c. Pac. Reg. Soc. SoilSei. News 14.
Kalra, YP.; Peters, M.K. 1981. WEALA check soil sample program: a collaborative study. West. Enviro-Agric. Lab. Assoc., Edmonton, Alberta. Rep. WEALA-1.
In! Rep. NOR·X·319
McKeague, J.A.; Sheldrik, B.H.; Desjardins, J.G. 1978. Compilation of data for csse reference soil samples. Agric. Can., Soil Res. Inst., Ottawa, Ontario.
Sheldrick, B.H.1986. Quality control procedure, preciSion, and rate of analysis in the analytical laboratory. Agric. Can., Land Resour. Res. Cent., Res. Branch, Ottawa, Ontario. Contrib. 85-69.
Skoberboe, R.K.; KOirtyohann, S.R. 1976. Accuracy assurance in the analysis of environment samples. Natl. Bur. Stand., Gaithersburg, Maryland. Publ. 422.
Taylor, J.K. 1984. Quality assurance of chemical measurements. Nat!. Bur. Stand., Gaithersburg, Maryland.
van Goor, c.P. 1978. The comparability of results of chemical analysis of leaf samples. Final Report of IUFRO Working Party 3. For. Res. Stn. De Dorschkamp, Wageningen, The Netherlands.
van Goor, c.P.; de Wit, M.; van den Burg, J. 1971. International comparison of methods for soH and plant analysis. Report of activities in 1970. For. Res. Stn. De Dorschkamp, Wageningen, The Netherlands.
3. ANALYTICAL TECHNIQUES
(i) ATOMIC ABSORPTION SPECTROPHOTOMETRY
Atomic absorption spectrophotometry (AAS) is one of the principal instrumental techniques for elemental analysis in agricultural and environmental laboratoties.
In AAS, atoms excited in an oxyacetylene flame absorb light at wavelengths characteristic of each element. Light absorption is proportional to the concentration of atoms in a light path. The most commonly used radiation source is a hollow cathode lamp, consisting of a tungsten anode and a cylindrical cathode sealed in a glass tube filled with neon or argon gas.
Though both single-beam and double-beam instruments are available, doublebeam instruments are preferred because they minimize effects of lamp emission variations, detector sensitivity, and electronic gain. Acetylene (C,H,) as fuel and air or nitrous oxide (N,O) as oxidant are commonly used. An air-C,H, flame (2100-2400"C) is used for elements (such as calcium, magnesium) that do not form refractory compounds and have low ionization potentials; an N,O-C,H, flame (2600-2800"C) is used for elements (such as aluminum) forming refractory compounds.
More than 60 elements can be determined by AAS. Besides detection limits, factors such as matrix or interference effects are major influences on the viability of particular analyses. At NoFC, the lowest concentration that can usefully be determined in soil and foliage extracts is five times greater than the detection limits given in the methods manual (Emmel et al. 1977).
Problems caused by the formation of stable compounds or compounds of low volatility by the element of interest in combination with some anion can be overcome by the addition of an excess of a "competing cation" or a "releasing agent". For example, lanthanum (1000 mg L·I) as chloride can be added in the determination of calcium and magnesium to remove the potential interference due to aluminum and phosphorus. To overcome ionization interference, an excess of an easily ionized metal is added. For example, 1000 mg L·I cesium is added to solutions for the determination of potassium and sodium. To eliminate matrix interferences, sample extracts and standard solutions should be in the same solvent.
Inj. Rep. NOR-X-3J9 9
10
Instrument settings are normally those recommended by the manufacturer; however, slight adjustments might be necessary in certain instances. The burner is flushed with water and the "zero absorption" re-established before aspirating each sample. At least three standards are prepared to obtain a working curve. Working curves are prepared with each batch of samples.
If the concentration of the element of interest is above the analytical range of the instrument, then the solution must be diluted. An alternative is to place the burner head perpendicular to the light path (or at any other angle that may be required). This increases the upper limit of linearity by a factor of up to 10.
References
Baker, D.E.i Suhr, N.H. 1982. Atomic absorption and flame emission spectrometry. Pages 13-27 in A.L. Page, RH. Miller, and D.R. Keeney, editors. Methods of soil analysis. Part 2, Agron. 9. Amer. Soc. Agron., Madison, Wisconsin.
Emmel, RH.; Sotera, J.}.; Stux, RL. 1977. Atomic absorption methods manual. Volwne 1: Standard conditions for flame operation. Instrumentation Laboratory, Inc. Wilmington, Massachusetts.
Isaac, R.A.; Kerber, J.D. 1971. Atomic absorption and flame photometry: techniques and uses in soil, plant, and water analysis. Pages 17-37 in L.M. Walsh, editor. Instrumental methods for analysis of soils and plant tissue. Soil Sci. Soc. Am., Madison, Wisconsin.
Kalra, Y.P. 1977. Application of atomic absorption spectrophotometry in soil, plant, water and fertilizer analysis: an annotated bibliography. Part I. Environ. Can., Can. For. Serv., North. For. Res. Cent., Edmonton, Alberta. File Rep. 6935-2.
Skoog, D.A 1985. Principles of. instrumental analysis. Saunders College Publishing, Philadelphia, Pennsylvania.
Ure, AM. 1983. Atomic absorption and flame emission spectrometry. Pages 1-53 in K.A Smith, editor. Soil analysis: instrumental techniques and related procedures. Marcel Dekker Inc., New York, N.Y.
(ii) CONTINUOUS FLOW ANALYSIS
Continuous flow analysis methods are classified into two types: the segmented flow method and the nonsegmented flow method.
In the NoFC laboratory, the segmented flow method is used and the present discussion will be limited to this technique. The first continuous automated analyzer was described by Skeggs (1957). The Technicon AutoAnalyzer became available later in the same year. This technique is widely used because of its capability to perform repetitive analytical processes with minimal operator assistance at a relatively rapid speed, producing high-quality analytical results.
The autoanalyzer consists of a sampler, peristaltic proportioning pump, detector (most typically a colorimeter) and recorder; for,certain analyses a heating bath is also required. The interconnected modules perform the functions of sampling, metering, mixing, heating (if required), incubation, detection, and recording of transmission.
Samples (standard and unknown solutions) are loaded into 4-mL polystyrene cups on the autoanalyzer's 4O-place turntable. The rate of analysis along with the relative lengths of the sample and rinse periods are set by inserting the appropriate cam in the sampler. The peristaltic proportioning pump draws the sample into the system through an inlet probe immersed in one of the sequence of cups.
/'if, Rep_ NOR-X-3/9
The tubes containing sample, reagents, diluent, and air pass through by positive displacement in a peristaltic proportioning pump. In the pump, a liquid is squeezed through plastic tubing by metal rollers mounted on a pair of parallel continuous chains; the spring-loaded platen pinches the tubing against one of the rollers, thus forcing a continuous flow of liquid through the tubing. The volume of sample and reagents delivered per unit of time can be changed by using tubes of different inside diameters (designated by shoulder colors of the tubes). Chemical reactions take place in continuously flowing air-segmented streams. Sample and reagents aspirated intermittently are mixed together by constant inversion through glass mixing coils and segmented by equally spaced bubbles of air. The bubbles establish and maintain sample integrity, promote mixing of sample and reagents by repeated inversions of the segments of liquid in mixing coils, eliminate crossmixing of samples, and provide a visual check of the streamflow characteristics for monitoring the analysis. They also provide a barrier between sample segments and wash segments preventing contamination and ensuring sample integrity.
The resulting color is measured by absorbance of a beam of light as the analytical stream passes through a colorimeter flow cell. Air bubbles are removed before colored solution enters the flowcell. The intensity of color, seen as a series of peaks, is plotted by the strip-chart recorder; peaks indicate concentrations of the analyte. Output on the recorder is directly proportional to the analyte concentration. Peaks of unknown samples are compared to the standard curve to determine analyte concentration of the unknown samples.
Remarks
1. Always use NH,-free double-distilled water for standards, reagents, and dilutions.
2. All reagent bottles, sample cups, and new pump tubes should be rinsed with .about 1 M HC!.
3. The volume delivered by a peristaltic pump generally changes with tubing age and use. The tubes, therefore, should be replaced periodically depending on the workload; up to once a week if a large number of samples are analyzed.
4. Pump water or a wash solution through sample and reagent lines before actual analysiS.
5. Ensure that bubble patterns are evenly segmented, connections are properly made, no leaks are present, and liquid uptake is operating properly.
6. Rinse the sample cups with sample solution before filling.
7. Sample cups should be about two-thirds filled.
8. Standards and dilutions should be prepared in the same matrix as the samples.
9. If air peaks show up on the graph, check to make sure that all connections are secure. Periodically check to see that air bubbles in the tubes are of uniform size and spacing. If they are not, there is probably a leak in one of the connections.
10. During operation, as the between-sample rinse solution passes, the output must drop back to baseline.
l"i Rep. NOR·X·319 II
12
11. For the preparation of a standard curve, a series of standards (in the range expected in the unknowns) should be run at the beginning and the end of each day's testing.
12. Prepare standard curve from recorded readings of standards and read off mg L" in samples.
13. Flow injection analysis is a nonsegmented continuous flow method. The term was originated by Ruzicka and Hansen (1975). The technique is fast and uses very low volumes of sample and reagents.
References
Coakley, W.A. 1981. Handbook of automated analysis-continuous flow techniques. Marcel Dekker, Inc., New York,N.Y.
Furman, W.B. 1976. Continuous flow analysis. Marcel Dekker, Inc., New York, N.Y.
Harris, W.E.; Kratochvil, B. 1981. An introduction to chemical analysis. Saunders College Publishing, Philadelphia, Pennsylvania.
Heffernan, B. 1985. A handbook of methods of inorganic chemical analysis for forest soils, foliage, and water. Commonw. Sci. Ind. Res. Organ. Div. For. Res., Canberra, Australia.
Issac,R.A.; JOMson, W.e. 1976. Detenpinationof totalnitrogen in planttissue.J. Assoc. Off. Anal. Chern. 59,98-100.
Issac, RA.i Jones, Jr., J.B. 1970. AutoAnalyzer systems for the analysis of soil and plant extracts, Pages 57-64 in Advances in automated analysis, Technicon Congress Proceedings. Technicon Corporation, Tarrytown, N.Y.
Jones, Jr., J.B. 1984. A laboratory guide of exercises in conducting soil tests and plant analyses. Benton Laboratories Inc., Athens, Georgia.
Karlberg, B.; Muller, J. 1982. Flow injection analysis-A new technique for the automation of wet-chemical procedures. Tecator AB, H6ganas, Sweden. In Focus 5:5-11
Knopp, J.F.; McKee, D. 1983. Methods for chemical analysis of water and wastes. Environ. Prot. Agency, Cincinnati, Ohio. EPA-600(4·79'()ZO.
Ranger, C. 1981. Flow injection analysis-principles, techniques, applications, design. Anal. Chern. 53,ZOA-Z6A.
Ruzicka, J.; Hansen, E.H. 1975. Flow injection analysis. Part 1. A new concept of fast continuous flow analysis. AnaL Chim. Acta 78:145-157.
Ruzicka,J.; Hansen, E.H. 1981. Flow injection analysis. J. Wiley and Sons, New York, N.Y.
Shaw, A; Karlsson, c.; Milller, J. 1988. An introduction to the use of flow injection analysis. Tecator AB, Hoganas, Sweden.
Sheldrick, B.H., editor. 1984. Analytical methods manual 1984. Agric. Can., Land Resour. Res.lnst., Res. Branch, Ottawa, Ontario. Contrib. 84-30.
Skeggs, L.T. 1957. An automatic method for colorimetric analysis. Am. J. Oin. PathoL 28:311-322.
Skoog, D.A. 1985. Principles of instrumental analysis. Third edition. Saunders College Publishing, Philadelphia, Pennsylvania.
Smith, KA.; Scott, A. 1983. Continuous-flow and discrete analysis, Pages 115-169 in K.A. Smith, editor. Soil analysis. Marcel Dekker, Inc., New York, N.Y.
I'ff. Rep. NOR·X·319
Technicon Corporation. 1968. Technicon AutoAnalyzerbi bliography 1957/67. Tarrytown, N.Y.
(iii) ION CHROMATOGRAPHY
Ion chromatography as an analytical technique was first described in 1975. Since its commercial introduction that year, the technique has been widely used.
Ion chromatography involves the replacement of buffer ions by sample ionic species on an ion-exchange resin (column). Separation is based upon the strength of interactions between sample ions in the mobile phase and exchange sites on the stationary phase (Hamilton and Sewell 1977). There are two basic systems for the simultaneous determination of soluble anions: suppressed ion chromatography and single column ion chromatography. The latter system is used at NoFC. Single column ion chromatography requires a low-capacity exchange column and a low-conductivity eluent without the need for a suppressor column (Nieto and Frankenberger, Jr. 1985).
The NoFC Ion Chromatography System (Waters Associates, Milford, Massachusetts) is completely automated with a 820 data station and a sample processor, Model nOB. It is equipped with a 96-place automated sampler, dual piston pump Model 590, and a Model 431 electrical conductivity detector. The detector has an automated temperature-control system that corrects for temperature fluctuations in the laboratory.
Simultaneous determinations of the following anions in soil extracts can be made: F, Cf, NO;, NO;, Br', [, ClO.-, PO"', and sot. In our laboratory, we have only routinely determined NO;, PO"', and SO." in soil extracts. The following configuration is used primarily for sot, although a similar procedure would be followed for NO; and PO .... (Note: Vydac columns eliminate PO;· from the separator.)
Suitable columns for anions and cations are available and the elements should be prepared according to manufacturer's specifications. The two most commonly used anion columns in our laboratory and the appropriate eluents are outlined briefly_
A Waters IC-Pak A anion exchange column (4.6 x50 mm) is used for the SO. determinations in all but Ca(H,PO.),-H,O extracts. The colwnn contains a polymethacrylate gel (10�) with a quaternary NH. + functional group. The mobile phase is a borate gluconate buffer (consisting of 1.5 mM K gluconate, 5.8 mM H,BO" 1.3 mM Na,B.O,-10H,O, 12% [v Iv] CH,CN and 0.25% [v Iv] glycerin) with a flow rate of 1.2 mL min". There is a straight line relationship between peak area and SO. concentrations for standards ranging from 1 to 100 mg 1.., (SO.-S [mg 1..,] ; 0.0204 + 0.216 peak area: r' = 0.998). The precision of the instrument for SO. is 0.94% (two standard deviations as a percentage of the slope). The detection limit for this colwnn is 0.25 mg 1.-'.
A Vydac 302 IC anion exchange column (4.6 x 250 mm) from the Separations Group (Hesperia, California) is used for Ca(H,PO.),-H,O extracts_ Phosphate is not retained by the Vydac column using the phthalic acid (4 mM, pH 4.5) eluent. This eliminates problems of PO;- interferences that occur when the PO;- extracts are used with the Waters IC-Pak A and borate-gluconate eluent. For both columns, sample injection volumes range from 50 to 200 JJL depending on the concentration of SO.-S in the extract.
Inf Rep. NOR-X·319 13
14
The eluent is pumped through the system to establish the baseline. Standards are analyzed and the calibration curve is determined by plotting peak area (or height) versus concentration for each standard. (In the NoPC instrument, this is programmed into the data handling system). The samples are run (after filtering through a 0.45 � filter) and the peak area is automatically converted by the data control station to concentration based on the standard curves. The calibration curve should be updated every 24 samples.
References
Begheijn, L. Th. 1980. Methods of chemical analyses for soils and waters. Agric. Univ., Wageningeo, The Netherlands.
Dick, W.A.; Tabatabai, M.A. 1979. Ion chromatographic determination of sulfate and nitrate in soils. Soil Sci. Soc. Am. j. 43,899-904.
Hamilton, R.J.; Sewell, P.A. 1977. 1ntroduction to high performance liqUid chromatography. Chapman and Hall, New York, N.Y.
Maynard, D.C.; Kalra, Y.P.; Radford, F.G. 1987. Extraction and determination of sulfur in organic horizons of forest soils. Soil Sci. Soc. Am. J. 51:801-806.
Nieto, K.F.; Frankenberger, W.T., Jr. 1985. Single column ion chromatography: I. Analysis of inorganic anions in soils. Soil Sci. Soc. Am. J. 49:587-592.
Waters Associates. 1988. Waters 431 conductivity detector. Operator's manual Millipore Corporation, Milford, Massachusetts.
(iv) INDUCTIVELY COUPLED PLASMA-ATOMIC EMISSION SPECTROSCOPY
An inductively coupled plasma-atomic emission spectroscopy (ICP":AES) spectrometer consists of an excitation source (RF generator), a sample introduction system (nebulizer, spray chamber, and torch), an optical resolving system (primary slit, diffraction grating, secondary optics, and photomultipliers), and an electronic data capture and storage system (measuring electronics and microcomputer).
The excitation source provides the energy required to form the plasma through an induction coil. An oscillating magnetic field is formed within the quartz tube in response to the radio frequency energy passing through the coil. Argon gas flowing to the torch is "seeded" by means of a tesla coil. As the seeded argon enters the magnetic field associated with the induction coil, collisions occur between ions and electrons. These collisions give rise to ohmic heating, which produces a plasma with temperatures ranging from 6000 to 10 000"1<. The resultant plasma is contained within the torch by means of argon flow.
The method of presenting the sample to the plasma is similar to that used in atomic absorption. The liquid sample is aspirated by a nebulizer that atomizes the sample and presents the aerosol to the torch via the spray chamber. The spray chamber serves to settle out larger droplets, allowing the smaller droplets to enter the torch assembly. In the torch, the sample is injected into the plasma, causing the excited neutral atoms or ions within the sample to emit radiation of specific wavelengths. The emitted energy is observed by means of the light tube. It can be focused on the entrance slit of a spectrometer and illuminates the diffraction grating. Here, the light is separated into its component wavelengths and passes through an exit slit, where it is order-sorted and impinged on a photo multiplier tube. The photo multiplier produces a signal directly proportional to the intensity
In! Rep. NOR-X-319
of the impinging light. This signal is then passed by the measuring electronics to the computer. The data are compared with previously stored data from standards and converted to concentration data. The concentration data are stored on disks and presented to the operator at the input-{)utput device.
Some of the advantages of ICP-AES are as follows:
1. Interelement interference is low.
2. Good spectra for many elements under a single set of excitation conditions, allowing multielement analysis of very small aliquots.
3. Low concentrations of elements (e.g., boron, phosphorus) that tend to form refractory compounds can be determined.
4. Elements over a dynamic range of concentration, four to six orders of magnitude, may be determined.
5. Ionization interference effects are small or nonexistent.
6. Analytical stability is long-term.
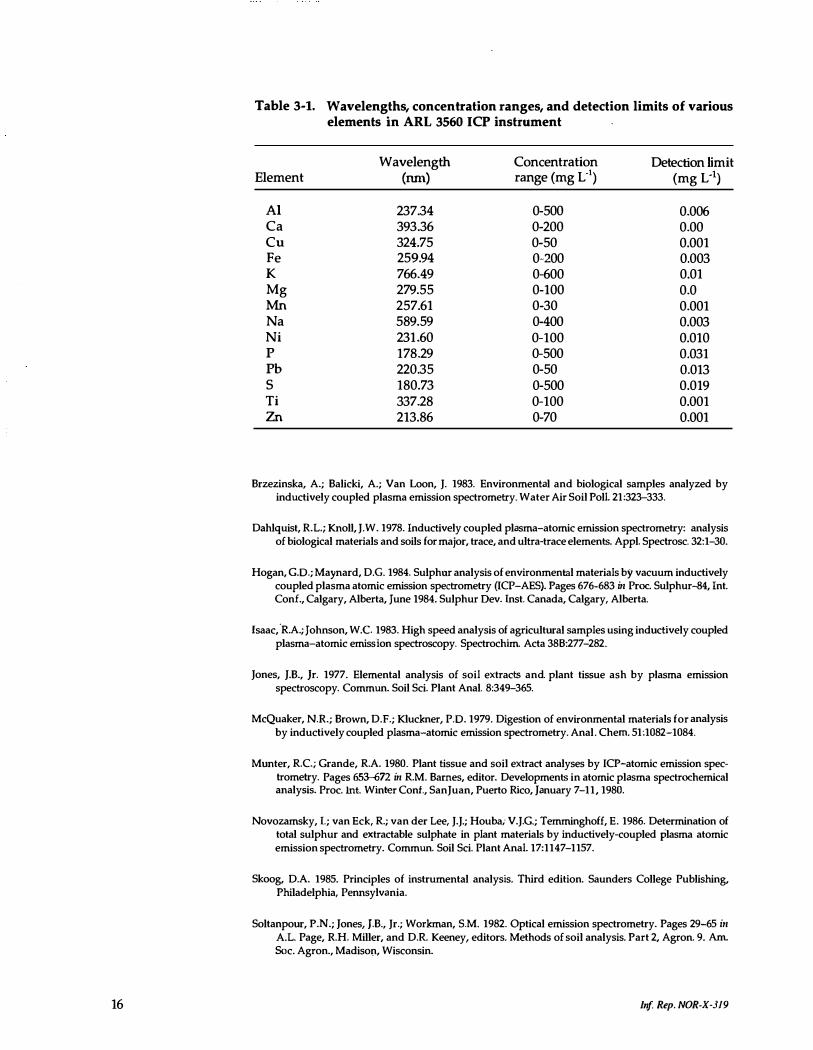
7. Detection limits are comparable or better than other atomic spectral procedures (Table 3-1). Soil extracts and plant digests can be analyzed directly without the preconcentration techniques often required for flame atomic absorption spectrophotometry.
8. Sample throughput is efficient.
9. Cost per sample analyzed is low.
The following points should be considered in ICP-AES analysis:
1. For any element, a minimum of concentration five times the detection limit is required to obtain reliable results (Table 3-1).
2. To prevent clogging of the nebulizer, soil extracts and plant tissue digests must be free of suspended particles. This is achieved by filtering with O.45 1Jffi filter.
3. "Blank" solutions are used as the zero point.
Generally, three to six standards are used for calibration. These working standards should be in the same matrix as the samples. Pure reagents and double distilled water should be used for the preparation of stock standard solutions.
Spectrometer software supplied by the manufacturer enables the operator to do many tasks automatically. Automated sample introduction permits the analysis of a large number of samples without operator attention. A wash cycle is chosen that is sufficient to eliminate carryover from sample to sample.
References
Applied Research Laboratories. 1990. Plasma Vision 60 software guide, ARL 3500 Series, single stand ICP Spectrometer, Version 2.0B12 single user. Valencia, California.
In! Rep. NOR·X·JI9 15
16
Table 3-1. Wavelengths, concentration ranges, and detection limits of various elements in ARL 3560 ICP instrument
Wavelength Concentration Detection limit Element (nm) range (mg L·') (mg L-l)
Al 237.34 0-500 0.006 Ca 393.36 0-200 0.00 Cu 324.75 0-50 0.001 Fe 259.94 0-200 0.003 K 766.49 0-600 0.01 Mg 279.55 0-100 0.0 Mn 257.61 0-30 0.001 Na 589.59 0-400 0.003 Ni 231.60 0-100 0.010 P 178.29 0-500 0.031 Ph 220.35 0-50 0.013 S 180.73 0-500 0.019 Ti 337.28 0-100 0.001 Zn 213.86 0-70 0.001
Brzezinska, A.; Balicki, A.; Van Loon, J. 1983. Environmental and biological samples analyzed by inductively coupled plasma emission spectrometry. Water Air Soil Poll. 21:323-333.
Dahlquist, R.L.; Knoll, J.W. 1978. Inductively coupled plasma-atomic emission spectrometry: analysis of biological materials and soils for major, trace, and ultra�trace elements. Appl. Spectrosc. 32:1-30.
Hogan, G.O.; Maynard, D.C. 1984. Sulphur analysis of environmental materials by vacuum inductively coupled plasma atomic emission spectrometry (ICP-AES). Pages 676-683 in Proc. Sulphur-84, Int. Coni., Calgary, Alberta, June 1984. Sulphur Dev. Inst. Canada, Calgary, Alberta.
Isaac, 'RA; Johnson, W.C 1983. High speed analysis of agricultural samples using inductively coupled plasma-atomic emission spectroscopy. Spectrochim. Acta 38B:277-282.
Jones, J.B., Jr. 1977. Elemental analysis of soil extracts and plant tissue ash by plasma emission spectroscopy. Commun. Soil Sci. Plant Anal. 8:349-365.
McQuaker, N.R.; Brown, D.F.; Kluckner, P.O. 1979. Digestion of environmental materials for analysis by inductively coupled plasma-atomic emission spectrometry. Anal. Chern. 51:1082-1084.
Munter, RCi Grande, RA 1980. Plant tissue and soil extract analyses by ICP-atomic emission spectrometry. Pages 653-672 in RM. Barnes, editor. Developments in atomic plasma spectrochemical analysis. Proc. Int. Winter Cont., SanJuan, Puerto Rico, January 7-11, 1980.
Novozamsky, I.; van Eck, R; van der Lee, J.J.; Houba; V.J.G.; Temminghoff, E. 1986. Determination of total sulphur and extractable sulphate in plant materials by inductively-coupled plasma atomic emission spectrometry. Commun. Soil Sci. Plant Anal. 17:1147-1157.
Skoog, D.A 1985. Principles of instrumental analysis. Third edition. Saunders College Publishing, Philadelphia, Pennsylvania.
Soltanpour, P.N.; Jones, 1.B., Jr.; Workman, S.M. 1982. Optical emission spectrometry. Pages 29-65 in AL. Page, R.H. Miller, and D.R Keeney, editors. Methods of soil analysis. Part 2, Agron. 9. Am. Soc. Agron., Madison, Wisconsin.
In! Rep. NOR-X·319

Soltanpour, P.N.; Workman, S.M.; Schwab, AP. 1979. Use of inductively-coupled plasma spectrometry for the simultaneous determination of macro- and micronutrients in NfuHC0:3-DTPA extracts of soils. Soil Sci. Soc. Am. j. 43075-78.
SOIL ANALYSIS
4. PREPARATION
Sample Coding
Information regarding samples is entered into a log book and, after they are arranged in numerical order, each sample is given a laboratory number. Proper documentation must be maintained. Samples sent frozen must remain frozen upon arrival and not thawed in transit. The first consideration is the degree of urgency associated with certain analyses. For example, it may be desirable to measure pH, nitrate (NO,-N), ammonium (NH,-N), etc., before handling the samples any further.
Drying
Most determinations are made on air-dried samples. In some cases, however, NH,-N, NO,-N, pH, electrical conductivity, and some other properties are determined on moist samples (field condition) immediately after arrival at the laboratory. Drying some soils, particularly organic horizons, can cause irreversible changes in some properties (Bartlett and James 1980; Davey and Conyers 1988; Leggett and Argyle 1983; Peverill et al. 1975; Schalscha et al. 1965; Searle and Sparling 1987), If analyses cannot be done immediately after collection, then moist samples are stored at 2°C or frozen at _20°C, depending upon the length of time before analysis can be done. Stored samples must be tightly closed. In some instances it might be necessary to air-dry part of the sample and to maintain the other part in the field-moist state. Problems associated with obtaining a representative sample of moist soils can be reduced by blending moist samples prior to subsampling.
Soil samples should be air-dried soon after collection to prevent microbial changes. Soils are air-dried at 20-25°C and with relative humidity of 20-60% Gackson 1958); the term "air-dried" refers to soil conditioned to ambient temperature and humidity. Large lumps of moist soil are broken by hand and spread on paper in a room free of fumes, dust, etc. If large clods are not broken, they will take an unduly long time to dry and will also be harder to grind. When dry, the soil is rolled gently with a wooden roller. Coarse concretions, stones and pieces of macro-organic matter (roots, leaves, and other vegetative material) are picked out.
Grinding
Grinding is essential to homogenize the soil and reduce subsampling error as well as to increase the specific surface. After air-<irying, the soil is ground to pass a 2-mm sieve using a modified Rukuhia soil grinder (Day and Dixon 1965). The grinder consists of three cylinders into which the samples and metal pestles are placed. The cylinders are rotated horizontally by electrically driven rollers. As the cylinders rotate, the sample is ground by the pestle and falls through the mesh of the cylinder walls into a tray below. Remaining gravel (weathered and nonweathered rock fragments) and organic residue (e.g., fibrous material from roots)
Inf. Rep.NOR-X-319 17
18
are removed. These materials are weighed and their percentage in the total sample is determined. Approximately 500 g of homogenized subsample fine earth (less than 2 mm soil) is obtained by the quartering method Gackson 1958) or by using a riffle sampler, in which a soil sample is automatically halved by a series of chutes. The process is repeated as many times as necessary. It is stored in a cardboard or glass container.
Nearly all determinations are carried out on the fine earth fraction (less than 2 mm). If less than 1 g of sample is required for a particular analysis, then the 2-mm fraction might not be sufficiently representative. A smaller-sized sample is obtained by grinding a 2-mm subsample with pestle and mortar or a Spex mixer/mill. For organic carbon, for example, soil is ground to a 35-mesh size.
The composition of the grinding and sieving apparatus is important, particulary if trace elements are to be determined. For heavy metals (such as eu and Zn), the soil is ground in an agate or porcelain mortar with a pestle (preferred over a Rukuhia soil grinder), then pas�ed through a nylon 2-mm sieve (or smaller if required). Iron, copper, and brass sieves are avoided. Treatment with a metallic grinder can also result in serious contamination for some analyses (e.g., iron can interfere with organic carbon determination).
All grinding is performed using clean, dry equipment: The grinder must be thoroughly cleaned between samples to avoid carryover. When grinding with a mortar and pestle, the complete subsample must be ground to pass the sieve and none is discarded.
Storage
Soils may undergo significant changes during storage (air-dried or frozen), particularly with respect to extractab.1e nutrient concentrations (Maynard et al. 1987; Peverill et al. 1975; Searle and Sparling 1987). As a result, many extractable analyses are carried out on moist samples and, therefore, the soils are stored frozen until the analyses can be performed.
The long-term effect of frozen storage of moist samples has not been sufficiently evaluated. This must be considered when interpreting data on soils analyzed immediately after collection and those analyzed after storage for any length of time. Segregation of particles by size can involuntarily occur during grinding, sieving, and storage; therefore, the ground sample must be mixed well before a sample is weighed for analysis.
Remarks
Sample integrity must be maintained. Analytical results are only as good as the samples collected and the method of preparation. Because a small amount of sample is used for any particular test, it is essential that subsamples be carefully selected and thoroughly mixed, and the quantity prepared should be at least 10 times greater than the final sample analyzed.
References
Bartlett, R.; James, B. 1980. Studying dried, stored soil samples-some pitfalls. Soil Sci. Soc. Am. J. 44:721-724.
Davey, B.G.; Conyers,M.K. 1988. Detennining the pH of acid soils. Soil Sci. 146:141-150.
In! Rep. NOR·X·319

Day, R.J.; Dixon, G.H. 1965. Modified Rukuhia soil grinder. Can. Dep. For., For. Res. Branch, Calgary, Alberta. Rep. 65-A-4.
Jackson, M.L. 1958. Soil chemical analysis. Prentice-Hall, Inc., Englewood Cliffs, New Jersey.
Leggett, G.E.; Argyle, D.P. 1983. The DTPA-extractable iron, manganese, copper and zinc from neutral and calcareous soil dried under different conditions. Soil Sci. Soc. Am. J. 47:518-522.
Maynard, D.G.; Kalra, Y.P.; Radford, F.G. 1987. Extraction and determination of sulfur in organic horizons of forest soils. Soil Sci. Soc. Am. J. 51:801-805.
Peverill, K.I.; Briner, G.P.; Douglas, L.A 1975. Changes in, extractable sulphur and potassium levels in soil due to oven drying and storage. AustJ. Soil Res. 13: 69-75.
Phillips, I.R.; Black, AS.; Cameron, KC 1986. Effects of drying on the ion exchange capacity and cation adsorption propertie� of some New Zealand soils. Commun. Soil Sci. Plant Anal. 17:1243--1256.
Schalscha, R.B.; Gonzalez, C; Vergara, I.; Galindo, G.; Schatz, A 1965. Effect of drying on volcanic ash soils in Chile. Soil Sci. Soc. Am. Proc. 29:481-482.
Searle, P.L.; Sparling, G.P. 1987. The effect of air-drying and storage conditions on the amounts of sulphate and phosphate extracted from a range of New Zealand topsoils. Commun. Soil Sci. Plant Anal. 18:725-734.
Soltanpour, P.N.; Khan, A; Schwab, A.P. 1979. Effect of grinding variables on the NH4HC03-DTPA soil values for Fe, Zn, Mn, Cu, P, and K. Commun. Soil Sci. Plant Anal. 10:903-909.
5. MOISTURE
(i) MOISTURE CONTENT
Principle
Moisture content is determined by weighing the field-fresh sample, followed by drying the soil in a forced-air oven and then reweighing. The loss in weight (water) is expressed as a percentage of ovendried weight. Organic matter in some soils may be decomposed at 105°C. For most soils this is not a serious source of error, but it can be serious for soils containing significant amounts of volatile compounds (e.g., soils contaminated with oil).
Apparatus
Disposable aluminum dishes (or tared soil-moisture cans) Drying oven Balance Desiccator
Reagents
None_
Procedure
1. Weigh an aluminum dish (0.01 g accuracy) (WI).
In! Rep. NOR·X-319 19

20
2. Transfer about 5 g mineral soil sample (0.01 g accuracy) to the dish and weigh soil plus dish (W2).
3. Place the dish plus sample in oven at 105°C. Dry to constant weight (24 hours).
4. Cool in desiccator for 30 minutes. Weigh to an accuracy of 0.01 g (W,).
Calculations
Ovendry soil Ig) = W, - WI
Moisture Ig) = W2 - W,
W I'" by . h moisture Ig)
100 "ater content \/0 we!g t) ovendried soil ig) x
Report results to three significant figures.
Remarks
1. To determine moisture content of LFH samples, dry samples at 70°C for 48 hours.
2. Moisture content in air-dry soil is called hygroscopic moisture. It varies from less than 0.2% for sands to more than 8% for LFH, depending upon the relative humidity in the storage area, fineness of soil particles, etc. Samples should be air-dried prior to moisture content determination.
3. Analytical results of N, P, K, etc., in many cases are expressed on the basis of ovendry weight. If the analyses are done on an air-dry or moist sample, the results can be converted to ovendry basis by determining moisture on a subsample of the soil and multiplying the results by the moisture factor where:
M · fi _ weight of air-tiry soil ig) olSture actor - . ht ,{ d ./ In) We!g OJ oven ry SOl "
4. Moisture content values reproducible to within ±0.5% can be achieved.
5. The oven is monitored periodically to ensure that temperature fluctuation does not exceed ±5"C.
6. For quality control, a minimum of one reference sample should be analyzed per batch of 40 samples (a minimum of one reference sample daily). Duplicates are done on approximately 5% of samples. Precision of moisture should be less than or equal to 10%. For example, long-term analyses of two laboratory samples were 2.70 ± 0.13% (coefficient of variation 4.9%) for the mineral soil and 7.92 ±0.16% (coefficient of variation 2.0%) for the LFH sample. Results reported by the Direct Delayed Response Project from several laboratories were 2.76 ± 0.21 % (coefficient of variation 7.7%) and 8.41 ± 0.73% (coefficient of variation 8.6%), respectively.
In! Rep. NOR·X·319
References
Cappo, K.A.; Blume, L.J.; Raab, G.A.; Bartz, J.K.; Engels, J.L. 1987. Analytical methods manual for the direct/delayed response project soil survey. U.S. Environ. Prot. Agency, Washington, D.C.
Houba, V.J.G.; van der Lee, }.J.; Novozamsky, I.; Walinga, I. 1988. Soil and plant analysis. Part 5: Soil analysis procedures. Agric. Univ., Wageningen, The Netherlands.
McKeague, J.A., editor. 1978. Manual on soil sampling and methods of analysis. Can. Soc. Soil Sci., Ottawa, Ontario.
Sheldrick, BR., editor. 1984. Analytical methods manua1 1984. Agric. Can., Land Resour. Res. Inst., Res. Branch, Ottawa, Ontario. Contrib. 84-30.
van Reeuwijk, L.P., editor, 1987. Procedures for soil analysis. Int. Soil Ref. Inf. Cent., Wageningen, The Netherlands. Tech. Pap. 9.
Principle
(ii) MOISTURE RETENTION CURVE AT 0-1500 kPa (0-15 BAR) PRESSURE
Soils are equilibrated with water at various tensions and moisture content is determined. The ability of soil to retain water depends on several factors, e.g., texture or particle-size distribution, organic matter content (due to its hydrophilic nature), nature of mineral colloids, and soil structure or arrangement of particles.
a. Low range: moisture at 0-100 kPa (0-1 bar) pressure
Apparatus
One-bar pressure plate extractor (Soil Moisture Equipment Co., Santa Barbara, California) One-bar ceramic plates Rubber rings (5-cm diameter, l-cm height) Compressed air source with a manifold, regulator, and gauge Balance Drying oven Disposable aluminum dishes or soil-moisture cans Desiccator
Reagents
None.
Procedure
1. Submerge the ceramic plates in water for 24 hours to saturate.
2. Place plates on work bench.
3. Place labeled rubber rings in order on the plate (each plate accommodates 12 samples).
Inl Rep. NOR-X-319 21
22
4. Fill ring with 2 mm air-dried soil using a spatula (about 20 g sample). In order to avoid particle-size segregation, place entire soil sample into the ring.
5. Level, but do not pack, the sample in the ring.
6. Cover plate with water to wet sample from below. Add water between the rings until there is an excess of water (at least 3 mm deep) on the plate.
7. Cover samples with wax paper or a plastic sheet.
8. Allow samples to stand overnight.
9. The next mOrning, remove excess water from the plate with a syringe, disposable pipet, or siphon.
10. Place the triangular support in the extractor vessel on the bottom.
11. Install plate with samples in the lower-most position in the extractor. Then install the middle and top plates (the plastic spacers should be placed between plates).
12. Connect outflow tubes.
13. Close extractor and tighten, ensuring that the "0" ring is in place and all nuts are uniformly tightened. Apply desired pressure in the 0-100 kPa (0-1 bar) range. Build up the desired pressure in the vessel gradually.
14. Place a beaker to collect water from the outflow tubes.
15. Maintain pressure until no more water is being released (generally 18-20 hours; for some soils 48 hours or longer).
16. Release pressure from extractor (remove outflow tubes from water before turning instrument off).
17. Open extractor.
18. Without undue delay, transfer moist soil sample from ring with a wide-bladed spatula to a tared dish. (It is not necessary to make a quantitative transfer of the entire soil.)
19. Immediately weigh wet sample (accuracy 0.01 g) and place in drying oven at 105"C for 24 hours.
20. Place samples in desiccator, cool, and weigh.
Calculation
M . '"') -wet sample (g) - ovendry sample (g)
100 olsture ,,0 - end I (g) x ov ry samp e
Inf Rep. NOR-X-3J9
Apparatus
b. High range: moisture at 100-1500 kPa (1-15 bar) pressure
Fifteen·bar ceramic plate extractor (Soil Moisture Equipment Co., Santa Barbara, California)
Fifteen-bar ceramic plates Compressed gas (N,) cylinder with regulator, manifold, and gauge (0-2 MPa).
(Pressure regulator must be capable of controlling in the range 0.1-1.6 MPa.) Rubber rings Balance Drying oven Weighing dishes (disposable aluminum dishes or tared soil-moisture cans) ;iO-mL buret Desiccator
Reagents
None.
Procedure
1. Use IS-bar ceramic plates and follow Steps 1-12 of Section 5(ii)a, applying 1-15 bar pressure (100-1500 kPa).
2. Place beaker to collect water from outflow tubes.
3. Leave overnight.
4. Connect outflow tube to buret partially filled with tap water.
5. Samples should stay in extractor until flow has ceased from all samples on plate and soils have reached equilibrium (24-48 hours for most soils; however, some fine-textured and organic soils may need up to 120 hours). No change in readings on buret would indicate that flow has stopped from all samples and equilibrium has been attained.
6. Disconnect buret to prevent backflow of tap water.
7. Release pressure from extractor.
8. Follow Steps 17-20 of Section 5(ii)a.
Calculation
M . t "" ) wet sample (g) - ovendry sample (g)
100 OlS ure \/0 ;:;; x ovendry sample (g)
Remarks
1. If the outlets of the plates continue to bubble after a few hours of applied pressure, the plates are probably defective and should be replaced.
lnf. Rep. NOR-X-319 23
24
2. Pressure should not be allowed to fluctuate during a run. It should be checked after every 2-3 hours (and adjusted if necessary). If the pressure fluctuations are within the specified tolerance of the regulator, then no adjusting is needed.
3. Never remove extractor lid with pressure in the container.
4. The height of the sample in the ring should be as small as possible to reduce the time required to reach equilibrium, which is proportional to the square of the height of the sample in the ring.
5. Field capacity (FC) approximation: field capacity is commonly estimated by measuring the moisture retained at the following pressures:
Course-textured soils Medium-textured soils Fine-textured soils
10 kPa 33 kPa SO kPa
(0.10 bar) (0.33 bar) (0.50 bar)
6. Permanent wilting point (PWP) approximation: wilting point is commonly estimated by measuring the lSoo-kPa (1S-bar) percentage. It varies according to plant species and stage of growth, ranging from 10 to 25 bars for mesophytic plants.
7. Available water (AW) or available water capacity (AWC) approximation: available water capacity is the amount of water retained in the soil reservoir that can be removed by plants. It is estimated by the difference in soil water content between FC and PWP.
AWC (%) = FC (%) - PWP (%)
AWC values for a particular crop computed from in situ observations of FC and PWP and those from laboratory methods may be quite different, partly because laboratory methods do not consider root distribution.
8. (i) 10 kPa (0.10 bar)
For quality control three ceramic plates can be used in the extractor for each run. One reference sample is used for each plate. Duplicates are done on apprOximately 5% of samples.
Precision of moisture should be less than or equal to 10%. For example, long-term analyses of two laboratory samples were 12.03 ± 1.13% (coefficient of variation 9.4%) and 54.22 ± 1.96% (coefficient of variation 3.6%).
(ii) 33 kPa (0.33 bar)
For quality control three ceramic plates can be used in the extractor for each run. One reference sample is used for each plate. Duplicates are done on approximately 5% of samples.
Precision of moisture should be less than or equal to 5%. For example, longterm analyses of two laboratory samples were 38.72 ± 1.74% (coefficient of variation 4.5%) and 5.41 ±0.24% (coefficient of variation 4.4%).
(iii) 1500 kPa (15 bars)
In! Rep. NOR·X·319

For quality control three ceramic plates can be used in the extractor for each run. One reference sample is used for each plate. Duplicates are done on approximately 5% of samples.
Precision of moisture should be less than or equal to 10%. For example, long-term analyses of two laboratory samples were 2.65 ±0.24% (coefficient of variation 9.1 %) and 21.05 ±1.66% (coefficient of variation 7.9%).
References
Cassel, D.K.; D.R. Nielsen. 1986. Field capacity and available water capacity. Pages 901-926 in A. Klute, editor. Methods of soil analysis. Part 1, Agron. 9. Am. Soc. Agron., Madison, Wisconsin.
Klute; A. 1986. Water retention: laboratory methods. Pages 635-662 in A. Klute, editor. Methods of soil analysis, Part 1, Agron. 9. Am. Soc. Agron., Madison, Wisconsin.
Richards, L.A., editor. 1954. DiagnOSis and improvement of saline and alkali soils. U.S. Dep.Agric., Washington, D.C. Agric. Handb. 60.
van Reeuwijk, L.P., editor, 1987. Procedures for soil analysis. Int. Soil Ref. Inf. Cent., Wageningen, The Netherlands. Tech. Pap. 9.
6. ORGANIC MAnER AND ORGANIC CARBON
Principle
(i) DIRECT ESTIMATION OF ORGANIC MATTER BY LOSS-ON-IGNITION (LOI)
Organic matter is oxidized by heating at 375°C and is estimated by weight loss.
Apparatus
Muffle furnace Porcelain crucibles Desiccator
Reagents
None.
Procedure
1. Heat porcelain crucibles for one hour at 375"C.
2. Cool in open to about 150°C. Place in a desiccator, cool for 30 minutes, and weigh.
3. Weigh about 5 g ovendried sample (0.001 g accuracy), 2 mm size, into each crucible.
4. Place crucibles containing samples in muffle furnace at room temperature. Heat slowly (increase temperature about 5°C minute·') to 375"C ± 5°C.
Inf Rep. NOR·X·319 25

26
5. Maintain at 375°C ±5°C overnight (16 hours).
6. Tum furnace off and let temperature drop to about 150°C.
7. Remove crucibles and place in desiccator for 30 minutes. Weigh to the nearest milligram.
Calculation
Loss on ignition (%) (approximate
organic matter)
Remarks
weight of ovendried weight of sample sample �) - after ignition (!()
100 weight of ovendried sample (!() x
1 . This method should be indicated as loss-on-ignition (LOI). It gives an estimate of organic matter sufficiently accurate for most descriptive purposes.
2. The method is most suitable for well-aerated samples (e.g., sandy and peaty soils) with low clay mineral and inert carbon (charcoal) content.
3. It is not suitable for calcareous soils.
4. The procedure is subject to error as weight loss may include C from carbonates and water and hydroxyl groups from clay. Error is also caused by combustion of inert C compounds and volatilization of substances other than organic material.
5. There is incomplete oxidation of carbonaceous materials in some soils at 375"C.
6. Precision and accuracy: insufficient data available.
References
Atkinson, H.J.; Giles, G.R.; MacLean, A.J.; Wright, J.R. 1958. Chemical methods of soil analysis. Can. Dep. Agric., Ottawa, Ontario. Contrib. 169 (revised).
Ball, D.F. 1964. Loss on ignition as an estimate of organic matter and organic carbon in non-calcareous soils. 1. Soil Sci. 15:84-92.
Ben-Dor, E.; Barnn, A. 1989. Detenninafion of organic matter content in arid-zone soils using a simple "loss-on-ignition" method. Commun. Soil Sci. Plant Anal. 20:1675-1695.
David, M.B. 1988. Usc of loss-on-ignition to assess soil organic carbon in forest soils. Commun. Soil Sci. Plant Anal. 19:1593-1599.
Davies, B.E. 1974. Loss-on-ignition as an estimate of soil organic matter. Soil Sci. Soc. Am. Proc. 38:150-151.
Goldin, A. 1987. Reassessing the use of loss-on-ignition for estimating organic matter content in noncalcareous soils. Commun. Soil Sci. Plant Anal. 18:1111-1116.
Hesse, P.R. 1971. A textbook of soil chemical analysis. John Murray (Publishers) Ltd., London, u.K.
Houba, V.J.G.; van der Lee, J.}.; Novozamsky, I.; Walinga, I. 1988. Soil and plant analysis. Part 5: soil analysis procedures. Agric. Univ., Wageningen, The Netherlands.
In/. Rep. NOR-X-319

Jackson, M.L. 1958. Soil chemical analysis. Prentice-Hall Inc., Englewood Cliffs, New Jersey.
McKeague, J.A., editor. 1978. Manual on soil sampling and methods of analysis. Can. Soc. Soil Sci., Ottawa, Ontario.
Nelson, D.W.; Sommers, L.E. 1982. Total carbon, organic carbon, and organic matter. Pages 539-579 in A.L. Page, R.H. Miller, and D.R. Keeney, editors. Methods of soil analysis. Part 2, Agron. 9. Am. Soc. Agron., Madison, Wisconsin.
Ranney, R.W. 1969. An organic carbon-organic matter conversion equation for Pennsylvania surface soils. Soil Sci. Soc. Am. Proc. 33:809-811.
(ii) ORGANIC CARBON BY WET DIGESTION (MODIFIED WALKLEY-BLACK PROCEDURE)
Principle
Organic matter is oxidized with a mixture of K,Cr,O, and H,S04. Unused K,Cr,O, is back-titrated with FeS04. The dilution heat of concentrated H,S04 with K,Cr ,0, is the sale source of heat. Because no external source of heat is applied, the method provides only an estimate of readily oxidizable organic carbon and is used as a measure of total organic C. Organic matter is estimated on the assumption that organic matter contains 58% C (Le., Van Bemmelen factor); however, this percentage varies considerably from soil to soil. Because of the problems associated with organic matter determination, it is recommended that researchers determine and report the organic C content as a measure of the organic matter in a soil (Nelson and Sommers 1982).
Apparatus
Magnetic stirrer General purpose adjustable illuminator Repipet dispensing bottle (for K,Cr,O, solution) Acid dispenser (Brinkman dispensette, adjustable 10-50 mL, teflon-coated,
adapted to fit 4-kg H,S04 reagent bottles) Buret Asbestos sheet 125-mL Erlenmeyer flasks
Reagents
1 . Standard potassium dichromate solution (0.1667 M = 1.00 N): dissolve exactly 49.04 g reagent grade K,Cr,O, (dried at 105t for 2 hours) in water and dilute to 1 L in a volumetric flask.
2. Ferrous sulfate solution (0.5 M = 0.5 N): dissolve 140 g reagent grade FeSO,·7H,O in about 800 mL water, add 40 mL concentrated H,SO" cool and dilute to 1 L in a volumetric flask. Mix thoroughly. Keep solution in a tightly stoppered bottle. Standardize daily by titrating against standard dichromate solution (this is the blank).
3. Ortho-phenanthroline ferrous sulfate (0.025 M) indicator solution, available under the trade name Ferroin. Use directly at this strength.
4. Sulfuric acid, concentrated, not less than 96% (specific gravity 1.84).
Inf. Rep. NOR-X-319 27
28
Procedure
1. Grind about 5 g of 2-mm soil using a mortar and pestle. Do not use an iron or steel mortar. Mix soil thoroughly in mortar with a spatula.
2. Accurately weigh 0.50 g (accuracy of 0.01 g) of 0.50-mm (35-mesh) soil and brush into a 125-mL Erlenmeyer flask. Weigh less soil for heavy textured black soils, more soil for light-textured or subsurface soil (e.g., 0.05 g peat or LFH samples and 2 g sand). Generally, 0.5-2.00 g mineral soil and 0.05-0.20 g organic soil are analyzed.
3. Include two blanks to standardize FeSO, solution.
4. Add exactly 10 mL dichromate solution. Avoid spattering fine soil particles. Swirl flask gently.
5. Rapidly add 20 mL concentrated H2SO4 by directing stream into the suspension.
6. Immediately mix by gentle rotation for 1 minute. Perform in a fume hood because fumes develop in previous step. Mixing should be done carefully to avoid throwing soil up onto the wall of the flask, out of contact with the reagents. -Allow flasks to stand on an asbestos sheet for about 30 minutes (anywhere from 20 to 40 minutes).
7. Add about 30 mL distilled water and 3-4 drops of the o-phenanthroline indicator.
8. Use a motor-driven stirrer and a general-purpose adjustable illuminator when titrating. From an automatic buret, add ferrous sulfate solution rapidly at the beginning. Initially the color is dark brown (the color would depend on the organic matter content of the sample). Then the solution takes on a greenish color and changes to dark green or greenish blue. At that point, add titrant dropwise. At the end point it flashes quickly from greenish blue to reddish brown. Check by adding a drop of dichromate solution. Color should change back to greenish blue (buret should have a one drop accuracy). !fend point is overrun, add a small volume (0.5 mL) of dichromate solution (record amount added) and complete titration. The calculations should be done accordingly.
!fburet reading (peSO,) is 0-4 mL, repeat with less soil; if it is 17 mL or higher, repeat with more soil.
Calculations
. . V, -V2 C In so.I (%) = M x . hl .. '1 I (g) x 0.39, where wag '" so. samp e
M = molarity of the FeSO, solution.
V, = volume of FeSO, required for the blank (mL).
V2 = volume of FeSO, required for the sample (mL).
0.39 = 3 x 10-' x 100 x1.3, where 3 is the equivalent weight of C and 1.3 is the factor explained below.
Inf Rep. NOR-X-319
There is incomplete oxidation of the organic matter in this procedure. The factor of 1.3 is based on the assumption that there is 77% recovery.
Organic matter (%) = Organic C (%) x 1.724.
The Van Bemmelen factor of 1.724 is used because organic matter contains 58% C.
Remarks
1. Nitrates interfere only when present in quantities greater than 5% of C content.
2. Carbonates do not interfere even if they constitute up to 50% of sample weight.
3. Elemental C (e.g., charcoal) is not attacked by dichromate solution in this method.
4. Grinding of the sample is required only to reduce subsampling error and it is generally not necessary to pass the ground sample through a sieve (if required, use a nonferrous sieve).
5. Fe(II), if present in soil, will give a positive error; therefore, to avoid contamination with metallic (reduced) iron, do not grind soil samples, particularly coarse-textured soils, in iron or steel mortar.
6. Organic matter is oxidized by Cr20/". The reaction occurs through the heat of dilution generated by mixing H2SO4 with K2Cr20, solution (2 volumes H2SO4 + 1 volume K2Cr20, solution).
7. �gher oxides of Mn will give a negative error.
8. The concentration of H2S04 should be about 6 M. For this reason only 30 mL water are added. (10 mL K2Cr20, solution + 20 mL concentrated H2SO4 + 30 mL H20 would give about 6 M H2SO4,)
9. Air-dried soils seldom contain sufficient amounts of Fe(II} to cause interference. Water-logged soils often contain large quantities of Fe(TI}, but in most cases this can be oxidized by drying the soil samples prior to analysis (Heffernan 1985).
10. Chloride is oxidized to chromyl chloride, which is volatilized, resulting in high organic matter values. If high amounts of Cl are present in the sample, add 15 g Ag,S04 to 1 L of H,S04 (Reagent 4).
11. H2SO4 readily absorbs water. Therefore, use a fresh reagent (Heffernan 1985).
12. A carbon analyzer would provide a better estimate of organic C; however, not all laboratories are equipped with this instrument.
13. For quality control, a minimum of one reference sample should be analyzed per batch of 50 samples (a minimum of one reference sample daily). Duplicates are done on approximately 5% of samples. Precision of organic C should be less than or equal to 6%. For example, long-term analyses of two laboratory samples were 4.49 ± 0.16% (coefficient of variation 3.6"10) and 7.16 ± 0.42% (coefficient of variation 5.8%).
In/. Rep. NOR·X·319 29
30
References
Allison, L.E. 1960. Wet-combustion apparatus and procedure for organic and inorganic carbon in soil. Soil Sci. Soc. Am. Proc. 24:36-40.
Greweling, T.; Peech, M. 1960. Chemical soil tests. Cornell Univ. Agric. Exp. Stn. Bull. 960.
Heffernan, B. 1985. A handbook of methods of inorganic chemical analysis for forest soils, foliage and water. Commonw. Sci. Ind. Res. Organ. Div. For. Res., Canberra, Australia.
Nelson, D.W.; Sommers, L.E. 1982. Total carbon, organic carbon, and organic matter. Pages 539-579 in A.L. Page, R.H. Miller, and D.R Keeney, editors. Methods of soil analysis. Part 2, Agron. 9. Am. Soc. Agron., Madison, Wisconsin.
Walkley, A. 1947. A critical examination of a rapid method for determining organic carbon in soils: effect of variations in digestion conditions and of inorganic soil constituents. Soil Sci. 63:251-263.
Walkley, A.; Black, LA. 1934. An examination of the Degfjareff method for determining soil organic matter and a proposed modification of the chromic acid titration method. Soil Sci. 37:29-38.
7. pH IN WATER OR CaCb
Principle
pH is measured potentiometrically in a saturated paste or a supernatant liquid that is in equilibrium with a soil suspension of a 1:2 soil-to-liquid mixture (1:4 for organic soils). The liquid is either water or an electrolyte (0.01 M CaCI,).
Apparatus
Digital pH/m V meter (e.g., Fisher Accumet Selective Ion Analyzer Model 750) with a combination electrode and an automatic temperature compensator
Brinkmann dispenser, adjustable to deliver 20 mL
Reagents
1. CaCl, solution (0.01 M): dissolve 14.7 g CaCl,·2H,O in 10 L water. Check pH of solution; it should be between 5.0 and 6.5. If required, adjust with Ca(OH), or HCl. The specific conductivity should be 2.32 ±0.08 mS cm
·j at 25"C. (In the last 23 years in the NoFC laboratory, it has been found that there has never been any need to adjust the pH, and the EC has always been within the specified range.)
2. Buffer solutions: pH 4.0, 7.0, and 10.0.
(i) pH OF SATURATED PASTE
Procedure
1. Half-fill a 400-mL plastic beaker with soil.
2. Add sufficient water until the whole soil is just wet: See Step 4 of this procedure. (Note: It is more convenient to prepare a batch of samples.)
In/. Rep. NOR·X·3J9
3. Stir soil with a spatula. Add a few more drops of water and stir. Consolidate soil-water mixture periodically during stirring by tapping beaker on the workbench. In this way, prepare a saturated soil paste that flows slightly but does not fall from the beaker when tipped. Also, with the exception of clays, the paste should slide freely off the spatula. Surface of the water-saturated soil glistens as it reflects light.
4. Cover beakers. Leave soil for 1 hour to equilibrate and check for saturation. Free water should not collect on the soil surface, nor should the paste stiffen markedly or lose its glistening appearance on standing. Add more water if required, and mix well. (Keep a record of the amount of soil and the amount of water added to prepare the saturated paste if analytical results are to be expressed on a dry-soil basis rather than on the basis of saturation extract.)
5. Insert electrode into the paste and raise and lower in paste repeatedly to provide readings in different parts of sample uritil a representative pH reading is obtained.
(ii) pH OF sOIL-TO-sOLUTlON RATIO OF 1:2 (1:4 FOR ORGANIC SOILS) USING CaCb SOLUTION OR
H20 AS THE SUSPENSION MEDIUM
Procedure
1. Weigh 10 g of 2 mm air-dried soil into a 50- or 100-mL beaker.
2. Add 20 mL (40 mL for organic soils) of CaCl2 solution (use water instead of CaCl2 solution throughout the procedure when H,O is needed as a suspension medium).
3. Allow soil to absorb CaCl, solution without stirring, then thoroughly stir for 10 seconds using a glass rod.
4. Further stir suspension four or five times during the next 30 minutes.
5. Allow suspension to settle for 30 minutes.
6. Measure pH by immersing the combination electrode in supernatant solution.
7. Record pH value when the reading has stabilized (usually 1 minute).
(iii) pH OF FIELD-MOIST ORGANIC SAMPLES
Procedure
1. Weigh 10 g moist soil into a 100-mL beaker.
2. Prepare a saturated paste using 0.01 M CaCl2 solution (Section 7(i)). Use water instead of CaCl2 solution throughout the procedure when H20 is needed as a suspension medium.
3. Add 20 mL 0.01 M CaCl2 solution.
In! Rep. NOR-X-3J9 31
32
4. Stir suspension five or six times during the next 30 minutes.
5. Follow procedure for 1:2 soil-to-solution suspension (Section 7(ii».
Calculations
None.
Remarks
1. The measurement of soil pH in 0.01 M CaCl, solution offers the following advantages:
(i) The pH is almost independent of dilution over a wide range of soil:CaCl, ratios.
(ii) It provides a good approximation of the pH of the soil solution under field conditions.
(iii) Results are more reproducible than pH measured in H,O.
(iv) The values obtained are less dependent on the positioning of the electrode.
(v) 0.01 M CaCl, solutionis similar in electrolyte composition to soil solutions found at optimum moisture conditions for plant growth in nonsaline soils.
(vi) The CaCl, solution masks the variability in salt content of soils, and soil is maintained in a flocculated condition, eliminating suspension effects.
2. The pH meter should be calibrated with two buffers that bracket the expected pH of the soils (commonly pH 4.0 and 7.0 buffers). Buffer adjustment should be made at least once a day. If should be checked after an extended series of measurements.
3. Keep the pH buffer properly stoppered and never pour buffer solution back in the bottle.
4. Buffer solutions, especially pH 9.0 and 10.0, are sensitive to CO, and may soon become unreliable. Therefore, these solutions should not be stored for long periods.
5. The CO, status of some soils changes with time; therefore, undue delay in taking a reading after introducing the electrode should be avoided. The initial pH of a nonalkaline soil may be as much as 0.5 pH unit greater than the reading taken after the sample has stood for 30 minutes or longer.
6. Never allow sample solutions to dry on the electrode.
7. Do not rub electrode against the sides of the beaker.
8. Store electrode in an electrode storage solution or a pH 4.0 to 7.0 buffer solution.
In! Rep. NOR-X-319
9. Instrument should always be switched to standby or off position before removing electrode.
10. Presence of clay may slow the electrode response. To avoid this, thoroughly clean electrode between samples. If electrode response is slow, clean by immersing in weak HCl solution overnight.
11. Wiping electrode dry with cloth or tissue or removing the electrode from solution when the meter is not on standby could cause electrode polarization.
12. When preparing saturated paste, keep the following points in mind.
(i) Do not stir soil until the entire soil mass is wet.
(ii) Dry organic soils (especially, if coarse or woody in texture) require overnight wetting to obtain a definite end point for the saturated paste. These usually stiffen on standing and require additional water and remixing to obtain stable saturated paste.
(iii) After the first wetting, paste usually stiffens and loses its shine on standing. Adding water and remixing gives a mixture that retains the characteristics of a saturated paste.
(iv) For mineral soils, about twice the field capacity is generally the amount of water required to obtain saturation percentage.
13. Air-drying can cause changes in pH values (e.g., through oxidation of sulfides). The determination of pH of field moist samples presents two limitations: taking a representative sample is difficult; and biological activity can affect pH during storage of soils in their natural state of moisture. Air-drying prevents development of acidity during moist storage.
14. The pH measured in 0.01 M CaCl2 is about 0.5 unit lower than that measured in water (soil-to-liquid ratio of 1:2).
15. Suspended colloids influence pH through the junction potential effect. In the presence of negatively charged colloids (e.g., clay particles or organic matter), pH measured in the suspension will usually be lower than measurement in the supernatant liquid. This is the suspension effect. This effect is extremely pronounced in peat soils because there is often little supernatant. The pH may vary as much as one unit between the supernatant and soil sediment. In every sample, therefore, place the electrode junction at the same distance above the surface of the soil to maintain uniformity in pH readings.
16. Method 7(iii) is used for organic soils only. This method was developed in the NoFC laboratory to ensure that approximately the same volume of supernatant solution is present.
17. Report the pH readings of the water and CaCl2 as blanks.
18. (i) For quality control of the saturation moisture percentage, a minimum of one reference sample should be analyzed per batch of 40 samples (a minimum of one reference sample daily). Duplicates are done on approximately 5% of samples. Precision of moisture should be less than or equal
Inj.Rep.NOR·X·319 33
34
to 10%. For example, long-term analysis of a laboratory sample was 33.14 ± 2.68% (coefficient of variation 8.1%).
(ii) For quality control in pH of saturated paste, a minimum of one reference sample should be analyzed per batch of 40 samples (a minimum of one reference sample daily). Duplicates are done on approximately 5% of samples. Precision of pH should be less than or equal to 5%. For example, long-term analyses of two laboratory samples were 5.1 ± 0.2 (coefficient of variation 3.6%) and 8.2 ±0.1 (coefficient of variation 1.5%).
(iii) In pH of 1.1 soil:H,O suspension (method not given here but used in many laboratories), ensure quality control by analyzing a minimum of one reference sample per batch of 40 samples (a minimum of one reference sample daily). Duplicates are done on approximately 5% of samples. Precision of pH should be less than or equal to 5%. For example, longe term analysis of a laboratory Sample was 4.4±0.1 (coefficient of variation 2.5%). The results reported by the Expert Committee on Soil Survey for 10 laboratories were 4.4 ±O.2 (coefficient of variation 4.5%).
(iv) For quality controlin pH of 1:2 soil:H,O suspension, a minimum of one reference sample should be analyzed per batch of 40 samples (a minimum of one reference sample daily), Duplicates are done on approximately 5% of samples. Precision of pH should be less than or equal to 5%. For example, long-term analysis of a laboratory sample was 8.6 ±0.2 (coefficient of variation 2.2%).
(v) For quality control in the pH by CaCl, method, a miriimum of one reference sample should be analyzed per batch of 40 samples (a minimum of one reference' sample daily), Duplicates are done on approximately 5% of samples. Precision of pH should be less than or equal to 5%. For example, long-term analysis of a laboratory sample was 6.1 ±O.l (coefficient of variation 1.2%). The results reported by the Expert Committee on Soil Survey for 12 laboratories were 6.1 ±0.1 (coefficient of variation 1.6%).
References
Blackmore, L.c.; Searle, P.L.; Daly, B.K. 1987. Methods for chemical analysis of soils. N.Z. Soil Bur., Lower Hutt, N.Z. Sci. Rep. 80.
Davey, B.C.; Conyers, M.K. 1988. Detennining the pH of acid soils. Soil Sci. 146:141-150.
McKeague, J .A., editor. 1978. Manual on soil sampling and methods of analysis. Can. Soc. Soil Sci., Ottawa, Ontario.
Richards, L.A., editor. 1954. Diagnosis and improvement of saline and alkali soils. U.S. Dep. Agric., Washington, D.C. Agric. Handb. 60.
Schofield, R.K.; Taylor, A.W. 1955. The measurement of sail pH. Soil Sci. Am. Proc. 19:164-167.
van Reeuwijk, L.P., editor, 1987. Procedures for soil analysis. Int. Soil Ref. Inf. Cent., Wageningen, The Netherlands.
Inf. Rep, NOR·X-319

8. ELECTRICAL CONDUCTIVITY AND SOLUBLE SALTS
Principle
Total soluble salts are estimated from electrical conductivity (EC) of aqueous soil extracts. If needed, cations and anions are also determined. The extract is obtained from saturated paste or 1:2 and 1:5 soil-to-water mixtures by vacuum filtration. The saturation extract procedure is the preferred method as this gives a better representation of the actual soil conditions with respect to plant roots than does the analysis of extracts of wider soil-to-water ratios. Other ratios (e.g., 1:2 or 1:5) are suitable for some purposes. If the amount of soil sample is limited, a 1:5 soil-to-water ratio might be the best choice. Sparingly soluble salts (e.g., gypsum) result in an overestimation of salinity when high soil-to-water ratios are used.
Apparatus
Beakers, plastic (400 mL) 250-mL Erlenmeyer flasks 250-mL suction flasks BUc1mer funnels (7-cm diameter) Eberbach reciprocating shaker Conductivity meter, Radiometer, Model CDM 3 Conductivity cell, pipet type, CDC 314 Thermometer (accuracy ±0.1 0C) Manifold for vacuum filtration Whatrnan 42 filter papers
Reagent
0.01 M KCl solution: dissolve 0.7456 g dry KCl in water and make up to 1 L. This solution has an electrical conductivity of 1.413 mS cm-! at 25°C (Table B-1).
Procedure
Table 8-1. Specific conductivity values of 0.01 M KCl solution
Temperature (0C)
1B 19 20 21 22
Specific conductivity (mS em-!)
1.225 1.251 1.27B 1.305 1.332
(i) SATURATION EXTRACT METHOD FOR EC
1. Prepare saturated paste as in Section 7(i).
Inf. Rep. NOR-X-319 35
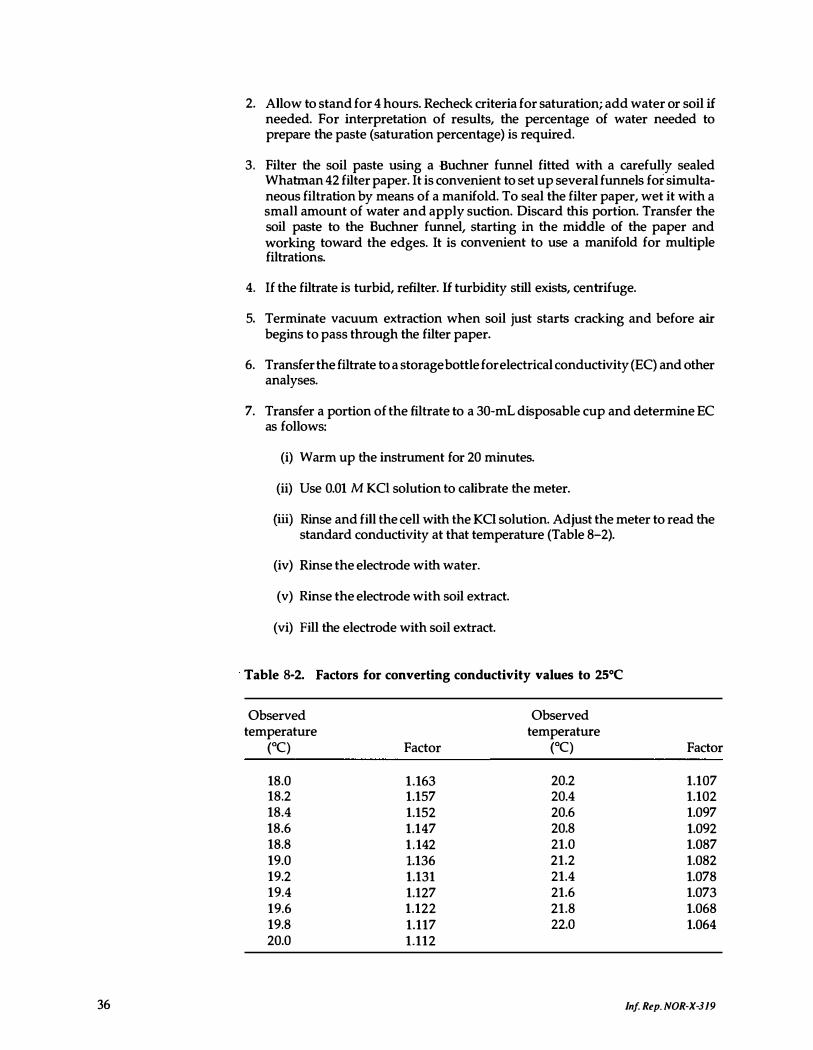
36
2. Allow to stand for 4 hours. Recheck criteria for saturation; add water or soil if needed. For interpretation of results, the percentage of water needed to prepare the paste (saturation percentage) is required.
3. Filter the soil paste using a Buchner funnel fitted with a carefully sealed Whatman 42 filter paper. It is convenient to set up several funnels for simultaneous filtration by means of a manifold. To seal the filter paper, wet it with a small amount of water and apply suction. Discard this portion. Transfer the soil paste to the Buchner funnel, starting in the middle of the paper and working toward the edges. It is convenient to use a manifold for multiple filtrations.
4. If the filtrate is turbid, refilter. If turbidity still exists, centrifuge.
5. Terminate vacuum extraction when soil just starts cracking and before air begins to pass through the filter paper.
6. Transfer the filtrate to a storage bottle for electrical conductivity (EC) and other analyses.
7. Transfer a portion of the filtrate to a 30-mL disposable cup and determine EC as follows:
(i) Warm up the instrument for 20 minutes.
(ii) Use 0.01 M KCI solution to calibrate the meter.
(iii) Rinse and fill the cell with the KCI solution. Adjust the meter to read the standard conductivity at that temperature (Table 8-2).
(iv) Rinse the electrode with water.
(v) Rinse the electrode with soil extract.
(vi) Fill the electrode with soil extract.
Table 8-2. Factors for converting conductivity values to 25°C
Observed Observed temperature temperature
(0C) Factor (0C) Factor
18.0 1.163 20.2 1.107 18.2 1.157 20.4 1.102 18.4 1.152 20.6 1.097 18.6 1.147 20.8 1.092 18.8 1.142 21.0 1.087 19.0 1.136 21.2 1.082 19.2 1.131 21.4 1.078 19.4 1.127 21.6 1.073 19.6 1.122 21.8 1.068 19.8 1.117 22.0 1.064 20.0 1.112
In! Rep. NOR·X·319

(vii) Record the conductivity reading. Note the temperature of the filtrate to the nearest O.l°C and correct the conductivity readings for temperature to express results as mS cm·l at 25°C (Table 8-2).
(viii) Store the cell in distilled water.
(ii) 1:2 50IL·TO·WATER EXTRACTION METHOD FOR EC
Procedure
1. Weigh 40 g of 2 mm air·dry soil (or its equivalent of field-moist soil) and transfer it to 250-mL Erlenmeyer flask.
2. Add 80 mL water; the water in the field-moist soil is included in this 80-mL volume. (Note: In general, no allowance is made for the water in air-dry soil; however, correction should be made for hygroscopic water in soils having high contents of organic matter or clay where water content will be more than 5%.)
3. Stopper the flasks.
4. Shake the mixture on the reciprocating shaker for 1 hour.
5. Filter using Buchner funnels as described above.
6. Determine EC as in the previous section. Conductivity increases about 2% for 1°C. Temperatures of soil extracts range from 18.0 to 22.0°C. Correction factors for these temperatures are given in Table 8-2. For additional temperature variation, see Weast et al. (1989).
(iii) 1:5 50IL·TO·WATER EXTRACTION METHOD FOR EC
Procedure
1. Weigh 15 g 2mm air-dried soil (or its equivalent of field-moist soil) and transfer it to a 250-mL Erlenmeyer flask. (Generally no correction is made for H20 in the air-dry soil.)
2. Add 75 mL water. (The water in the field-moist soil is included in this 75-mL volume).
3. Follow Steps 3 to 6 of Method 8(ii).
Calculations
The electrical conductivity is reported as millisiemens per centimetre at 25°C (mS cm-'). Multiply the observed conductivity reading with the temperature factor (Table 8-2) to express the results at 25°C.
EC ofl:2 extract x 2 = EC of soil. EC ofl:2 extract x 2 = EC, approximate equivalent of saturation extract (depends on
soil type). EC ofl:5 extract x 5 = EC of soil.
Inf. Rep. NOR-X·319 37
38
(iv) SOLUBLE INDIVIDUAL IONS
If the EC of the soil saturation extract is greater than 2.0 mS cm-! (or greater than 1.0 for the 1:2 soil-to-water extract, equivalent to about 0.15% total soluble salt content of soil), retain the water extract for soluble ions. For specific purposes any ion which is water soluble may be determined. Cations commonly determined are Ca, Mg, K, and Na. Anions that are often determined are Cl and SO.; CO, and HCO, usually occur in small amounts unless the pH is high.
Qualitative Tests
Calcium
A few drops of about 5% ammonium oxalate [(NH.),C,O.·H,O] solution are added to the extract. The presence of a white precipitate of CaC,O. is noted after warming the mixture for 10 minutes.
Magnesium
A few drops of about 10% sodium ammonium phosphate (NaNH.HPO.·4H,O) are added to the extract and made strongly alkaline with NH,OH. After stirring, the presence of a flocculent precipitate is noted.
Chloride
The extract is acidified with HN03 and a few drops of about 5% AgNO, solution are added. A white, curdy precipitate is formed. If presence of carbonate is also suspected, dilute HNO, is added to observe dissolution. Insolubility of the precipitate confirms precipitate due to chloride. The soils are rated (low, medium, and high) depending upon the visual estimation of turbidity and/or precipitate of AgCl.
Sulfate
A few drops of about 10% BaCl, solution, acidified with HCl, are added to the extract. The presence or absence of SO. is indicated by the visual estimation of turbidity and/ or white precipitate of Ba50 •.
Quantitative Tests
1. Ca, Mg, Na, K: ICP-AES or AAS methods.
2. Cl: Potentiometric titration with AgNO, (See Section 21).
3. 50.: 50. by IC or S by ICP-AES.
4. In CO, and HCO, (alkalinity) tests, soluble carbonates are unlikely to occur if the soil pH is less than 9.5.
In! Rep. NOR-X-319
Carbonate and bicarbonate
Principle
Carbonate and HC03 are determined potentiometrically by titration with 0.01 M HCI to pH 8.3 and 4.5, respectively.
Apparatus
Radiometer automatic potentiometric titration system, including TIT 80 Titrator PHM 82 Standard pH meter ITA 60 Titration Assembly ABU 12 Autoburette
Reagents
Hydrochloric acid (0.01 M HCl).
Procedure
1 . Transfer a 10-mL aliquot to a beaker. (If necessary, add H20 until the electrode is submerged,)
2. Set the end point to pH 8.3 and titrate.
3. Record the titrant volume (V). 4. Set the end point to pH 4.5.
5. Continue titration without refilling the buret to zero.
6. Record the titrant volume (T).
Calculations
-1 _ Molarity 1000 C03 (mM L ) - (V -b) x ofHCl x 10
-1 _ Molarity 1000 HC03 (mM L ) - (T-2V -b) x ofHCl x 10 , where
b = blank. V = volume of HCl (mL) to titrate to pH 8.3. T = total volume of HCl (mL) to titrate to pH 4.5.
Remarks
1. Because KCl from the pH electrode will contaminate the paste, it is recommended that a separate paste should be made for electrical conductivity determination. If, however, there is not enough sample for two separate pastes, then the same paste can be used for both analyses; ensure that the pH electrode is not left in the paste unnecessarily.
Inf. Rep. NOR-X-319 39
40
2. Carbonate and HCO, should be determined soon after preparing extracts because CaCO, precipitates on standing. If other analyses (Ca, Mg, K, Na, C1, and SO,) cannot be performed immediately, refrigerate the extracts.
3. The titration can also be performed colorimetrically. Use phenolphthalein indicator (equivalent to pH 8.3 end point) and titrate until pink color disappears. Add methyl orange indicator and titrate until it turns orange (equivalent to pH 4.5 end point). A colorimetric method cannot be used for strongly colored soil extracts.
4. Determination of EC is especially important in heavily-fertilized nursery soils and salt-affected soils, which may accumulate salts in quantities detrimental to plant growth.
5. Electrical conductivity should be measured as soon as the extracts are prepared because of possible changes in ionic content due to microbial activity during storage at room temperature. If needed, however, the extracts can be stored for a week under refrigeration (4°C) before measuring the conductivity.
6. Generally, one-quarter to one-third of the water in saturated paste can be removed by vacuum filtration.
7. Soil samples should. not be ovendried before extracting for the determination of solUble salts.
8. The values for saturation extract can be calculated from the 1:2 soil-to-water measurement by the equation:
EC (saturation extract) = ECn x t . '1 2�0
t t ' fl. ) . wa er In SOl a sa ura IOn 0
9. (i) Sodium adsorption ratio _ Na+ (SAR) - V(Ca'+ + Mg'}i2
(ii) ,ft Potassium adsorption ratio - C:�F"'7';�� (PAR) -
..J(Ca'+ + Mg'}i2
(iii) The soluble sodium percentage value is useful as a supporting criterion in the distinction of solonetzic from chernozemic soils. It is calculated as follows:
Soluble sodium percentage = Na +
x 100 (SSP) Ca2+ +Mg'+ +Na+ +K'
Note: In the above calculations, cation concentrations are expressed as mol, m" (same as meq L·l). Specify the soil-to-water ratio.
10. (i) Salt concentration, mg rl=640 xEC (mS cm·l).
(ii) Osmotic pressure of solution, bars at 25°C �0.36 xEC (mS cm·l).
11. The SI unit for conductivity is siemens per meter (S m·l). In the past the results have been reported as mmho cm·l, which is equal to mS cm·l (1 mho = 1
Inf Rep. NOR·X·JI9
Siemen). This manual, therefore, uses rnS cm·1 . If required, the results can be converted to SI units as follows:
mS cm-1 = dS m-1 = S m-1 x 10
mS cm4 x O.1 = S m-1
12. (i) For quality control in the saturation extract, a minimum of one reference sample should be analyzed per batch of 40 samples (a minimum of one reference sample daily). Duplicates are done on approximately 5% of samples. Precision ofEC should be less than or equal to 15%. For example, long-term analysis of a laboratory sample was 0.52 ±0.06 mS cm-1 (coefficient of variation 11.4%).
(ii) For quality control in EC, 1:2 soil:HzO, a minimum of one reference sample should be analyzed per batch of 40 samples (a minimum of one reference sample daily). Duplicates are done on approximately 5% of samples. Precision ofEC should be less than or equal to 10%. For example, long-term analYSis of a laboratory sample was 0.48 ±0.04 mS cm-1 (coefficient of variation 8.0%).
References
Ballantyne, A.K.; Clayton, J.S. 1963. The relationship of water-soluble cations to field separations of Chernozemic and Solonetzic soils. Can. J. Soil Sci. 43:359-369.
Blackmore, L.C; Searle, P.L.; Daly, B.K. 1987. Methods for chemical analysis of soils. N.Z. Soil Bur., Lower Hutt, New Zealand. Sci. Rep. 80.
McKeague, J.A., editor. 1978. Manual on soil sampling and methods of analysis. Can. Soc. Soil Sci., Ottawa, Ontario.
Rhoades, J.D. 1982. Soluble salts. Pages 167-179 in A.L. Page, R.H. Miller, and D.R. Keeney, editors. Methods of soil analysis. Part 2, AgTOn. 9. Am. Soc. Agron., Madison, Wisconsin.
Richards, L.A., editor. 1954. Diagnosis and improvement of saline and alkali soils. U.S. Dep. Agric., Washington, D.C. Agric. Handb. 60.
Sheldrick, B.H., editor. 1984. Analytical methods manual 1984. Agric. Can., Land Resour. Res. Inst., Res. Branch, Ottawa, Ontario. Contrib. 84-30.
Sonnevelt, c.; van den Ende, J. 1971. Soil analysis by means of a 1:2 volume extract. Plant Soil 35:505-516.
U.S. Department of Agriculture Soil Survey Staff. 1951. Soil survey manual U.S. Dep. Agric., Washington, D.C. Handb. 18.
van Reeuwijk, L.P., editor, 1987. Procedures for soil analysis. lnt. Soil Ref. Inf. Cent., Wageningen, The Netherlands.
Weast, R.c.; Lide, D.R.; Astle, M.J.; Beyer, W H. 1989. Handbook of chemistry and physics. CRC Press Inc., Boca Raton, Florida.
Inf Rep. NOR-X-319 41
42
9. PARTICLE-SIZE ANAL VSIS
Principle
The mineral part of the soil is separated into different-size fractions (sand at sizes 0.05-2.00 mm, silt at sizes 0.002-0.05 mm, and clay at sizes less than 0.002 mm). The proportions of these fractions are determined by the sedimentation principle based on Stokes' law, which relates the radius of the particles to the velocity of sedimentation. For the purpose of determination, the real density of soil particles is assumed to be 2.65 Mg m·3•
In the NoFC laboratory, the hydrometer method and the pipet method are used, depending upon the purpose of the analysis. In the former method, a hydrometer is used to measure the density of a soil suspension. In the latter method, sand is removed after dispersion by sieving (fractionation by dry sieving) and the silt and clay are determined on aliquots of soil suspension at predetermined times.
Pretreatments are often used to ensure the complete dispersion of the primary soil particles. The hydrometer method without any pretreatment is sufficient for most purposes; however, for soils high in organic matter, pretreatment is still required. For the pipet method, it is important that the soil be pretreated to remove cementing materials (CaC03) and organic matter. Pretreatments can alter or dissolve some primary soil minerals; for example, physical treatment, such as violent stirring to break down aggregates, can fragment primary particles.
Apparatus
(i) BOUYOUCOS HYDROMETER METHOD
a. Without pretreatment (for soils with up to about 5% organic matter)
American Standard Testing Methods soil hydrometer, 152H (20°C) with Bouyoucos scale (0-60 g L·I)
Electric mixer (at NoFC, a milkshake machine: Hamilton Beach Company, Racine, Wisconsin) 16 000-lS 000 rpm when running idle, together with the baffles in the cup
Metal disperSing cups Glass sedimentation cylinders marked at the 1000-mL level; the 1000-mL mark
should be 36 ±2 em from the bottom of the inside of the cylinder. Perforated brass plunger, consisting of a circular brass plate 1.5 mm thick and 5-mm
diameter, and a brass rod 5 mm x50 cm, fastened to the center of the plate. Stopwatch Thermometer (range 10-50°C)
Reagents
1. Calgon solution (100 g L·I): dispersing agent calgon consists of sodium hexametaphosphate with sufficient Na,C03 to give a pH of about S.3 in a solution containing 100 g of the dissolved constituents, dissolved and diluted to 1 L (10% solution).
2. Amyl alcohol.
Inf Rep. NOR·X·319
Procedure
1. Transfer 50 g fine-textured 2-mm air-dried soil (0.1 g accuracy) to a dispersion cup. For sands (90-100% sand), transfer 100 g of the sample.
2. Add water to make up volume to about 400 mL.
3. Add 50 mL calgon solution (or add 100 mL for 100-g sample) and stir on the milkshake machine for 15 minutes.
4. Transfer the soil suspension quantitatively to the sedimentation cylinder.
5. Add water to make up to 1-L mark (include a blank consisting of 50 mL calgon solution and 950 mL H,o).
6. Cover the cylinder with a watch glass and let it stand overnight to equilibrate to room temperature on a vibration-free bench.
7. Insert the plunger close to the bottom of the cylinder and stir the suspension vigorously for approximately 2 minutes (about 25 strokes) by moving the plunger up and down the whole length of the column, in order to loosen sediment settled on the bottom of the cylinder. Move the plunger cautiously near the top of the cylinder to avoid spilling the contents. It is important not to remove plunger out of suspension or bubbles will form, disrupting sedimentation. Finish stirring with two or three slow, smooth strokes.
8. Remove the plunger, tipping it slightly to remove adhering drops of suspension.
9. Immediately lower a hydrometer gently into the suspension.
10. Take the hydrometer reading (top of the meniscus) exactly 40 seconds after the completion of stirring. Add a couple of drops of amyl alcohol if the surface of the suspension is covered with foam.
11. Remove the hydrometer. Determine the temperature of the suspension at about 5 em depth. Clean the hydrometer with water for the following suspensions.
12. Let the cylinder stand undisturbed. Take hydrometer and temperature readings at the end of 2 hours.
Calculations
For every 1"(: above 20"(:, a 0.36 graduation is added to the hydrometer reading, and for every l°C below 20"(:, a 0.36 graduation is subtracted.
The correct hydrometer readings are obtained by correcting for temperature and subtracting the blank reading.
(a) corrected hydrometer
S 'I I I''' ) reading at 40 seconds 100 I t + c ay vo = . . x sample welght (g)
Inf. Rep. NOR·X·3I9 43
44
(b) corrected hydrometer
Clay <:'/0) � reading at 2 hours
x 100 sample weight (g)
(c) Silt (%) � (a) - (b) (d) Sand <:'/0) � 100 - (a)
b. With pretreatment to remove organic matter and soluble salts
Apparatus
Same as Section 9(i)a, plus: Hot plate and desiccator Sieve (15-cm diameter), 0.050 mm (if 0.050-mm sieve is not available, 0.053-mm
sieve can be used)
Reagents
1-2. Same as Section 9(i)a.
3. H,O, (30%).
Procedure
1. Transfer 50 g soil (or 100 g sand) to 1-L beaker.
2. Add about 50 mL water.
3. Add about 50 mL H,O, slowly. To avoid excessive foaming, H,O, is added carefully in 10-20 mL increments until reaction slows.
4. Stir. Place a watch glass over beaker to prevent clay from spattering.
5. Observe closely for 15-20 minutes. If excessive frothing occurs, cool suspension by adding cold water or by placing beakers in a basin with cold water. A few drops of amyl alcohol can be added to suppress frothing; a jet of water from a wash bottle can also be used.
6. Wash soil adhering to watch glass into beaker.
7. When frothing has subsided, place beakers on hot plate and heat at about BO°e. (If there is excessive frothing, the samples should be allowed to stand overnight before heating.)
8. Add more H,O,.
9. Repeat Steps 7 and 8 until no more frothing occurs. (The supernatant solution will be clear at this time and the sample will have a bleached color.)
10. Rinse down and rub off the sides of the beaker occasionally, and wash off any soil adhering to the watch glass.
In! Rep. NOR·X·319
11. Add water to the 400-mL mark on the beaker.
12. Place the beakers on a hot plate and boil for about 1 hour after the final addition of H,O, to remove excess H,O,. (Do not allow samples to go to dryness.)
13. Remove beaker from hot plate and allow to cool and settle.
14. Siphon off the supernatant liquid.
15. Add about 250 mL H,O in a jet strong enough to stir the sample in order to redisperse sediment. Repeat Step 14.
16. Repeat Step 15 twice. Test the supernatant for Cl with AgN03 and SO, with BaCl, solution (see Section 8(iv» .
17. Transfer the suspension to the dispersion cup.
18. Follow Steps 2-12 of Section 9(i)a.
19. Pass suspension through a 0.050-mm sieve by placing the sieve over a sink.
20. Wash sediment until the water passing through sieve is clear.
21. Transfer sand into tared 250-mL beaker.
22. Evaporate excess water and dry sand by placing beakers in oven at 105"C for 24 hours.
23. Cool in desiccator and weigh (0.1 g accuracy). (The sand can be fractioned into different sizes as described in Section 9(ii).)
Calculations
(a)
Correct the hydrometer readings for temperature and blank as in Section 9(i)a.
corrected hydrometer
S ·I I " reading at 40 seconds I t +c ay (lo) = . sample weIght �) x 100
(b) corrected hydrometer
CIa Yo = reading at 2 hours x 100 y r, )
sample weight �)
(c) Silt ("!o) = (a) - (b)
(d) S d ("J. _ weight of sand x 100 an 0) - sample weight �)
where
Sample weight _ corrected hydrometer sand �) obtained from Step 23 �) - reading at 40 seconds + of Section 9(i';1 procedure
In/. Rep. NOR·X-319 45
46
(ii) PIPET METHOD
Apparatus
Electric mixer, metal dispersing cups, glass sedimentation cylinders, perforated brass plunger, hot plate; and sieve (as in Section 9(i)b)
Constant temperature water bath with clips to hold cylinders Pipet assembly: permits sliding the pipet (20 mL) laterally, and lowering the pipet
to a precise depth in the suspensions Beakers, 50 and 100 mL Sieve shaker (500 oscillations minute-I) and set of sieves Desiccator
Reagents
1. Dispersing agent as in Section 9(i)a.
2. H,o, (30%).
3. Dilute HCl, about 1 M (1 volume acid + 11 volumes water).
Procedure
Pretreatment to remove carbonates (if soil pH in water is higher than 6.8).
1. Transfer 10 g soil' (2.00 mm air-dried) into 500-mL beaker. A larger weight (20-30 g) should be taken for sandy soils_ (Nine samples and a blank can be done at a time with the constant temperature bath used in the NoFC laboratory).
2. Add about 100 mL water. Mix.
3. Add 1 M HCl slowly. Cover beaker with watch glass. After effervescence has stopped,' heat on hot plate for .15-30 minutes. If CaC03 equivalent percentage is known, 3 mL of 1 M HCl are needed for each 1 % CaC03 using 10 g soil. Add extra 1 M HCI.
4. Add about 100 mL water, allow to stand 2 hours, and siphon off supernatant solution.
5. Add about 100 mL water and repeat Step 4. (This washing process is to remove excess HCl and CaCl,.)
Pretreatment to remove organic matter.
1. In the 500-mL beaker, add about 10 mL H,O, slowly to sample after removal of carbonates, or directly to 10 g soil (if pH is less than 6.8), to which about 10 mL water has been added.
2 All weighings in the pipet method have 0.01 g accuracy.
3 Soil carbonates sometimes occur as hard compact nodules or as dolomite. Soil should be left overnight in contact with He} to ensure complete dissolution.
In! Rep. NOR·X-319
2. Follow Steps 4-17 of Section 9(i)b.
3. Follow Steps 2 and 3 of Section 9(i)a (but use 10 mL Calgon solution instead of 50 mL).
Detennination.
1. Determination of sand:
(i) Affix a large funnel to a stand for wet sieving.
(ii) Place a 300-mesh sieve (0.050-mm), 15 cm in diameter, into funnel positioned above a 1-L sedimentation cylinder.
(iii) Shake suspension in cup for a few seconds, then allow to settle for about 10 seconds. Carefully pour suspension through the sieve without transferring any sand onto the sieve at this stage, as it will clog the sieve (particularly in samples with a high content of silt/sand-size particles). Pouring suspensions while shooting a stream of water from a wash bottle onto the screen usually prevents clogging.
(iv) Add about 100 mL water to the cup and repeat Step 1(iii), above.
(v) Repeat Step l(iv) about five times until most of the silt and clay is washed through the sieve before transferring the sand to the sieve. Transfer remaining contents from the cup onto the sieve and thoroughly wash sand retained on the sieve until the water passing through the sieve is clear. To wash silt and clay out of the sand, it is necessary to work the sediment from side to side of the sieve by directing a jet of water from a wash bottle against the inside wall of the sieve. This provides a swirling action of the suspension, whidl also helps in preventing clogging of the sieve.
Tapping the side of the sieve with fingers or a rubber stopper helps to pass the sample through the sieve. Avoid using jets of water because they might break the fine mesh of the sieve. Gently rubbing the screen with a rubber policeman can unclog the screen. Ensure that all the sand is removed from the cup.
(vi) Continue washing until the volume in the cylinder is about 950 mL.
(vii) Remove the sieve.
(viii) Tilt sieve about 30° and wash all sand down to the lower side of the sieve. Carefully invert the sieve in the funnel and direct water from the wash bottle through the underside of the sieve to wash the sand into a 100-mL tared beaker. When only a few grains of sand remain, rotate the sieve while continuing the washing until all the sand has been washed out. Care must be taken to keep the volume of water below 70 mL.
(ix) Dry overnight at 105°C; cool in desiccator and weigh to determine sand content.
2. Determination of silt and clay:
Inf. Rep. NOR·X·319 47
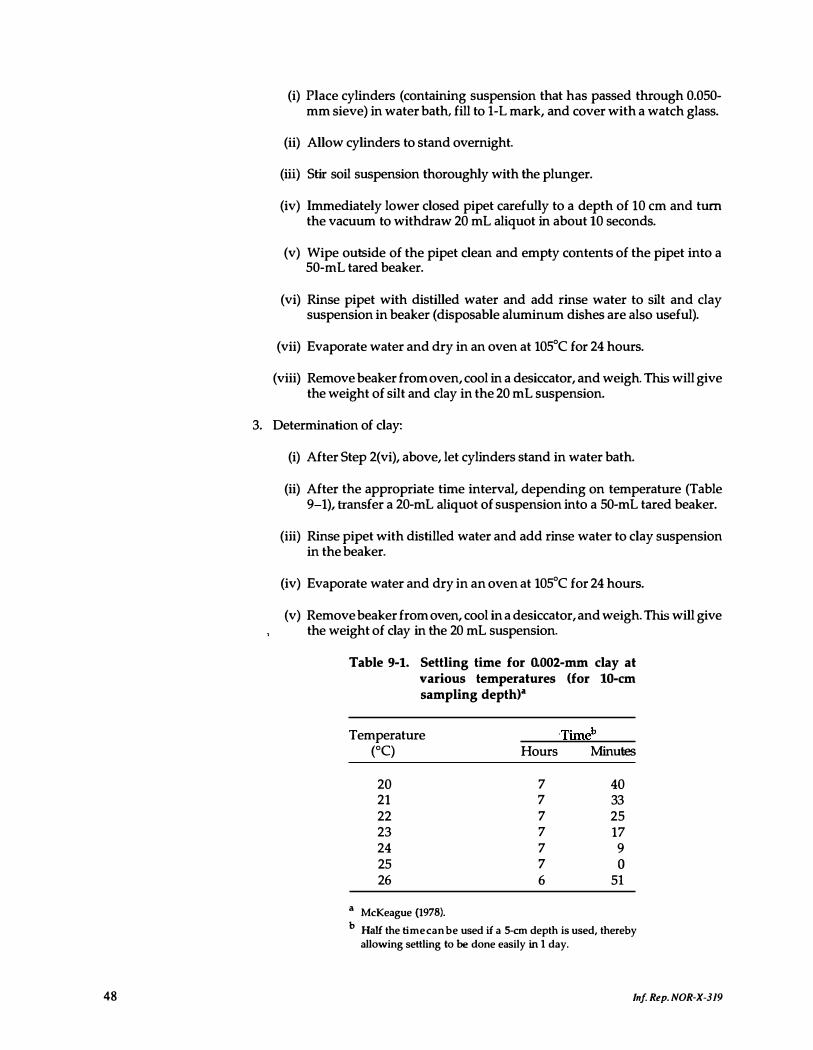
48
(i) Place cylinders (containing suspension that has passed through O.OSOmm sieve) in water bath, fill to l-L mark, and cover with a watch glass.
(ii) Allow cylinders to stand overnight.
(iii) Stir soil suspension thoroughly with the plunger.
(iv) Immediately lower closed pipet carefully to a depth of 10 cm and tum the vacuum to withdraw 20 mL aliquot in about 10 seconds.
(v) Wipe outside of the pipet clean and empty contents of the pipet into a SO-mL tared beaker.
(vi) Rinse pipet with distilled water and add rinse water to silt and clay suspension in beaker (disposable aluminum dishes are also useful).
(vii) Evaporate water and dry in an oven at 10SoC for 24 hours.
(viii) Remove beaker from oven, cool in a desiccator, and weigh. This will give the weight of silt and clay in the 20 mL suspension.
3. Determination of clay:
(i) After Step 2(vi), above, let cylinders stand in water bath.
(ii) After the appropriate time interval, depending on temperature (Table 9-1), transfer a 20-mL aliquot of suspension into a SO-mL tared beaker.
(iii) Rinse pipet with distilled water and add rinse water to clay suspension in the beaker.
(iv) Evaporate water and dry in an oven at 10SoC for 24 hours.
(v) Remove beaker from oven, cool in a desiccator, and weigh. This will give the weight of clay in the 20 mL suspension.
Table 9-1. Settling time for O.002-mm clay at various temperatures (for lO-cm sampling depth)"
Temperature (0C)
20 21 22 23 24 2S 26
" McKeague (1978).
Hours Minutes
7 7 7 7 7 7 6
40 33 25 17 9 o
Sl
b HaH the time can be used if a 5-cm depth is used, thereby allowing settling to be done easily in 1 day.
In! Rep. NOR·X-319
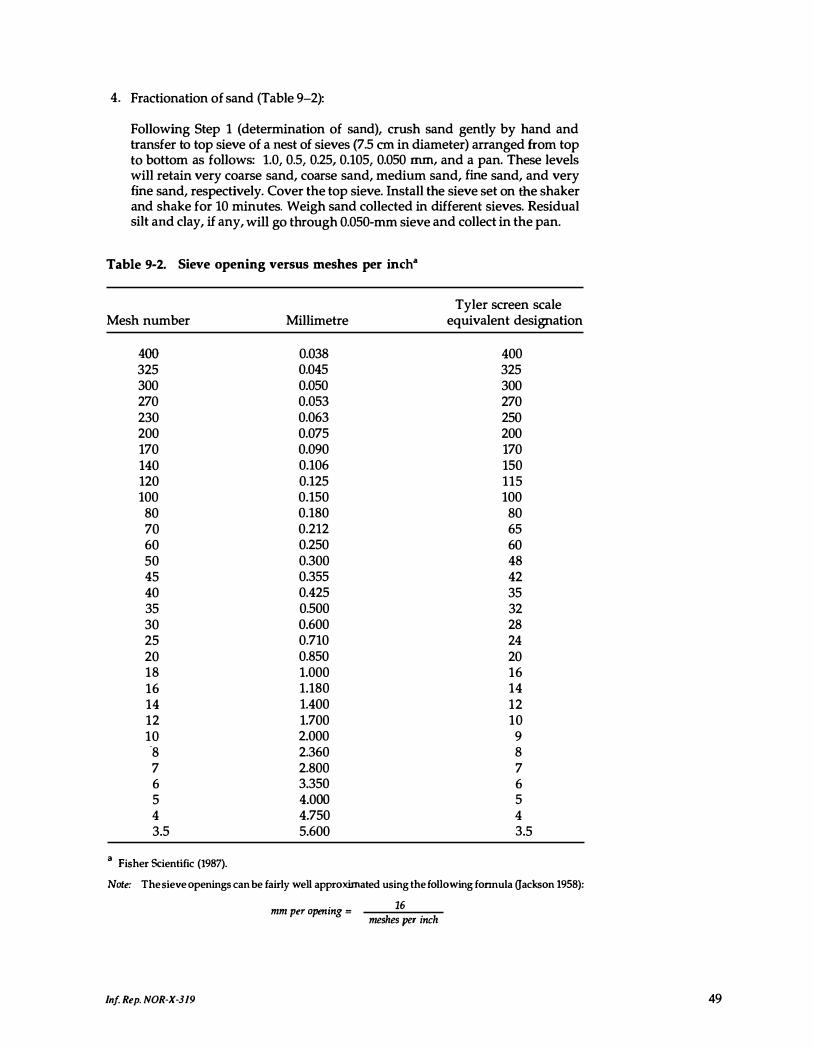
4. Fractionation of sand (Table 9-2):
Following Step 1 (determination of sand), crush sand gently by hand and transfer to top sieve of a nest of sieves (7.5 em in diameter) arranged from top to bottom as follows: 1.0, 0.5, 0.25, 0.105, 0.050 mm, and a pan. These levels will retain very coarse sand, coarse sand, medium sand, fine sand, and very fine sand, respectively. Cover the top sieve. Install the sieve set on the shaker and shake for 10 minutes. Weigh sand collected in different sieves. Residual silt and clay, if any, will go through 0.050-mm sieve and collect in the pan.
Table 9-2. Sieve opening versus meshes per inch"
Mesh number
400 325 300 270 230 200 170 140 120 100 80 70 60 50 45 40 35 30 25 20 18 16 14 12 10
8 7 6 5 4 3.5
a Fisher Scientific (1987).
Millimetre
0.038 0.045 0.050 0.053 0.063 0.075 0.090 0.106 0.125 0.150 0.180 0.212 0.250 0.300 0.355 0.425 0.500 0.600 0.710 0.850 1.000 1.180 1.400 1.700 2.000 2.360 2.800 3.350 4.000 4.750 5.600
Tyler screen scale equivalent designation
400 325 300 270 250 200 170 150 115 100 80 65 60 48 42 35 32 28 24 20 16 14 12 10 9 8 7 6 5 4 3.5
Note: The sieve openings can be fairly well approximated using the following fonnula ijackson 1958);
mm per opening = 16 meshes per inch
In! Rep. NOR·X·319 49
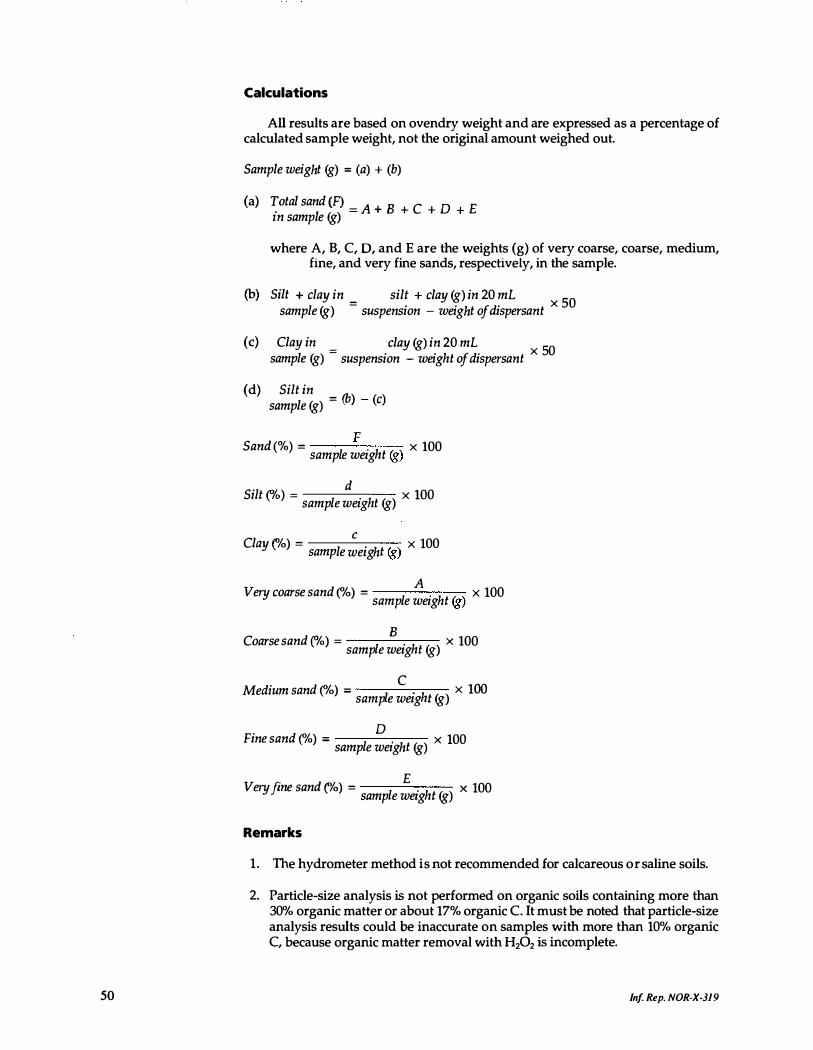
50
Calculations
All results are based on ovendry weight and are expressed as a percentage of calculated sample weight, not the original amount weighed out.
Sample weight (g) = (a) + (b)
(a) Total sand (F) _ A B C D E . 1 - + + + + In samp e (g)
where A, B, C, 0, and E are the weights (g) of very coarse, coarse, medium, fine, and very fine sands, respectively, in the sample.
(b) Silt + clay in =
silt + clay (g) in 20 mL 50 sample (g) suspension - weight of dispersant x
(c) Clay in =
clay (g) in 20 mL 50 sample (g) suspension - weight of dispersant x
(d) Silt in sample (g) = (b) - (c)
F Sand (%) = I . h (�) x 100 samp e wezg t '6
Silt (%) = I d
. h (g) x 100 samp e wezg t
Clay ('fo) = I . ht (�) x 100 samp e wezg '6 e
A Very coarse sand ('fo) = I . h (�) x 100 samp e wezg t '6
B Coarse sand ('fo) = I . h x 100 samp e wezg t (g)
Medium sand ('fo) = I
C. h x 100
samp e wezg t (g)
Fine sand ('fo) = I D . ht (g) x 100 samp e wezg
Very fine sand ('fo) = IE . h (g) x 100 samp e wezg t
Remarks
1. The hydrometer method is not recommended for calcareous or saline soils.
2. Particle-size analysis is not performed on organic soils containing more than 30% organic matter or about 17% organic C. It must be noted that particle-size analysis results could be inaccurate on samples with more than 10% organic C, because organic matter removal with H202 is incomplete.
Inf Rep. NOR-X-319
3. Soil should not be stirred by mechanical shaker for too long, because it can lead to the abrasion of soil particles. Alternatively, an ultrasonic water bath can be used. Place beakers of samples and dispersant in the bath. This might be better than the milkshake mixer and a few samples can be done at once.
4. It is difficult to estimate the quantity of HCl needed to decompose carbonates. Too much will lead to low results from dissolution of the clay minerals.
5. H,O,doesnot destroy all organic matter in the soil; about 20% of organiC matter present is not destroyed, but the influence of resistant compounds on final results is negligible.
6. High concentrations of soluble salts can cause flocculation of soil suspensions. Gypsum, if present in large quantities, will also cause flocculation of clay from suspension.
7. Stokes' law' is valid only for spherical particles moving below a certain velocity. Most soil particles are not spherical and the specific gravity is not 2.65.
8. Mixer blades deteriorate due to abrasion and therefore should be replaced when signs of wear show.
9. Use distilled water throughout procedure.
10. Sodium from sodium hexametaphosphate replaces cations (e.g., calcium) on the surface of clay particles, resulting in an increase in the net negative charge of the clay particles. This causes the clay particles to disperse by repelling each other. The cation replaced by Na precipitates as a metaphosphate.
11. Soil textural classes are listed in Figure 9-1.
12. For quality control in the hydrometer method without pretreatment, a minimum of one reference sample should be analyzed per batch of 20 samples (a minimum of one reference sample daily). Duplicates are done on approximately 5% of samples. Precision and accuracy are outlined in Table 9-3.
For the pipet method, quality control is achieved by analyzing a minimum of one reference sample per batch of 12 samples (a minimum of one reference sample daily). Duplicates are done on approximately 5% of samples. Precision and accuracy are outlined in Table 9-4.
References
Bouyoucos, G.}. 1962. Hydrometer method improved for making particle size analysis of soils. Agron. j. 54:464-465.
Cappo, K.A.; Blume, L.J.; Raab, G.A.; Bartz, J,K.; Engels, J.L. 1987. Analytical methods manual for the direct/delayed response project soil survey. U.S. Environ. Prot. Agency, Washington, D.C.
Clark, 1.5.; Green, A.J. 1962. Note on a pipetting assembly for the mechanical analysis of soils. Can. J. Soil Sci. 42:316.
4 Stokes' law relates the terminal settling velocity of a.smooth, rigid sphere in a viscous fluid of known density and viscosity to the diameter of .the sphere when subjected to a known force field (Gee and Bauder 1986).
Inf. Rep. NOR·X·3I9 5 1
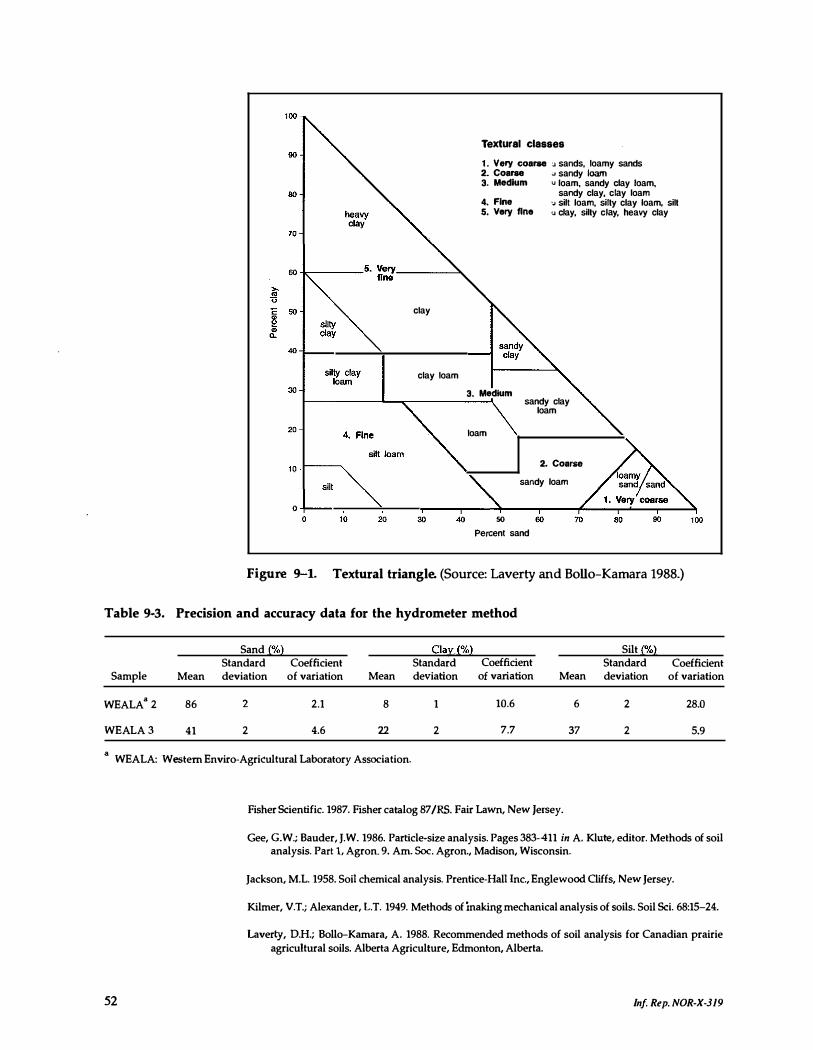
clay
clay loam
Textural classes 1. Very coarse ;l sands, loamy sands 2. Coarse " sandy loam 3. Medium u loam, sandy clay loam,
sandy clay, clay loam 4. Fine '"' silt loam, silty clay loam, silt 5. Very fine '..I clay, silty clay, heavy clay
3. Medium
loam
sandy clay loam
2. Coarse sandy loam
50 Percent sand
60 70 60 90
Figure 9-1. Textural triangle. (Source: Laverty and Bollo-Kamara 1988.)
100
Table 9-3. Precision and accuracy data for the hydrometer method
Sand {%} Clay_{%} Silt {%} Standard Coefficient Standard Coefficient Standard Coefficient
Sample Mean deviation of variation Mean deviation of variation Mean deviation of variation
WEALA" 2 86 2 2.1 8 1 10.6 6 2 28.0
WEALA 3 41 2 4.6 22 2 7.7 37 2 5.9
a WEALA: Western Enviro-Agricultural Laboratory Association.
52
Fisher Scientific. 1987. Fisher catalog 87 IRS. Fair Lawn, New Jersey.
Gee, G.W.; Bauder, J.W. 1986. Particle-size analysis. Pages 383-411 in A. Klute, editor. Methods of soil analysis. Part 1, Agron. 9. Am. Soc. Agron., Madison, Wisconsin.
Jackson, M.L. 1958. Soil chemical analysis. Prentice-Hall Inc., Englewood Cliffs, New Jersey.
Kilmer, V.T.; Alexander, L.T. 1949. Methods of ina king mechanical analysis of soils. Soil Sci. 68:15-24.
Laverty, D.H.; Bollo-Kamara, A. 1988. Recommended methods of soil analysis for Canadian prairie agricultural soils. Alberta Agriculture, Edmonton, Alberta.
In! Rep. NOR·X·319
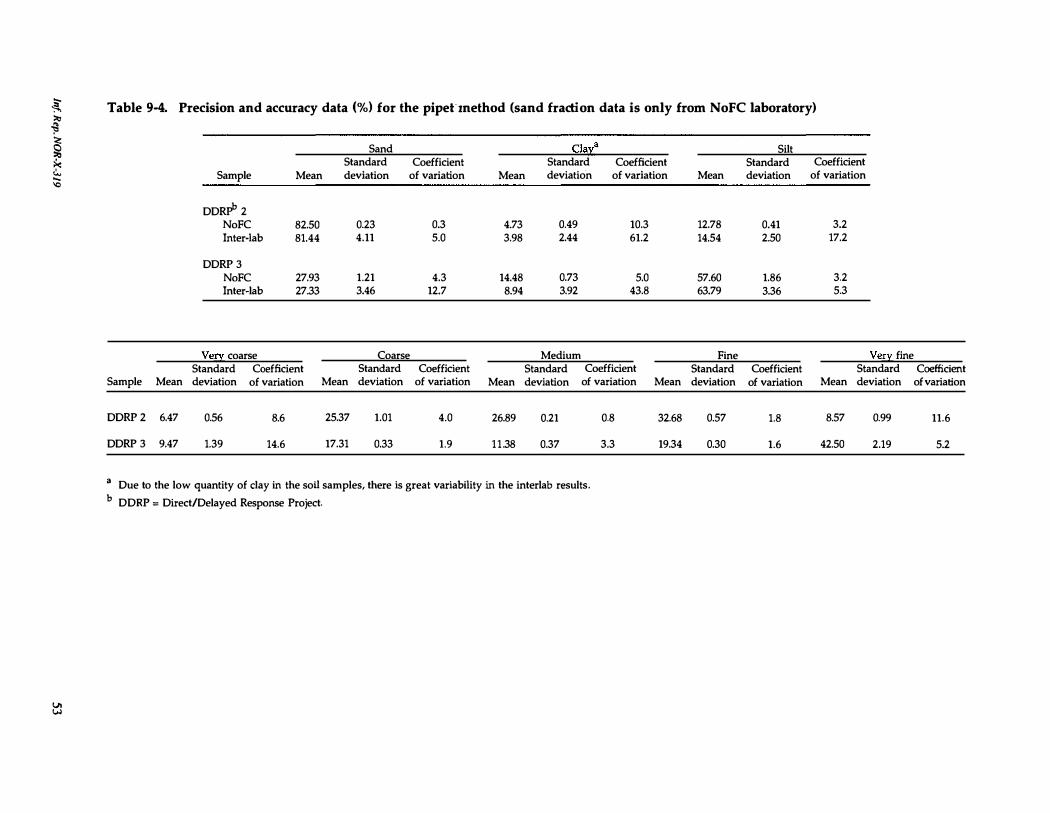
� � '" � '" §l >< C. � '0
'" '"
Table 9-4. Precision and accuracy data (%) for the pipehnethod (sand fraction data is only from NoFC laboratory)
Sand Claxa
Standard Coefficient Standard Coefficient Sample Mean deviation of variation Mean deviation of variation
DDRPb 2
NoFC 82.50 0.23 0.3 4.73 0.49 10.3 Inter-lab 81.44 4.11 5.0 3.98 2.44 61.2
DDRP 3 NoFC 27.93 1.21 4.3 14.48 0.73 5.0 Inter-lab 27.33 3.46 12.7 8.94 3.92 43.8
Ven:: coarse Coarse Medium Standard Coefficient Standard Coefficient Standard Coefficient
Sample Mean deviation of variation Mean deviation of variation Mean deviation of variation Mean
DDRP 2 6.47 0.56 8.6 25.37 1.01 4.0 26.89 0.21 0.8 32.68
DDRP 3 9.47 1.39 14.6 17.31 0.33 1.9 11.38 0.37 3.3 19.34
a Due to the low quantity of day in the soU samples, there is great variability in the interlab results, b
DDRP = Direct/Delayed Response Project.
Silt Standard Coefficient
Mean deviation of variation
12.78 0.41 3.2 14.54 2.50 17.2
57.60 1.86 3.2 63.79 3.36 5.3
Fine Ve!:y' fine Standard Coefficient Standard deviation of variation Mean deviation
0.57 1.8 8.57 0.99
0.30 1.6 42.50 2.19
Coefficient of variation
11.6
5.2

54
McKeague, J.A., editor. 1978. Manual on soil sampling and methods of analysis. Can. Soc. Soil SeL, Ottawa, Ontario.
Toogood, J.A.; Peters, T.W. 1953. Comparison of methods of mechanical analysis of soils. Can. J. Agr. Sci. 33:59-171.
Wilde, S.A.; Corey, R.B.; Iyer, J.G.; Voigt, G.K 1979. Soil and plant analysis for tree culture. Oxford Publishing Co., New Delhi, India.
10. CARBONATES: CALCITE AND DOLOMITE
Principle
Carbonate in the sample is reacted with HCL The evolved CO, is measured manometrically at various time intervals. Amounts of calcite and dolomite are obtained by plotting the readings on a semi-log paper using the intercept method.
Apparatus
Burrell wrist action shaker Water bath, Lab Line Manometer, mercury Reaction bottles, ground neck, wide mouth, 500 mL, fitted with a one-hole stopper
and tubing 15-mL paper cups (Lily portion cup No. 050)
Reagents
1. Dilute HCl: about 4 M HCl (1 volume HCl + 2 volume water).
2. Dilute NaOH: add six drops of about 6 M NaOH to 500 mL distilled water in a wash bottle. (This NaOH is required to absorb CO, from the air so that atmospheric CO, does not contaminate the sample.)
Procedure
1. Place a small amount of soil in a watch glass and test with a few drops of about 4 M HCl to determine the quantity of soil to be taken for analysis (depending upon the degree of effervescence; the more the effervescence, the less the sample needed.)
2. Transfer the required quantity (0.5-5.0 g) of finely ground soil (see Remark 1 of this section) to a IS-mL paper cup. It is preferred that sufficient soil be taken to give a final manometer reading of 5-8 em of mercury.
3. Measure about 30 mL of about 4 M HCl into the reaction bottle.
4. Add a few millilitres of dilute NaOH to the soil in the cup until the cup is about three-fifths full. Keep volume of soil plus water in the cup equal for all determinations.
5. Place the cup with soil in the bottle, taking care not to let HCl come in contact with the contents of the cup.
Inf Rep. NOR·X·319
6. Stopper the bottle tightly (using thumb, press all around the stopper) with a rubber stopper carrying a glass tube. Connect the glass tube to a rubber tube, which in tum is connected to the glass tube of the mercury manometer.
7. Clamp the reaction bottle to the arm of the shaker. Immerse it to the neck into the water bath filled with water maintained at 25"C (water in the bath should be about 2.5 em from the top).
8. To analyze two samples simultaneously, place a rubber band around both bottles to keep them steady and to prevent the cup with the sample from turning over before the timing is begun.
9. Check the zero reading on the manometer.
10. Set the shaker in motion at full speed (setting 9) and simultaneously tum the stop watch on. Tum the speed down to medium (setting 5) after about 20 seconds, when the contents of the cup have come in contact with the HCl solution in the shaking bottle by tipping over the cup. Keep the shaking speed constant.
11. Record the manometer readings (em) at intervals (0.5, 1, 1.5, 2, 3, 4, 5, 8, 11, 14, 24, 34, and 44 minutes, etc.) until the reaction is complete and the mercury level does not change.
12. Stop the shaker, take out the bottle, and remove the stopper. Wash the bottle, rinse with distilled water, and carry out determination of the other samples.
13. Dry the mouth of the bottle and proceed with the next sample.
14. Run standards using 0.25- and 0.50-g samples of ovendried reagent grade CaC03 in exactly the same way as the soil samples. The reaction is complete in one minute.
Calculations
1. Subtract the manometer reading recorded at each time interval (H,) from the final reading (H.J to obtain the reading equivalent to CO, from unreacted carbonates (H�- H,).
2. Using semilog graph paper, plot the manometer reading (cm) of CO, equivalent to unreacted carbonates (�- H,) on the log scale and time (minutes) on linear scale. Draw a line through points to obtain the curve.
3. Extrapolate the linear portion of the curve (which normally occurs within about one minute) to zero time. Where points do not fall on a straight line, the extrapolation should be obtained through the points from about 1.5 to 5.0 minutes. The intercept (Hd) would give the manometer reading of CO, equivalent to dolomite.
4. Subtract the reading of CO, for dolomite (Hd) from the total CO, reading (H.J to obtain CO, equivalent to calcite (H, = H�- Hd)·
5. Convert the manometric readings of the samples to CO, (g) and then convert the CO, (g) values to calcite and dolomite.
Inf Rep. NOR·X·319 55
56
If only CaCO, equivalent percentage is required, the total manometer reading is multiplied by the factor from standardization. Consequently there is no need to plot the values on graph paper.
Remarks
1. Soil should be ground to 100-mesh size if dolomite is present; otherwise grinding to O.50-mm size is sufficient.
2. Samples should be dried at 105"C overnight and placed in a desiccator before analysis.
3. Conversion factors:
Molecular weight of calcite (CaCO,) = 100.09 Molecular weight of dolomite (CaCO,·MgCO,) = 184.40 Calcite contains 43.97% CO, Dolomite contains 47.73% CO, CO, = CO, x 1.3635 CaCO, = CO, x 1.6679 CaCO, = CO, x 2.2743 CaCO, = CaCO,·MgCO, x 1.0856 CaCO,·MgCO, = CO, x 1.5365 CaCO,·MgCO, = CO, x 2.0951 CaCO,·MgCO, = CaCO, x 0.9212
4. In Step 7 of the procedure, it is not important that the temperature be exact, but it is important that the samples and the standards are run at the same temperature.
5. For CaCO, equivalent, quality control is attained by analyzing a minimum of one reference sample per batch of 20 samples (a minimum of one reference sample daily). Duplicates are done on approximately 5% of samples. Precision of CaCO, equivalent should be less than or equal to 10%. For example, long-term analysis of a laboratory sample was 23.58 ± 1.71% (coefficient of variation 7.2%). Values reported by the Expert Committee on Soil Survey from several laboratories ranged from 22.0 to 26.6%.
6. A qualitative estimate of the amount of free lime is obtained by effervescence with about 10% HC!. The relative effervescence is described as below:
Rating
Nil Low Medium High
References
Spot test using dilute HCl
No effervescence Weak effervescence Moderate effervescence Strong effervescence
Approximate CaCO, equivalent (%)
o 1-5 6-10 10+
Brydon, J.E.; Ricel H.M. 1965. Use of the intercept method in determining the calcite-dolomite ratio for rating agricultural limestones. Agron. J. 57:283-285.
In! Rep. NOR·X·319
McKeague, J.A.; Sheldrick, B.H. 1976. A comparison of some methods for determining carbonates in soil. Can. j. Soil Sci. 56:125-127.
Sheldrick, B.H., editor. 1984. Analytical methods manual 1984. Agric. Can., Land Resour. Res. Inst., Res. Branch, Ottawa, Ontario. Contrib. 84-30.
Skinner, SJ.M.; Halstead, R.L. 1958. Note on rapid method for determination of carbonates in soils. Can. j. Soil Sci. 38:187-188.
Skinner, S.I.M.i Halstead, R.L.; Brydon, J.E. 1959. Quantitative manometric determination of calcite and dolomite in soils and limestones. Can. J. Soil Sci. 39:97-204.
Turner, R.c. 1960. An investigation of the intercept method for determining the proportion of dolomite and calcite in mixtures of the two. I. Theoretical aspects of the rate of solution of dolomite when a number of crystals are present. Can. J. Soil Sci. 40:219-231.
Turner, R.c.; Skinner, S.I.M. 1960. An investigation of the intercept method for determining the proportion of dolomite and calcite in mixtures of the two. II. Experimental rates of solution of dolomite and calcite in samples consisting of a number of crystals. Can. J. Soil Sci. 40:232-241.
1 1 . NITROGEN
(i) TOTAL NITROGEN
a. Digestion
Principle
The sample is digested with H2SO, to convert organic N to NH;-N. Highly refractory organic N compounds or compounds containing N-N or N-O linkages are not completely recovered by the Kjeldahl digestion; however, very little of the N in most soils is in this form. If soils do contain high amounts of NO;-N or NO;-N, then a pretreatment must be carried out to include these forms ofN. In undisturbed forest soils negligible amounts of NO;-N and NO;-N are present.
Apparatus
Digestion block: a 20-place block digester, e.g., Technicon BD-20 heating unit or Tecator Digestion System 20, 1015 digester
Tecator Auto Temp 1012 controller 250-mL digestion tubes (295 x40 mm diameter)
Reagents
1. Concentrated H2SO, (18 M), 96%.
2. Kjeltab: each tablet contains 3.5 g K2SO, and 0.4 g CuSO,·SH,o.
Procedure
Always use safety glasses and chemical and heat-resistant gloves when performing Steps 2-9.
Inf. Rep. NOR·X·319 57
58
1. Transfer 0.25 g LFH (40-mesh), 0.50 g Ah horizon soil (60-mesh), or 1.00-2.00 g mineral soil low in N (60-mesh) into a digestion tube, with accuracy in weighing to 0.01 g.
2. Add 10 mL concentrated H2S04 and mix by swirling.
3. Heat at 200°C in a digestion block until very black (about 30 minutes). To avoid acid irritation to the analyst, the digestion block must be loaded in a fume hood to ensure the removal of fumes and vapors released during digestion.
4. Add one Kjeltab.
5. Heat for 15-20 minutes until Kjeltab dissolves (200°C).
6. Increase heat to 300°C and heat for 30 minutes.
7. Raise the temperature to 375°C and heat until sample turns turquoise (45 minutes).
8. Remove the digestion tubes from the block and allow to cool for 5 minutes. Do not allow to cool in the heating block: NH, from the (NH4)2S04formed by digestion will be lost if heated.
9. Add about 50 mL water and mix well until sample is in solution.
b. Determination
Distillation (Kjeltec Auto 1030 Analyzer) method
Principle
In the Kjeltec Auto 1030 Analyzer method, NH.,-N (liberated by distillation of the digest with strong alkali) is absorbed in unstandardized H,BO,. Ammonium borate is formed. The borate is titrated back to H,BO, by titration against standard strong acid (HCl).
Apparatus
Distillation and titration apparatus: Kjeltec Auto 1030 Analyzer, Tecator
Reagents
1. 40% NaOH solution: 10 kg NaOH + 15 L H20.
2. Receiving solution (Tecator 1985):
(i) Dissolve 100 g H,BO, in 10 L water.
(ti) Add 100 mL bromocresol green solution (100 mg in 100 mL methanol).
(iii) Add 70 mL methyl red solution (100mg in 100 mL methanol).
In! Rep. NOR·X·319
(iv) Add 5 mL of 4% NaOH.
3. Standard acid (0.01 M HCl).
Procedure
1. Bring the digest up to about 100 mL.
2. Follow instructions for the operation of KjeJtec Auto 1030 Analyzer (Tecator 1985).
3. Set the alkali pump to deliver 30 mL of 40% N aOH.
4. Titrate with 0.01 M He!.
Calculation
Report total N as percentage (accuracy 0.01%) on dry-weight basis.
. . (V"m,l, - Vb!",) x molarity of standard Hc/ x 1.401 % N m so,l ; . . where wezght of ovendry sample d'gested (g') ,
V �mpl' ; the volume (mL) of standard HCl for titration of the sample.
Vbl"" ; the volume (mL) of standard HCl for titration of the blank.
Colorimetric (autoanalyzer) method
Principle
In the autoanalyzer method, the NH; ion is reacted with alkaline phenol and sodium hypochlorite to form the indophenol blue complex (Berthelot reaction), which is measured at 630-nm wavelength.
Apparatus
Technicon AutoAnalyzer unit consisting of sampler, manifold, proportioning pump, heating bath, colorimeter, and recorder
Reagents
1. Standards:
(i) Stock solution 1 (1000 mg L'! N): dissolve 4.717 g ammonium sulfate « NH4),S04) in about 500 mL H20 in a l-L volumetric flask, add 2.8 mL concentrated H2SO4 and make up to volume with H20. This will give acidity equivalent to 0.05 M H2SO4,
(ii) Stock solution 2 (100 mg L'! N): transfer 25 mL of the 1000 mg L'! N stock solution into a 250-mL volumetric flask and make up to volume with H20.
In! Rep. NOR·X·3I9 59
60.
(iii) Working standards: transfer 1, 2, 5, 10., 15, 20., and 25 mL of the 10.0. mg L-' N stock solution to lOD-mL volumetric flasks and make up to volume with H20 to obtain 1, 2, 5, 10, 15, 20., and 25 mg L-' N standards.
2. Sodium hydroxide-tartrate reagent: dissolve 75 g NaOH and 50. g potassium sodium tartrate in about 70.0. mL of double distilled H20. Dilute to 1 L with H20. Store in a polyethylene bottle.
3. Alkaline phenol: prepare 5 M NaOH (20.% solution) by dissolving 2DQ.g NaOH in water and diluting to 1 L in a volumetric flask. To 250. mL of this solution slowly add 138 mL liquified phenol (about 88%). Dilute to l-L volume. Add 0..5 mL Brij-35 before use. Store in dark brown polyethylene bottle.
4. Sodium hypochlorite: commercial household bleach of at least 5.0.% available chlorine.
5. Manganese diluent:
(i) Stock solution: dissolve 3.0.76 g manganese sulfate, MnSO,·H20, in H20, and dilute to 1 L. (Note: If using MnSO,·4H20, weighout4.D6D g to make stock solution.)
(ii) Working solution: dilute 5.0. mL of stock solution to 1 L with H20.
Procedure
1. Dilute digest to 250. mL. Mix contents thoroughly.
2. Transfer an aliquot (about 3D mL) of diluted digest to a 6D-mL Nalgene storage bottle.
3. When ready to use autoanalyzer, carefully pour (decant) some digest (2-3 mL) into sample cups (4-mL size) and arrange in carrousel. (Note: Some digests may have residue particles. It is extremely important that the supernatant solution should be poured very gently into the sample cups without disturbing residue particles, if any.)
4. Set up autoanalyzer and analyze samples using the flow diagram (Fig. 11-1).
calculation
0' N . ./ _ N in the digest (mg L -') 0. 0.25 '0 In so, - . h if d / d ' ed ) x . we'g t o oven ry samp e 'gest Ig
Remarks
(Remarks 1, 2, and 9 for the distillation method; Remarks 3-8 for the autoanalyzer method.)
1. There are many variations of the Kjeldahl digestion technique available. For the most part, those reported in the literature since the mid -1960.5 will recover similar amounts of total N from most soils (Bremner and Mulvaney 1982). Comparisons of the recommended method with the old macrokjeldahl technique, and the colorimetric method for the direct determination of NH, +, found
Tnt Rep. NOR-X-3T9
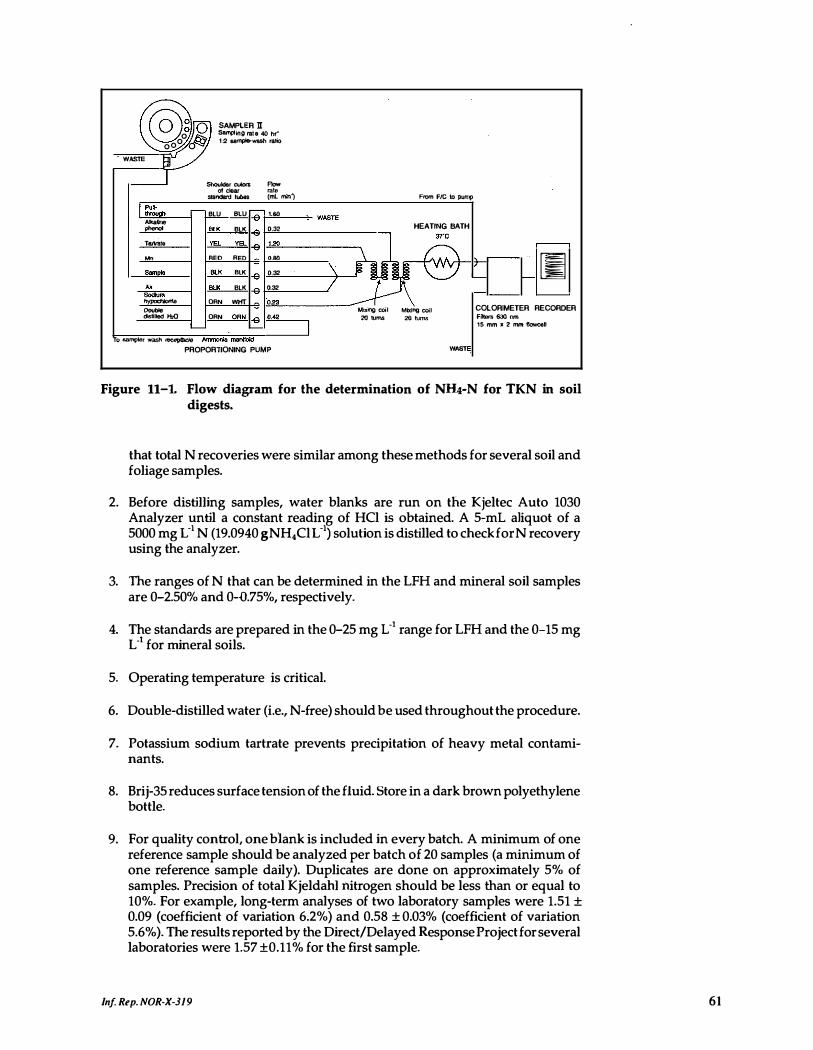
O g o SAMPLER n Sampling ral8 40 hi"
0000 fft.. 1:2 sampl&-wash ratio
W"'" sr I ""'""" - Row
. .. - -" stalldafd lubes (mL min') From Ftc to pump
t �� r- BLU BLU r:- 1.60 W"'" ..... HEATING BATH ..... "" '''' ,."
Tartrate ""'- m ,'" � 8 -
� "0 R" '.M � [S "'" "" '''' ,." \ � -
,. "" '''' '" / --i \ """'" -
- DRN WHT 02' """" Mixing coil Mbi;lng coil COLORIMETER RECORDER distilled H,Q DRN ORN ' " " -= ,, � Filters 630 nm
� � I 15 mm � 2 mm fIoweeH
To sampler wash receptacle Ammonia manlfold PROPORTIONING PUMP w"'"
Figure 11-1. Flow diagram for the determination of NH4-N for TKN in soil digests.
that total N recoveries were similar among these methods for several soil and foliage samples.
2. Before distilling samples, water blanks are run on the Kjeltec Auto 1030 Analyzer until a constant reading of HCl is obtained. A 5-mL aliquot of a 5000 mg L-1 N (19.0940 g NH,Cl L-1) solution is distilled to check for N recovery using the analyzer.
3. The ranges of N that can be determined in the LFH and mineral soil samples are 0-2.50% and 0-0.75%, respectively_
4. The standards are prepared in the 0-25 mg L-1 range for LFH and the 0-15 mg L-1 for mineral soils.
5_ Operating temperature is critical.
6. Double-distilled water (Le., N-free) should be used throughout the procedure.
7_ Potassium sodium tartrate prevents precipitation of heavy metal contaminants.
8. Brij-35 reduces surface tension of the fluid_ Store in a dark brown polyethylene bottle_
9. For quality control, one blank is included in every batch. A minimum of one reference sample should be analyzed per batch of 20 samples (a minimum of one reference sample daily). Duplicates are done on approximately 5% of samples. Precision of total Kjeldahl nitrogen should be less than or equal to 10%_ For example, long-term analyses of two laboratory samples were 1.51 ± 0.09 (coefficient of variation 6.2%) and 0.58 ± 0.03% (coefficient of variation 5.6%)_ The results reported by the Direct/Delayed Response Project for several laboratories were 1.57 ±0.11 % for the first sample_
In! Rep_ NOR-X-319 61
62
References
Bremner, J.M.; Mulvaney, e.S. 1982. Nitrogen-total. Pages 595-624 in A.L. Page, R.H. Miller, and D.R. Keeney, editors. Methods of soil analysis. Part 2, Agron. 9. Am. Soc. Agron., Madison, Wisconsin.
Heffernan, B. 1985. A handbook of methods of inorganic chemical analysis for forest soils, foliage and water. Cornmonw. Sci. Ind. Res. Organ. Div. For. Res., Canberra, Australia.
Tecator. 1985. Kjeltec Auto 1030 Analyzer manual. Hoganas, Sweden.
Technicon Instrument Corporation. 1971. Industrial method No. 146/71 AI Preliminary total nitrogen (Kjeldahl). Tarrytown, N.Y.
van Reeuwijk, L.P. editor. 1987. Procedures for soil analysis. lot. Soil Ref. Inf. Cent., Wageningen, The Netherlands. Tech. Pap. 9.
(ii) EXTRACTION OF NH4-N AND NOl-N WITH 2 M KCI
Principle
Ammonium is held in exchangeable form in soils in the same manner as exchangeable metallic cations. Fixed NH; is present in soil primarily as NH; in interlayer positions of the 2:1 layer silicates, in the same way as K', by closure of interlayer space. Exchangeable NH; is extracted with 2 M KCl. Nitrate is watersoluble and is therefore also determined on the same 2 M KCl extract. Nitrite is seldom present in detectable amounts and, therefore, usually not determined.
Apparatus
Reciprocating shaker (160 strokes per minute) Repipet dispensing bottle for KCl solution 12S-mL Erlenmeyer flasks Filter funnels Whatman 42 filter papers
Reagents
Potassium chloride (2 M KCl): 149.1 g KCl L-1
Procedure
1. Weigh S.O g soil into each Erlenmeyer flask. (If the sample is limited, it can be reduced to a minimum of 1.0 g and 10 mL 2 M KCI to keep 1:10 ratio.)
2. Add SO-mL 2 M KCl solution.
3. Stopper the flasks and shake for 30 minutes.
4. Filter.
S. Analyze for NH; -N and NO,--N within '24 hours. Store the extracts in a refrigerator or freeze them if storage is required until analysis can be performed.
Inj Rep. NOR-X-319
Remarks
1 . Ideally, field-moist samples should be analyzed immediately after collection. A separate subsample should be ovendried at 105°C and appropriate correction applied to the sample weight analyzed.
2. In samples low in NH, and NO, (such as those from deeper mineral soil horizons) the soil-to-solution ratio could be decreased to obtain detectable amounts of NH. and NO,.
3. To prevent or reduce biological transformations, samples should be either frozen or dried at room temperature.
4. If air-dried soil samples have to be stored for any length of time prior to NH; analysis, they should be stored in plastic or glass containers. Prolonged storage of air-dried soils in paper containers has resulted in Significant increases in exchangeable NH; (Nelson and Bremner 1972).
5. There are no reference samples available as significant changes in the amounts of NH. and NO, can take place on prolonged storage at room temperature of air-dried samples. A study conducted by the Western Enviro-Agricultural Laboratory Association showed that the NO, content of soils decreased significantly after a 3-year storage period of air-dried samples at room temperature.
6. Errors caused by NH. and NO, contamination from filter paper can be significant (Sparrow and Masiak 1987).
References
McKeague, lA., editor. 1978. Manual on soil sampling and methods of analysis. Can. Soc. Soil Sci., Ottawa, Ontario.
Muneta, P. 1980. Analytical errors resulting from nitrate contamination of filter paper. J. Assoc. Off. Anal. Chern. 63:937-938.
Nelson, D.W.; Bremner, J.M. 1972. Preservation of soil samples for inorganic nitrogen analysis. Agron. J. 6H96-199.
Quasim, M.; Flowep;, T .H. 1989. Errors in the measurement of extractable soil inorganic nitrogen caused by impurities in the extracting solution. Commun. Soil Sci. Plant Anal. 20:1745-1752.
Sheldrick, S.H., editor- 1984. Analytical methods rnanua1 1984. Agric. Can., Land Resaur. Res. Inst., Res. Branch, Ottawa, Ontario. Contribution 84-30.
Sparrow, S.D.; Masiak, D.T. 1987. Errors in analyses for ammonium and nitrate caused by contamination from filter papers. Soil Sci. Soc. Am. J. 51:107-110.
Principle
(iii) DETERMINATION OF NH4-N IN 2 M KCI EXTRACTS BY AUTOANAL YZER
In determining the amount of ammonia present, the Berthelot reaction is used: a blue indophenol complex occurs when ammonia is reacted with sodium phenoxide followed by sodium hypochlorite addition.
In! Rep. NOR·X·3I9 63
64
Apparatus
Technicon AutoAnalyzer consisting of sampler, manifold, proportioning pump, heating bath, colorimeter, and recorder
Reagents
1 . Standard solutions:
(i) Stock solution 1 (1000 mg L-t N): 4_717 g (NH,),SO, ct.
(ii) Stock solution 2 (100 mg L-t N): dilute 10 mL of stock solution 1 (above) to 100 mL with 2 M KCl solution.
(iii) Working standards: transfer 0, 1, 2, 5, 7, and 10 mL of stock solution 2 to 100-mL volumetric flasks. Make up to volume with 2 M KCl. This will provide 0, 1, 2, 5, 7, and 10 mg Ct N, respectively.
(iv) Stock solution 3 (10 mg L-t N): dilute 10 mL of stock solution 2 (above) to 100 mL.
(v) Working standards: dilute 2, 5, 7, and 10 mL of stock solution 3 (above) to 100 mL to obtain 0.2, 0.5, 0.7, and 1.0 mg L-t N, respectively.
2. Complexing reagent: dissolve 33 g of potassium sodium tartrate, KNaC,H.O,·4H,O, and 24 g of sodium citrate, Na3C,Hs07·2H,O, in 950 mL of H,O. Adjust pH to 5.0 with concentrated H2S04, Dilute to 1 L. Add 0.5 mL of Brij-35.
3. Alkaline phenol: using a l-L Erlenmeyer flask, dissolve 83 g of phenol in 50 mL of H20. Cautiously add, while cooling flask under tap water, 180 mL of 20% NaOH in small increments with agitation. Dilute to 1 L with H20.
To make 20% NaOH, dissolve 200 g of NaOH and dilute to 1 L. Store alkaline phenol reagent in an amber bottle.
4. Sodium hypochlorite: dilute 200 mL of 5.25% household bleach to 1 L with H,O. This reagent must be made daily.
5. Sodium nitroprusside: dissolve 0.5 g of sodium nitroprusside, Na,Fe(CN),NO·2H,O, in 900 mLofH,o and dilute to 1 L. Store in dark-colored bottle.
Procedure
1 . If soil extracts are frozen or refrigerated, bring them to room temperature.
2. Shake extracts well.
3. Set up the autoanalyzer and analyze samples using the flow diagram in Figure 11-2.
Inj Rep. NOR-X-319
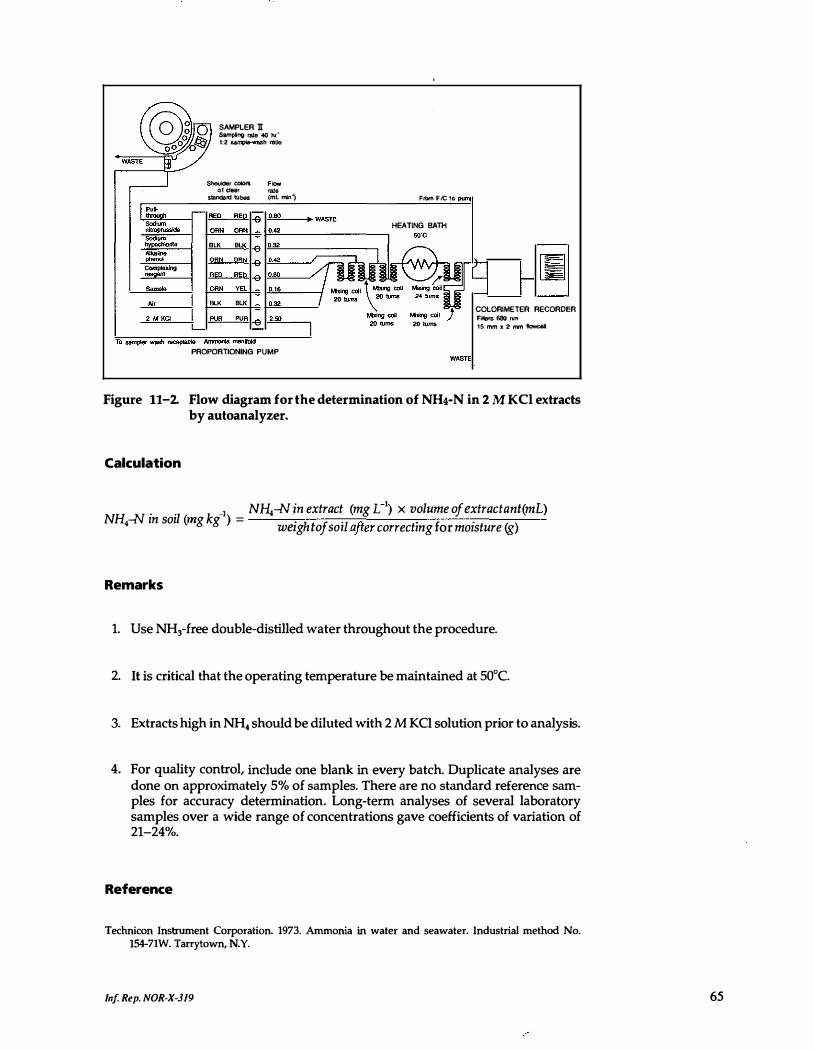
SAMPLER n Sam�no rate 40 hr' 1:2 sa.mple-wash /'IItlo
ShDuklllr colors Flow 01 dear rate
stardartl lubes (mL min") From F/c 10
HEATING BAlli 1-""---------.
PROPORTIONING PUMP
COLORIMETER RECORDER FiHer5. 630 nm 15 mm x 2 mm l\owcell
Figure 11-2. Flow diagram for the determination of NH4-N in 2 M KCl extracts by autoanalyzer.
Calculation
• • -1 NH,-N in extract (mg e') x volume of extractant(mL) NH,-N In sOIl (rng kg ) =
. h if '1 ,n . f . welg to SOl a},er correctzng or mOIsture Ig)
Remarks
1. Use NH,-free double-distilled water throughout the procedure.
2. It is critical that the operating temperature be maintained at 50'C.
3. Extracts high in NH, should be diluted with 2 M KCl solution prior to analysis.
4. For quality control, include one blank in every batch. Duplicate analyses are done on approximately 5% of samples. There are no standard reference samples for accuracy determination. Long-term analyses of several laboratory samples over a wide range of concentrations gave coefficients of variation of 21-24%.
Reference
Technicon Instrument Corporation. 1973. Ammonia in water and seawater. Industrial method No. 154-71W. Tarrytown, N.Y.
In! Rep. NOR-X-319 65
66
Principle
(iv) DETERMINATION OF N03-N IN 2 M KCI EXTRACTS BY AUTOANAL YZER
Nitrates are reduced to nitrite by a copper-cadmium reductor column. The nitrite ion reacts with sulfanilamide under acidic conditions to form a diazo compound. This couples with N-(l-naphthyl)·ethylenediamine dihydrochloride to form a reddish purple azo dye.
Apparatus
Technicon AutoAnalyzer consisting of sampler, manifold, proportioning pump, cadmium reductor column, colorimeter, and recorder
Reductor column preparation
1. Grind cadmium to size. Particles used in the column must be between 25- and 60-mesh size.
2. New or used cadmium particles (10 g) are cleaned with 50 mL of 6 M HCI for 1 minute. Decant HCl and wash cadmium with another 50 mL of 6 M HCI for 1 minute.
3. Decant HCl and wash cadmium several times with water.
4. Decant distilled water and add 50 mL of 2% CuSO,·5H20. Wash cadmium until no blue color remains in solution.
5. Rinse cadmium several times with water, then decant.
6. Add an additional 50 mL of 2% CuSO,·5H20 and wash until no blue color remains in the solution.
7. Decant and wash thoroughly with distilled water.
8. Fill reductor column with ammonium chloride reagent (or water) and transfer prepared cadmium particles to column using a Pasteur pipet. Be careful not to allow any air bubbles to be trapped in the column. (Note: In place of Reductor Tube 189-0000, a 35-crn length of 2-mm I.D. Tygon tubing can be used.)
9. Prior to sample analysis, condition the column with 100 mg N L·t (nitrate) for 5 minutes followed by 100 mg N L·t (nitrite) for 10 minutes.
Reagents
1. Standards:
(i) Stock nitrate solution: dissolve 0.7218 g of KN03 in H20 and dilute to 1 L. Add 1 mL of chloroform to preserve. This gives 100 mg N03-N L·t solution.
Tn/. Rep. NOR·X·3T9
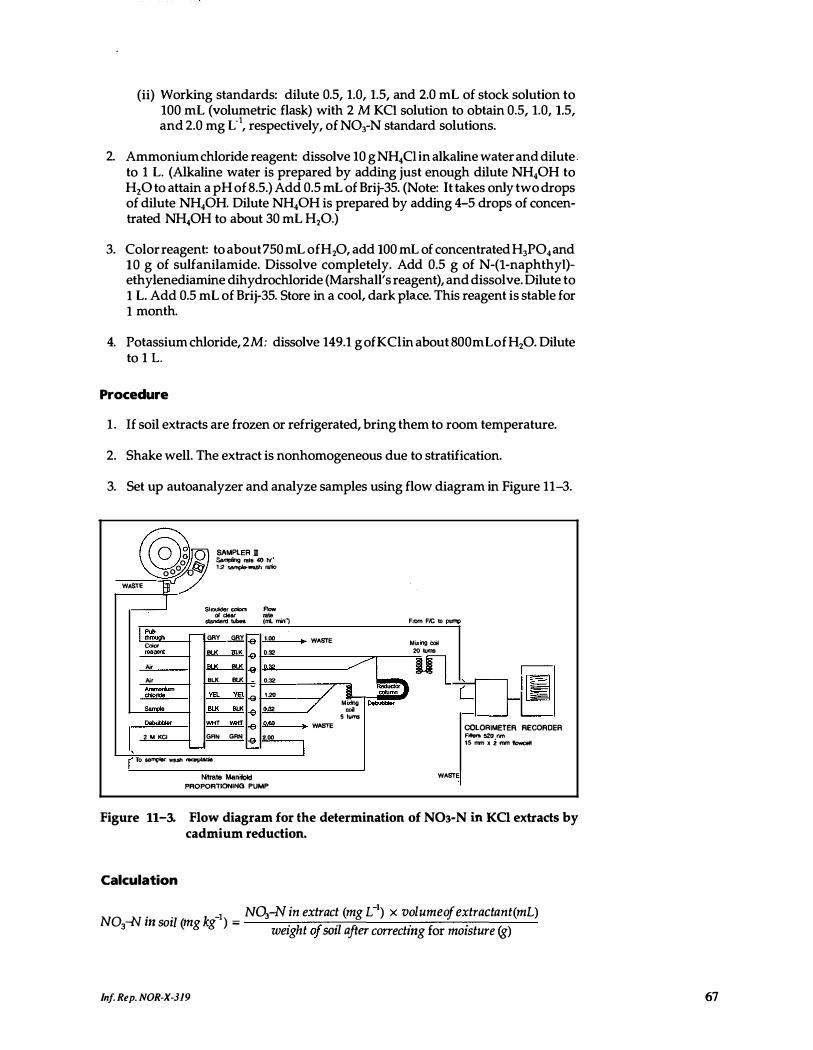
(ii) Working standards: dilute 0.5, 1.0, 1.5, and 2.0 mL of stock solution to 100 mL (volumetric flask) with 2 M KCI solution to obtain 0.5, 1.0, 1.5, and 2.0 mg L·t, respectively, of NO,-N standard solutions.
2. Ammonium chloride reagent: dissolve 10 g NH.CI in alkaline water and dilute. to 1 L. (Alkaline water is prepared by adding just enough dilute NH,oH to H,O to attain a pH of 8.5.) Add 0.5 mL of Brij-35. (Note: It takes only two drops of dilute NH,oH. Dilute NH,oH is prepared by adding 4-5 drops of concentrated NH,OH to about 30 mL H,O.)
3. Color reagent: to about 750 mL ofH,O, add 100 mL of concentrated H,PO, and 10 g of sulfanilamide. Dissolve completely. Add 0.5 g of N-(I-naphthyl)ethylenediamine dihydrochloride (Marshall's reagent), and dissolve. Dilute to 1 L. Add 0.5 mL of Brij-35. Store in a cool, dark place. This reagent is stable for 1 month.
4. Potassium chloride, 2M: dissolve 149.1 gofKClinabout800mLofH,O. Dilute to 1 L.
Procedure
1. If soil extracts are frozen or refrigerated, bring them to room temperature.
2. Shake well. The extract is nonhomogeneous due to stratification.
3. Set up autoanalyzer and analyze samples using flow diagram in Figure 11-3.
O g o SAMPlER D Sampling mla 40 hr'
0000 fJ:J. 1:2 sampIe-wash IllIio
w,'" Br J ..... , - Row
- "" •• _ . .... (mL rrinj From F/c to P\II'I¥I
I :::;... r- GRY GRY -:- 1.00 w""' "'" Mu.ing Coil ..,., ox ... ,." 20 lums
.. • ox
/ :b -
.. .'" ox ,� �
} [I �.., ..... ""- va ,� -""'" / Mixing -'"' '"' ". ..
, ,� -""","" "'" "'" ,.W w""' COLORIMETER RECOROE R Z M KCI G", G ... '.00 Fottera 520 nm
'- -'- I 15 nm x Z mm l\owcell
To sa� wash ...:eptade
Nitrate Manifold w""' PROPORTIONING PUMP
Figure 11-3. Flow diagram for the determination of N03-N in KCI extracts by cadmium reduction.
calculation
. . k -1 _ No,-N in extract (mg L-1) x volumeof extractant(mL) NO,-N m sol/ (mg g ) - . h ,f '1 rft .
f .
(g wetg t oJ SOl a er correctmg or mOIsture )
Inf. Rep. NOR-X-319 67
68
Remarks
1. Use double-distilled water throughout procedure.
2. Extracts high in NO,..N should be diluted with 2 M KCl solution prior to analysis.
3. This procedure includes NO, and NO,.
4. For quality control, include one blank in every batch. Duplicates are done on approximately 5% of samples. There are no standard reference samples for accuracy determination. Precision measurements for NO,-N carried out for the soil test quality assurance program of the Alberta institute of Pedology indicated that NO,-N was one of the most variable parameters measured (Heaney et at. 1988). Coefficient of variation ranged from 4.8 to 30.4% for samples with 67.3 ±3.2 (standard deviation) and 3.3 ±1.0 (standard deviation) mg NO,-N kg·l, respectively.
References
Heaney, D.].; McGill, W.B.; Nguyen, C. 1988. Soil test quality assurance program. Final report. Dept. Soil SeL, Univ. Alberta, Edmonton, Alberta.
Technicon Instrument Corporation. 1971. Nitrate + nitrite in water. Industrial method No. 32-69W. Tarrytown, N.Y.
(v) EXTRACTION OF N03-N WITH 0.01 M CUS04 AND MANUAL DETERMINATION COLORIMETRICALL Y
Principle
Nitrate is extracted with 0.01 M CuSO, solution, containing silver sulfate. Clear soil extract is obtained by the use of CUSO" Ca(OH), and MgCO,. Chloride interference is prevented by the use of Ag,SO,. Nitrate is determined colorimetrically by the nitrophenoldisulfonic yellow color method. The colorimetric method depends upon the nitration of position 6 of 2,4-phenoldisulfonic acid in fuming H,SO" as shown in the following formula:
C"H,oH(HSo,), + HNO, -> C"H,OH(HSO,),NO, + H,O
The product behaves as a nitrophenolic type indicator; it is colorless in acid and yellow when neutralized or in alkaline solution, e.g. NH,OH, due to the formation of triammonium salt (ammonium nitrophenoldisulfonic acid).
Apparatus
125-mL Erlenmeyer flasks Eberbach reciprocating shaker (160 strokes per minute) Lindberg heavy-duty hot plate Spectrophotometer (such as Uitrospec II) Brinkmann dispensettes Filter funnels Whatrnan 42 filter papers
In! Rep. NOR-X·ji9
Reagents
1. Phenoldisulfonic acid (phenoI 2,4-disulfonic acid): transfer 70 mL pure liquid phenol (carbolic acid) to an 800-mL Kjeldahl flask. Add 450 mL concentrated H,SO, while shaking flask. Add 225 mL fuming H,SO, (13-15% SO,). Mix well. Place Kjeldahl flask (loosely stoppered) in boiling water in a beaker and heat for 2 hours. Store resulting phenoldisulfonic acid [C6H,OH(HSO,lz] solution in a glass-stoppered bottle.
2. Dilute ammonium hydroxide (about 7.5 M NH,OH): mix one part NH,OH (specific gravity 0.90) with one part H,o.
3. Copper sulfate solution (0.5 M): 125 g CuSO,.5H,O LO'.
4. Silver sulfate solution (0.6% solution): 6.0 g Ag,SO, L-'. Heat or shake well until all salt is dissolved.
5. Nitrate extracting solution (CuSO, and Ag,SO, solutions): mix 200 mL of 0.5 M copper sulfate solution and 1 L 0.6% silver sulfate solution and dilute to 10 L with water. Mix well.
6. Standard nitrate solution (100 mg L-' N stock solution): dissolve 0.7218 g KNO, (ovendried at 105°C) in water and dilute to 1 L. Mix thoroughly.
7. Standard nitrate solution (10 mg L-' N working solution): dilute 100 mL of 100 mg L-' N stock solution to 1 L with water. Mix well.
8. Ca(OHlz reagent-grade powder.
9. MgCO, reagent-grade powder.
Procedure
1. Place 5 g (2.5 g of peat) of 2-mm soil in a 125-mL Erlenmeyer flask.
2. Add 25 mL nitrate extracting solution.
3. Shake contents for 10 minutes.
4. Add about 0.2 g Ca(OH), and shake for 5 minutes.
5. Add about 0.5 g MgCO, and shake for 10-15 minutes.
6. Allow to settle for a few minutes.
7. Filter through a Whatman 42 filter paper. Discard first 10-15 mL (Note: A perfectly dear and colorless soil extract must be obtained in order to secure accurate results with this method.)
8. Pipet 10 mL of dear filtrate into a 100-mL beaker. Evaporate to dryness on a hot plate at low heat in a fume hood free from HNO, fumes. Do not continue heating beyond dryness.
9. When completely dry, cool residue. Add 2 mL phenoldisulfonic acid rapidly (from a buret having the tip cut off or a dispensetle), covering the residue
In! Rep. NOR-X-319 69
70
quickly. Rotate beaker so that reagent comes in contact with all residual salt. Allow to stand for 10-15 minutes. (Caution: Phenoldisulfonic acid is very corrosive.)
10. Add 16.5 mLcold water. Rotate beaker to dissolve residue. If required, stir with a glass rod until all residue is in solution.)
11. After beakers are cool, add 15 mL dilute NH,OH slowly.
12. After beakers are cool, add 16.5 mL water (volume at the end of Step 12 is 50 mL). Mix thoroughly.
13. Read concentration of NO,-N at 415 nm.
14. Standards: evaporate 0, 2, 5, 8, and 10 mL of the 10 mg L-1 NO,-N working solution after adding 10 mL NO, extracting solution in 100-mL beakers. Follow Steps 9-13, above. After Step 12, these solutions will have 0, 0.40, 1.00, 1.60, and 2.00 mg L-1, respectively, of NO,-N.
Calculations
volume after color volume of extracting _ . -1 N03-N in test development (mL) solution (mL)
N03-N zn sOil (mg kg ) = 1 X X . . solution (mg C ) volume evaporated (mL) Weight of SOil (g)
N03-N in test 50 25 N03-N in soil (mg kg-1) = 1 X - x . .
solution (mg L- ) 10 Weight of 50.1 (g)
Remarks
1. From 5 to 25 mL of soil extract should be evaporated, depending upon expected NO, content of the soil.
2. Calcium hydroxide, MgCO" and Ag,SO, should be free of nitrate contamination.
3. Colored soil extracts should be decolorized with activated charcoal or blanks must be prepared from the extracts to zero spectrophotometer.
4. Phenoldisulfonic acid should be added when samples have completely dried.
5. Silver sulfate removes chloride.
6. Copper sulfate and calcium hydroxide clarify and decolorize soil extract_
7. Magnesium carbonate removes excess Ca(OH),.
8. NH,OH loses strength after long storage. Therefore, a fresh reagent should be used.
9. This method is used when only NO, is needed and when only limited number of samples are to be analyzed.
10. For quality control, a minimum of One reference sample should be analyzed per batch of 40 samples (a minimum of one reference sample daily). Duplicates
Inf. Rep. NOR-X-319
are done on approximately 5% of samples. Precision of N03-N should be less than or equal to 15%. For example, long-term analyses of two laboratory samples were 207.6 ± 19.4 (coefficient of variation 9.4%) and 5.82 ±0.76 mg N kg'! (coefficient of variation 13.1%).
References
Chapman, H.D.; Pratt, P .F. 1961. Methods of analysis for soils, plants, and waters. Univ. Calif., Riverside, California.
Harper, H.J. 1924. The accurate determination of nitrates in soils. Ind. Eng. Chern. 16:180-183.
Hesse, P.R. 1971. A textbook of soil chemical analysis. John Murray (Publishers) Ltd., London, U.K.
Jackson, M.L. 1958. Soil chemical analysis. Prentice-Hall Inc., Eng1ew0o? Cliffs, New Jersey.
McKeague, J.A., editor. 1978. Manual on soil sampling and methods of analysis. Can. Soc. Soil ScL, Ottawa, Ontario.
Prince, A.L. 1945. Detennination of total nitrogen, ammonia, nitrates, and nitrites. Soil Sci. 59:47-52.
Wilde, S.A.; Corey, R.B.i Iyer, J.G.; Voigt, G.K. 1979. Soil and plant analysis for tree culture. Oxford Publishing Co., New Delhi, India.
Principle
12. MIXED ACID DIGESTION FOR TOTAL
ELEMENTS IN SOILS
Organic matter is destroyed by wet digestion with HClO, after a predigestion with HN03• Silicates are driven off as gaseous SiF,. Soluble constituents are dissolved in HC!. Losses through volatilization are negligible because the temperature of the digest cannot exceed the boiling point of HCIO, (203°C).
Apparatus
A 20-place block digester such as a Technicon BD-20 heating unit or a Tecator Digestion System 20, 1015 digester
Technicon BD-20/40 control unit and Tecator Digester 20/40 Control Unit III for Technicon and Tecator block digesters, respectively
Teflon tubes (in-house manufactured): Do not use digestion tubes made of glass. Plastic volumetric cylinder for hydrofluoric acid Filter funnels Whatman 42 filter papers
Reagents
1. Concentrated HN03 (16 M).
2. Concentrated HClO, (12 M).
3. Concentrated HF (28 M).
4. Concentrated HCl (12 M).
In! Rep. NOR·X·319 71
72
Procedure
This procedure is to be used only by analysts trained in handling perchloric acid. Always use safety glasses and chemical- and heat-resistant gloves when performing Steps 2-9.
1. Transfer 0.250-0.500 g (O.OOl-g accuracy) of 100-mesh ovendried sample into teflon tube.
2. Add 10 mL of concentrated HN03 and swirl until all organic matter comes into contact with the acid. Place tubes in digester. Heat at 180"<: for 1 hour or until 1-2 mL of HN03 are left. Do not dry completely. To avoid acid irritation to the analyst, the digestion block must be located in a fume hood to assure the removal of fumes and vapors released during digestion.
3. Carefully add 3 mL of HClO. down inside of the tube and heat at 180"<: for 1 hour or until 1-2 mL of acid remain. All organic matter should be completely digested at this stage.
4. Add 20 mL of HF using a plastic volumetric cylinder and heat at 150°C for approximately 6 hours to near dryness to drive off silicates.
5. Dissolve residue in 2 mL of concentrated HCI and heat at 150°C for 15 minutes.
6. Add 10 mL water, heat, and filter through a Whatman 42 filter paper into a 50-mL volumetric flask.
7. Repeat Step 6 three times.
8. Make up to 50 mL.
9. Store in 60-mL Nalgene square bottles for rcp analysis.
Calculation
The rCP-AES has its own computer. The weight and volume of each sample are entered and internal calibration and calculation are done with the blank subtracted.
Remarks
1. This procedure is very hazardous, but can be performed safely if directions are rigorously followed.
2. Only hoods designed for HClO. use should be used. For safety information see Schilt (1979). Also refer to safety section in this manual (Section 1).
3. Block must be at the temperature indicated when the appropriate time period begins.
4. This procedure is not suitable for elements such as Si, Ti, Cr, and Ag; therefore, blanket analyses cannot be performed on these extracts.
5. For organic soil samples that do not contain significant amounts of inorganic material, analyses can be performed by microwave digestion. (See Section 19.)
Inf Rep. NOR·X·319
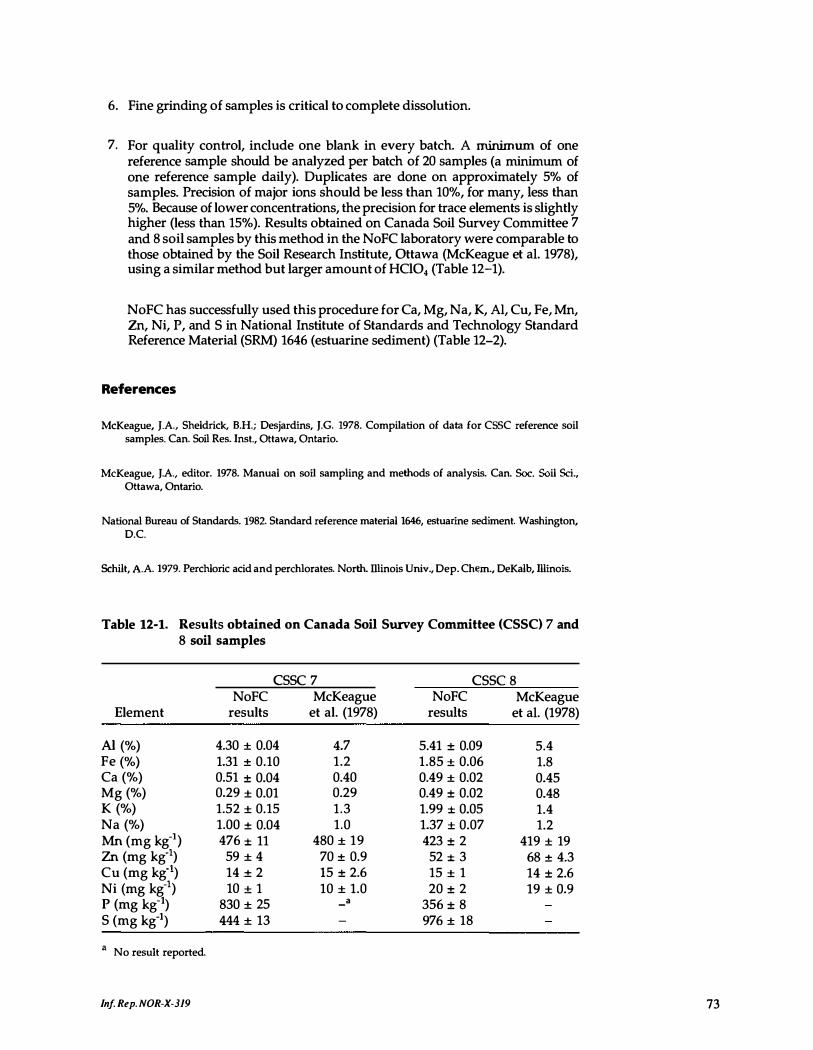
6. Fine grinding of samples is critical to complete dissolution.
7. For quality control, include one blank in every batch. A minimum of one reference sample should be analyzed per batch of 20 samples (a minimum of one reference sample daily). Duplicates are done on approximately 5% of samples. Precision of major ions should be less than 10%, for many, less than 5%. Because of lower concentrations, the precision for trace elements is slightly higher (less than 15%). Results obtained on Canada Soil Survey Committee 7 and 8 soil samples by this method in the NoFC laboratory were comparable to those obtained by the Soil Research Institute, Ottawa (McKeague et aJ. 1978), using a similar method but larger amount of HClO, (Table 12-1).
NoFC has successfully used this procedure for Ca, Mg, Na, K, AI, Cu, Fe, Mn, Zn, Ni, P, and S in National Institute of Standards and Technology Standard Reference Material (SRM) 1646 (estuarine sediment) (Table 12-2).
References
McKeague, J.A., Sheldrick, B.H.; Desjardins, J.G. 1978. Compilation of data for esse reference soil samples. Can. Soil Res. Inst., Ottawa, Ontario.
MCKeague, J.A., editor. 1978. Manual on soil sampling and methods of analysis. Can. Soc. Soil Sci., Ottawa, Ontario.
National Bureau of Standards. 1982. Standard reference material 1646, estuarine sediment. Washington, D.C.
Schilt, AA. 1979. Perchloric acid and perchlorates. North. lllinois Univ., Dep. Chern., DeKalb, Illinois.
Table 12-1. Results obtained on Canada Soil Survey Committee (CSSC) 7 and 8 soil samples
csse 7 csse 8 NoFC McKeague NoFC McKeague
Element results et al. (1978) results et aJ. (1978)
AI (%) 4.30 ± 0.04 4.7 5.41 ± 0.09 5.4 Fe (%) 1.31 ± 0.10 1.2 1.85 ± 0.06 1.8 Ca (%) 0.51 ± 0.04 0.40 0.49 ± 0.02 0.45 Mg (%) 0.29 ± 0.01 0.29 0.49 ± 0.02 0.48 K (%) 1.52 ± 0.15 1.3 1.99 ± 0.05 1.4 Na (%) 1.00 ± 0.04 1.0 1.37 ± 0.07 1.2 Mn (mg kg-I) 476 ± 11 480 ± 19 423 ± 2 419 ± 19 Zn (mg kg-I) 59 ± 4 70 ± 0.9 52 ± 3 68 ± 4.3 Cu (mg kg" ) 14 ± 2 15 ± 2.6 15 ± 1 14 ± 2.6 Ni (mg kg-I) 10 ± 1 10 ± 1.0 20 ± 2 19 ± 0.9 P (mg kg-I) 830 ± 25 -• 356 ± 8 S (mg kg-I) 444 ± 13 976 ± 18
a No result reported.
In! Rep. NOR-X-319 73
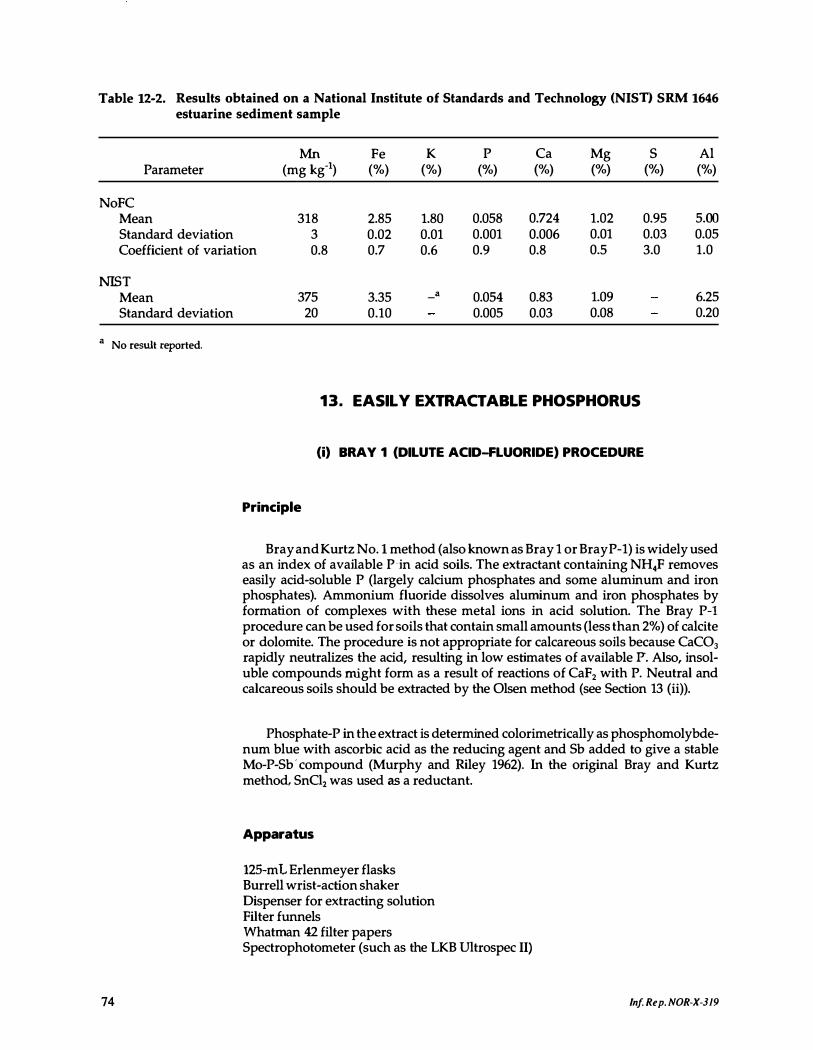
Table 12-2. Results obtained on a National Institute of Standards and Technology (NISn SRM 1646 estuarine sediment sample
Mn Fe K P Ca Mg S Al Parameter (mg kg-') ('Yo) ('Yo) ('Yo) ('Yo) ('Yo) ('Yo) ('Yo)
NoFC Mean 318 2.85 1.80 0.058 0.724 1.02 0.95 5.00 Standard deviation 3 0.02 0.01 0.001 0.006 0.01 0.03 0.05 Coefficient of variation 0.8 0.7 0.6 0.9 0.8 0.5 3.0 1.0
NIST Mean Standard deviation
a No result reported.
74
375 3.35 -a 0.054 0.83 1.09 6.25 20 0.10 0.005 0.03 0.08 0.20
13. EASILY EXTRACTABLE PHOSPHORUS
(i) BRAY 1 (DILUTE ACID-FLUORIDE) PROCEDURE
Principle
Bray and Kurtz No. 1 method (also known as Bray 1 or Bray P-1) is widely used as an index of available P in acid soils. The extractant containing NH.F removes easily acid-soluble P (largely calcium phosphates and some aluminum and iron phosphates). Ammonium fluoride dissolves aluminum and iron phosphates by formation of complexes with these metal ions in acid solution. The Bray P-l procedure can be used for soils that contain small amounts (less than 2'Yo) of calcite or dolomite. The procedure is not appropriate for calcareous soils because CaC03 rapidly neutralizes the acid, resulting in low estimates of available P. Also, insoluble compounds might form as a result of reactions of CaF, with P. Neutral and calcareous soils should be extracted by the Olsen method (see Section 13 (ii)).
Phosphate-P in the extract is determined colorimetrically as phosphomolybdenum blue with ascorbic acid as the reducing agent and Sb added to give a stable Mo-P-Sb' compound (Murphy and Riley 1962). In the original Bray and Kurtz method, SnCi, was used as a reductant.
Apparatus
12S-mL Erlenmeyer flasks Burrell wrist-action shaker Dispenser for extracting solution Filter funnels Whatman 42 filter papers Spectrophotometer (such as the LKB Uitrospec II)
In! Rep. NOR-X-319
Reagents
1. Extracting solution (Bray and Kurtz No. 1 solution): dissolve 22.2 g NH,F and 41.6 mL HCl and make up to 20 L. This makes a solution of 0.03 M NH.,F in 0.025 M HC!. It will keep in a glass bottle for more than a year without appreciable deterioration.
, 2. Reagent A: dissolve 12 g ammonium molybdate [(NH,),Mo.,O,,-4H20) in 250
mL of distilled H20. Dissolve 0.2908 g antimony potassium tartrate [K(SbO)C,H,O,·1/2 H20) in 100 mL H20. Add these two solutions to 1000 mL of 2.5 M H2SO" mix thoroughly, and make up to 2000 mL. Store in Pyrex glass bottle in a dark, cool place.
3. Reagent B: dissolve 1.056 g ascorbic acid (C,H,O,) in 200 mL reagent A and mix. Prepare daily as required. This does not keep for more than 24 hours at room temperature.
4. Sulfuric acid (2.5 M): dilute 140 mL concentrated H2SO, to 1 L.
5. Stock standard P solution (50 mg L·r P): 0.2197 g KH2PO, L·r. Add five drops of toluene to diminish microbial activity. (KH2PO, is dried at 100"(: for 1 hour and cooled in a desiccator before weighing.)
6. Working standard P solution (1 mg L·r): dilute 20 mL of 50 mg L·r P solution (stock) to 1 L. Mix thoroughly.
Procedure
1. Weigh 2.5 g of 2-mm air dry-soil (O.l-g accuracy) into a 125-mL Erlenmeyer flask.
2. Add 25 mL of extracting solution (soil-to-solution ratio of 1:10).
3. Stopper and immediately shake suspension for exactly 1 minute on Burrell wrist-action shaker at speed setting 2. Alternately, shake for exactly 1 minute by hand.
4. Immediately filter through Whatrnan 42 filter paper. Filtrate should be clear. If filtrate is turbid, quickly pour solution back through the same filter. The filtration procedure should not exceed 10 minutes. If filtration takes an unduly long time, use only extract that has filtered in 10 minutes.
5. Store extracts in 60-mL Nalgene bottles.
6. Transfer 2-mL aliquot of filtrate to a 100-mL beaker.
7. Add 20 mL distilled water.
8. Add 8 mL reagent B.
9. Add 20 mL distilled H20.
10. Prepare blank as above using 2 mL extracting solution in place of the soil extract.
Inf Rep. NOR·X·319 75
76
11. Standard curve: measure 0, 2, 5, 10, 15, and 20 mL of standard 1.0 mg L·I P solution in 100-mL beakers. Add 2 mL extracting solution. Add 8 mL reagent B. Add enough water to bring volume to 50 mL. The P concentration of these solutions will be 0, 0.04, 0.10, 0.20, 0.30, and 0.40 mg L"I, respectively.
12. After 10 minutes (solution should be bluish purple), read P concentration at 882 nm after calibrating spectrophotometer with standards. The color is stable for 24 hours and is not affected by the color in the filtrate due to organic P.
Calculation
P in soil (mg kg-I) = P in extract(mg L -l) X 10 (the standard soil-lo-solution ratio)
Remarks
1. In the NoFC laboratory, batch-samples (approximately 30 samples) are weighed and filter papers are set up in all funnels. Extractant is added to two samples at a time. These samples are shaken immediately using the wristaction shaker. The suspension is quickly poured into the funnels. The procedure is repeated with other samples.
2. Reagent blanks should be carried throughout the determination.
3. In general, the amount of P extracted increases with increased speed and shaking time.
4. Phosphorus in solutions can also be determined by ICP-AES; however, ICPAES determines all P in solution, not just orthophosphate. Therefore, in forest soils (particularly the organic layer), ICP-AES will measure soluble organic P compounds in addition to orthophosphates.
5. See Remarks 1 and 2 in Section 13(ii).
6. If the Bray P-1 method is used on highly calcareous soils, the results will be very low because P might be precipitated during extraction.
7. For quality control, a minimum of one reference sample should be analyzed per batch of 40 samples (a minimum of one reference sample daily). Duplicates are done on approximately 5% of samples. Precision of P should be less than or equal to 10%. For example, long-term analyses of two laboratory samples at NoFC were 106 ± 6 (coefficient of variation 5.3%) and 52.2 ± 3.4 mg kg·1 (coefficient of variation 6.4%). The results reported by the Expert Committee on Soil Survey for several laboratories were 88 ± 20 and 37 ± 16 mg kg·l, respectively.
References
Bray, R.H.; Kurtz, L.T. 1945. Determination of total, organic, and available fOImS of phosphorus in soils. Soil Sci. 59:39-45.
McKeague, J.A., editor. 1978. Manual on soil sampling and methods of analysis. Can. Soc. Soil ScL, Ottawa, Ontario.
Murphy, J.; Riley, J.P. 1962. A modified single solution method for the determination of phosphate in natural waters. Anal. Chern. Acta 27:31-36.
Inf. Rep. NOR·X·319
Olsen, S.R.; Sommers, L.E. 1982. Phosphorus. Pages 403-430 in A.L. Page, R.H. Miller, and D.R. Keeney, editors. Methods of soil analysis. Part 2, Agron. 9. Am. Soc. Agron., Madison, Wisconsin.
Sheldrick, B.H., editor. 1984. Analytical methods manual. Agric. Can. Land Resour. Res. Inst., Res. Branch, Ottawa, Ontario. Contrib. 84-30.
(ii) OLSEN (NaHC03) METHOD
Principle
Sodium bicarbonate (sodium hydrogen carbonate) solution extracts some exchangeable or surface-adsorbed P, calcium phosphates and other phosphates. Olsen's method is suitable for calcareous, alkaline, or neutral soils. Calcium carbonate is precipitated, resulting in the dissolution of P from calcium phosphates. The Bray Method (Section 13(i» is more appropriate for acidic soils.
Determination of extracted P is based on the principle that in an acid molybdate solution containing orthophosphate ions, a phosphomolybdate complex forms that can be reduced by ascorbic acid to a molybdenum blue color.
Apparatus
Reciprocating shaker, 160 vibrations per minute (such as an Eberbach shaker) Repipet dispensing bottle Spectrophotometer (such as an LKB Uitrospec II) 125-mL Erlenmeyer flasks Filter funnels Whatman 42 filter papers
Reagents
1. Extracting solution, sodium bicarbonate (sodium hydrogen carbonate); 0.5 M NaHC03: dissolve 84 g NaHC03 in water and make up to 2 L. Mix thoroughly. Adjust to pH 8.5 with 1 M NaOH (4 g NaOH per 100 mL) solution (usually 20-25 mLNaOH solution is required for 2 L NaHC03 solution). Prepare a fresh solution if solution has been standing over 1 month in a glass bottle. Use polyethylene bottle for periods longer than 1 month, but check pH once monthly.
2. Reagents 2� prepared as described in Section 13(i).
Procedure
1. Transfer 2.5 g soil into 12S-mL Erlenmeyer flask.
2. Add 50 mL extracting solution and shake on the reciprocal shaker for 30 minutes (soil-to-solution ratio 1:20). The rate of shaking should be same as would be obtained at speed set at 2 on Burrell wrist-action shaker. The rate of shaking should be constant.
3. Filter through Whatman 42 filter paper. Shake flask immediately before pouring suspension into funnel.
4. Transfer 10-mL aliquot of the filtrate to a lOO-mL beaker.
In! Rep. NOR·X·319 77
78
5. Add 1.0 mL 2.5 M H2SO4 to lower the pH to 5.
6. Add 15.5 mL distilled water.
7. Add 8 mL reagent B.
8. Add 15.5 mL distilled water and mix well.
9. Prepare blank as above using 10 mL extracting solution in place of soil extract.
10. Standard curve: measure 0, 2, 5, 10, 15, and 20 mL of standard 1 mg L-' P solution in 100 mL beakers. Add 10 mL extracting solution and 1.0 mL 2.5 M H2SO4, Add 8 mL reagent B. Add 31, 29, 26, 21, 16, and 11 mL distilled H20, respectively. (Note: The total volume will be 50 mL.) The P concentration of these solutions will be 0, 0.04, 0.10, 0.20, 0.30, and 0.40 mg L" , respectively.
11. After 10 minutes (solution should be bluish purple), read P concentration at 882 nm after calibrating the spectrophotometer with standards.
Calculation
P in soil (mg kg-') = P in extract(mg L-') x 20 (the standard soil-to-solution ratio)
Remarks
1. Color is stable for 24 hours.
2. Dissolved organic matter does not interfere with the method (Watanabe and Olsen 1965).
3. The Olsen method is used on a routine basis at the Manitoba and Saskatchewan provincial soil testing laboratories. It is used as an alternate method in the Alberta Provincial Soil Testing Laboratory.
4. If glass container is used to store extracting solution, pH tends to increase with time, resulting in higher values for extractable P.
5. Analysis cannot be performed by ICP-AES because ICP-AES determines total P and not orthophosphate-P, and CO2 is evolved, which interferes with the determination.
6. In general, the Bray P-l method will extract about the same amount of P as the Olsen method in the low range, and more in the medium and high ranges, except on highly calcareous soils, where it extracts less P.
7. For quality control, analyze a minimum of one reference sample per batch of 40 samples (a minimum of one reference sample daily). Duplicates are done on approximately 5% of samples. Precision of P should be less than or equal to 20%. For example, long-term analyses of two laboratory samples were 12.5 ± 2.0 (coefficient of variation 16.0%) and 47.5 ± 4.7 mg kg-' (coefficient of variation 9.9%).
In/. Rep. NOR-X-319
References
Chapman, H.D.; Pratt, P.F. 1961. Methods of analysis for soils, plants, and waters. Uniy. Calif., Riverside, California.
Houba, V.J.G.; van der Lee, J.J.; Novozamsky, I.; Walinga, 1. 1988. Soil and plant analysis. Part 5: soil analysis procedures. Agric. Univ., Wageningen, The Netherlands.
McKeague, J.A., editor. 1978. Manual on soil sampling and methods of analysis. Can. Soc. Soil Sci., Ottawa, Ontario.
Murphy, J.; Riley, J. P. 1962. A modified single solution method for the determination of phosphate in natural waters. Anal. Chern. Acta 27:31-36.
Olsen, S.R.; Cole, C.V; Watanabe, F.S.; Dean, L.A. 1954. Estimation of available phosphorus in soils by extraction with sodium bicarbonate. U.S. Dep. Agric., Washington, D.C. Cire. 939.
Olsen, S.R.; Sommers, L.E. 1982. Phosphorus. Pages 403-430 in AL. Page, R.H. Miller, and D.R. Keeney, editors. Methods of soil analysis. Part 2, Agron. 9. Am. Soc. Agron., Madison, Wisconsin.
Sheldrick, RH., editor. 1984. Analytical methods manual 1984. Agric. Can., Land Resour. Res. Inst., Res. Branch, Ottawa, Ontario. Contrib. 84-30.
Stone, B. 1971. Effect of temperature and shaking rate on sodium bicarbonate soluble phosphorus. Can. ). Soil Sci. 51:312-313.
van Reeuwijk, L.P., editor, 1987. Procedures for soil analysis. Int. Soil Ref. Inf. Cent., Wageningen, The Netherlands.
Watanabe, F.5.; Olsen, S.R 1965. Test of an ascorbic acid method for detennining phosphorus in water and NaHC03 extracts from soil. Soil Sci. Soc. Am. Proc. 29:677-678.
14. SULFATE AND TOTAL EXTRACTABLE SULFUR
(i) ORGANIC SOILS
Principle
Samples are extracted with 0.01 M NH.Cl solution. A weak salt is used because there is no appreciable amount of adsorbed SO. in organic horizons (Maynard et al. 1987). Soils are extracted moist following homogenization in a Waring blender. It has been shown that the drying of samples (air-dried and ovendried) will significantly alter the sot content of the soil, particularly in organic horizons (David et al. 1982; Peverill et al. 1975; Searle and Sparling 1987). Water is not recommended because it removes more organic 5 than weak salt extractants, is more variable for IC analysis, and produces inconsistent results (Maynard et al. 1987).
Sulfate in the extract is determined by IC and total extractable S by ICP-AE5. Ion chromatography is sensitive, and specific to the SO.' -5 ion (Dick and Tabatabai 1979; Nieto and Frankenberger, Jr. 1985), while the ICP-AES measures the total S in solutions.
Apparatus
Reciprocal shaker Vacuum filtration apparatus with Buchner funnels
In! Rep. NOR-X-319 79
80
Whatman 42 filter papers Ion chromatograph-Single-column ion chromatography electrical conductivity
detector with anion separator column, automated injection system, and data recording system
ICP-AES (such as an ARL 3560) Waring blender
Reagents
1. 0.01 M NH,CI: 0.5349 g NH,Cl L·'.
2. Appropriate eluent for IC system and anion separator column used (see manufacturer's specifications).
3. Stock SO;- standard: 1000 mg SO,-S L·'.
4. Secondary sot standards made up in the appropriate extractant. Range of standards should be based on expected SO,'· concentrations in the extracts.
Procedure
1. Homogenize field-moist sample in a Waring blender. Weigh moist subsample that would approximate 2 g on a dry-weight basis into a 6O-mL Nalgene bottle. Weigh an additional subsample to determine percentage moisture so that SO;can be calculated on a dry-weight basis.
2. Add 20 mL 0.01 M NH.CI.
3. Shake for 1 hour on reciprocal shaker.
4. Vacuum filter resulting suspension (Whatman 42 filter paper) in a Buchner funnel.
5. Analyze extracts within 24 hours or store frozen.
6. Determine total S in extracts by vacuum inductively coupled plasma-atomic emission spectrometry (ICP-AES). See details in Section 3(iv).
7. Determine SO,-S'in the extracts by Ie. See details in Section 3(ili).
Calculation
. • , • -1 extractant (mL) 50.-5 In Sal/ (mg kg- ) = 50,-5 In extract (mg L ) x d . d '/ (g) oven rze SOl
Remarks
1. Some eluents for IC require the use of organic solvents. These should be prepared in a fume hood.
2. Inorganic SO,-S is not a major constituent in terms of total 5; however, it is important to the 5 cycle. Sulfate is the most oxidized form of 5 and most readily taken up by plants and microorganisms (Blair 1971). In general, plants take up
In! Rep, NOR-X-319
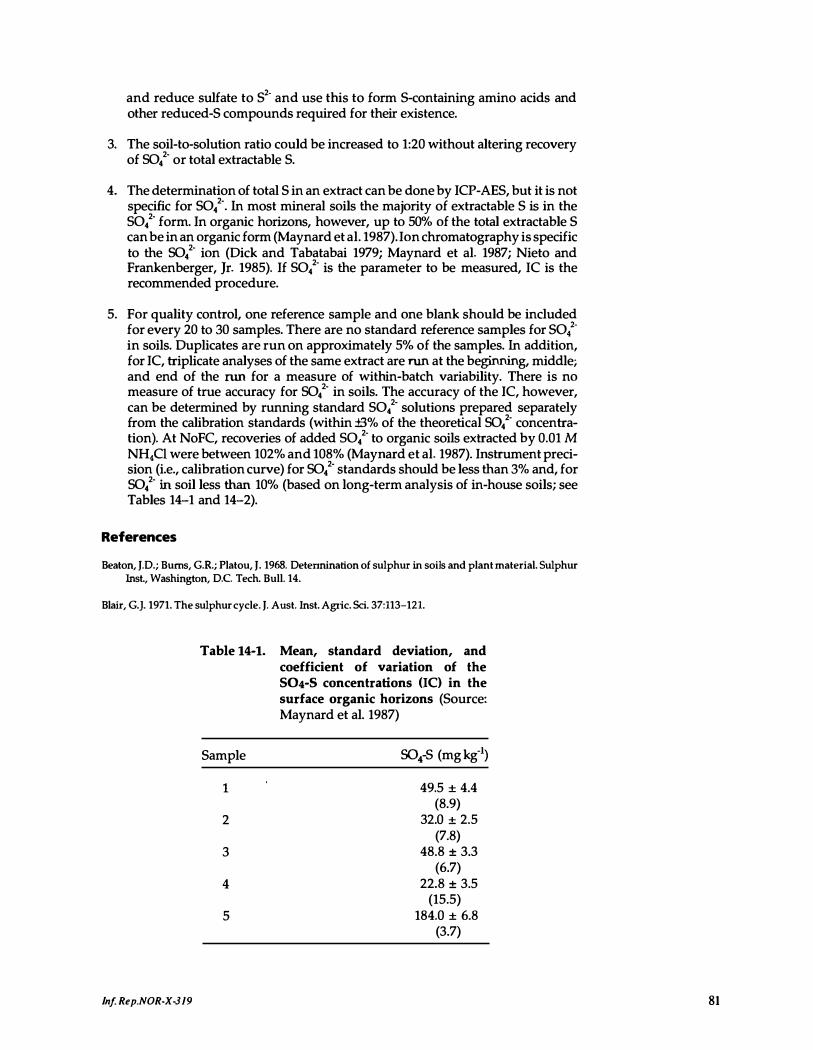
and reduce sulfate to S'- and use this to form S-containing amino acids and other reduced-S compounds required for their existence.
3. The soil-to-solution ratio could be increased to 1:20 without altering recovery of sot or total extractable S.
4. The determination of total S in an extract can be done by ICP-AES, but it is not specific for sot. In most mineral soils the majority of extractable S is in the sot form. In organic horizons, however, up to 50% of the total extractable S can be in an organic form (Maynard et al. 1987). Ion chromatography is specific to the sot ion (Dick and Tabatabai 1979; Maynard et al. 1987; Nieto and Frankenberger, Jr. 1985). If sot is the parameter to be measured, IC is the recommended procedure.
5. For quality control, one reference sample and one blank should be included for every 20 to 30 samples. There are no standard reference samples for SO,'in soils. Duplicates are run on approximately 5% of the samples. In addition, for IC, triplicate analyses of the same extract are run at the beginning, middle; and end of the run for a measure of within-batch variability. There is no measure of true accuracy for sot in soils. The accuracy of the IC, however, can be determined by running standard sot solutions prepared separately from the calibration standards (within :1:3% of the theoretical sot concentration). At NoFC, recoveries of added sot to organic soils extracted by 0.01 M NH,Ci were between 102% and 108% (Maynard et al. 1987). Instrument precision (i.e., calibration curve) for sot standards should be less than 3% and, for sot in soil less than 10% (based on long-term analysis of in-house soils; see Tables 14-1 and 14-2).
References
Beaton, J.D.; Bums, G.R.; Platou, J. 1968. Detennination of sulphur in soils and plant material. Sulphur Inst., Washington, D.C. Tech. Bull. 14.
Blair, G.J. 1971. The sulphur cycle. J. Aust. 1nst. Agric. Sci. 37:113-121.
Table 14-1. Mean, standard deviation, and coefficient of variation of the S04-5 concentrations (IC) in the surface organic horizons (Source: Maynard et al. 1987)
Sample SO,-S (mg kg-I)
1 49.5 ± 4.4 (8.9)
2 32.0 ± 2.5 (7.8)
3 48.8 ± 3.3 (6.7)
4 22.8 ± 3.5 (15.5)
5 184.0 ± 6.8 (3.7)
Inf Rep.NOR·X·319 81
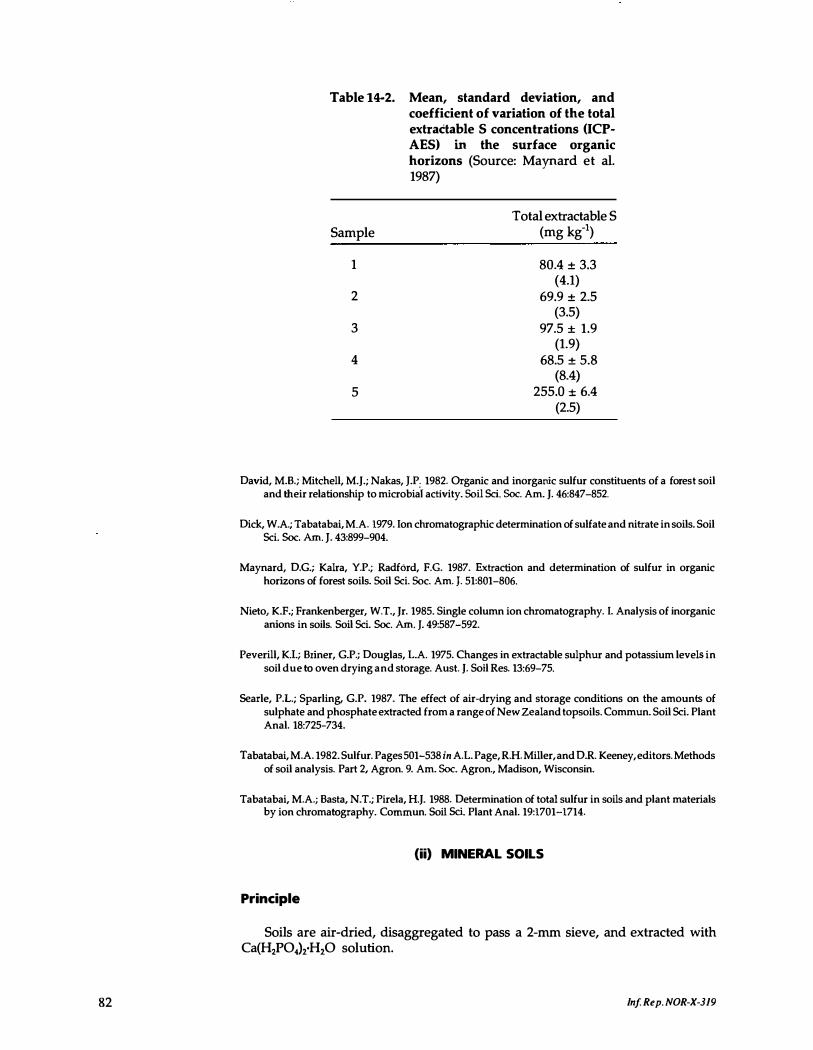
82
Table 14-2. Mean, standard deviation, and coefficient of variation of the total extraCtable S concentrations (ICPAES) in the surface organic horizons (Source: Maynard et al. 19S7)
Total extractable S Sample (mg kg-I)
1 SOA ± 3.3 (4.1)
2 69.9 ± 2.5 (3.5)
3 97.5 ± 1.9 (1.9)
4 6S.5 ± 5.S (SA)
5 255.0 ± 6A (2.5)
David, M.B.; Mitchell, M.J.; Nakas, l.P; 1982. Organic and inorganic sulfur constituents of a forest soil and their relationship to microbial activity. Soil Sci. Soc. Am. J. 46:847-852.
Dick, W.A.; Tabatabai, M.A. 1979. Ion chromatographic determination of sulfate and nitrate in soils. Soil Sci. Soc. Am. J. 43:899-904.
Maynard, D.G.; Kalra, Y.P.; Radford, F.C. 1987. Extraction and determination of sulfur in organic horizons of forest soils. Soil Sci. Soc. Am. J. 51:801-806.
Nieto, K.F.; Frankenberger, W.T., Jr. 1985. Single column ion chromatography. I. Analysis of inorganic anions in soils. Soil Sci. Soc. Am. J. 49:587-592.
Peverill, K.I.; Briner, G.P.; Douglas, L.A. 1975. Changes in extractable sulphur and potassium levels in soil due to oven drying and storage. Aust. J. Soil Res. 13:69-75.
Searle, P.L.; Sparlin� G.P. 1987. The effect of air-drying and storage conditions on the amounts of sulphate and phosphate extracted from a range of New Zealand topsoils. Commun. Soil Sci. Plant Anal. 18:725-734.
Tabatabai, M.A. 1982. Sulfur. Pages 501-538 in A.L. Page, R.H. Miller, and D.R. Keeney, editors. Methods of soil analysis. Part 2, Agron. 9. Am. Soc. Agron., Madison, Wisconsin.
Tabatabai, M.A.; Basta, N.T.; Pirela, H.J. 1988. Determination of total sulfur in soils and plant materials by ion chromatography. Cornrnun. Soil Sci. Plant Anal. 19:1701-1714.
(ii) MINERAL SOILS
Principle
Soils are air-dried, disaggregated to pass a 2-mm sieve, and extracted with Ca(H,PO,j,·H,O solution.
Inf Rep. NOR-X-319
A phosphate solution is preferred for mineral soils to ensure that any adsorbed SO.'" is extracted. Monocalcium phosphate (500 mg L·j P) is preferred over Na or K phosphate because Ca prevents deflocculation in clay soils and makes filtering more convenient. Sulfate is determined by IC and total extractable S by ICP-AES.
Apparatus
See Section 14(i).
Reagents
1. Ca(H,PO,), solution, 500 mg L·j P: 2.03 g Ca(H,PO,),·H,O L·j•
2-4. See Section 14(i).
Procedure
1. Transfer 2-g sample into a 60-mL Nalgene bottle.
2. Add 20 mL Ca(H,PO,), solution.
3. Shake for 1 hour on a reciprocal shaker.
4. Vacuum-filter resulting suspension (Whatman 42 filter paper) using a Buchner funnel.
5. Analyze extracts within 24 hours or store frozen.
6. Determine total S in extracts by ICP-AES. (See Section 3(iv).)
7. Determine SO,-5 in the extracts by IC (See Section 3(iii).)
Calculation
. . -I . -I volumeD! extractant (mL) 50,-5 In SOlI (mg kg ) = 50,-5 In extract (mg L ) x . ht ,f ·1 (g) welg oJ 501
Remarks
1. Ca(H,PO,), removes readily soluble SO.'"plus adsorbed SO.'".
2. See remarks in Section 14(i).
3. Insufficient data available for precision and accuracy calculations.
References
Fox, R.L.; Olson, R.A.; Rhoades, H.F. 1964. Evaluating the sulfur status of soils by plant and soil tests. Soil Sci. Soc. Am. Pree. 28:243-246.
Maynard, D.G.; Kalra, Y.P.; Radford, F.G. 1987. Extraction and determination of sulfur in organic horizons of forest soils. Soil Sci. Soc. Am. J. 51:801-806.
In! Rep. NOR·X·319 83
84
1 S. CATION EXCHANGE CAPACITY AND EXCHANGEABLE CATIONS
Principle
Exchange sites are saturated with NH. + by leaching with unbuffered NH.Cl or buffered NH,OAc solution. Ammonium replaces exchangeable cations on the exchange sites. Excess saturating salt (NH,Cl or NH,OAc) is removed from the soil with an electrolyte-free solvent such as ethyl alcohol. The total amount of the index cation (NH:) retained by the soil is regarded as an estimate of the cation exchange capacity (CEC). Adsorbed NH, + is replaced by Na and is subsequently determined titrimetrically after distillation.
The exchangeable cations in the NH,Cl or NH.OAc leachate are determined by ICP-AES or AAS. Usually Ca, Mg, K, and Na are determined. InK-fixing soils,NH, + can replace part of the fixed K, leading to high exchangeable K results.
(i) MANUAL LEACHING METHOD USING VACUUM EXTRACTION
Apparatus
Buchner funnels Whatman 42 filter papers Suction manifold Tecator Kjeltec Auto 1030 Analyzer
Reagents
1. (i) Ammonium chloride, 1.0 M, unbuffered: 535 g NH.Cl per 10 L (pH of the solution is 4.5-5.5).
(ti) Ammonium acetate, 1.0 M, pH 7.0: dissolve 1540 g ammonium acetate (CH3COONH,) in water and dilute to 20 L. Mix thoroughly. Determine pH of a small sample and discard. Adjust pH to 7.00 ± 0.05 with dilute NH,OH or dilute HOAc as required.
2. Ethyl alcohol, U.S.P., C2H,OH, 95%: 50 mL alcohol plus 35 mL CO2-free water should not require more than 0.2 mL 0.05 M NaOH to give a slight pink color with phenolphthalein.
3. Sodium chloride, U.S.P. grade, NaCl, 10% solution, acidified: prepare 10% solution (use NH3-free salt). Acidify with HCl to render solution approximately 0.005 M with respect to acidity (4.15 mL 12 M HCl per 10 L).
4. Sodium hydroxide (NaOH), 40%: see Section 11(i)b distillation ..
5. Hydrochloric acid (HCl): 0.01 and 0.02 M HCl standardized.
6. Receiving solution (H3B03): see Section 11(i)b distillation.
7. Standard NH,-N solution (1000 mg L·I): 4.717 g (NH,hSO, (dried at 105°C for 1 hour), diluted to 1 L.
In! Rep. NOR·X·319

Procedure
1. Transfer 25 g soil (5 g LFH) to a 250-mL beaker.
2. Add about 50 mL 1.0 M NH.,CI.
3. Stir with a glass rod.
4. Leave samples to stand overnight.
5. Filter with suction using Whatman 42 filter papers. Filter paper should first be sealed by gentle suction in the Buchner funnel using 1 M NH,Cl solution. Shake the suspension before pouring onto the filter paper. Transfer soil from beaker to funnel using NH,Cl solution.
6. Leach with small portions of NH,Cl solution, using gentle suction, to a volume less than 250 mL. Rinse beaker with NH,Cl when analysis is required of individual ions. Make up to 250 mL.in a volumetric flask with NH.,Cl solution, shake well, and save an aliquot for Ca, Mg, Na, and K. (Add 4--5 drops toluene if analyses cannot be performed immediately or store the samples in a cold room at + 2°e.)
7. Leach excess NH,Cl from NH,-saturated soil with about 200 mL of 95% C,HsOH, using small portions of alcohol at a time and draining well between each addition. Discard the filtrate.
8. Leach alcohol-washed soil, called ammonium-soil (all the exchange positions are now filled by ammonium ions), with about 225 mL NaCl solution, using small portions at a time and draining well between each addition. Transfer the contents quantitatively to a 250-mL volumetric flask and make up to volume with NaCl solution.
9. Transfer a 100-mL aliquot of the NaCl leachate to a digestion/ distillation tube (250-mL size) and determine NH,-N on the Kjeltec Auto 1030 Analyzer (Tecator 1985) using 5 mL of 40% NaOH.
Calculations
CEC of soil volume of HCl molarity of
1 -1 = used for x HCl used for x [emo (+)kg 1 titration (mL) titration
total volume of NaClleachate (mL) 100
volume ofNaCI x weight of sample (g) leachate distilled(mL)
CEC ofsoil volume ofHCl molarity ofHCl 250 100 -1 = used for x used for x - x =00. -;:-;-:-;:--;-;-, [emol (+)kg I titration (mL) titration 100 wezghtoJsample (g)
References
Atkinson, H.J.; Giles, G.R.; Maclean, A.J.; Wright, J.R. 1958. Chemical methods of soil analysis. Can. Dep. Agrico, Ottawa, Ontario. Contrib. 169 (rev.).
Tecator. 1985. Kjeltec Auto 1030 Analyzer manual. Hoganas, Sweden.
Inf Rep. NOR-X-319 85
86
(ii) AUTOMATIC EXTRACTION PROCEDURE
Principle
Leachlng tubes (24) attached to 60-mL plastic syringes are mounted on the periphery of three vertically aligned slotted disks. The plungers are withdrawn at a controlled rate by a variable-speed screw jack that separates the two lower disks holding the plungers and syringe barrels, respectively.
Apparatus
Mechanical vacuum extractor, 24-place (Centurion International Inc., Lincoln, Nebraska) (Fig. 15-1)
60-mL polypropylene syringes (use one sample tube, one reservoir tube, and one tared extraction syringe for each sample)
3 x 6 mm rubber tubing (for connecting syringe barrels) Analytical filter pulp, No. 289 (Schleicher and Schuell) Steam distillation-titration apparatus, such as Kjeltec Auto 1030 Analyzer 250-mL digestion/distillation tubes, straight neck
Reagents
1. (i) NH,Cl, 1.0 M: see Section 15(i).
(ti) NH,OAc, 1.0 M, pH 7.0: see Section 15(i).
2. Ethyl alcohol: see Section 15(i).
3. NaCl crystals.
4. Antifoam mixture: mix equal parts of mineral oil and amyl alcohol.
5. Solutions 5-7 described in Section 15(i).
Procedure
1. Tightly compress a O.5-g ball of filter pulp into bottom of syringe barrel with a modified plunger. (Modify plunger by removing the rubber portion of the plunger and cutting off the plastic protrusion.)
2. Place 2.50 ±0.01 g air-dried soil (or 0.50 g LFH) on the filter pulp. If necessary, level sample to even thickness with a spatula.
3. Place sample tube in upper disk of extractor and connect to inverted tared extraction syringe, with plunger inserted in the slot of the stationary disk of the extractor. Fill sample tube to 25-mL mark with NH,Cl. Stir sample and NH,Cl solution with stirring rod and rinse rod with NH,Cl. Let stand for 20 minutes.
4. Extract rapidly (at half-hour setting) until about 15 mL of NH,Cl solution have entered the syringe.
Inf Rep. NOR-X-319
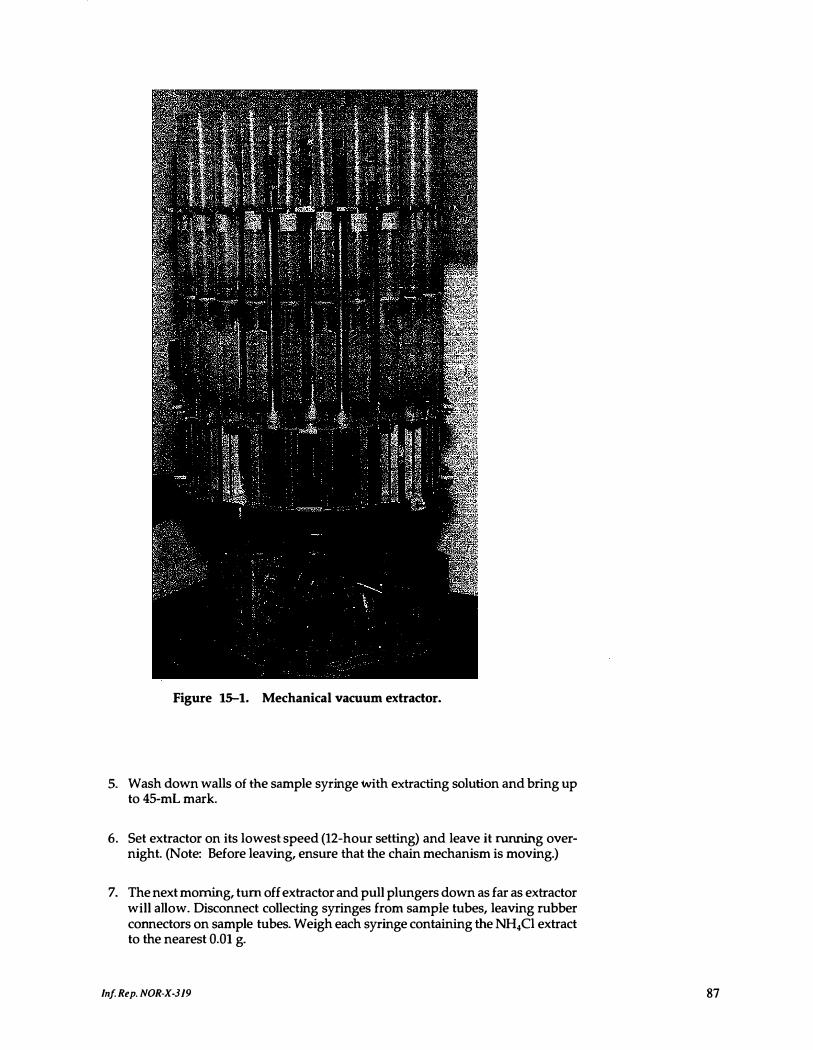
Figure 15-1. Mechanical vacuum extractor.
5. Wash down walls of the sample syringe with extracting solution and bring up to 45-mL mark.
6. Set extractor on its lowest speed (12-hour setting) and leave it running overnight. (Note: Before leaving, ensure that the chain mechanism is moving.)
7. The next morning, tum off extractor and pull plungers down as far as extractor will allow. Disconnect collecting syringes from sample tubes, leaving rubber connectors on sample tubes. Weigh each syringe containing the NH,Cl extract to the nearest 0.01 g.
In! Rep. NOR-X-319 87
88
8. Mix the NH,Cl extract thoroughly and transfer an aliquot into a 6O-mL Nalgene storage bottle for the determination of Ca;Mg, K, and Na by ICP-AES or AAS.
9. Reset upper two-disk unit to starting position. Attach the collecting syringes to the sample tubes and rinse the sides of sample tubes with ethanol from a wash bottle. Fill sample tubes to 25 mL. Stir using micromixer. Let stand for 15-20 minutes. Place reservoir tube on sample tube. Extract rapidly at halfhour setting until about 15 mL of ethanol have drained into syringe.
10. Turn off extractor.
11. Wash down sides of sample tubes and add ethanol to 45-mL mark.
12. Set extractor for 1.5-1.75 hours.
13. After extractor stops, turn off switch, pull plungers down, and remove syringes. Discard the ethanol wash.
14. Remove reservoir tube and return upper unit of extractor to starting position. Reattach coUecting syringes to sample tube and add about 45 mL ethanol. Do not stir, and extract again for approximately 45 minutes. When extractor has stopped, remove syringes and discard ethanol wash.
15. Remove sample tubes and, using compressed air, quantitatively transfer sample plus pulp to 250-mL digestion/ distillation tubes by inverting each sample tube into a digestion/ distillation tube.
16. Wash down any adhering soil On sides of syringe with about 10 mL of water into the digestion/distillation tube.
17. Add 5-6 g (a level teaspoon) NaCl, about 90 mL water and 4-5 drops antifoam mixture (1 mL antifoam mixture to LFH samples).
18. Set Kjeltec Auto 1030 Analyzer to deliver 5 mL 40% NaOH.
19. Collect distilled NH, into boric acid receiving solution and titrate with 0.01 or 0.02 M HCI.
Calculation
CEC of soil . 100
[ l ( ) k -1] = volume ofHCl (mL) x molantyofHCl x . ht if I (g) cmo + g welg 0 samp e
Remarks
1. 1.0 M (pH 7.00) NH,OAc solution gives slightly higher results than 1.0 M NH,Cl (unbuffered) solution; this could be significantly higher on soils with a high pH-dependent CEC.
2. To calculate Ca, Mg, Na, and K in NH,OAc or NH,Cl extract, use the following density factor to convert solution weight to volume: 1.0124 g mL'! for NH,OAc; 1.0106 g mL'! for NH,Cl (weight of the extract is obtained by subtracting weight
Inf. Rep. NOR·X·319
of the syringe from the weight of syringe plus extract in Step 7 of the above procedure).
3. Prepare standard 0.01 or 0.02 M HCI by diluting a 0.10 M HCl stock solution previously prepared by diluting 8.3 mL concentrated HCI to 1 L. It is standardized against standard Na2CO, solution prepared from the primary-standard grade salt (after drying for 2 hours at 110°C and cooling in a desiccator). Methyl orange indicator solution (0.1% aqueous solution) is used for titration.
4. Cation exchange capacity (CEC) = total exchangeable bases + replaceable H
Total exchangeable bases (fEB) = Ca + Mg + Na + K
Percentage base saturation (% BS) = ��� x 100
. exchan!(eable Na Exchangeable sodlUm percentage (ESP%) = cic x 100
5. Ammonium acetate and NH,CI procedures are used for soils low in carbonates and soluble salts.
6. For soils high in soluble salts (EC 0.5 mS cm·' or greater), leach soil with water before analyzing for CEC.
7. Ammonium acetate (1.0 M) pH 7.0 yields a theoretical estimate of the maximum CEC potential (total CEC). In acid soils, this estimate results in a high CEC value because of adsorption of NH; ions to the pH-dependent exchange sites that exist at a neutral pH level. 1ms overestimation does not occur when a neutral unbuffered saturating solution (1.0 M NH,CI) is used. This NH,CIdetermined CEC is termed "effective CEC" or that which occurs at field pH. It is a more realistic estimate of CEC than is the total CEC (NH,OAc).
8. Micaceous clay minerals (e.g., biotite, vermiculite, and muscovite) contain K+ and NH, + as interlayer cations. These cations are not readily exchangeable, and soils containing large quantities of these silicate minerals will produce erroneous results when NH; is used to replace cations for the determination of CEC.
9. Approximate CEC of kaolinite, illite (hydrous mica) and montmorillonite is 10, 30, and 100 cmol (+) kg·', respectively; of clay and humus the CEC is 200 cmol (+) kg·'.
10. Analysis of three soil samples (ECSS 4, 7, and 8; Sheldrick and Wang 1987) in the NoFC laboratory indicated no difference between automatic vacuum extraction and manual leaching methods for CEC (and exchangeable K and Na) in all three soils and exchangeable Ca and Mg in the two noncalcareous soils (ECSS 7 and 8). On calcareous soil (ECSS 4; 24% CaCO, equivalent), however, exchangeable Ca and Mg results were higher by automatic vacuum extractor than the manual leaching method (Ca results were 50% higher by NH,OAc and 100% higher by NH,CI, while Mg results were 20% higher by NH,OAc and 60% higher by NH,CI).
11. Automatic vacuum extraction might give higher results for CEC in NH,-fixing soils because soil is transferred to the distillation tube. In the manual method only NaCi leachate is transferred to the tube.
hrf. Rep. NOR·X·3J9 89
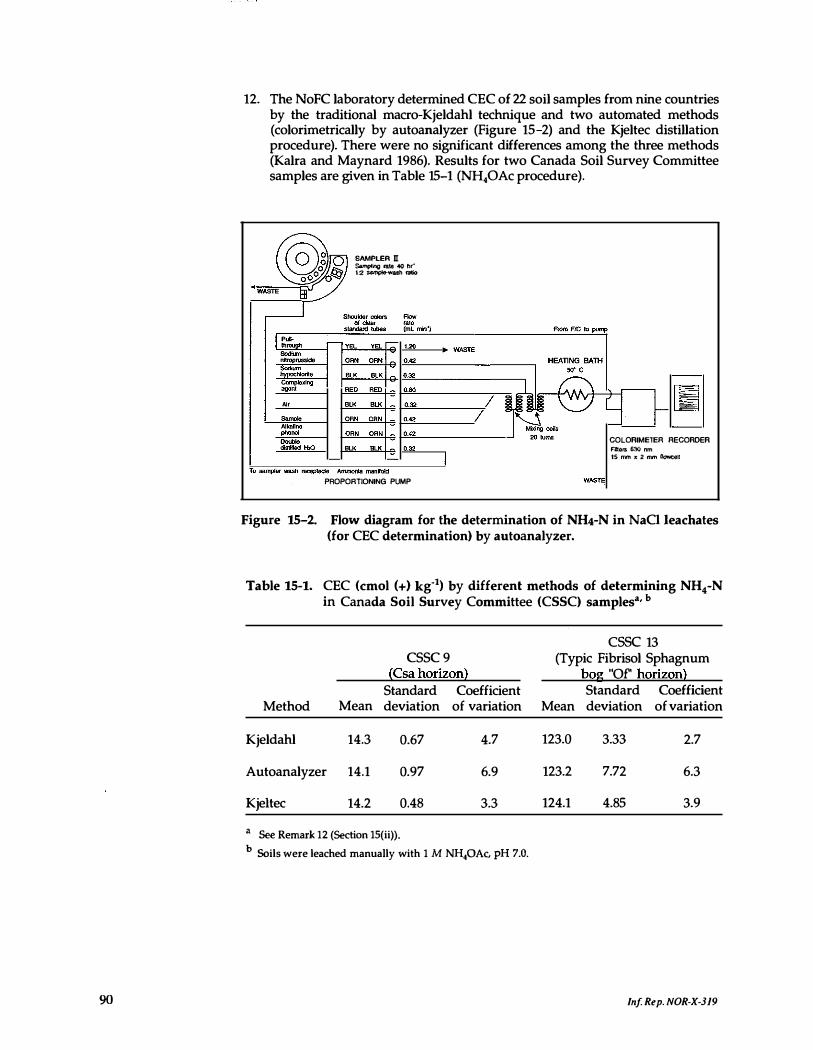
90
12. The NoFC laboratory determined CEC of 22 soil samples from nine countries by the traditional macro-Kjeldahl technique and two automated methods (colorimetrically by autoanalyzer (Figure 15-2) and the Kjeltec distillation procedure). There were no significant differences among the three methods (Kalra and Maynard 1986). Results for two Canada Soil Survey Committee samples are given in Table 15-1 (NH,OAc procedure).
SAMPLER II "..,.:;{O;'1,.,lJ.�J Sampling rate 40 h(' � 1:2 sample-wash IaIio
-PROPORTIONING PUMP
COLORIMETER RECORDER
Fillers 630 nm IS nm x 2 mm fIowcell
Figure 15-2. Flow diagram for the determination of NH4-N in NaCi leachates (for CEC determination) by autoanalyzer.
Table 15-1. CEC (cmol (+) kg·I) by different methods of determining NH.-N in Canada Soil Survey Committee (CSSC) samples" b
CSSC 9 (Csa horizon)
Standard Coefficient
csse 13 (Typic Fibrisol Sphagnum
bog "Of' horizon) Standard Coefficient
Method Mean deviation of variation Mean deviation of variation
Kjeldahl 14.3 0.67 4.7 123.0 3.33 2.7
Autoanalyzer 14.1 0.97 6.9 123.2 7.72 6.3
KjeJtec 14.2 0.48 3.3 124.1 4.85 3.9
a See Remark 12 (Section 15(ii».
b Soils were leached manually with 1 M NH40Ac, pH 7.0.
Inf Rep. NOR·X·319
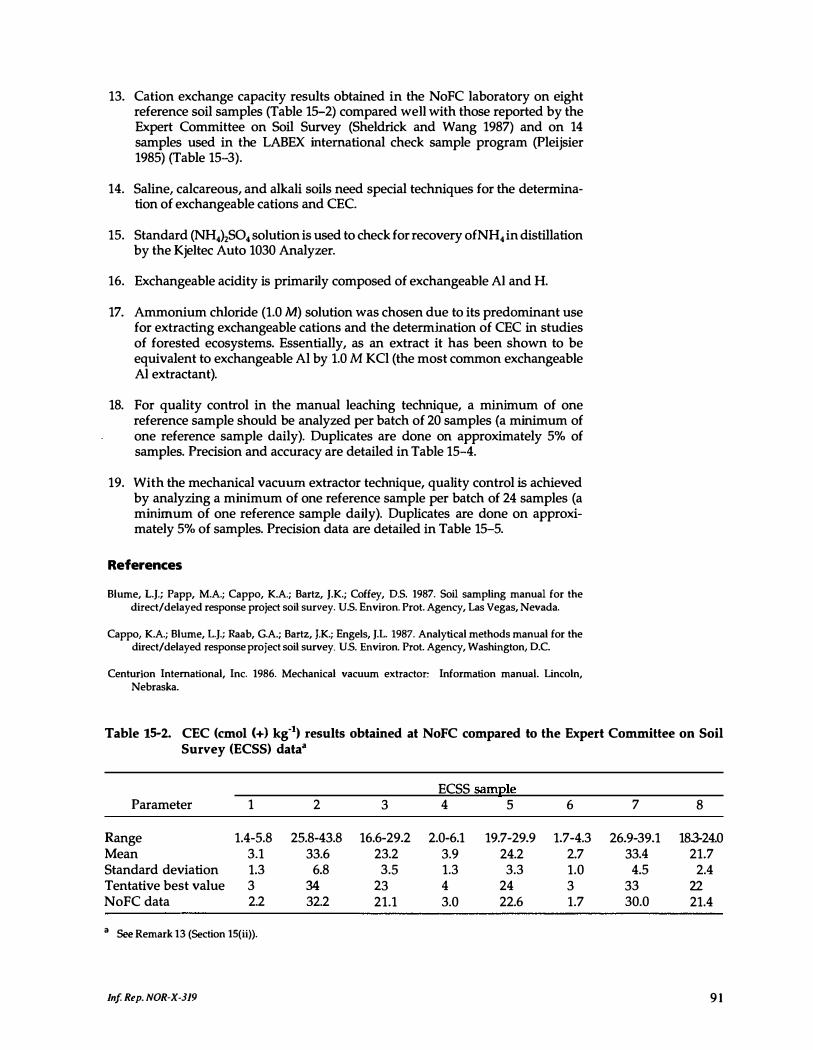
13. Cation exchange capacity results obtained in the NoFC laboratory on eight reference soil samples (Table 15-2) compared well with those reported by the Expert Committee on Soil Survey (Sheldrick and Wang 1987) and on 14 samples used in the LABEX international check sample program (Pleijsier 1985) (Table 15-3).
14. Saline, calcareous, and alkali soils need special techniques for the determination of exchangeable cations and CEC.
15. Standard (NH,),SO, solution is used to checkfor recovery ofNH, in distillation by the Kjeltec Auto 1030 Analyzer.
16. Exchangeable acidity is primarily composed of exchangeable Al and H.
17. Ammonium chloride (1.0 M) solution was chosen due to its predOminant use for extracting exchangeable cations and the determination of CEC in studies of forested ecosystems. Essentially, as an extract it has been shown to be equivalent to exchangeable Al by 1.0 M KCl (the most common exchangeable Al extractant).
18. For quality control in the manual leaching technique, a minimum of one reference sample should be analyzed per batch of 20 samples (a minimum of one reference sample daily). Duplicates are done on approximately 5% of samples. Precision and accuracy are detailed in Table 15-4.
19. With the mechanical vacuum extractor technique, quality control is achieved by analyzing a minimum of one reference sample per batch of 24 samples (a minimum of one reference sample daily). Duplicates are done on approximately 5% of samples. Precision data are detailed in Table 15-5.
References
Blume, L.J.; Papp, M.A.; Cappo, K.A.; Bartz, J.K.; Coffey, D.S. 1987. Soil sampling manual for the direct/delayed response project soil survey. U.S. Environ. Prot. Agency, Las Vegas, Nevada.
Cappo, K.A.; Blume, L.J.; Raab, G.A.; Bartz, J.K.; Engels, J.L. 1987. Analytical methods manual for the direct/delayed response project soil survey. U.S. Environ. Prot. Agency, Washington, D.C.
Centurion International, Inc. 1986. Mechanical vacuum extractor: Information manual. Lincoln, Nebraska.
Table 15-2. CEC (cmol (+) kg·l) results obtained at NoFC compared to the Expert Committee on Soil Survey (ECSS) data"
ECSS sam121e Parameter 1 2 3 4 5 6 7 8
Range 1.4-5.8 25.8-43.8 16.6-29.2 2.0-6.1 19.7-29.9 1.7-4.3 26.9-39.1 183-24.0 Mean 3.1 33.6 23.2 3.9 24.2 2.7 33.4 21.7 Standard deviation 1.3 6.8 3.5 1.3 3.3 1.0 4.5 2.4 Tentative best value 3 34 23 4 24 3 33 22 NoFC data 2.2 32.2 21.1 3.0 22.6 1.7 30.0 21.4
a See Remark 13 (Section lS(ii».
In! Rep. NOR·X·319 9 1
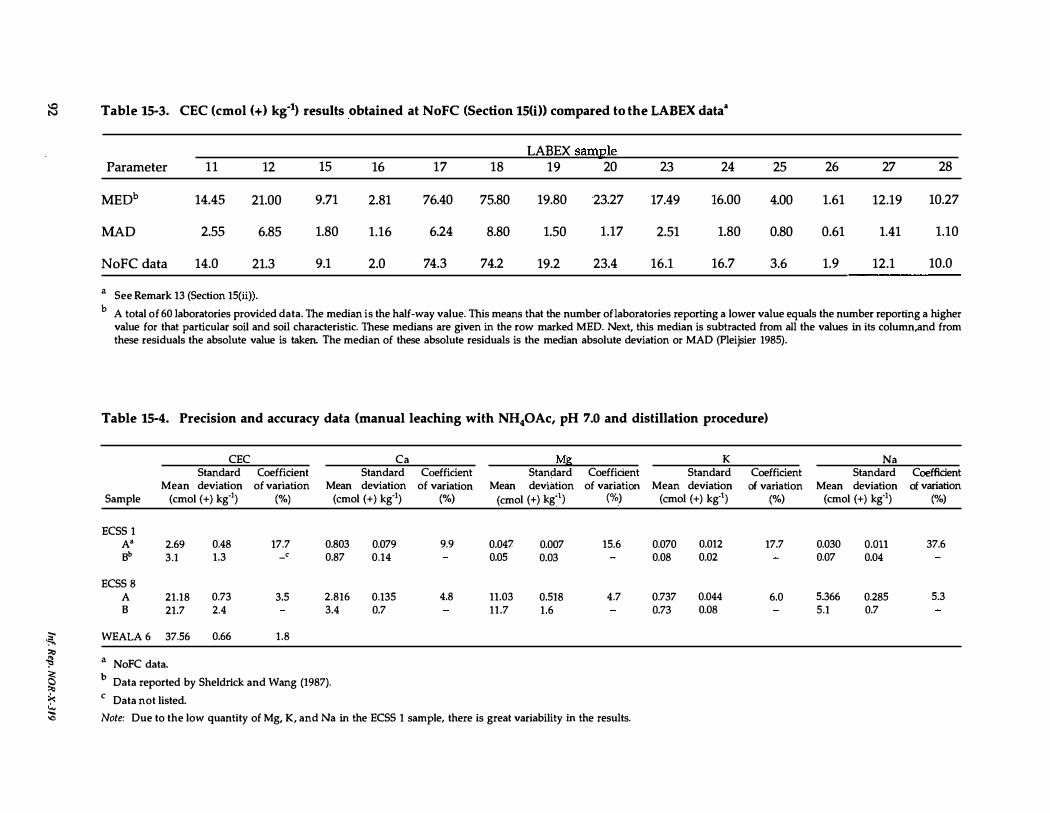
tS Table 15-3. CEC (cmol (+) kg·1) results .obtained at NoFC (Section 15(1» compared to the LABEX data'
LABEX saml2le Parameter 11 12 15 16 17 18 19 20 23 24
MEDb 14.45 21.00 9.71 2.81 76.40 75.80 19.80 23.27 17.49 16.00
MAD 2.55 6.85 1.80 1.16 6.24 8.80 1.50 1.17 2.51 1.80
NoFC data 14.0 21.3 9.1 2.0 74.3 74.2 19.2 23.4 16.1 16.7
a See Remark 13 (Section 15(H» .
25 26 27 28
4.00 1.61 12.19 10.27
0.80 0.61 1.41 1.10
3.6 1.9 12.1 10.0
b A total of 60 laboratories provided data. The median is the half-way value. This means that the number oflaboratories reporting a lower value equals the number reporting a higher value for that particular soil and soil characteristic. These medians are given in the row marked MED. Next, this median is subtracted from all the values in its column,and from these residuals the absolute value is taken. The median of these absolute residuals is the median absolute deviation or MAD (Pleijsier 1985).
Table 15-4. Precision and accuracy data (manual leaching with NH40Ac, pH 7.0 and distillation procedure)
� "" '" �
CEC Standard Coefficient
Sample
ECSS 1 A' Bb
ECSS 8 A B
Mean deviation (cmol (+) kg-I)
2.69 3.1
21.18 21.7
0.48 1.3
0.73 2.4
WEALA 6 37.56 0.66
a NoFC data.
of variation (%)
17.7 , -
3.5
1.8
Ca Standard Coefficient
Mean deviation (emol (+) kg-I)
0.803 0.079 0.87 0.14
2.816 0.135 3.4 0.7
of variation (%)
9.9
4.8
a b . §5 Data reported by Sheldnck and Wang (1987).
� C Data not listed. <.0,
Mg Standard Coefficient
Mean deviation of variation (cmol (+) kg" ) ('Yo)
0.047 0.05
11.03 11.7
0.007 0.03
0.518 1.6
15.6
4.7
;0 Note: Due to the low quantity of Mg, K, and Na in the EeSS 1 sample, there is great variability in the results.
K Standard Coefficient
Mean deviation (emol (+) kg-I)
0.070 0.08
0.737 0.73
0.012 0.02
0.044 0.08
of variation (%)
17.7
6.0
Na Standard Coefficient
Mean deviation (cmol (+) kg-I)
0.030 0.07
5.366 5.1
O.Oll 0.04
0.285 0.7
of variation (%)
37.6
5.3
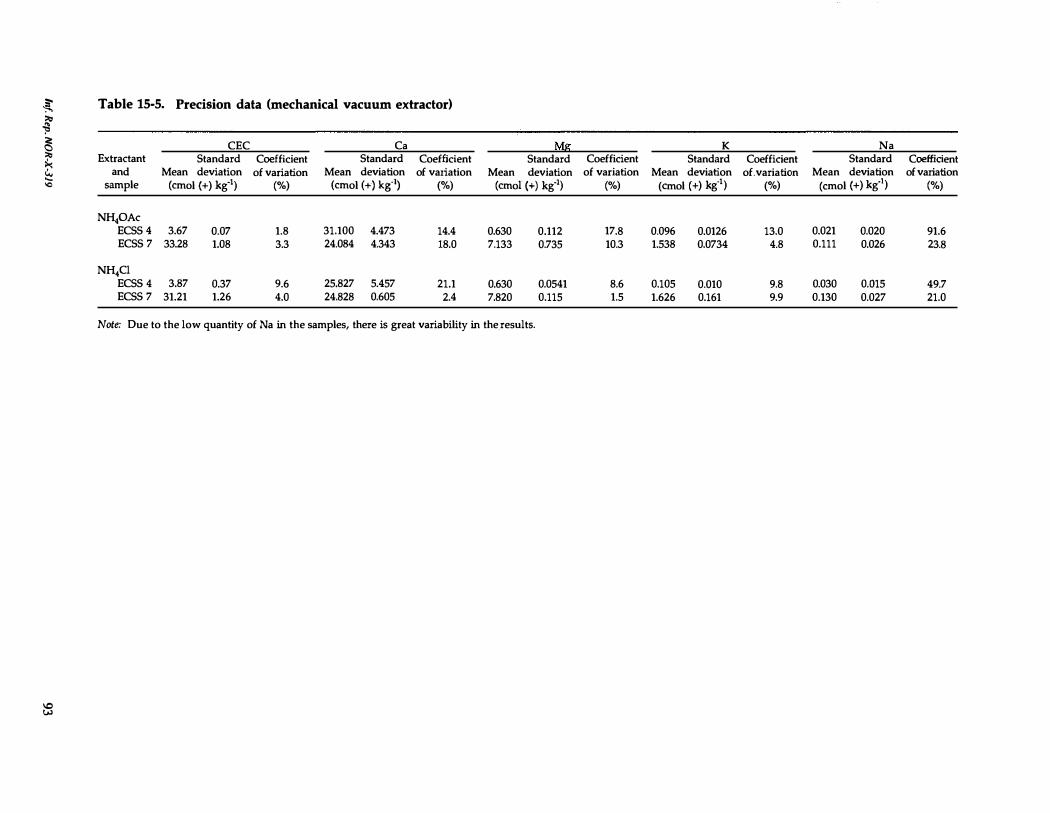
;c '" Table 15-5. Precision data (mechanical vacuum extractor) '" � � CEC Ca Mg K Na '" Extractant Standard Coefficient Standard Coefficient Standard Coefficient Standard Coefficient Standard Coeffident i.: � and Mean deviation of variation Mean deviation of variation Mean deviation of variation Mean deviation of . variation Mean deviation of variation '0 sample (emol (+) kg-') (%) (emol (+) kir') (%) (emol (+) kg-') (%) (emol (+) kg-
') (%) (emol (+) kg-') (%)
NH40Ac ECSS 4 3.67 0_07 1.8 31.100 4.473 14.4 0.630 0.112 17.8 0.096 0.0126 13.0 0.021 0.020 91.6 ECSS 7 33.28 1.08 3.3 24.084 4.343 18.0 7.133 0.735 10.3 1.538 0.0734 4.8 0.111 0.026 23.8
NH,Cl ECSS 4 3.87 0.37 9.6 25.827 5.457 21.1 0.630 0.0541 8.6 0.105 0.010 9.8 0.030 0.Q15 49.7 ECSS 7 31.21 1.26 4.0 24.828 0.605 2.4 7.820 0.115 1.5 1.626 0.161 9.9 0.130 0.027 21.0
Note: Due to the low quantity of Na in the samples, there is great variability in the_results.
�
94
Holmgren, G.G.5.;Juve, R.L.; Geschwender, R.c. 1977. A mechanically controlled variable rate leaching device. Soil Sci. Soc. Am. J. 41:1207-1208.
Huntington, T.G.; Johnson, AH.i Schwartzman, T.N. 1990. Mechanical vacuum extraction vs. batch equilibration for estimation of exchangeable cations. Soil Sci. Soc. Am. J. 54:381-385.
Kalra, Y.P.; Maynard, D.C. 1986. An evaluation of automated and manual methods for NH4-N analysis in the determination of cation exchange capacity of soils. Pages 67-76 in L.K. Pleijsier, editor. Proceedings of an international workshop on the laboratory methods and data exchange programme; August 25-29, 1986. Int. Soil Ref. Inf. Cent., Wageningen, The Netherlands.
Kalra, Y.P.; Maynard, D.C. 1990. An evaluation of a mechanical vacuum extractor for the determination of cation exchange capacity and extractable cations in calcareous soils. Pages 11-451--452 in Trans. 14th In!. Congo Soil Sci., August 12-18, 1990, Kyoto, Japan.
Pleijsier, L.K. 1985. The laboratory methods and data exchange programme: Interim report on the exchange round 85-1. Int. Soil Ref. Inf. Cent., Wageningen, the Netherlands.
Sheldrick, B.H.; Wang, C. 1987. Compilation of data for ECSS (Expert Committee on Soil Survey) reference Soil Samples. Land Resour. Res. Cent., Res. Branch, Ottawa, Ontario.
van Reeuwijk, L.P., editor, 1987. Procedures for soil analysis. Int. Soil Ref. Inf. Cent., Wageningen, The Netherlands. Tech. Pap. 9.
1 6. PYROPHOSPHATE EXTRACTABLE AI AND Fe (AND Mn AND Si, IF NEEDED)
Principle
Sodium pyrophosphate extracts Fe and Al complexed to organic matter in soils. It dissolves amorphous inorganic oxides only slightly. Silicate minerals and crystalline Fe and Al oxides are not attacked to a Significant extent (Sheldrick 1984).
Apparatus
Reagent dispenser (Brinkmann dispensette) Eberbach reciprocating shaker Sorvall Superspeed RC2-il centrifuge with 10.8-cm radius rotor (S5-34/S5-1) 50-mL centrifuge tubes suitable for high-speed centrifugation (round-bottom
plastic tubes) ICP-AES (such as an ARL 3560)
Reagents
1. Sodium pyrophosphate solution (0.1 M): 89.2 g Na.P,07,10 H,O made up to 2 L.
2. Certified ICP standards.
Procedure
1. Transfer 0.30 g soil (accuracy 0.01 g), 60-mesh, into a 50-mL centrifuge tube .. (Note: Sample weight can be anywhere from 0.30 to 1.00 g, depending upon concentration of Al and Fe in the soil.) See Remark 1.
2. Add 30 mL 0.1 M sodium pyrophosphate solution.
Inf. Rep. NOR-X·319
3. Stopper tubes tightly, place horizontally, and shake overnight (16 hours).
4. Centrifuge at 20 000 x gravity (13 000 rpm) for 10 minutes.
5. Decant a portion (about 15-20 mL) of clear centrifugate into a 60-mL Nalgene storage bottle. Carefully examine each centrifugate to ensure that no suspended clay remains.
6. Determine concentration of Al and Fe by ICP-AES using standards prepared in matrix of extracting solution. Analysis can also be performed by atomic absorption.
calculation
Al (or Fe) in soil Al (or Fe) in centrifugate (mg L-') x volume of extractant (mL) (mg kg-')
= weight of soil (g)
Remarks
1. Samples ground to 35-mesh (Sheldrick 1984) and l00-mesh (McKeague 1978) gave comparable results.
2. Standard solutions should be prepared with 0.1 M sodium pyrophosphate for matrix match. If necessary, dilute extracts with pyrophosphate solution or prepare standards containing the same concentration of pyrophosphate as diluted extracts.
3. This procedure has been used in Canada since 1973 for the differentiation of podzolic B horizons from other horizons. It is more suitable for this purpose than acid ammonium oxalate because it avoids problems of some soils containing either volcanic ash or magnetite (McKeague 1978; Sheldrick 1984).
4. Centrifuge speed is critical because it could affect results in some soils. Sheldrick (1984) reported that concentrations of Fe and Al in 0.1 M sodium pyrophosphate extracts decrease progressively by centrifuging for longer times or at higher speeds.
5. It is essential that extracts are perfectly clear. Extracts containing suspended material will give erroneous (higher) results. Centrifugates containing suspended particles should be filtered. Ultrafiltration through a 0.025-!Jlll Mil!ipore filter is recommended for tropical soils and for soils producing doubtful results by the centrifugation method.
6. Length of sample storage time does not affect the results. Results of csse samples analyzed in 1977-78, 1984, and 1987 were similar (McKeague 1978; Sheldrick 1984).
7. If analysis cannot be performed within 24 hours after extraction, store supernatants at 4"<:.
8. In a comparison of pyrophosphate extraction techniques for Fe and AI (Loveland and Digby 1984), the Na-pyrophosphate technique was more consistent than the K-pyrophosphate method, although it would not yield the maximum Fe and Al concentrations.
Inf. Rep. NOR·X-319 95
96
9. For quality control in the Fe pyrophosphate method, a minimum of one reference sample should be analyzed per batch of 60 samples (a minimum of one reference sample daily). Duplicates are done on approximately 5% of samples. Precision of Fe should be less than or equal to 20%. For example, long-term analysis of one laboratory sample was 0.18 ± 0.04% (coefficient of variation 18.9%). The results reported by the Expert Committee on Soil Survey for several laboratories were 0.17 ± 0.07%.
10. In the Al pyrophosphate method, quality control is achieved by analyzing a minimum of one reference sample per batch of 60 samples (a minimum of one reference sample daily). Duplicates are done on approximately 5% of samples. Precision of Al should be less than or equal to 15%. For example, long-term analysis of a laboratory sample was 0.31 ±0.05% (coefficient of variation 15.0%). The results reported by the Expert Committee on Soil Survey for several laboratories were 0.21 ±0.1O%.
References
Bascombe, c.L. 1968. Distribution of pyrophosphate-extractable iron and organic carbon in soils of various groups. J. Soil Sci. 19:251-268.
Loveland, P.J.;. Dighy, P. 1984. The extraction of Fe and Al by 0.1 M pyrophosphate solutions: a comparison of some techniques. J. Soil Sci. 35:243-250.
McKeague, J.A. 1967. An evaluation of 0.1 M pyrophosphate and pyrophosphate-dithionite in comparison with oxalate as extractants of the accumulation products in P0d201s and some other soils. Can. J. Soil Sci. 47,95-99.
McKeague, I.A.; Brydon, J.E.; Miles, N.M. 1971. Differentiation of forms of extractable iron and aluminum in soils-. Soil Sci. Soc. Am. Proc. 35:33-38.
McKeague, I.A., editor. 1978. Manual on soil s{Ul\pling and methods of analysis. Cart. Soc. Soil Set, Ottawa, Ontario.
McKeague, J.A.; Schuppli, P.A. 1982. Changes in concentration of Fe and Al in pyrophosphate extracts of soil, and composition of sediment resulting from ultra centrifugation in relation to spodic horizons. Soil Sci. 13U65-270.
Schuppli, P.A.; Ross, G.J.; McKeague, J.A. 1983. The effective removal of suspended materials from pyrophosphate extracts of soils from tropical and temperate regions. Soil Sci. Soc. Am. J. 47:1026-1032.
Sheldrick, B.H. 1986. Quality control procedure, precision, and rate of analysis in the analytical laboratory. Agric. Can., Land Resour. Res. Cent, Res. Branch, Ottawa, Ontario. Contrib. 85-69.
Sheldrick, B.H., editor. 1984. Analytical methods manual 1984. Agiic. Can., Land Resour. Res. Inst., Res. Branch, Ottawa, Ontario. Contrib. 84-30.
Sheldrick, RH.; McKeague, J.A. 1975. A comparison of extractable Fe and Al data using methods followed in the U.S.A. and Canada. Can. J. Soil Sci. 55:77-78.
van Reeuwijk, L.P., editor, 1987. Procedures for soil analySiS. Int. Soil Ref. Inf. Cent., Wageningen, The Netherlands.
In! Rep. NOR·X·319
PLANT ANALYSIS
17. PREPARATION
To remove surface contamination, leaves are cleansed with a damp linen cloth or by gentle brushing with a stiff-bristled brush followed by brief rinsing with distilled water. Shoots (from greenhouse experiments) contaminated with soil may be washed under running tap water. Washing must be done quickly to minimize loss of soluble constituents, and should be followed by rinsing with distilled water and drying with cloth or tissue paper. Sand or soil adhering to roots can be washed away under running tap water, then roots must be rinsed with distilled water and dried with a cloth or tissue paper.
Scale-like leaves (e.g., Chamaecyparis and Thuja spp.) are analyzed together and should not be removed from twigs. Short needles (e.g., Picea and Tsuga spp.) are analyzed entirely. Long needles (e.g., Pinus and some Abies spp.) are broken into about lO-rnrn lengths for weighing prior to subsampling.
Metabolic activity can alter the composition of plant tissue material. To keep metabolic activity to a minimum, keep the samples cold or frozen.
Leaves and other plant material such as bark, branches, and roots are cut into small pieces. Before drying, pine needles and leaves are removed from the twigs; spruce needles are left to dry on the twigs. Contamination by dust should be avoided, especially when Fe, Mn, Cu, and Zn are to be determined. In some species (e.g., Pinus sylvestris L.) the fascicle sheath is removed. Samples are put in an oven and dried overnight at 70 ± 2°C. Longer drying times are required for woody material. To avoid possible loss of B from the samples, dry samples at 60°C prior to B determination.
To obtain homogeneous powders, samples are finely ground, using an Intermediate Wiley Mill with stainless steel contact points or the Tecator Cyclotec mill, to pass through a 20-mesh sieve. Large samples are first ground through a standard Wiley mill using a 2-rnrn sieve and are then reduced by quartering to a manageable size. These are then ground by the Intermediate Wiley Mill or Tecator Cyclotec. Between samples the mill is thoroughly cleansed with a stiff-bristled brush or compressed air in order to avoid cross-contamination. These samples are used for the determination of N, P, K, Ca, Mg, Na, and other elements. For the determination of Fe, Mn, Cu, and Zn, the samples are ground in an agate or porcelain mortar to avoid metallic contamination. The sample mesh can be important, but for routine analyses samples ground to pass a 20-mesh sieve are satisfactory. After grinding, the whole sample must be mixed thoroughly.
Ground samples are transferred to tightly capped glass jars or sealed polyethylene bags, labeled clearly, and stored for further analysis. Samples are ovendried overnight at 60"(: for B and 70"(: for other determinations before being weighed for analysis. If a sample is dried at 60°C for B, it can be used for other determinations after drying at 70"(:. For analysis, the material is subsampled by quartering.
Remark
For the determination of root-to-shoot ratio, such as in sand culture experiments, the seedlings are washed free of sand, separated into shoots and roots, ovendried at 70"(:, and weighed.
In! Rep. NOR·X·319 97
98
References
Jackson, E.; Farrington, D.S.; Henderson, K. 1986. The analysis of agricultural materials, reference book 427. Minist. Agric. Fish. Food, London, U.K.
Jones, J.B., Jr.; Case, V.W. 1990. Sampling, handling, and analyzing plant tissue samples. Pages 389-427 in R.L. Westerman, editor. Soil testing and plant analysis. Soil Sci. Soc. Am. Book Ser. 3, Madison, Wisconsin.
Weetman, G.F.; Wells, CG. 1990. Plant analyses as an aid in fertilizing forests. Pages 659-690 in R.L. Westerman, editor. Soil testing and plant analysis. Soil Sci. Soc. Am. Book Ser. 3, Madison, Wisconsin.
18. TOTAL NITROGEN
Follow the procedure outlined in Section l1(i) using a 0.25 g sample.
Remarks
For quality control, a mirtimum of one reference sample should be analyzed per batch of 20 samples (a mirtimum of one reference sample daily). Duplicates are done on approximately 5% of samples. Precision of total Kjeldahl nitrogen should be less than or equal to 10%. For example, long-term analyses of two laboratory samples were 1.23 ± 0.11 (coefficient of variation 9.2%) ru:td 2.66 ± 0.09% (coefficient of variation 3.3%). The non-certified values reported by the National Institute of Standards and Technology for several laboratories were 1.2 and 2.86, respectively.
19. MICROWAVE DIGESTION FOR Ca. Mg. K. Na. Mn. Fe. AI. P. AND S
Principle
Electromagnetic radiation of frequencies of 100 to 100 000 megacycles per second is commonly referred to as microwaves. Samples are heated by the oscillating electromagnetic field. Radiation passes through glass or plastic and does not couple with the container material (as is the case with conventional heating). Because the radiation energy is applied directly to the digestion mixture, it provides extremely rapid heating and better control of power and time. The plant material is digested by acid oxidation.
Apparatus
A commercially available laboratory microwave drying/digestion oven, such as Model MDS-81 D (CEM Corp., Indian Trail, North Carolina)
Teflon digestion vessels (with teflon screw caps) of 120-mL capacity (CEM Corp., Indian Trail, North Carolina)
2 Brinkmann dispensette acid dispensers, adjustable from 0-10 mL, for HNO, and HCl
Auto-pipet, for H,O, Filter funnels Whatman 42 filter papers
Int Rep. NOR-X-319
Reagents
1. Nitric acid: concentrated, 70% HNO, (specific gravity 1.42).
2. Hydrogen peroxide: 30% H,O,.
3. Hydrochloric acid: concentrated, 37% HCl (specific gravity 1.18).
Procedure
1. Transfer 0.50 g (0.01 g accuracy) foliage or organic soil sample (20-mesh) into each digestion vessel. Larger samples may be required in digestion to obtain detectable concentrations of some elements. Add 10 mL HNO, and swirl the vessel gently so that all the material comes in contact with the acid.
2. Screw on the caps. Do not use inserts in the caps. Load digestion vessels on turntable and put turntable in oven. Make sure that center wheel of turntable sits inside the tabs on the drive lugs. Switch on turntable and check to ensure that assembly rotates smoothly.
3. Enter in time (30 minutes) and power (90%); press Start, making sure that the exhaust is on full power and fume hood is on "fast" function.
4. At the end of the digestion cycle, stop turntable rotation. Leave containers in oven for about 5 minutes to exhaust fumes.
5. Take containers out of oven and add 1.0 mL H,O, slowly. Allow samples to stand for about 5 minutes.
6. Digest samples at 90% power for 15 minutes.
7. After cooling for about 5 minutes, add 2 mL HCl and let sit for about 5 minutes.
8. Digest samples at 30% power for 10 minutes.
9. Remove caps (in fume hood) and rinse with water. Rinse down sides of container.
10. Filter sample solutions (using Whatman 42 filter paper) into 100-mL volumetric flasks (in a fume hood).
11. Rinse digestion vessel three times to ensure that material is quantitatively transferred to funnels (make sure that it has filtered before second and third additions). Make up volume to 100 mL.
12. After thorough mixing, transfer an aliquot into a 60-mL Nalgene bottie for ICP-AES analysis.
Calculation
The ICP-AES has its own computer. The weight and volume of each sample are entered and internal calibration and calculation are done with the blank subtracted.
In! Rep. NOR-X-319 99
100
Remarks
1. Immediately before use, all glassware, plastic ware and teflon digestion vessels should be thoroughly rinsed first with dilute HCl (1 + 3) and then with double-distilled water.
2. Screw caps are used to provide reflux action.
3. Reagents should be added to the samples in the fume hood.
4. Digestion vessel carousel should be rotated during digestion period. This ensures that all samples are subjected to the same microwave flux.
5. After HN03 digestion, samples must be cooled before adding H,O,. Otherwise there is excessive frothing due to the reaction between H,O, and hot acid digest.
6. It is essential that filtrate does not have any particles that could clog the ICP"-AES sample nebulizer.
7. Sodium in filter paper can impair delicate measurements unless removed before filtering digests (Ali and Kalra 1974).
8. Microwave oven should be checked routinely for leakage using an electromagnetic monitor.
9. A calibration curve is run as outlined in Section 3(iv}.
10. A microwave oven digests 12 samples at a time, 'allowing digestion of 36-48 samples per day. For quality control, a minimum of . one blank and one reference sample should be analyzed daily. Duplicates are done on approximately 5% of the samples for both digestions.
11. This procedure is suitable for the digestion of organic soil samples but not mineral soils.
12. As a measure of preciSion and accuracy, the mean concentration of elementS (mg kg-') with standard deviation and coefficient of variation (%, in parentheses), as determined by the above method are compared with National lnstitute of Standards and Technology values and are given in Table 19-1. The Fe and Al results were the most problematic in precision and accuracy. Analysis of National Institute of Standards and Technology standards (wheat flour, citrus and tomato leaves, and pine needles) by the proposed method gave lower results than the certified values; however, they compared well with the data obtained by other investigators (Kalra et aI. 1989).
References
Ali, M.W.; Kalra, Y.P. 1974. Sodium contamination by filter paper. J. Assoc. Off. Anal. Chern. 57:762.
Hogan, G.O.; Maynard, D.G 1984. Sulphur analysis of environmental materials by vacuum inductively coupled plasma atomic emission spectrometry (ICP-AES). Pages 676-683 in Proc. Sulphur-84, Int. Coni., Calgary, Alberta, June 1984. Sulphur Dev. Inst. Can., Calgary, Alberta.
Kalra, YP.; Maynard, D.G.; Radford, F.G. 1989. Microwave digestion of tree foliage for multi-element analysis. Can. J. For. Res. 19:981-985.
In[. Rep. NOR-X·3J9
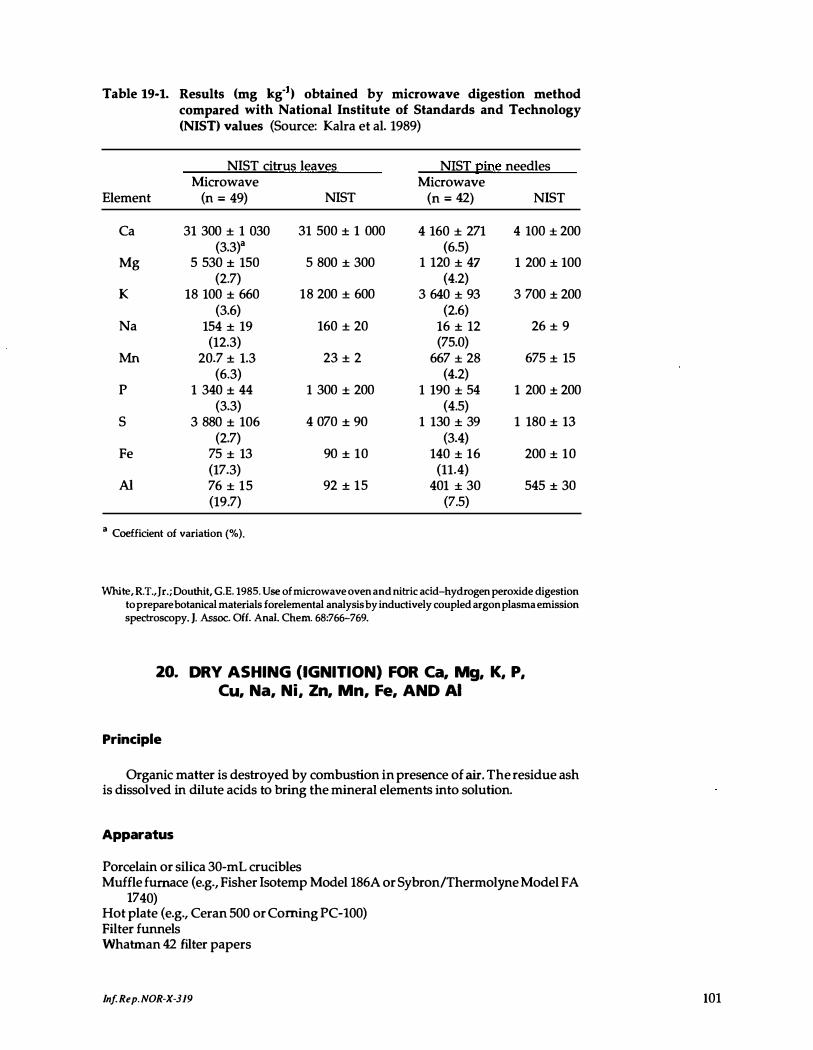
Table 19-1. Results (mg kg" ) obtained by microwave digestion method compared with National Institute of Standards and Technology (NIST) values (Source: Kalra et al. 1989)
NIST citrus leaves NIST Eine needles Microwave Microwave
Element (n = 49) NIST (n = 42) NIST
Ca 31 300 ± 1 030 31 500 ± 1 000 4 160 ± 271 4 100 ± 200 (3.3)" (6.5)
Mg 5 530 ± 150 5 800 ± 300 1 120 ± 47 1 200 ± 100 (2.7) (4.2)
K 18 100 ± 660 18 200 ± 600 3 640 ± 93 3 700 ± 200 (3.6) (2.6)
Na 154 ± 19 160 ± 20 16 ± 12 26 ± 9 (12.3) (75.0)
Mn 20.7 ± 1.3 23 ± 2 667 ± 28 675 ± 15 (6.3) (4.2)
P 1 340 ± 44 1 300 ± 200 1 190 ± 54 1 200 ± 200 (3.3) (4.5)
S 3 880 ± 106 4 070 ± 90 1 130 ± 39 1 180 ± 13 (2.7) (3.4)
Fe 75 ± 13 90 ± 10 140 ± 16 200 ± 10 (17.3) (11.4)
AI 76 ± 15 92 ± 15 401 ± 30 545 ± 30 (19.7) (7.5)
a Coefficient of variation (%).
White, R.T., Jr.i Douthit, G.E. 1985. Use of microwave oven and nitric add-hydrogen peroxide digestion to prepare botanical materials forelemental analysis by inductively coupled argon plasma emission spectroscopy. J. Assoc. Off. Anal. Chern. 68:766-769.
20. DRY ASHING (IGNITION) FOR Ca, Mg, K, P, Cu, Na, Ni, Zn, Mn, Fe, AND AI
Principle
Organic matter is destroyed by combustion in presence of air. The residue ash is dissolved in dilute acids to bring the mineral elements into solution.
Apparatus
Porcelain or silica 30-mL crucibles Muffle furnace (e.g., Fisher Isotemp Model 186A or Sybron/Thermolyne Model FA
1740) Hot plate (e.g., Ceran 500 or Coming PC-l00) Filter funnels Whatman 42 filter papers
Inj. Rep. NOR·X·319 101
\02
Reagents
1. 5 M HCl: 430 mL concentrated HCl (specific gravity 1.lB) + 570 mL water.
2. Concentrated HN03 (specific gravity 1.42).
Procedure
1. Clean crucibles by heating on a hot plate with 10% HN03•
2. Place crucibles in drying oven at BO°C for at least 30 minutes.
3. Cool crucibles and weigh 0.50 g of ground plant material (20-mesh size) into each.
4. Place crucibles in a muffle furnace at room temperature. Temperature is set at 470 ±SOC (the temperature is raised gradually to 4700q and samples are ashed for 16 hours (overnight).
5. After ashing is complete, residual ash is white to greyish-white or darker in color. Cool crucibles before removing from muffle furnace with stainless steel tongs.
6: Moisten ash in crucible with 8-10 drops of water followed by 3 mL of 5 M HC!. Care must be taken to ensure that there is no loss of sample due to effervescence.
7. Place crucibles on hot plate set at low temperature (approximately BOt, Setting 4 on the Lindberg hotplate) and add 0.25 mLof concentrated HN03• Evaporate to dryness (takes 60-75 minutes) in order to solubilize phosphates and precipitate silica.
B. Moisten dried salts from Step 7 with 3 mL 5 M HCl and warm on hot plate. Add 5 mL water and maintain heat. Salts will usually dissolve in about 10 minutes.
9. Transfer solution while hot (using rubber policeman) with distilled water to 50-mL volumetric flask through funnel fitted with Whatman 42 filter paper. Wash crucible and paper with four changes of distilled water.
10. Discard filter paper and make up to volume with distilled water. Save an aliquot for analysis.
11. Resultant solution is suitable for determination of most non-volatile metals (Ca, Mg, K, P, Cu, Na, Ni, Zn, Mn, Fe, and AI) by ICP-AES, but cannot be used for As, S, Se, F, or Cl because of volatilization loss.
Calculation
The ICP-AES has its own computer. Weight and volume of each sample are entered, and an internal calibration and calculation will be done with the blank subtracted.
In! Rep. NOR·X·319
Remarks
1. Experience in the NoFC laboratory has shown that any temperature between 450 and 480"C is suitable for ashing.
2. Ashing time (16 hours) begins when furnace has reached 470°C. It is important to note that different furnaces take different times to reach 470°C from room temperature. For example, NoFC's Sybron/Thermolyne Model FA 1740 (Thermolyne Corporation, Dubuque, Iowa) takes 1.5 hours, while the Fisher Isotemp Muffle Furnace Model 186A takes 3 hours (the rate of temperature increase can be adjusted).
3. Ashing is carried out for about 16 hours. Variations between 12 and 18 hours are suitable.
4. Sodium in filter paper can impair delicate measurements unless removed before filtering ash extracts (Ali and Kalra 1974).
5. One blank is included in every batch for quality control. A minimum of one reference sample should be analyzed per batch of 20 samples (a minimum of one reference sample daily). Duplicates are done on approximately 5% of samples. Insufficient data are available for precision and accuracy calculations.
References
Ali, M.W.; Kalra, YP. 1974. Sodium contamination by filter paper. J. Assoc. Off. Anal. Chern. 57:762.
Ali, M.W.; Zoltai, S.c.; Radford, F.G. 1988. A comparison of dry and wet ashing methods for the elemental analysis of peat. Can.}. Soil Sci. 68:443-447.
Lambert, M.J. 1976. Preparation of plant material for estimating a wide range of elements. For. Comm. New South Wales, West Pennant Hills, Australia. Res. Note 29.
21. CHLORIDE
Principle
Plant samples are extracted with water. Water extracts are acidified by sulfuric acid before potentiometric titration. In this method, both steps are combined. Chloride in the extract is determined electrometrically by argentimetric titration. The Ag electrode, used in conjunction with a reference Hg,SO, electrode, registers change to an excess of Ag ions.
Apparatus
Reciprocating shaker Radiometer automatic titration system, consisting of a Titration Assembly ITA 60
with provision for stirring, delivery of titrant, and electrodes. The radiometer electrode combination is a silver-billet electrode, Type P4011, and a mercurous sulfate reference electrode, Type K601. The delivery control equipment (Autoburette ABU 12) is monitored by an automatic titration control unit (TIT 80 Titrator) used in conjunction with a digital standard pH/mV meter (PHM 82).
In! Rep. NOR·X·319 103
104
Reagents
1. 0.05 M AgN03 (stock solution): dissolve 8.494 g AgN03 and make up to 1 L. Store in a dark-colored bottle.
2. 0.01 M NaCl (stock solution): dissolve 0.5844 g NaCl (ovendried at 105°C) and make up to 1 L.
3. 0.001 M NaCl (working solution): dilute 100 mL stock 0.01 M NaCl solution to 1 L. (Use this solution to standardize the 0.001 M AgN03 solution.)
4. 0.001 M AgN03' H2SO4 medium (working titrant): transfer 20 mL of the stock 0.05 M AgN03 solution, add some water (about 500 mL), cool, add 42 mL concentrated H2SO4, and make up to 1 L. Store in a dark bottle. Determine the correct molarity by titration with standard 0.001 M NaCl solution. (Titrate 25 mL of reagent (4) + 1 mL concentrated H2SO4 against reagent (3) to -150 mV end point.)
5. Extracting solution (about 0.75 M H2S04): 42 mL concentrated H2SO4 L·'.
Procedure
1. Transfer 0.25 g (0.10-1.00 g) of 20-mesh ovendried sample into a 100-mL polyethylene screw-cap container.
2. Add 50 mL of extracting solution (H2SO4),
3. Shake the mixture for 30 minutes on a reciprocating shaker.
4. Place the polyethylene container on the built-in magnetic stirrer.
5. Introduce the electrodes into the suspension and stir the sample.
6. Set pH/mV meter to read mV.
7. Set end point at -150 mV.
8. Titrate suspension to -150 m V end point. At beginning, large increments of AgN03 can be added. As end point approaches, smaller amounts should be added so that exact end point can be obtained.
Calculation
c/ in sample (mg kg-')
Remarks
volumeoj AgN03 x molarity oj AgN03 x 35.45 x 1000 weight of samplelg)
1. Clean electrodes periodically according to instructions provided.
2. Silver nitrate solution is photosensitive and must be stored in amber bottles or clear bottles covered with aluminum foil.
Inj. Rep. NOR·X·319
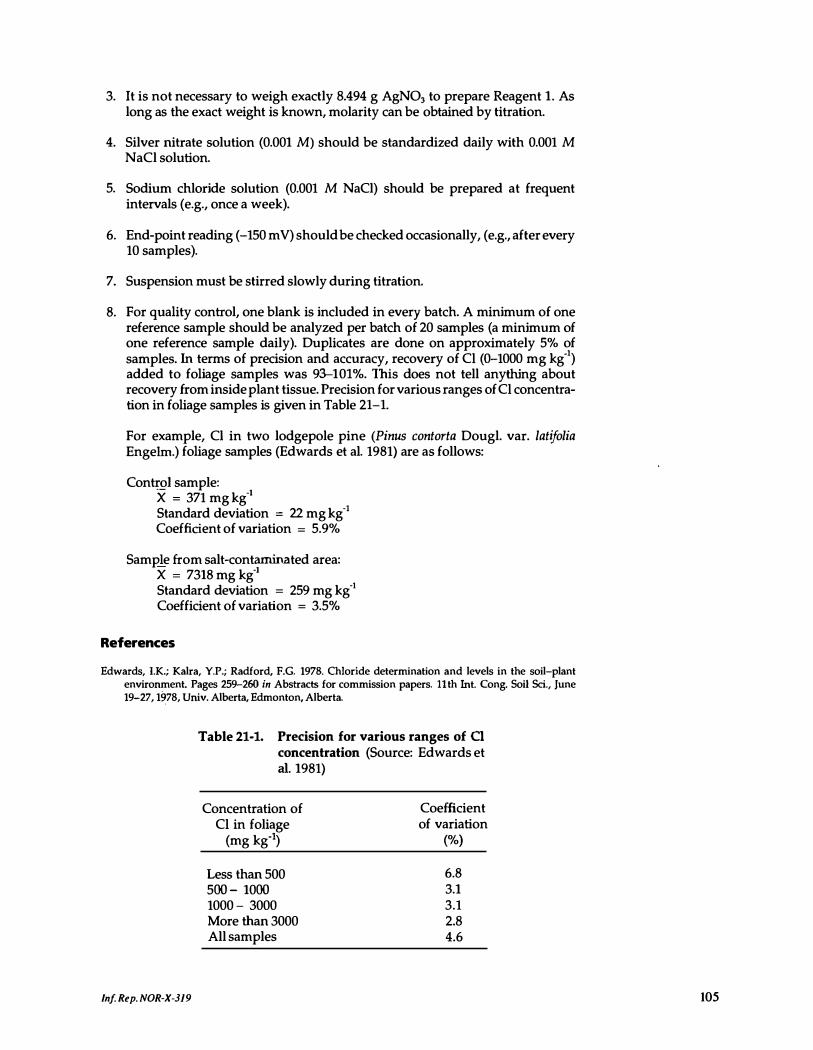
3. It is not necessary to weigh exactly 8.494 g AgNO, to prepare Reagent 1. As long as the exact weight is known, molarity can be obtained by titration.
4. Silver nitrate solution (0.001 M) should be standardized daily with 0.001 M NaCl solution.
5. Sodium chloride solution (0.001 M NaCl) should be prepared at frequent intervals (e.g., once a week).
6. End-point reading (-150 mV) should be checked occasionally, (e.g., after every 10 samples).
7. Suspension must be stirred slowly during titration.
8. For quality control, one blank is included in every batch. A minimum of one reference sample should be analyzed per batch of 20 samples (a minimum of one reference sample daily). Duplicates are done on approximately 5% of samples. In terms of precision and accuracy, recovery of CI (0-1000 mg kg·') added to foliage samples was 9J-10l%. lhls does not tell anything about recovery from inside plant tissue. Precision for various ranges of CI concentration in foliage samples is given in Table 21-1.
For example, CI in two lodgepole pine (Pinus contorta Dougl. var. latifolia Engelrn.) foliage samples (Edwards et al. 1981) are as follows:
Contr.Q1 sample: X = 371 mg kg·' Standard deviation = 22 mg kg·} Coefficient of variation = 5.9%
Sample from salt-contarninated area: X = 7318 mg kg·} Standard deviation = 259 mg kg·' Coefficient of variation = 3.5%
References
Edwards, lK.; Kalra, Y.P.; Radford, F.G. 1978. Chloride determination and levels in the soil-plant environment. Pages 259-260 in Abstracts for commission papers. 11 th Int. Congo Soil Sci., June 19-27, 1�78, Univ. Alberta, Edmonton, Alberta.
In! Rep. NOR·X-319
Table 21-1. Precision for various ranges of Cl concentration (Source: Edwards et al. 1981)
Concentration of CI in foliage
(mg kg·l)
Less than 500 500 - 1000 1000 - 3000 More than 3000 All samples
Coefficient of variation
(%)
6.8 3.1 3.1 2.8 4.6
105
106
Edwards, 1.K.; Kalra, Y.P.; Radford, F.G. 1981. Chloride detennination and levels in the soil-plant environment. Environ. Poll. (Series B) 2:109-117.
22. TOTAL P (VANADOMOL YBDOPHOSPHORIC YELLOW COLOR METHOD)
Principle
Plant digests are prepared by dry ashing or wet digestion. The determination of total P content is made colorimetrically by the vanadomolybdate procedure based on the yellow color (complex of uncertain composition) of the unreduced vanadomolybdophosphoric heteropoly complex in acid medium. The yellow color is attributed to a substitution of oxyvanadium and oxymolybdenum radicals for the oxygen of phosphate. The color intensity is determined at a light maximum of 470 nm.
Apparatus
Spectrophotometer (such as the LKB Ultrospec II) Autoburet
Reagents
1. Vanadomolybdate solution:
Solution A: dissolve 25 g ammonium molybdate [(NH')6Mo,o,,·4H,O] in 400 mL water in a 500-mL beaker.
Solution B: dissolve 1.25 g ammonium metavanadate [NH, VO,] in 300 mL boiling water. Cool, add 250 mL concentrated HNO" and cool again.
Add solution A to solution B and make up to 1 L in a volumetric flask.
2. 2,4-dinitrophenol indicator solution: prepare a saturated solution of 2,4-dinitrophenol (C6H,N,Os)'
3. NH,OH (about 5 M): dilute one volume of NH,OH (14.8 M) with two volumes of water.
4. Phosphorus stock standard solution (50 mg L·t P): 0.2197 g KH,PO, L·t. Mix thoroughly. Add four to five drops of toluene to prevent microbial activity. (KH2PO, is dried at 1oo't: for 1 hour and cooled in a desiccator before weighing.)
Procedure
1. Place 10-mL aliquot of the plant digest in a 50-mL volumetric flask. Use dear solution. Let silica settle before taking an aliquot. Filter, if necessary.
2. Dilute to about 30 mL.
3. Add four drops of 2,4-dinitrophenol indicator.
4. Add NH.oH (about 5 M) dropwise until yellow color just appears.
In! Rep. NOR·X-319
5. Add 10 mL vanadomolybdate reagent.
6. Make up to volume and mix thoroughly.
7. Read P concentration at 470 nm after 10 minutes. (Note: Color is quite stable.)
8. To prepare standards, measure 0, 1 .0, 2.5, 5.0, 7.5, 10, and 20.0 mL of 50 mg L·' P solution in 50-mL volumetric flasks and follow Steps 2-{i of this procedure. They will give concentrations of 0, 1.0, 2.5, 5.0, 7.5, 10.0, and 20.0 mg L·' P (in 50-mL volume), respectively. Use these to calibrate the instrument.
Calculation
P . I . k -1 volume of digest (mL) 50 mfo lage (mg g ) = . x . welght of sample (g) volume of dIgest used
to develop color (mL)
Remarks
P (mg L-') in x 5O-mL solution
1. In the NoFC laboratory, total P on vegetation samples is normally determined by digestion in microwave oven followed by ICP-AE5-analysis. The vanadomolybdophosphoric yellow color method is recommended if P is the only element needed and there are fewer than 50 samples.
2. In the NoFC laboratory, this method was used for several years on samples digested with HNO,-H2SO,-HClO, ternary acid mixture and on dry ashed samples (480°C overnight).
3. The method permits application on a large scale because of its low sensitivity (about one-tenth the sensitivity of the blue-color methods).
4. Range of conformity to Beer's Law is 0-20 mg L·' P.
5. Final acid concentration of 0.5 M is recommended.
6. Excess molybdate-acid reagent has no effect.
7. There is freedom from interferences from a wide range of ionic species in concentrations up to 100 mg L·'.
8. The method is easily adaptable to HNO" HCI, H2SO" or HClO, system.
9. For quality control, a minimum of one reference sample should be analyzed per batch of 40 samples (a minimum of one reference sample daily). Duplicates are done on approximately 5% of samples. Precision of P should be less than or equal to 5%. For example, long-term analysis of a laboratory sample was 1085 ± 29 mg kg·' (coefficient of variation 2.7%).
References
Barton, C.}. 1948. Photometric analysis of phosphate rock. Anal. Chern. 20:1068-1073.
Jackson, M.L. 1958. Soil chemical analysis. Prentice-Hall Inc., Englewood Cliffs, New Jersey.
Inf Rep. NOR·X·319 107
108
Kitson, RE.; Mellon, M.G. 1944. Colorimetric determination of phosphorus as molybdivanadophosphoric acid. Ind. Eng. Chern. Anal. Ed. 16:379-383.
23. INORGANIC SULFATE-SULFUR
Principle
Suifate-S might be superior to total S as an indicator of S status in plants because of large differences in 5O,-S levels between 5-deficient and 5-nondeficient plant tissues (Freney and Spencer 1967). Very little information exists on sulfate-S levels in tree foliage. The following method developed by Richter and Johnson (1983) is a modification of the boiling acid extraction method of Kelly and Lambert (1972).
Apparatus
Eberbach reciprocating shaker 125-mL Erlenmeyer flasks Filtering funnels Whatrnan 42 filter papers Repipet dispensing bottle
Reagents
1. HCl stock solution 1.0 M: 83 mL HCl L·'.
2. Extracting solution 0.01 M HCl: 10 mL 1.0 M HCl L·'.
Procedure
1. Transfer 2.00 g foliage into each 125-mL Erlenmeyer flask.
2. Add 50 mL extracting solution.
3. Stopper flasks.
4. Shake for 30 minutes on a reciprocal shaker (160 strokes per minute).
5. Gravity filter suspension into 60-mL plastic storage bottles using Whatrnan 42 filter paper. Discard first 10 mL from each bottle before filtering remaining suspension.
6. Determine concentration of S by ICP-AES using standards prepared in matrix of extracting solution.
Calculation
S in the sample S in the filtrate 50 = x -
(mg kg""') (mg e') 2
In! Rep. NOR·X·319
Remarks
1. Lodgepole pine foliage samples were extracted by this method and also by boiling with 0.01 M HCl (Kelly and Lambert 1972) in the NoFC laboratory. At NoFC the boiling HCl method gave results 10--20% higher than extraction at room temperature. It appears that appreciable amounts of hydrolyzable organic sulfates are present in the extract from the boiling HCl method.
2. ICP determines total S in extract, including soluble organic 5 compounds. Use IC if only sot is to be determined.
3. The NoFC laboratory has not developed a procedure for determining 5 in plant extracts.
4. lnsufficient data are available for precision and accuracy calculations.
References
Freney, ).R.; Spencer, K., 1967. Diagnosis of sulphur deficiency in plants by soil and plant analysis. J. Aust. Ins!. Agric. Sci. 33:284-288.
Heffernan, B. 1985. A handbook of methods of inorganic chemical analysis for forest soils, foliage and water. Common. Sci. Ind. Res. Organ., Div. For. Res., Canberra, Australia.
Kelly, J.; Lambert, M.J. 1972. The relationship between sulphur and nitrogen in the foliage of Pinus radiata.
Plant Soil 37:395-407.
Richter, D.D.;Johnson, D.W. 1983. Detennination of inorganic sulfateinfoliagew ithbariumchloranilate. Soil Sci. Soc. Am. J. 47:522-524.
Inf Rep. NOR-X-319 \09

1 10
APPENDIXES
1 . Common Commercial Concentrations of Acids and Ammonium Hydroxide
2. Reporting of Analytical Data
3. Bulk Density
4. Plant-available Micronutrients (B, Cu, Fe, Mn, Mo, and Zn) in Soils and Total Elements in Foliage
In! Rep. NOR-X-319
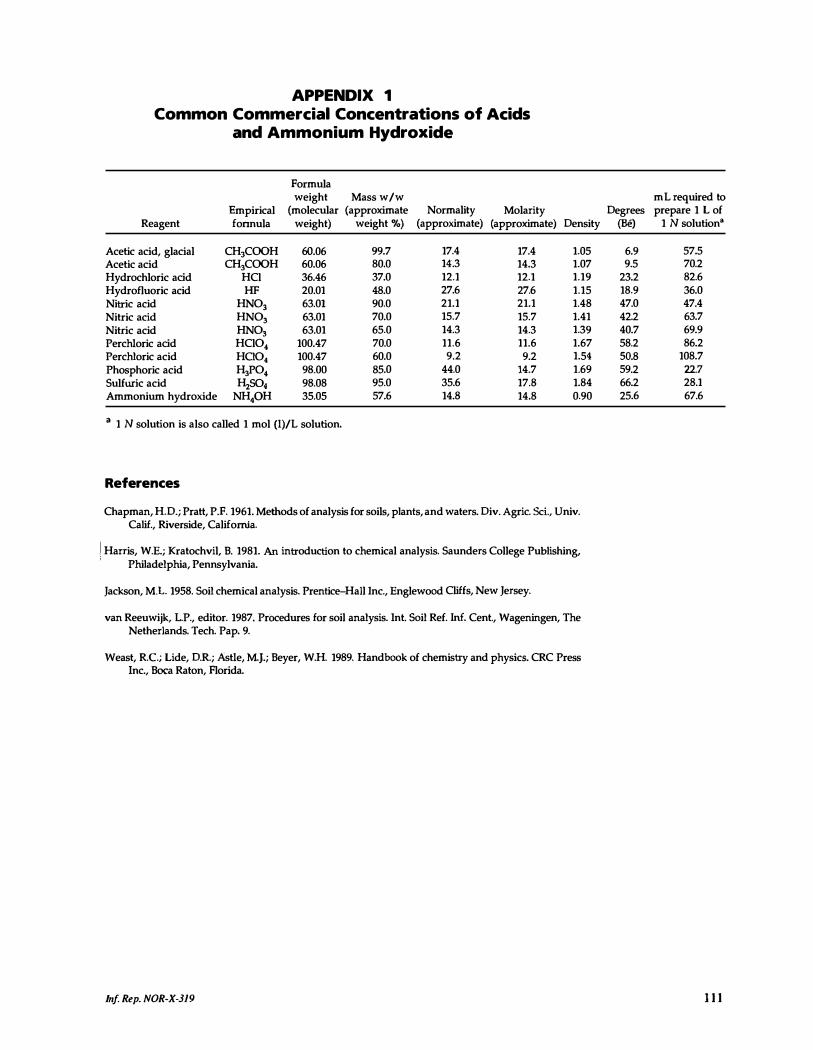
APPENDIX 1 Common Commercial Concentrations of Acids
and Ammonium Hydroxide
Formula weight Mass w/w
Empirical (molecular (approximate Normality Molarity Reagent fonnula weight) weight %) (approximate) (approximate)
Acetic acid, glacial CH,COOH 60.06 99.7 17.4 17.4 Acetic acid CH,COOH 60.06 80.0 14.3 14.3 Hydrochloric acid HCl 36.46 37.0 12.1 12.1 Hydrofluoric acid HF 20.01 48.0 27.6 27.6 Nitric acid HNO, 63.01 90.0 21.1 21.1 Nitric acid HNO, 63.01 70.0 15.7 15.7 Nitric acid HNO, 63.01 65.0 14.3 14.3 Perchloric acid HClO. 100.47 70.0 11.6 11.6 Perchloric acid HClO. 100.47 60.0 9.2 9.2 Phosphoric acid H,PO. 98.00 85.0 44.0 14.7 Sulfwic acid H2SO4 98.08 95.0 35.6 17.8 Ammonium hydroxide NH.oH 35.05 57.6 14.8 14.8
a 1 N solution is also called 1 mol {l)/L solution.
References
Density
1.05 1.07 1.19 1.15 1.48 1.41 1.39 1.67 1.54 1.69 1.84 0.90
Chapman, H.D.; Pratt, P.F. 1961. Methods of analysis for soils, plants, and waters. Div. Agric. SeL, Univ. Calif., Riverside, California.
I Harris, W.E.; Kratochvil, B. 1981. An introduction to chemical analysis. Saunders College Publishing, ,
Philadelphia, Pennsylvania.
Jackson, M.L. 1958. Soil chemical analysis. Prentice-Hall Inc., Englewood Cliffs, New Jersey.
van Reeuwijk, L.P., editor. 1987. Procedures for soil analysis. Int. Soil Ref. Inf. Cent., Wageningen, The Netherlands. Tech. Pap. 9.
Weast, R.C; Lide, D.R.; Astle, M.J.; Beyer, W.H. 1989. Handbook of chemistry and physicS. CRC Press Inc., Boca Raton, Florida.
In! Rep. NOR-X·319
mL required to Degrees prepare 1 L of
(Be) 1 N solutiona
6.9 57.5 9.5 70.2
23.2 82.6 18.9 36.0 47.0 47.4 42.2 63.7 40.7 69.9 58.2 86.2 SO.8 108.7 59.2 22.7 66.2 28.1 25.6 67.6
I I I
1 12
APPENDIX 2 Reporting of Analytical Data
1 . Ensure consistency in reporting analytical data.
2. Zero (O) is not used to report results; rather, report results as "below detection" or uless than. II
3. Numbers as they are measured (based on the output of the measuring instrument) should be carried through to the end of the calculation before determining how many Significant figures are required. Rounding off or truncating should be done after the final computation so that only the last digit is uncertain. An analysis is only as precise as its least-precise step, whether that is weighing, instrument reading, or any other step.
Results of Soil Analysis
In general, report results on an ovendry basis. Ovendrying, however, might cause changes in several chemical properties of soils. Analyses, therefore, are often made on air-dried or field-moist samples and the results are converted to ovendry basis by multiplying with the moisture factor (weight of air-dry soil divided by weight of ovendry soil).
Inf. Rep. NOR-X-319
APPENDIX 3 Bulk Density
Bulk density is not determined on a routine basis, though NoFC has determined bulk density for special projects. Two methods are generally used: the core and clod methods. For the core method (in situ method), undisturbed soil samples are collected by means of metal core sampling cylinders of known volume and then ovendried at 105"(: for 48 hours. The ovendried weight of the soil sample divided by the volume of the cylinder gives the bulk density, expressed as g cm-' (Mg m-'). The bulk volume includes the volume of the solids and of the pore space. (It is not necessary to keep soil undisturbed during transport to the laboratory for drying.) For the clod method, the volume of the clod is determined by coating a clod of known weight with a water-repellent substance and by weighing it first in the air and then inunersed in water, making use of Archimedes' principle. For further details on the core and clod methods, see Blake and Hartge (1986).
From the viewpoint of soil-plant relationship, the results for a number of soil parameters are expressed on a soil volume basis (w /v) rather than the usual soil weight basis (w /w). The calculation for converting from weight basis to volume basis is as follows:
w/v results = w/w results x bulk density.
Reference
Blake, G.R.; Hartge, K.H. 1986. Bulk density. Pages 363--375 in A. Klute, editor. Methods of soil analysiS. Part 1, Agron. 9. Am. Soc. Agron., Madison, Wisconsin.
In! Rep. NOR-X-319 113
1 14
APPENDIX 4 Plant-available Micronutrients (B, Cu, Fe, Mn, Mo, and
Zn) in Soils and Total Elements in Foliage
These elements are not determined in soils on a routine basis in our laboratory. They are determined for special investigations only. Except for Mn (Kalra and Edwards 1982), methods of extraction for micronutrients have not been evaluated.
Micronutrient Cations (Cu. Fe, Mn and Zn) in Soils
Extraction
1. Diethylenetriaminepentacetic acid extractant (Lindsay and Norvell 1978).
Although several extractants have been used, DTPA has been found to be the most useful chelate for simultaneous measurement of available Fe, Mn, Cu, and Zn. It consists of 0.005M DTPA (diethylenetriaminepentaacetic acid), 0.1 M triethanolamine (TEA), and 0.01 M CaCl" adjusted to pH 7.30 with HC!.
2. Versenate extractants:
(i) 1% solution of Na,EDTA
(ti) 0.05 M disodium EDTA, 0.01 M CaCl" 0.1 M triethanolamine (TEA)
(iii) 0.5 M CH,COONH4, 0.5 M CH,COOH, 0.02 M Na,EDTA
3. Mehlich 1 solution (a mixture of 0.05 M HCl in 0.0125 M H,S04)'
4. O.l M HC!.
5. For Mn: 0.02 M CaCl, (Hoyt and Nyborg 1971).
Determination
Atomic absorption spectrophotometry or ICP-AES.
Micronutrient Cations in Foliage
See Section 19.
Micronutrient Anions (B and Mo) in Soils
1. Hot water-soluble B is accepted as the best index of availability of B to plants. It is extracted from soil by boiling water and measured colorimetrically using the curcumin method (Kowalenko and Lavkulich 1976). Boron can also be determined by ICP-AES. It is necessary to use B-free glassware. Distilled water that is redistilled in a B-free glass still and stored in linear polyethylene bottles should be used.
Inf. Rep. NOR·X·319

2. Mo is generally extracted with ammonium oxalate solution (Cox and Kamprath 1972; Lindsay and Cox 1985). Molybdenum can be determined by ICP-AES.
Micronutrient Anions in Foliage
1 . For B, the method given by Jackson (1958) is generally used at NoFC. It employs dry ashing at 550°C and the colorimetric curcumin method for the determination of B in HCl extract.
2. For Mo, dry-ash at 550°C and determine by ICP-AES.
References
Cox, F.R.; Kamprath, E.}. 1972. Micronutrient soil tests. Pages 289-317 in }.J. Mortvedt, P.M. Giordano, and W.L. Lindsay, editors. Micronutrients in agriculture. Soil Sci. Soc. Am., Madison, Wisconsin.
Emteryd, O. 1989. Chemical and physical analysis of inorganic nutrients in plant, soil, water and air. Swed. Univ. Agric. Sci., Dep. For. Site Res., Vmea, Sweden.
Gupta, U.c.; Lipsett, }. 1981. Molybdenum in soils, plants, and animals. Adv. Agron. 34:73-115.
Heffernan, B. 1985. A handbook of methods of inorganic chemical analysis for forest soils, foliage and water. Commonw. Sci. Ind. Res. Organ. Div. For. Res., Canberra, Australia.
Hoyt.. P.B.; NyboIg- M. 1971. Toxic metals in acid soil: II. Estimation of plant-available manganese. Soil Sci. Soc. Am. Proc. 35:241-244.
Jackson, M.L. 1958. Soil chemical analysis. Prentice-Hall Inc., Englewood Cliffs, New Jersey.
Johnson, G.V.; Fixen, P.E. 1990. Testing soils for sulfur, boron, molybdenum, and chlorine. Pages 265-273 in R.L. Westerman, editor. Soil testing and plant analysis. Soil Sei. Soc. Am. Book Ser. 3, Madison, Wisconsin.
Jones, J.B., Jr. 1972. Plant tissue analysis for micronutrients. Pages 319-346 in J.J. Mortvedt, P.M. Giordano, and W.L. Lindsay, editors. Micronutrients in agriculture. Soil Sci. Soc. Am., Madison, Wisconsin.
Jones, J.B.,Jr. 1990. Universal soil extractants: their composition and use. Commun. Soil Sei. Plant Anal. 2U09H101.
Jones, J.B., Jr.; WoU, B.; Mil1s, H.A. 1991. Plant analysis handbook: a practical sampling, preparation, analYSiS, and interpretation guide. Micro-Macro Publishing, Inc., Athens, Georgia.
Kalra, Y.P.; Edwards, I.K. 1982. Evaluation of extraetants for the determination of available Mn in forest-nursery soils. Page 85 in Abstracts. Trans. 12th Int. Congo Soil Sei., February 8-16, 1982, New Delhi, India.
Kowalenko, c.G.; Lavkulich, L.M. 1976. A modified curcumin method for boron analysis of soil extracts. Can. ). Soil Sci. 56:537-539.
Lindsay, W.L.; Cox, F.R. 1985. Micronutrient soil testing for the tropicS. Fert. Res 7:169-200.
Lindsay, W.L.; Norvell, W.A. 1978. Development of a OTPA test for zinc, iron, manganese, and copper. Soil Sci. Soc. Am.). 42:421-428.
Martens, D.C.; Lindsay, W.L. 1990. Testing soils for copper, iron, manganese, and zinc. Pages 229-264 in RL. Westerman, editor. Soil testing and plant analysis. Soil Sci. Soc. Am. Book Ser. 3, Madison, Wisconsin.
In! Rep. NOR·X-319 1 1 5

1 16
McGeehan, S.L.; Topper, K; Naylor, D.V. 1989. Sources of variation in hot water extraction and colorimetric determination of soil boron. Commun. Soil Sci. Plant AnaL 20:1777-1786.
Renan, L.; Gupta, u.c. 1991. Extraction of soil boron for predicting its availability to plants. Commun. Soil Sci. Plant Anal. 22:1003-1012.
Sillanpaa, M. 1982. Micronutrients and the nutrient status of soils: a global study. Food and Agriculture Organiz.ation of the United Nations, Rome, Italy.
Soltanpour, P.N.; Workman, S.M. 1981. Soil-testing methods used at Colorado State University soil testing laboratory for the evaluation of fertility, salinity, sodicity and trace element toxicity. Colorado State Univ. Exp. Stn., Fort Collins, Colorado. Tech. Bull. 142.
Wilde, S.A.; Corey, R.B.; Iyer, J.G.; Voigt, G.K. 1979. Soil and plant analysis for tree culture. Oxford Publishing Co., New DeIhl, India.
bif. Rep. NOR-X-319


![Tesina de valuación: JetBlue - repositorio.udesa.edu.arrepositorio.udesa.edu.ar/jspui/bitstream/10908/11845/1/[P][W] T.M. Fin...Tesina de Valuación: JetBlue LARA MATEOS, Matías](https://img.pdfslide.net/doc/110x75/5e177667e8d6641605124406/tesina-de-valuacin-jetblue-pw-tm-fintesina-de-valuacin-jetblue-lara.jpg)