Embed Size (px)
Citation preview
Methods of Quantitative and Qualitative Analysis of Bird Migration with a Tracking Radar
BRUNO BRUDERER Zoologische Anstaltder Uniumsitlit Basel
PETER STEIDINGER Zoologisch-Vergl. Anatomisches Institute der Vniversitat Zurich
HE AIM OF OUR WORK with a tracking T radar was not primarily orientation re- search, but a study of intensity and height of migration under the influence of changing weather conditions and an examination of the different groups of birds and other ani- mals involved in these migratory movements. Nevertheless we think that a presentation of the methods we have developed and of some of the results attained may be a valuable con- tribution to this symposium, because of their possible application in orientation research.
The present paper is based on two observ- ation periods of three weeks each (March 19
to April 10, 1968 and April 3 to 25, 1969) in northern Switzerland near the Zurich airport ( w 430 m above sea level). In the first part of the paper we describe our method of as- sessing the rate of bird passage and discuss three topics-the grouping of nocturnal mi- grants, their velociiy of flight, and the identi- fication of species by radar echoes. Finally we will deal with height and volume of migra- tion under different weather situations. The second part outlines the methods of studying the directions of migration and discusses the correlation between winds and the height and direction of migrating birds.
Part I by B. Bruderer
R A D A R EQUIPMENT A N D I T S APPLICATION
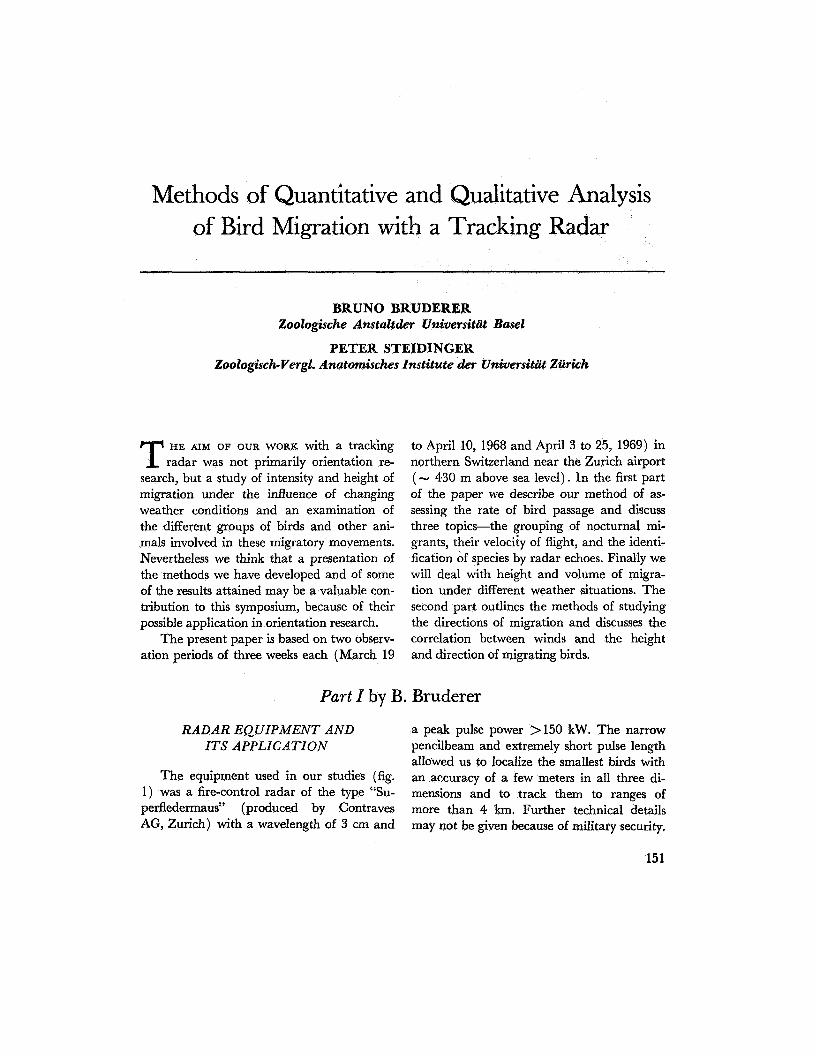
a peak pulse power >150 kW. The narrow pencilbeam and extremely short pulse length allowed us to localize the smallest birds with
The equipment used in our studies (fig. an accuracy of a few meters in all three di- 1) was a fire-control radar of the type “Su- mensions and to track them to ranges of perfledermaus” (produced by Contraves more than 4 km. Further technical details AG, Zurich) with a wavelength of 3 cm and may not be given because of military security.
151
152 ANIMAL O R I E N T A T I O N A N D N A V I G A T I O N
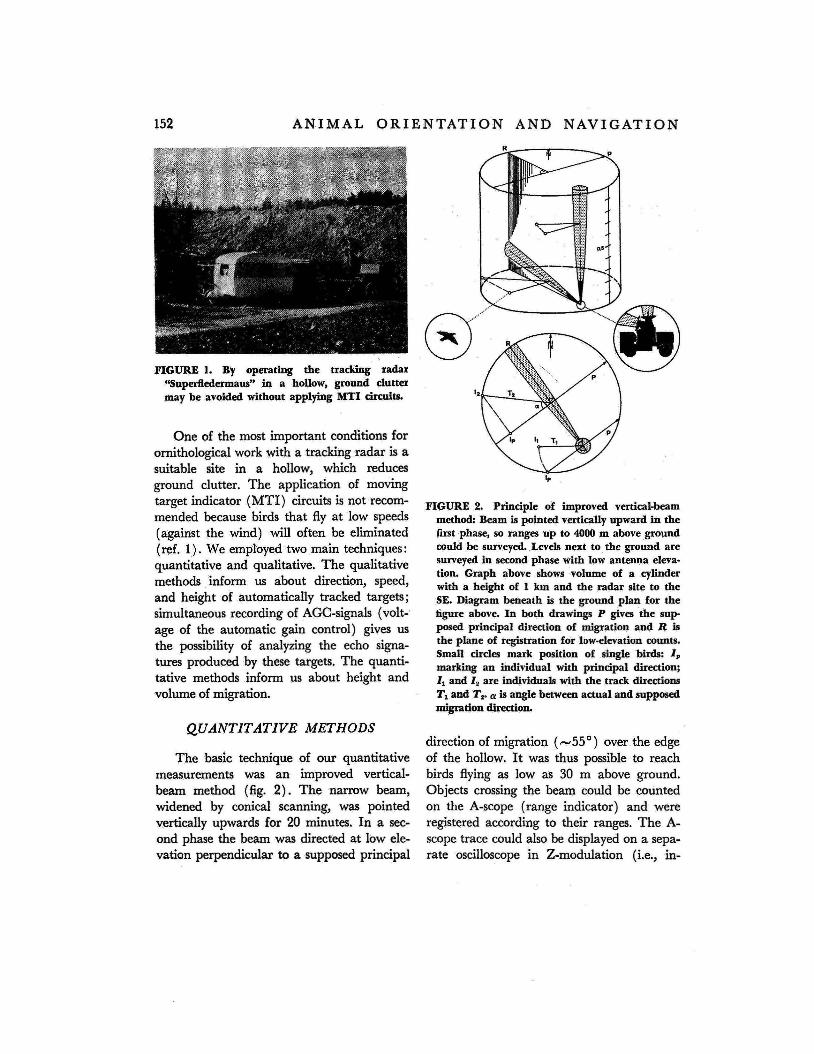
FIGURE 1. By operating the tracking radar %uperfledermaus” in a hollow, ground clutter may be avoided without applying MTI circuits.
One of the most important conditions for ornithological work with a tracking radar is a suitable site in a hollow, which reduces ground clutter. The application of moving target indicator (MTI) circuits is not recom- mended because birds that fly at low speeds (against the wind) will often be eliminated (ref. 1). We employed two main techniques: quantitative and qualitative. The qualitative methods inform us about direction, speed, and height of trutomatically tracked targets; simultaneous recording of AGC-signals (volt-’ age of the automatic gain control) gives us the possibility of analyzing the echo signa- tures produced by these targets. The quanti- tative methods inform us about height and volume of migration.
QUANTITATIVE METHODS
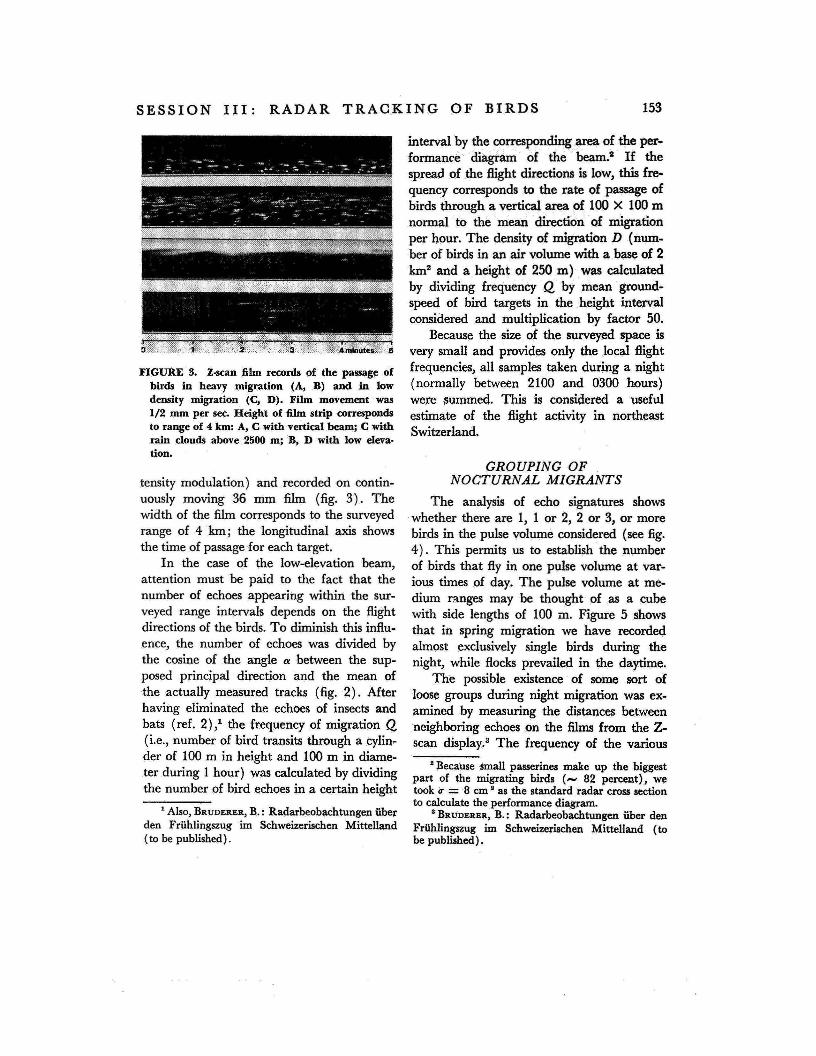
The basic technique of our quantitative measurements was an improved vertical- beam method (fig. 2). The narrow beam, widened by conical scanning, was pointed vertically upwards for 20 minutes. In a sec- ond phase the beam was directed at low ele- vation perpendicular to a supposed principal
FIGURE 2. Principle of hpmved vertical-beam method: Beam is pointed vertically upward in the first phase, so ranges up to 4000 m above ground could be surveyed. Levels next to the ground are surveyed in second phase with low antenna eleva- tion. Graph above shows volume of a cylinder with a height of 1 km and the radar site to the SE. Diagram beneath is the ground plan for the figure above. I n both drawings P gives the sup- posed principal direction of migration and R is the plane of registration for low-elevation counts. Small circles mark position of single Vi. marking an individual with principal direction; Zl and In are individuals with the track d i i o n s TI and Tr is angle between actual and supposed migration direetion.
direction of migration ( -55 ’ ) over the edge of the hollow. It was thus possible to reach birds flying as low as 30 m above ground. Objects crossing the beam could be counted on the A-scope (range indicator) and were registered according to their ranges. The A- scope trace could also be displayed on a sepa- rate oscilloscope in Z-modulation (Le., in-
S E S S I O N 1 1 1 : R A D A R T R A C K I N G OF B I R D S 153
> , D 1 2 3 4mlnutes 5
FIGURE 5. Z-scan film records of the passage of birds in heavy migration (A, B) and in low density migration (Cy D). Film movement was 1/2 mm per sec. Height of film strip corresponds to range of 4 km: A, C with vertical beam; C with rain clouds above 2500 m; By D with low eIeva- tion.
tensity modulation) and recorded on contin- uously moving 36 mm film (fig. 3). The width of the film corresponds to the surveyed range of 4 km; the longitudinal axis shows the time of passage for each target.
In the case of the Iow-elevation beam, attention must be paid to the fact that the number of echoes appearing within the sur- veyed range intervals depends on the flight directions of the birds. To diminish this influ- ence, the number of echoes was divided by the cosine of the angle a between the sup- posed principal direction and the mean of the actually measured tracks (fig. 2). After having eliminated the echoes of insects and bats (ref. 2); the frequency of migration Q (Le., number of bird transits through a cylin- der of 100 m in height and 100 m in diame- ter during 1 hour) was calculated by dividing the number of bird echoes in a certain height
Also, BRUDERER, B. : Radarbeobachtungen iiber den Friihlingszug im Schweizerischen Mittelland (to be published).
interval by the corresponding area of the per- formance diagram of the beam? If the spread of the flight & d o n s is low, this fre- quency corresponds to the rate of passage of birds through a vertical area of 100 X 100 m normal to the mean direction of migration per hour. The densiv of m i g d o n D (num- ber of birds in an air volume with a base of 2 ha and a height of 250 m) was calculated by dividing frequency Q by mean ground- speed of bird targets in the height interval considered and multiplication by factor 50.
Because the size of the surveyed space is very small and provides only the local flight frequencies, all samples taken during a night (normally between 2100 and 0300 hours) were summed. This is considered a useful estimate of the flight activity in northeast Switzerland,
GROUPING OF ,
NOCTURNAL MIGRANTS The analysis of echo signatures shows
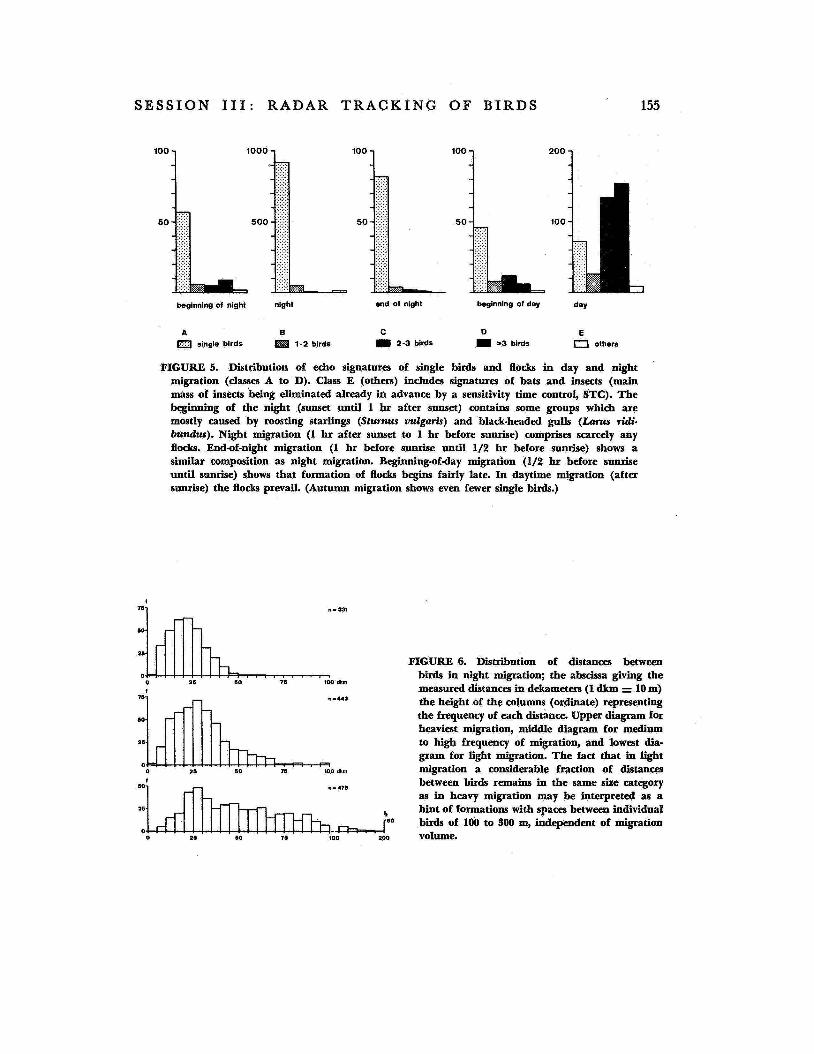
whether there are 1, 1 or 2, 2 or 3, or more birds in the pulse volume considered (see fig. 4). This permits us to establish the number of birds that fly in one pulse volume at var- ious times of day. The pulse volume at me- dium r.mges may be thought of as a cube with side lengths of 100 in. Figure 5 shows that in spring migration we have recorded almost exclusively single birds during the night, while flocks prevailed in the daytime.
The possible existence of some sort of loose groups during night migration was ex- amined by measuring the distances between neighboring echoes on the films from the Z- scan di~play.~ The frequency of the various
*Because smail passerines make up the biggest part of the migrating birds (t- 82 percent), we took Q = 8 cm * as the standard radar cross section to cdculate the performance diagram.
BRUDERER, B.: Radarbeobachtungen iiber den Friihlingsfllg im Schweizerischen Mittelland (to be published).
A N I M A L O R I E N T A T I O N A N D N A V I G A T I O N
R F
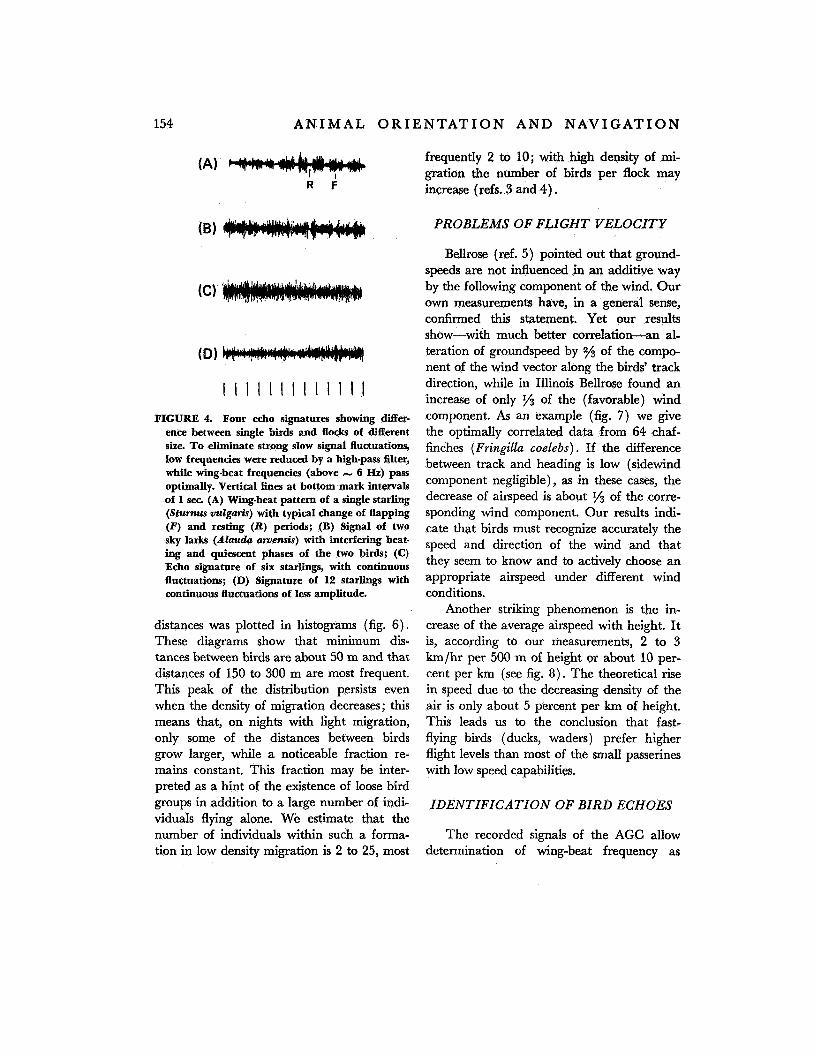
1 1 1 1 1 1 1 1 1 1 1 1 1 Four echo signatures showing mer-
ence between single Sir& and flocks of different size. To eliminate strong slow signal fluctuations, low frequencies were reduced by a high-pass filter, while wing-beat frequencies (above N 6 Hz) pass optimally. Vertical lines at bottom mark intervals of 1 sec. (A) Wmg-beat pattern of a single starling (Sturnus vulgaris) with typical change of flapping (F) and resting (R) periods; (B) Signal of two sky larks (Alauda urvensis) with interfering beat- ing and quiescent phases of the two birds; (C) Echo signature of six starlings, with continuous fluctuations; (D) Signature of 12 starlings with continuous fluctuations of less amplitude.
distances was plotted in histograms (fig. 6 ) . These diagrams show that minimum dis- tances between birds are about 50 m and that distances of 150 to 300 m are most frequent. This peak of the distribution persists even when the density of migration decreases; this means that, on nights with light migration, only some of the distances between birds grow larger, while a noticeable fraction re- mains constant. This fraction may be inter- preted as a hint of the existence of loose bird groups in addition to a large number of indi- viduals flying alone. We estimate that the number of individuals within such a forma- tion in low density migration is 2 to 25, most
frequently 2 to 10; with high density of mi- gration the number of birds per flock may increase (refs. 3 and 4).
PROBLEMS OF FLIGHT VELOCITY
Bellrose (ref. 5) pointed out that ground- speeds are not influenced in an additive way by the following component of the wind. Our own measurements have, in a general sense, confirmed this statement. Yet our results show-with much better correlation-an al- teration of groundspeed by y3 of the compo- nent of the wind vector along the birds' track direction, while in Illinois Bellrose found an increase of only '/3 of the (favorable) wind component. As an example (fig. 7) we give the optimally correlated data from 64 chaf- finches (FringiUa coelebs) . If the difference between track and heading is low (sidewind component negligible) , as in these cases, the decrease of airspeed is about '/3 of the corre- sponding wind component. Our results indi- cate that birds must recognize accurately the speed and direction of the wind and that they seem to know and to actively choose an appropriate airspeed under different wind conditions.
Another striking phenomenon is the in- crease of the average airspeed with height. I t is, according to our measurements, 2 to 3 km/hr per 500 m of height or about 10 per- cent per km (see fig. 8). The theoretical rise in speed due to the decreasing density of the air is only about 5 percent per km of height. This leads us to the conclusion that fast- flying birds (ducks, waders) prefer higher flight levels than most of the small passerines with low speed capabilities.
IDENTIFICATION OF BIRD ECHOES
The recorded signals of the AGC allow determination of wing-beat frequency as
S E S S I O N 111: R A D A R T R A C K I N G O F B I R D S
28.
155
-r as in heavy migration may be interpreted as a hint of formations with spaces between individual birds of 100 to 300 m, independent of migration
100 1000 100 100 200
50 500 50 50 100
beginning of night night end of night beginning of day day
A B c D E a single birds 1 - 2 birds = 2-3 birds *3 birds a others
FIGURE 5. Distribution of echo signatures of single birds and flocks in day and night migration (classes A to D). Class E (others) includes signatures of bats and insects (main mass of insects Wing eliminated already in advance by a sensitivity time control, STC). The beginning of the night (sunset until 1 hr after sunset) contains some groups which are mostly caused by roosting starlings (Sturnus vulgaris) and black-headed gulls (Lams ridi- bundus). Night migration (1 hr after sunset to 1 hr before sunrise) comprises scarcely any flocks. End-of-night migration (1 hr before sunrise until 1/2 hr before sunrise) shows a similar composition as night migration. Beginniig-of-day migration (1/2 hr before sunrise until sunrise) shows that formation of flocks begins fairly late. In daytime migration (after sunrise) the flocks prevail. (Autumn migration shows even fewer single birds.)
n -331
156 A N I M A L ORIENTATION AND NAVIGATION
v"-t~vw/") k m/h T 6 -
r - -qsa b- -0.31
25 -
0 4 , v*. -50 -25 0 25 50 75 100 k m h
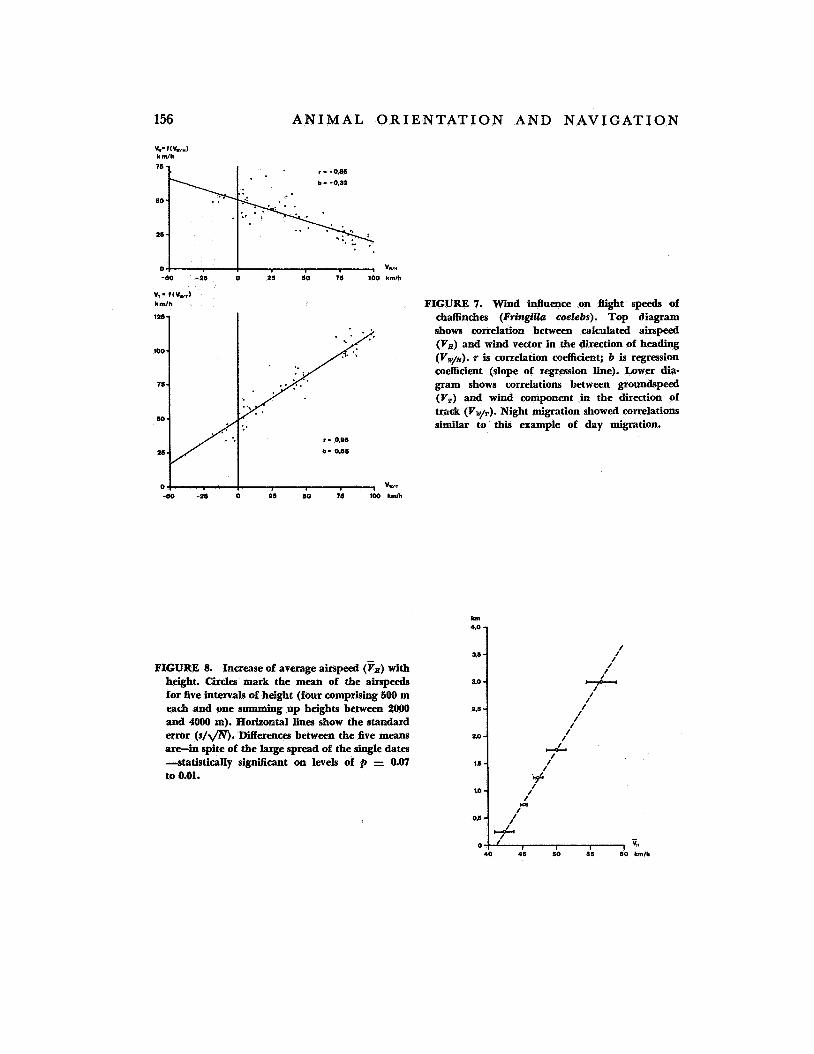
v,- f(Vvr) kmlh FIGURE 7. Wind influence on flight speeds of
chaffinches (FringilZa coelcbs). Top diagram shows correlation between calculated airspeed (V,) and wind vector in the direction of heading (Vw/a). r is correlation coefficient; b is regression coefficient (slope of regression line). Lower dia- gram shows correlations between groundspeed (V,) and wind component in the direction of track (Vw/,). Night migration showed correlations similar to this example of day migration.
km
FIGURE 8. Increase of average airspeed (Vx) with height. Circles mark the mean of the airspeeds for five intervals of height (four comprising 500 m each and one summing up heights between 2000 and 4OOO m). Horizontal lines show the standard error ( s / g ) . Differences between the five means are-in spite of the large spread of the single da ta -statistically signiicant on levels of 2, = 0.07 to 0.01.
S E S S I O N 111: R A D A R T R A C K I N G O F B I R D S 157
well as the duration of flapping and quies- cent periods within the wing-beat patterns of a bird (see fig. 9) . Additional information of less diagnostic value may be obtained by cal- culating the typical flight velocity of a partic- ular species (airspeed plus -% of the wind component in the direction of heading)* and by measuring its radar cross section (ref.
In daytime migration the species belong- ing to a certain echo signature can be identi- fied with the help of a telescope mounted parallel to the optical axis of the antenna. For night migration we need much more film material showing flight of night migrants in daytimes; this is needed to establish a correla- tion between taxonomic classification and the “radar” or “echo” species determined from echo signatures (ref. 7) . In order to make the sampled echo signatures available for imme- diate use we have established a provisional radar classification without attempting a zoological one (fig. 10). An example of the application of this radar classification is given in part 11.
6) .
VOLUME AND HEIGHT OF SPRING MIGRATION UNDER DIFFERENT
WEATHER CONDITIONS
In all graphs of figures 11 to 14 the length of the horizontal columns indicates the frequency (Q) of migration; the position of the circles marks the corresponding density ( D ) of migration (an average groundspeed of 50 km/hr leading to the same values in both frequency and density).
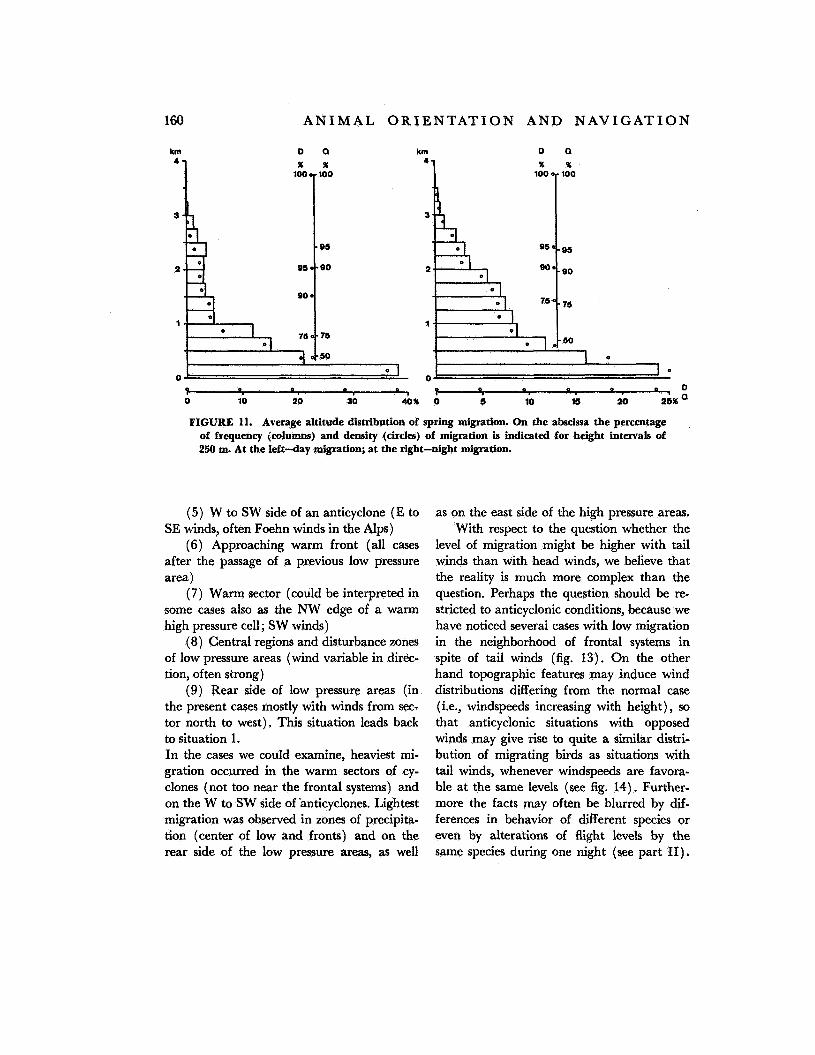
Figure 11 shows the average altitude dis- tribution of spring migration derived from two periods of 3 weeks (1968 and 1969). The distribution agrees fairly well with the results
‘The sign - is necessary because the value of is somewhat too high in cases with large com-
ponents of wind normal to the heading.
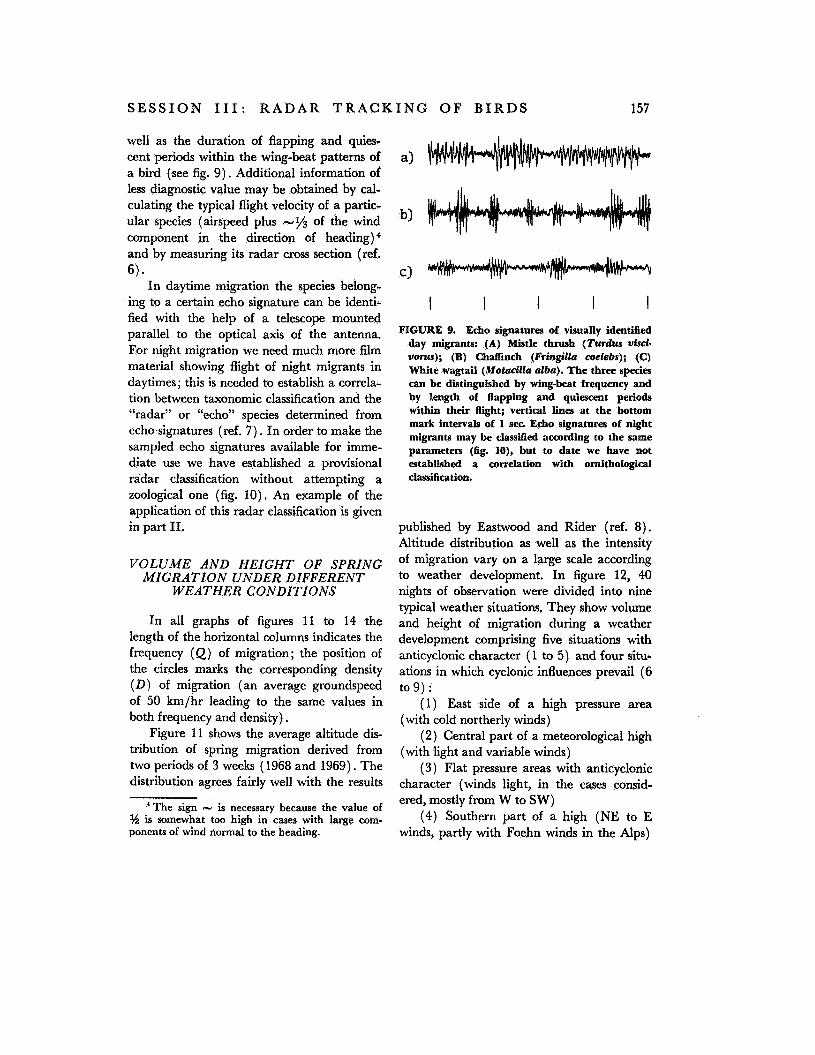
I FIGURE 9. Echo signatures of visually identified
day migrants: (A) Mistle thrush (Turdus visci- vorus); (B) Chaffinch (Fringilla coclebs); (C) White wagtail (MotaciUa ulba). The three species can be distinguished by wing-beat frequency and by length of flapping and quiescent periods within their flight; vertical Wes at the bottom mark intervals of 1 sec. Echo signatures of night migrants may be classified according to the same parameters (fig. lo), but to date we have not established a correlation with ornithological classification.
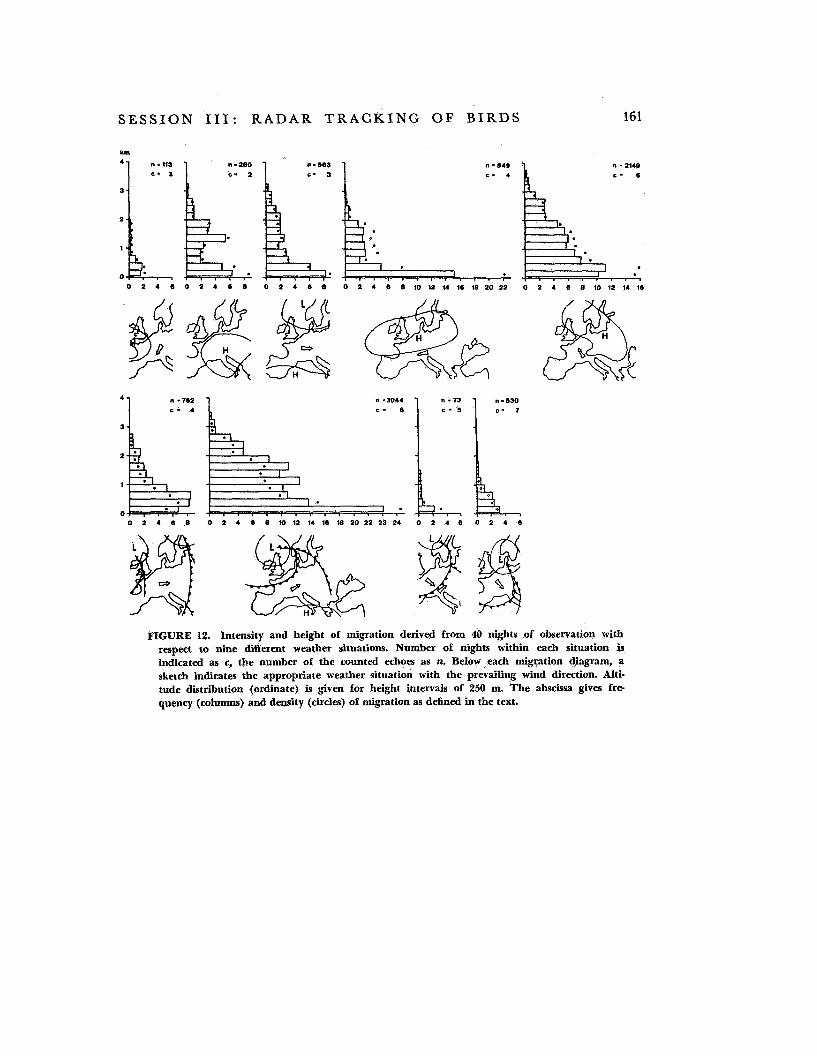
published by Eastwood and Rider (ref. 8). Altitude distribution as well as the intensity of migration vary on a large scale according to weather development. In figure 12, 40 nights of observation were divided into nine typical weather situations. They show volume and height of migration during a weather development comprising five situations with anticyclonic character (1 to 5) and four situ- ations in which cyclonic influences prevail (6
( 1) East side of a high pressure area (with cold northerly winds)
(2) Central part of a meteorological high (with light and variable winds)
(3) Flat pressure areas with anticyclonic character (winds light, in the cases consid- ered, mostly from W to SW)
(4) Southern part of a high (NE to E winds, partly with Foehn winds in the Alps)
to 9) :
158 A N I M A L O R I E N T A T I O N A N D N A V I G A T I O N Nr flapping ph. (e) restlng ph. ( 0 ) distribution of wing-beat frequencies N V G
kmlh
88 58 0-K ::ha-*. . * ,
la-d 4
2a - , La, 10 38 K-M 12
3a.b - , :: : , 8 49 K-M
4a @’,. I 3 53 K
34 K I 8
10 l&k+
a 7
0 5 10 15 WOO 4 8 12 18 20 24 28
13a.b -: ,
12 Lolra,
38 52 K-M
3 0 37 K-M
4 49 K
9 53 K
58 38 K
18 a 24 38 K
8
12 A
101 58 K-M
158 46 K-M
22 41 K
I 8 7
0 5 10 15 4 8 12 18 20 24 28
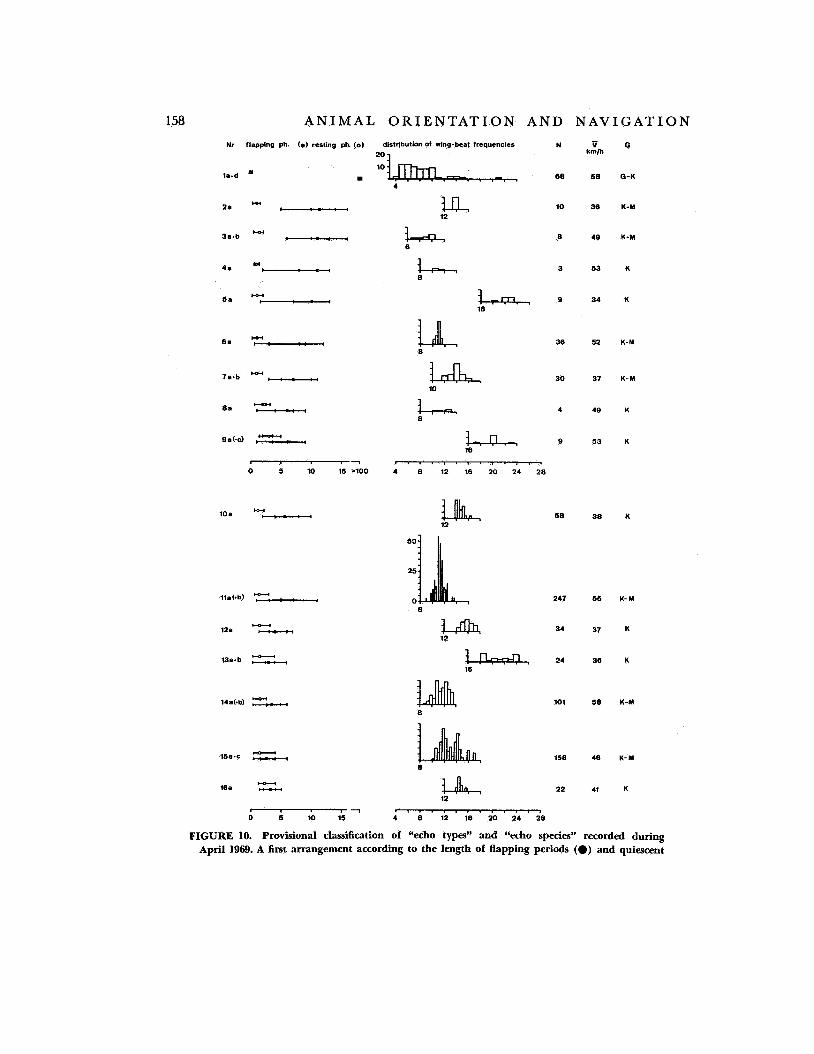
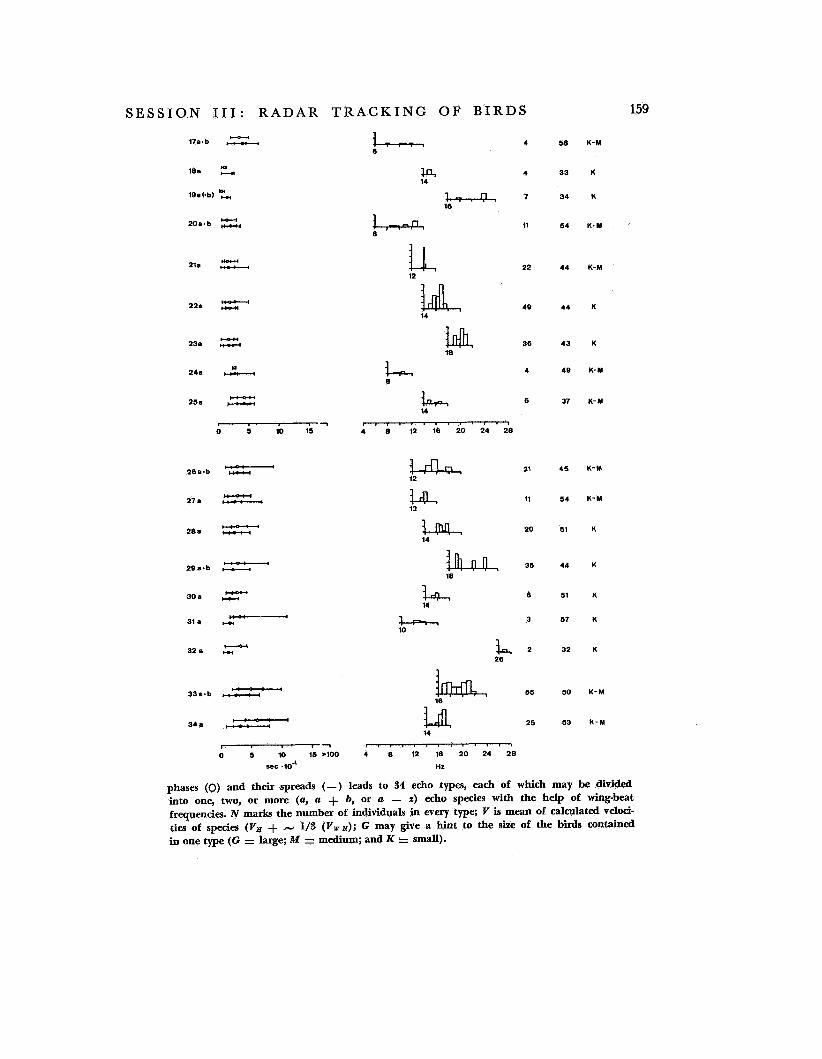
FIGURE 10. Provisional classification of “echo types” and “echo species” recorded during April 1969. A first arrangement according to the length of flapping periods (0) and quiescent
S E S S I O N 111: R A D A R T R A C K I N G O F B I R D S 159
4
e
7
11
22
49
36
4
6
58
33
34
54
44
44
43
49
37
45
54
51
44
51
57
32
50
53
K - M
K
K
K - M
K-M
K
K
K- M
K-M
K-M
K-M
K
K
K
K
K
K- M
K - M
I4 14
L-I-L 16
20a.b
12
14 lddL 22a
23.
L 24. ..’?.
L 14
25.
, . , . . I . . . . . . .
4 8 12 16 20 24 28 , - - . I
0 5 10 15
l-da 12
I2 I-s, 21 26a.b
11 27. c 20
14
18 h 35
6 14
h 3 10
a 2 26
k I6 55 33a.b
Ldl 34. -- 25 . . 14
r . . I I * I . . 0 . . I
4 8 12 16 20 24 2 8 H r
I . Y
0 5 10 15 *lo0 5ec .lo-’
phases (0) and their spreads (-) leads to 34 echo types, each of which may be divided into one, two, or more (a, a + b, or a - z) echo species with the help of wing-beat frequencies. N marks the number of individuals in every type; Y is mean of calculated veloci- ties of species (V, + N 1/3 ( V W Z Z ) ; G may give a hint to the size of the birds contained in one type (G = large; M = medium; and K = small).
160 A N I M A L O R I E N T A T I O N A N D N A V I G A T I O N
0 0 % %
km 4
3
2
1
0
km
“I D O % %
100 0- 100
950-95
9 0 0 - ~ ~
750.75
0 0 0 0 0 0 0 0 I 0 10 20 30 40% 0 8 10 15 20 1;Ix a
FIGURE 11. Average altitude distribution of spring migration. On the alwcissa the percentage of frequency jcolumns) and density (circles) of migration is indicated for height intervals of 250 m. At the left-day migration; at the right-night migration.
( 5 ) W to SW side of an anticyclone (E to SE winds, often Foehn winds in the Alps)
(6) Approaching warm front (all cases after the passage of a previous low pressure area)
(7) Warm sector (could be interpreted in some cases also as the NW edge of a warm high pressure cell; SW winds)
( 8 ) Central regions and disturbance zones of low pressure areas (wind variable in direc- tion, often strong)
(9) Rear side of low pressure areas (in the present cases mostly with winds from sec- tor north to west). This situation leads back to situation 1. In the cases we could examine, heaviest mi- gration occurred in the warm sectors of cy- clones (not too near the frontal systems) and on the W to SW side of ‘anticyclones. Lightest migration was observed in zones of precipita- tion (center of low and fronts) and on the rear side of the low pressure areas, as well
as on the east side of the high pressure areas. With respect to the question whether the
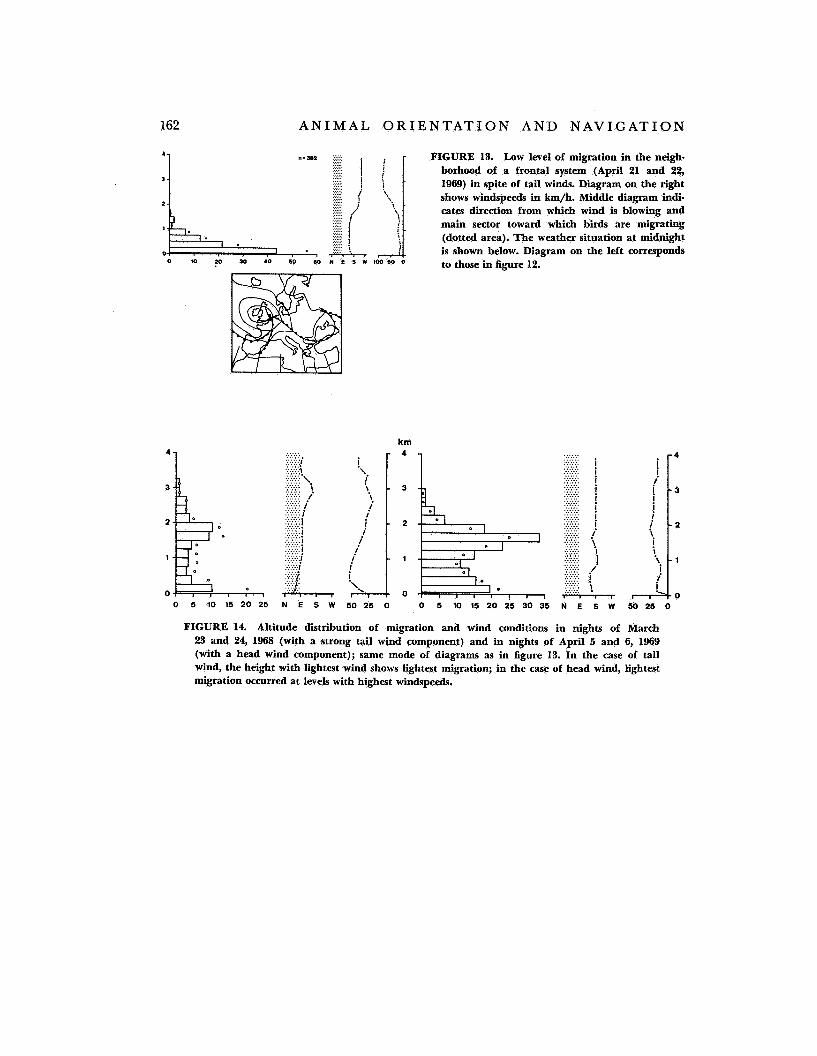
level of migration might be higher with tail winds than with head winds, we believe that the reality is much more complex than the question. Perhaps the question should be re- stricted to anticyclonic conditions, because we have noticed severai cases with low migration in the neighborhood of frontal systems in spite of tail winds (fig. 13). On the other hand topographic features may induce wind distributions differing from the normal case (Le., windspeeds increasing with height), so that anticyclonic situations with opposed winds may give rise to quite a similar distri- bution of migrating birds as situations with tail winds, whenever windspeeds are favora- ble at the same levels (see fig. 14). Further- more the facts may often be blurred by dif- ferences in behavior of different species or even by alterations of flight levels by the same species during one night (see part 11).
S E S S I O N 111: R A D A R T R A C K I N G OF B I R D S 161
km
0 2 4 6 0 2 4 6 I ) 0 2 4 6 6 0 2 4 6 8 1 0 1 2 1 4 1 6 1 8 2 0 2 2 0 2 4 6 8 1 0 1 2 1 4 1 6
1 n - (140 5 - 4
n - 2140 c - 6
4
3
2
1
0 0 2 4 6 6
n -3044 5 - 6
0 2 4 6 I ) 10 12 14 16 18 20 22 23 24 0 2 4 6 0 2 4 6
FIGURE 12. Intensity and height of migration derived from 40 nights of observation with respect to nine different weather situations. Number of nights within each situation is indicated as c, the number of the counted echoes as n. Below each migration diagram, a sketch indicates the appropriate weather situation with the prevailing wind direction. Alti- tude distribution (ordinate) is given for height intervals of 250 m. The abscissa gives f r e quency (cohmns) and density (circles) of migration as defined in the text.
162 A N I M A L O R I E N T A T I O N A N D N A V I G A T I O N
4 FIGURE 13. Low level of migration in the neigh- borhood of a frontal system (April 21 and 22, 1969) in spite of tail winds. Diagram on the right shows windspeeds in km/h. Middle diagram indi- cates direction from which wind is blowing and
(dotted area). The weather situation at midnight
to those in figure 12.
1
1 main sector toward which birds are migrating
is shown below. Diagram on the left corresponds 0
km
...... ..... , ...... :::<::<:: i ..... ....... ....... i
.'.'.'.'.:I
.:..'.....I ..... 2
i ...... , :..:..;.. ...... . . . . . . ...... . . . . . . . ..... ...... ...... ..... ...... ..... ...... ..... ...... ..... ......
I ...... .._.. i
i :.:.:.:.:.:, i ..... ..... ....:-.. */* .... I .___. .....
::;.:'.I
. . . . . I r
0 I , , , , , , - 0 : , , q
0 0 5 10 1 5 2 0 2 5 N E S W 5 0 2 5 0 0 5 10 1 5 2 0 2 5 3 0 3 5 N E S W 5 0 2 5 0
FIGURE 14. Altitude distribution of migration and wind conditions in nights of March 23 and 24, 1968 (with a strong tail wind component) and in nights of April 5 and 6, 1969 (with a head wind component); same mode of diagrams as in figure 13. In the case of tail wind, the height with lightest wind shows lightest migration; in the case of head wind, lightest migration occurred at levels with highest windspeeds,
S E S S I O N 1 1 1 : R A D A R T R A C K I N G O F B I R D S 163
Part I I by P. Steidinger
DEPENDENCE OF MIGRATION FLIGHT DIRECTIONS UPON
WIND DIRECTIONS
Taking as an example one of the most interesting nights in our radar observation period in the spring of 1969, we will show one of the potentialities of our tracking radar in orientation research.
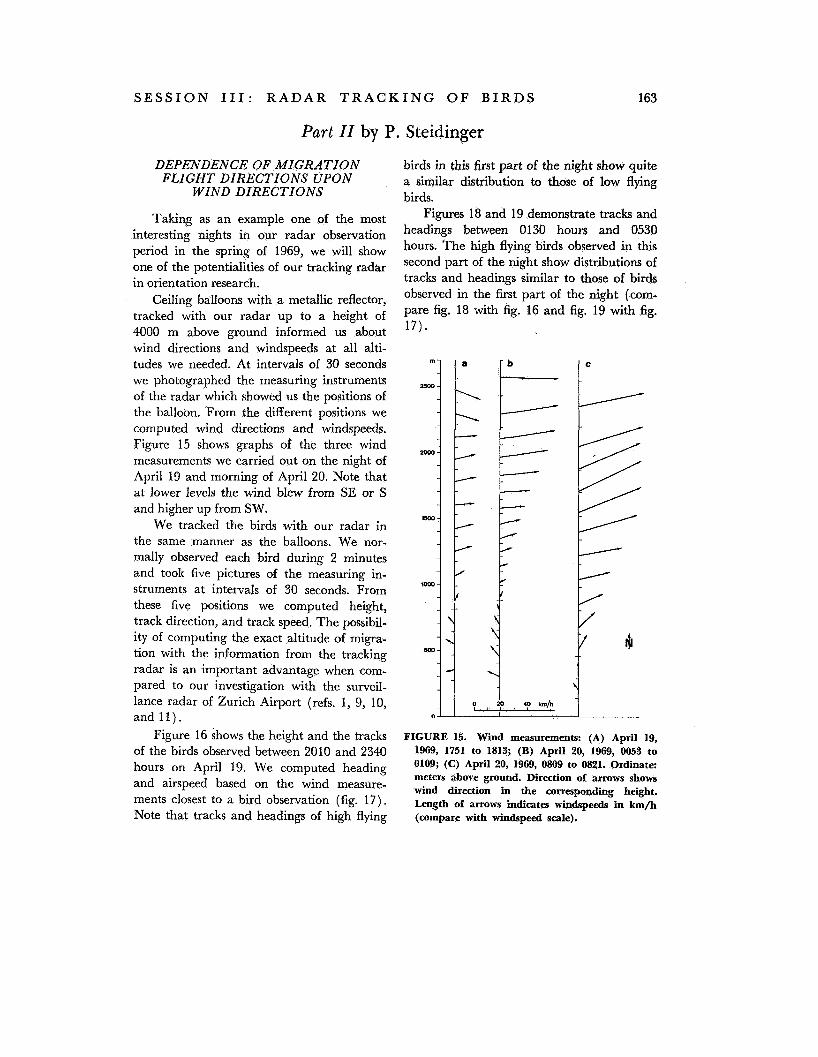
Ceiling balloons with a metallic reflector, tracked with our radar up to a height of 4000 m above ground informed us about wind directions and windspeeds at all alti- tudes we needed. At intervals of 30 seconds we photographed the measuring instruments of the radar which showed us the positions of the balloon. From the different positions we computed wind directions and windspeeds. Figure 15 shows graphs of the three wind measurements we carried out on the night of April 19 and morning of April 20. Note that at lower levels the wind blew from SE or S and higher up from SW.
We tracked the birds with our radar in the same manner as the balloons. We nor- mally observed each bird during 2 minutes and took five pictures of the measuring in- struments at intervals of 30 seconds. From these five positions we computed height, track direction, and track speed. The possibil- ity of computing the exact altitude of migra- tion with the information from the tracking radar is an important advantage when com- pared to our investigation with the surveil- lance radar of Zurich Airport (refs. 1, 9, 10, and 11).
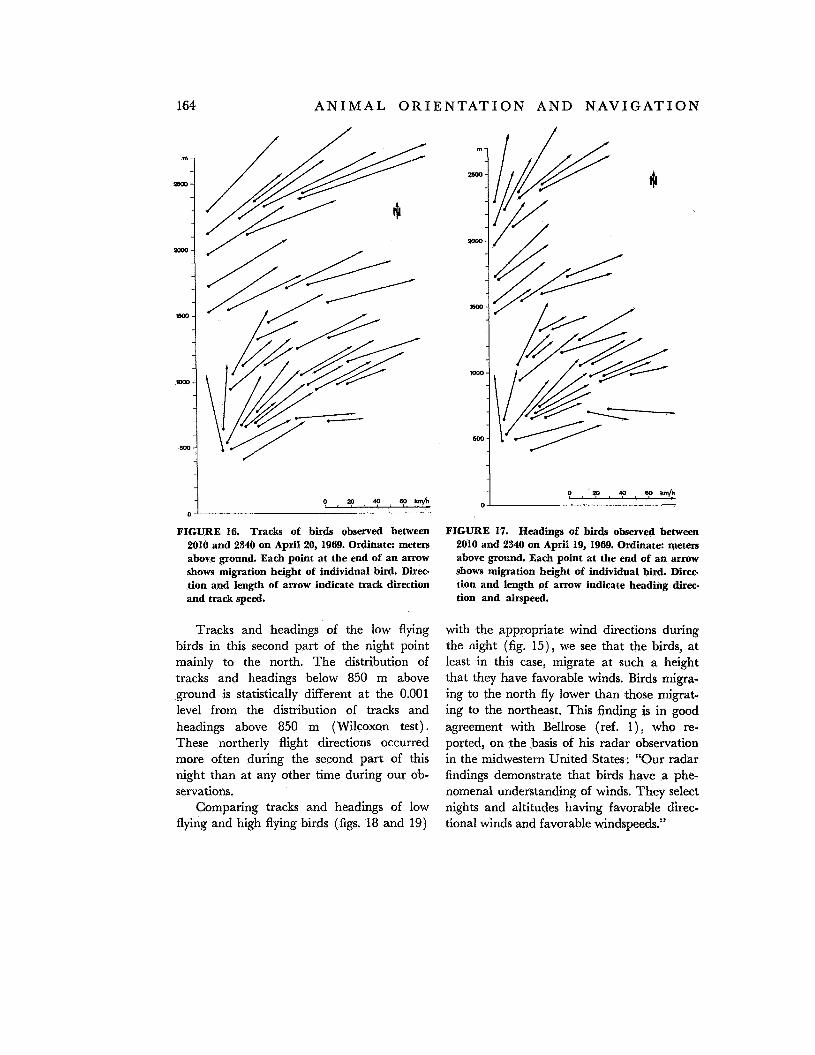
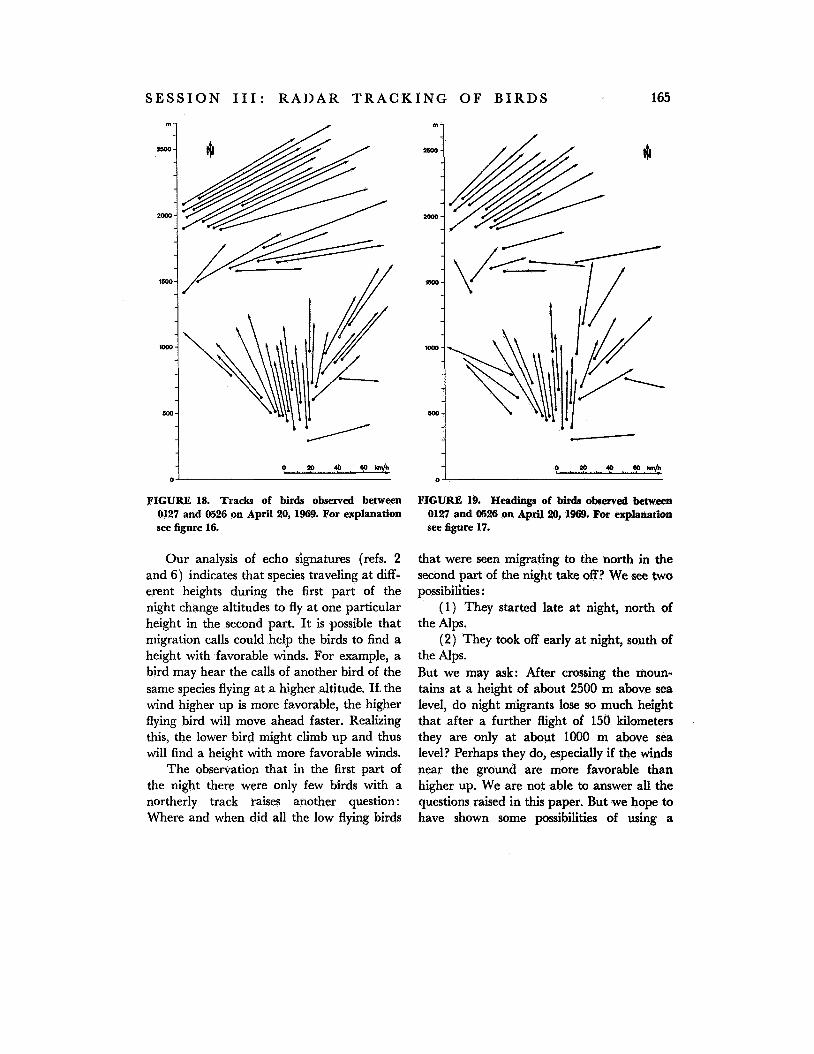
Figure 16 shows the height and the tracks of the birds observed between 2010 and 2340 hours on April 19. We computed heading and airspeed based on the wind measure- ments closest to a bird observation (fig. 17). Note that tracks and headings of high flying
birds in this first part of the night show quite a similar distribution to those of low flying birds.
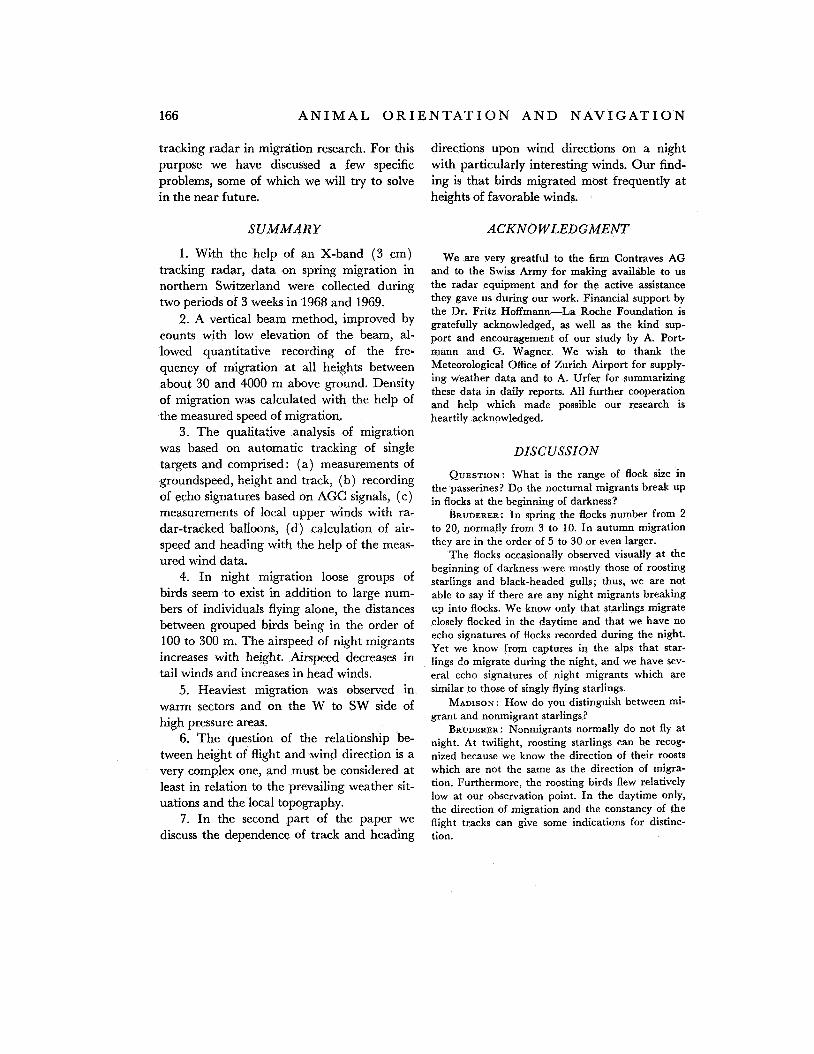
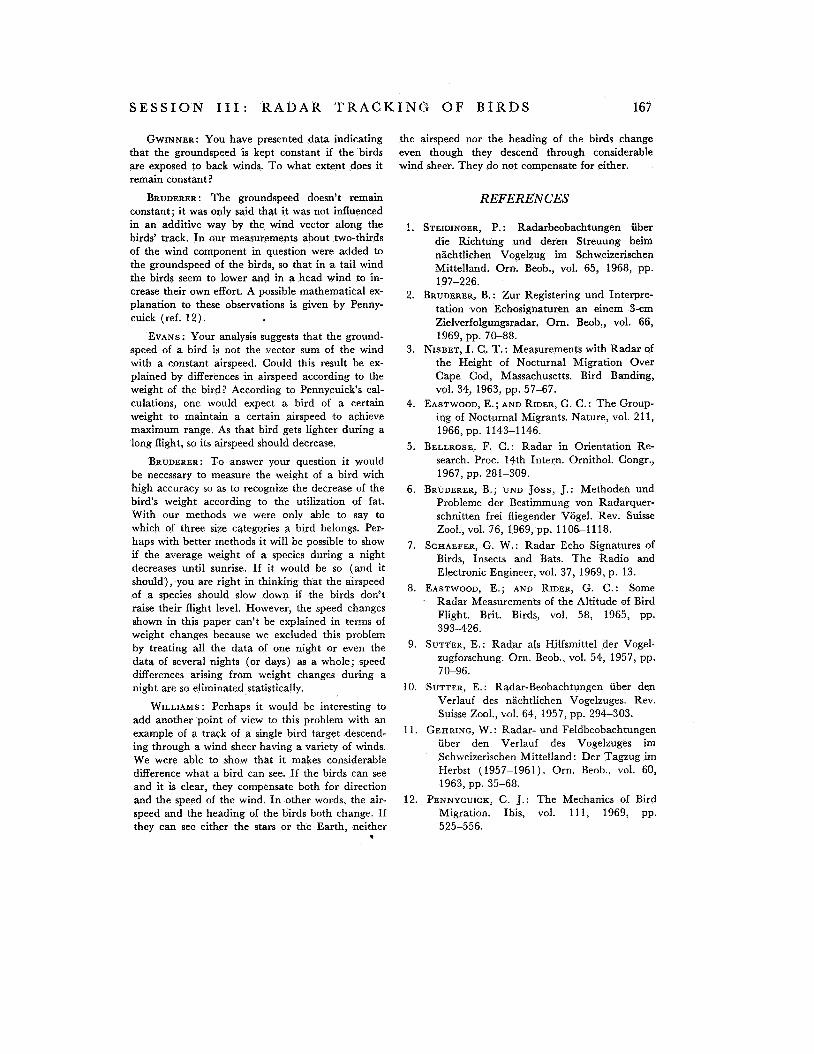
Figures 18 and 19 demonstrate tracks and hzadings between 0130 hours and 0530 hours. The high flying birds observed in this second part of the night show distributions of tracks and headings similar to those of birds observed in the first part of the night (com- pare fig. 18 with fig. 16 and fig. 19 with fig.
F- E
/ 4 t
d 1 I ' a i ' '
0 A 40 km/h
0
FIGURE 15. Wind measurements: (A) April 19, 1969, 1751 to 1813; (B) April 20, 1969, 0053 to 0109; (C) April 20, 1969, 0809 to 0821. Ordinate: meters above ground. Direction of arrows shows wind direction in the corresponding height. Length of arrows indicates windspeeds in km/h (compare with windspeed scale).
164 A N I M A L O R I E N T A T I O N A N D N A V I G A T I O N
m -
2600-
2ooo-
ISM)-
m-
500-
0
0 , 2 0 .“p Q W n / h 0 10 40 80 km/h 0
Tracks and headings of the low flying birds in this second part of the night point mainly to the north. The distribution of tracks and headings below 850 m above ground is statistically different at the 0.001 level from the distribution of tracks and headings above 850 m (Wilcoxon test). These northerly flight directions occurred more often during the second part of this night than at any other time during our ob- servations.
Comparing tracks and headings of low flying and high flying birds (figs. 18 and 19)
with the appropriate wind directions during the aight (fig. 15) , we see that the birds, at least in this case, migrate at such a height that they have favorable winds. Birds migra- ing to the north fly lower than those migrat- ing to the northeast. This finding is in good agreement with Bellrose (ref. l ) , who re- ported, on the basis of his radar observation in the midwestern United States: “Our radar findings demonstrate that birds have a phe- nomenal understanding of winds. They select nights and altitudes having favorable direc- tional winds and favorable windspeeds.”
S E S S I O N 111: R A D A R T R A C K I N G OF B I R D S 165
0 . ? O , q , q o L m / h
FIGURE 18. Tracb of birds observed between 0127 and 0526 on April 20, 1969. For explanation see figure 16.
Our analysis of echo signatures (refs. 2 and 6) indicates that species traveling at diff- erent heights during the first part of the night change altitudes to fly at one particular height in the second part. It is possible that migration calls could help the birds to find a height with favorable winds. For example, a bird may hear the calls of another bird of the same species flying at a higher altitude. If the wind higher up is more favorable, the higher flying bird will move ahead faster. Realizing this, the lower bird might climb up and thus will find a height with more favorable winds.
The observation that in the first part of the night there were only few birds with a northerly track i-aises another question : Where and when did all the low flying birds
that were seen migrating to the north in the second part of the night take off? We see two possibilities :
(1) They started late at night, north of the Alps.
(2) They took off early at night, south of the Alps. But we may ask: After crossing the moun- tains at a height of about 2500 m above sea level, do night migrants lose so much height that after a further flight of 150 kilometers they are only at about 1000 m above sea level? Perhaps they do, especially if the winds near the ground are more favorable than higher up. We are not able to answer all the questions raised in this paper. But we hope to have shown some possibilities of using a
166 A N I M A L O R I E N T A T I O N A N D N A V I G A T I O N
tracking radar in migration research. For this purpose we have discussed a few specific problems, some of which we will try to solve in the near future.
SUMMARY
1. With the help of an X-band ( 3 cm) tracking radar, data on spring migration in northern Switzerland were collected during two periods of 3 weeks in 1968 and 1969.
2. A vertical beam method, improved by counts with low elevation of the beam, al- lowed quantitative recording of the fre- quency of migration at all heights between about 30 and 4000 m above ground. Density of migration was calculated with the help of the measured speed of migration.
3. The qualitative analysis of migration was based on automatic tracking of single targets and comprised : (a) measurements of groundspeed, height and track, (b) recording of echo signatures based on AGC signals, (c) measurements of local upper winds with ra- dar-tracked balloons, (d) calculation of air- speed and heading with the help of the meas- ured wind data.
4. In night migration loose groups of birds seem to exist in addition to large num- bers of individuals flying alone, the distances between grouped birds being in the order of 100 to 300 m. The airspeed of night migrants increases with height. Airspeed decreases in tail winds and increases in head winds.
5. Heaviest migration was observed in warm sectors and on the W to SW side of high pressure areas.
6. The question of the relationship be- tween height of flight and wind direction is a very complex one, and must be considered at least in relation to the prevailing weather sit- uations and the local topography.
7. In the second part of the paper we discuss the dependence of track and heading
directions upon wind directions on a night with particularly interesting winds. Our find- ing is that birds migrated most frequently at heights of favorable winds.
ACKNOWLEDGMENT
We are very greatful to the firm Contraves AG and to the Swiss Army for making available to us the radar equipment and for the active assistance they gave us during our work. Financial support by the Dr. Fritz Hoffmann-La Roche Foundation is gratefully acknowledged, as well as the kind sup- port and encouragement of our study by A. Port- mann and G. Wagner. We wish to thank the Meteorological Office of Zurich Airport for supply- ing weather data and to A. Urfer for summarizing these data in daily reports. All further cooperation and help which made possible our research is heartily acknowledged.
DISC USSI 0 N
QUESTION: What is the range of flock size in the passerines? Do the nocturnal migrants break up in flocks at the beginning of darkness?
BRUDERER: In spring the flocks number from 2 to 20, normally from 3 to 10. In autumn migration they are in the order of 5 to 30 or even larger.
The flocks occasionally observed visually at the beginning of darkness were mostly those of roosting starlings and black-headed gulls; thus, we are not able to say if there are any night migrants breaking up into flocks. We know only that starlings migrate closely flocked in the daytime and that we have no echo signatures of flocks recorded during the night. Yet we know from captures in the alps that star- lings do migrate during the night, and we have sev- eral echo signatures of night migrants which are similar to those of singly flying starlings.
MADISON : How do you distinguish between mi- grant and nonmigrant starlings?
BRUDERER: Nonmigrants normally do not fly at night. At twilight, roosting starlings can be recog- nized because we know the direction of their roosts which are not the same as the direction of migra- tion. Furthermore, the roosting birds flew relatively low at our observation point. In the daytime only, the direction of migration and the constancy of the flight tracks can give some indications for distinc- tion.
S E S S I O N 1 1 1 : R A D A R T R A C K I N G O F B I R D S 167
GWINNER: You have presented data indicating that the groundspeed is kept constant if the birds are exposed to back winds. To what extent does it remain constant?
BRUDERER: The groundspeed doesn’t remain constant; it was only said that it was not influenced in an additive way by the wind vector along the birds’ track. In our measurements about two-thirds of the wind component in question were added to the groundspeed of the birds, so that in a tail wind the birds seem to lower and in a head wind to in- crease their own effort. A possible mathematical ex- planation to these observations is given by Penny- cuick (ref. 12).
EVANS: Your analysis suggests that the ground- speed of a bird is not the vector sum of the wind with a constant airspeed. Could this result be ex- plained by differences in airspeed according to thr weight of the bird? According to Pennycuick’s cal- culations, one would expect a bird of a certain weight to maintain a certain airspeed to achieve maximum range. As that bird gets lighter during a long flight, so its airspeed should decrease.
BRUDERER: To answer your question it would be necessary to measure the weight of a bird with high accuracy so as to recognize the decrease of the bird’s weight according to the utilization of fat. With our methods we were only able to say to which of three size categories a bird belongs. Per- haps with better methods it will be possible to show if the average weight of a species during a night decreases until sunrise. If it would be so (and it should), you are right in thinking that the airspeed of a species should slow down if the birds don’t raise their flight level. However, the speed changes shown in this paper can’t be explained in terms of weight changes because we excluded this problem by treating all the data of one night or even the data of several nights (or days) as a whole; speed differences arising from weight changes during a night are so eliminated statistically.
WILLIAMS: Perhaps it would be interesting to add another point of view to this problem with an example of a track of a single bird target descend- ing through a wind sheer having a variety of winds. We were able to show that it makes considerable difference what a bird can see. If the birds can see and it is clear, they compensate both for direction and the speed of the wind. In other words, the air- speed and the heading of the birds both change. If they can see either the stars or the Earth, neither
*
the airspeed nor the heading of the birds change even though they descend through considerable wind sheer. They do not compensate for either.
REFERENCES
!. STEIDINGER, P. : Radarbeobachtungen iiber die Richtung und deren Streuung beim nachtlichen Vogelzug im Schweizerischen Mittelland. Om. Beob., vol. 65, 1968, pp.
2. BRUDERER, B.: Zur Registering und Interpre- tation von Echosignaturen an einem 3-cm Zielverfolgungsradar. Om. Beob., vol. 66,
3. NISBET, I. C. T.: Measurements with Radar of the Height of Nocturnal Migration Over Cape Cod, Massachusetts. Bird Banding,
4. EASTWOOD, E.; AND RIDER, G. C.: The Group- ing of Nocturnal Migrants. Nature, vol. 211, 1966, pp. 1143-1 146.
5. BELLROSE, F. C.: Radar in Orientation Re- search. Proc. 14th Intern. Ornithol. Congr., 1967, pp. 281-309.
6. BRUDERER, B.; UND Joss, J.: Methoden und Probleme der Bestimmung von Radarquer- schnitten frei fliegender Vogel. Rev. Suisse
7. SCKAEFER, G. W.: Radar Echo Signatures of Birds, Insects and Bats. The Radio and Electronic Engineer, vol. 37, 1969, p. 13.
8. EASTWOOD, E.; AND RIDER, G. C.: Some Radar Measurements of the Altitude of Bird Flight. Brit. Birds, vol. 58, 1965, pp. 393-426.
9. SUTTER, E.: Radar als Hilfsmittel der Vogel- zugforschung. Om. Beob., vol. 54, 1957, pp. 70-96.
10. SUTTER, E. : Radar-Beobachtungen iiber den Verlauf des nachtlichen Vogelzuges. Rev. Suisse Zool., vol. 64, 1957, pp. 294-303.
1 1. GEHRING, W. : Radar- und Feldbeobachtungen iiber den Verlauf des Vogelzuges im Schweizerischen Mittelland: Der Tagzug im Herbst (1957-1961). Om. Beob., vol. 60,
12. PENNYCUICR, C. J.: The Mechanics of Bird Migration. Ibis, vol. 11 1, 1969, pp.
197-226.
1969, pp. 70-88.
V O ~ . 34, 1963. pp. 57-67.
ZOO~.,VO~. 76, 1 9 6 9 , ~ ~ . 1106-1118.
1963, pp. 35-68.
525-556.