Embed Size (px)
Citation preview
ARTHRITIS & RHEUMATISMVol. 65, No. 11, November 2013, pp 2791–2802DOI 10.1002/art.38094© 2013, American College of Rheumatology
Methotrexate Normalizes Up-RegulatedFolate Pathway Genes in Rheumatoid Arthritis
Marjolein Blits,1 Gerrit Jansen,1 Yehuda G. Assaraf,2 Mark A. van de Wiel,1
Willem F. Lems,1 Mike T. Nurmohamed,3 Dirkjan van Schaardenburg,3
Alexandre E. Voskuyl,1 Gert-Jan Wolbink,4 Saskia Vosslamber,1 and Cornelis L. Verweij1
Objective. The folate antagonist methotrexate(MTX) is an anchor drug in the treatment of rheu-matoid arthritis (RA), but its mechanism of actionwith regard to the impact on folate metabolism re-mains elusive. The aim of the present study was toinvestigate the cellular pharmacologic impact of MTXon peripheral blood cells, by comparing MTX-treatedRA patients to MTX-naive RA patients and healthycontrols.
Methods. Gene expression microarray datawere used to investigate the expression of 17 folatepathway genes by peripheral blood cells from a cohort of25 RA patients treated with MTX, 10 MTX-naive RApatients starting treatment with MTX, and 15 healthycontrols (test cohort). Multiplex real-time polymerasechain reaction was used to validate the results in anindependent cohort, consisting of 151 RA patients
treated with MTX, 28 MTX-naive RA patients startingtreatment with MTX, and 24 healthy controls (valida-tion cohort).
Results. Multiple folate metabolism–relatedgenes were consistently and significantly altered be-tween the 3 groups in both cohorts. Concurrent withevidence of an immune-activation gene signature inMTX-naive RA patients, significant up-regulation ofthe folate-metabolizing enzymes �-glutamyl hydrolaseand dihydrofolate reductase, as well as the MTX/folateefflux transporters ABCC2 and ABCC5, was observed inthe MTX-naive RA group compared to healthy controls.Strikingly, MTX treatment of RA patients normalizedthese differential gene expression levels to the levelsobserved in healthy controls.
Conclusion. These results suggest that under in-flammatory conditions, basal folate metabolism in theperipheral blood cells of RA patients is markedly up-regulated, and treatment with MTX restores folatemetabolism to normal levels. Identification of this novelgene signature provides insight into the mechanism ofaction of MTX, thus paving the way for development ofnovel folate metabolism–targeted therapies.
Rheumatoid arthritis (RA) is a systemic auto-immune disease that is characterized by chronic inflam-mation of the joints. RA is heterogeneous in terms of itsclinical presentation, pathologic processes, and responseto therapy (1,2). The folic acid antagonist methotrexate(MTX) is by far the most widely used disease-modifyingantirheumatic drug (DMARD) in the treatment of RA,either as a single agent or in combination with otherDMARDs. Failure to respond to DMARD-based ther-apy may prompt the use of biologic agents, such asanti–tumor necrosis factor � monoclonal antibodies, incombination with MTX (3,4).
Supported in part by the TRACER consortium of theCenter for Translational and Molecular Medicine, the Dutch ArthritisFoundation (grant 9-1-407), the Centre for Medical Systems Biology(a center of excellence from the Netherlands Genomics Initiative),and the European Union (project AutoCure). Dr. Assaraf was recip-ient of a visiting professor fellowship provided by the Dutch ArthritisFoundation as well as awards from the Dutch Organization forScientific Research, the Royal Netherlands Academy of Arts andSciences, and the VU University Medical Center, Amsterdam.
1Marjolein Blits, MSc, Gerrit Jansen, PhD, Mark A. van deWiel, PhD, Willem F. Lems, MD, PhD, Alexandre E. Voskuyl, MD,PhD, Saskia Vosslamber, MSc, Cornelis L. Verweij, PhD: VU Uni-versity Medical Center, Amsterdam, The Netherlands; 2Yehuda G.Assaraf, PhD: Technion–Israel Institute of Technology, Haifa, Israel;3Mike T. Nurmohamed, MD, PhD, Dirkjan van Schaardenburg, MD:VU University Medical Center, and Jan van Breemen ResearchInstitute�Reade, Amsterdam, The Netherlands; 4Gert-Jan Wolbink,MD, PhD: Jan van Breemen Research Institute�Reade, Amsterdam,The Netherlands.
Address correspondence to Cornelis L. Verweij, PhD, VUUniversity Medical Center, Departments of Pathology and Rheuma-tology, Inflammatory Disease Profiling, CCA2.28, PO Box 7057,1007MB Amsterdam, The Netherlands. E-mail: [email protected].
Submitted for publication December 14, 2012; accepted inrevised form July 11, 2013.
2791
Beyond its application in the treatment of RA,MTX is also commonly prescribed in the treatment ofmalignant diseases (5,6). The antiinflammatory effectselicited by low-dose MTX treatment of RA may involvemechanisms that are distinct from those observed withhigh-dose MTX treatment of various cancers. How-ever, with respect to the cellular pharmacologic effectsof MTX, there are overlapping mechanisms of actionin RA and cancer. MTX suppresses proliferation ofmalignant cells by blocking the de novo biosynthesisof purines and pyrimidines (5). Moreover, MTX in-hibits the homocysteine and methionine cycle involvedin methylation of DNA, RNA, and proteins. MTX-induced inhibition of 5-aminoimidazole-4-carboxamideribonucleotide formyltransferase (AICARTF/ATIC)promotes release of the endogenous antiinflammatorymediator adenosine (5,7,8). MTX has also been re-ported to achieve additional pharmacologic effects, e.g.,
generation of reactive oxygen species through JNKactivation (9,10), induction of T cell apoptosis (11), andinhibition of NF-�B (12), for which the contribution ofits therapeutic efficacy is not fully defined.
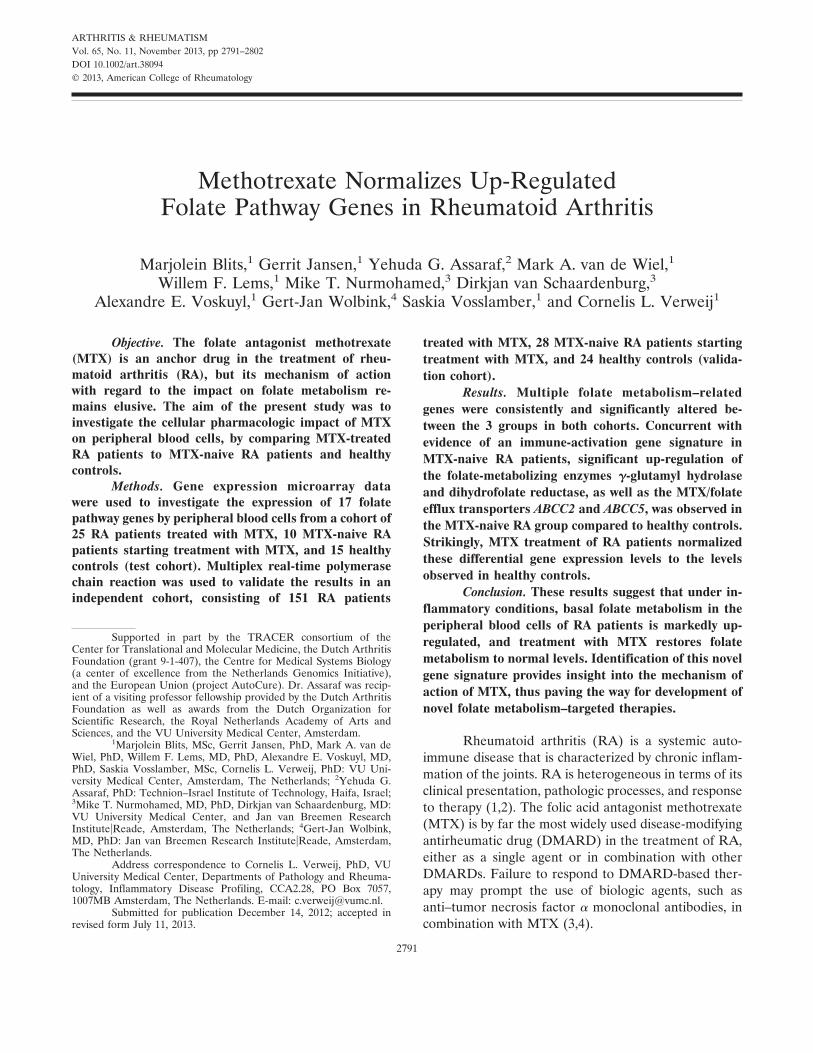
As shown in Figure 1, treatment with MTXprimarily interferes with folate homeostasis, a processthat is tightly controlled at multiple levels, including thefollowing: 1) routes of cellular uptake and efflux ofMTX/folate; 2) intracellular metabolism and retentionof MTX/folate; and 3) expression of key regulatoryfolate-dependent enzymes (for review, see refs. 5 and13). Oral MTX is taken up in the upper small intestinevia the proton-coupled folate transporter (PCFT/SLC46A1), which functions optimally at the acidic pH ofthe duodenum and jejunum, both of which show pre-dominant expression of PCFT (5,14). Cellular uptake ofMTX by immune cells proceeds via the reduced folatecarrier (RFC/SLC19A1), although a third transport
Figure 1. Key components of methotrexate (MTX)/folate metabolism, involved in the uptake and extrusion, metabolism, and targeting ofMTX/folate. The influx transporters comprise reduced folate carrier (RFC), proton-coupled folate transporter (PCFT), and folate receptor � and� (FR�/�) isoforms. The metabolizing enzymes comprise folylpolyglutamate synthetase (FPGS) and �-glutamyl hydrolase (GGH) (compartmen-talized in lysosomes). The folate-dependent enzymes involved in folate cycling include dihydrofolate reductase (DHFR), thymidylate synthase(TYMS), 5-aminoimidazole-4-carboxamide ribonucleotide formyltransferase (AICARTF/ATIC), glycinamide ribonucleotide transformylase(GART), methylenetetrahydrofolate reductase (MTHFR), and methionine synthase (MS). The MTX efflux transporters, members of theATP-binding cassette (ABC) transporters, include ABCC1–5 and ABCG2. Inhibition of folate-dependent enzymes by MTX is depicted with the longbroken lines. Proteins and enzymes are shown in boldface. PG � polyglutamate; OP� � organic phosphate; H� � hydrogen; Pi � phosphates;DHF � dihydrofolate; THF � tetrahydrofolate; CH3-THF � 5-methyl-tetrahydrofolate; CH2-THF � 5,10-methylene-tetrahydrofolate; CHO-THF � 10-formyl-tetrahydrofolate. Adapted, with permission, from refs. 5 and 13.
2792 BLITS ET AL
route, involving a receptor-mediated process via folatereceptor � (FR�), which is expressed predominantly inmacrophages, can be operative in activated macro-phages in inflamed synovial tissue (15,16). Upon entryinto the cell, MTX is metabolically activated by theenzyme folylpolyglutamate synthetase (FPGS) to a poly-anionic polyglutamate form that is highly retained withincells (17). For deactivation, polyglutamylation can bereversed by �-glutamyl hydrolase (GGH), which cleavesoff the polyglutamyl chain attached to folates and poly-glutamatable antifolates such as MTX (18).
MTX blocks the key enzyme dihydrofolate reduc-tase (DHFR), whereas MTX polyglutamates (MTXGlu)potently inhibit thymidylate synthase (TYMS), both ofwhich are enzymes that are crucial for the de novo bio-synthesis of purines and pyrimidines required for DNAreplication and cellular proliferation. MTXGlu and di-hydrofolate polyglutamates that accumulate afterDHFR inhibition can also exert an inhibitory effecton other folate-dependent enzymes downstream ofDHFR, such as glycinamide ribonucleotide formyltrans-ferase (GART) and methylenetetrahydrofolate reduc-tase (MTHFR) (19,20), which also function in de novopurine biosynthesis and methylation of DNA, RNA,and proteins, respectively. Finally, folate/MTX can beextruded from cells, mainly as the nonpolyglutamatedform, via ATP-binding cassette (ABC) transporters,including ABCC1 and ABCG2 (5,21).
Despite the key role of MTX in current RAtherapies, its mechanism of action remains elusive, and arecurrent theme is the lack of a clinical response and therisk of toxicity in a considerable fraction of patients.Many studies have investigated genetic variants of folatepathway genes and the levels of MTXGlu in red bloodcells (RBCs) as predictive markers for therapy responseor toxicity, and these markers could be used to decipherthe molecular basis underlying the loss of MTX efficacyin RA (22–26).
Although these studies offer promising avenuestoward the discovery of markers that could predict andexplain the mechanisms underlying loss of MTX func-tion, the mode of action of MTX in RA remains unclear.As a step toward this end and in order to betterunderstand the impact of MTX treatment on RA, wecompared expression levels of multiple MTX/folatepathway genes in RA patients prior to and duringtreatment with MTX. Furthermore, expression profilingin these 2 RA groups was compared with that in healthycontrols.
PATIENTS AND METHODS
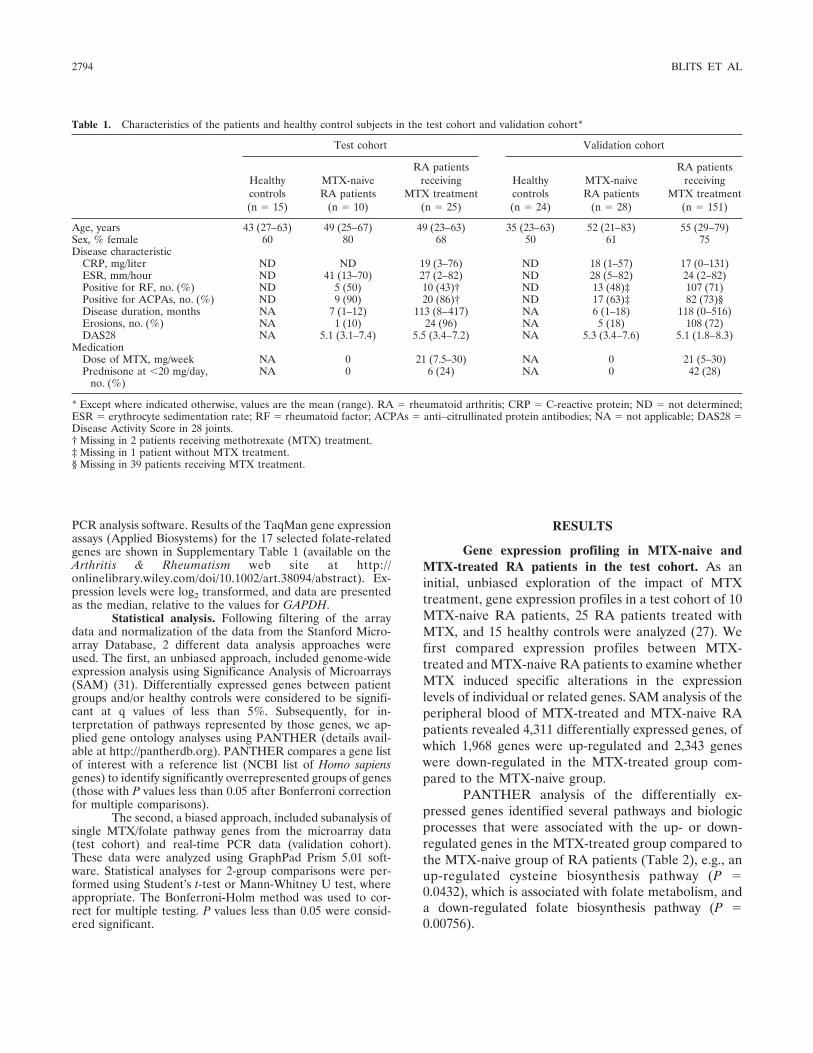
Patients and controls. This study consisted of 2 inde-pendently collected cohorts, a test cohort and a validationcohort. The test cohort included 25 RA patients who werereceiving treatment with MTX, 10 RA patients who had notbeen treated with MTX or other DMARDs and were about tostart MTX treatment (MTX-naive), and 15 healthy controls, aspreviously reported (27). The validation cohort consisted of151 RA patients who were receiving treatment with MTX,28 MTX-naive RA patients who were about to start MTXtreatment, and 24 healthy controls. The characteristics of thepatients and controls in both cohorts are summarized inTable 1. All patients were diagnosed as having RA accordingto the American College of Rheumatology 1987 revised cri-teria for RA (28), and each subject was randomly selected forthe study. All RA patients and healthy individuals gave theirinformed consent to participate, and the study protocol wasapproved by medical ethics committees of the AcademicMedical Center, the VU University Medical Center, and theJan van Breemen Research Institute�Reade (Amsterdam, TheNetherlands).
Blood sampling for RNA isolation. Samples of peri-pheral blood (2.5 ml) for RNA isolation were obtained fromall patients and healthy controls and directly collected inPAXgene Blood RNA isolation tubes (PreAnalytiX) to avoidmanipulation and activation of the cells (29). Incubation atroom temperature for 2 hours on a roller bank ensuredcomplete cell lysis and RNA stabilization, after which tubeswere stored at �20°C. Total RNA was isolated using aPAXgene RNA isolation kit according to the manufacturer’sinstructions, including a DNase treatment (Qiagen) to re-move genomic DNA. The quantity and quality of the RNAwere determined using a NanoDrop Technologies spectro-photometer.
Gene expression microarray data. For gene expressionanalysis (27) of peripheral blood samples from the test cohort,data were retrieved from the Stanford Microarray Database(30) (http://smd.stanford.edu/cgi-bin/search/basicSearch.pl),and expression levels of specific genes were extracted andanalyzed. A subanalysis in the test cohort involved microarrayexpression analysis of genes in the MTX/folate pathway (13),in particular those involved in cellular uptake of MTX/folate(FR, PCFT, and RFC) and efflux of MTX/folate (ABCC1–ABCC5 and ABCG2), the metabolism of MTX/folate (FPGSand GGH), and intracellular targeting of MTX (DHFR, TYMS,MTHFR, ATIC, and GART).
Complementary DNA (cDNA) synthesis and real-timepolymerase chain reaction (PCR) analysis. RNA (0.25 �g) wasreverse-transcribed into cDNA with a RevertAid H MinusFirst Strand cDNA Synthesis Kit (MBI Fermentas) accordingto the manufacturer’s instructions. The BioMark 96.96 dy-namic array (Fluidigm) used for gene expression analysis wasalso used for real-time PCR analysis of 17 folate/MTX pathwaygenes, performed by an outsourcing company (ServiceXS).Before using the BioMark array, Specific Target Amplificationof the cDNA (14 cycles) was performed. The reaction wasdiluted 5-fold before being loaded onto the BioMark array.PCR and imaging were performed on a BioMark instrument,after which Ct values were extracted using BioMark Real-Time
IMPACT OF MTX ON FOLATE PATHWAY GENES IN RA 2793
PCR analysis software. Results of the TaqMan gene expressionassays (Applied Biosystems) for the 17 selected folate-relatedgenes are shown in Supplementary Table 1 (available on theArthritis & Rheumatism web site at http://onlinelibrary.wiley.com/doi/10.1002/art.38094/abstract). Ex-pression levels were log2 transformed, and data are presentedas the median, relative to the values for GAPDH.
Statistical analysis. Following filtering of the arraydata and normalization of the data from the Stanford Micro-array Database, 2 different data analysis approaches wereused. The first, an unbiased approach, included genome-wideexpression analysis using Significance Analysis of Microarrays(SAM) (31). Differentially expressed genes between patientgroups and/or healthy controls were considered to be signifi-cant at q values of less than 5%. Subsequently, for in-terpretation of pathways represented by those genes, we ap-plied gene ontology analyses using PANTHER (details avail-able at http://pantherdb.org). PANTHER compares a gene listof interest with a reference list (NCBI list of Homo sapiensgenes) to identify significantly overrepresented groups of genes(those with P values less than 0.05 after Bonferroni correctionfor multiple comparisons).
The second, a biased approach, included subanalysis ofsingle MTX/folate pathway genes from the microarray data(test cohort) and real-time PCR data (validation cohort).These data were analyzed using GraphPad Prism 5.01 soft-ware. Statistical analyses for 2-group comparisons were per-formed using Student’s t-test or Mann-Whitney U test, whereappropriate. The Bonferroni-Holm method was used to cor-rect for multiple testing. P values less than 0.05 were consid-ered significant.
RESULTS
Gene expression profiling in MTX-naive andMTX-treated RA patients in the test cohort. As aninitial, unbiased exploration of the impact of MTXtreatment, gene expression profiles in a test cohort of 10MTX-naive RA patients, 25 RA patients treated withMTX, and 15 healthy controls were analyzed (27). Wefirst compared expression profiles between MTX-treated and MTX-naive RA patients to examine whetherMTX induced specific alterations in the expressionlevels of individual or related genes. SAM analysis of theperipheral blood of MTX-treated and MTX-naive RApatients revealed 4,311 differentially expressed genes, ofwhich 1,968 genes were up-regulated and 2,343 geneswere down-regulated in the MTX-treated group com-pared to the MTX-naive group.
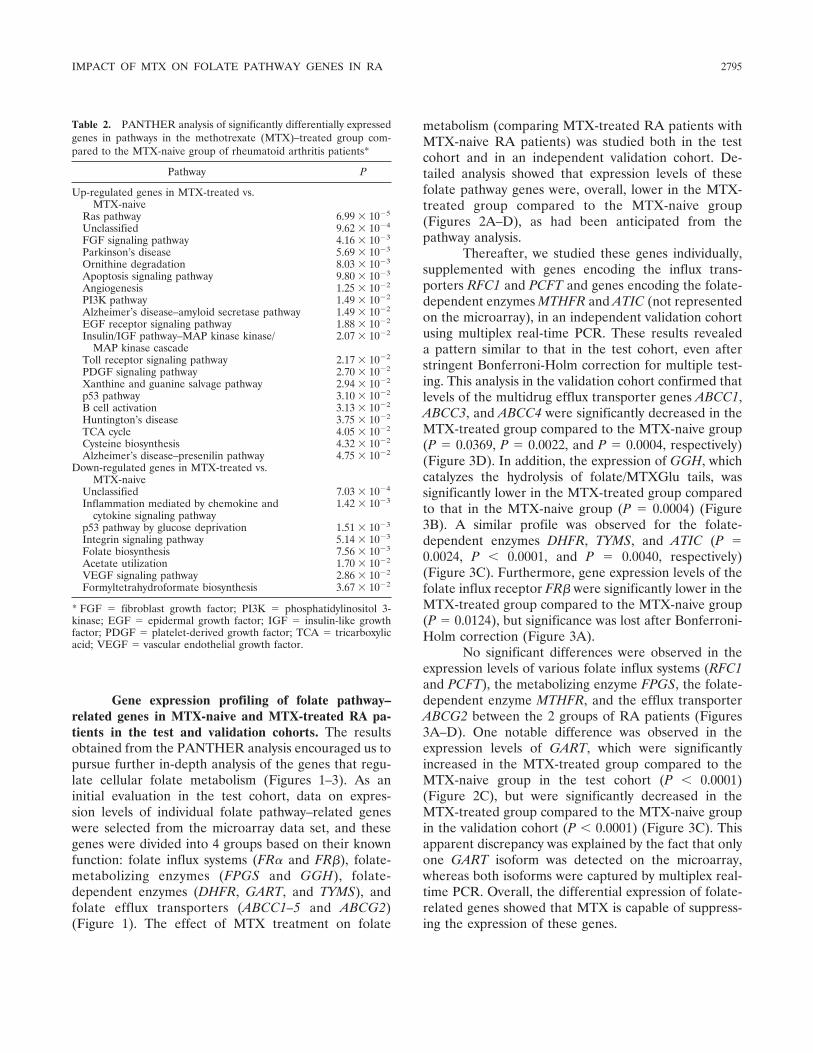
PANTHER analysis of the differentially ex-pressed genes identified several pathways and biologicprocesses that were associated with the up- or down-regulated genes in the MTX-treated group compared tothe MTX-naive group of RA patients (Table 2), e.g., anup-regulated cysteine biosynthesis pathway (P �0.0432), which is associated with folate metabolism, anda down-regulated folate biosynthesis pathway (P �0.00756).
Table 1. Characteristics of the patients and healthy control subjects in the test cohort and validation cohort*
Test cohort Validation cohort
Healthycontrols(n � 15)
MTX-naiveRA patients
(n � 10)
RA patientsreceiving
MTX treatment(n � 25)
Healthycontrols(n � 24)
MTX-naiveRA patients
(n � 28)
RA patientsreceiving
MTX treatment(n � 151)
Age, years 43 (27–63) 49 (25–67) 49 (23–63) 35 (23–63) 52 (21–83) 55 (29–79)Sex, % female 60 80 68 50 61 75Disease characteristic
CRP, mg/liter ND ND 19 (3–76) ND 18 (1–57) 17 (0–131)ESR, mm/hour ND 41 (13–70) 27 (2–82) ND 28 (5–82) 24 (2–82)Positive for RF, no. (%) ND 5 (50) 10 (43)† ND 13 (48)‡ 107 (71)Positive for ACPAs, no. (%) ND 9 (90) 20 (86)† ND 17 (63)‡ 82 (73)§Disease duration, months NA 7 (1–12) 113 (8–417) NA 6 (1–18) 118 (0–516)Erosions, no. (%) NA 1 (10) 24 (96) NA 5 (18) 108 (72)DAS28 NA 5.1 (3.1–7.4) 5.5 (3.4–7.2) NA 5.3 (3.4–7.6) 5.1 (1.8–8.3)
MedicationDose of MTX, mg/week NA 0 21 (7.5–30) NA 0 21 (5–30)Prednisone at �20 mg/day,
no. (%)NA 0 6 (24) NA 0 42 (28)
* Except where indicated otherwise, values are the mean (range). RA � rheumatoid arthritis; CRP � C-reactive protein; ND � not determined;ESR � erythrocyte sedimentation rate; RF � rheumatoid factor; ACPAs � anti–citrullinated protein antibodies; NA � not applicable; DAS28 �Disease Activity Score in 28 joints.† Missing in 2 patients receiving methotrexate (MTX) treatment.‡ Missing in 1 patient without MTX treatment.§ Missing in 39 patients receiving MTX treatment.
2794 BLITS ET AL
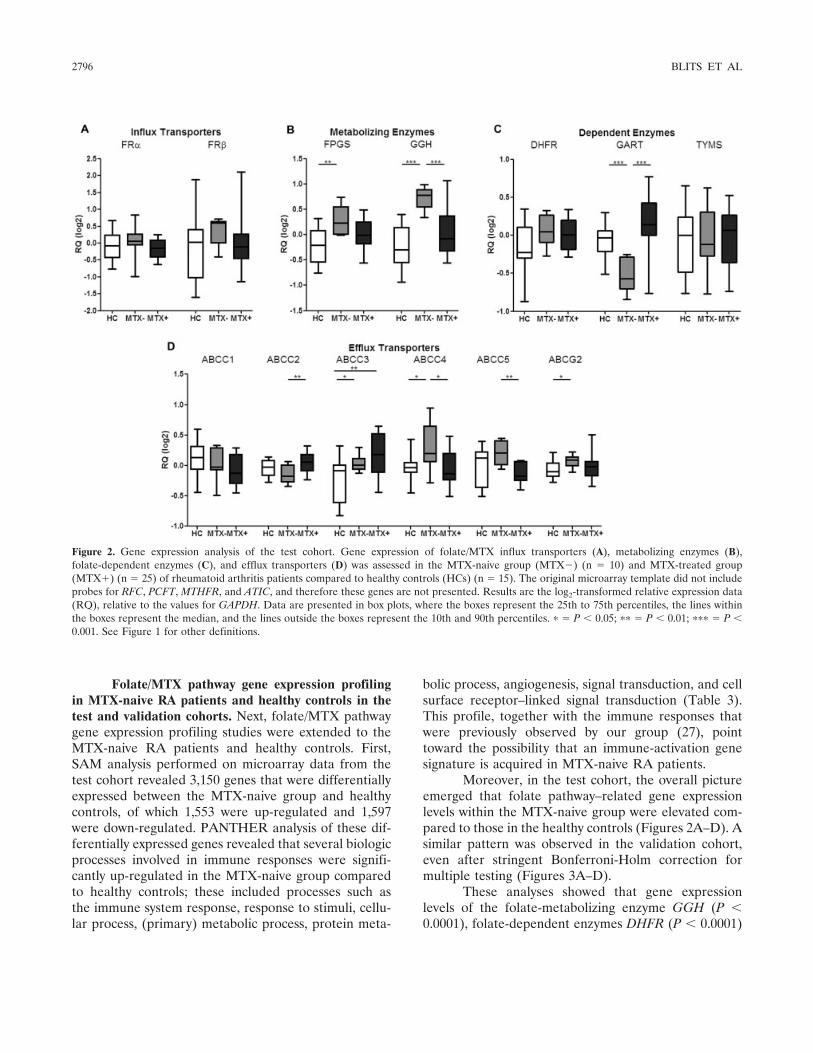
Gene expression profiling of folate pathway–related genes in MTX-naive and MTX-treated RA pa-tients in the test and validation cohorts. The resultsobtained from the PANTHER analysis encouraged us topursue further in-depth analysis of the genes that regu-late cellular folate metabolism (Figures 1–3). As aninitial evaluation in the test cohort, data on expres-sion levels of individual folate pathway–related geneswere selected from the microarray data set, and thesegenes were divided into 4 groups based on their knownfunction: folate influx systems (FR� and FR�), folate-metabolizing enzymes (FPGS and GGH), folate-dependent enzymes (DHFR, GART, and TYMS), andfolate efflux transporters (ABCC1–5 and ABCG2)(Figure 1). The effect of MTX treatment on folate
metabolism (comparing MTX-treated RA patients withMTX-naive RA patients) was studied both in the testcohort and in an independent validation cohort. De-tailed analysis showed that expression levels of thesefolate pathway genes were, overall, lower in the MTX-treated group compared to the MTX-naive group(Figures 2A–D), as had been anticipated from thepathway analysis.
Thereafter, we studied these genes individually,supplemented with genes encoding the influx trans-porters RFC1 and PCFT and genes encoding the folate-dependent enzymes MTHFR and ATIC (not representedon the microarray), in an independent validation cohortusing multiplex real-time PCR. These results revealeda pattern similar to that in the test cohort, even afterstringent Bonferroni-Holm correction for multiple test-ing. This analysis in the validation cohort confirmed thatlevels of the multidrug efflux transporter genes ABCC1,ABCC3, and ABCC4 were significantly decreased in theMTX-treated group compared to the MTX-naive group(P � 0.0369, P � 0.0022, and P � 0.0004, respectively)(Figure 3D). In addition, the expression of GGH, whichcatalyzes the hydrolysis of folate/MTXGlu tails, wassignificantly lower in the MTX-treated group comparedto that in the MTX-naive group (P � 0.0004) (Figure3B). A similar profile was observed for the folate-dependent enzymes DHFR, TYMS, and ATIC (P �0.0024, P � 0.0001, and P � 0.0040, respectively)(Figure 3C). Furthermore, gene expression levels of thefolate influx receptor FR� were significantly lower in theMTX-treated group compared to the MTX-naive group(P � 0.0124), but significance was lost after Bonferroni-Holm correction (Figure 3A).
No significant differences were observed in theexpression levels of various folate influx systems (RFC1and PCFT), the metabolizing enzyme FPGS, the folate-dependent enzyme MTHFR, and the efflux transporterABCG2 between the 2 groups of RA patients (Figures3A–D). One notable difference was observed in theexpression levels of GART, which were significantlyincreased in the MTX-treated group compared to theMTX-naive group in the test cohort (P � 0.0001)(Figure 2C), but were significantly decreased in theMTX-treated group compared to the MTX-naive groupin the validation cohort (P � 0.0001) (Figure 3C). Thisapparent discrepancy was explained by the fact that onlyone GART isoform was detected on the microarray,whereas both isoforms were captured by multiplex real-time PCR. Overall, the differential expression of folate-related genes showed that MTX is capable of suppress-ing the expression of these genes.
Table 2. PANTHER analysis of significantly differentially expressedgenes in pathways in the methotrexate (MTX)–treated group com-pared to the MTX-naive group of rheumatoid arthritis patients*
Pathway P
Up-regulated genes in MTX-treated vs.MTX-naive
Ras pathway 6.99 � 10�5
Unclassified 9.62 � 10�4
FGF signaling pathway 4.16 � 10�3
Parkinson’s disease 5.69 � 10�3
Ornithine degradation 8.03 � 10�3
Apoptosis signaling pathway 9.80 � 10�3
Angiogenesis 1.25 � 10�2
PI3K pathway 1.49 � 10�2
Alzheimer’s disease–amyloid secretase pathway 1.49 � 10�2
EGF receptor signaling pathway 1.88 � 10�2
Insulin/IGF pathway–MAP kinase kinase/MAP kinase cascade
2.07 � 10�2
Toll receptor signaling pathway 2.17 � 10�2
PDGF signaling pathway 2.70 � 10�2
Xanthine and guanine salvage pathway 2.94 � 10�2
p53 pathway 3.10 � 10�2
B cell activation 3.13 � 10�2
Huntington’s disease 3.75 � 10�2
TCA cycle 4.05 � 10�2
Cysteine biosynthesis 4.32 � 10�2
Alzheimer’s disease–presenilin pathway 4.75 � 10�2
Down-regulated genes in MTX-treated vs.MTX-naive
Unclassified 7.03 � 10�4
Inflammation mediated by chemokine andcytokine signaling pathway
1.42 � 10�3
p53 pathway by glucose deprivation 1.51 � 10�3
Integrin signaling pathway 5.14 � 10�3
Folate biosynthesis 7.56 � 10�3
Acetate utilization 1.70 � 10�2
VEGF signaling pathway 2.86 � 10�2
Formyltetrahydroformate biosynthesis 3.67 � 10�2
* FGF � fibroblast growth factor; PI3K � phosphatidylinositol 3-kinase; EGF � epidermal growth factor; IGF � insulin-like growthfactor; PDGF � platelet-derived growth factor; TCA � tricarboxylicacid; VEGF � vascular endothelial growth factor.
IMPACT OF MTX ON FOLATE PATHWAY GENES IN RA 2795
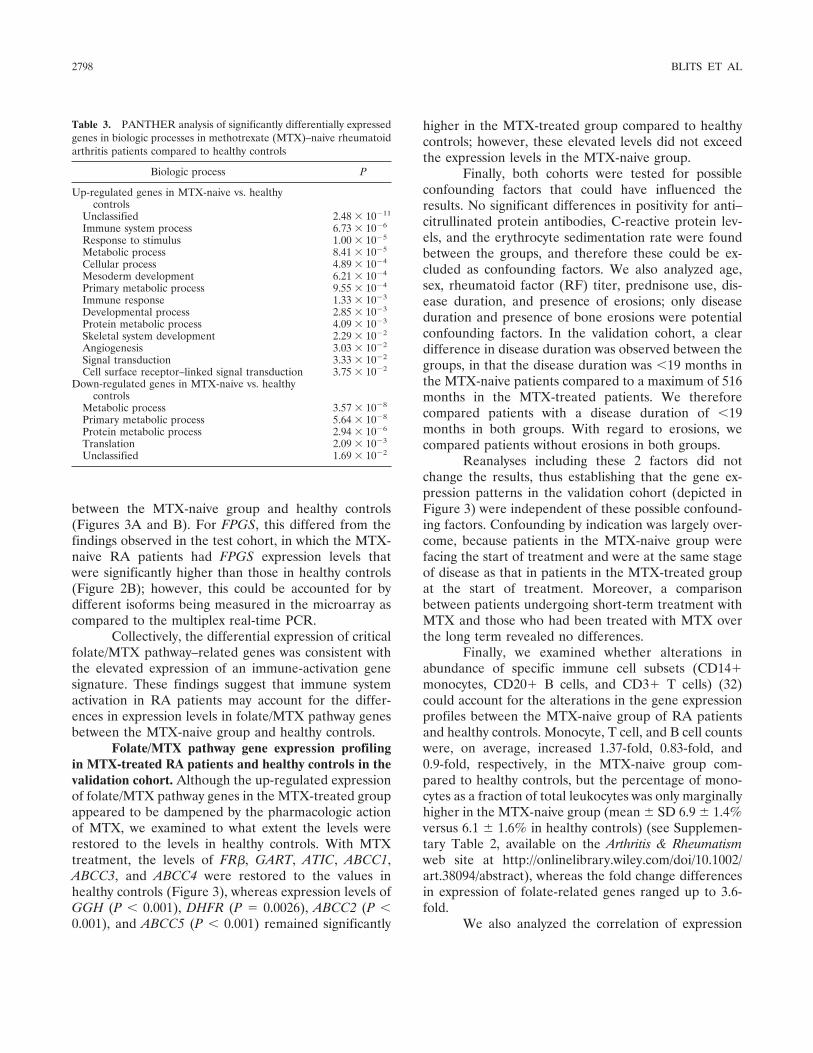
Folate/MTX pathway gene expression profilingin MTX-naive RA patients and healthy controls in thetest and validation cohorts. Next, folate/MTX pathwaygene expression profiling studies were extended to theMTX-naive RA patients and healthy controls. First,SAM analysis performed on microarray data from thetest cohort revealed 3,150 genes that were differentiallyexpressed between the MTX-naive group and healthycontrols, of which 1,553 were up-regulated and 1,597were down-regulated. PANTHER analysis of these dif-ferentially expressed genes revealed that several biologicprocesses involved in immune responses were signifi-cantly up-regulated in the MTX-naive group comparedto healthy controls; these included processes such asthe immune system response, response to stimuli, cellu-lar process, (primary) metabolic process, protein meta-
bolic process, angiogenesis, signal transduction, and cellsurface receptor–linked signal transduction (Table 3).This profile, together with the immune responses thatwere previously observed by our group (27), pointtoward the possibility that an immune-activation genesignature is acquired in MTX-naive RA patients.
Moreover, in the test cohort, the overall pictureemerged that folate pathway–related gene expressionlevels within the MTX-naive group were elevated com-pared to those in the healthy controls (Figures 2A–D). Asimilar pattern was observed in the validation cohort,even after stringent Bonferroni-Holm correction formultiple testing (Figures 3A–D).
These analyses showed that gene expressionlevels of the folate-metabolizing enzyme GGH (P �0.0001), folate-dependent enzymes DHFR (P � 0.0001)
Figure 2. Gene expression analysis of the test cohort. Gene expression of folate/MTX influx transporters (A), metabolizing enzymes (B),folate-dependent enzymes (C), and efflux transporters (D) was assessed in the MTX-naive group (MTX�) (n � 10) and MTX-treated group(MTX�) (n � 25) of rheumatoid arthritis patients compared to healthy controls (HCs) (n � 15). The original microarray template did not includeprobes for RFC, PCFT, MTHFR, and ATIC, and therefore these genes are not presented. Results are the log2-transformed relative expression data(RQ), relative to the values for GAPDH. Data are presented in box plots, where the boxes represent the 25th to 75th percentiles, the lines withinthe boxes represent the median, and the lines outside the boxes represent the 10th and 90th percentiles. � � P � 0.05; �� � P � 0.01; ��� � P �0.001. See Figure 1 for other definitions.
2796 BLITS ET AL
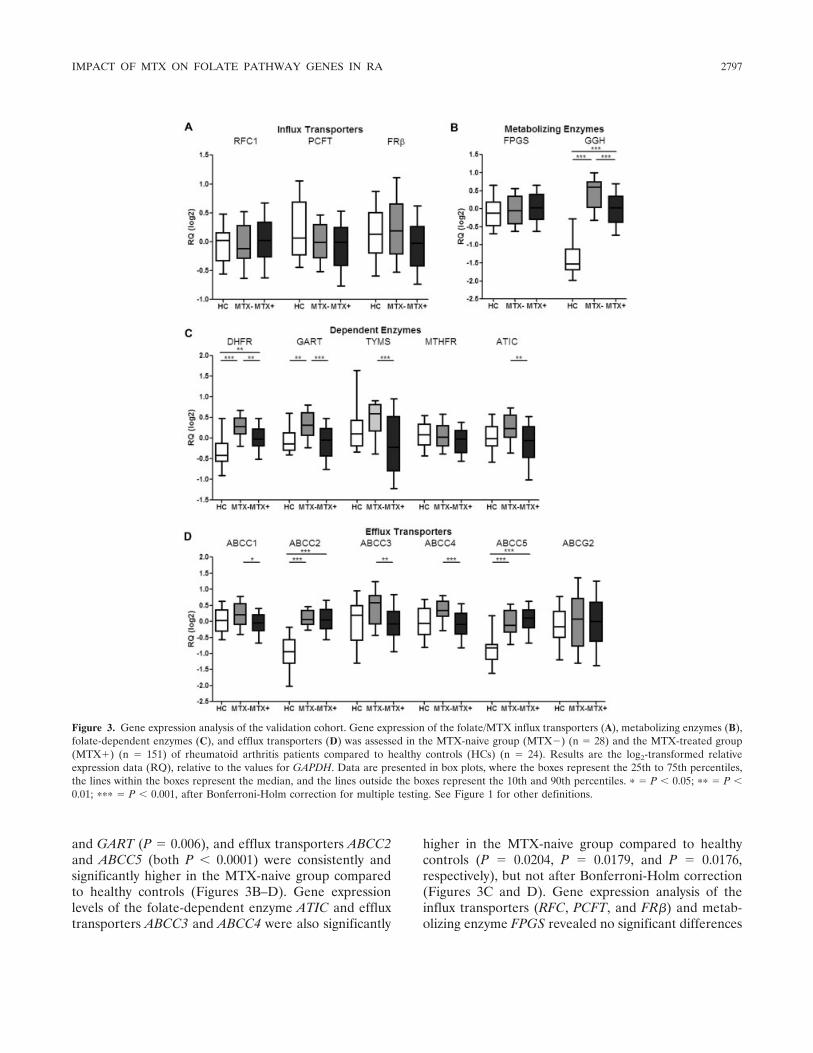
and GART (P � 0.006), and efflux transporters ABCC2and ABCC5 (both P � 0.0001) were consistently andsignificantly higher in the MTX-naive group comparedto healthy controls (Figures 3B–D). Gene expressionlevels of the folate-dependent enzyme ATIC and effluxtransporters ABCC3 and ABCC4 were also significantly
higher in the MTX-naive group compared to healthycontrols (P � 0.0204, P � 0.0179, and P � 0.0176,respectively), but not after Bonferroni-Holm correction(Figures 3C and D). Gene expression analysis of theinflux transporters (RFC, PCFT, and FR�) and metab-olizing enzyme FPGS revealed no significant differences
Figure 3. Gene expression analysis of the validation cohort. Gene expression of the folate/MTX influx transporters (A), metabolizing enzymes (B),folate-dependent enzymes (C), and efflux transporters (D) was assessed in the MTX-naive group (MTX�) (n � 28) and the MTX-treated group(MTX�) (n � 151) of rheumatoid arthritis patients compared to healthy controls (HCs) (n � 24). Results are the log2-transformed relativeexpression data (RQ), relative to the values for GAPDH. Data are presented in box plots, where the boxes represent the 25th to 75th percentiles,the lines within the boxes represent the median, and the lines outside the boxes represent the 10th and 90th percentiles. � � P � 0.05; �� � P �0.01; ��� � P � 0.001, after Bonferroni-Holm correction for multiple testing. See Figure 1 for other definitions.
IMPACT OF MTX ON FOLATE PATHWAY GENES IN RA 2797
between the MTX-naive group and healthy controls(Figures 3A and B). For FPGS, this differed from thefindings observed in the test cohort, in which the MTX-naive RA patients had FPGS expression levels thatwere significantly higher than those in healthy controls(Figure 2B); however, this could be accounted for bydifferent isoforms being measured in the microarray ascompared to the multiplex real-time PCR.
Collectively, the differential expression of criticalfolate/MTX pathway–related genes was consistent withthe elevated expression of an immune-activation genesignature. These findings suggest that immune systemactivation in RA patients may account for the differ-ences in expression levels in folate/MTX pathway genesbetween the MTX-naive group and healthy controls.
Folate/MTX pathway gene expression profilingin MTX-treated RA patients and healthy controls in thevalidation cohort. Although the up-regulated expressionof folate/MTX pathway genes in the MTX-treated groupappeared to be dampened by the pharmacologic actionof MTX, we examined to what extent the levels wererestored to the levels in healthy controls. With MTXtreatment, the levels of FR�, GART, ATIC, ABCC1,ABCC3, and ABCC4 were restored to the values inhealthy controls (Figure 3), whereas expression levels ofGGH (P � 0.001), DHFR (P � 0.0026), ABCC2 (P �0.001), and ABCC5 (P � 0.001) remained significantly
higher in the MTX-treated group compared to healthycontrols; however, these elevated levels did not exceedthe expression levels in the MTX-naive group.
Finally, both cohorts were tested for possibleconfounding factors that could have influenced theresults. No significant differences in positivity for anti–citrullinated protein antibodies, C-reactive protein lev-els, and the erythrocyte sedimentation rate were foundbetween the groups, and therefore these could be ex-cluded as confounding factors. We also analyzed age,sex, rheumatoid factor (RF) titer, prednisone use, dis-ease duration, and presence of erosions; only diseaseduration and presence of bone erosions were potentialconfounding factors. In the validation cohort, a cleardifference in disease duration was observed between thegroups, in that the disease duration was �19 months inthe MTX-naive patients compared to a maximum of 516months in the MTX-treated patients. We thereforecompared patients with a disease duration of �19months in both groups. With regard to erosions, wecompared patients without erosions in both groups.
Reanalyses including these 2 factors did notchange the results, thus establishing that the gene ex-pression patterns in the validation cohort (depicted inFigure 3) were independent of these possible confound-ing factors. Confounding by indication was largely over-come, because patients in the MTX-naive group werefacing the start of treatment and were at the same stageof disease as that in patients in the MTX-treated groupat the start of treatment. Moreover, a comparisonbetween patients undergoing short-term treatment withMTX and those who had been treated with MTX overthe long term revealed no differences.
Finally, we examined whether alterations inabundance of specific immune cell subsets (CD14�monocytes, CD20� B cells, and CD3� T cells) (32)could account for the alterations in the gene expressionprofiles between the MTX-naive group of RA patientsand healthy controls. Monocyte, T cell, and B cell countswere, on average, increased 1.37-fold, 0.83-fold, and0.9-fold, respectively, in the MTX-naive group com-pared to healthy controls, but the percentage of mono-cytes as a fraction of total leukocytes was only marginallyhigher in the MTX-naive group (mean � SD 6.9 � 1.4%versus 6.1 � 1.6% in healthy controls) (see Supplemen-tary Table 2, available on the Arthritis & Rheumatismweb site at http://onlinelibrary.wiley.com/doi/10.1002/art.38094/abstract), whereas the fold change differencesin expression of folate-related genes ranged up to 3.6-fold.
We also analyzed the correlation of expression
Table 3. PANTHER analysis of significantly differentially expressedgenes in biologic processes in methotrexate (MTX)–naive rheumatoidarthritis patients compared to healthy controls
Biologic process P
Up-regulated genes in MTX-naive vs. healthycontrols
Unclassified 2.48 � 10�11
Immune system process 6.73 � 10�6
Response to stimulus 1.00 � 10�5
Metabolic process 8.41 � 10�5
Cellular process 4.89 � 10�4
Mesoderm development 6.21 � 10�4
Primary metabolic process 9.55 � 10�4
Immune response 1.33 � 10�3
Developmental process 2.85 � 10�3
Protein metabolic process 4.09 � 10�3
Skeletal system development 2.29 � 10�2
Angiogenesis 3.03 � 10�2
Signal transduction 3.33 � 10�2
Cell surface receptor–linked signal transduction 3.75 � 10�2
Down-regulated genes in MTX-naive vs. healthycontrols
Metabolic process 3.57 � 10�8
Primary metabolic process 5.64 � 10�8
Protein metabolic process 2.94 � 10�6
Translation 2.09 � 10�3
Unclassified 1.69 � 10�2
2798 BLITS ET AL
levels of immune cell subset–specific genes and expres-sion of the most significantly differentially expressedfolate-related genes (i.e., GGH, DHFR, and ABCC3)between the MTX-naive and MTX-treated groups ofRA patients and healthy controls. Consistently, no cor-relation between the groups was found in the levels ofmonocyte gene expression and the differentially ex-pressed folate-related genes. With regard to expressionof other immune cell subset–specific transcript markers(CD3 and CD20), a random distribution of some corre-lations between the groups was observed (results shownin Supplementary Table 2, available on the Arthritis &Rheumatism web site at http://onlinelibrary.wiley.com/doi/10.1002/art.38094/abstract). Taken together, theseresults underscore the notion that changes in immunecell subsets are not associated with the expression pro-files of folate-related genes.
Collectively, in these 2 independent cohorts, aconsistent profile of increased expression of folate/MTXpathway genes was observed in MTX-naive RA patients,and these levels exceeded those in healthy controls.MTX treatment led to stabilization and suppression ofthe gene expression levels in RA patients, when com-pared to the levels in RA patients who had not receivedtreatment with MTX.
DISCUSSION
Microarray techniques have been successfullyapplied to identify gene expression signatures and rele-vant pathways involved in the pathophysiology of RA(27,33). In the current study, we quantified expressionlevels of folate/MTX pathway–related genes in the peri-pheral blood of RA patients (prior to and during MTXtreatment) and healthy control subjects in order toaddress 2 questions: 1) is the expression of these genesaltered during chronic inflammation?; and 2) what im-pact does MTX treatment have on the expression ofthese genes? Since these expression profiles included themajority of folate pathway–related genes, it could gen-erate an integrated picture of dynamic alterations infolate metabolism as a function of chronic inflammationand/or MTX treatment.
An important finding of the current study wasthat in blood cells of MTX-naive RA patients, expres-sion levels of multiple folate/MTX pathway–relatedgenes were significantly increased, whereas in MTX-treated patients, these expression levels were eitherretained or largely suppressed to the levels observed inhealthy controls. These findings were unrelated to themany possible confounding factors tested, including age,
sex, co-medication, confounding by indication, RF sero-positivity, disease duration, presence of bone erosions,and alterations in immune cell–type abundance, al-though an influence of residual confounding factorscannot be ruled out.
The finding of up-regulated expression of folate/MTX pathway–related genes under inflammatory con-ditions is compatible with evidence of an immune-activation program that did emerge from PANTHERpathway analysis of the microarray data. In this context,immune activation, with accompanying proliferation andlymphopoiesis, requires (folate-dependent) purine andpyrimidine de novo biosynthesis for increased nucleotidegeneration, occurring concomitant with up-regulatedexpression of the folate-dependent enzymes DHFR,GART, and ATIC. MTX could harbor the capacity tooffset the imbalance in homeostasis caused by theimmune activation in this chronic inflammatory disease.Consistently, part of the therapeutic effects of MTX maystem from suppression of proliferation and induction ofapoptosis in activated immune cells (11).
In accordance with the mode of action of MTX,pathway analysis revealed down-regulation of folate bio-synthesis and up-regulation of cysteine biosynthesis inthe MTX-treated patients compared to the MTX-naivepatients. The latter may be explained by the observationthat MTX diminishes the intracellular folate pool, whichgives rise to accumulation of potentially toxic levels ofhomocysteine. By converting homocysteine to cysteine,the cell has an escape route to prevent induction of celldeath (34).
Although pathway analysis involves multiple lev-els of complexity, and the results should be interpretedwith care, we and other investigators have successfullyapplied pathway analysis tools, such as PANTHERanalysis, to reveal biologically relevant processes, char-acterized by differentially expressed gene signatures(27,35). Herein, we applied PANTHER analysis toselect folate metabolism as a regulated process, whichwas further validated and extended by quantitative PCRanalysis of the originally identified genes and additionalbiologically related genes in an independent cohort.
Evaluation of alterations in expression of func-tionally related genes may provide additional informa-tion about the dynamic features of folate metabolismand homeostasis. When we examined the group offolate/MTX influx transporters, we found that expres-sion of RFC and PCFT was largely unchanged, andtherefore the functional capacity of these transportersmay not be a limiting factor in MTX uptake. FR� isexpressed particularly on activated macrophages, and
IMPACT OF MTX ON FOLATE PATHWAY GENES IN RA 2799
although FR� has a relatively low affinity for MTX(15,16), its reduced expression in MTX-treated patientscompared to MTX-naive patients may be a reflection ofthe MTX-induced suppression of macrophage activation.
Initially, one may have anticipated that expres-sion of FPGS, which has been implicated in the activa-tion of MTX to polyglutamate forms, could have playeda critical role in folate/MTX homeostasis in the bloodcells of RA patients. However, no significant differencesin expression were found between the groups. Neverthe-less, it should be mentioned that FPGS messenger RNA(mRNA) expression levels may not necessarily be indic-ative of FPGS catalytic activity, as FPGS pre-mRNA issubject to aberrant splicing, particularly under condi-tions of antifolate pressure (17). Remarkably, a promi-nent alteration observed was the increased GGH expres-sion in MTX-naive RA patients as compared to that inhealthy controls. In response to MTX treatment, GGHexpression was suppressed to levels that were in theintermediate range between those in MTX-naive pa-tients and those in healthy controls. Conceivably, GGHmay serve as a potential marker of the onset of inflam-matory processes and could be used to demonstrate asuccessful antiinflammatory response upon MTX treat-ment. In this context, GGH may regulate the increasedneed for folates by regulating cleavage of intracellularlystored folylpolyglutamate pools (5,18,36). MTX maysuppress this need and facilitate restoration of cellularfolate homeostasis. Given the notion that GGH is com-partmentalized in the lysosome, and folylpolyglutamatesreside in the cytoplasm and mitochondria (36), thisimplies that intercompartmental cross-talk may takeplace in folate homeostasis and the response to MTX.
ABC drug–efflux transporters have dual func-tions. From a pharmacologic perspective, they mayextrude a variety of cytotoxic drugs, including MTX, andthereby confer drug resistance (5,13,37), whereas phys-iologically, one important function is to secrete inflam-matory mediators, e.g., leukotrienes (38). As such, in-creased expression of ABC transporters in MTX-naiveRA patients as compared to that in healthy controlsmay be compatible with an inflammatory response. Inthis respect, it is of interest to note that upon MTXtreatment, expression levels of ABC transporters donot further increase, which would suggest that they haveno role in resistance development, but rather, the levelsdecrease, which is a possible indication of a genuineantiinflammatory effect.
Given its cross-sectional approach, the presentstudy was not designed to directly assess MTX-responsepredictions. Moreover, on a cautionary note, it is advised
that (clinical) MTX-response parameters should not beoverinterpreted in cross-sectional studies when com-pared to longitudinal studies (39). However, over thepast decade, multiple efforts have been made to buildMTX-response prediction models based on geneticvariants (single-nucleotide polymorphisms [SNPs]) offolate/MTX–related genes (22,24,40) or MTXGlu inRBCs (26,41,42). Although these studies showed prom-ising results, genetic associations were not always con-sistent (23) or could not be replicated in various inter-national cohorts (43). For most SNPs, their impact onthe functional activity of gene products is still unknown,and it remains to be determined whether they contributeindividually to sustaining folate homeostasis. RegardingMTXGlu formation, measurements in RBCs providevaluable information and are well accepted. However,RBCs do not represent the most ideal cell type, sincethey do not have a nucleus and intracellular organelles(and therefore lack lysosomal GGH activity) to controlfolate homeostasis, as white blood cells do. Therefore,a longitudinal cohort study combining analysis of geneexpression profiles, SNPs, and RBC MTXGlu would bemost revealing in identifying relevant parameters forMTX-response prediction studies.
Understanding the MTX response is relevantnot only in a monotherapy or DMARD-combinationsetting. It is also a crucial factor in a treatment setting ofcombination therapy with biologic agents such as inflix-imab, adalimumab, or etanercept (44,45), to achieve lessradiologic progression of damage in the joints (46).Based on our observations of a stabilization/decrease infolate/MTX pathway–related gene expression levels inthe MTX-treated group compared to the MTX-naivegroup, the results of the present study suggest that RApatients may have a sustained response to MTX therapy,even though they may be clinically classified as poorresponders eligible for biologic treatment. This wouldimply that clinical nonresponsiveness to MTX may beassociated with mechanisms downstream of the folate/MTX pathway (9,13). Moreover, one cannot exclude thepossibility that for a small fraction of RA patients with apoor response to MTX, classic mechanisms of acquiredresistance to MTX may still apply (5,13).
Finally, identification of differential expressionprofiles of folate-related genes in RA patients mayopen new avenues for therapeutic interventions beyonddrugs such as MTX. In fact, from a clinical oncologyperspective, many MTX analogs were designed to over-come MTX resistance (5). These next-generation anti-folate drugs have emerged from clinical application withknown efficacy and safety/toxicity profiles. For ex-
2800 BLITS ET AL
ample, these novel antifolate agents harbor properties ofmore efficient cellular uptake (via RFC, FR, or PCFT),polyglutamylation by FPGS, impaired efflux via ABCtransporters, and targeting of key enzymes in folatemetabolism (5,47,48). Expanding our knowledge of thedifferential expression levels of folate transporters invarious blood-cell types may also contribute to theirselective targeting. For example, FR� expression onsynovial macrophages has been exploited for selectivedelivery of antifolate drugs for which FR� has a highaffinity (16,49). Given the response profile for MTX,the present study results (as shown in Figure 3) couldsuggest that the folate-dependent enzyme GART (in-volved in de novo purine biosynthesis) may be anattractive drug target. Currently, several inhibitors ofthis enzyme are being evaluated in a (pre)clinical oncol-ogy setting (5,50). Whether these novel GART inhibitorscould elicit potential antiinflammatory responses re-mains to be established.
In conclusion, the current study identified re-markable differences in expression profiles of folate/MTX pathway–related genes in the peripheral bloodcells of MTX-treated RA patients compared to MTX-naive RA patients and healthy controls. The increasedimmune-activation status known to be present in pa-tients with RA paralleled the elevated expression levelsof these genes in MTX-naive RA patients compared tohealthy controls. The impact of MTX treatment on RAwas manifested in the stabilization and suppression ofthe folate/MTX pathway–related gene expression levels.This novel gene signature could provide additional in-sights into the mechanism of action of MTX, and thuspave the way to facilitate further exploration of MTXwith the aim of continually improving its pharmacologicproperties and efficacy.
ACKNOWLEDGMENTS
We extend our gratitude to the rheumatologists whoallowed inclusion of their patients in the present study. We alsothank Michiel Pegtel for his support.
AUTHOR CONTRIBUTIONS
All authors were involved in drafting the article or revising itcritically for important intellectual content, and all authors approvedthe final version to be published. Dr. Verweij had full access to all ofthe data in the study and takes responsibility for the integrity of thedata and the accuracy of the data analysis.Study conception and design. Blits, Jansen, Assaraf, Lems,Nurmohamed, van Schaardenburg, Verweij.Acquisition of data. Blits, Jansen, Nurmohamed, Voskuyl, Wolbink.Analysis and interpretation of data. Blits, Jansen, Assaraf,van de Wiel, Nurmohamed, Wolbink, Vosslamber, Verweij.
REFERENCES
1. Scott DL, Wolfe F, Huizinga TW. Rheumatoid arthritis. Lancet2010;376:1094–108.
2. McInnes IB, Schett G. The pathogenesis of rheumatoid arthritis.N Engl J Med 2011;365:2205–19.
3. Kremer JM. Toward a better understanding of methotrexate.Arthritis Rheum 2004;50:1370–82.
4. Smolen JS, Aletaha D, Koeller M, Weisman MH, Emery P. Newtherapies for treatment of rheumatoid arthritis. Lancet 2007;370:1861–74.
5. Gonen N, Assaraf YG. Antifolates in cancer therapy: structure,activity and mechanisms of drug resistance. Drug Resist Updat2012;15:183–210.
6. Bertino JR. Karnofsky memorial lecture: ode to methotrexate.J Clin Oncol 1993;11:5–14.
7. Cronstein BN. Low-dose methotrexate: a mainstay in the treat-ment of rheumatoid arthritis. Pharmacol Rev 2005;57:163–72.
8. Cutolo M, Sulli A, Pizzorni C, Seriolo B, Straub RH. Anti-inflammatory mechanisms of methotrexate in rheumatoid arthri-tis. Ann Rheum Dis 2001;60:729–35.
9. Spurlock CF III, Tossberg JT, Fuchs HA, Olsen NJ, Aune TM.Methotrexate increases expression of cell cycle checkpoint genesvia JNK activation. Arthritis Rheum 2012;64:1780–9.
10. Phillips DC, Woollard KJ, Griffiths HR. The anti-inflammatoryactions of methotrexate are critically dependent upon the produc-tion of reactive oxygen species. Br J Pharmacol 2003;138:501–11.
11. Genestier L, Paillot R, Fournel S, Ferraro C, Miossec P, RevillardJP. Immunosuppressive properties of methotrexate: apoptosis andclonal deletion of activated peripheral T cells. J Clin Invest1998;102:322–8.
12. Majumdar S, Aggarwal BB. Methotrexate suppresses NF-�B acti-vation through inhibition of I�B� phosphorylation and degrada-tion. J Immunol 2001;167:2911–20.
13. Van der Heijden JW, Dijkmans BA, Scheper RJ, Jansen G. Druginsight: resistance to methotrexate and other disease-modifyingantirheumatic drugs—from bench to bedside. Nat Clin PractRheumatol 2007;3:26–34.
14. Qiu A, Jansen M, Sakaris A, Min SH, Chattopadhyay S, Tsai E,et al. Identification of an intestinal folate transporter and themolecular basis for hereditary folate malabsorption. Cell 2006;127:917–28.
15. Nakashima-Matsushita N, Homma T, Yu S, Matsuda T, SunaharaN, Nakamura T, et al. Selective expression of folate receptor � andits possible role in methotrexate transport in synovial macrophagesfrom patients with rheumatoid arthritis. Arthritis Rheum 1999;42:1609–16.
16. Van der Heijden JW, Oerlemans R, Dijkmans BA, Qi H,van der Laken CJ, Lems WF, et al. Folate receptor � as a potentialdelivery route for novel folate antagonists to macrophages in thesynovial tissue of rheumatoid arthritis patients. Arthritis Rheum2009;60:12–21.
17. Stark M, Wichman C, Avivi I, Assaraf YG. Aberrant splicing offolylpolyglutamate synthetase as a novel mechanism of antifolateresistance in leukemia. Blood 2009;113:4362–9.
18. Rots MG, Pieters R, Peters GJ, Noordhuis P, van Zantwijk CH,Kaspers GJ, et al. Role of folylpolyglutamate synthetase andfolylpolyglutamate hydrolase in methotrexate accumulation andpolyglutamylation in childhood leukemia. Blood 1999;93:1677–83.
19. Baggott JE, Morgan SL, Vaughn WH. Differences in methotrex-ate and 7-hydroxymethotrexate inhibition of folate-dependentenzymes of purine nucleotide biosynthesis. Biochem J 1994;300:627–9.
20. Allegra CJ, Drake JC, Jolivet J, Chabner BA. Inhibition of phos-phoribosylaminoimidazolecarboxamide transformylase by metho-trexate and dihydrofolic acid polyglutamates. Proc Natl Acad SciU S A 1985;82:4881–5.
IMPACT OF MTX ON FOLATE PATHWAY GENES IN RA 2801
21. Hooijberg JH, Broxterman HJ, Kool M, Assaraf YG, Peters GJ,Noordhuis P, et al. Antifolate resistance mediated by the multi-drug resistance proteins MRP1 and MRP2. Cancer Res 1999;59:2532–5.
22. Wessels JA, van der Kooij SM, le Cessie S, Kievit W, Barerra P,Allaart CF, et al. A clinical pharmacogenetic model to predict theefficacy of methotrexate monotherapy in recent-onset rheumatoidarthritis. Arthritis Rheum 2007;56:1765–75.
23. Stamp LK, Roberts RL. Effect of genetic polymorphisms in thefolate pathway on methotrexate therapy in rheumatic diseases.Pharmacogenomics 2011;12:1449–63.
24. Fransen J, Kooloos WM, Wessels JA, Huizinga TW, GuchelaarHJ, van Riel PL, et al. Clinical pharmacogenetic model to predictresponse of MTX monotherapy in patients with established rheu-matoid arthritis after DMARD failure. Pharmacogenomics 2012;13:1087–94.
25. Dervieux T, Zablocki R, Kremer J. Red blood cell methotrexatepolyglutamates emerge as a function of dosage intensity and routeof administration during pulse methotrexate therapy in rheuma-toid arthritis. Rheumatology (Oxford) 2010;49:2337–45.
26. Stamp LK, O’Donnell JL, Chapman PT, Zhang M, James J,Frampton C, et al. Methotrexate polyglutamate concentrations arenot associated with disease control in rheumatoid arthritis patientsreceiving long-term methotrexate therapy. Arthritis Rheum 2010;62:359–68.
27. Van der Pouw Kraan TC, Wijbrandts CA, van Baarsen LG,Voskuyl AE, Rustenburg F, Baggen JM, et al. Rheumatoidarthritis subtypes identified by genomic profiling of peripheralblood cells: assignment of a type I interferon signature in asubpopulation of patients. Ann Rheum Dis 2007;66:1008–14.
28. Arnett FC, Edworthy SM, Bloch DA, McShane DJ, Fries JF,Cooper NS, et al. The American Rheumatism Association 1987revised criteria for the classification of rheumatoid arthritis.Arthritis Rheum 1988;31:315–24.
29. Chaussabel D, Pascual V, Banchereau J. Assessing the humanimmune system through blood transcriptomics. BMC Biol 2010;8:84.
30. Ball CA, Awad IA, Demeter J, Gollub J, Hebert JM, Hernandez-Boussard T, et al. The Stanford Microarray Database accommo-dates additional microarray platforms and data formats. NucleicAcids Res 2005;33:D580–2.
31. Tusher VG, Tibshirani R, Chu G. Significance analysis of micro-arrays applied to the ionizing radiation response. Proc Natl AcadSci U S A 2001;98:5116–21.
32. Batliwalla FM, Baechler EC, Xiao X, Li W, Balasubramanian S,Khalili H, et al. Peripheral blood gene expression profiling inrheumatoid arthritis. Genes Immun 2005;6:388–97.
33. Van Baarsen LG, Wijbrandts CA, Gerlag DM, Rustenburg F,van der Pouw Kraan TC, Dijkmans BA, et al. Pharmacogenomicsof infliximab treatment using peripheral blood cells of patientswith rheumatoid arthritis. Genes Immun 2010;11:622–9.
34. Mattson MP, Shea TB. Folate and homocysteine metabolism inneural plasticity and neurodegenerative disorders. Trends Neuro-sci 2003;26:137–46.
35. Viswanathan GA, Seto J, Patil S, Nudelman G, Sealfon SC.Getting started in biological pathway construction and analysis.PLoS Comput Biol 2008;4:e16.
36. Tibbetts AS, Appling DR. Compartmentalization of mammalianfolate-mediated one-carbon metabolism. Annu Rev Nutr 2010;30:57–81.
37. Van der Heijden JW, Oerlemans R, Tak PP, Assaraf YG, Kraan
MC, Scheffer GL, et al. Involvement of breast cancer resistanceprotein expression on rheumatoid arthritis synovial tissue macro-phages in resistance to methotrexate and leflunomide. ArthritisRheum 2009;60:669–77.
38. Van de Ven R, Oerlemans R, van der Heijden JW, Scheffer GL,de Gruijl TD, Jansen G, et al. ABC drug transporters andimmunity: novel therapeutic targets in autoimmunity and cancer.J Leukoc Biol 2009;86:1075–87.
39. De Rotte MC, Luime JJ, Bulatovic M, Hazes JM, Wulffraat NM,de Jonge R. Do snapshot statistics fool us in MTX pharmaco-genetic studies in arthritis research? Rheumatology (Oxford)2010;49:1200–1.
40. Owen SA, Hider SL, Martin P, Bruce IN, Barton A, Thomson W.Genetic polymorphisms in key methotrexate pathway genes areassociated with response to treatment in rheumatoid arthritispatients. Pharmacogenomics J 2013;13:227–34.
41. Dalrymple JM, Stamp LK, O’Donnell JL, Chapman PT, Zhang M,Barclay ML. Pharmacokinetics of oral methotrexate in patientswith rheumatoid arthritis. Arthritis Rheum 2008;58:3299–308.
42. Dervieux T, Furst D, Lein DO, Capps R, Smith K, Walsh M, et al.Polyglutamation of methotrexate with common polymorphisms inreduced folate carrier, aminoimidazole carboxamide ribonucleo-tide transformylase, and thymidylate synthase are associated withmethotrexate effects in rheumatoid arthritis. Arthritis Rheum2004;50:2766–74.
43. Dervieux T, Wessels JA, Kremer JM, Padyukov L, SeddighzadehM, Saevarsdottir S, et al. Patterns of interaction between geneticand nongenetic attributes and methotrexate efficacy in rheumatoidarthritis. Pharmacogenet Genomics 2012;22:1–9.
44. Burmester GR, Mariette X, Montecucco C, Monteagudo-Saez I,Malaise M, Tzioufas AG, et al. Adalimumab alone and in combi-nation with disease-modifying antirheumatic drugs for the treat-ment of rheumatoid arthritis in clinical practice: the Research inActive Rheumatoid Arthritis (ReAct) trial. Ann Rheum Dis2007;66:732–9.
45. Klareskog L, van der Heijde D, de Jager JP, Gough A, Kalden J,Malaise M, et al. Therapeutic effect of the combination ofetanercept and methotrexate compared with each treatment alonein patients with rheumatoid arthritis: double-blind randomisedcontrolled trial. Lancet 2004;363:675–81.
46. Emery P, Genovese MC, van Vollenhoven R, Sharp JT, Patra K,Sasso EH. Less radiographic progression with adalimumab plusmethotrexate versus methotrexate monotherapy across the spec-trum of clinical response in early rheumatoid arthritis. J Rheuma-tol 2009;36:1429–41.
47. Walling J. From methotrexate to pemetrexed and beyond: a reviewof the pharmacodynamic and clinical properties of antifolates.Invest New Drugs 2006;24:37–77.
48. Westerhof GR, Schornagel JH, Kathmann I, Jackman AL,Rosokowsky A, Forsch RA, et al. Carrier- and receptor-mediatedtransport of folate antagonists targeting folate-dependent en-zymes: correlates of molecular-structure and biological activity.Mol Pharmacol 1995;48:459–71.
49. Nagayoshi R, Nakamura M, Ijiri K, Yoshida H, Komiya S,Matsuyama T. LY309887, antifolate via the folate receptor sup-presses murine type II collagen-induced arthritis. Clin Exp Rheu-matol 2003;21:719–25.
50. Jansen G, Mauritz R, Kathmann I, Boritzki TJ, Peters GJ.Membrane transport properties and biological activity of stereo-isomers of glycinamide ribonucleotide formyltransferase (GARTF)inhibitors AG2032 and AG2034. Pteridines 2010;20:109–14.
2802 BLITS ET AL