Embed Size (px)
Citation preview

Astronomy&Astrophysics
A&A 624, A82 (2019)https://doi.org/10.1051/0004-6361/201833676© ESO 2019
Methylamine and other simple N-bearing species in the hot coresNGC 6334I MM1–3
Eva G. Bøgelund1, Brett A. McGuire2, Michiel R. Hogerheijde1,3,Ewine F. van Dishoeck1,4, and Niels F. W. Ligterink1,5
1 Leiden Observatory, Leiden University, PO Box 9513, 2300 RA Leiden, The Netherlandse-mail: [email protected]
2 National Radio Astronomy Observatory, 520 Edgemont Rd, Charlottesville, VA 22903, USA3 Anton Pannekoek Institute for Astronomy, University of Amsterdam, Science Park 904, 1098 XH Amsterdam, The Netherlands4 Max-Planck Institut für Extraterrestrische Physik, Giessenbachstr. 1, 85748 Garching, Germany5 Center for Space and Habitability (CSH), University of Bern, Sidlerstrasse 5, 3012 Bern, Switzerland
Received 19 June 2018 / Accepted 17 February 2019
ABSTRACT
Context. In the search for the building blocks of life, nitrogen-bearing molecules are of particular interest since nitrogen-containingbonds are essential for the linking of amino acids and ultimately the formation of larger biological structures. The elusive moleculemethylamine (CH3NH2) is thought to be a key pre-biotic species but has so far only been securely detected in the giant molecular cloudSagittarius B2.Aims. We identify CH3NH2 and other simple nitrogen-bearing species involved in the synthesis of biologically relevant moleculestowards three hot cores associated with the high-mass star-forming region NGC 6334I, located at a distance of 1.3 kpc. Column den-sity ratios are derived in order to investigate the relevance of the individual species as precursors of biotic molecules.Methods. High sensitivity, high angular and spectral resolution observations obtained with the Atacama Large Millimeter/submillimeter Array were used to study transitions of CH3NH2, CH2NH, NH2CHO, and the 13C- and 15N-methyl cyanide (CH3CN)isotopologues, detected towards NGC 6334I. Column densities are derived for each species assuming local thermodynamic equilib-rium and excitation temperatures in the range 220–340 K for CH3NH2, 70–110 K for the CH3CN isotopologues and 120–215 K forNH2CHO and CH2NH.Results. We report the first detections of CH3NH2 towards NGC 6334I with column density ratios with respect to CH3OH of5.9× 10−3, 1.5× 10⁻³ and 5.4× 10⁻⁴ for the three hot cores MM1, MM2, and MM3, respectively. These values are slightly lowerthan the values derived for Sagittarius B2 but higher by more than an order of magnitude as compared with the values derived for thelow-mass protostar IRAS 16293–2422B. The column density ratios of NH2CHO, 13CH3CN, and CH3C15N with respect to CH3OH are(1.5 – 1.9)× 10−4, (1.0 – 4.6)× 10−3 and (1.7 – 3.0)× 10−3 respectively. Lower limits of 5.2, 1.2, and 3.0 are reported for the CH3NH2to CH2NH column density ratio for MM1, MM2, and MM3 respectively. These limits are largely consistent with the values derived forSagittarius B2 and higher than those for IRAS 16293–2422B.Conclusions. The detections of CH3NH2 in the hot cores of NGC 6334I hint that CH3NH2 is generally common in the interstellarmedium, albeit that high-sensitivity observations are essential for the detection of the species. The good agreement between modelpredictions of CH3NH2 ratios and the observations towards NGC 6334I indicate a main formation pathway via radical recombinationon grain surfaces. This process may be stimulated further by high grain temperatures allowing a lager degree of radical mobility. Fur-ther observations with ALMA will help evaluate the degree to which CH3NH2 chemistry depends on the temperature of the grains inhigh- and low-mass star-forming regions respectively.
Key words. astrochemistry – methods: observational – stars: protostars – ISM: individual objects: NGC 6334I –submillimeter: ISM
1. Introduction
A number of molecular species that are recognised as pre-cursors to biologically relevant molecules have in recent yearsbeen identified in the interstellar medium (ISM). These so-called pre-biotic species (see Herbst & van Dishoeck 2009, andreferences therein) are involved in the formation of, for example,amino acids, the main constituents of proteins, and nucleobases,the fundamental components of DNA and RNA, and therebyconstitute the basis for the building blocks of life.
Among the pre-biotic molecules are the species methy-lamine (CH3NH2) and methanimine (CH2NH), the simplest pri-mary amine- (–NH2) and imine- (–C = N–) containing species,
respectively. Experiments in which interstellar ice analogues aresubjected to thermal processing or irradiation by UV photonshave shown that both CH3NH2 and CH2NH are involved in reac-tions that form amino acids, and have specifically been proven toengage in the synthesis of glycine (NH2CH2COOH), the smallestmember of the amino acid family (Holtom et al. 2005; Lee et al.2009; Bossa et al. 2009; Danger et al. 2011). The formation ofglycine within or upon the icy mantles of interstellar dust grainsis consistent with theoretical models by Garrod (2013) who traceand couple the gas-phase, grain-surface and bulk ice chemistryduring the formation of hot cores. In addition, the connectionbetween CH3NH2 and glycine has been established throughthe proposed formation of both these species from a common
Article published by EDP Sciences A82, page 1 of 19

A&A 624, A82 (2019)
set of precursors present in carbonaceous chondrite meteorites(Aponte et al. 2017) including carbon monoxide (CO), ammonia(NH3), hydrogen cyanide (HCN), and carbon dioxide (CO2).
Another example of a simple progenitor of biotic moleculesis formamide (NH2CHO), the simplest amide (–NH–(C = O)–),which has the same chemical structure as the peptide bonds thatlink amino acids and thereby form the backbone of larger pro-tein structures. NH2CHO has also been shown to be involved inthe formation of nucleobases and nucleobase analogues in pro-cesses which use minerals and metal oxides, including samplesof primitive meteoroids, as catalysts (Saladino et al. 2006, 2016;Kumar et al. 2014).
Lastly, due to its cyanide (–CN) group, the molecule methylcyanide (acetonitrile, CH3CN) is also of interest in relation tothe synthesis of pre-biotic molecules. This is due to the impor-tance of C–N bonds for the formation of peptide structures.Reactions involving cyanides, especially HCN and its deriva-tives, are therefore regarded as the foundation of the formationof complex structures such as proteins, lipids and nuclei acids(Matthews & Minard 2006; Patel et al. 2015). In addition,Goldman et al. (2010) propose that shock-induced C–N bondsdue to cometary impacts on the early Earth provide a poten-tial synthesis route for amino acids which is independent of thepre-existing atmospheric conditions and materials on the planet.In summary, continued observations and searches for CH3NH2,CH2NH, NH2CHO, CH3CN, and other pre-biotic species in theISM, as well as in solar system bodies, are of high interest inorder to establish the relevance of the respective species in con-nection to the emergence of life on Earth, and potentially onother (exo)planets and moons.
NH2CHO and CH3CN are routinely detected towards high-and low-mass hot cores (Cazaux et al. 2003; Bisschop et al. 2007;Kahane et al. 2013), and have in addition been identified towardsa number of comets (see review by Mumma & Charnley 2011),in particular the bright comet Hale–Bopp (e.g. Bockelée-Morvanet al. 1997; Remijan et al. 2008) and comet 67P/Churyumov-Gerasimenko (hereafter 67P), the target of ESA’s Rosetta mis-sion (Goesmann et al. 2015; Altwegg et al. 2017). In addition,CH3CN was the first complex organic molecule (COM) to alsobe detected in a protoplanetary disk (Öberg et al. 2015) andthereby became one of the few pre-biotic species whose pres-ence could be traced throughout all formation phases from theearliest stages of star formation to the last remnants in comets.
Despite the lack of firm detections of CH2NH in comets(Irvine et al. 1998; Crovisier et al. 2004), this species has alsobeen detected towards a variety of interstellar sources includinggiant molecular clouds (Dickens et al. 1997) and high- andlow-mass protostellar systems (Suzuki et al. 2016; Ligterinket al. 2018). In contrast to these detections, the structurallysimilar species CH3NH2 has proven to be an especially elusivemolecule and for a long time was only securely detected towardsthe high-mass source Sagittarius B2 (hereafter Sgr B2) locatedin the Galactic centre (e.g. Kaifu et al. 1974; Belloche et al.2013). Recently, the molecule was also detected towards thehot core G10.47 + 0.03 by Ohishi et al. (2017) who also report atentative detection towards NGC 6334I although the low signal-to-noise and variations in vLSR between transitions of the speciesmakes the detection unclear. A tentative detection was alsoreported towards Orion KL by Pagani et al. (2017). In addition,a series of non-detections have been reported towards a numberof high-mass young stellar objects (YSOs, Ligterink et al. 2015)and a very stringent upper limit has been set on the abundanceof the species in the low-mass Sun-like protostar IRAS 16293–2422B (Ligterink et al. 2018). Recently, the species has also
been detected in the coma of comet 67P (Altwegg et al. 2017).These detections (and upper limits) indicate a range of CH3NH2abundances with respect to CH3OH, with that of IRAS 16293–2422B being at least one to two orders of magnitude lower thanthe values derived for Sgr B2. The discrepancies between thedetections in Sgr B2 and the non-detections elsewhere has led tothe suggestion that formation pathways for CH3NH2 are not veryefficient and that they may depend strongly on the conditionswhich characterise the individual regions. Based on the detec-tions of CH3NH2 in Sgr B2 it has therefore been speculated thatthe presence of relatively high dust grain temperatures or strongradiation fields enhance CH3NH2 formation.
The formation of CH3NH2 is discussed in a number ofstudies. On interstellar dust grains, two main formation path-ways have been proposed: the first is a hydrogenation sequencestarting from hydrogen cyanide: HCN + 2H→ CH2NH + 2H→CH3NH2 (Theule et al. 2011). Although the efficiency of forma-tion via this pathway is ill constrained, the same hydrogenationmechanism has been used in glycine formation models to formthe intermediate CH2NH2 radical (Woon 2002). The second for-mation route involves radical recombination reactions betweena methyl (–CH3) and an amino group: CH3 + NH2 → CH3NH2.This pathway has been included in the astrochemical modelspresented by Garrod et al. (2008) as the main formation routefor CH3NH2. Experimentally, electron and photon irradiatedinterstellar ice analogues, consisting of CH4 and NH3, have beenshown to result in formation of CH3NH2 (Kim & Kaiser 2011;Förstel et al. 2017). Although in dark clouds, both CH3 and NH2can also result from H-addition to atomic C and N and thereforephotodissociation is not critical for the formation of the radicals.In the gas-phase, the radical-neutral reaction CH3 + NH3 →
CH3NH2 + H has been proposed to be the main CH3NH2formation route. This is based on the observational study ofSgr B2 conducted by Halfen et al. (2013) who also argue thatthe formation of CH3NH2 through successive hydrogenationof CH2NH is unlikely due to the large difference in rotationaltemperature, 44± 13 K in the case of CH2NH and 159± 30 Kin the case of CH3NH2, derived through rotational temperaturediagrams. This difference makes it unlikely that the moleculesoccupy the same regions thereby making CH2NH an unlikelysynthetic precursor of CH3NH2. A dominant gas-phase forma-tion route for CH2NH is also reported by Suzuki et al. (2016)although they note that hydrogenation of solid-phase CH2NHcan also form CH3NH2. Additional detections of CH3NH2 andrelated species, preferably towards a large number of differentsources, will therefore provide valuable information and helpdistinguish between formation routes and conditions requiredfor the formation of this species.
In this work, CH3NH2 along with other simple pre-bioticnitrogen-bearing species, in particular CH2NH, CH3CN, andNH2CHO, are studied towards three dense cores within the giantmolecular cloud complex NGC 6334. The NGC 6334 region,located in the constellation Scorpius in the southern hemisphere,is a very active high-mass star-forming region composed of sixsub-regions denoted I – V and I(N) (see review by Persi & Tapia2008, and references therein). Water and methanol (CH3OH)maser studies have placed the region at a mean distance of1.3 kpc from the Sun (Chibueze et al. 2014; Reid et al. 2014),equivalent to a galactocentric distance (dGC) of ∼7.02 kpc. Thefocus of this work is on the deeply embedded source NGC6334I which is located in the north-eastern part of the cloud.The morphology of this source has been studied in detail byBrogan et al. (2016) who identify a number of distinct peaksin the sub-millimetre continuum and assign these to individual
A82, page 2 of 19

E. G. Bøgelund et al.: Methylamine in the hot cores NGC 6334I MM1 – 3
high-mass star-forming systems. The region has a very richmolecular inventory as demonstrated by Zernickel et al. (2012)who identify a total of 46 molecular species towards NGC 6334Iincluding CH2NH, CH3CN, and NH2CHO but not CH3NH2.
This paper presents the first detection of CH3NH2 towardsNGC 6334I. The work is based on high sensitivity, high spectraland angular resolution data obtained with the Atacama LargeMillimeter/submillimeter Array (ALMA). Previous searches forCH3NH2 have, for the most part, been carried out with sin-gle dish telescopes, which are generally less sensitive whencompared with interferometric observations, and have thereforefocused mainly on the bright hot cores associated with the Galac-tic central region. With the unique sensitivity and resolvingpower of ALMA this is changing and the weak lines associ-ated with CH3NH2 can now be probed in regions away fromthe Galactic centre, such as NGC 6334I, as well as in low-masssystems (Ligterink et al. 2018).
The paper is structured in the following way: in Sect. 2the observations and analysis methodology are introduced.Section 3 presents the observed transitions of each of the stud-ied species and the model parameters used to reproduce the data.In Sect. 4 the derived column density ratios are discussed andcompared between the regions in NGC 6334I as well as to thevalues derived for other high- and low-mass objects. Finally, ourfindings are summarised in Sect. 5.
2. Observations and method
2.1. Observations
Observations of NGC 6334I were carried out with ALMA inCycle 3 on January 17, 2016 using the ALMA Band 7 receivers(covering the frequency range 275 – 373 GHz). Three spectralwindows centred around 301.2, 302.0, and 303.7 GHz covering atotal bandwidth of ∼3 GHz were obtained. The observations havespectral and angular resolutions of 1 km s−1 and ∼1′′ (equivalentto ∼1300 au at the distance of NGC 6334I) respectively. Thedata were interactively self-calibrated and continuum subtractedusing the most line-free channels. A detailed description of thisreduction procedure may be found in Brogan et al. (2016) andHunter et al. (2017) while a summary of all observing parametersare listed in Table 1 of McGuire et al. (2017). After calibrationthe data were corrected for primary beam attenuation.
2.2. Method
For the analysis of CH3NH2 and related species three spectra,extracted at different locations across the NGC 6334I region,are used. For consistency we use the same locations and nam-ing as in Bøgelund et al. (2018) and focus on the regionsMM1 II, MM2 I, and MM3 I. These regions are associatedwith each of the continuum sources MM1, MM2, and MM3making it possible to compare the abundances of the variousspecies across the three hot cores. Due to the greater lineswidths characterising the central part of the MM1 region and thebright continuum emission, which in some cases result in neg-ative features after continuum subtraction has been applied, weselect a region away from the main continuum peak where weakemission line features are more easily identified. The extractedspectra are the average of a 1.′′00× 0.′′74 region, equivalent tothe area of the synthesised beam. The coordinates of the cen-tral pixel of each of the regions are (J2000 17h20m53.371s,−35◦46′57.′′013), (J2000 17h20m53.165s, −35◦46′59.231′′) and(J2000 17h20m53.417s, −35◦47′00.′′697) for MM1 II, MM2 I,and MM3 I respectively. For each of the extracted spectra, the
17h20m53.6s 53.4s 53.2s 53.0s
-35°46'56"
58"
47'00"
02"
Right ascension (J2000)
Decli
natio
n(J2
000) MM1 II
MM2 I
MM3 I
1300 au0.1
0.2
0.3
0.40.50.60.70.80.91.0
2.0
3.0
4.05.0
Jy/b
eam
Fig. 1. 1 mm continuum image of the NGC 6334I region with the veloc-ity integrated intensity map of the 13CH3CN transition at 303.610 GHzoverlaid in grey contours (levels are [3, 20, 40, 60, 100, 150, 180]σwith σ= 0.07 Jy beam−1 km s−1). Pixels with values less than 1% ofthe peak intensity have been masked out. The locations at which spectrahave been extracted are marked for each region. The synthesised beam(∼1300× 962 au) is shown in the bottom left corner.
rms noise is calculated after careful identification of line-freechannels. These are ∼0.9 K (68 mJy beam−1) for MM1, ∼0.6 K(45 mJy beam−1) for MM2, and ∼0.04 K (3 mJy beam−1) forMM3. The difference in the estimated rms noise values reflectsthe large variations in brightness and line density over the threeregions. An overview of the NGC 6334 I region and the locationsat which spectra have been extracted is shown in Fig. 1.
In order to identify transitions of CH3NH2, CH2NH, CH3CN,and NH2CHO, as well as to constrain the column density andexcitation temperature of the species at each of the studied posi-tions, synthetic spectra are produced using the CASSIS1 lineanalysis software. The spectroscopic data for CH2NH and themethyl cyanide and formamide isotopologues are adopted fromthe JPL2 and CDMS3 molecular databases (CH2NH: Kirchhoffet al. 1973; 13CH3CN and CH3C15N: Müller et al. 2009 and ref-erences therein; NH2CHO and NH13
2 CHO: Kukolich & Nelson1971; Gardner et al. 1980; Blanco et al. 2006; Motiyenko et al.2012 and references therein). For CH3NH2, the spectroscopicdata are taken from Motiyenko et al. (2014). Assuming localthermodynamic equilibrium (LTE) and optically thin lines, syn-thetic spectra are constructed for each species. This is done byproviding CASSIS with a list of parameters including excitationtemperature, Tex (K), column density of the species, Ns (cm−2),source velocity, vLSR (km s−1), line width at FWHM (km s−1),and angular size of the emitting region, θs (′′), assumed to beequal to the size of the synthesised beam.
Excitation temperatures and column densities are determinedfor the detected species by creating grids of model spectra vary-ing Tex and Ns and identifying the model spectrum with theminimal χ2 as the best fit. The CASSIS software computes the χ2
value for each of the model spectra taking into account the rmsnoise of the observed spectrum and the calibration uncertainty
1 Centre d’Analyse Scientifique de Spectres Instrumentaux et Synthé-tiques; http://cassis.irap.omp.eu2 Jet Propulsion Laboratory (Pickett et al. 1998); http://spec.jpl.nasa.gov3 Cologne Database for Molecular Spectroscopy (Müller et al. 2001,2005; Endres et al. 2016); https://cdms.astro.uni-koeln.de/cdms/portal/
A82, page 3 of 19
A&A 624, A82 (2019)
010203040
CH3NH2
MM
1
05
101520
T B[K
]
MM
2
301.226 301.248 301.2700.0
0.5
1.0
1.5
301.404 301.426 301.448 301.631 301.653 301.675Frequency [GHz]
CH3NH2 Others
302.780 302.802 302.824 303.712 303.734 303.756
MM
3
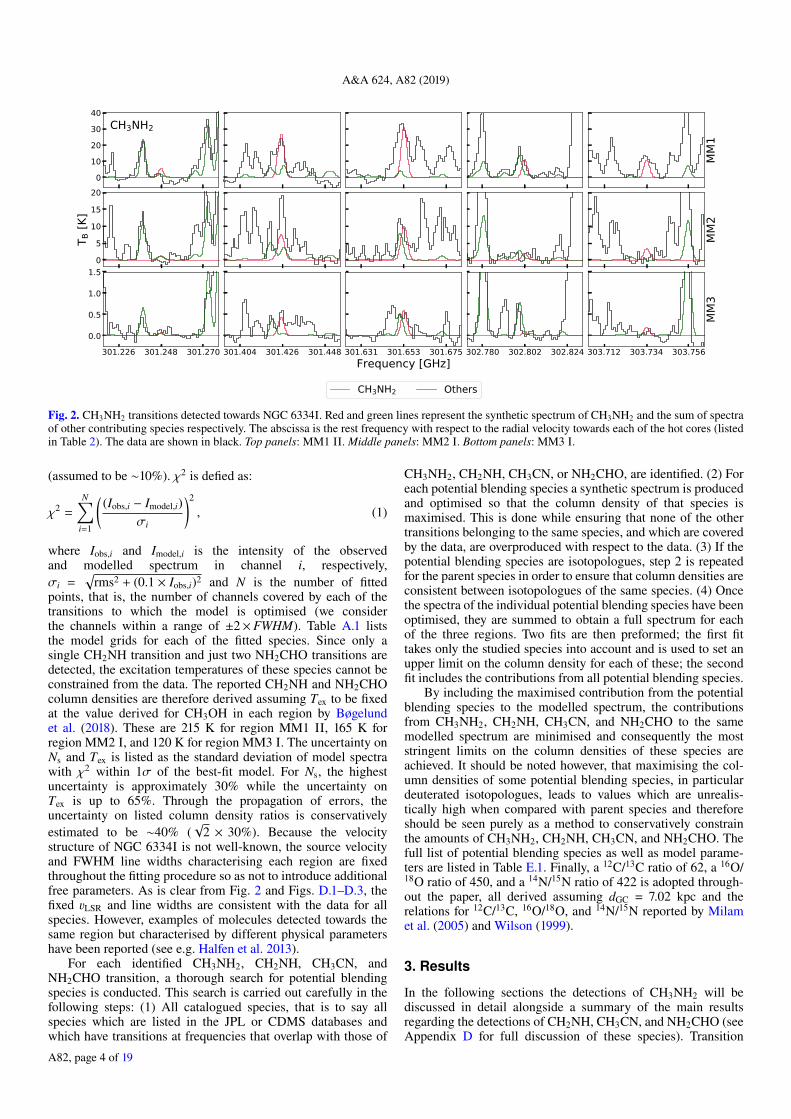
Fig. 2. CH3NH2 transitions detected towards NGC 6334I. Red and green lines represent the synthetic spectrum of CH3NH2 and the sum of spectraof other contributing species respectively. The abscissa is the rest frequency with respect to the radial velocity towards each of the hot cores (listedin Table 2). The data are shown in black. Top panels: MM1 II. Middle panels: MM2 I. Bottom panels: MM3 I.
(assumed to be ∼10%). χ2 is defied as:
χ2 =
N∑i=1
((Iobs,i − Imodel,i)
σi
)2
, (1)
where Iobs,i and Imodel,i is the intensity of the observedand modelled spectrum in channel i, respectively,σi =
√rms2 + (0.1 × Iobs,i)2 and N is the number of fitted
points, that is, the number of channels covered by each of thetransitions to which the model is optimised (we considerthe channels within a range of ±2×FWHM). Table A.1 liststhe model grids for each of the fitted species. Since only asingle CH2NH transition and just two NH2CHO transitions aredetected, the excitation temperatures of these species cannot beconstrained from the data. The reported CH2NH and NH2CHOcolumn densities are therefore derived assuming Tex to be fixedat the value derived for CH3OH in each region by Bøgelundet al. (2018). These are 215 K for region MM1 II, 165 K forregion MM2 I, and 120 K for region MM3 I. The uncertainty onNs and Tex is listed as the standard deviation of model spectrawith χ2 within 1σ of the best-fit model. For Ns, the highestuncertainty is approximately 30% while the uncertainty onTex is up to 65%. Through the propagation of errors, theuncertainty on listed column density ratios is conservativelyestimated to be ∼40% (
√2 × 30%). Because the velocity
structure of NGC 6334I is not well-known, the source velocityand FWHM line widths characterising each region are fixedthroughout the fitting procedure so as not to introduce additionalfree parameters. As is clear from Fig. 2 and Figs. D.1–D.3, thefixed vLSR and line widths are consistent with the data for allspecies. However, examples of molecules detected towards thesame region but characterised by different physical parametershave been reported (see e.g. Halfen et al. 2013).
For each identified CH3NH2, CH2NH, CH3CN, andNH2CHO transition, a thorough search for potential blendingspecies is conducted. This search is carried out carefully in thefollowing steps: (1) All catalogued species, that is to say allspecies which are listed in the JPL or CDMS databases andwhich have transitions at frequencies that overlap with those of
CH3NH2, CH2NH, CH3CN, or NH2CHO, are identified. (2) Foreach potential blending species a synthetic spectrum is producedand optimised so that the column density of that species ismaximised. This is done while ensuring that none of the othertransitions belonging to the same species, and which are coveredby the data, are overproduced with respect to the data. (3) If thepotential blending species are isotopologues, step 2 is repeatedfor the parent species in order to ensure that column densities areconsistent between isotopologues of the same species. (4) Oncethe spectra of the individual potential blending species have beenoptimised, they are summed to obtain a full spectrum for eachof the three regions. Two fits are then preformed; the first fittakes only the studied species into account and is used to set anupper limit on the column density for each of these; the secondfit includes the contributions from all potential blending species.
By including the maximised contribution from the potentialblending species to the modelled spectrum, the contributionsfrom CH3NH2, CH2NH, CH3CN, and NH2CHO to the samemodelled spectrum are minimised and consequently the moststringent limits on the column densities of these species areachieved. It should be noted however, that maximising the col-umn densities of some potential blending species, in particulardeuterated isotopologues, leads to values which are unrealis-tically high when compared with parent species and thereforeshould be seen purely as a method to conservatively constrainthe amounts of CH3NH2, CH2NH, CH3CN, and NH2CHO. Thefull list of potential blending species as well as model parame-ters are listed in Table E.1. Finally, a 12C/13C ratio of 62, a 16O/18O ratio of 450, and a 14N/15N ratio of 422 is adopted through-out the paper, all derived assuming dGC = 7.02 kpc and therelations for 12C/13C, 16O/18O, and 14N/15N reported by Milamet al. (2005) and Wilson (1999).
3. Results
In the following sections the detections of CH3NH2 will bediscussed in detail alongside a summary of the main resultsregarding the detections of CH2NH, CH3CN, and NH2CHO (seeAppendix D for full discussion of these species). Transition
A82, page 4 of 19

E. G. Bøgelund et al.: Methylamine in the hot cores NGC 6334I MM1 – 3
Table 1. Summary of lines.
Transition Catalogue frequency Eup Aij Catalogue
(QN)up(a) (QN)low
(a) (MHz) (K) ×10−5 (s−1)
CH2NH152,13 14 143,12 13 302 565.4318 408.72 6.61 JPL152,13 16 143,12 15 302 565.4883 408.72 6.64152,13 15 143,12 14 302 566.3219 408.72 6.61
CH3NH2(b)
16 2 A2 15 15 3 A1 14 301 247.6939 305.21 1.37 Motiyenko et al. (2014)16 2 A2 17 15 3 A1 16 301 247.7074 305.21 1.5516 2 A2 16 15 3 A1 16 301 247.9700 305.21 1.4613 2 B2 13 13 1 B1 13 301 424.0139 210.13 2.6913 2 B2 14 13 1 B1 14 301 425.6883 210.13 2.9013 2 B2 13 13 1 B1 12 301 425.8175 210.13 2.509 0 B2 8 8 1 B1 7 301 653.3284 95.93 2.689 0 B2 10 8 1 B1 9 301 653.4789 95.93 3.369 0 B2 9 8 1 B1 8 301 654.7988 95.93 3.00
16 7 B1 16 17 6 B2 17 302 801.6275 480.13 0.8316 7 B2 16 17 6 B1 17 302 801.6306 480.15 0.8316 7 B1 17 17 6 B2 18 302 801.7834 480.13 0.8816 7 B2 17 17 6 B1 18 302 801.7866 480.13 0.8816 7 B1 15 17 6 B2 16 302 801.7912 480.13 0.7816 7 B2 15 17 6 B1 16 302 801.7943 480.13 0.789 0 E2+1 8 8 1 E2+1 7 303 733.9183 96.20 2.639 0 E2+1 10 8 1 E2+1 9 303 734.0611 96.20 3.299 0 E2+1 9 8 1 E2+1 8 303 735.3214 96.20 2.94
13CH3CN175 165 303 518.8535 310.00 222 CDMS174 164 303 570.0991 245.64 230173 163 303 609.9710 195.57 236172 162 303 638.4820 159.80 240171 161 303 655.5770 138.33 243170 160 303 661.2780 131.18 243
CH3C15N174 164 303 187.8887 245.49 229173 163 303 227.9360 195.41 235172 162 303 256.5540 159.64 240171 161 303 273.7300 138.17 242170 160 303 279.4560 131.01 243
NH2CHO151,15 141,14 303 450.2040 120.01 205 CDMS141,13 131,12 303 660.5390 113.01 204
NH132 CHO
151,15 141,14 302 553.9861 119.61 203 CDMS141,13 131,12 303 111.8280 112.78 203
Notes. (a)Quantum numbers for CH2NH are JKa,Kc F. Quantum numbers for CH3NH2 are J Ka Γ F, following the notation of Motiyenko et al. (2014).Quantum numbers for 13CH3CN and CH3C15N are JK. Quantum numbers for NH2CHO and NH13
2 CHO are JKa,Kc. (b)Only lines with Aij > 10−6 s−1
are listed.
frequencies and line data for all species are listed in Table 1,while integrated line intensities of a select number of lines inthe observational data are listed in Table B.1. In the case ofCH3NH2, detected lines have Eup values ranging from 96 to480 K. For each of the studied regions and species the columndensity and excitation temperature of the best-fit synthetic spec-trum are derived. In Sect. 4 these values and their ratios withrespect to CH3OH and CH3NH2 will be compared between theindividual regions of NGC 6334I but also discussed in relationto those derived for other objects. The parameters of the best-fit models are listed in Table 2 and all transitions and modelled
spectra of CH3NH2 and other species are plotted in Fig. 2 andFigs. D.1–D.3 respectively.
3.1. Methylamine CH3NH2
For CH3NH2, five transitional features (all covering multiplehyperfine components) are identified towards NGC 6334I. Theseare plotted in Fig. 2. The CH3NH2 transitions are not isolatedlines but blended with transitions of other species. Neverthe-less, and despite the contributions from the potential blendingmolecules, it is evident that the data cannot be reproduced
A82, page 5 of 19

A&A 624, A82 (2019)
Table 2. Best-fit model parameters.
MM1 II MM2 I MM3 I
vLSR (km s−1) [−6.7] [−9.0] [−9.0]FWHM (km s−1) [3] [3.5] [3]θs (′′) [1] [1] [1]
Tex Ns Tex Ns Tex Ns(K) (cm−2) (K) (cm−2) (K) (cm−2)
CH2NH [215] ≤5.2× 10¹⁶ [165] ≤5.0× 10¹⁶ [120] ≤1015
CH3NH2 340± 60 (2.7± 0.4)× 1017 230± 30 (6.2± 0.9)× 1016 220± 30 (3.0± 0.6)× 1015
13CH3CN 70± 10 (3.4± 1.0)× 1015 80± 25 (1.4± 0.5)× 1015 90± 15 (9.0± 0.8)× 1013
CH3C15N 110± 50 (3.3± 0.5)× 1014 [80] (1.8± 0.4)× 1014 70± 45 (2.3± 0.7)× 1013
NH2CHO [215] (7.0± 1.7)× 1015 [165] (7.6± 0.8)× 1015 [120] ≤5.0× 10¹³
NH132 CHOa [215] ≤2.0× 10¹⁵ [165] ≤5.0× 10¹⁴ – –
Notes. Values in square brackets are fixed. Excitation temperatures for CH3NH2 and CH3CN are the values of the best-fit respective models whileTex for CH2NH and NH2CHO is fixed at the best-fit model value derived for CH3OH (Bøgelund et al. 2018). In the MM2 region, the excitationtemperature for CH3C15N is not well constrained and is therefore adopted from 13CH3CN. Listed uncertainties are the standard deviation of modelswith χ2 within 1σ of the best-fit model.
without including CH3NH2 in the model, especially for theMM1 II and MM3 I regions.
MM1 II. For MM1 II the CH3NH2 transitions are wellreproduced by a model with a column density of 2.7× 1017 cm−2
and an excitation temperature of 340 K. The uncertainty on eachof these values is less than 20%. For lower excitation tempera-tures, down to 100 K, the column density is consistent with thatderived for 340 K within a factor of approximately two. Thesame is true for Tex up to 500 K although for very low tem-peratures, down to 50 K, the column density can no longer bewell-constrained. Also, since the variation between the columndensity of the fit which only takes into account CH3NH2 andthe fit which includes all potential blending species is less then30%, we consider it very probable that the features in the spec-trum of this region are due to CH3NH2. The fact that the featurescannot be reproduced without including CH3NH2 in the modelmakes the detection even more convincing. Around the transitionlocated at 301.248 GHz, a slight negative offset in the baseline isseen. This is likely caused by continuum over-subtraction result-ing in a negatively displaced baseline which makes the modeltransition at this location appear brighter than the observed one.
MM2 I. The best-fit model for region MM2 I has a columndensity equal to 6.2× 1016 cm−2 and an excitation temperature of230 K. This model is optimised to fit all of the covered CH3NH2transitions, although only two of these, located at 301.426 and301.653 GHz, are considered fully detected. The remaining tran-sitions, located at 301.248, 302.802, and 303.734 GHz, are con-sidered tentative detections. This is because these transitions areblended with emission from other species (lines at 301.248 and302.802 GHz) or because no clear line is visible in the observedspectrum at the expected location (line at 303.734 GHz). Thetentative detections are included in the χ2 minimisation, as theyhelp constrain the best-fit model. For MM2, the uncertainty onNs and Tex is ∼15%. Varying the excitation temperature downto 50 and up to 500 K does not cause the value of the columndensity to change by more than a factor of two with respect tothe best-fit value derived at 230 K. In contrast to the CH3NH2features of MM1 II however, which are all well reproducedby the single-density, single-temperature model, the lines ofMM2 I are not. Particularly the line ratio of the transitions at
301.426 and 301.653 GHz is off and cannot be reproduced bythe model. Despite the fact that the upper state energy of thetransitions is fairly different, ∼210 K for the 301.426 GHz tran-sitions and ∼96 K for the 301.653 GHz transitions, introducing atwo-component model to account for a warm and cool emissionregion respectively, does not improve the fit. While the transitionat 301.653 GHz may be well reproduced by a model with an exci-tation temperature of ∼50 K, addition of any higher excitationtemperature-components to the model results in modelled lineintensities that vastly overshoot the transition at 301.653 GHzwith respect to the data while the intensity of the lines at301.426 GHz remains much weaker than the observed line. Thebehaviour of this last transition is especially puzzling since noneof the species included in either the JPL or CDMS catalogues areable to reproduce the observed data feature. One possible expla-nation is of course that the feature in the spectrum of MM2 Iis due to transitions of some unknown species (or unknowntransition of a known species) which is not included in the spec-troscopic databases. However, if that is the case, this unknownspecies is particular to the MM2 I region and does not signifi-cantly affect regions MM1 II and MM3 I where the respectiveCH3NH2 models correspond well with the observations.
The dissimilarity between the CH3NH2 model spectrum andthe observations could also indicate that the critical density forindividual transitions in the MM2 I region may not be reached,removing the region from LTE. Thus, a scenario in which thedensity of region MM2 is so low that the critical density of onetransition is reached, while that of another transition is not, couldexplain why the model predictions are not able to reproduce theCH3NH2 transitions at 301.425 and 301.655 GHz simultaneouslyin this region while the same lines are well-matched with thedata for regions MM1 and MM3. To test this hypothesis, thecollisional coefficients need to be known and the critical den-sities inferred for each of the transitions in question. However,since these numbers are not known for CH3NH2 we are unable tomake the comparison but can instead conclude that it is likelythat the MM2 region has a lower overall density as comparedwith the regions MM1 and MM3. A lower density of the MM2region with respect to the MM1 region is consistent with thefindings of Brogan et al. (2016), who estimate the dust massassociated with each of the hot cores based on their spectral
A82, page 6 of 19

E. G. Bøgelund et al.: Methylamine in the hot cores NGC 6334I MM1 – 3
energy distribution. As in the case of MM1 II, the CH3NH2 fea-tures cannot be reproduced satisfactory by any other species andtherefore we conclude that CH3NH2 is likely to be present in theregion despite the inadequacy of the model to fully reproducethe data.
MM3 I. For MM3 I the best-fit column density andexcitation temperature values are 3.0× 1015 cm−2 and 220 Krespectively. The uncertainty on these values is ∼35% for Texand 20% for Ns. For fixed excitation temperatures down to 50 Kand up to 500 K, the CH3NH2 column density remains withina factor of two of the best-fit value at 220 K. The value of thecolumn density of the best-fit model does not change whenthe contributions from other species are included in the fit. Asin the case of the MM1 region, the good agreement betweenthe CH3NH2 model and data, especially around the transitionsat 301.426 and 301.653 GHz, makes the presence of CH3NH2in this region very convincing. Due to blending with otherspecies at the location of the CH3NH2 transitions at 301.248 and302.802 GHz, we consider these as tentative detections only. Inthe case of the transition located at 303.734 GHz, a weak linefeature is present in the observed spectrum although not at theexact same location as predicted in the model spectrum. Thistransition is therefore also considered a tentative detection. Asin the case of MM2 I, the tentative detections are included whenthe model spectra are optimised.
In summary, CH3NH2 is securely detected towards boththe MM1 and MM3 regions while the detection towards MM2is slightly less clear. The uncertainty on the CH3NH2 columndensities is between 15 and 20%. Despite the local variations,the overall uniformity of CH3NH2 makes it likely that its originis the same throughout the NGC 6334I region. In addition to thedata presented here, we included in Appendix C a confirmationof the presence of CH3NH2 in NGC 6334I based on ALMABand 10 observations from McGuire et al. (2018). However, dueto the difference in angular resolution and extraction location,these data probe different excitation conditions and differentpopulations of gas and therefore cannot be compared directlywith the Band 7 observations discussed above. The Band 10spectrum and modelled CH3NH2 transitions shown in Fig. C.1and listed in Table C.1 are therefore included as proof of thepresence of CH3NH2 in NGC 6334I but will not be discussedfurther here. A detailed analysis of the Band 10 data is presentedby McGuire et al. (2018).
3.2. Summary of results on methanimine, methyl cyanide andformamide
A single (hyperfine-split) transition of CH2NH is covered bythe data and consequently no excitation temperature can bederived for this species. In addition, the transition is blendedwith CH3OCHO and the column density of CH2NH is thereforereported as an upper limit for each of the studied regions. Incontrast, a total of eleven transitions belonging to the 13C- and15N-methyl cyanide isotopologues are detected towardsNGC 6334I. Six of these belong to 13CH3CN and five toCH3C15N. Although some transitions are blended, both isotopo-logues are clearly detected towards all of the studied regions.The uncertainty on the derived column densities of 13CH3CNand CH3C15N is up to 30% while the uncertainty on the derivedexcitation temperatures is up to 65%. In the case of MM2, theexcitation temperature for CH3C15N could not be constrainedand therefore the column density of this species is derivedassuming Tex to be the same as for 13CH3CN. As in the case ofCH2NH, no excitation temperature can be derived for NH2CHO
since only two of the 18 transitions of this species covered by thedata are bright enough to be detected and these represent a verylimited range of upper state energies, with a difference betweenthe two of less than 10 K. In the case of the regions MM1 II andMM2 I, the features in the data at the location of the NH2CHOtransitions cannot be reproduced by any other species includedin either the JPL or the CDMS catalogues. In contrast, thefeatures detected towards the MM3 I region, may be reproducedby other species and the detection of NH2CHO towards thisregion is therefore considered tentative. The uncertainty on thecolumn density of NH2CHO towards MM1 II and MM2 I isless than 25%. The full discussion of the detections of CH2NH,CH3CN, and NH2CHO can be found in Appendix D.
4. Discussion
In this section, the column densities and excitation tempera-tures discussed above will be compared with the predictions ofthe chemical models of Garrod (2013) as well as to the val-ues derived towards a number of other sources including thehigh-mass star-forming regions Sgr B2 and Orion KL, the low-mass protostar IRAS 16293–2422B, and the comet 67P. In orderto do this, column density ratios for each of the studied specieswith respect to CH3OH are derived, these are given in Table 3.CH3OH is chosen as a reference because it is one of the mostabundant COMs in the ISM and therefore has been studiedcomprehensively, also in NGC 6334I (Bøgelund et al. 2018).Secondly, in order to investigate the relation between the stud-ied species, column density ratios of CH3NH2 with respect toCH2NH, NH2CHO, and CH3CN are derived, these are given inTable 4. Figures 3 and 4 summarise all ratios. In the followingsections the results on CH3NH2 and on the other species will bediscussed separately.
4.1. Methylamine towards NGC 6334I
The detection of CH3NH2 in the hot cores of NGC 6334Ipresented here, combined with recent (tentative) detections byPagani et al. (2017) towards Orion KL and Ohishi et al. (2017)towards a few high-mass objects, indicate that this molecule ismore common and abundant than previously thought (see forexample the upper limits on the species presented by Ligterinket al. 2015). In this case, the “lacking” CH3NH2-detectionsare more likely explained by observational biases, for examplethe large partition function of CH3NH2 resulting in relativelyweaker transitions of this species as compared with, for exam-ple, NH2CHO, rather than actual chemical variations betweenobjects.
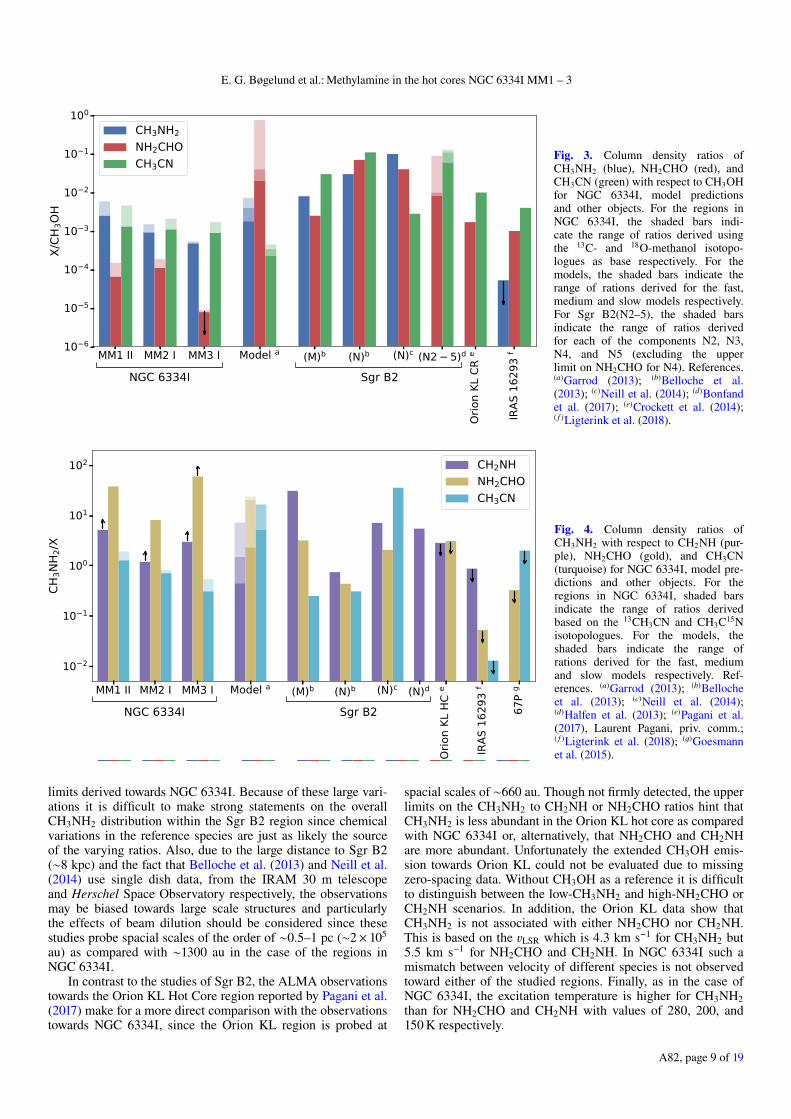
Within the regions of NGC 6334I, the CH3NH2 abundance isfairly uniform and column density ratios with respect to CH3OHand CH3CN show variations within factors of four and twobetween regions MM1 and MM2 and up to an order of mag-nitude between regions MM1 and MM3. The variation over thecolumn density ratios derived using the 13C- and 18O-methanoliosotopologues as a reference vary with a factor of three, whilethe ratios derived based on the 13C- and 15N-methyl cyanide iso-topologues vary with a factor of two. In the case of the CH3NH2to NH2CHO ratio, the variation is a factor of seven if all threeregions are considered and less than a factor of five betweenregions MM1 II and MM2 I. This is due to the relatively lowcolumn density of NH2CHO in MM3 I as compared with regionsMM1 II and MM2 I. Similarly, the variation of the CH3NH2 toCH2NH column density ratio over the three regions is within afactor of four, though the single CH2NH line covered by the datameans that these ratios should be seen as lower limits.
A82, page 7 of 19

A&A 624, A82 (2019)
Table 3. Column density ratios with CH3OH as reference.
CH3NH2/CH3OH NH2CHO/CH3OH CH3CN/CH3OH References13CH3CN CH3C15N
CH3OH reference 13C 18O 13C 18O 13C 18O 13C 18O
MM1 II 5.9× 10⁻³ 2.5× 10⁻³ 1.5× 10⁻⁴ 6.5× 10⁻⁵ 4.6× 10⁻³ 2.0× 10⁻³ 3.0× 10⁻³ 1.3× 10⁻³ This workMM2 I 1.5× 10⁻³ 9.2× 10⁻⁴ 1.9× 10⁻⁴ 1.1× 10⁻⁴ 2.1× 10⁻³ 1.3× 10⁻³ 1.9× 10⁻³ 1.1× 10⁻³ This workMM3 I 5.4× 10⁻⁴ 4.8× 10⁻⁴ ≤9.0× 10⁻⁶ ≤7.9×10⁻⁶ 1.0× 10⁻³ 8.9× 10⁻⁴ 1.7× 10⁻³ 1.5× 10⁻³ This work
Model F 7.3× 10⁻³ 0.04 4.5× 10⁻⁴ 1Model M 4.0× 10⁻³ 0.02 2.3× 10⁻⁴ 1Model S 1.8× 10⁻³ 0.76 3.4× 10⁻⁴ 1
Sgr B2(M) 8.0× 10⁻³ 2.5× 10⁻³ 0.03 2Sgr B2(N) 0.03 0.07 0.11 2Sgr B2(N) 0.10 0.04 2.8× 10⁻³ 3Sgr B2(N2–5) (a) – 8.3× 10⁻³ – 0.09 (b) 0.06 – 0.13 4Orion KL Compact Ridge – 1.7× 10⁻³ 0.01 5
IRAS 16293–2422B ≤5.3× 10⁻⁵ 10−3 4× 10⁻³ 6, 7, 8, 9
Notes. The uncertainty on the column density ratios derived towards NGC 6334 I is estimated to be 40% (see Sect. 2). (a)Range of values derivedfor the cores N2, N3, N4, and N5. (b)Excluding the upper limit on NH2CHO for N4.References. (1) Garrod (2013); (2) Belloche et al. (2013); (3) Neill et al. (2014); (4) Bonfand et al. (2017); (5) Crockett et al. (2014); (6) Coutenset al. (2016); (7) Ligterink et al. (2018); (8) Jørgensen et al. (2018); (9) Calcutt et al. (2018).
Table 4. CH3NH2 column density ratios.
CH3NH2/CH2NH CH3NH2/NH2CHO CH3NH2/CH3CN References
CH3CN reference 13C 15N
MM1 II ≥5.2 38 1.28 1.94 This workMM2 I ≥1.2 8.16 0.71 0.70 This workMM3 I ≥3.0 ≥60 0.54 0.31 This work
Model F 7.27 20.5 16.3 1Model M 1.5 24 17.1 1Model S 0.45 2.34 5.23 1
Sgr B2(M) 31 (a) 3.21 0.25 2Sgr B2(N) 0.75 0.44 0.31 2Sgr B2(N) 7.14 2.08 35.7 3Sgr B2(N) 5.49 – – 4Orion KL Hot Core ≤2.86 ≤3.13 – 5
IRAS 16293–2422B ≤0.88 ≤0.053 ≤0.013 6, 7
Comet 67P (b) – ≤0.33 ≤2 8
Notes. The uncertainty on the column density ratios derived towards NGC 6334 I is estimated to be 40% (see Sect. 2). (a)Extended CH2NHemission. (b)Listed as upper limits based on the discussion in Sect. 2.4 of Altwegg et al. (2017).References. (1) Garrod (2013); (2) Belloche et al. (2013); (3) Neill et al. (2014); (4) Halfen et al. (2013); (5) Pagani et al. (2017), Laurent Pagani,priv. comm.; (6) Calcutt et al. (2018); (7) Ligterink et al. (2018); (8) Goesmann et al. (2015).
Although the variations in the column density of CH3NH2over the studied regions are similar to those of CH3OH andCH3CN, the CH3NH2 excitation temperatures are higher thanfor any of the other species. This trend is most pronounced inthe case of MM1. A relatively higher excitation temperature ofCH3NH2 compared with other species is consistent with thefindings of Halfen et al. (2013).
4.2. Methylamine towards other objects
Compared with the CH3NH2 to CH3OH ratios derived byBelloche et al. (2013) and Neill et al. (2014) towards Sgr B2
(M) and (N), the values inferred for the regions in NGC 6334Iare lower by up to two orders of magnitude, though the valuederived for Sgr B2 (M) is only higher by a factor of three whencompared with the value derived for MM1. For the CH3NH2 toNH2CHO, CH3CN, and CH2NH ratios the picture is less clear;while the CH3NH2/NH2CHO values derived towards Sgr B2are all about an order of magnitude lower than those derivedtowards NGC 6334I, the CH3NH2/CH3CN value derived byNeill et al. (2014) is higher by more than an order of magni-tude while the values derived by Belloche et al. (2013) are lowerby up to a factor of six. In the case of CH3NH2/CH2NH, allbut one of the values towards Sgr B2 are higher than the lower
A82, page 8 of 19
E. G. Bøgelund et al.: Methylamine in the hot cores NGC 6334I MM1 – 3
MM1 II MM2 I MM3 I Model a (M)b (N)b (N)c (N2 5)d
Orio
nKL
CRe
IRAS
1629
3f10 6
10 5
10 4
10 3
10 2
10 1
100
X/CH
3OH
NGC 6334I Sgr B2
CH3NH2NH2CHOCH3CN Fig. 3. Column density ratios of
CH3NH2 (blue), NH2CHO (red), andCH3CN (green) with respect to CH3OHfor NGC 6334I, model predictionsand other objects. For the regions inNGC 6334I, the shaded bars indi-cate the range of ratios derived usingthe 13C- and 18O-methanol isotopo-logues as base respectively. For themodels, the shaded bars indicate therange of rations derived for the fast,medium and slow models respectively.For Sgr B2(N2–5), the shaded barsindicate the range of ratios derivedfor each of the components N2, N3,N4, and N5 (excluding the upperlimit on NH2CHO for N4). References.(a)Garrod (2013); (b)Belloche et al.(2013); (c)Neill et al. (2014); (d)Bonfandet al. (2017); (e)Crockett et al. (2014);( f )Ligterink et al. (2018).
MM1 II MM2 I MM3 I Model a (M)b (N)b (N)c (N)d
Orio
nKL
HCe
IRAS
1629
3f
67P
g
10 2
10 1
100
101
102
CH3N
H 2/X
NGC 6334I Sgr B2
CH2NHNH2CHOCH3CN
Fig. 4. Column density ratios ofCH3NH2 with respect to CH2NH (pur-ple), NH2CHO (gold), and CH3CN(turquoise) for NGC 6334I, model pre-dictions and other objects. For theregions in NGC 6334I, shaded barsindicate the range of ratios derivedbased on the 13CH3CN and CH3C15Nisotopologues. For the models, theshaded bars indicate the range ofrations derived for the fast, mediumand slow models respectively. Ref-erences. (a)Garrod (2013); (b)Bellocheet al. (2013); (c)Neill et al. (2014);(d)Halfen et al. (2013); (e)Pagani et al.(2017), Laurent Pagani, priv. comm.;( f )Ligterink et al. (2018); (g)Goesmannet al. (2015).
limits derived towards NGC 6334I. Because of these large vari-ations it is difficult to make strong statements on the overallCH3NH2 distribution within the Sgr B2 region since chemicalvariations in the reference species are just as likely the sourceof the varying ratios. Also, due to the large distance to Sgr B2(∼8 kpc) and the fact that Belloche et al. (2013) and Neill et al.(2014) use single dish data, from the IRAM 30 m telescopeand Herschel Space Observatory respectively, the observationsmay be biased towards large scale structures and particularlythe effects of beam dilution should be considered since thesestudies probe spacial scales of the order of ∼0.5–1 pc (∼2× 10⁵
au) as compared with ∼1300 au in the case of the regions inNGC 6334I.
In contrast to the studies of Sgr B2, the ALMA observationstowards the Orion KL Hot Core region reported by Pagani et al.(2017) make for a more direct comparison with the observationstowards NGC 6334I, since the Orion KL region is probed at
spacial scales of ∼660 au. Though not firmly detected, the upperlimits on the CH3NH2 to CH2NH or NH2CHO ratios hint thatCH3NH2 is less abundant in the Orion KL hot core as comparedwith NGC 6334I or, alternatively, that NH2CHO and CH2NHare more abundant. Unfortunately the extended CH3OH emis-sion towards Orion KL could not be evaluated due to missingzero-spacing data. Without CH3OH as a reference it is difficultto distinguish between the low-CH3NH2 and high-NH2CHO orCH2NH scenarios. In addition, the Orion KL data show thatCH3NH2 is not associated with either NH2CHO nor CH2NH.This is based on the vLSR which is 4.3 km s−1 for CH3NH2 but5.5 km s−1 for NH2CHO and CH2NH. In NGC 6334I such amismatch between velocity of different species is not observedtoward either of the studied regions. Finally, as in the case ofNGC 6334I, the excitation temperature is higher for CH3NH2than for NH2CHO and CH2NH with values of 280, 200, and150 K respectively.
A82, page 9 of 19

A&A 624, A82 (2019)
The lowest CH3NH2 ratios are observed towards the low-mass protostar IRAS 16293–2422B, an analogue to the youngSun, where a deep upper limit on the column density of CH3NH2was inferred by Ligterink et al. (2018), based on the ALMAPILS survey (see Jørgensen et al. 2016, for full PILS overview)probing spacial scales of ∼60 au. This upper limit results inratios with respect to CH3OH, NH2CHO, and CH3CN whichare all lower by one to two orders of magnitude when comparedwith the lowest ratios derived towards NGC 6334I. The smallestvariation between NGC 6334I and IRAS 16293–2422B is seenin the CH3NH2 to CH2NH ratio where the value derived forIRAS 16293–2422B is within the uncertainty of value derivedfor the MM2 I region but lower by up to a factor of six comparedwith the regions MM1 II and MM3 I. These differences inratios hint that the formation of CH3NH2 in the high-mass hotcores of NGC 6334I differ from the formation of CH3NH2 inthe low-mass IRAS 16293–2422B protostar. An explanation forthis difference could be the dust grain temperature. Based onthe low levels of CH3OH deuteration in NGC 6334I, Bøgelundet al. (2018) determine a relatively warm dust grain temperatureof ∼30 K during the time of CH3OH formation. In contrast,the dust grains in the cloud from which the IRAS 16293–2422protobinary system formed are thought to have been muchcooler, with temperatures below 20 K (Jørgensen et al. 2016). Athigh grain temperatures the solid-state formation of CH3NH2via CH3 + NH2 could be enhanced, due to increased mobility ofthe radicals or the loss of H-atoms, which at lower temperatureswould hydrogenate these radicals to form the neutral speciesCH4 and NH3.
Additional indications for a grain surface formation routeare found in the chemical models presented by Garrod (2013).These models evaluate the chemical evolution of high-mass hotcores as these evolve through infall and warm-up phases. Thephysical model adopted by Garrod (2013) consists of a collapsephase followed by a gradual warm-up of the gas and dust. Forthe warm-up phase, three timescales are adopted: a “fast” scalereaching 200 K in 5× 10⁴ yr, a “medium” scale reaching 200 Kin 2× 10⁵ yr, and a “slow” scale reaching 200 K in 1× 10⁶ yr.Listed in Tables 3 and 4 are the predicted peak gas-phase abun-dance ratios for each of these models. In the models, CH3NH2is formed predominantly via CH3 and NH2 radical recombina-tion reactions on the grain surface. Since the predicted CH3NH2ratios are quite similar to the ratios derived for the regionsin NGC 6334I, and for most species agree within a factor offive, a solid state formation pathway for CH3NH2 seems likely.However, since the models are not optimised to the physicalconditions of the hot cores of NGC 6334 I but rather generalconditions found in hot cores, the comparison between observedand modelled column density ratios should only be consideredas indicative of trends.
4.3. Comparison with comet 67P
In an effort to understand how the life we know on Earth todayhas come to be, the chemical composition of the Solar Nebularmust be examined. The most pristine record of this compositionis believed to be locked up in comets. Goesmann et al. (2015)report the first in situ analysis of organic molecules on the sur-face of comet 67P. Based on the measurements of the COSACinstrument aboard Rosetta’s Philae lander, Goesmann et al.(2015) derive CH3NH2 to NH2CHO and CH3CN ratios which arelower by one to two orders of magnitude for CH3NH2/NH2CHOand higher by up to a factor of six for CH3NH2/CH3CN, ascompared with the values derived for NGC 6334I. To improvecounting statistics, Goesmann et al. (2015) binned the COSAC
data in bins around integer mass numbers, thereby effectivelyreducing the mass resolution, before identifying and derivingabundances of the detected species. However, after reanalysingthe unbinned COSAC data, and using higher resolution mea-surements from the ROSINA mass spectrometer, aboard theRosetta orbiter, as a proxy for the near-surface cometary mate-rial, Altwegg et al. (2017) conclude that a revision of the list ofmolecules and derived abundances reported by Goesmann et al.(2015) is needed. Specifically, the contributions from CH3NH2,NH2CHO, and CH3CN to the signal in the COSAC data arelikely to be significantly smaller than originally reported byGoesmann et al. (2015). Therefore, the CH3NH2 ratios for comet67P are listed in this work as upper limits (following the discus-sion in Sect. 2.4 of Altwegg et al. 2017). The ratios derived forthe comet are consistent with the values derived for the low-massprotostar IRAS 16293–2422B.
4.4. Other N-bearing species
For the NH2CHO and CH3CN to CH3OH ratios, the variationsderived for each of the NGC 6334I regions are small andwithin factors of between two and four (excluding the upperlimit on NH2CHO for region MM3 I which is about an orderof magnitude lower than the values for MM1 II and MM2 I).Compared with the hot core model predictions of Garrod (2013),NH2CHO/CH3OH is over-predicted by orders of magnitude,while CH3CN/CH3OH, as is the case for CH3NH2/CH3OH,shows fairly good agreement with the numbers derived forNGC 6334I.
For Sgr B2, the NH2CHO and CH3CN ratios with respectto CH3OH show the same trends as CH3NH2/CH3OH, and aregenerally one to two orders of magnitude higher than the valuesderived for NGC 6334I, though, as in the case of the CH3NH2ratios, observations may suffer from beam dilution effects orunderestimated CH3OH values since only the main CH3OH-isotope, which may be optically thick, is detected. AlthoughCH3NH2 is not included in their study, the ratios derived forNH2CHO and CH3CN by Bonfand et al. (2017), using ALMAobservations which probe scales of ∼0.06 pc (∼13300 au), indi-cate that the higher NH2CHO and CH3CN to CH3OH ratiosreported by Belloche et al. (2013) and Neill et al. (2014), are trueand not artefacts of beam dilution or opacity effects. This impliesthat the chemical inventory of Sgr B2 is richer in complexnitrogen-bearing species than that of NGC 6334I, in agreementwith the high temperatures and complexity characterising theGalactic central region. That the NGC 6334I region is relativelypoor in N-bearing species is also in agreement with the findingsof Suzuki et al. (2018) who investigate the correlation betweenO- and N-bearing species in a sample of eight hot cores and findthat the former species are more abundant than the latter in thisregion.
For the Orion KL Compact Ridge, Crockett et al. (2014)use observations from Herschel to derive NH2CHO/CH3OH andCH3CN/CH3OH values which are generally lower than thosederived for Sgr B2 but higher by at least an order of magnitudeas compared with NGC 6334I.
Lastly, the ALMA observations towards the low-mass pro-tostar IRAS 16293–2422B, indicate similar CH3CN/CH3OHvalues as compared with the regions in NGC 6334I, while thevalues for NH2CHO/CH3OH are higher for IRAS 16293–2422Bby about an order of magnitude as compared with the valuesfor the regions in NGC 6334I. The generally similar CH3CNand NH2CHO to CH3OH ratios between NGC 6334I and IRAS16293–2422B indicate that the overall lower CH3NH2 ratiosderived towards IRAS 16293–2422B reflect an actual difference
A82, page 10 of 19

E. G. Bøgelund et al.: Methylamine in the hot cores NGC 6334I MM1 – 3
in chemical composition between the two sources. As discussedabove, this difference in CH3NH2 abundance may reflect a differ-ence in grain temperature during the time when the species wasformed. With the sensitivity and resolution provided by ALMA,continued studies of this and related species will broaden ourunderstanding of the inventory of pre-biotic species in both high-and low-mass sources and help evaluate the degree to whichCH3NH2 chemistry depends on the grain temperature.
5. Summary
In this work, we present the first detection of CH3NH2 towardsNGC 6334I and derive the column density of the species inthe hot cores MM1, MM2, and MM3. Transitions of CH2NH,NH2CHO, 13CH3CN, and CH3C15N are also studied and theircolumn densities inferred. Assuming LTE and excitation temper-atures in the range 70–340 K, each species is modelled separatelyand then summed to obtain a full spectrum for each of the stud-ied regions. Based on the good agreement between the CH3NH2column density ratios predicted by the hot core models of Garrod(2013) and the values derived for the regions in NGC 6334I,the formation of CH3NH2 is more likely to proceed via radi-cal recombination reactions on grain surfaces than via gas-phasereactions.
The detection of CH3NH2 towards NGC 6334I reported hereand recent (tentative) detections towards the high-mass star-forming regions in Orion KL and G10.47+0.03 by Pagani et al.(2017) and Ohishi et al. (2017) respectively, also indicate thatthe species is not as uncommon in the ISM as was previouslythought. This implies that future high-sensitivity, high-resolutionsearches for the species are likely to yield additional detectionsof the formerly so elusive molecule. In this case, observationscarried out towards both high- and low-mass objects, will helpassess the dependency of CH3NH2-grain formation efficiency onthe dust grain temperature of individual regions.
Acknowledgements. We thank the anonymous referee for a careful evalua-tion and many useful comments that helped us clarify our manuscript. Aspecial thanks to L. Pagani for insights into the complex structure and chem-istry of Orion KL and providing column density estimates for NH2CHO andCH2NH. We also thank C. Brogan and T. Hunter for assistance in reducing andanalysing the Band 10 data. This paper makes use of the following ALMA data:ADS/JAO.ALMA#2015.1.00150.S and #2017.1.00717.S. ALMA is a partnershipof ESO (representing its member states), NSF (USA) and NINS (Japan), togetherwith NRC (Canada) and NSC and ASIAA (Taiwan) and KASI (Republic ofKorea), in cooperation with the Republic of Chile. The Joint ALMA Observatoryis operated by ESO, AUI/NRAO and NAOJ. This work is based on analysis car-ried out with the CASSIS software and JPL: http://spec.jpl.nasa.gov/and CDMS: https://cdms.astro.uni-koeln.de/cdms/portal/ spec-troscopic databases. CASSIS has been developed by IRAP-UPS/CNRS(http://cassis.irap.omp.eu).
References
Altwegg, K., Balsiger, H., Berthelier, J. J., et al. 2017, MNRAS, 469, S130Aponte, J. C., Elsila, J. E., Glavin, D. P., et al. 2017, ACS Earth Space Chem., 1, 3Belloche, A., Müller, H. S. P., Menten, K. M., Schilke, P., & Comito, C. 2013,
A&A, 559, A47Bisschop, S. E., Jørgensen, J. K., van Dishoeck, E. F., & de Wachter, E. B. M.
2007, A&A, 465, 913Blanco, S., López, J. C., Lesarri, A., & Alonso, J. L. 2006, J. Am. Chem. Soc,
128, 12111Bockelée-Morvan, D., Wink, J., Despois, D., et al. 1997, Earth Moon and
Planets, 78, 67Bøgelund, E. G., McGuire, B. A., Ligterink, N. F. W., et al. 2018, A&A, 615, A88Bonfand, M., Belloche, A., Menten, K. M., Garrod, R. T., & Müller, H. S. P.
2017, A&A, 604, A60Bossa, J.-B., Duvernay, F., Theulé, P., et al. 2009, A&A, 506, 601
Brogan, C. L., Hunter, T. R., Cyganowski, C. J., et al. 2016, ApJ, 832, 187Calcutt, H., Jørgensen, J. K., Müller, H. S. P., et al. 2018, A&A, 616, A90Cazaux, S., Tielens, A. G. G. M., Ceccarelli, C., et al. 2003, ApJ, 593, L51Chibueze, J. O., Omodaka, T., Handa, T., et al. 2014, ApJ, 784, 114Coutens, A., Jørgensen, J. K., van der Wiel, M. H. D., et al. 2016, A&A, 590, L6Crockett, N. R., Bergin, E. A., Neill, J. L., et al. 2014, ApJ, 787, 112Crovisier, J., Bockelée-Morvan, D., Colom, P., et al. 2004, A&A, 418, 1141Danger, G., Borget, F., Chomat, M., et al. 2011, A&A, 535, A47Dickens, J. E., Irvine, W. M., DeVries, C. H., & Ohishi, M. 1997, ApJ, 479, 307Endres, C. P., Schlemmer, S., Schilke, P., Stutzki, J., & Müller, H. S. P. 2016, J.
Mol. Spectr., 327, 95Förstel, M., Bergantini, A., Maksyutenko, P., Góbi, S., & Kaiser, R. I. 2017,
ApJ, 845, 83Gardner, F. F., Godfrey, P. D., & Williams, D. R. 1980, MNRAS, 193, 713Garrod, R. T. 2013, ApJ, 765, 60Garrod, R. T., Widicus Weaver, S. L., & Herbst, E. 2008, ApJ, 682, 283Goesmann, F., Rosenbauer, H., Bredehöft, J. H., et al. 2015, Science, 349,
aab0689Goldman, N., Reed, E. J., Fried, L. E., William Kuo, I.-F., & Maiti, A. 2010,
Nat. Chem., 2, 949Halfen, D. T., Ilyushin, V. V., & Ziurys, L. M. 2013, ApJ, 767, 66Herbst, E., & van Dishoeck, E. F. 2009, ARA&A, 47, 427Holtom, P. D., Bennett, C. J., Osamura, Y., Mason, N. J., & Kaiser, R. I. 2005,
ApJ, 626, 940Hunter, T. R., Brogan, C. L., MacLeod, G., et al. 2017, ApJ, 837, L29Irvine, W. M., Dickens, J. E., Lovell, A. J., et al. 1998, Faraday Discuss., 109, 475Jørgensen, J. K., van der Wiel, M. H. D., Coutens, A., et al. 2016, A&A, 595,
A117Jørgensen, J. K., Müller, H. S. P., Calcutt, H., et al. 2018, A&A, 620, A170Kahane, C., Ceccarelli, C., Faure, A., & Caux, E. 2013, ApJ, 763, L38Kaifu, N., Morimoto, M., Nagane, K., et al. 1974, ApJ, 191, L135Kim, Y. S., & Kaiser, R. I. 2011, ApJ, 729, 68Kirchhoff, W. H., Johnson, D. R., & Lovas, F. J. 1973, J. Phys. Chem. Ref. Data,
2, 1Kukolich, S. G. & Nelson, A. C. 1971, Chem. Phys. Lett., 11, 383Kumar, A., Sharma, R., & Kamaluddin. 2014, Astrobiology, 14, 769Lee, C.-W., Kim, J.-K., Moon, E.-S., Minh, Y. C., & Kang, H. 2009, ApJ, 697,
428Ligterink, N. F. W., Tenenbaum, E. D., & van Dishoeck, E. F. 2015, A&A, 576,
A35Ligterink, N. F. W., Calcutt, H., Coutens, A., et al. 2018, A&A, 619, A28Matthews, C. N., & Minard, R. D. 2006, Faraday Discuss., 133, 393McGuire, B. A., Shingledecker, C. N., Willis, E. R., et al. 2017, ApJ, 851, L46McGuire, B. A., Brogan, C. L., Hunter, T. R., et al. 2018, ApJ, 863, L35Milam, S. N., Savage, C., Brewster, M. A., Ziurys, L. M., & Wyckoff, S. 2005,
ApJ, 634, 1126Motiyenko, R. A., Tercero, B., Cernicharo, J., & Margulès, L. 2012, A&A, 548,
A71Motiyenko, R. A., Ilyushin, V. V., Drouin, B. J., Yu, S., & Margulès, L. 2014,
A&A, 563, A137Müller, H. S. P., Thorwirth, S., Roth, D. A., & Winnewisser, G. 2001, A&A,
370, L49Müller, H. S. P., Schlöder, F., Stutzki, J., & Winnewisser, G. 2005, J. Mol.
Struct., 742, 215Müller, H. S. P., Drouin, B. J., & Pearson, J. C. 2009, A&A, 506, 1487Mumma, M. J., & Charnley, S. B. 2011, ARA&A, 49, 471Neill, J. L., Bergin, E. A., Lis, D. C., et al. 2014, ApJ, 789, 8Öberg, K. I., Guzmán, V. V., Furuya, K., et al. 2015, Nature, 520, 198Ohishi, M., Suzuki, T., Hirota, T., Saito, M., & Kaifu, N. 2017, PASJ, submitted
[arXiv:1708.06871]Pagani, L., Favre, C., Goldsmith, P. F., et al. 2017, A&A, 604, A32Patel, B. H., Percivalle, C., Ritson, D. J., Duffy, C. D., & Sutherland, J. D. 2015,
Nat. Chem., 7, 301Persi, P., & Tapia, M. 2008, Star Formation in NGC 6334, ed. B. Reipurth, 456Pickett, H. M., Poynter, R. L., Cohen, E. A., et al. 1998, J. Quant. Spectr. Rad.
Transf., 60, 883Reid, M. J., Menten, K. M., Brunthaler, A., et al. 2014, ApJ, 783, 130Remijan, A. J., Milam, S. N., Womack, M., et al. 2008, ApJ, 689, 613Saladino, R., Crestini, C., Ciciriello, F., Costanzo, G., & di Mauro, E. 2006,
Orig. Life Evol. Biospheres, 36, 523Saladino, R., Carota, E., Botta, G., et al. 2016, Orig. Life Evol. Biospheres, 46,
515Suzuki, T., Ohishi, M., Hirota, T., et al. 2016, ApJ, 825, 79Suzuki, T., Ohishi, M., Saito, M., et al. 2018, ApJS, 237, 3Theule, P., Borget, F., Mispelaer, F., et al. 2011, A&A, 534, A64Wilson, T. L. 1999, Rep. Prog. Phys., 62, 143Woon, D. E. 2002, ApJ, 571, L177Zernickel, A., Schilke, P., Schmiedeke, A., et al. 2012, A&A, 546, A87
A82, page 11 of 19

A&A 624, A82 (2019)
Appendix A: Model grids
Table A.1. Overview of model grids.
Species Ns range (cm−2)MM1 II MM2 I MM3 I
CH2NH 1016–1017 1016–1017 5× 10¹⁴–5× 10¹⁵
CH3NH2 5× 10¹⁶–5× 10¹⁷ 3× 10¹⁶–3× 10¹⁷ 1015–1016
13CH3CN 1015–1016 5× 10¹⁴–5× 10¹⁵ 5× 10¹³–5× 10¹⁴
CH3C15N 1014–1015 1014–1015 5× 10¹²–5× 10¹³
NH2CHO 5× 10¹⁵–5× 10¹⁶ 5× 10¹⁵–5× 10¹⁶ 1013–1014
NH132 CHO 5× 10¹⁴–5× 10¹⁵ 1014–1015 –
Notes. All grids have Tex spanning 10 – 500 K in steps of 10 K and Nssampled by 20 logarithmically spaced steps.
Appendix B: Integrated line intensities
This appendix lists the integrated intensities of the best-fit modelfor each species and region, along with the integrated inten-sity, FWHM and vLSR of a gaussian profile fitted to selectedline features in the observed spectra. However, due to the highline density in the observed spectra, the majority of the listedtransitions are blended. Therefore, care should be taken wheninterpreting the integrated intensities of the observed transitionssince these fits in the majority of cases cover blended featureswhich cannot be disentangled and therefore will include thecontributions from other (unknown) species.
Table B.1. Integrated intensities of spectral line features.
Fit to observed spectrum (a)
Transition Region Imodel(b) Igauss FWHMgauss vLSR,gauss
(QN)up(c) (QN)low
(c) (K km s−1) (K km s−1) (km s−1) (km s−1)
CH2NH
152,13 14 143,12 13
}MM1∗ 46.2 37.8 2.7± 0.8 −8.2± 0.3
152,13 16 143,12 15 MM2∗ 36.8 24.1 2.4± 0.3 −10.4± 0.1152,13 15 143,12 14 MM3 0.5 – – –
CH3NH2(d)
16 2 A2 15 15 3 A1 14
}MM1 18.3 – – –
16 2 A2 17 15 3 A1 16 MM2 4.8 – – –16 2 A2 16 15 3 A1 16 MM3 0.2 – – –
13 2 B2 13 13 1 B1 13
}MM1∗ 106.0 123.6 4.8± 0.8 −7.9± 0.2
13 2 B2 14 13 1 B1 14 MM2∗ 32.5 74.0 3.6± 0.3 −11.0± 0.113 2 B2 13 13 1 B1 12 MM3 1.7 2.0 3.2± 0.6 −10.9± 0.29 0 B2 8 8 1 B1 7
}MM1 115.3 – – –
9 0 B2 10 8 1 B1 9 MM2 41.5 – – –9 0 B2 9 8 1 B1 8 MM3∗ 2.2 2.4 4.4± 1.1 −10.7± 0.4
16 7 B1 16 17 6 B2 17
} MM1 36.6 – – –16 7 B2 16 17 6 B1 17
MM2 7.6 – – –16 7 B1 17 17 6 B2 18
MM3 0.4 – – –16 7 B2 17 17 6 B1 1816 7 B1 15 17 6 B2 1616 7 B2 15 17 6 B1 16
9 0 E2+1 8 8 1 E2+1 7
}MM1 38.8 – – –
9 0 E2+1 10 8 1 E2+1 9 MM2 13.7 – – –9 0 E2+1 9 8 1 E2+1 8 MM3 0.7 – – –
13CH3CN
MM1∗ 27.5 36.9 3.6± 0.6 −6.8± 0.3175 165 MM2∗ 10.8 32.2 2.8± 0.2 −8.0± 0.1
MM3 0.9 1.1 2.4± 0.3 −9.2± 0.1
Notes. (∗)Fit to blended feature. (a)Gaussian fit to the observed line features. Listed values are the integrated intensity, FWHM and vLSR of the fittedgaussian profile, including 1σ uncertainties. (b)Integrated intensity of the best-fit model for each region and spectral feature. (c)Quantum numbersfor CH2NH are JKa,Kc F. Quantum numbers for CH3NH2 are J Ka Γ F, following the notation of Motiyenko et al. (2014). Quantum numbers for13CH3CN and CH3C15N are JK. Quantum numbers for NH2CHO and NH13
2 CHO are JKa,Kc. (d)Only lines with Aij > 10−6s−1 are listed.
A82, page 12 of 19

E. G. Bøgelund et al.: Methylamine in the hot cores NGC 6334I MM1 – 3
Table B.1. continued.
Fit to observed spectrum (a)
Transition Region Imodel(b) Igauss FWHMgauss vLSR,gauss
(QN)up(c) (QN)low
(c) (K km s−1) (K km s−1) (km s−1) (km s−1)
MM1∗ 49.0 38.1 2.6± 0.4 −6.5± 0.2174 164 MM2∗ 24.2 50.4 3.3± 0.3 −8.6± 0.1
MM3 1.9 1.9 2.5± 0.2 −8.8± 0.1
MM1 132.1 108.1 3.5± 0.4 −6.4± 0.2173 163 MM2 80.9 86.2 3.4± 0.2 −8.3± 0.1
MM3 6.7 7.1 2.3± 0.2 −8.7± 0.1
MM1∗ 100.4 124.5 4.4± 0.7 −6.7± 0.2172 162 MM2∗ 66.9 72.9 3.2± 0.2 −8.3± 0.1
MM3∗ 5.1 5.2 2.4± 0.6 −8.6± 0.2
MM1∗ 113.1 212.7 4.3± 0.3 −7.5± 0.1171 161 MM2∗ 82.5 78.0 3.1± 0.3 −8.4± 0.1
MM3∗ 6.6 7.5 2.3± 0.3 −8.7± 0.1
MM1 128.5 – – –170 160 MM2 91.8 – – –
MM3 7.5 – – –CH3C15N
MM1 8.3 – – –174 164 MM2 3.3 – – –
MM3 0.3 – – –
MM1 26.0 23.7 2.5± 0.5 −6.3± 0.2171 161 MM2∗ 12.3 32.56 2.4± 0.2 −7.9± 0.1
MM3 1.4 1.31 2.7± 0.6 −8.9± 0.2
MM1∗ 18.6 20.2 3.2± 0.5 −6.5± 0.2172 162 MM2∗ 9.8 23.0 3.8± 0.5 −7.7± 0.2
MM3 1.2 0.65 1.6± 0.4 −8.5± 0.2
MM1 24.7 – – –171 161 MM2 13.0 – – –
MM3 1.6 – – –
MM1 26.7 – – –171 161 MM2 16.5 – – –
MM3 1.8 – – –
NH2CHO
MM1 135.1 – – –151,15 141,14 MM2 172.0 – – –
MM3 1.6 – – –
MM1 130.7 – – –141,13 131,12 MM2 168.3 – – –
MM3 1.6 – – –
NH132 CHO
MM1 41.4 – – –151,15 141,14 MM2 13.2 – – –
MM3 – – – –
MM1 40.1 – – –141,13 131,12 MM2 12.9 – – –
MM3 – – – –
A82, page 13 of 19

A&A 624, A82 (2019)
Appendix C: ALMA Band 10 spectrum ofmethylamine
The Band 10 spectrum was acquired as part of projectADS/JAO.ALMA#2017.1.00717.S. Because the primary beam atBand 10 is only ∼7′′, two pointing positions were needed to coverthe entire source. Only one of those has been observed, the phasecentre was α(J2000) = 17h20m53.3s δ(J2000) = −35◦46′59.′′0.The spectrum presented in Fig. C.1 was extracted from aposition with coordinates (J2000 17h20m53.3s, −35◦46′59.′′0),
chosen off the bright continuum peak of MM1, to minimisethe number of transitions driven into absorption. A detailedfirst look at the data is presented in McGuire et al. (2018).We present the spectrum here to support the identificationof CH3NH2 in NGC 6334I, but caution that the excitationconditions and column density in these data at this positionare not directly comparable to the Band 7 data discussedin this work. Table C.1 lists the catalogue frequencies andother spectroscopic data for the CH3NH2 transitions shown inFig. C.1.
890.300 890.500 890.700 890.900 891.100 891.300 891.500 891.700Frequency [GHz]
0.5
0.0
0.5
1.0
1.5
2.0
2.5
3.0
Inte
nsity
[Jybe
am1 ]
CH3NH2
Fig. C.1. CH3NH2 transitions detected towards NGC 6334I in the range 890.2 to 891.7 GHz (ALMA Band 10). The red line represents the syntheticspectrum of CH3NH2 assuming a column density of 2× 1017 cm−2, an excitation temperature of 100 K and a FWHM line width of 3.2 km s−1, in a00.′′26× 0.′′26 beam (equivalent to the angular resolution of the data). The abscissa is the rest frequency with respect to the radial velocity towardsthe region (−7 km s−1). The data are shown in black.
Table C.1. Summary of the brightest CH3NH2 lines between 890.2 and 891.7 GHz.
Transition Catalogue Frequency Eup Aij Catalogue
(QN)up (QN)low (MHz) (K) × 10−4 (s−1)
13 6 E1-1 13 13 5 E1-1 13 890 291.6353 333.72 8.77 Motiyenko et al. (2014)13 6 E1-1 14 13 5 E1-1 14 890 291.7865 333.72 9.6113 6 E1-1 12 13 5 E1-1 12 890 291.7981 333.72 8.1812 6 E1-1 12 12 5 E1-1 12 890 383.6647 306.08 8.5712 6 E1-1 13 12 5 E1-1 13 890 383.8427 306.08 9.3912 6 E1-1 11 12 5 E1-1 11 890 383.8576 306.08 8.0020 6 B2 20 20 5 B1 21 890 402.2366 589.75 9.8020 6 B2 21 20 5 B1 21 890 402.2883 586.75 10.320 6 B2 19 20 5 B1 19 890 402.2909 586.75 9.3320 6 B1 20 20 5 B2 21 890 404.2829 589.75 9.8020 6 B1 21 20 5 B2 21 890 404.3348 586.75 10.320 6 B1 19 20 5 B2 19 890 404.3374 586.75 9.3311 6 E1-1 11 11 5 E1-1 11 890 464.2275 280.56 8.1811 6 E1-1 12 11 5 E1-1 12 890 464.4391 280.56 8.9711 6 E1-1 10 11 5 E1-1 10 890 464.4584 280.56 7.6410 6 E1-1 10 10 5 E1-1 10 890 534.3699 257.17 7.6410 6 E1-1 11 10 5 E1-1 11 890 534.6247 257.17 8.5710 6 E1-1 9 10 5 E1-1 9 890 534.6502 257.17 6.969 6 E1-1 9 9 5 E1-1 9 890 595.0509 235.9 6.969 6 E1-1 10 9 5 E1-1 10 890 595.3625 235.9 7.819 6 E1-1 8 9 5 E1-1 8 890 595.3973 235.9 6.35
Notes. Quantum numbers are J Ka Γ F, following the notation of Motiyenko et al. (2014).
A82, page 14 of 19

E. G. Bøgelund et al.: Methylamine in the hot cores NGC 6334I MM1 – 3
Table C.1. continued.
Transition Catalogue Frequency Eup Aij Catalogue
(QN)up (QN)low (MHz) (K) × 10−4 (s−1)
8 6 E1-1 8 8 5 E1-1 8 890 647.1409 216.76 6.078 6 E1-1 9 8 5 E1-1 9 890 647.5298 216.76 6.968 6 E1-1 7 8 5 E1-1 7 890 647.5788 216.76 5.417 6 E1-1 7 7 5 E1-1 7 890 691.4204 199.74 4.827 6 E1-1 8 7 5 E1-1 8 890 691.9184 199.74 5.537 6 E1-1 6 7 5 E1-1 6 890 691.9903 199.74 4.206 6 E1-1 6 6 5 E1-1 6 890 728.5759 184.85 2.906 6 E1-1 7 6 5 E1-1 7 890 729.5759 184.85 3.496 6 E1-1 5 6 5 E1-1 5 890 729.3469 184.85 2.5318 6 B2 18 18 5 B1 18 890 757.4027 503.88 9.6118 6 B2 19 18 5 B1 19 890 757.4734 503.88 10.318 6 B1 18 18 5 B2 18 890 758.1200 503.88 9.6118 6 B1 19 18 5 B2 19 890 758.1908 503.88 10.311 3 A1 11 10 2 A2 10 890 875.8080 175.87 7.9411 3 A1 12 10 2 A2 11 890 875.9815 175.87 8.7111 3 A1 10 10 2 A2 9 890 876.0048 175.87 7.2417 6 B1 17 17 5 B2 17 890 904.3890 465.64 9.6117 6 B1 18 17 5 B2 18 890 904.4711 465.64 10.317 6 B1 16 17 5 B2 16 890 904.4759 465.64 8.9717 6 B2 17 17 5 B1 17 890 904.7947 465.64 9.6117 6 B2 18 17 5 B1 18 890 904.8768 465.64 10.117 6 B2 16 17 5 B1 16 890 904.8816 465.64 8.9716 6 B2 16 16 5 B1 16 891 033.4246 429.50 9.3916 6 B2 17 16 5 B1 17 891 033.5198 429.50 10.116 6 B2 15 16 5 B1 15 891 033.5258 429.50 8.9716 6 B1 16 16 5 B2 16 891 033.6460 429.50 9.3916 6 B1 17 16 5 B2 17 891 033.7412 429.50 10.116 6 B1 15 16 5 B2 15 891 033.7472 429.50 8.9715 6 B1 15 15 5 B2 15 891 146.2027 395.48 9.1815 6 B1 16 15 5 B2 16 891 146.3132 395.48 9.8415 6 B2 15 15 5 B1 15 891 146.3187 395.48 9.1815 6 B1 14 15 5 B2 14 891 146.3206 395.48 8.7715 6 B2 16 15 5 B1 16 891 146.4292 395.48 9.8415 6 B2 14 15 5 B1 14 891 146.4366 395.48 8.7714 6 B2 14 14 5 B1 14 891 244.3081 363.58 9.1814 6 B1 14 14 5 B2 14 891 244.3661 363.58 9.1814 6 B2 15 14 5 B1 15 891 244.4368 363.58 9.8414 6 B2 13 14 5 B1 13 891 244.4460 363.58 8.5714 6 B1 15 14 5 B2 15 891 244.4948 363.58 9.8414 6 B1 13 14 5 B2 13 891 244.5040 363.58 8.5713 6 B1 13 13 5 B2 13 891 329.2209 333.82 8.7713 6 B2 13 13 5 B1 13 891 329.2483 333.82 8.7713 6 B1 14 13 5 B2 14 891 329.3714 333.82 9.6113 6 B1 12 13 5 B2 12 891 329.3831 333.82 8.1813 6 B2 14 13 5 B1 14 891 329.3989 333.82 9.6113 6 B2 12 13 5 B1 12 891 329.4106 333.82 8.1812 6 B2 12 12 5 B1 12 891 402.3183 306.18 8.5712 6 B1 12 12 5 B2 12 891 402.3306 306.18 8.5712 6 B2 13 12 5 B1 13 891 402.4958 306.18 9.3912 6 B1 13 12 5 B2 13 891 402.5081 306.18 9.3912 6 B2 11 12 5 B1 11 891 402.5107 306.18 8.0012 6 B1 11 12 5 B2 11 891 402.5229 306.18 8.0011 6 B1 11 11 5 B2 11 891 464.8770 280.66 8.1811 6 B2 11 11 5 B1 11 891 464.8820 280.66 8.1811 6 B1 12 11 5 B2 12 891 465.0882 280.66 8.9711 6 B2 12 11 5 B1 12 891 465.0932 280.66 8.9711 6 B1 10 11 5 B2 10 891 465.1075 280.66 7.4611 6 B2 10 11 5 B1 10 891 465.1125 280.66 7.46
A82, page 15 of 19

A&A 624, A82 (2019)
Table C.1. continued.
Transition Catalogue Frequency Eup Aij Catalogue
(QN)up (QN)low (MHz) (K) × 10−4 (s−1)
10 6 B2 10 10 5 B1 10 891 518.0731 257.26 7.6410 6 B1 10 10 5 B2 10 891 518.0750 257.26 7.6410 6 B2 11 10 5 B1 11 891 518.3275 257.26 8.5710 6 B1 11 10 5 B2 11 891 518.3294 257.26 8.5710 6 B2 9 10 5 B1 9 891 518.3531 257.26 6.9610 6 B1 9 10 5 B2 9 891 518.3550 257.26 6.969 6 B1 9 9 5 B2 9 891 562.9831 235.99 6.969 6 B2 9 9 5 B1 9 891 562.9838 235.99 6.969 6 B1 10 9 5 B2 10 891 563.2945 235.99 7.819 6 B2 10 9 5 B1 10 891 563.2952 235.99 7.819 6 B1 8 9 5 B2 8 891 563.3294 235.99 6.359 6 B2 8 9 5 B1 8 891 563.3300 235.99 6.358 6 B2 8 8 5 B1 8 891 600.5836 216.85 6.078 6 B1 8 8 5 B2 8 891 600.5838 216.85 6.078 6 B2 9 8 5 B1 9 891 600.9724 216.85 6.968 6 B1 9 8 5 B2 9 891 600.9725 216.85 6.968 6 B2 7 8 5 B1 7 891 601.0213 216.85 5.418 6 B1 7 8 5 B2 7 891 601.0215 216.85 5.417 6 B1 7 7 5 B2 7 891 631.7493 199.83 4.827 6 B2 7 7 5 B1 7 891 631.7493 199.83 4.827 6 B1 8 7 5 B2 8 891 632.2472 199.83 5.667 6 B2 8 7 5 B1 8 891 632.2473 199.83 5.667 6 B1 6 7 5 B2 6 891 632.3190 199.83 4.297 6 B2 6 7 5 B1 6 891 632.3191 199.83 4.296 6 B1 6 6 5 B2 6 891 657.2500 184.94 2.976 6 B2 6 6 5 B1 6 891 657.2500 184.94 2.976 6 B1 7 6 5 B2 7 891 657.9096 184.94 3.496 6 B2 7 6 5 B1 7 891 657.9096 184.94 3.496 6 B1 5 6 5 B2 5 891 658.0209 184.94 2.536 6 B2 5 6 5 B1 5 891 658.0209 184.94 2.53
Appendix D: Methanimine, methyl cyanide andformamide
In this appendix, the detections of CH2NH, the 13C- and15N-methyl cyanide isotopologues, and NH2CHO are discussedin detail. The detected lines and best-fit models are shown inFigs. D.1–D.3.
D.1. Methanimine CH2NH
A single (hyperfine split) transition of CH2NH is covered by thedata. The CH2NH transition, located at 302.565 GHz, and best-fit synthetic spectrum for each of the regions are included inFig. D.3. Unfortunately, the CH2NH feature is situated in thewing of a much stronger transition, located at approximately302.562 GHz, identified as CH3OCHO. It should be noted how-ever, that the peak in the data at 302.562 GHz is only partlyreproduced by the synthetic spectrum of CH3OCHO and addi-tional contributions to the peak from other species, which are notincluded in the JPL or CDMS molecular databases, can thereforenot be excluded. Because of this blend, we report only upperlimits on the column density of CH2NH in each of the stud-ied regions. The CH2NH column densities are ≤5.2× 1016 cm−2
assuming Tex = 215K for MM1 II, ≤5.0× 1016 cm−2 assumingTex = 165 K for MM2 I, and ≤1015 cm−2 assuming Tex = 120 Kfor MM3 I.
D.2. Methyl cyanide CH3CN
There are no transitions of the main CH3CN isotopologue cov-ered by the observations but six transitions belonging to the13C- and five transitions belonging to the 15N-methyl cyanideisotopologues are within the data range. Based on these, thecolumn density of the main CH3CN isotopologue is derivedassuming a 12C/13C value of 62 and a 14N/15N value of 422,both derived assuming dGC = 7.02 kpc and the 12C/13C and14N/15N relations presented by Milam et al. (2005) and Wilson(1999), respectively. The detected transitions of both 13CH3CNand CH3C15N belong to the J = 17→16 series around 303.6 and303.2 GHz, respectively, and have upper state energies in therange 131 to 310 K. No transitions of the 13C-methyl cyanideisomer CH13
3 CN are covered by the data. Figures D.1 andD.2 show the detected methyl cyanide transitions and best-fitmodels.
MM1 II. In the case of MM1 II, the best-fit methyl cyanidecolumn densities and excitation temperature are 3.4× 1015 cm−2
and 70 K for 13CH3CN, respectively, and 3.3× 1014 cm−2 and110 K for CH3C15N, respectively. For 13CH3CN, the uncer-tainty on Ns and Tex is approximately 30 and 15%, respectively,while for CH3C15N, the approximate uncertainty is 15 and 45%,respectively. The ratio of the column densities of 13CH3CNto CH3C15N is a factor of 10, higher than the expected value
A82, page 16 of 19

E. G. Bøgelund et al.: Methylamine in the hot cores NGC 6334I MM1 – 3
010
30
50 13CH3CN
MM
1
010
30
50
T B[K
]
MM
2
303.497 303.519 303.5410
1
2
3
303.548 303.570 303.592 303.588 303.610 303.632Frequency [GHz]
13CH3CN NH2CHO Others
303.616 303.638 303.660 303.634 303.656 303.678
MM
3
Fig. D.1. 13CH3CN transitions detected towards NGC 6334I. Turquoise, magenta and green lines represent the synthetic spectrum of 13CH3CN andNH2CHO and the sum of spectra of other contributing species respectively. The abscissa is the rest frequency with respect to the radial velocitytowards each of the hot cores (listed in Table 2). The data are shown in black. Top panels: MM1 II. Middle panels: MM2 I. Bottom panels: MM3 I.
05
101520 CH3C15N
MM
1
0
5
10
15
T B[K
]
MM
2303.166 303.188 303.210
0.30.00.30.60.9
303.206 303.228 303.250 303.235 303.257 303.279Frequency [GHz]
CH3C15N Others
303.252 303.274 303.296 303.257 303.279 303.301
MM
3
Fig. D.2. CH3C15N transitions detected towards NGC 6334I. Blue and green lines represent the synthetic spectrum of CH3C15N and the sum ofspectra of other contributing species respectively. The abscissa is the rest frequency with respect to the radial velocity towards each of the hot cores(listed in Table 2). The data are shown in black. Top panels: MM1 II. Middle panels: MM2 I. Bottom panels: MM3 I.
of 6.8 based on the 12C/13C and 14N/15N relations. Of thesix detected transitions belonging to 13CH3CN, five are largelyuncontaminated by emission from other species and can beassigned distinct peaks in the data. The final transition, locatedat 303.661 GHz, is blended with a transition of NH2CHO (tobe discussed in detail below). The sum of the best-fit spec-tra of 13CH3CN and NH2CHO results in a model with a peakthat is ∼45% more intense than the data at 303.661 GHz.Optimising the column density of the 13CH3CN model to fit theblended transition results in underestimated model peak intensi-ties for the remaining 13CH3CN lines with respect to the data.
The best-fit column density optimised to the blended line is afactor two lower than the best-fit column density when opti-mising to all 13CH3CN transitions. In contrast to 13CH3CN,the transitions of CH3C15N are mostly blended and only twoof the five transitions, located at 303.228 and 303.257 GHz,can be assigned distinct counterparts in the data. The remain-ing transitions are blended with transitions of CH3SH locatedaround 303.187 and 303.276 GHz respectively. Excluding thecontribution from CH3SH to the model does not change thevalue of the best-fit column density of CH3C15N but it shouldbe noted that the summed best-fit spectra of CH3C15N and
A82, page 17 of 19

A&A 624, A82 (2019)
010203040 CH2NH
0
20
40
60NH2CHO
0
20
40
60
010203040
NH132 CHO
010203040
MM
1
0
10
20
30
T B[K
]
0
20
40
60
0
20
40
60
0
5
10
15
0
5
10
15
MM
2
302.543 302.565 302.5870.3
0.0
0.3
0.6
0.9
303.428 303.450 303.4720
1
2
3
303.639 303.661 303.683Frequency [GHz]
0
1
2
3
CH2NH CH3C15N NH132 CHO 13CH3CN NH2CHO Others
302.532 302.554 302.5760.3
0.0
0.3
0.6
0.9
303.090 303.112 303.1340.3
0.0
0.3
0.6
0.9
MM
3
Fig. D.3. CH2NH, NH2CHO and NH132 CHO transitions detected towards NGC 6334I. Orange, magenta, red and green lines represent the synthetic
spectrum of CH2NH, NH2CHO and NH132 CHO and the sum of spectra of other contributing species respectively. The abscissa is the rest frequency
with respect to the radial velocity towards each of the hot cores (listed in Table 2). The data are shown in black. Top panels: MM1 II. Middlepanels: MM2 I. Bottom panels: MM3 I.
CH3SH overshoot the data feature located at 303.276 GHz withapproximately 50%.
MM2 I. The best-fit excitation temperature and columndensity for 13CH3CN in the MM2 I region is 80 K and1.4× 1015 cm−2, respectively. For CH3C15N, the excitation tem-perature is not well contained and therefore the best-fit excitationtemperature for 13CH3CN is adopted. For this temperature, thebest-fit column density is 1.8× 1014 cm−2. The uncertainty onNs and Tex is approximately 30% in the case of 13CH3CN and20% in the case of CH3C15N. As is the case of MM1 II, a sin-gle 13CH3CN line and three CH3C15N lines are contaminatedby emission from NH2CHO and CH3SH respectively. However,while the best-fit 13CH3CN column density optimised purelybased on the unblended transitions is higher by ∼20% withrespect to the value derived when all transitions are included,the best-fit column density of CH3C15N remains the same. Thesum of spectra of 13CH3CN and NH2CHO results in a modelpeak which is 15% brighter than the data at the location of theblended 13CH3CN line while including the contribution fromCH3SH to the model of CH3C15N has only little effect on thesummed spectra. The 13CH3CN to CH3C15N ratio is lower thanthe ratio derived for MM1 II and has a value of 7.8.
MM3 I. The best-fit methyl cyanide column densities inregion MM3 I are lower than for both MM1 II and MM2 Iwith values of 9× 1013 cm−2 for 13CH3CN and 2.3× 1013 cm−2
for CH3C15N, with excitation temperatures of 90 and 70 K,respectively. The uncertainty on Ns and Tex is approximately10 and 20%, respectively, for 13CH3CN and 30% and a factorof two, respectively, for CH3C15N. The ratio of the 13CH3CNto CH3C15N column density is a factor of 3.9, lower than theexpected value. For 13CH3CN as well as for CH3C15N, the best-fit column density remains unchanged when contributions fromblending species are included in the synthetic spectrum.
D.3. Formamide NH2CHO
While a total of 18 NH2CHO transitions are covered by thedata, only two are bright enough to be detected towardsthe NGC 6334I region. As discussed above, one of theselines, located at 303.661 GHz, is blended with a transition of13CH3CN. The second transition, located at 303.450 GHz, is alsoblended but with emission from CH3SH. Figure D.3 shows thetransitions and the best-fit model for each of the regions. Inaddition to the main NH2CHO isotopologue, two transitions ofNH13
2 CHO are within the data range. Transitions belonging tothe 15N- and deuterated formamide isotopologues are too weakto be detected.
MM1 II. The synthetic spectrum that best reproduces theNH2CHO lines detected towards the MM1 II region has acolumn density of 7.0× 1015 cm−2, assuming an excitation tem-perature of 215 K. The uncertainty on Ns is approximately 25%.In Sect. D.2 the NH2CHO line blended with 13CH3CN wasdiscussed and it was concluded that the sum of the optimised13CH3CN and NH2CHO spectra results in a modelled spec-trum which overshoots the data by approximately 45%. Thesecond detected NH2CHO transition is blended with CH3SH.However, the contribution from this species to the data featureat the location of the NH2CHO transition is small. Excludingthe contribution from CH3SH to the full spectrum, results ina best-fit NH2CHO column density which is less than a fac-tor of two higher than the best-fit value which includes theblending species. For NH13
2 CHO the best-fit column density is≤2.0× 1015 cm−2 assuming an excitation temperature of 215 K.Both the detected transitions of NH13
2 CHO are located in thewing of brighter emission lines and therefore, as in the case ofCH2NH, the best-fit model parameters are listed as upper limitsonly. Neither of the features blended with the NH13
2 CHO tran-sitions are reproduced by the modelled spectra of the potentialblending species listed in Table E.1.
A82, page 18 of 19

E. G. Bøgelund et al.: Methylamine in the hot cores NGC 6334I MM1 – 3
MM2 I. For region MM2 I the best-fit column densitiesare 7.6× 1015 cm−2 and ≤5.0× 1014 cm−2 for NH2CHO andNH13
2 CHO respectively, both assuming an excitation temperatureof 165 K. The uncertainty on the column density of NH2CHO is∼10%. As in the case of MM1 II, both the blended NH2CHOtransitions are slightly overproduced with respect to the datawhen the modelled spectra of 13CH3CN and other blendingspecies are included in the fit. Excluding these blending specieshowever, only increases the best-fit NH2CHO column density by10%. As in the case of MM1 II, the NH13
2 CHO column densityis listed as an upper limit.
MM3 I. In region MM3 I only the transitions of the mainNH2CHO isotopologue are detected. However, since the datafeatures at the locations of the NH2CHO transitions can also
be reproduced by the respective blending species 13CH3CN andCH3SH, the detection of NH2CHO in this region is tentativeand its column density reported as an upper limit. The best-fitmodelled spectrum of NH2CHO has a column density of≤5.0× 1013 cm−2 assumes an excitation temperature of 120 K.
Appendix E: Potential blending species
In this appendix, a list of the potential blending species andthe column densities and excitation temperatures used to fitthem, is presented. The species have transitions which overlapin frequency with transitions of CH3NH2, CH2NH, NH2CHO,or the CH3CN isotopologues and may therefore be contribut-ing to the observed spectrum extracted from each of the studiedregions.
Table E.1. Model parameters of potential blending species.
Species Catalogue MM1 II MM2 I MM3 I
Ns (cm−2) Tex (K) Ns (cm−2) Tex (K) Ns (cm−2) Tex (K)13CH3OH (a) CDMS 7.4× 10¹⁷ [215] 6.6× 10¹⁷ [165] 9.0× 10¹⁶ [120]CH18
3 OH (a) CDMS 2.0× 10¹⁷ [215] 8.0× 10¹⁶ [165] 1.4× 10¹⁶ [120]C2H5OH JPL 5.0× 10¹⁷ [215] 2.0× 10¹⁷ [300] 6.0× 10¹⁵ [200]CH3CH2OD CDMS 5.0× 10¹⁵ [215] 6.0× 10¹⁵ [165] 6.0× 10¹⁴ [50]CH2DCH2OH CDMS 5.0× 10¹⁵ [215] 3.0× 10¹⁵ [165] 2.0× 10¹⁴ [50]CH3SH CDMS 3.0× 10¹⁶ [215] <1.0× 10¹⁶ [165] 1.0× 10¹⁵ [120]C2H3CN CDMS 1.0× 10¹⁵ [215] <1.0× 10¹⁵ [165] – –13CH2CHCN CDMS 8.0× 10¹⁴ [215] 2.0× 10¹⁴ [165] – –CH3COCH3 JPL 1.5× 10¹⁷ [215] 2.0× 10¹⁷ [165] 2.0× 10¹⁵ [120]CH3OCHO JPL 1.2× 10¹⁷ [215] 2.5× 10¹⁷ [165] 9.0× 10¹⁶ [120]HCOCH2OH JPL 3.5× 10¹⁶ [215] 8.0× 10¹⁵ [165] – –C2H5SH CDMS 3.0× 10¹⁶ [215] 4.0× 10¹⁶ [165] 7.0× 10¹⁴ [120]CH3C3N CDMS 1.0× 10¹⁵ [215] 5.0× 10¹⁴ [165] 5.0× 10¹³ [120]C3H7CN CDMS 5.0× 10¹⁵ [215] 5.0× 10¹⁵ [165] – –
Notes. All models assume θs = 1.′′0, vLSR = −6.7 km s−1 for MM1 II and vLSR = −9.0 km s−1 for MM2 I and MM3 I, and FWHM = 3.5 km s−1 forMM2 I and FWHM = 3.0 km s−1 for MM1 II and MM3 I. Ns is the highest value consistent with the data. (a)Values from Bøgelund et al. (2018).
A82, page 19 of 19