Embed Size (px)
Citation preview
________________________________________________________________________________________________________
Excerpt from PNSQC 2012 Proceedings PNSQC.ORG Copies may not be made or distributed for commercial use Page 1
Metric-driven Fuzzing Strategy for Network Protocols
Faraz Qadri, Vivek Jain, Aniket Malatpure [email protected], [email protected], [email protected]
Abstract
Fuzzing is a commonly deployed testing strategy to uncover security vulnerabilities. Measuring coverage and assessing fuzzing effectiveness add significant value to the fuzzing process. Metrics like interface coverage, input space coverage, code coverage (code volume, cyclomatic complexity, defect density, known vulnerability density, tool soundness) have been proposed for the above. However, there is a dearth of industry case studies that show application of such metric-driven fuzzing approaches to standard network protocols. Hence, security practitioners lack step by step guidance to define metrics for planning and executing a fuzzing project.
This paper introduces a metric-driven fuzzing strategy and shows its application to standard network protocols. The strategy is a stage-based approach, which starts by evaluating the system as a black box, to analyze attack surface and attack vectors in common usage scenarios. In the next stage, the system is explored from a white box perspective and blocks of code that consume untrusted data are identified. In the third stage, tools are developed to cover both black box and white box scenarios. Metrics relevant to each stage are created. In the final stage, these metrics become the driving factor to track progress, measure coverage and continually improve the fuzzing process.
We present a case study that applied this fuzzing strategy to three different network protocols (SMB, NFS & iSCSI). Being able to create metrics early in each stage helped our fuzzing efforts effectively meet the exit criteria. This approach also helped uncover different classes of security vulnerabilities that were not exposed by prior methods. Furthermore, the generic nature of this fuzzing strategy enables it to be used as a template for fuzzing most network protocols.
Biography
Vivek Jain is a Software Development Engineer in Test at Microsoft in Windows Sustained Engineering
(WinSE) group. He has been working at Microsoft for the last 6 years. His primary focus is releasing
security and non-security Windows updates in various network protocols like SMB, Webdav and NFS.
Faraz Qadri is a Software Development Engineer in Test at Microsoft in WinSE group. He has been
working at Microsoft for the last 5 years. His primary focus is releasing security and non-security Windows
updates in various network protocols like NFS, SMB and iSCSI.
Aniket Malatpure is a Senior Lead Software Development Engineer in Test, in the WinSE group. He has
been working at Microsoft for the last 8 years. His team owns shipping security and non-security updates
for Windows File Server. He has a Masters in Electrical Engineering from Clemson University.

________________________________________________________________________________________________________
Excerpt from PNSQC 2012 Proceedings PNSQC.ORG Copies may not be made or distributed for commercial use Page 2
1. Introduction
Security testing has become an integral part of the testing process especially with the advent of storage
network solutions, web services and cloud computing. High availability and data protection requirements
imposed on these services make a compelling case for secure deployments across enterprises. This
distributed model implies an increased attack surface as critical data now flows over secure and insecure
networks. Security vulnerabilities in such networked systems can cause adverse consequences ranging
from denial of service to data compromise.
The well-known method of testing a network protocol for security vulnerabilities is fuzzing. In fuzzing,
malformed data is fed to the system to detect if the code handling this data behaves in an insecure
manner. While the adoption of fuzzing is gradually increasing in security testing landscape, a common
question that arises for testers is, are we done with fuzzing? Are we confident enough in our fuzzing
effectiveness? How can we measure the value of fuzzing?
In order to reach an accurate conclusion, we must be able to measure fuzzing. Measuring fuzzing, by
using metrics, is an important step when it comes to robust fuzz testing. It is also equally important to be
able to use these metrics as a key factor in driving fuzzing improvements and hence their effectiveness.
Without this it is hard to reason about fuzzing effectiveness and there is not much improvement we can
make in terms of coverage. This coverage comes from a variety of factors such as attack surface
coverage, scenario coverage and code coverage.
This paper discusses a metric-driven fuzzing strategy we adopted during fuzz testing. This fuzzing
strategy has two primary tasks, performing quantitative analysis, using metrics, to measure effectiveness
and continuously improve fuzzing. In order to achieve these, this approach makes metrics the main focus
in driving the fuzzing process.
The strategy begins by approaching the system from a black-box perspective. Black-box fuzzing is a
method adopted by penetration testers who focus on targeting the various parts of the protocol. These
parts of the network protocol constitute the attack surface and need to be covered thoroughly. Therefore,
metrics are associated with them to provide an indication on the fraction of attack surface being covered.
Examples of such metrics are related protocols, commands and fields, etc. Similarly, a protocol can be
attacked in different ways. For example, a network protocol supporting multiple transports has an equal
chance of being attacked over both TCP and UDP. These possible attack vectors provide a list of
scenarios that needs to be covered.
While black-box fuzzing does provide one with a quick start, it does not however provide any information
about the protocol’s code coverage details. This is a necessary step in getting an insight into the code
paths being executed as a result of malformed packets. Hence, the need for white-box analysis arises.
Metrics pertaining to code blocks and selected functions are defined. These metrics not only ensure that
critical code blocks are covered thoroughly but also help improve the tool effectiveness.
By using metrics associated with both these approaches in conjunction with continuous tool
improvements, one can get a holistic view of what’s being covered and how. The sections below will
describe each of these steps in detail with examples of network protocols.
________________________________________________________________________________________________________
Excerpt from PNSQC 2012 Proceedings PNSQC.ORG Copies may not be made or distributed for commercial use Page 3
2. Background and Motivation
The process of defining metrics for fuzzing is very scattered across the industry. It is crucial to be able to
use metrics that measure a concrete aspect of fuzzing and not just an activity. This means assessing the
coverage by the number of packets fuzzed or the amount of time spend on execution is not enough.
Many well-defined metrics already exist in the industry. For example code coverage, attack vectors, input
space coverage [2], coverage of previous vulnerabilities, process metrics [3] etc. Given the finite amount
of time allotted for fuzzing, this list gets quite exhaustive to implement. Ideally, it would be an aid to use
just the right mix of metrics, applicable to network protocols, without compromising on its thoroughness.
But because of the dearth of industry case studies demonstrating an end to end approach of using such a
strategy, the task of procuring such metrics can be quite challenging. Most of the time is often spent
selecting the key metrics, from a huge set at our disposal, and setting reasonable targets.
3. Metric-Driven Fuzzing
Metric-Driven fuzzing is a process where an appropriate set of metrics is defined to track and assess
different aspects of fuzzing and then those metrics drive the fuzzing process. This section introduces the
metrics sets and describes how development of these metrics and tracking these to completion drives the
fuzzing process.
3.1 Attack Surface
This is our first set of metrics. The metrics in this set focus on protocol level details which are published
externally. Since the details used to create these metrics cover interfaces, ports, commands for the
protocol, we name it ‘Attack Surface’. Attack surface can have these three metrics.
1. Protocol Coverage
2. Command Coverage
3. Field Coverage
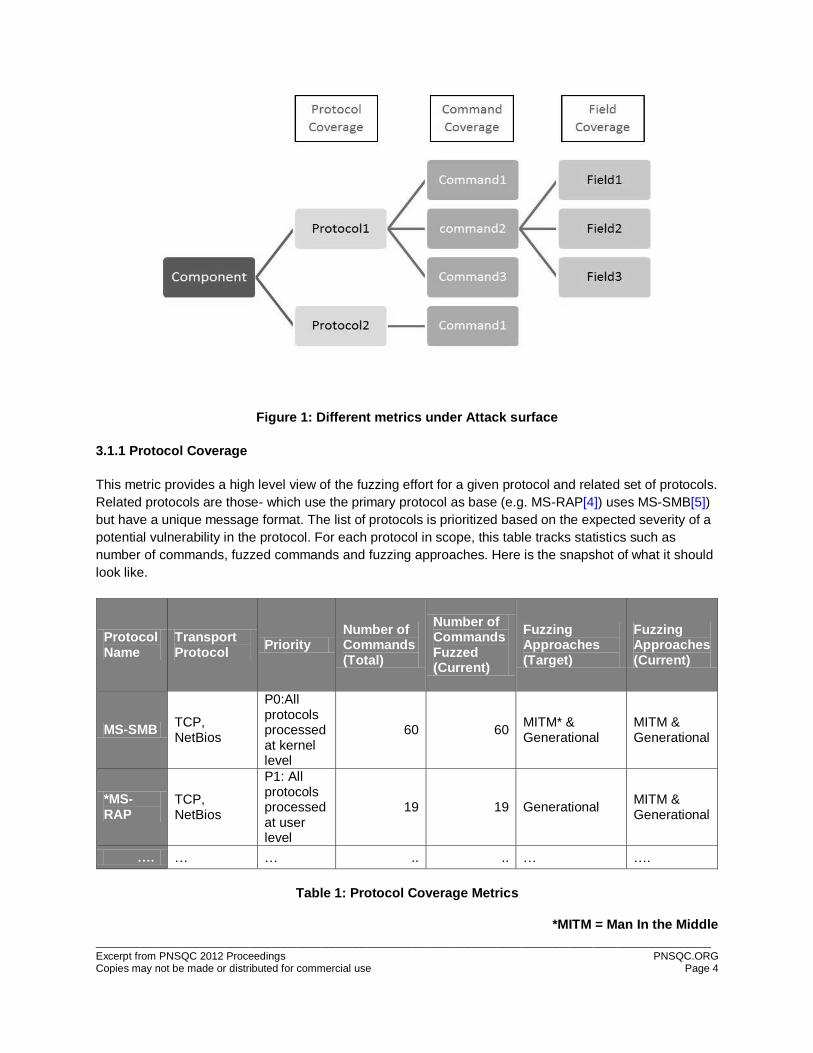
For a given component, the Protocol Coverage metric provides an overview of the protocol fuzzing. The
Command Coverage metric tracks coverage of individual commands. Similarly, to make sure a specific
command is fully covered, within each command, Field Coverage metrics is defined. This way each table
contains different levels of information ,ensuring maximum coverage for the level above it. The following
tree can illustrate the metrics relationship under Attack Surface.
________________________________________________________________________________________________________
Excerpt from PNSQC 2012 Proceedings PNSQC.ORG Copies may not be made or distributed for commercial use Page 4
Figure 1: Different metrics under Attack surface
3.1.1 Protocol Coverage
This metric provides a high level view of the fuzzing effort for a given protocol and related set of protocols.
Related protocols are those- which use the primary protocol as base (e.g. MS-RAP[4]) uses MS-SMB[5])
but have a unique message format. The list of protocols is prioritized based on the expected severity of a
potential vulnerability in the protocol. For each protocol in scope, this table tracks statistics such as
number of commands, fuzzed commands and fuzzing approaches. Here is the snapshot of what it should
look like.
Protocol Name
Transport Protocol
Priority Number of Commands (Total)
Number of Commands Fuzzed (Current)
Fuzzing Approaches (Target)
Fuzzing Approaches (Current)
MS-SMB TCP, NetBios
P0:All protocols processed at kernel level
60 60 MITM* & Generational
MITM & Generational
*MS-RAP
TCP, NetBios
P1: All protocols processed at user level
19 19 Generational MITM & Generational
…. … … .. .. … ….
Table 1: Protocol Coverage Metrics
*MITM = Man In the Middle

________________________________________________________________________________________________________
Excerpt from PNSQC 2012 Proceedings PNSQC.ORG Copies may not be made or distributed for commercial use Page 5
3.1.2 Command Coverage
This metric set provides a deeper view of fuzzing performed on a protocol by tracking the coverage at the
command level. Two metrics are created at this level.
1. Individual commands
2. Command sequences
Individual commands metrics
We categorize those commands based on various parameters like
a) Usage (i.e. Currently Used, Deprecated),
b) Authentication level (i.e. Authenticated, Unauthenticated or Pre-authentication)
c) Ease of generating the command by a user
This helps define fuzzing priority. For example, we would first want to cover currently used and pre-
authenticated commands. This metric also captures the Fuzzing tool usage for each command. This data
helps the tool coverage metric which we discuss in Tool Coverage section. The Minimum Target
Iterations count is calculated using the following formulae.
n = number of fields in the command
Multiplier Quotient = Command Fuzzing Priority (1 -10) X 1000
Command Fuzzing Priority is decided based on the role the field plays in overall operation of the
command. (10 being most important, 1 being mostly untouched as per protocol spec)
For evaluating the fuzzed values generated by a fuzzer which fuzzes one value in an iteration:
Minimum Target Iterations (N) = ( ∑i=1 to n (# of unique values generated for field i) ) X Multiplier
Quotient
For evaluating the fuzzed values generated by a fuzzer which fuzzes multiple values in an
iteration:
ni = # of unique values generated for field i
m = # of fields in command
Minimum Target Iterations (N) = (ni X ni+1 X ni+2………………. X nm) X Multiplier Quotient
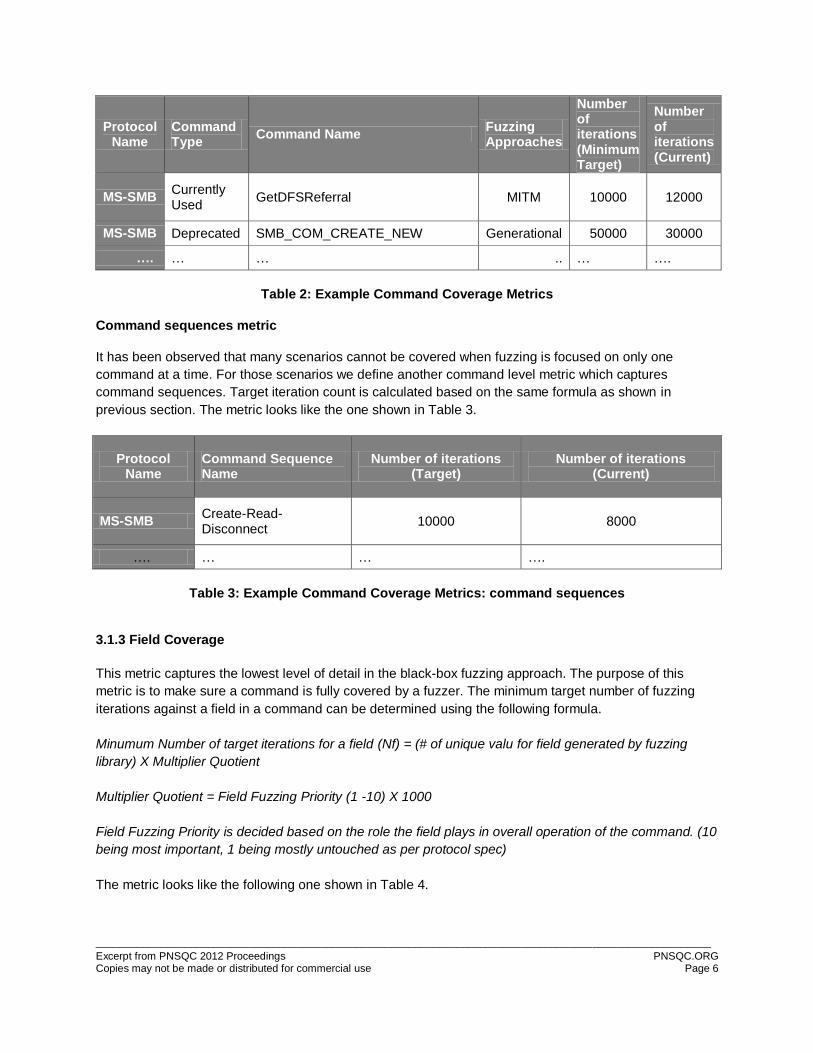
The metric looks like the one shown in Table 2.
________________________________________________________________________________________________________
Excerpt from PNSQC 2012 Proceedings PNSQC.ORG Copies may not be made or distributed for commercial use Page 6
Protocol Name
Command Type
Command Name Fuzzing Approaches
Number of iterations (Minimum Target)
Number of iterations (Current)
MS-SMB Currently Used
GetDFSReferral MITM 10000 12000
MS-SMB Deprecated SMB_COM_CREATE_NEW Generational 50000 30000
…. … … .. … ….
Table 2: Example Command Coverage Metrics
Command sequences metric
It has been observed that many scenarios cannot be covered when fuzzing is focused on only one
command at a time. For those scenarios we define another command level metric which captures
command sequences. Target iteration count is calculated based on the same formula as shown in
previous section. The metric looks like the one shown in Table 3.
Protocol Name
Command Sequence Name
Number of iterations (Target)
Number of iterations (Current)
MS-SMB Create-Read-Disconnect
10000 8000
…. … … ….
Table 3: Example Command Coverage Metrics: command sequences
3.1.3 Field Coverage
This metric captures the lowest level of detail in the black-box fuzzing approach. The purpose of this
metric is to make sure a command is fully covered by a fuzzer. The minimum target number of fuzzing
iterations against a field in a command can be determined using the following formula.
Minumum Number of target iterations for a field (Nf) = (# of unique valu for field generated by fuzzing
library) X Multiplier Quotient
Multiplier Quotient = Field Fuzzing Priority (1 -10) X 1000
Field Fuzzing Priority is decided based on the role the field plays in overall operation of the command. (10
being most important, 1 being mostly untouched as per protocol spec)
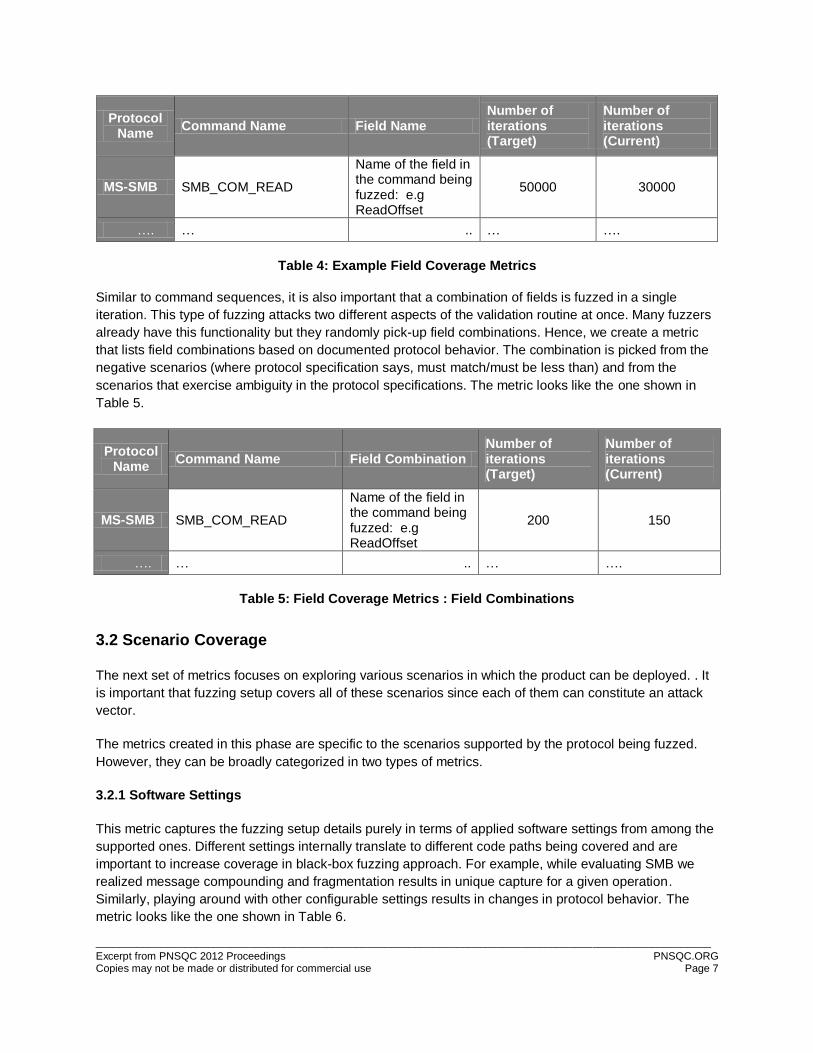
The metric looks like the following one shown in Table 4.
________________________________________________________________________________________________________
Excerpt from PNSQC 2012 Proceedings PNSQC.ORG Copies may not be made or distributed for commercial use Page 7
Protocol Name
Command Name Field Name Number of iterations (Target)
Number of iterations (Current)
MS-SMB SMB_COM_READ
Name of the field in the command being fuzzed: e.g ReadOffset
50000 30000
…. … .. … ….
Table 4: Example Field Coverage Metrics
Similar to command sequences, it is also important that a combination of fields is fuzzed in a single
iteration. This type of fuzzing attacks two different aspects of the validation routine at once. Many fuzzers
already have this functionality but they randomly pick-up field combinations. Hence, we create a metric
that lists field combinations based on documented protocol behavior. The combination is picked from the
negative scenarios (where protocol specification says, must match/must be less than) and from the
scenarios that exercise ambiguity in the protocol specifications. The metric looks like the one shown in
Table 5.
Protocol Name
Command Name Field Combination Number of iterations (Target)
Number of iterations (Current)
MS-SMB SMB_COM_READ
Name of the field in the command being fuzzed: e.g ReadOffset
200 150
…. … .. … ….
Table 5: Field Coverage Metrics : Field Combinations
3.2 Scenario Coverage
The next set of metrics focuses on exploring various scenarios in which the product can be deployed. . It
is important that fuzzing setup covers all of these scenarios since each of them can constitute an attack
vector.
The metrics created in this phase are specific to the scenarios supported by the protocol being fuzzed.
However, they can be broadly categorized in two types of metrics.
3.2.1 Software Settings
This metric captures the fuzzing setup details purely in terms of applied software settings from among the
supported ones. Different settings internally translate to different code paths being covered and are
important to increase coverage in black-box fuzzing approach. For example, while evaluating SMB we
realized message compounding and fragmentation results in unique capture for a given operation.
Similarly, playing around with other configurable settings results in changes in protocol behavior. The
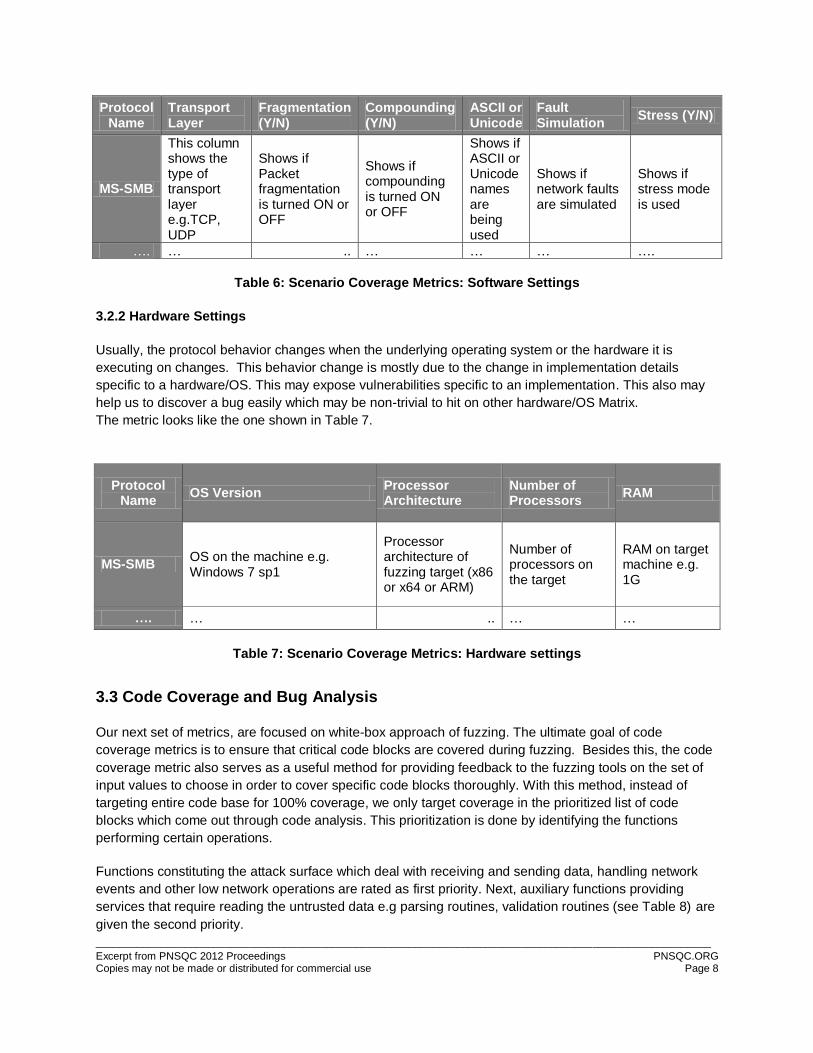
metric looks like the one shown in Table 6.
________________________________________________________________________________________________________
Excerpt from PNSQC 2012 Proceedings PNSQC.ORG Copies may not be made or distributed for commercial use Page 8
Protocol Name
Transport Layer
Fragmentation (Y/N)
Compounding (Y/N)
ASCII or Unicode
Fault Simulation
Stress (Y/N)
MS-SMB
This column shows the type of transport layer e.g.TCP, UDP
Shows if Packet fragmentation is turned ON or OFF
Shows if compounding is turned ON or OFF
Shows if ASCII or Unicode names are being used
Shows if network faults are simulated
Shows if stress mode is used
…. … .. … … … ….
Table 6: Scenario Coverage Metrics: Software Settings
3.2.2 Hardware Settings
Usually, the protocol behavior changes when the underlying operating system or the hardware it is
executing on changes. This behavior change is mostly due to the change in implementation details
specific to a hardware/OS. This may expose vulnerabilities specific to an implementation. This also may
help us to discover a bug easily which may be non-trivial to hit on other hardware/OS Matrix.
The metric looks like the one shown in Table 7.
Protocol Name
OS Version Processor Architecture
Number of Processors
RAM
MS-SMB OS on the machine e.g. Windows 7 sp1
Processor architecture of fuzzing target (x86 or x64 or ARM)
Number of processors on the target
RAM on target machine e.g. 1G
…. … .. … …
Table 7: Scenario Coverage Metrics: Hardware settings
3.3 Code Coverage and Bug Analysis
Our next set of metrics, are focused on white-box approach of fuzzing. The ultimate goal of code
coverage metrics is to ensure that critical code blocks are covered during fuzzing. Besides this, the code
coverage metric also serves as a useful method for providing feedback to the fuzzing tools on the set of
input values to choose in order to cover specific code blocks thoroughly. With this method, instead of
targeting entire code base for 100% coverage, we only target coverage in the prioritized list of code
blocks which come out through code analysis. This prioritization is done by identifying the functions
performing certain operations.
Functions constituting the attack surface which deal with receiving and sending data, handling network
events and other low network operations are rated as first priority. Next, auxiliary functions providing
services that require reading the untrusted data e.g parsing routines, validation routines (see Table 8) are
given the second priority.
________________________________________________________________________________________________________
Excerpt from PNSQC 2012 Proceedings PNSQC.ORG Copies may not be made or distributed for commercial use Page 9
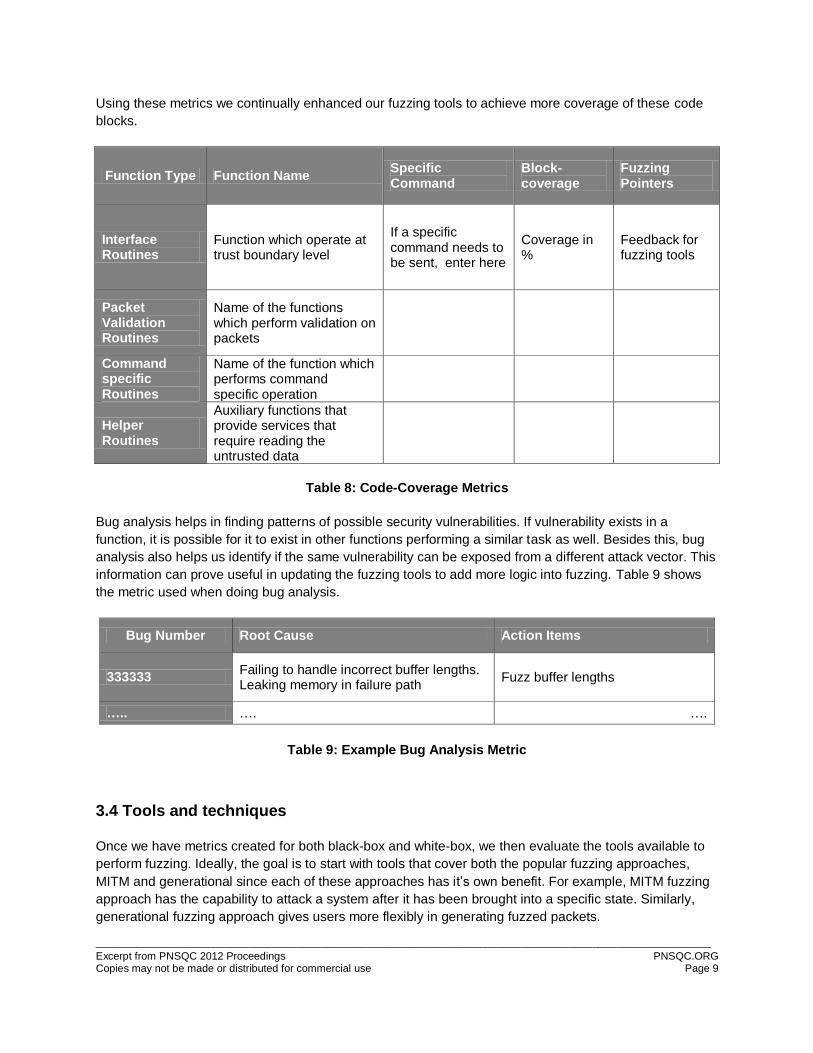
Using these metrics we continually enhanced our fuzzing tools to achieve more coverage of these code
blocks.
Function Type Function Name Specific Command
Block-coverage
Fuzzing Pointers
Interface Routines
Function which operate at trust boundary level
If a specific command needs to be sent, enter here
Coverage in %
Feedback for fuzzing tools
Packet Validation Routines
Name of the functions which perform validation on packets
Command specific Routines
Name of the function which performs command specific operation
Helper Routines
Auxiliary functions that provide services that require reading the untrusted data
Table 8: Code-Coverage Metrics
Bug analysis helps in finding patterns of possible security vulnerabilities. If vulnerability exists in a
function, it is possible for it to exist in other functions performing a similar task as well. Besides this, bug
analysis also helps us identify if the same vulnerability can be exposed from a different attack vector. This
information can prove useful in updating the fuzzing tools to add more logic into fuzzing. Table 9 shows
the metric used when doing bug analysis.
Bug Number Root Cause Action Items
333333 Failing to handle incorrect buffer lengths. Leaking memory in failure path
Fuzz buffer lengths
….. …. ….
Table 9: Example Bug Analysis Metric
3.4 Tools and techniques
Once we have metrics created for both black-box and white-box, we then evaluate the tools available to
perform fuzzing. Ideally, the goal is to start with tools that cover both the popular fuzzing approaches,
MITM and generational since each of these approaches has it’s own benefit. For example, MITM fuzzing
approach has the capability to attack a system after it has been brought into a specific state. Similarly,
generational fuzzing approach gives users more flexibly in generating fuzzed packets.

________________________________________________________________________________________________________
Excerpt from PNSQC 2012 Proceedings PNSQC.ORG Copies may not be made or distributed for commercial use Page 10
Evaluation of generated values is also performed to ensure that a combination of both valid and invalid
values are covered for a given data type. This is to ensure that the input space coverage is effective.
During fuzzing execution if parts of the metrics, whether black-box or white-box, show room for
improvement in terms of coverage, these tools are enhanced to cover missing areas. Hence, by
continuously improving the effectiveness of the fuzzing tools we stay away from getting saturated in our
fuzzing efforts early in the fuzzing period.
The metric shown in Table10 explains the requirements for fuzzing tools and their development is tracked
during the fuzzing cycle.
Tool Name Technique
Name Protocol List (Target)
Protocol List (Current)
Missing Features
Tool1 MITM
MS-SMB MS-RAP MS-BRWS
MS-SMB Capability to fuzz MS-RAP commands
…. …. .. … …
Table 10: Example Fuzzing Tools and Techniques Metrics
4. Continuous Improvement
After successfully creating metrics that cover various parts of the protocol, we are then left with the task of
executing them to continuously improve our fuzzing. This task is equally vital to ensure we keep
penetrating into the different layers of protocol. Figure 2 demonstrates the interconnection among
different parts of the fuzzing cycle.
________________________________________________________________________________________________________
Excerpt from PNSQC 2012 Proceedings PNSQC.ORG Copies may not be made or distributed for commercial use Page 11
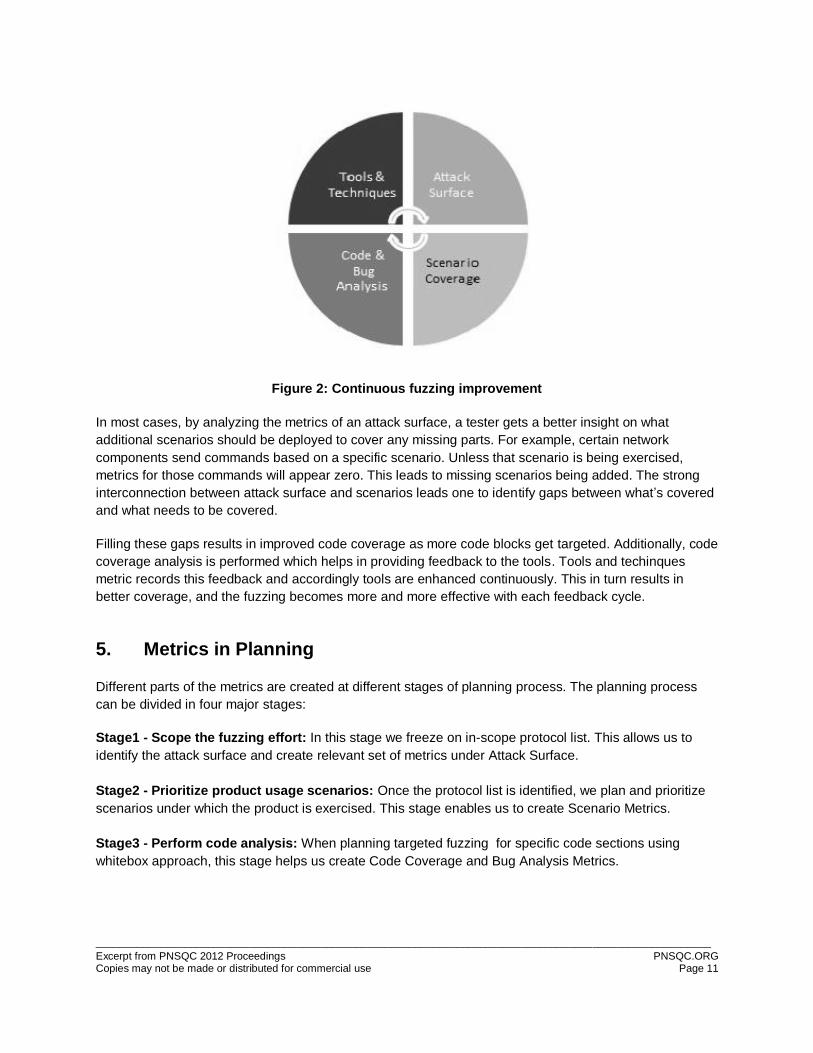
Figure 2: Continuous fuzzing improvement
In most cases, by analyzing the metrics of an attack surface, a tester gets a better insight on what
additional scenarios should be deployed to cover any missing parts. For example, certain network
components send commands based on a specific scenario. Unless that scenario is being exercised,
metrics for those commands will appear zero. This leads to missing scenarios being added. The strong
interconnection between attack surface and scenarios leads one to identify gaps between what’s covered
and what needs to be covered.
Filling these gaps results in improved code coverage as more code blocks get targeted. Additionally, code
coverage analysis is performed which helps in providing feedback to the tools. Tools and techinques
metric records this feedback and accordingly tools are enhanced continuously. This in turn results in
better coverage, and the fuzzing becomes more and more effective with each feedback cycle.
5. Metrics in Planning
Different parts of the metrics are created at different stages of planning process. The planning process
can be divided in four major stages:
Stage1 - Scope the fuzzing effort: In this stage we freeze on in-scope protocol list. This allows us to
identify the attack surface and create relevant set of metrics under Attack Surface.
Stage2 - Prioritize product usage scenarios: Once the protocol list is identified, we plan and prioritize
scenarios under which the product is exercised. This stage enables us to create Scenario Metrics.
Stage3 - Perform code analysis: When planning targeted fuzzing for specific code sections using
whitebox approach, this stage helps us create Code Coverage and Bug Analysis Metrics.
________________________________________________________________________________________________________
Excerpt from PNSQC 2012 Proceedings PNSQC.ORG Copies may not be made or distributed for commercial use Page 12
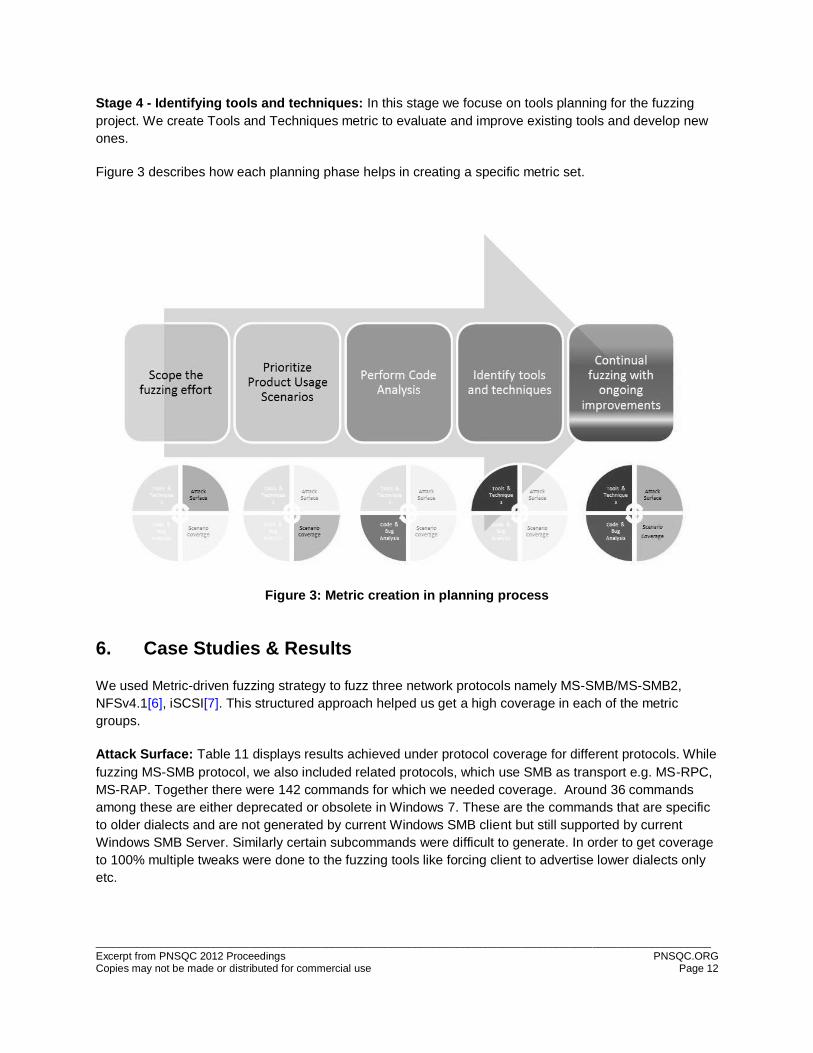
Stage 4 - Identifying tools and techniques: In this stage we focuse on tools planning for the fuzzing
project. We create Tools and Techniques metric to evaluate and improve existing tools and develop new
ones.
Figure 3 describes how each planning phase helps in creating a specific metric set.
Figure 3: Metric creation in planning process
6. Case Studies & Results
We used Metric-driven fuzzing strategy to fuzz three network protocols namely MS-SMB/MS-SMB2,
NFSv4.1[6], iSCSI[7]. This structured approach helped us get a high coverage in each of the metric
groups.
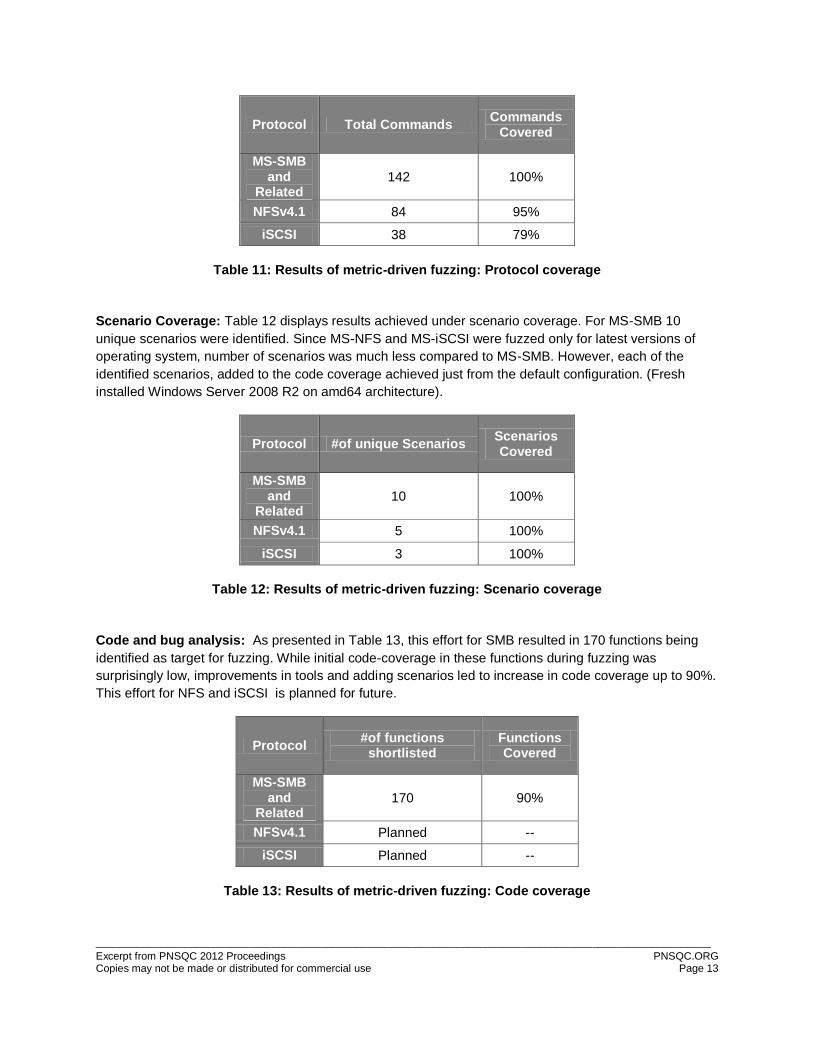
Attack Surface: Table 11 displays results achieved under protocol coverage for different protocols. While
fuzzing MS-SMB protocol, we also included related protocols, which use SMB as transport e.g. MS-RPC,
MS-RAP. Together there were 142 commands for which we needed coverage. Around 36 commands
among these are either deprecated or obsolete in Windows 7. These are the commands that are specific
to older dialects and are not generated by current Windows SMB client but still supported by current
Windows SMB Server. Similarly certain subcommands were difficult to generate. In order to get coverage
to 100% multiple tweaks were done to the fuzzing tools like forcing client to advertise lower dialects only
etc.
________________________________________________________________________________________________________
Excerpt from PNSQC 2012 Proceedings PNSQC.ORG Copies may not be made or distributed for commercial use Page 13
Protocol Total Commands Commands
Covered
MS-SMB and
Related 142 100%
NFSv4.1 84 95%
iSCSI 38 79%
Table 11: Results of metric-driven fuzzing: Protocol coverage
Scenario Coverage: Table 12 displays results achieved under scenario coverage. For MS-SMB 10
unique scenarios were identified. Since MS-NFS and MS-iSCSI were fuzzed only for latest versions of
operating system, number of scenarios was much less compared to MS-SMB. However, each of the
identified scenarios, added to the code coverage achieved just from the default configuration. (Fresh
installed Windows Server 2008 R2 on amd64 architecture).
Protocol #of unique Scenarios Scenarios Covered
MS-SMB and
Related 10 100%
NFSv4.1 5 100%
iSCSI 3 100%
Table 12: Results of metric-driven fuzzing: Scenario coverage
Code and bug analysis: As presented in Table 13, this effort for SMB resulted in 170 functions being
identified as target for fuzzing. While initial code-coverage in these functions during fuzzing was
surprisingly low, improvements in tools and adding scenarios led to increase in code coverage up to 90%.
This effort for NFS and iSCSI is planned for future.
Protocol #of functions
shortlisted Functions Covered
MS-SMB and
Related 170 90%
NFSv4.1 Planned --
iSCSI Planned --
Table 13: Results of metric-driven fuzzing: Code coverage
________________________________________________________________________________________________________
Excerpt from PNSQC 2012 Proceedings PNSQC.ORG Copies may not be made or distributed for commercial use Page 14
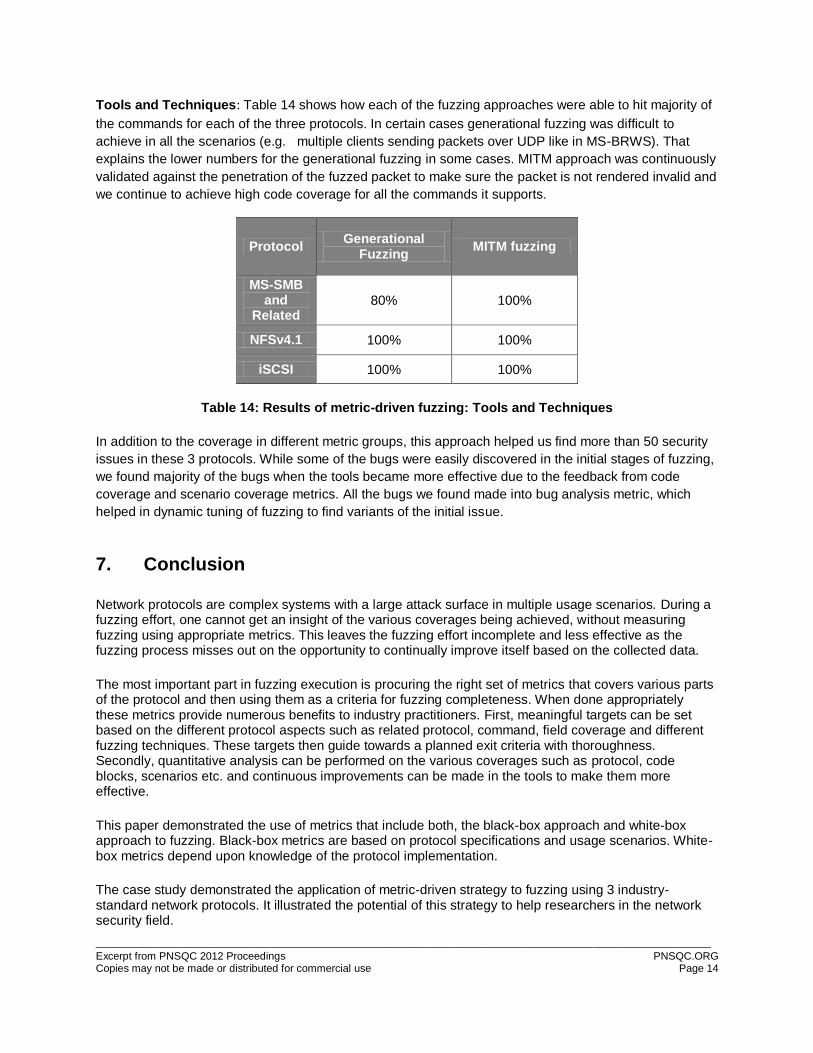
Tools and Techniques: Table 14 shows how each of the fuzzing approaches were able to hit majority of
the commands for each of the three protocols. In certain cases generational fuzzing was difficult to
achieve in all the scenarios (e.g. multiple clients sending packets over UDP like in MS-BRWS). That
explains the lower numbers for the generational fuzzing in some cases. MITM approach was continuously
validated against the penetration of the fuzzed packet to make sure the packet is not rendered invalid and
we continue to achieve high code coverage for all the commands it supports.
Protocol Generational
Fuzzing MITM fuzzing
MS-SMB and
Related 80% 100%
NFSv4.1 100% 100%
iSCSI 100% 100%
Table 14: Results of metric-driven fuzzing: Tools and Techniques
In addition to the coverage in different metric groups, this approach helped us find more than 50 security
issues in these 3 protocols. While some of the bugs were easily discovered in the initial stages of fuzzing,
we found majority of the bugs when the tools became more effective due to the feedback from code
coverage and scenario coverage metrics. All the bugs we found made into bug analysis metric, which
helped in dynamic tuning of fuzzing to find variants of the initial issue.
7. Conclusion
Network protocols are complex systems with a large attack surface in multiple usage scenarios. During a fuzzing effort, one cannot get an insight of the various coverages being achieved, without measuring fuzzing using appropriate metrics. This leaves the fuzzing effort incomplete and less effective as the fuzzing process misses out on the opportunity to continually improve itself based on the collected data.
The most important part in fuzzing execution is procuring the right set of metrics that covers various parts of the protocol and then using them as a criteria for fuzzing completeness. When done appropriately these metrics provide numerous benefits to industry practitioners. First, meaningful targets can be set based on the different protocol aspects such as related protocol, command, field coverage and different fuzzing techniques. These targets then guide towards a planned exit criteria with thoroughness. Secondly, quantitative analysis can be performed on the various coverages such as protocol, code blocks, scenarios etc. and continuous improvements can be made in the tools to make them more effective.
This paper demonstrated the use of metrics that include both, the black-box approach and white-box approach to fuzzing. Black-box metrics are based on protocol specifications and usage scenarios. White-box metrics depend upon knowledge of the protocol implementation.
The case study demonstrated the application of metric-driven strategy to fuzzing using 3 industry-standard network protocols. It illustrated the potential of this strategy to help researchers in the network security field.
________________________________________________________________________________________________________
Excerpt from PNSQC 2012 Proceedings PNSQC.ORG Copies may not be made or distributed for commercial use Page 15
Bibliography
[1] Writing Secure Code by Michael Howard and David LeBlanc (Second Edition)
[2] Mikko Varpiola and Ari Takanen. How to Deploy Robustness testing.
[3] Fuzzing for Software Security Testing and Quality Assurance
[4] [MS-SMB]: Server Message Block (SMB) Protocol Specification
[5] [MS-RAP]: Remote Administration Protocol Specification
[6] Network File System (NFS) Version 4 Minor Version 1 Protocol
[7] Internet Small Computer Systems Interface (iSCSI)