Embed Size (px)
Citation preview

STeP-IN SUMMIT 2008 Metrics & Measurements
STeP_IN Forum & QSIT Copyright Page 1 of 24
1
No part of this presentation may be reproduced without prior written permission from authors, copyright owner and publisher of the book
Metrics & Measurements
2/4/2008 Metrics & Measurements Slide : 2
Agenda
0.1 What is metrics?0.2 Why Metrics?0.3 Steps for metrics0.4 Types of metrics0.5 Overview slide
1. Project Metrics2. Progress Metrics3. Productivity Metrics4. Development Metrics5. Release Metrics

STeP-IN SUMMIT 2008 Metrics & Measurements
STeP_IN Forum & QSIT Copyright Page 2 of 24
2/4/2008 Metrics & Measurements Slide : 3
Metrics
2/4/2008 Metrics & Measurements Slide : 4
What is Metrics
This is the period we noticed excellent profits in the organization …and…Boss, you were on vacation that period!

STeP-IN SUMMIT 2008 Metrics & Measurements
STeP_IN Forum & QSIT Copyright Page 3 of 24
2/4/2008 Metrics & Measurements Slide : 5
Terminology1. Set of data is called information and set of information
combined to provide a perspective is called Metrics. 2. A quantitative measure to explain at what degree an attribute
of testing or product quality or process has performed is calledMetrics.
3. Effort is the actual time that is spent on a particular activity or a phase. “Elapsed days” is the difference between start of an activity to completion of the activity.
4. Measurement is an unit used by metrics (e.g Effort, elapsed days, number of defects …etc). A metric typically uses one of more measurements
2/4/2008 Metrics & Measurements Slide : 6
Why Metrics?
1. How do you determine quality and progress of testing?2. How much testing is completed?3. How much more time is needed for release? 4. How much time needed to fix defects?5. How many Days needed for release?6. How many defects that will be reported by customers?7. Do you know how to prevent defects rather than finding
and fixing them?Do you have answers?

STeP-IN SUMMIT 2008 Metrics & Measurements
STeP_IN Forum & QSIT Copyright Page 4 of 24
2/4/2008 Metrics & Measurements Slide : 7
Why Metrics for Testing?
1. Testing is penultimate cycle of product release --- Determining quality and progress of testing thus is very important
2. How much testing is completed can be measured if you know how much total testing is needed
3. How much more time is needed for release (e.g) Days needed to complete testing = total test cases yet to be executed / test case execution productivity
4. How much time needed to fix defects (e.g) The defect trend gives a rough estimate of defects that will come in future. Metrics helps in predicting the number of defects that can be found in future test cycles (e.g) Total days needed for defect fixes = (Outstanding defects yet to be fixed + Defects that can be found in future test cycles) / defect fixing capability
5. Days needed for release = Max of (days needed for testing, days needed for defect fixes)
2/4/2008 Metrics & Measurements Slide : 8
Why Metrics for QA?
Days needed for release = Max of (Days needed for testing, (Daysneeded for defect fixes + Days needed for regressing outstandingdefect fixes))
In SummaryWhen to make the releaseWhat to release – Based on defect density across modules, their importance to customers and impact analysis of those defects, scope of the product can be decided to release the product on time. Metrics help in making this decision. Are we releasing the product with known quality? – The idea of metrics is not only for meeting the date but also to know the quality of product and ascertaining the decision on whether we are releasing the product with the known quality and whether it willfunction in predictable way in the field.

STeP-IN SUMMIT 2008 Metrics & Measurements
STeP_IN Forum & QSIT Copyright Page 5 of 24
2/4/2008 Metrics & Measurements Slide : 9
Steps for metricsStep 1: Identify what measurements are importantStep 2: Define granularity of measurements ; Granularity depends on
data drilling. Example
Tester: We found 100 more defects in this test pass compared to the previous one
Manager: What aspect of the product testing produced more defects?
Tester: Functionality aspect produced 60 defects out of 100
Manager: Good, what are the components in the product that produced morefunctional defects?
Tester: “Installation” component produced 40 out of those 60
Manager: What particular feature produced that many defects?
Tester: The data migration involving different schema produced 35 out of those 40 defects…….
2/4/2008 Metrics & Measurements Slide : 10
Steps for metrics
Step 3: Decide on periodicity of metrics
Step 4: Analyze metrics and take action items for both positivesand improvement areas
Step 5-n: Track action items from metrics

STeP-IN SUMMIT 2008 Metrics & Measurements
STeP_IN Forum & QSIT Copyright Page 6 of 24
2/4/2008 Metrics & Measurements Slide : 11
Types of metrics
Project metrics: The set of metrics which indicate how the project is planned and executed
Progress metrics: The set of metrics to indicate how different activities of the project are progressing.
Productivity metrics: The set of metrics that takes into account various productivity numbers that can be collected and used for planning and tracking the testing activities.
2/4/2008 Metrics & Measurements Slide : 12
OverviewProcess Metrics
Product Metrics
Project Metrics
Progress Metrics
Productivity Metrics
Effort distribution
Schedule Variance
Effort Variance
Effort distribution
Schedule Variance
Effort Variance
Defect cause distribution
Weighted defects trend
Defect classification trend
Defects trend
Priority outstanding rate
Outstanding defects rate
Defect fix rate
Defect find rate
Defect cause distribution
Weighted defects trend
Defect classification trend
Defects trend
Priority outstanding rate
Outstanding defects rate
Defect fix rate
Defect find rate
Introduced and reopened defects rate
Age analysis of outstanding defects
Defect density and defect removal rate
Component-wise defect distribution
Introduced and reopened defects rate
Age analysis of outstanding defects
Defect density and defect removal rate
Component-wise defect distribution
Closed defects distribution
Test phase effectiveness
Defects per 100 failed test cases
Defects per 100 test cases
Test cases developed per 100 hours
Test cases executed per 100 hrs of testing
Defects per 100 hrs of testing
Closed defects distribution
Test phase effectiveness
Defects per 100 failed test cases
Defects per 100 test cases
Test cases developed per 100 hours
Test cases executed per 100 hrs of testing
Defects per 100 hrs of testing.
.
.
.
Development defect metrics
Testing defect metrics

STeP-IN SUMMIT 2008 Metrics & Measurements
STeP_IN Forum & QSIT Copyright Page 7 of 24
2/4/2008 Metrics & Measurements Slide : 13
1. Project Metrics – Effort Variance (Planned Vs Actual)
Phase Wise Effort Variation
0.0010.0020.00
30.0040.00
Req Design Coding Testing Doc Defectfixing
Pers
on D
ays
Baselined Estimate Revised Estimate Actual
2/4/2008 Metrics & Measurements Slide : 14
1. Project Metrics – Schedule Variance (Planned Vs Actual)
Schedule Variance
126.00 136.00 110.00
56.00
0.00
50.00
100.00
150.00
200.00
Baseline Estimated Actual/Remaining
No.
of D
ays
Estimated Remaining

STeP-IN SUMMIT 2008 Metrics & Measurements
STeP_IN Forum & QSIT Copyright Page 8 of 24
2/4/2008 Metrics & Measurements Slide : 15
1. Project Metrics – Effort & Schedule Variance
Over estimation & over schedule;Both effort and schedule Estimation needs improvement
Negative varianceNegative variance
Over estimation & schedule;Both effort and schedule Estimation needs improvement
Zero or acceptable variance
Negative variance
Under estimation of both effort and schedule
Unacceptable variance
Unacceptable variance
Under estimation (People get burnt);Needs further analysis
Zero or acceptable variance
Unacceptable variance
Need slight improvement in effort / schedule estimation
Acceptable variance
Zero or acceptable variance
A well executed projectZero varianceZero or Acceptable variance
Probable causes / ResultSchedule VarianceEffort Variance
2/4/2008 Metrics & Measurements Slide : 16
1. Project Metrics – Effort & Schedule Variance
I have no Effort & Schedule Metrics in my organization ;
No problems whatsoever!!

STeP-IN SUMMIT 2008 Metrics & Measurements
STeP_IN Forum & QSIT Copyright Page 9 of 24
2/4/2008 Metrics & Measurements Slide : 17
1. Project Metrics – Effort distribution
Actual effort distribution
23%
18%
15%
22%
0%
5%17%
Req Design Coding Testing Doc bug f ixing
1. Matured orgn spend atleast 10-15% in requirements 10-15% in design and 40-50% in testing (This data normally comes from time sheets)
2. Adequate effort needs to be spent in each of the SDLC phase for a quality product release (both more testing and less testing are issues)
2/4/2008 Metrics & Measurements Slide : 18
1. Project Metrics
Time for a break; Here are related metrics but can’t be used though ☺
Pizza MetricHow: Count the number of pizza boxes in the lab over period. What: More boxes means more under estimation.
Aspirin MetricHow: Maintain a centrally-located aspirin bottle for use by the team and count usage over period. What: Measures stress suffered by the team during the project.
Beer MetricHow: Invite the team to a beer bash each Friday. Record the total bar bill.What: Closely related to the Aspirin Metric, the Beer Metric measures the frustration level of the team.

STeP-IN SUMMIT 2008 Metrics & Measurements
STeP_IN Forum & QSIT Copyright Page 10 of 24
2/4/2008 Metrics & Measurements Slide : 19
2. Progress Metrics –Testing progress
0%
20%
40%
60%
80%
100%
1 2 3 4 5 6 7 8
Week
Test cases executed Blocked
Not Run
Fail
Pass
• Increase in pass % indicate, quality of product improving
• Decrease in Blocked % indicate, tests can progress well
• Reduced % in fail, is requirement for a release
• Not run % should be Zero for the release ; final week should have only Pass and Fail %
2/4/2008 Metrics & Measurements Slide : 20
2. Progress Metrics –Defect find rate
Objective: The purpose of testing is to find defects early in the test cycle
Defect find rate
time->
Num
ber o
f def
ects

STeP-IN SUMMIT 2008 Metrics & Measurements
STeP_IN Forum & QSIT Copyright Page 11 of 24
2/4/2008 Metrics & Measurements Slide : 21
2. Progress Metrics –Defect fix rate
Objective: The purpose of development is to fix defects as soon as they are identified
Defect find rate
time->
Num
ber o
f def
ects
Defect fix rate
2/4/2008 Metrics & Measurements Slide : 22
2. Progress Metrics –Outstanding defects
Objective: A well-executed project has the number of outstanding defects which is very close to zero all the time during test cycle
Defect find rate
time->
Num
ber o
f def
ects
Outstanding defects
STeP-IN SUMMIT 2008 Metrics & Measurements
STeP_IN Forum & QSIT Copyright Page 12 of 24
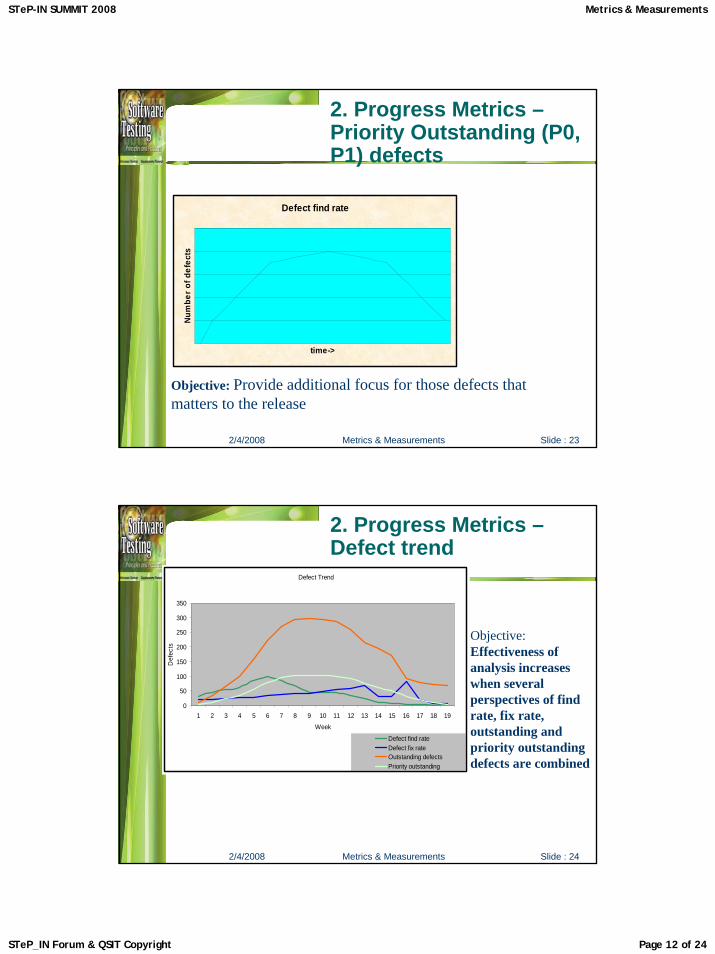
2/4/2008 Metrics & Measurements Slide : 23
2. Progress Metrics –Priority Outstanding (P0, P1) defects
Objective: Provide additional focus for those defects that matters to the release
Defect find rate
time->
Num
ber o
f def
ects
2/4/2008 Metrics & Measurements Slide : 24
2. Progress Metrics –Defect trend
Objective: Effectiveness of analysis increases when several perspectives of find rate, fix rate, outstanding and priority outstanding defects are combined
Defect Trend
0
50
100
150
200
250
300
350
1 2 3 4 5 6 7 8 9 10 11 12 13 14 15 16 17 18 19
Week
Def
ects
Defect find rateDefect fix rateOutstanding defects Priority outstanding

STeP-IN SUMMIT 2008 Metrics & Measurements
STeP_IN Forum & QSIT Copyright Page 13 of 24
2/4/2008 Metrics & Measurements Slide : 25
2. Progress Metrics –Defect trend
0
4
8
12
16
20
24
28
32
Week Starting
No. of Defects
Actual Open 3 13 14 10 7 6 2
Defects Found 8 16 15 10 18 17 2
Defects Fixed 9 5 12 13 24 18 6
P1 Found 2 9 3 4 6 6 1
P2 Found 6 7 12 6 12 11 1
Forecast Open 10 15 20 20 11 6 4
Forecast Found 15 20 25 15 6 5 4
Forecast Fixed 5 15 20 15 10 5 3
Actual Defer 0 0 0 0 0 0 0
4-Apr 11-Apr 18-Apr 25-Apr 2-May 9-May 16-May
2/4/2008 Metrics & Measurements Slide : 26
0
10
20
30
40
50
60
70
Week1 Week2 Week3 Week4 Week5 Week6 Week7 Week8 Week9 Week10
Find rate Fix rate Deferred
Defect StagesIncreasing
Bugs (Stage I)
ControlledChanges
(Stage IV)
DecliningBugs
(Stage III)
Bug Peak
(Stage II)

STeP-IN SUMMIT 2008 Metrics & Measurements
STeP_IN Forum & QSIT Copyright Page 14 of 24
2/4/2008 Metrics & Measurements Slide : 27
2. Progress Metrics – Defect Distribution & Trend
Defect distributionP0
11%
P118%
P218%
P335%
P418%
Defect classification trend
020406080
100120140
1 2 3 4 5 6 7 8 9 10
week
P4
P3
P2
P1
P0
Objective: Providing the perspective of defect classification in the chart helps in finding out on how the defects are distributed
2/4/2008 Metrics & Measurements Slide : 28
2. Progress Metrics –Weighted Defects
Weighted defects = (P0* 5 + P1 * 4 + P2 *3 + P3 *2+ P4)
Both “large defects” and “large number of small defects” affect the product release0
50
100
150
200
250
300
350
400
1 2 3 4 5 6 7 8 9 10Week
Weighted

STeP-IN SUMMIT 2008 Metrics & Measurements
STeP_IN Forum & QSIT Copyright Page 15 of 24
2/4/2008 Metrics & Measurements Slide : 29
2. Progress Metrics
If my son is doing so badly, then why is it called Progress report?
Project report metricHow: Count the total number of words of the project status report.
What: This is a simple way to estimate the progress of project. If things are going well, an item will read, "I talked to Fred; the widgets are on schedule." If things are not going as well, it will say, "I finally got in touch with Fred after talking to his phone mail for nine days straight. It appears that the widgets will be delayed due to snow in the Ozarks, which will cause the whoozits schedule to be put on hold until widgets arrive. If the whoozitsschedule slips by three weeks, then the entire project is in danger of missing the July deadline."
Time for a break
2/4/2008 Metrics & Measurements Slide : 30
3. Development Metrics –Defect Cause
Knowing the causes (Why a defect happened) of defects help in finding more defects and also in preventing such defects early
Requirement15%
Design10%
Code37%
Feature request
4%
Change request
20%
Third party8%
Others6% Requirement
Design
Code
FeaturerequestChangerequestThird party
Others

STeP-IN SUMMIT 2008 Metrics & Measurements
STeP_IN Forum & QSIT Copyright Page 16 of 24
2/4/2008 Metrics & Measurements Slide : 31
3. Development Metrics –Module-wise defects
Knowing the components producing more defects help in defect fix plan and in deciding what to release
0 10 20 30 40
Defect
Install
Reports
admin
login
GUI
Client
Server
Database
Media
API
Modulewise Defect DistributionP0P1P2P3P4
2/4/2008 Metrics & Measurements Slide : 32
3. Development Metrics –Defects/KLOC & defect removal rate
Defects per KLOC = (Total defects found in the product) / (Total executable AMD lines of the code in KLOC)
Note: AMD=added/modified/deleted
Defect removal % = (Defects found thru verification activities + defects found by DEV team) / (Defects found by test teams)* 100
Defects/KLOC & Defect removal %
0
10
20
30
40
50
60
70
1 2 3 4 5 6 7 8Releases
Valu
e
Defects/KLOCDefect removal %

STeP-IN SUMMIT 2008 Metrics & Measurements
STeP_IN Forum & QSIT Copyright Page 17 of 24
2/4/2008 Metrics & Measurements Slide : 33
3. Development Metrics –Age analysis of outstanding defects
Age analysis of outstanding defects
05
101520253035404550
1 2 3 4 5 6 7 8 9 10
Week
Cum
ulat
ive
age
P4
P3P2
P1P0
The time needed to fix a defect
may be proportional to
its age
2/4/2008 Metrics & Measurements Slide : 34
3. Development Metrics –Reopened and introduced defects
Testing is not there to find same
defects again; Release readiness should consider quality of defect
fixes0
10
20
30
40
50
60
Defects
1 2 3 4 5 6 7 8 9 10
Week
Introduced & Reopened Defects Reopened defects
Introduced defects

STeP-IN SUMMIT 2008 Metrics & Measurements
STeP_IN Forum & QSIT Copyright Page 18 of 24
2/4/2008 Metrics & Measurements Slide : 35
4. Productivity metrics
• Honesty and Trust are fundamental requirements for productivity metrics
• Productivity metrics are not for people; it is for processes
2/4/2008 Metrics & Measurements Slide : 36
4. Productivity metrics –Defects per 100 hrs of testing
Defects per 100 hours of testing
0
20
40
60
80
100
120
1 2 3 4 5 6 7 8 9 10
Week
Def
ects
CosmeticMinorImportantCriticalExtreme
Defects per 100 hours of testing = (Total defects found in the product for a period / Total hours spent to get those defects) * 100
Normalizing the defects with effort spent indicates another perspective for release quality

STeP-IN SUMMIT 2008 Metrics & Measurements
STeP_IN Forum & QSIT Copyright Page 19 of 24
2/4/2008 Metrics & Measurements Slide : 37
4. Productivity metrics – Test productivity
Productivity Metrics
0
20
40
60
80
100
120
140
160
180
200
1 2 3 4 5 6 7 8 9 10Week
Test cases executed per 100 hours Test cases developed per 100 hours
Defects per 100 test cases Defects per 100 failed test cases
2/4/2008 Metrics & Measurements Slide : 38
4. Productivity metrics –Test Phase effectiveness
Test phase effectiveness
CT32%
IT17%
ST12%
UT39%
Testing is the responsibility of everyone and multiple teams does testing
Hence it is important to analyze which phase (not teams) found more defects

STeP-IN SUMMIT 2008 Metrics & Measurements
STeP_IN Forum & QSIT Copyright Page 20 of 24
2/4/2008 Metrics & Measurements Slide : 39
4. Productivity metrics –Closed defect distribution
Fixed in closed is a good metric to have for both DEV & test teams
Duplicate to be avoided (<5%)
Not reproducable defects may reappear again; need to be careful
Defects moving to next release needs to be with in certain band (3-6%)
Closed defect distribution
Will not fix32%
Next release1%
Others8%
Fixed28%
Duplicate19%
Not reproducable
11%As per design
7%
2/4/2008 Metrics & Measurements Slide : 40
5. Release Metrics
Q: How do you estimate release date?
Ans: A carefully calculated date determined by estimating the actual shipping date and subtracting six months from it.
Q: How do you release with Quality that customer wants?
Ans: Software release undergoes alpha testing as a first step in getting user feedback.
Honest Manager
Alpha is Latin for "doesn't work."

STeP-IN SUMMIT 2008 Metrics & Measurements
STeP_IN Forum & QSIT Copyright Page 21 of 24
2/4/2008 Metrics & Measurements Slide : 41
5. Release Metrics
1.Weighted defects trend showing “Bell curve”2.Close to zero weighted defects in the last few weeks prior to release
High priority defects as well as high number of low priority defects
Weighted defects trend
Close to zero high-priority defects in the last few weeks prior to release
High Priority defectsPriority Outstanding defects trend
1.Outstanding defects trend showing “downward” trend2.Close to zero outstanding defects in the last few weeks prior to release
Outstanding defectsOutstanding defects trend
Defect fixing trend matching arrival trendDefect fix trendDefect fix rate
1.Defect arrival trend showing ‘bell curve”2.Incoming defects close to zero in the last week
Defect trendDefect find rate
15-20% effort spent each on Requirements, design and Testing phases
Adequate effort has been spent on all phases
Effort Distribution
1.All 100% of test cases to be executed2.Test cases passed should be minimum 98%
Execution %Pass %
Test cases executed
GuidelinesPerspectives to be considered
Name of the metric
2/4/2008 Metrics & Measurements Slide : 42
5. Release Metrics
Test cases executed showing an upward trend
Whether improved quality in product allowing more test cases being executed
Whether test cases executed is proportional to effort spent
Test cases executed per 100 hours of testing
1. Defects per 100 hours of testing should be less than 5
2. Defects per 100 hours of testing trend showing downward trend
Whether defect arrival is proportional to effort spent
Defects per 100 hours of testing
1. Combined number of outstanding & reopened defects showing downward trend
2. Introduced & reopened defects are less than 5% of defect arrival rate
Quality of defect fixSame defects reappearing
again
Introduced and reopened defects
Age of defects showing downward trendAge of defectsAge analysis of outstanding defects
1. Defects / KLOC less than 72. Defects / KLOC less than last release3. Defect removal is 50% of more4. Defect removal % better than last
release
Defects /KLOCDefect removal %
Defect density and defect removal rate
GuidelinesPerspectives to be considered
Name of the metric

STeP-IN SUMMIT 2008 Metrics & Measurements
STeP_IN Forum & QSIT Copyright Page 22 of 24
2/4/2008 Metrics & Measurements Slide : 43
5. Release Metrics
1.At least 70% of closed defects are fixed2.Non-reproducible defects are less than 5%3.Defects moved to next release should be less than 10%
Whether good proportion of defects found by testing are fixed
Closed defects distribution
1.Very low percentage of defects found in system and acceptance test phase (say less than 12%)2.A distribution of defects and reduction in defects % compared to next test phase3.A distribution of UT=50%, CT=30%, IT=13% and ST=7% would be ideal
Defects found in each of the test phase
Test phase effectiveness
GuidelinesPerspectives to be consideredName of the metric
2/4/2008 Metrics & Measurements Slide : 44
5. Release Metrics - SummaryTestcases executed P1 3 4 = Completely met Effort Distribution P2 4 3 = Partially metDefect Find rate P3 3 2 = Met with some exceptionsDefect fix rate P4 3 1 = Not met Outstanding defects trend P5 3 0 = Not met with serious objectionsPriority outstanding trend P6 3Weighted defects P7 3Defect density P8 3Defect removal rate P9 1Age analysis P10 1Defects per 100 hrs P11 3Test cases executed per 100 hrs P12 2Test phase effectiveness P13 2Closed defects distribution P14 1
Release Metrics - Summary01234P1
P2P3
P4
P5
P6P7
P8P9
P10
P11
P12
P13P14

STeP-IN SUMMIT 2008 Metrics & Measurements
STeP_IN Forum & QSIT Copyright Page 23 of 24
2/4/2008 Metrics & Measurements Slide : 45
5. Release Metrics
“You are the guy who ordered the 2005 windows?”“You are the guy who ordered the 2005 windows?”
2/4/2008 Metrics & Measurements Slide : 46
Metrics & Measurements
1. Book – Chapter 17: “Software Testing –Principles & Practice”; Srinivasan Desikan & Ramesh Gopalaswamy; Pearson Education, 2005-2006
Disclaimer
The views and jokes expressed in this presentation are my own and not necessarily that of my employer!.

STeP-IN SUMMIT 2008 Metrics & Measurements
STeP_IN Forum & QSIT Copyright Page 24 of 24
2/4/2008 Metrics & Measurements Slide : 47
Thank you!Thank you!