Embed Size (px)
Citation preview

BIS RESEARCH PAPER NO. 190
Metrics and models used to assess company and investment performance
OCTOBER 2014
1

Metrics and models used to assess company and investment performance
2

Metrics and models used to assess company and investment performance
Contents Acknowledgments ........................................................................................................................ 4
Introduction ................................................................................................................................... 5
Key findings and suggestions ..................................................................................................... 7
Approach ..................................................................................................................................... 14
Part A: The end investor-asset manager relationship .............................................................. 18
A1 Fund manager procurement and selection ........................................................................... 19
A2 Monitoring of stewardship by fund managers ....................................................................... 27
A3 The not-for-profit institutional sector ..................................................................................... 31
A4 Organisational investment time horizons and client reporting ............................................... 36
A5 Investment fund ratings and performance numbers ............................................................. 44
A6 Suitability ............................................................................................................................. 58
Part B: The asset manager-corporate manager relationship ................................................... 67
B1 ‘Narrow’ metrics and models ................................................................................................ 68
B2 Ownership changes ............................................................................................................. 78
B3 Earnings guidance ............................................................................................................... 83
B4 Sell-side analysis ................................................................................................................. 89
Part C: Dividends C1 Dividends ................................................................................................. 94
Dividends from an investment portfolio perspective ................................................................... 96
Dividends from a corporate decision making perspective ........................................................ 100
Concluding remarks ................................................................................................................. 106
References ................................................................................................................................ 108
3

Metrics and models used to assess company and investment performance
Acknowledgments Authors London Economics Patrice Muller, Senior Managing Partner Shaan Devnani, Senior Economic Consultant
Dr. Paul Cox Dr. Paul Cox is Senior Lecturer in finance and member of the Centre for Household Assets and Saving Management, a research centre based at the University of Birmingham.
Contributors to the research We would like to thank the steering panel for its guidance during this research, which included Saker Nusseibeh1, Anne Richards2, Anne Marden3, Sarah Breeden4, Colin Wilson5, Alexander Ljungqvist6 and John Thanassoulis7; the support of Alastair Cowie and colleagues Regis Lopez and Nick Herrick at BIS; the suggestions by Richard Taffler8 who provided helpful feedback through the research regarding Part B; the chapter on ‘Narrow’ metrics and models contributed by Jane Fuller9; and the great many professionals who gave their time to be interviewed.
The views expressed in this report do not necessarily reflect those of the Department for Business, Innovation and Skills (BIS) or the steering panel. This report is submitted to BIS and is not a statement of Government policy.
1 Hermes Fund Managers 2 Aberdeen Asset Management 3 JP Morgan 4 Bank of England 5 Government Actuaries Department 6 NYU Stern Business School 7 University of Warwick 8 Warwick Business School 9 Centre for the Study of Financial Innovation
4

Metrics and models used to assess company and investment performance
Introduction
Background In 2012 Professor John Kay published his independent review of investment in UK equity markets, examining its impact on the long-term performance and governance of publicly-traded UK companies.10 The Kay Review highlighted how the growth of intermediation in the investment chain between companies and end investors has led to an increased potential for misaligned incentives and market failures. Consequently, investors rely on metrics or models to judge the performance of companies. Such metrics and models may have inherent limitations for investors with long-term investment horizons.
Moreover, intermediaries have incentives to promote the use of particular metrics or models which prompt investment decisions in line with intermediaries’ interests rather than those of the end investors. As such, investment decisions may shift from what is in the best interests of long-term investors.
This research was therefore commissioned to look in more detail at the role of metrics and models, and the way they are used by different parts in the investment chain. In initiating this research, metrics and models were originally conceived of narrowly as explicit indicators that drive investment decision-making, such as free cash flow and price-to-earnings comparables. However, it became clear during the research that the scope of the terms 'metrics' and 'models' cover a far broader range of qualitative and quantitative factors where company and investment evaluation is concerned.
Approach Given a broader perspective on metrics and models, the research had the potential to become dominated by the minutiae of considerations involved when arriving at investment decisions, perhaps at the expense of insights into the impact on long-term decision-making. To address this issue, a principal-agent framework has been used because it focuses on the role of metrics and models in investment decision-making within the context of the relationships between end investor, asset manager and corporate manager.
A series of principal-agent relationships are in play here: asset managers (agents) are tasked with acting in the interests of end investors (principals), and corporate managers (agents) are tasked with acting in the interests of stakeholders including, among others, shareholders represented by asset managers (principals). Broadly defined metrics and models are used widely, implicitly or explicitly, to monitor that agents are acting in the best interests of principals. They can be understood in terms of whether they are effective in achieving this objective.
The research was conducted using a series of semi-structured interviews with a variety of market participants, including company CEOs, investor relations managers, seel-side
10 The Kay Review (2012)
5

Metrics and models used to assess company and investment performance
analysts, buy-side researchers, asset managers, a variety of types of investor and a number of representative bodies.
The suggestions made in this research paper seek to improve the range of metrics used for principals to monitor agents acting on their behalf. We have sought to avoid substitution of one set of problematic metrics with others. Rather the aim is to improve the functioning of principal-agent relationships.
Equally the suggestions seek to enable greater trust between corporate managers, investment managers and end investors, so as to reduce, for instance, the number of investment decisions made in response to short-term changes in company performance (‘blips’) that do not affect the company’s long-term prospects. Trust was also a key theme of the Kay Review: trust between corporate managers and shareholders is essential if companies are to make effective long-term investment decisions.
In conclusion, these suggestions and the outcomes of this research aim to help orientate the institutions that are stewards of end investors’ assets towards the long term. It is hoped that this research provides a broad framework of understanding pertinent to investment performance assessments, whilst contributing to a generalisable framework of knowledge in this area.
The research is presented in three parts:
• Part A considers the relationships between end investors and asset managers and in particular the role of metrics and models used by end investors in the selection and monitoring of investment funds and asset managers. It is researched and written by Dr Paul Cox.
• Part B considers the relationships between asset managers and company management, and the role of metrics and models used by asset managers in the selection of equity investments and the monitoring of those investments. It is researched and written by London Economics.
• Part C explores the role of company dividends, both from the investment portfolio perspective, and in informing decisions by asset managers. It is researched and written by both Dr Paul Cox and London Economics.
6
Metrics and models used to assess company and investment performance
Key findings and suggestions Part A Part A considers the role of metrics and models used by investment funds and the investment management industry, and how they serve end investors. It reports findings from interviews and workshops involving a great variety of experts from the UK and overseas. In total, 42 meetings were carried out. Thirty seven meetings were with independent financial advisers (IFAs), private client stock brokers, family offices, wealth management companies, investment consulting companies, fund managers, pension funds, national reserve funds and charities. Five meetings were with professional bodies and consumer representative groups. The knowledge, experience and expertise of the interviewees provided the study with a rich source of information and valuable discourse. Three workshops were also held at which there were a total of 50 participants. Throughout this research period, the study was particularly focused on whether models, metrics and measures are having a harmful short-term effect, and what might be done if there is to be a beneficial effect along the investment chain.
The research finds that, for the most part, existing metrics are there for good reason. However, we have observed a disproportionate reliance on one or a small number of metrics and models when a greater variety and balance would better cover what investors want to examine. Overall, the research finds that there is value in encouraging a greater variety of models and metrics, and scope to develop alternative metrics and models in a number of areas. It makes a number of suggestions which are a combination of policy suggestions, industry suggestions, ideas to generate discussion, and ideas that help share good practice. The objective is that they form the basis for constructive action to improve the models and metrics used by investors and the investment management industry.
Key findings and suggestions are summarised below:
• Chapter A1 focuses on the process of fund manager procurement and selection process undertaken by institutional asset owners. It finds that there is a need to ensure greater consistency of message about time horizons throughout the whole of the procurement and selection process. It suggests that institutional asset investors should use mandates and related correspondence with fund managers to more explicitly articulate an investment time horizon for all to be clear about. It suggests that institutional asset owners should integrate questions about the long-term within the procurement process and allocate weight to these. Examples are provided of questions the procurement process might usefully include.
• Chapter A2 considers the approach taken to monitoring stewardship activity undertaken by fund managers. It finds that there is scope for institutional asset owners to play a greater role in building stewardship objectives into investment mandates and into the monitoring of asset managers’ stewardship activity. It finds there is scope to improve the dialogue between asset owners and asset managers on stewardship. It suggests that fund managers should demonstrate how they have discharged stewardship through specific stewardship reporting, and suggests a reporting framework which might be used. It further suggests that this might
7
Metrics and models used to assess company and investment performance
complement, or inform the development of, both the Stewardship Code and related industry initiatives which seek to improve the focus on stewardship in the asset owner and fund manager relationship.
• Chapter A3 examines the role played by the not-for-profit institutional sector. It finds that the institutional asset owner sector, and the not-for-profit sector in particular, has a pivotal position in setting investment management contracts, and has significant potential to slow the system – i.e. to focus on returns from long-term patient investments. It identifies a willingness to share knowledge, expertise and combine resource for the improvement of decision making across the sector. It suggests that greater focus is needed on the not-for-profit sector, and that the sector should create its own profession, in particular in response to the development of investment principles, concepts, processes, law, and regulation surrounding the sector. It proposes that this might involve specific study of the area in education, the creation of a professional institute, and establishing a principles-based code of practice.
• Chapter A4 explores in more detail the concept of organisational investment time horizons in the context of reporting by asset managers to their clients. It finds a lack of clarity about the investment time horizon around which many organisations calibrate their business. In some cases different parts of an organisation may be operating to different time horizons. It concludes that this can be a cause of short-term approaches which fail to meet investors’ needs. It suggests that fund management firms should articulate an organisational investment time horizon either for the whole company or for their investment business, and that this should be aligned to average client investment maturity. Examples are provided about how average client investment maturity is calculated. It also finds that, although organisations operated and articulated quite different investment time horizons, reporting to investment clients was largely uniform and homogenous. Suggestions are made about metrics that might add balance to current investment reporting, provide a more meaningful comparison to client objectives, and prevent a shortening of time horizons.
• Chapter A5 looks at the retail investment sector, and finds that investment decisions are strongly influenced by investment fund ratings based on past performance metrics. These have developed in response to the large number of frequently changing funds available. The research finds that overreliance on ratings is driving unwarranted portfolio turnover on the basis of short-term relative performance. Three suggestions are made to address this issue. First, alternative metrics are suggested to focus retail investors away from ratings and numbers towards more of an ownership mindset. Second, regulation is suggested to encourage the consolidation of funds, which would help to create greater continuity and identity of funds, economies of scale, and a better understanding of which funds managers have the skill to make good investment decisions. Finally, an organisation could be created to act as an advocate for savers and encourage greater alignment between the interests of end investors and the investment funds that serve them.
• Chapter A6 also focuses on the retail investment sector. It identifies uncertainty about application of “suitability” requirements on asset managers and advisors to ensure investments are appropriate for their clients in terms of risk. It suggests that in response to the threat of customer complaints and enforcement action, asset managers are over-monitoring of client portfolios, setting overly narrow volatility bands, and setting risk
8

Metrics and models used to assess company and investment performance
targets that appear to overly de-risk the client relative to his or her risk tolerance. It argues this is leading to excessive portfolio turnover. Again three suggestions are made to address this issue. First, fixed price fund management could be introduced to reduce excessive portfolio turnover. Second, managers should show clients and the regulator the impact on portfolio turnover if volatility bands were narrowed or widened slightly from their current position – to clearly show the trade-off involved. Finally disaggregated reporting of portfolio turnover could be revealed to both clients and companies.
Part B Part B focuses on the principal-agent relationships arising between corporate managers (agents) and asset managers (principals) representing end investors. To develop an evidence base, a series of semi-structured interviews with market participants, including CEOs and asset managers, were carried out. Interviews with asset managers were structured around investments into particular companies that individual asset managers had made, and interviews with corporate personnel centred on the particular companies receiving investment.
Chapter B1 provides an introductory analysis of metrics and models commonly used in investment analysis, discussing their uses and limitations for different types of investor. It concludes that most equity investors use a broader range of qualitative and quantitative factors to inform their investment decisions.
The remainder of this part of the research then explores the issues that were raised most frequently through interviews as giving rise to short-termism:
• Chapter B2 focuses on the impact of changes in share ownership on corporate decisions. It finds that corporate managers may be taking actions in response to ownership changes when they do not fully understand the reasons for these changes. In particular they may be conscious of the share price implications of such events, and interpret them as a market view of the fundamentals of the company, when in fact they have been motivated by other considerations such as changes to asset allocation in an investment fund or wider portfolio. Asset managers confirmed that this information is something that they rarely disclose to companies. The research therefore recommends that companies hold exit interviews to communicate with shareholders that divest themselves of substantial holdings.
• Chapter B3 considers the relationship between earnings guidance and short-termism. It finds that earnings guidance tends to be focused on point estimates of future performance which can become targets for company management, and triggers for decisions by investors as to whether a company is on track to deliver against its strategy. It suggests that if earnings guidance is being provided it should avoid providing point estimates and should instead communicate uncertainty around forecasts by reporting the path of earnings within a range using fan charts. It suggests this would dampen the potential for unwarranted reactions to differences between market expectations and realisations of earnings. It also suggests that companies and investors should have an annual meeting focused on forward looking company strategy only, separate from the reporting cycle and the AGM.
9
Metrics and models used to assess company and investment performance
• Chapter B4 explores the role of sell-side analysts in providing information to asset managers and investors. It finds that market participants have concerns that sell-side analysis is subject to conflicts of interest and misaligned incentives. It suggests that further research would be beneficial into the barriers faced by the independent research sector in the market for analysis.
Part C Part C – comprising chapter C1 – is a synthesis of findings emerging from the research conducted for Parts A and B on the role of company dividends.
The first part considers dividends from the investment portfolio perspective. It finds that: • many end investors find dividends useful, understandable, and valuable; • dividends can encourage long-term investment, both because a focus on yield often
leads to investing on low valuation (a value investing style), and because attention paid to dividends encourages a long-term holding - to achieve a return it is not necessary to crystallise the investment;
• taxation of dividends has reduced the level of interest in dividends and contributed to an investment culture based more around short-term capital gain: the preference for dividends in the absence of taxation would be significantly higher; and
• companies have responded to the reduced level of interest in dividends and greater interest in capital gain by designing capital gain into executive remuneration systems. This has led the system to increasingly orientate around capital gain, when investors would rather a more mixed split of investment return.
It proposes that funds provide information to help investors better understand the role of dividends as a source of investment return. Specifically it proposes that funds could report to investors the proportion of fund return coming from dividends and from capital gain and provide information on companies’ track record on dividends and potential future dividends.
Having established the presence of significant underlying investor interest in dividends, the second part of the chapter focuses on dividends from a corporate decision making perspective. It finds that deviations from dividend policy in the form of dividend cuts signal deterioration in company and investment performance to investors. This is because companies set their dividend policy according to what they think they can deliver, and failing to deliver what has been promised sends a signal that management is not in control of the company. Due to the negative share price response that dividend cuts tend to elicit, corporate managers have the incentive to manage dividend realisations at the cost of long-term investments (namely, by directing capital back to investors in the form of dividends at the cost of investments that exceed the company’s hurdle rate).
The research suggests changes in the design of dividend policy to reduce the extent to which investors disinvest in response to short-term dividend variability which does not reflect the long-term prospects of the company. One suggestion is that companies could more routinely split their dividend into (i) a steady long-term component and (ii) a fluctuating short-term component. A further suggestion is that expected dividends could be linked more explicitly to the earnings guidance which provides information about expected performance in a range, rather than as a point estimate, as suggested in chapter B3.
10

Metrics and models used to assess company and investment performance
The role of remuneration The research also found that remuneration is crucial within the principal-agent context of asset manager and corporate manager; and, in turn, the allocation of savings to investments.
The purpose of linking executive remuneration to share price was originally to better align the executive’s incentives with shareholder returns. In this instance, the alignment of executive remuneration and corporate goals was the ‘metric’ used for assessing the effectiveness of principal-agent relationship that company executives and shareholders were engaged in. Over time, the role of performance-related-pay in executive remuneration has increased, for example, through long-term incentive plans (LTIPs).
However, as performance-related-pay has increased, rather than increasing in turn the alignment of incentives between executives and shareholders, the research suggests that executives have an incentive to maximise short-term share price performance at the cost of long-term value creation.
The in-depth interviews carried out with stakeholders as part of this research highlighted that the linking of executive remuneration to share price developments is a key factor in the incidence of short-term decision-making by corporate managers in many settings.
For instance, dividend cuts can elicit share price reactions so corporate managers are incentivised to maintain dividends potentially at the cost of productive investments. Additionally, the provision of earnings guidance can lead to short-termism through the share price due to the constant pressure to manage market expectations regarding future profits.
Corporate managers are not alone in being incentivised to focus on the short-term. The incentives of sell-side analysts may also fuel short-termism in the corporate sector, for instance, through recommendations geared to generate trading activity.
Crucially, short-termism on the part of asset managers is also a key cause of short-termism on the part of corporate managers: without the willingness of asset managers to shift capital between companies based on short-term factors, corporate managers would not be as incentivised towards short-term decision-making.
On the one hand, asset management firms may be motivated to achieve short-term returns as a means of managing business risk, in the sense of achieving performance that allows for the retention and growth of assets under management. On the other hand, at the level of the individual asset manager, he or she may manage career risk by transferring capital from one investment to another based on the expectation of short-term share price performance.11
In the presence of these short term incentives arising from the link between remuneration and performance, the research suggests that actions that seek to re-align the motives of the corporate manager and shareholders, such as increasing the time horizon over which
11 Tuckett and Taffler (2012) describe business risk and career risk of asset managers
11

Metrics and models used to assess company and investment performance
performance outcomes are rewarded are necessary. Suggestions for change in Parts B and C are therefore made with reference to remuneration reform that would align corporate managers’ and others’ incentives with shareholders’ and long-term value creation.
The role of trust Trust is also crucial in the context of the principal-agent relationship between asset managers and corporate managers. Asset managers are aware of the possibility that they may not have access to the right information. As Tuckett and Taffler elaborate on the thoughts of asset managers, “Is the information [provided by corporate manager to asset manager] accurate? Have important factors that should affect the investment decision been overlooked or misunderstood?” 12 There is therefore a need for asset managers to establish trust in corporate managers; which one author describes as follows: “Trust is said to involve giving discretion to or relying on or being vulnerable to another under uncertain conditions”.13
Theoretically, once trust is established it is linked to reducing transaction costs14. Focusing on capital raising, evidence shows that trust improves relationships firms have with banks15 and, for smaller firms, other institutions such as venture capital funds16 that providing external finance.
Empirically, there is evidence that trust is economically relevant – contributing to lowering the cost of capital faced by firms whose corporate management is trusted. A study by He, for instance, develops a trust score for firms based on accounting restatement, earnings management, CEO compensation, board size shrinking, fraud and litigation and auditor change; and shows that firms with a higher trust score face a lower cost of capital.17 Another study, by Guiso et al., finds that firms with high levels of social trust 'have more access to credit and are more likely to have multiple shareholders'.18
Qualitatively, Tuckett and Taffler demonstrate the importance of trust of corporate managers in how asset managers carry out investment analysis. Through a content-analysis of 52 asset manager interviews, in which asset managers discussed their investments, trust was the second most frequently mentioned emotion-laden key words used.
12 Tuckett and Taffler (2012) 13 Shapiro (2012) 14 Dwyer, Schurr and Oh (1987) 15 Howorth and Moro (2006) 16 Strätling, Wijbenga and Dietz (2012) 17 He (2013) 18 Guiso et al. (2001)
12

Metrics and models used to assess company and investment performance
Table 1: Relative frequency of some emotive words in 52 asset manager interviews Word or word stem Frequency of mention Worry*a 199 Trust*b 113 Hope* 102 Love* 90 Disappoint* 80 Fear*/afraid 62 Excite* 32 Hate* 26 Irrational 18 Greed* 13 Anxiety/anxious 11 (3)c Anger 3 Notes: a Word stems include various forms of the word. For example, ‘Worry*’ covers ‘worry’ (107 mentions), ‘worried’ (69), ‘worrying’ (22), and ‘worrier’ (1), and ‘Trust*’ covers ‘trust (97 mentions), ‘trusted’ (8), ‘trusting’ (4), ‘trusts’ (2), ‘trustworthy’ (1), and ‘dis-trust’ (1). b Mentions of investment trusts, bank trusts, unit trusts, etc. were omitted c Only three mentioned were volunteered unprompted Source: Tuckett and Taffler (2012)19
In practical terms, asset managers codify the need to establish trust within their investment decision-making processes as metrics and models for assessing management quality; that is, in the context of uncertainty, asset managers attempt to assess management plans and the likelihood that they will bear the intended results over the course of time. One asset manager interviewed as part of this research, for example, described how it assesses management quality with reference to its ‘strategic vision’ and whether ‘management forecasts sensibly’.
The discussion above suggests that establishing the conditions that improve the level of trust between asset managers and corporate managers may in turn improve the allocation of savings to investments. With this in mind, suggestions are made that may establish conditions that enable greater trust and thereby improve the asset manager-corporate manager relationship: In many cases this involves addressing situations in which corporate managers face losing the trust of asset managers by failing to meet their expectations.
19 Tuckett and Taffler (2012)
13

Metrics and models used to assess company and investment performance
Approach The research uses a mix of economic and finance theory, existing empirical research and a series of semi-structured interviews with relevant market participants, including company CEOs and Investor Relations (IR) managers, asset managers, buy-side researchers and sell-side analysts, a variety of types of investor and other stakeholder groups.
Economic and finance theory provides reasons as to why certain phenomena may give rise to short-termism. Principal-agent theory is relevant in this regard and serves as a tool for understanding what motivates institutions and the individuals within them to behave in ways that may not be desirable.
Existing empirical research can be used to distinguish explanations provided by economic and finance theory. With regard to the questions at hand, existing empirical research such as applied econometric studies are useful insofar as they show which features of institutions give rise to certain outcomes; however, they are not adept at explaining nuances regarding the link between the two (features and outcomes).
Understanding the abovementioned nuances is the role of interviews. Interviews have the distinctive benefit that interviewees can articulate their views on the motivations of their actions: Why do companies and investors care about dividend policies? What do companies seek to achieve in communicating with investors and how do investors respond to the information they receive? How is the role of sell-side analysts viewed? Etc.
By conducting a number of interviews the salience of views can be established, as certain views arise repeatedly. In addition, as a wide range of market participants have been interviewed as part of the research an element of triangulation is also achieved.
Lastly, the semi-structured approach, which to some degree avoids directing interviewees towards particular topics, is suitable because it enables the emergence of topics that may not have been apparent in advance. This is especially important in this research because, as will be apparent through the report, while ‘metrics and models’ – regarded as quantitative measures of company and investment performance – are a reference point for investment decisions, there is a broader range of considerations which are relevant that would not have been researched without the interview approach followed.
14

Metrics and models used to assess company and investment performance
Interview questions
As a starting point the research was carried out with regard to five main (and additional supplementary) research aims. These are set out below.
1. Identify the variety of metrics and models commonly used to assess and forecast the performance of companies.
2. Identify the main users of such metrics and models, the situations in which they use them, their varied levels of sophistication, and which types of investors place most value on which metrics and models.
3. Provide an analysis of the uses and limitations of these metrics and models in the context of selecting and managing an equity portfolio with the objective of achieving long-term returns.
4. Highlight in particular: a. the relevance of metrics and models to assessing a company’s fundamentals
and their potential for long-term creation of value; b. how short-term market fluctuations can influence data produced by metrics
and models, and vice versa; c. how different market conditions may impact on the uses and limitations of
metrics and models; d. the ways in which they may be misunderstood, manipulated or misapplied; e. the approach used by investors to analysis of the data produced by models
and metrics and the extent to which non-quantifiable measures of company performance can usefully influence investment decisions;
f. how the choice of appropriate metrics and models may vary according to the specific characteristics of the company, including size, structure, and the sector / markets in which it operates, providing case studies as appropriate, and considering the value of comparability across companies and industry sectors;
g. the impacts of using particular metrics and models on investor choices; h. the impacts of using particular metrics and models on decisions by
companies – for instance whether companies’ efforts to maximise identified metrics can undermine the creation of long-term value.
5. Identify what factors drive the choice of metrics and models by long-term investors, in particular identifying:
a. the role of regulatory requirements; b. the presence of misaligned incentives; and c. the prominence with which particular metrics are presented in the data
provided to investors.
15

Metrics and models used to assess company and investment performance
Interview samples Part A Part A of the research is informed by 42 meetings. Thirty seven meetings were with independent financial advisers (IFAs), private client stock brokers, family offices, wealth management companies, investment consulting companies, fund managers, pension funds, national reserve funds and charities. Five meetings were with professional bodies and consumer representative groups. The knowledge, experience and expertise of the interviewees provided the study with a rich source of information and valuable discourse. Three workshops were also held at which there were a total of 50 participants.
Throughout this research period, the study was particularly focused on whether models, metrics and measures are having a harmful short-term effect, and what might be done if there is to be a beneficial effect along the investment chain.
The focus is on investment in funds and collective investment vehicles, as well as on individuals and trusts that hold securities via a stockbroker, IFA, or platform, whether on a discretionary, advised, or execution-only basis. The commonality here is the existence of a chain of intermediation. Individuals who directly hold securities in name and where no, or virtually no, intermediation is involved are out of scope of the research.
The empirical methods consisted of interviews and workshops. Each meeting started by introducing the topic and the study. During the initial meetings some of the questions followed grounded research methods and were open questions such as: “What should be the focus?”, “What angle or viewpoint should we look at the problem from?” “What are the key questions we should be asking?”20 Other questions were based on interviewees’ areas of expertise, with the remaining questions constructed from desk-based research. The meetings during the first half of the project focused on identifying and analysing where current models and metrics were not appropriate to their situation. This part of the investigation was open-ended and involved ‘listening mode’.
As the meetings evolved, the inquiry moved from description to prescription. Emerging concepts were tested. The concepts were taken to two international workshops, one in France and one in the Netherlands. At the workshops further face-to-face input was obtained from Australian, Canadian, Spanish and US perspectives.
While the focus was the UK, the international perspective has been instrumental in providing critique and helping move thinking forward on models, metrics and measures.
Detailed notes were taken during each meeting. The full narrative of each meeting was written-up. Repetitions, themes and cross-interview commonalities were looked for to give confidence that emerging concepts are grounded in the data and capture underlying processes rather than individual positions.
20 Grounded research is an empirical method that allows a researcher to adopt a broad view on a subject that is not well understood.
16
Metrics and models used to assess company and investment performance
Part B The institutions consulted as part of Part B included corporates, asset managers and, among others, firms carrying out sell-side analysis.
All FTSE100 companies, and a selection of FTSE250 companies, were contacted. The rationale for including FTSE100 companies in the consultation is that they constitute such a large portion of UK equity market capitalisation. The rationale for including selected FTSE250 companies was that they are potentially a key engine for future UK growth. In particular, the selection of FTSE 250 companies was made on the basis of activity in the knowledge services or medium-to-high tech manufacturing sectors.21
The financial institutions consulted were weighted towards asset managers. Firms active in UK equities and present in the top 100 asset managers by asset under management were contacted. In addition, other asset managers of interest were contacted, for example, those known to have long or very long time-horizons. In total, over 80 asset managers were contacted. As well as this, a handful of other financial institutions were consulted including firms carrying out investment analysis and one M&A consultant specialised in transactions involving asset managers.
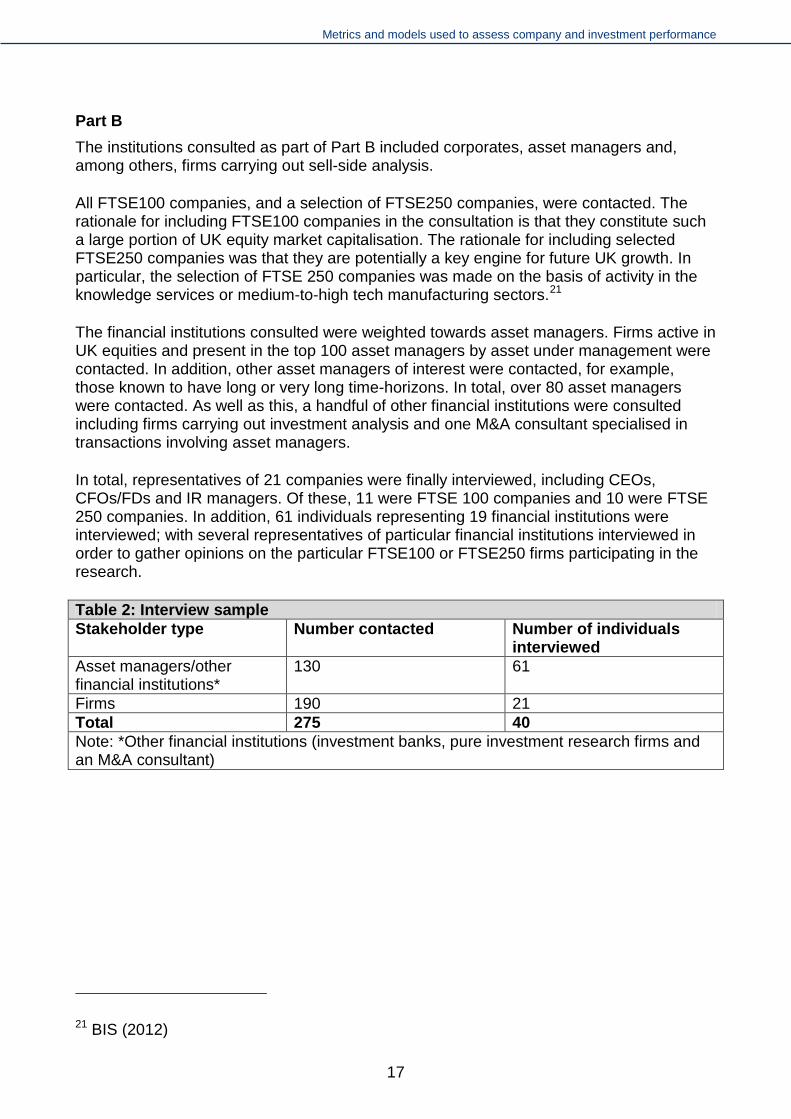
In total, representatives of 21 companies were finally interviewed, including CEOs, CFOs/FDs and IR managers. Of these, 11 were FTSE 100 companies and 10 were FTSE 250 companies. In addition, 61 individuals representing 19 financial institutions were interviewed; with several representatives of particular financial institutions interviewed in order to gather opinions on the particular FTSE100 or FTSE250 firms participating in the research.
Table 2: Interview sample Stakeholder type Number contacted Number of individuals
interviewed Asset managers/other financial institutions*
130 61
Firms 190 21 Total 275 40 Note: *Other financial institutions (investment banks, pure investment research firms and an M&A consultant)
21 BIS (2012)
17

Metrics and models used to assess company and investment performance
Part A: The end investor-asset manager relationship
18

Metrics and models used to assess company and investment performance
A1 Fund manager procurement and selection
Synopsis
The focus of this chapter is the fund manager procurement process. In the institutional sector, investors who outsource their assets for others to manage took on average 10 months to procure an investment manager. During this time a great deal of correspondence – informal, formal, spoken, not spoken, explicit and inferred travelled back and forth. Each communication was a piece of information that fund managers used to construct a ‘mosaic’. The mosaic, when put together, created a picture of what was involved in winning and successfully servicing the particular mandate. Institutions’ hiring fund managers were thought to be asymmetrical in their interest about performance, with greater interest shown in instances and reasons for underperformance. This gave fund managers motives to avoid underperformance more than generate outperformance. Avoiding short-term underperformance was seen as an appropriate way to deliver good long-term performance even though, according to the institutional asset owners interviewed, such a translation was never intended or desired.
To overcome unwarranted shortening in the investment time horizon, institutional asset owners need to ensure greater consistency of message about time horizons throughout the whole of the procurement and selection process. Institutional asset owners should integrate questions about the long-term within the procurement process and allocate weight to these. Examples are provided of questions the procurement process might include.
None of the experts believed that issuing longer mandates of 5, 7 or 10 years, rather than the normal 3 years, would make any difference because all contracts can be immediately terminated.
Introduction In the institutional sector, asset owners are key players. A reason given by many interviewees for this was their role in setting investment management contracts. Of those who cited this reason, most had seen or heard evidence that in the institutional sector these investors outsource about two thirds of their assets to external managers. This made the manager procurement process an important issue.
In this chapter, the term ‘institutional asset owner’ refers to institutional investors who delegate the management of their assets to fund managers, for example trust based pension funds, charities, churches, and endowments.
Preceding a procurement, there was a decision about what proportion of the portfolio to allocate to which asset classes, and a further one concerning how many managers to employ for each asset class and on what basis. There was also a decision about whether to procure a fund managed on a single or multi asset basis. For funds managed on a multi asset basis, more autonomy was normally granted to the managers, including how to allocate assets and the proportion of cash that can be held in the overall portfolio. These
19

Metrics and models used to assess company and investment performance
antecedent decisions aside, in terms of process, manager procurement was run in much the same way.
The procurement process The procurement process is an opportunity for institutional asset owners to set out how they wish a fund manager to serve them. They establish their questions, on their terms. It is therefore an effective point to start the process of orientating fund managers around the long term.
Procurement was usually run on an open-market basis, and comprised 4 stages: 1. Initial market engagement. 2. Pre-Qualification Questionnaire (PQQ), or Initial Screening Questionnaire (ISQ). 3. Invitation To Tender (ITT), or Full Questionnaire (FQ). 4. Bidder presentations and due diligence.
Each stage is now explained in more detail:
Initial market engagement Institutional asset owners used initial market engagement to develop an understanding of the available types, sizes, players, and characteristics of funds in a particular asset or strategy. Initial market engagement was key to focusing in on the mandate to specify in the full tender. Overall, initial market engagement ranged from 2 to 6 months, with a median of 3 months.
Initial Screening Questionnaire The first formal expression of interest to the market was the Pre-Qualification Questionnaire (PQQ), or Initial Screening Questionnaire (ISQ). The ISQ is a means of reaching many fund manager candidates with questions designed to immediately exclude those not suitable and move rapidly to a short list of candidates. The normal specification is for each criterion in the ISQ to be scored “pass – meets the requirement” or “fail – does not meet the requirement”. If the bidder’s response scores a “fail” on a criterion in the ISQ, this normally resulted in rejection of the whole tender for that bidder. Used in this way, the ISQ ensured only suitable suppliers proceed to be assessed at the Full Questionnaire (FQ) stage.
Full Questionnaire Responses that pass the ISQ go through to the FQ. Further questions of the asset owners choosing are asked. Each question on the tender document carried a weight - decided by the asset owner. The weights on all the questions summed to 100. Questions, criteria and scoring methodology were set out in the tender document. The score on each question was multiplied by the weighting and an overall score calculated for the tender. An example scoring and weighting system for a full questionnaire is illustrated below.
20

Metrics and models used to assess company and investment performance
Example scoring methodology for each section:
Scoring System Score
Does not satisfy any part of the requirement. 0
Satisfies only minor aspects of the requirement. 1
Satisfies part of the requirement only, not the full requirement. 2
Satisfies the requirement. 3
Satisfies the requirement, with minor additional benefits. 4
Satisfies the requirement, with major additional benefits. 5
Example weighting on each section for an actual Global Equity Fund:
The thresholds in Section A.1 and A.2 are designed to ensure no manager could be successful by achieving high marks on other areas alone.
From the scores, a short list of fund managers was selected for presentation. Overall, the ISQ and FT took 3 to 6 months to conduct, with a median of 4 months.
Section Question Weight Technical 70% Section A.1 Business, Organisation
& Staff 7.5% (must score in at least 4 questions)
A.2 Operations 7.5% (must score in at least 4 questions)
A.3 Investment Philosophy & Investment Process
22.5%
A.4 Stewardship 5% A.5 Environmental, Social,
Governance 5%
A.6 Risk Management 12.5% A.7 Performance Analysis 10% Commercial 30% Section B.1 Fees 30%
21

Metrics and models used to assess company and investment performance
Bidder presentation Bidder presentation and due diligence - traditionally called the ‘beauty parade’, was often held off-site at the bidder’s offices and involved a whole day. A team from the institutional asset owner visited key parts of the bidder’s business – the executive team, investment managers and analysts, operations, custody – if applicable, stewardship, and environmental, social and governance analysts – if relevant. This was a chance to ask further questions, see and hear the whole story, and acquire the comfort level needed to make a final decision. The bidder presentation and due diligence took from 1 to 2 months to conduct, with a median of 1 month. Once the preferred bidder had been selected, a further 2 months passed as the investment management agreement was firmed-up.
The mandate mosaic From initial market engagement, through initial selection questionnaire, full tender document, bidder presentation, to the investment management agreement, took on average 10 months.
During this time a great deal of correspondence – informal, formal, spoken, not spoken, explicit and inferred travelled back and forth. Each communication was a piece of information that fund managers used to construct a mosaic. The mosaic, when put together, created a picture of what was involved in winning and successfully servicing the particular mandate.
“No pension fund tender document starts out talking about the short-term, but at the end we have often walked away thinking it may as well have done. We try to understand what the client is really looking for and interested in.”
Types of communication that fund managers often found significant within their mosaics included: • Extent of asymmetry of interest in underperformance and outperformance. • Verbal and non-verbal responses of institutional asset owners to fund manager
questions. • Charts and tables of data that particularly interest the asset owner. • Informal conversation with the asset owner, for example in the lift following a formal
meeting. • Reasons that past mandates were lost. • How the asset owner has acted in the past. Weaknesses of the procurement process Five weaknesses with the procurement process as a whole were identified in terms of the long-term.
1. Fund managers often gained the sense that the asset owner was likely to change manager after 1 year of underperformance or not hire at all based on past underperformance due to their asymmetry of interest in performance, with greater interest in the instances and reasons for underperformance. This was also the key reason for the belief that two years of significant underperformance was certain to cause immediate termination of the mandate. These were commonly held beliefs,
22

Metrics and models used to assess company and investment performance
which gave fund managers motives to avoid underperformance more than generate outperformance.
Avoiding short-term underperformance was seen as an appropriate way to deliver good long-term performance even though, according to the asset owner interviewed, such a translation was never intended or desired.
“An inevitable consequence of us seeking to control underperformance is an over focus on the benchmark and a short-term mindset based on the application of performance relative to the benchmark. We’d rather not, but the mandates we have do not steer us sufficiently clear of this trap.”
Some respondents from pension funds argued that the fault lay with fund managers who misinterpreted their wishes. While pension funds and other asset owners did look at quarterly results, all insisted that they are not actually changing managers or investment strategy on the basis of quarterly time periods.
2. Most of all, what was thought missing was consistency of emphasis around a particular investment time horizon within the procurement process. Often, the pieces and steps of the procurement process were not sufficiently thought through to prevent a shortening of the desired longer investment time horizon. As a result, the message is often that the focus is shorter than asset owners believe they are suggesting. Haziness over time horizons meant that, in practice, the actual objectives of asset owners are unlikely to be those adopted by fund managers.
3. A small minority of pension fund interviewees mentioned that the ISQ and FQ are already crowded documents and once the technical, operational and commercial questions have been asked there was limited space for anything more. Other areas will not move aside to make way for other questions.
4. A survey of procurement questions revealed no instances of questions specifically about the long-term, either stand-alone or integrated within other sections.22 Institutional asset owners did not put these questions into the ISQ either. In short, no weight was allocated to questions about a long-term approach. The survey revealed the following average weights based on the sections.
22 The survey technique was informal. This involved the researcher drawing on the goodwill of pension fund colleagues. There is no claim that the survey is statistically representative. The survey included a sample of 8 pension funds that each devote significant resource.
23

Metrics and models used to assess company and investment performance
The meaning of the long-term in the survey was not the same as ESG factors, which do receive weight. According to one fund manager:
“We performed an analysis of past tender questionnaires and found an average of 6 questions on the whole ownership, voting, engagement, stock lending and environmental, social and governance (ESG) piece. That is slightly less than 10% of questions. We don’t know what weight that corresponds to, but we hear from others that it’s between 0% and 5%.”
Overall, questions on ESG and stewardship tended to be conformance driven, closed-end rather than open-end, and were not directly addressing a long-term investment time horizon. That was not always the case, but mostly so.
5. The use of thresholds in the procurement process in which bidders must score more than zero across questions on the infrastructure they have in place, such as custody and operations to service the mandate, produced an industry in which brand and recent success are rewarded. This occurred because of the high weight within the procurement process given to standard criteria such as the business, organisation, staff and operations, as well commercial aspects such as fees compared to investing for the long-term. Some experts thought that a focus on these criteria in terms of weight and threshold will always come down against smaller and more recent fund managers, many of whom are eager to bespoke their business to the interests of institutional asset owners but are denied the chance.
Question Weight Business, Organisation & Staff 10%
(thresholds present)
Operations 10% (thresholds present)
Investment Philosophy & Investment Process
25%
Stewardship 2%
Environmental, Social, Governance 3%
Risk Management 15%
Performance Analysis 15%
Investment Time Horizons and the Long-Term
0%
Fees 20%
24

Metrics and models used to assess company and investment performance
Improvements to the procurement process The process of articulating weaknesses naturally took the discussion to where the procurement process can potentially be improved. Most experts believed that influencing demand through mandates is a potentially powerful means of helping the system to slow down – i.e. to embed longer-term stewardship where that reflects the investment objectives and horizons of the asset owner.
None of the experts believed that issuing longer mandates of 5, 7 or 10 years, rather than the normal 3 years, would make any difference because all contracts can be immediately terminated.
Particular areas of improvement were: • Consistency of message about time horizons within the procurement process. • Alignment of time horizon with monitoring and measurement in the procurement
process, as a whole. • Introduce specific questions about the long-term within the FQ.
There was discussion about whether new questions introduced should be integrated or stand-alone. Most experts thought integrated was the more appropriate. The experts were asked about the type of questions the procurement process might include. Below are examples suggested by the experts of how the questions can be integrated within the procurement process, covering investment philosophy, the investment process, and stewardship. It would be for each Institutional asset owner to decide whether the weight on these sections should change as a result of the revised emphasis, or stay the same. The experts emphasised that the questions below represent initial thoughts rather than finished product.
Investment Philosophy and Process In no more than 500 words please describe: • Your corporate philosophy towards the long-term, the timescale you consider when you
speak and think about the long-term. • How the team will construct and manage the portfolio incorporating long-term issues,
risks and opportunities into the process, and how this will be reported back. Please ensure the following points are covered: a) Your organisational investment time horizon and how this is aligned to client
investment maturity. b) Provide details of the process of internal rating and ranking of issues, risks and
opportunities, and demonstrate how this is factored into the investment process. c) What long-term analysis and tools are used, and how? Please state which are
proprietary. d) Please outline the split of internally and externally produced long-term research and
analysis used in your investment process. e) Whether scenario analysis is used in order to assess the impacts of the long-term
within portfolio construction and portfolio risk? If yes please provide examples.
What effect do you think long-term risks will have on the structure of your equity portfolios?
25

Metrics and models used to assess company and investment performance
There is considerable discussion about using a longer investment time horizon as an instrument to provide the necessary funding to move the economy to a long-term, intentionally competitive position. What’s your position and how are you involved?
Analysis Is any analysis performed to capture long-term risks and opportunities at the systemic, industry or thematic level? How is this performed?
Please provide up to three of the most material examples over the last two years where long-term risk and opportunities have affected your investment decisions for mainstream portfolios, and give an indication of the proportion of your holdings affected.
What engagement do you undertake to understand companies’ long-term issues? Please provide examples.
Please present and explain your investment selection and de-selection decision making criteria, and how this is integrated with long-term views and risks.
In investment and valuation analysis, do you allow for a varying long-term price of oil and gas, carbon, renewable energy, water, and food commodities, when assessing the value of a particular investment? If so, how? If not, please explain why.
Reporting In your reporting do you review the impact that long-term issues and risks may have on your investment portfolios? If yes, please answer questions a) – c) below. If not, say why not.
Do you include: a) How have long-term risks and opportunities contributed to your portfolio performance? b) How the analysis of long-term issues has contributed to your investment thinking and
strategy? c) How you view analysis and integration of long-term issues and risks as return
enhancing or risk mitigation?
Detail what efforts are taken to report long-term performance measurement to clients.
26

Metrics and models used to assess company and investment performance
A2 Monitoring of stewardship by fund managers
Synopsis
This chapter focuses on the development of a reporting framework to help institutional asset owners monitor the stewardship of their fund managers.
Asset owners first decide whether stewardship is a requirement for the asset class or particular investment strategy. If so, that becomes expressed within the investment mandate or side letter agreement. Once appropriate direction and wording for the asset class or investment strategy has been established within the investment mandate or documented in a side letter, reporting becomes a key monitoring vehicle.
A case study is provided of work undertaken by a group of UK pension funds to develop a reporting framework for responsible investment, focusing on stewardship activities and the integration of environmental, social and governance objectives, with the aim of formalising and clarifying their reporting expectations for listed equity asset managers.
Reporting like this might complement, or inform the development of, the Stewardship Code and related industry initiatives which seek to improve the focus on stewardship in the asset owner and fund manager relationship.
The focus here is stewardship, but the process set out in this chapter may be taken forward to other areas in asset owners’ interaction with fund managers.
What is stewardship? The functional – and in some cases legal, separation of ownership and control that characterises the joint stock company structure and investment management contracts sets the framework for the concept of stewardship.
The purpose of stewardship is to help improve risk and long-term returns to owners through monitoring and engaging on matters of: • Strategy • Performance • Capital structure • Risk • Corporate governance – including remuneration, culture, and quality of management • Risk management
The way corporations are affected by environmental and societal impacts, and the way corporations affect them, was thought to give environmental and societal issues a place within stewardship under the topics of risk management, performance and risk.
Stewardship involves two elements. The first is behaviours by corporate and fund managers to help ensure that the resources entrusted to them have been exercised in a proper manner. The second is the demonstration of these behaviours to the owners through reporting.
27

Metrics and models used to assess company and investment performance
Stewardship between fund managers and companies Fund managers are expected to practise their part of stewardship with companies through: • Monitoring and analysis of company fundamentals which underpin returns in the form of
income and growth, via dialogue with companies on strategy, performance, capital structure, risk and corporate governance, among others.
• A willingness to vote on resolutions at company general meetings, and to engage on issues that feed into the resolutions with the company, with the aim of an improvement to risk and return.
• A willingness to hold a stock with a view to realising value based on these improvements over time.
Many asset owners were concerned about the underprovision of stewardship. Fund managers agreed with that diagnosis at the whole industry level. This detracts from the trust relationships needed to be built between the asset owner and fund manager. Hence there is an important role for asset owners in stewardship. Two reasons were given for the underprovision of stewardship:
Free rider problem Many fund managers were concerned about the existence of free-riders who sign up to the Stewardship Code or a collaborative engagement but then contribute little. The problem is that investors who do not participate in stewardship or a collective engagement will still reap the benefit if the outcome is successful. At the same time, their non-participation will make such success less likely, to the detriment of all. The cost advantage falls to the fund manager that contributes least, while the benefits accrue equally to all investors. All the while, asset owners may not be able to distinguish those who do from those who do not, resulting in overall detriment to those who do.
Principal agent problem Due to asymmetric information and imperfect oversight, stewardship activities may be inappropriately discharged, which could lead to second-best outcomes, and all the while owners will not observe this happening unless effort is taken to do so.
Stewardship between asset owners and fund managers The responsibility for discharging stewardship does not rest with fund managers alone; pension fund and charity trustees, endowments and other asset owners share in this through the mandates they give to fund managers and the monitoring of these. As the providers of capital, they set some of the tone for stewardship and can influence behaviour that leads to improved stewardship by fund managers.
28

Metrics and models used to assess company and investment performance
Suggestions Experts believed that large institutional asset owners should expect to exercise their part of stewardship with fund managers to a greater extent than most currently do. Suggestions about what an effective collaborative relationship looks like between asset owner and fund manager were:
• Monitoring of fund managers’ stewardship with companies. • Participating in fund managers’ voting decisions through viewpoints and analysis. • Undertaking joint engagement work. • Undertaking joint workshops or seminars. • Encouraging alignment of interest through co-signing engagement letters. • Sharing research and information. • Sharing expertise.
Trust is an essential part of the relationship between asset owner and fund manager, and stewardship is seen as a particularly fertile area to help underpin the preservation of trust. Stewardship is demonstrated in part through high quality reporting, which allows constructive dialogue between the parties.
High quality reporting helps: • Fund managers who do real stewardship to be identified. • To overcome the free-rider problem and concerns of fund managers that their actions
are invisible and difficult to separate out from fund managers who only associate with engagements or investor bodies without significantly contributing to the process.
• To demonstrate appropriate behaviours to the owners.
Case Study
Building on the Principles for Responsible Investment’s publication on aligning expectations23, in September 2013 a group of UK pension funds began a series of workshops with the aim of formalising and clarifying their responsible investment reporting expectations for their listed equity managers. As long-term investors, the group define responsible investment (RI) as the integration of environmental, social and governance (ESG) factors and stewardship activities in the investment and manager monitoring process.
The group agreed better RI reporting can help improve transparency, accountability and trust between investors and their fund managers. It was felt RI reporting could be helpful in building a better understanding of the extent to which stewardship activities and ESG integration can help to explain long-term investment risk and performance attribution.
23 Principles for Responsible Investment (PRI) (2013)
29

Metrics and models used to assess company and investment performance
The group have been careful not take a one-size-fits-all approach to RI reporting and recognise that different investment styles and strategies will adopt a wide range of approaches to integrating ESG and stewardship. Managers will therefore communicate their valuable insights differently and produce unique reports which vary in frequency (for example, quarterly and/or annually) and form (for example, client-specific or public reports, formal and informal verbal updates).
The group intend to publish a more detailed document called “Aligning responsible investment reporting in public equity” which they intend to use in their engagement with their current and prospective fund managers. The group will also welcome use by international asset owners in other markets.
30

Metrics and models used to assess company and investment performance
A3 The not-for-profit institutional sector
Synopsis
This chapter contains a suggestion that the not-for-profit institutional sector should become a profession. This suggestion met with widespread agreement among respondents from within the sector.
The institutional investment sector that is not-for-profit has a pivotal position in setting investment management contracts, and has significant potential to slow the system – i.e. to focus on returns from long-term patient investments. Fund management, wealth management, advice, and investment consulting have evolved into distinct professions, but the not-for-profit institutional sector has not. All the time, investment principles, concepts, processes, law, and regulation surrounding the sector have been building and are probably now sufficiently complex and separate to warrant the sector becoming a profession.
Suggestions aimed at helping an identifiable profession to emerge were: the specific study of the area in education; the creation of a professional institute, and the establishment of a principles based code of practice.
It would be for the sector to have a free hand in moving this forward, and to derive and inculcate metrics better aligned to its longer term investment time horizon.
Introduction Pension funds, charities, churches, endowments, national reserve funds and sovereign wealth funds occupy a unique place within institutional investment. Reasons for this are that the sector is: • Not-for-profit. • Comprised of non-conflicted principals. • There to singly serve their respective end investors. • Key to setting investment management contracts and hiring external managers and
advisers as agents.
Experts referred to this sector as the “not-for-profit institutional sector” and those operating within the sector as “not-for-profit institutional investors”. In this chapter, these terms will be followed.
One of the important attributes of this sector is the size and strength of funded trust-based pension schemes. The UK has a small number of very large schemes by membership or assets. Between them, they hold the bulk of pension fund assets. Particularly notable are local government schemes, ex-nationalised industry schemes, industry wide schemes, large single corporate schemes, and new defined contribution schemes designed to meet workplace pension auto-enrolment duties, such as the National Employment Savings Trust (NEST). There is then a long tail of smaller schemes. The great majority of pension funds contract out the management of their assets to fund managers.
31

Metrics and models used to assess company and investment performance
The not-for-profit institutional sector There was a widespread belief among those consulted that the sector merits significant further attention in the short-term versus long-term investment debate than it has so far received. Three reasons were cited:
1. The sector represents a large pool of investment capital that exists purely to serve the interests of the end investor.
2. The purpose of singly serving the end investor is different to many other institutional
investors – for example asset management firms, insurance companies, multiservice banks, who themselves are often listed or for profit companies that are subject to some or all the same pressures of listed and for profit companies generally.
3. The job of not-for-profit institutional investors is not to compete on profit, scale,
assets under management, global reach, research, product innovation, trading immediacy, or to leverage their capital, as other institutional investors do. Their job is investment patience, often intergenerational. They provide more of an incentive and less of a disincentive to slow the system down.
The size of the UK pension fund sector is about £2 trillion. Once we include UK charities, churches and endowments from estimates by the Office for National Statistics, as well as other trusts, the total size of the not-for-profit institutional sector is around £2.5 trillion.
Many of the larger not-for-profit institutional investors, especially the pension schemes, are open, transparent and collaborative with one another in a way that is absent in the profit driven institutional sector. Many of the trustees of larger pension schemes explicitly hope that their published materials, such as Statement of Investment Principles, investment philosophy, investment beliefs, voting policies, and research, may be copied and used by smaller schemes. There is a tangible desire to have the smaller schemes free ride because the purpose and goals are common, whereas the opposite tendency is evident in the profit driven institutional sector. These organisations recognise too that they are leaner than fund management companies, and need to collaborate and share resource if they are to hold their own relative to them.
A sector in need of articulation? Many experts believed that more attention should be given to the not-for-profit institutional sector in the debate around a short-term approach than there so far has been. Experts thought that the sector lacks visibility, identity, and the inter-connectedness it would like to have. Their suggestion was that the not-for-profit institutional sector should professionalise.
Corporate pension schemes have both representation and guidance from the National Association of Pension Schemes (NAPF), and trust-based pension schemes also benefit from education and guidance from the Pensions Regulator. However, many respondents argued that it would be beneficial for the broader not-for-profit sector to create a professional institute and a code of practice, and to develop an educational syllabus and examinations.
32

Metrics and models used to assess company and investment performance
It was argued that the asset management, advice, wealth management, and investment consulting sectors have evolved into distinct professions, but the not-for-profit institutional sector has not. Yet, investment principles, concepts, processes, law and regulation surrounding the not-for-profit institutional sector are now sufficiently complex and separate to warrant professionalisation.
Discussion - mixed views While a majority of experts thought that the not-for-profit institutional sector should establish itself as a profession, a small minority of interviewees expressed doubt about the level of interest the sector had in this. The interviewees who held this opinion mentioned that, with some exceptions, the sector has in recent years largely avoided taking part in debates about, for example, capital requirements, financial market reform, and reporting standards. As long-term investors, if they really were interested they would be more vocal in explaining how markets can be run more effectively in the long-term interests of end investors. A further small minority expressed doubt as to whether not-for-profit institutional investors truly wish to independently act as engaged and active owners, and participate in the regulation and management of the financial markets as a whole, as opposed to wanting fund managers to do this for them.
Experts provided three suggestions about how a profession could progress:
1. Subject and study 2. Professional institute 3. A Code of Practice
These concepts tended to be nested rather than stand alone. The concepts were thought to help a profession establish and evolve in a cost effective manner while retaining the plurality of investors in the sector. Collaboration and sharing of workload was key, complemented by policies and mechanisms to promote the long-term. Each of the three suggestions above is now further discussed.
Subject and study One suggestion was to encourage specific study of the area via a syllabus. Syllabus suggestions included law, regulation, tax, portfolio construction, setting investment objectives, time horizon, philosophy, process and principles, and the procurement process. The subject material could be a chapter and module within a broader finance and investment syllabus, or stand-alone with its own exams and workbook. Increased complexity, regulation, and higher expertise requirements have all combined to fuel the need among the investment boards of these investors to be more professional and in control.
Professional institute A second suggestion was the creation of a professional institute. There were said to be some elements about the sector’s purpose, objectives, culture, and principles that could form a focus around which a professional institute can orientate. A professional institute could use these common aspects to encourage good practice in learning, development and leadership.
33

Metrics and models used to assess company and investment performance
Experts agreed that establishment of a professional institute and a profession will take time and the challenges need not be tackled at once. The aim was that some amount of work could get under way, and that momentum would be achieved with greater visibility.
The model put forward was for larger investors to lead in a collective effort to drive the process forward. The aim would be to self-manage and not add another layer of cost to the system. It would be for the sector to have a free hand in moving this forward, and to derive and inculcate metrics better aligned to its longer term investment time horizon. A rolling chair / secretariat to spread and share workload was suggested.
One external benefit of a professional institute would be a ‘voice’ that standard setters could benefit hearing from when trying to strike the right balance in policy design. Standard setters hear too little from asset owners, whose time horizon is thought to be longer-term.
A highly valuable use of the professional institute would be to develop common guidance on interpretation of fiduciary duty agreeable to the whole sector to help trustee bodies move forward. This links into the work by the Law Commission –some long-term investors have fed back to the Law Commission that the fiduciary question needs codification of some sort. Trustee bodies often say they need a more concrete interpretation of duty.
Code of Practice An extension of a professional institute was the concept of a principles-based code of practice to help bring focus on the long-term together.
Some architecture already exists that the not-for-profit institutional sector draws on. Examples include: • International coalitions e.g. the United Nations-supported Principles for Responsible
Investment. • Regional coalitions of investors e.g. Local Authority Pension Fund Forum, UK Pension
Fund Roundtable. • The Stewardship Code, and the industry Stewardship Framework, which seek to bring
transparency to fund management companies’ approach to the ownership rights of assets they hold for clients.
• Proxy voting organisations • Engagement organisations e.g. Hermes EOS, F&C REO • Ethical committees e.g. Church of England Ethical Investment Advisory Group.
A principles-based code would be separate to the list above. The code might be voluntary to sign up, but comes with a commitment to show progress to each other and to end clients. The Code would encourage sharing work load, and aim to help reduce the set-up and fixed costs of small investors who wish to actively participate for the long-term.
Suggestions for the Code set out by experts would be to encourage: • Large investors to commit to a programme of sharing with small investors. • Voluntary standards to serve the interests of end investors, such as the tender and
procurement process, and approach to high-frequency trading. • Larger investors to offer ‘how to’ seminars and tutorials for smaller and newer investors.
34

Metrics and models used to assess company and investment performance
• Sharing of process manuals on areas such as establishing investment beliefs, time horizons, tenders and stewardship.
• Sharing of research reports. • Connecting investors with dispassionate viewpoints and perspectives to balance sales
pitches from the sell side. • Identifying and developing professionalisation in learning, development and leadership. • Working with other professional bodies already active in the investment industry to
increase the value of outcomes to clients.
35

Metrics and models used to assess company and investment performance
A4 Organisational investment time horizons and client reporting
Synopsis
This chapter focuses on the alignment of organisational investment time horizons to client investment maturity within the retail and institutional sector.
Articulating an organisational investment time horizon is important to do. A good organisational investment time horizon is one that is aligned to average client investment maturity. There was common agreement that most investment organisations adopt time horizons that are considerably shorter than those of the individual investors they serve. Few organisations articulate an investment time horizon for their investment business, and this leads to haziness over time horizons. Suggestions are made about how best to calculate average client investment maturity.
A suggestion is made that fund management companies articulate an organisational investment time horizon either for the whole company or for their investment business. Doing so will help investment clients select an investment manager whose organisational investment time horizon is aligned to their investment maturity.
The research also found that, although organisations operated and articulated quite different investment time horizons, reporting to investment clients was uniform and homogenous. Why investment reporting is so homogenous is difficult to explain. The research found little evidence that this was due to the imposition of prescriptive regulatory requirements. A lot of what gets reported is simply cultural, and takes the form of what managers expect to report and what clients expect to see.
Suggestions are made about metrics that might add balance to current investment reporting, provide a more meaningful comparison to client objectives, and prevent a shortening of time horizons.
One of the most pivotal steps that organisations can take to help ensure they develop models and design metrics and measures that are appropriate for investment clients is to set an appropriate organisational investment time horizon. Experts believed that the creation of an organisational investment time horizon had a positive impact on: • Expectations among staff about levels of activity that are justified; • Metrics and measures to employ in house; • Metrics and measures to communicate with clients; • The type of funds to build, acquire or promote; • Creating appropriate culture.
“If you don’t know the journey you’re on how can you measure key milestones, and how can you communicate these to clients.”
The term ‘organisations’ refers to institutional investors, investment fund groups, wealth managers, private client stock brokers, and family offices that manage retail, professional and institutional clients. The term also applies to the investment business side of these organisations.
36

Metrics and models used to assess company and investment performance
Some experts felt that the importance of setting an appropriate organisational investment time horizon was matched by the difficulty some organisations appear to have in developing a consensus about what this should be. Only a handful of organisations have publicly articulated an investment time horizon. More were identified as having one internally – unpublished, but most organisations have neither articulated one externally nor internally.
The articulation of an investment time horizon helps to co-ordinate an organisational culture by acting as a foundation stone for staff to coalesce around. When no organisational investment time horizon has been articulated, different layers of management within an organisation may adopt their own, sometimes quite separate, time horizons. This disconnect leads some parts of the organisation to serve similar clients in quite different ways.
One of the weaknesses exposed through conversations with experts was just how loose and vague a concept ‘investment time horizon’ can be. There is the time horizon of the investment business of the organisation, the time horizon of the individual clients, the fund manager, and intermediaries who interact at various touch points along the investment chain. Unpacking what organisations mean by investment time horizon and how this relates back to individuals was seen as important if the study was to determine whether time horizons, in some cases, are too short to effectively match clients’ investment objectives. This research attempted to deliver that analysis.
Experts agreed the most important area to focus on was how the organisation reconciles its investment time horizon with those of individual investor clients. A good organisational investment time horizon was seen as one that is similar to that of the average client investment maturity. Experts believed that this was calculated in different ways, leading to differing degrees of alignment and misalignment with client money. The following types of organisational time horizon were identified as being most often adopted.
1. Client money weighted average age 2. Client unweighted average age 3. Client money weighted average time horizon
Each is now discussed further.
Client money weighted average age This was the most common. Most organisations had a client money weighted average age of 60. Clients were presumed to invest until retirement, with retirement typically 1-5 years away. Organisations typically took the shorter end of the range, 12 months, as the average client investment maturity, and their investment time horizon. Especially where the investing organisation had made little effort to understand its client base, experts agreed that the investment time horizon tends to be geared around this. This helps to explain the focus by investment organisations on annual performance as the unit of
37

Metrics and models used to assess company and investment performance
analysis as well as academic evidence that funds make changes as the year progresses to try to achieve strong year end performance (Brown, Harlow and Starks, 1996)24.
Client unweighted average age This was second most common. The unweighted client average age for most organisations was 55. With retirement 5-10 years away for the average client, organisations that apply this thinking process to the creation of their investment time horizon tended to have a longer-term mindset of between 5 to 10 years. Organisations with this time horizon tended to hold higher proportions of more illiquid investments.
Client money weighted average time horizon The argument continued that both specifications of investment time horizons above represent flawed thinking because a significant proportion of client money is intergenerational, where the focus is really on the long-term.
“Our client money weighted average age is 60. Does this mean that the average investment time horizon is at most 5 years? No, this would be flawed thinking because of bequests and this makes the whole idea of short horizons seriously flawed.”
With a client money weighted average time horizon, each client’s invested money is multiplied by their stated investment time horizon and the sum over all clients is the client money weighted average time horizon. This takes into account the intergenerational part of wealth, where the focus is really on the long-term. Here, the time horizon was around 20 years. Some wealth management companies, family offices, and charity fund managers used client time horizon weights. A client money weighted average time horizon was seen as the best alignment with investment clients. An organisational time horizon based on a client money weighted average was almost unique to the wealth management and charity sector, and is where experts believed that analysis of the wealth management industry may help uncover long-term practices not found in a study of institutional management alone.
“The frames of reference and the targets of the people who give their money to managers are typically long-term. In the case of charity, church, endowment, and ultra high net worth clients the frames of reference are often intergenerational. This long-term foundation forms the basis of every initial client meeting. Initial meetings between client and manager or adviser involve listening and empathising with the long term intent of the client, followed by a recommendation along the lines of “here’s what I can do for you” or “based on the circumstances you have told me, here’s how I propose I can help you move towards your goals”.”
Of those experts who expressed an opinion, approximately half thought that an investing organisation that had no need to Know Your Client, for example investment fund groups,
24 Brown, Harlow and Starks (1996)
38
Metrics and models used to assess company and investment performance
are the most likely to presume a short-term client horizon worked-off a client money weighted average age.
Discussion – general agreement There was common agreement that most investment organisations adopt time horizons that are considerably shorter than those of the individual investors they serve. The principal reason for this is that most focus on age and proximity to retirement, while most individual investors care more about investment maturity and the time horizon to that maturity25. The result of a focus on age is a misalignment of time horizons. Organisations that proxy client investment maturity by a money weighted average age were focused on higher levels of activity in more liquid investments with more concern about frequent measurement and reporting periods. The bulk of attention being paid to client money weighted average age can help to explain the use of annual performance as the key performance period around which activity and success is calibrated. Most experts thought that the best instrument to use is a client money weighted average time horizon, but few organisations do.
Suggestions Often, organisations had not thought through the investment time horizon to a sufficient extent to prevent a shortening of the time horizon relative to client objectives. Haziness over time horizons meant that, in practice, the actual objectives of owners are unlikely to be those adopted by fund managers. Fund managers are then more likely to act on shorter term developments than is in the owners’ best interests or that owners believe them to be. What was thought to be missing was consistency of emphasis from organisations about the particular investment time horizon their business is built around.
Experts suggested that fund management companies should articulate an organisational investment time horizon either for the whole company or for the investment business. Doing so will help investment clients select an investment manager whose organisational investment time horizons is aligned to their investment maturity.
Do differences in organisational time horizons lead to differences in reporting to clients? With a diversity of organisational investment time horizons revealed, it was expected that this diversity would continue through to the ways in which organisations employ models, metrics and measures to report to clients. The study expected to find at one end of a spectrum organisations with long time horizons and the type of reporting models, metrics and measures that correspond with that approach. At the other end of the spectrum would be the profile of organisations with short time horizon organisations and their specific reporting models, metrics and measures. The expected diversity of reporting was not found. Instead, reporting to clients was relatively homogeneous.
25 Clients presumably also care about the time horizon to the extent it is priced in when they come to crystallise their investment.
39

Metrics and models used to assess company and investment performance
“At the initial client meeting we want to hear the client’s objectives and goals. These are most usually long-term. We help the client translate that into an investment piece that we can constructively feed into and help on. When we report back we report the same information to all clients, quarterly performance, tracking error, information ratio, all relative to benchmark. The client never requests longer term information.”
Limited diversity of reporting was surprising because reporting is not an area replete with prescriptive regulatory requirements.
“The regulator requires a wealth manager to make a meaningful comparison when reporting an investment – a relatively interpretive statement which has tended to be reduced to clear and not misleading.”
A lot of what gets reported appears to be cultural, and takes the form of what managers expect to report and what clients expect to see.
“This area has few regulatory requirements. A lot of what gets reported is cultural, and takes the form of what managers expect to report and what clients expect to see. But with some private equity, infrastructure and hedge funds the culture is not the same and reporting is different.”
Some interviewees thought that limited diversity of reporting occurred because reporting was manufacturer-driven rather than client-driven.
“Is the reporting status quo because that is how investors best become informed about the progress of their investments or because that is the place preferred by producers?”
Experts also argued against the suggestion that the way the investment industry reports is no different to how other industries report. Company accounts focus on annual variability as the shortest unit of measure, and the constant pressure from regulators is for companies to look forward more and backward less when reporting to all shareholders.
“Go back to the 1970s and 1980s, much investment management was carried out on a “trust me” basis. What was reported was the context for the decisions taken, the judgements. The challenge to infrequent reporting of judgement is accountability. How do you know that the job done is good? When investment management professionalised in the 1980’s there was a movement away from trust toward complete measurement and contracts – establish a yardstick of measurement. The logic is to hold the market portfolio or measure me against it if I claim to have some kind of additional insight. You now have a way of measuring whether those you delegate to are up to it. “Measure us relative to this; keep us if good, fire us if poor”.”
40

Metrics and models used to assess company and investment performance
A number of experts pointed out that the standard and frequent investment reporting we currently see across industry leads professionals to look for, and presume, too close a correspondence of their activity to short-term performance. Managers appear to over think the link between short-term activity and performance, which is in fact vague, at best.
“We have put too much trust in the past when all the while parties we are accountable to do not understand nor can interpret the past measures. There is a strong likelihood that reporting the metrics we do leads managers to be over optimistic about their own understanding of the data and all parties have become changed by the measures. We need to help stop manager and client from gazing over short-term changes and trends. We need to turn down the influence of statistical artefacts with no direct economic relationship to the client’s investment goals and objective.”
“Fund managers have far less control over the outcomes they report than people believe they have control over. Reporting provides an illusion of control, but there is in fact so much noise in the relationship that only over the very long-term can anything concrete assert itself. There is a sense of dishonesty in reporting to near decimal place precision past performance as if this was somehow intentional.”
“The belief in the efficient markets concept – that movements in share prices rationally reflect prospects of future cash flows, has gone too far. This tells a false story of influence upon the share price and an equally false reverse story that short-term investment fund performance informs individual investor clients about the effectiveness of the fund management team. But there is far less control over outcomes. If we drop the paradigm we are in a quite different place. Reporting would look different.”
The illusion of control that reporting provides was a worry, especially for people more likely to take reporting at face value. The types of people thought more likely to do so were individual investor clients and also trustees, especially when acting in a committee capacity. Some experts thought that committees tend to coalesce around a common denominator to find agreement, with data being easier to agree on. Especially where the committee is large, the interpersonal relationship is different – more formal, and every action is that of the whole committee, without endorsement by any one trustee. A strong correlate with short-term thinking were committees of 4 or more people, especially when comprised of experts, for they tend to turn straight to the data and are more prone to believe the data.
More balanced reporting metrics As the interviews moved toward how the process could be improved, a more balanced reporting concept was suggested, that took a fresh perspective on the regulator’s interpretive statement of a meaningful comparison. A meaningful comparison could be made relative to an end objective rather than short-term comparison to a benchmark. If the economic link between activity and success is loose, at best, over any short-term period, investors would be more able to make more appropriate judgements if the metrics
41

Metrics and models used to assess company and investment performance
reported are themselves more balanced. The concept envisaged by a number of experts was that the manager should establish, with purpose, the targets of the people who gave their money.
“Report to the people who gave their money on how your stewardship of their assets has helped them to move toward their targets.”
The manager would speak to these targets in terms of actions taken to get there. The intent was to provide greater long-term relevance by increasing the amount of judgemental and forward-looking reporting by the manager.
“Your job as manager is to apply judgement and report to clients on the judgements you have made. Their job is to assess that judgement.”
By manager, the interviewees meant those who advise and invest for clients, retail and institutional.
Experts thought that attempts to shift reporting towards a more balanced concept had to be grounded in manager self-interest. Why else would they – unless mandated to? The practical challenge is how to take the self-interest of managers and align that motivation to a more balanced investment fund reporting concept? Reporting awards and kitemarks that reward through enhanced reputation those companies that achieve a balance were seen as potentially good ways of aligning manager self-interest with the interest of individual investor clients. A hoped for additional outcome was greater alignment between the organisational investment time horizon and client investment maturity.
Discussion – general agreement There was common agreement that a significant short-term mindset is introduced by investment fund reporting. The high similarity of client reporting could not be explained by regulation, and its short-term focus has led managers to over think the link between short-term activity and performance. Reporting provides an illusion of control, and all parties have become changed by gazing over short-term changes and trends. The short-term mindset is not easily dealt with. A more balanced reporting concept was one suggestion. More balanced reporting needed to appeal to manager self-interest. Reporting awards and kitemarks were seen as ways of potentially improving the alignment of manager self-interest with client interest. When funds start reporting on why the numbers represent appropriate management of the assets we’ll be able to say that reporting is client-driven rather than manufacturer driven. Individuals and investment committees were seen as those most in need of more balanced reporting.
42

Metrics and models used to assess company and investment performance
Suggestions Experts considered that the following metrics could add balance to current reporting and provide a more meaningful comparison to client objectives – akin to a balanced scorecard: • A summary of judgements taken. “In the stewardship of your assets here is how we
have made progress towards meeting your long-term goals”. • A summary of forward-looking judgements. “These are the judgements we expect to
take given our assessment of how investment risks may assert themselves.” • A summary of the progress of the investment in relation to economic growth and
inflation. • A summary of the valuations at which the holdings were purchased relative to their
long-run average. • Metrics that focus on the investment fund in the round – examples include staff
turnover and manager name on fund, which might correlate with greater commitment from the manager and more long-term decision making. How is the identity and support of those involved in the fund being maintained to ensure its continued strength?
The purpose is for fund managers to demonstrate they can be trusted.
Research required Other suggestions to a balanced scorecard included: • Organisational factors - operations, company information. • Quality of holdings factors – cash flow, dividends, total yield. • Team factors - fund manager, the team, investment process.
What is the more appropriate type of balanced scorecard - an actual template for managers to complete, or a high level framework for manager thinking? This was suggested to be a question to take into further testing.
43

Metrics and models used to assess company and investment performance
A5 Investment fund ratings and performance numbers
Synopsis
This chapter focuses on the private client, wealth management and retail sector.
The research found that the large number of investment funds and their frequent change creates information overload and works against long-term approach to investment in the sector. Information overload has led to the development of a significant fund ratings industry. Across the retail sector, investment decisions are strongly influenced by ratings. The relative nature of ratings gives rise to a constant supply of top rated funds even if all funds perform poorly in absolute terms. Funds flow to top rated funds. Individual investors follow ratings for they have the appearance of being more understandable than performance numbers. Advisers follow ratings because they link to suitability and possible defence if the fund subsequently performs poorly. A change in rating becomes a catalyst for portfolio turnover, much of which is unwarranted.
This chapter makes three suggestions as to how this issue could be addressed: 1) First, to help investors turn attention away from ratings and numbers by inculcating
more of an ownership mindset, metrics about ownership could be reported alongside performance to encourage the endowment effect found in behavioural finance to flourish and to reduce unwarranted turnover. Suggestions are made as to what these metrics might look like.
2) Second, regulation could be used to encourage the consolidation of funds. This would help to create greater continuity and identity of funds, economies of scale, and an understanding of which funds have skill.
3) Finally, an organisation could be created to advocate for savers and encourage greater alignment between the interests of end investors and the investment funds that serve them. An organisation that only serves savers would help promote transparency, accountability of the investment industry to its customers, and to help them trust and value the system.
Introduction The retail sector is characterised by wealth management firms, private client stock brokers, family offices, tied and independent financial advisers (IFAs). The term ‘retail’ also has a regulatory meaning covering individual investors, trusts, charities, churches, and small companies who fall below the Financial Conduct Authority’s (FCA) size threshold. Clients who are not retail are ‘professional’. ‘Retail’ and ‘professional’ are technical terms used by the FCA to categorise clients that has implications for how authorised firms must treat them. Although quite separate in meaning, authorised firms will often treat professional clients the same way as they do retail clients in terms of process. A harmonised internal process was mentioned as simpler to deliver and reduced the potential for litigation. The processes discussed in this chapter therefore speak to all clients. Not all retail investors are investment clients. The alternative is for individuals to manage their own portfolios independent of an advisor relationship.
Retail investment clients may be execution only, advisory or full discretionary. Almost all assets in the retail sector are held in nominee form. Holdings in nominee rather than in
44

Metrics and models used to assess company and investment performance
name are lower cost, with more efficient investment processing, more tax efficient and anonymous. The alternative to holdings in nominee form is holdings in name. Holdings in name offer tangible certification, legal title, name on register, ability to receive the annual report and accounts, to vote, attend AGMs, take a position on stock lending, and receive discounts and offers that the company provides to shareholders.
The Wealth Management Association (WMA), the main trade body for the private client sector, has about 120 member firms that represent 4 million investor clients and about £500bn of assets. However, not all firms in the sector are WMA members. Greater voice in stewardship would be welcome by much of the sector and there was a feeling that the sector has to date been too silent given its size and membership. The theme of empowering the retail sector is returned to later in the last part of this chapter.
The relative size of retail / institutional split is getting increasingly difficult to estimate. The wealth management and private client investment management sector is valued below.
Investment Assets (£m) 2009 2010 2011 2012 2013 Execution Only Stockbrokers 57.1 76.9 76.5 92.1 113.8 Full Service Wealth Managers 97.7 114.4 115.6 124.6 151.0 Investment Managers 93.8 118.1 123.2 137.3 141.1 Private Banks 170.0 187.9 198.3 206.1 233.7 Total 419 497 514 560 640
Source: ComPeer - http://www.compeer.co.uk/
There is also £660 billion of assets managed in UK authorised funds (OEICs and unit trusts) of which around 65% of funds under management is retail. About half of this 65% is direct holdings by individuals, or £215 billion. The Office for National Statistics (ONS) identifies a further retail sector pool that is direct holdings of single company shares by individuals. ONS values these holdings at £187 billion, but there is overlap with the wealth management and private client investment management figures above, so only about half of this amount should perhaps be counted. An estimate of the retail sector is therefore £660 billion + £215 billion + £98 billion = £973 billion, or rounded £1 trillion. Estimates of up to £1.5 trillion were put forward by those consulted as part of the research, albeit without supporting data.
The Retail Distribution Review The Retail Distribution Review (RDR) was widely viewed as a welcome development in driving transparency around areas of advice, platforms, and clean share prices. Along with the many benefits this has brought, some respondents raised concerns that RDR, while ensuring that advice is independent, transparent and aligned with client rather than provider interests, has increased cost transparency and had the effect of reducing the volume of advice sought.
Some industry participants had expected a new form of Simplified Advice to have emerged by now. The purpose of Simplified Advice is to reduce the price of advice at the point of
45

Metrics and models used to assess company and investment performance
delivery, but so far this is not on a commercial footing so unable to fill the current higher than market clearing price for advice26. The concern continued that RDR has led retail investors into increased reliance on metrics, many of whom may lack the expertise needed to make sound investment decisions in the absence of advice. Many of the metrics and measures are the same or similar to ones used by professionals and practitioners, or they have been developed by industry to mostly serve investment fund manufacturers, for example fund categories and sectors. In short, the customer problem begins with unfamiliarity with many models, metrics and measures in use, and in many cases little chance of their being understood.
Is one type of investor or situation more prone to unwarranted portfolio turnover? One early aim of the research was to find agreement among the interviewees about which investor clientele makes changes to their investment portfolio with the greatest unwarranted frequency or suboptimal timing and under what circumstances. The aim was to then focus on the models, metrics and measures in use by this investor clientele that might help reduce unwarranted portfolio turnover.
Rather than finding agreement, respondents had mixed views. Discretionary managers, investment advisers, execution only clients, and individual investors who were not clients, were each mentioned as responsible for unwarranted high frequency or suboptimal timing, suggesting problems exist in all channels: discretionary, advised, execution only, and individual clients.
• On discretionary management:
“The performance numbers of a discretionary manager rarely completely flatter, which leads the client to ask “what are you doing to improve performance?” The discretionary manager starts to think of things that might help in the short-term to generate performance. An adjustment is made, a view is varied, a process altered slightly, with the hope and expectation that these will feed through to a change in one or more performance variables. The very difficult thing to say is “nothing”; there is a pressure to constantly show progress of some kind no matter how vaguely related this is to performance outcomes. Here is the greatest tendency to needlessly fiddle with investment.”
• On advised investment:
“Advisers have often come from sales backgrounds and many firms still style advisers as salesman not stewards. A changing investment attitude goes with a sales mindset.”
26 These problems have been extensively documented and discussed elsewhere (for example, Gleneagles conference 2012) and are out of scope of this study.
46
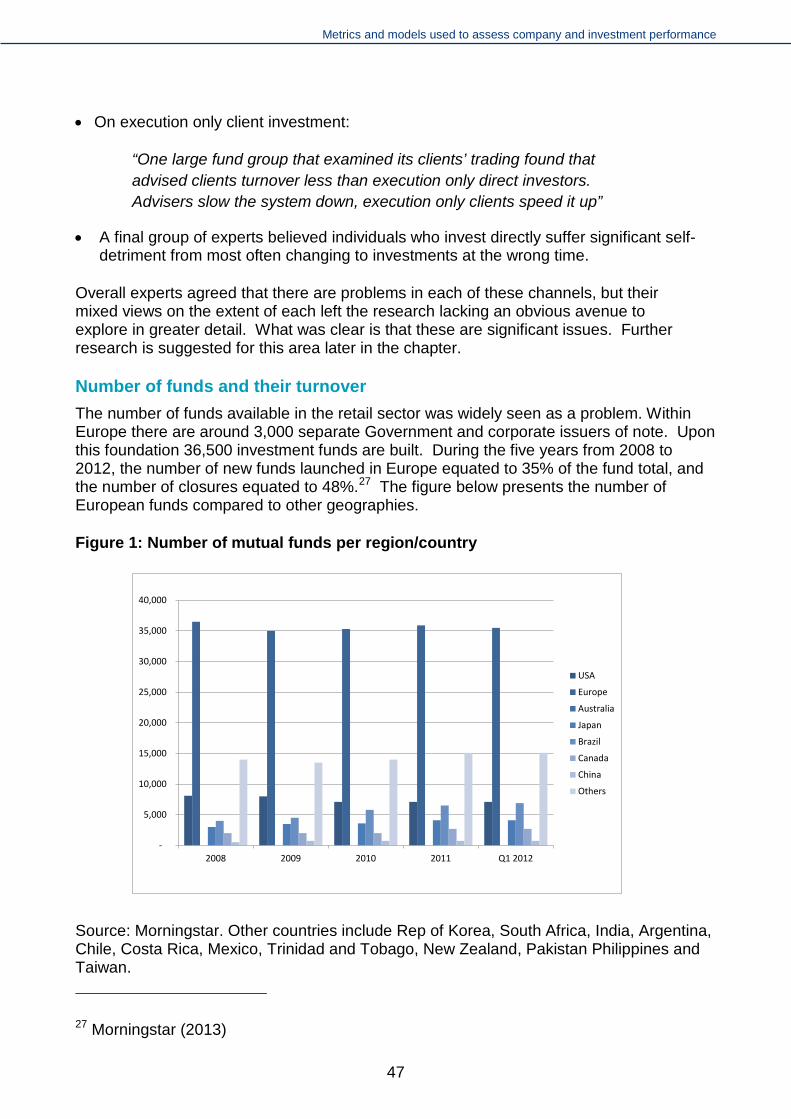
Metrics and models used to assess company and investment performance
• On execution only client investment:
“One large fund group that examined its clients’ trading found that advised clients turnover less than execution only direct investors. Advisers slow the system down, execution only clients speed it up”
• A final group of experts believed individuals who invest directly suffer significant self-detriment from most often changing to investments at the wrong time.
Overall experts agreed that there are problems in each of these channels, but their mixed views on the extent of each left the research lacking an obvious avenue to explore in greater detail. What was clear is that these are significant issues. Further research is suggested for this area later in the chapter.
Number of funds and their turnover The number of funds available in the retail sector was widely seen as a problem. Within Europe there are around 3,000 separate Government and corporate issuers of note. Upon this foundation 36,500 investment funds are built. During the five years from 2008 to 2012, the number of new funds launched in Europe equated to 35% of the fund total, and the number of closures equated to 48%.27 The figure below presents the number of European funds compared to other geographies.
Figure 1: Number of mutual funds per region/country
-
5,000
10,000
15,000
20,000
25,000
30,000
35,000
40,000
2008 2009 2010 2011 Q1 2012
USA
Europe
Australia
Japan
Brazil
Canada
China
Others
Source: Morningstar. Other countries include Rep of Korea, South Africa, India, Argentina, Chile, Costa Rica, Mexico, Trinidad and Tobago, New Zealand, Pakistan Philippines and Taiwan.
27 Morningstar (2013)
47

Metrics and models used to assess company and investment performance
Interviewees commented:
“When I began my career there were 300 unit trusts, and now there are 2,500."
"When I started out in the industry, commentators were suggesting then that it was in dire need of consolidating, but it has not happened and the industry has grown.”
Most of the funds in Europe are established as Undertakings for Collective Investment in Transferable Securities (UCITS) and governed by European legislation, which means that once authorised in one EU member state, they are available to be sold in any other EU member state, including the UK, without additional authorisation. Within the UK itself, there are about 2,500 authorised funds. ‘Authorised’ is a technical term meaning authorised by the FCA, subject to its regulations, and aimed at the saving and investing public. Other funds are unauthorised. For funds authorised in other EU jurisdictions there is a passporting arrangement into the UK.
The large number of investment funds with high rates of cancellation and creation leads to a need for models and metrics to cut-down the workload associated with sifting through funds. The interviewees cited five models used by advisers and individual investors to deal with complexity and information overload:
1. Individual investors base investment decisions wholly on external fund ratings or lists. A number of respondents cited evidence that around 60-70% of individual investors draw on external fund ratings or lists. Ratings are discussed in the next section.
2. Many IFAs and other advisers recommend the more highly rated funds. Ratings
provide a defence to advisers as they can cite the rating if the fund performs poorly or steps outside its risk levels. Ratings appear on fund platforms such as Aegon, Cofunds, Aviva, and Fidelity where advisers can sort based on these.
3. Small private client stock brokers and wealth managers often maintain an internal
list of one or two ‘approved’ external ratings, such as Morningstar or Best Invest, to be used by the advisers who work for them.
4. Larger private client stock brokers and wealth managers have an in house
collectives team who screen funds, meet fund managers and recommend a short-list of perhaps 40-70 funds for branch offices and staff to use in client portfolio construction.
5. Some IFAs, many of whom provide holistic advice on long-term planning and are
not investment specialists, simply ignore the many funds available and instead choose to establish a professional relationship with a discretionary manager they have worked with well in the past or which bothers to visit local IFA offices in the regions. Examples of discretionary managers are Rathbones, Quilter, and Brewin Dolphin. Visits by discretionary managers are useful because the IFA learns face-to-face what the manager is doing, reputationally what is going on, and improves understanding of the product so that suitability can be better judged. A further
48

Metrics and models used to assess company and investment performance
minority of IFAs picked funds mentioned positively in the news. In short, many IFAs simply ignored the universe of funds rather than try to assess and select from it.
Looked at solely from the perspective of reducing unwarranted fund turnover, the fifth model in which an IFA establishes a relationship with a discretionary manager and disregards the latest winning and losing funds based on ratings may be best. The IFA’s approach is to tell the client “I’m not expert but there are managers that are. Here is a discretionary manager who has bothered to take the time to build a relationship, visit in person, listen, explain and provide assurance to me of their ongoing interest to serve. Based on this comfort level I’m connecting you with the manager who will select an appropriate fund or funds for you. I’ll walk the manager through your circumstances so that the fund or funds selected are suitable.”
Ratings There was common agreement that the development of a fund ratings industry is a product of information overload caused by the large number of funds and their high creation and cancellation rates.
The typical external rating for a fund amounts to an assessment of the fund’s past performance relative to other funds. The timescales and basis of the ratings vary greatly from rating provider to rating provider. At the short end, one fund rating provider rates funds only on their past few weeks of performance. At the longer end, providers rate funds on overlapping periods such as 1, 3 and 5 years. Even then the latest 1 year performance has a weight of 3 times the 1 year performance of 5 years ago because it appears in each of the 1, 3 and 5 year performance numbers. The bias is to recency.
A minority of experts argued that ratings providers often receive rebates, discounts and fees from the fund manufacturers so are conflicted in the provision of ratings. They cited as evidence the lack of ratings on investment trusts and passive index funds and the emphasis, sometimes sole emphasis, on open-end, active funds. Conflicts are mentioned again below.
A rating for a fund is usually arrived at by placing a large number of funds into quartile or quintile performance buckets based on past performance. According to the performance bucket the fund is placed in, it’s assigned a corresponding number or letter grade rating.
The performance information that ratings use to allocate funds to performance buckets is usually past investment returns alone or past risk adjusted return. Costs are usually ignored. The relative measure of performance means a constant supply of top rated funds. This is true even if all funds performed poorly in absolute terms, whether through market decline or poor management. A number of experts thought that fund ratings benefit industry more than consumers, and are likely to give the wrong answer from an end investor perspective.
“Each mutual fund group effectively pays the investment fund rating agency to rate their funds, so there will always be the possibility to influence the rating agency. At the heart of all the problems is the issue that these ratings have not been designed for clients, but for
49

Metrics and models used to assess company and investment performance
advisers and sales teams to be able to meet regulatory requirements and to sell to clients.” “Every event, every conference, every award night, every trip of a ratings company is paid for, ultimately, by fund manufacturers, so in all likelihood fund manufacturers control the ratings.” “An increasing number of funds are being rated, partly because they make the process of selling products quicker and easier”
Several interviewees separately had heard evidence that around 75% of execution only investment fund flow goes to top ranked funds. The substantial value of investment that follows ratings and lists incentivised fund providers to proliferate funds and pay for the promotion of the ongoing subset of recent winners.
“When I was CEO of an investment fund group we did not know what the best performing investment fund will be. We shut down underperforming funds and launch new. This leaves only good performers and recent, and explains fund proliferation and turnover.”
A significant minority of interviewees thought that external ratings and lists encourage us to be fooled by randomness. A distinction was made between investment manager luck and skill and how could we know what we are looking at.
“So much is luck. If we took success over 5 years. Does the information ratio or performance that lies behind the external fund rating represent skill not luck? We’d need to randomly generate a 5 year distribution. Unless we look at this we cannot know how sure we are that the apparent skill is genuine. We’d want to do that for separate non-overlapping 5 year periods. That is not what external ratings do”
Ratings versus performance numbers While all the interviewees were distrustful of the investment use value of fund ratings, a small minority of respondents were less sure that if we took away ratings and showed only performance numbers - return, risk, or risk adjusted return, that investors would be in a better place, in terms of reducing unnecessarily high fund turnover. Their argument was that published external fund ratings probably change more slowly than published performance numbers.
“Ratings versus performance numbers – which changes slowest?”
“Are ratings any worse than the performance numbers they are based on? Raw performance numbers tell us absolutely nothing so anything other than performance numbers may be good.”
The problem was not the speed with which ratings change but the influence that ratings have on investment decisions. This is so much greater than performance numbers, and all the while there is opacity in terms of who pays for them and potential conflicts. Methodologies were generally distrusted by experts, but probably not by end investors.
50

Metrics and models used to assess company and investment performance
Suggestion Ratings providers tend to focus on open-end, active funds. The business is relatively opaque for a post RDR environment, with a web of financial links to the sell-side. While ratings are not investment advice, individual investors use them as if they do constitute investment advice and advisers and investment managers use them as a potential defence against a claim of a lack of suitability. There is significant scope for clarity and better practice. The suggestion was that this is something for the larger industry trade bodies or regulator to take forward.
Ratings and a link to short-termism Advisers who followed ratings agreed they usually choose a 5 star rated fund, where there is one, in the fund sector. There was said to be difficulty recommending a 3 star fund from the outset if a 5 star is available. Regulatory pressure was felt, real or perceived, to not sustain an existing allocation to a fund that had fallen to a 3 star absent any other information. The usual course of action after a while would be to recommend clients switch their investment to a higher rated fund. Pressure came from the regulator’s suitability rules, which has accentuated a sense among advisers that there is now less scope to ignore funds with better ratings when providing advice and recommendations. Suitability is the theme of the next chapter.
Discussion – general agreement There was common agreement that the large number of funds created information overload and to deal with this a significant fund ratings industry has developed. End investors follow ratings as they are more understandable than performance numbers, even if they are no more informative. Advisers follow ratings because they link to suitability and possible defence if the fund subsequently performs poorly. The relative nature of ratings gives rise to a constant supply of top rated funds even if all funds perform poorly in absolute due to market decline or poor management. If ratings tell you very little, if anything, about nominal or real future fund performance, this amounted to unwarranted portfolio turnover when ratings change.
Research required Experts thought that ratings lead investors into unwarranted high investment fund turnover. Experts also felt they needed greater conviction in this viewpoint in order to gravitate to clearer policy recommendation. They believed further research could help achieve this. Experts had strong but very different views about which channel: discretionary, advised and execution only, exhibited greatest unwarranted portfolio turnover. Evidence on this would help industry to focus on areas of most need. There is merit in further research to compile evidence on the levels of portfolio turnover in the three channels to determine the extent of the problem of differences in portfolio turnover.
51

Metrics and models used to assess company and investment performance
Improvements As the interviews moved toward what better would look like, the following models were suggested:
1. Fewer funds 2. Other metrics alongside 3. A ‘union’ for savers
Each is now discussed.
Fewer funds Some experts thought that the large number of funds and their frequent change creates problems for investors who want to understand which funds have skill. Greater continuity and identity of funds was needed. Also mentioned was that fewer funds might help create economies of scale. These were thought important to delivering value for customers, whether through advertising, technology, research, costs or charges. Most respondents thought economies of scale in funds do exist, but that these are rents captured by the fund management industry because empirically larger funds charge no less than smaller funds. The greater concentration from fewer funds is entirely consistent with the 2012 Kay Review, which also called for concentration in other areas. Further arguments for fewer funds were: • Investment fund groups would narrow the focus of their resources. This would help
ensure a stronger and more identifiable investment philosophy, identity of funds, and greater effort on building track record and service.
• Monitoring and comparing investment funds is simpler and easier for end investors, and provides an opportunity for investors to consider a greater variety of fund information not at present looked at.
• Investors are more easily able to identify particular funds as well as identify manager talent.
• Economies of scale and consequent improvements on price could improve consumer outcomes.
Other metrics alongside Other experts believed that investment fund data needs a new discourse to help customers achieve more positive outcomes. Attention should be paid to developing a set of metrics alongside ratings and performance numbers that tell a more helpful story. The argument’s starting point was the retail customer problem of there being almost no possibility that the metrics currently presented are well understood.
“I don’t really understand the investment fund I’m invested in but this other investment fund in the category has a similar hard-to-understand model that has been performing better over the last 12 months, so I’ll switch”.
Out of this problem the following thinking emerged:
“Investors and advisers need to trust more and sales teams need to be out there trying to get ratings and performance off or low down the agenda because a focus on this is unhelpful. That is very hard for sales teams to do because the narrative, the discourse, has for so
52

Metrics and models used to assess company and investment performance
long been about performance. If we have not been performing well over the short-term we have to over explain which in itself undermines confidence and leads to switching which churns the industry. The message to customers needs to be you should not be judging us based only on a rating or past performance.”
One area suggested in which to look for answers was for fund managers to tell a more helpful story so that customers may think twice before switching. This is consistent with Kay who placed an expectation on fund managers to initiate a culture change to improve trust. A suggestion for this can be found in the box below. This suggestion complements those made in the later chapter on organisational investment time horizons.
The second, and more popular area suggested in which to look for answers was ownership. Investment fund groups, advisers and wealth management firms should be trying to make ownership feel more real. The argument continued that everybody’s starting assumption has been that customers care not for what they own but see investments only as instruments that yield performance characteristics. What follows is that ownership does not matter and only performance does.
But what if we started with the assumption that investors might care for what they own or even that they do care for what they own? Behavioural finance finds strong empirical support that ownership creates satisfaction, known as Divestiture Aversion or the Endowment Effect. People – animals even, become attached to what they own and value them more highly. If the fact of ownership makes us reluctant to be parted from what we own, from this comes the suggestion that if we want to slow the system down to encourage a long-term mindset we should be doing all we can to report ownership. The experts agreed that the aim should be to inculcate as much as possible a sense of ownership to encourage a higher reluctance to swap among funds and reduce the impact that changes in ratings and performance currently have on investment decisions. Experts mentioned the following ownership related information and metrics might be useful:
Suggestions 1. If we want to reduce unwarranted investment fund change by inculcating more of an
ownership mindset, the following information was thought likely to be helpful. • A summary of ‘here is what you own’, that references the companies owned and
their role in the real economy and in people’s lives. • ‘Here is the length of time you’ve owned each of these investments’. • ‘Here is how your holdings have changed and how they’ve increased or
decreased in number since we last reported to you’. • ‘Did you know’ facts about companies and industries held. • Linking investment holding information to the annual reports of the companies. • Passing on shareholder deals from companies e.g. restaurant, shopping,
entertainment, holiday deals, to both name on record holders of shares and unit holders.
• Offering some restricted ability for a say on voting via a representative or poll. • Links to company produced multimedia clips informing investors what the
company does and how their money is used by the company.
53

Metrics and models used to assess company and investment performance
2. If we want fund managers to tell a more helpful story so that customers think twice before changing investment allocation, the following model was thought likely to be helpful. Each fund manager for each client should clearly set out that their understanding of the client’s objectives and time horizon, the kind of investment journey and outcome the client is looking for, and how the portfolio contributes to the overall achievement of this. The point is for the fund manager to demonstrate that it can be trusted to act in accordance with the objectives. A fund manager would set out: • Their investment philosophy and approach • The model they have used to choose the client’s portfolio. • The approach they plan to use when deciding whether to make changes to
individual investments or emphasis they have in the portfolio. • What they understand the client’s investment objectives to be • Why they think the approach will work for the client’s investment objectives.
Research required The assumption that customers see investments only as instruments that yield performance characteristics has not been thoroughly tested. Investors might care for what they own if ownership was revealed to them, and may change their priorities or behaviour as a result. More research is needed to understand these potential effects in more detail.
It is possible that reporting on a collection of wider fund information in order to inculcate more of an ownership mindset may not be successful in changing behaviour. One expert doubted that investors would bother to look at the information, and cited evidence that less than 1% of clients ever ask for investment fund reports and accounts.
“Most investors will never read the information. The annual report with lots of information in is rarely asked for, let alone read. Will producing more information have a positive effect? Probably not. Might ownership information have a positive effect? Perhaps – but perhaps not. Surely performance is the only driver of fund change – why else would you?”
Another expert thought that ownership information might encounter push-back from some wealth managers and fund groups - what if a client spotted an aspect with a company annual report that rendered it an unsuitable investment. Some might see this as embarrassing, reputation harming, even financially damaging, although the reverse might be true that the opportunity is then there to engage more with clients, to learn, and to raise effort internally.
A ‘union’ for savers A further group of experts saw a need for a new governance model that focuses on the saver. They argued that previous Government reviews, for example Myners (2001) and Sandler (2002), have pointed to a need to strengthen the connection between savers and their money. The argument continued that more than one decade on from these reviews there remain few governance mechanisms to redress the dominance of producers. The
54
Metrics and models used to assess company and investment performance
challenge is to create a model to cover the hundreds of thousands of unrepresented retail investors. The principal-agent gap was thought to be relatively wide at the saver-fund manager interface. The new governance model proposed was an organisation, or ‘union’, to represent and advocate for individual investors. The organisation would act as principal to help ensure fund manager agents serve savers. The organisation could add value to savers by holding agents to account and monitoring the alignment of producers’ behaviour to the savers they serve. Experts thought that the organisation could be valuable in helping to encourage behaviours and metrics more appropriate to investors’ time horizons. The organisation would not rate, measure performance, or itself advise.
Several experts pointed to the many organisations that industry has created to represent its interests, for example National Association of Pension Funds, Association of British Insurers, Investment Management Association, British Bankers Association, Chartered Institute of Insurers, Chartered Institute of Securities and Investment. Without a savers’ voice, the regulator and Government will continue to hear very little from civil society and savers, and decisions are likely to continue to come down in favour of industry.
Of those experts who addressed the question, the majority thought that the regulator would surely find a union that represents only savers a valuable tool in helping to avoid capture by industry because most savers are too busy and preoccupied with their lives to have the time or inclination to participate at the level of detail needed.
“Just as in a parliamentary democracy you have a small number of citizens who take the trouble to scrutinise what is done by their representatives, similarly you could have the organisation undertake that scrutiny. An organisation that only serves savers would help rectify current imbalances and promote transparency and accountability of the investment industry to its customers and to help them trust others in the system.”
Respondents were mixed on whether or not investors would pay any attention to such an organisation. Around half thought not, just as most consumers don’t consult Which before making purchases. Generally, respondents believed that the focus should be for the organisation to communicate with producers for the benefit of consumers rather than communicate with consumers themselves.
“Might the organisation be able to put pressure on producers to improve value for money for those they serve? Probably. Could the organisation help to align consumer and producer time horizons and work to gradually influence metrics? Maybe.”
A handful of respondents thought this new governance mechanism was a step too far.
“No one knows how savers will respond and the regulator and industry are unlikely to offer any support to take the idea forward.”
One expert doubted that an organisation is the right direction to take.
55
Metrics and models used to assess company and investment performance
“The Money Advice Service has full backing of the regulator and Government, costs the consumer more than £50 million, yet touches the lives of very few. An organisation with less political and financial support may easily achieve less, although the reverse could be true that more may be achieved when freed from the knots of politics. But where does the funding come from, what incentives does this drive, and would the regulator recognise the organisation?”
Empowering the private client, wealth management and retail sector This chapter finishes with a collection of points raised by experts under the broad area of empowerment. Some experts believed that if the value of retail nominee holdings under advice was pulled together as a line item in the shareholder register of companies, listed companies would take greater note of the wealth management and private client sector. Greater participation in stewardship would be welcome by many in the sector. This is likely to involve standard setters and oversight organisations consciously including the sector to a greater extent than has been the case in the past. Inclusion of the private client and retail sector within stewardship is important if we believe that plurality of views can help improve outcomes as a result of the more and varied representation that results.
Some further transparency of the beneficiaries behind nominees was thought to help. Tagging additional information on who the investors are in share registers would help companies to better understand who owns them and facilitate a role for a greater variety of investors to be able to engage with companies. Without this companies tend to hear from only a small number of the larger asset management companies. Some wealth management interviewees had strong views about power and conflicts in the top handful of mega size fund managers. Their size leads corporations to mould policy and activity around the few, especially concerning transactions, capital and remuneration. Companies know they had to play the game of consulting and finding agreement with the 3 to 5 largest fund managers who represent 0.000001% of the shareholder base defined by number of different shareholders. To some extent, the views of wealth managers were borne from failed previous attempts to engage both with companies and large fund managers.
“The mega size fund managers suit regulators and companies for they help them do their job. Regulators like to push together and control and command while company boards like to say to “we’ve consulted with 10% of our shareholders” when all the while the company has seriously consulted with 3, who happen to be the ones most likely to get votes through at the AGM.”
56

Metrics and models used to assess company and investment performance
Discussion – general agreement The wealth management and private client industry is important in terms of investment size and employment, and perhaps is set to become more so following the April 2014 budget that announced changes on accessing and drawing on retirement savings. Inclusion of the private client and retail sector within stewardship is important if we believe that plurality of views can help improve outcomes as a result of the more and varied representation that results. Given that the wealth management sector manages some assets that are intergenerational, such perspectives may be helpful if we want to encourage a longer-term focus.
Suggestions In summary, three options are suggested to help better align the interests of end investors and the investment funds that serve them:
1) Inculcate more of an ownership mindset among investors. If we start from the not unreasonable assumption that investors might care for what they own, metrics about ownership would be reported alongside performance to encourage the endowment effect found in behavioural finance and to turn attention away from ratings and performance numbers.
2) Regulation could be used to encourage the consolidation of funds. This would help to create greater continuity and identity of funds, economies of scale, and an understanding of which funds have skill.
3) A new civil society organisation could be created – a kind of union for savers, to advocate for savers and redress the dominance of producer interest in the financial services industry. Those in favour believed strongly that an organisation that only serves savers would help rectify current imbalances and promote transparency and accountability of the investment industry to its customers and to help them trust others in the system. This received strong support from civil society groups, accounting institutes and trustees.
57

Metrics and models used to assess company and investment performance
A6 Suitability
Synopsis The focus of this chapter is on the retail investment sector. It identifies uncertainty about application of “suitability” requirements on asset managers and advisors to ensure investments are appropriate for their clients in terms of risk.
It suggests that in response to the threat of customer complaints and enforcement action, asset managers are over-monitoring of client portfolios, setting overly narrow volatility bands, and setting risk targets that appear to overly de-risk the client relative to his or her risk tolerance. It argues this is leading to excessive portfolio turnover.
Three suggestions are made to address this issue. First, fixed price fund management could be introduced to reduce excessive portfolio turnover. Second, managers should show clients and the regulator the impact on portfolio turnover if volatility bands were narrowed or widened slightly from their current position – to clearly show the trade-off involved. Finally disaggregated reporting of portfolio turnover could be revealed to both clients and companies.
What is suitability? The term ‘suitability’ refers to the steps that managers take in order to achieve the comfort level needed that a recommendation, portfolio construction, or a decision to trade is appropriately tailored, and so suitable for clients. Appropriately tailored means aligning the client’s appetite, capacity and need for risk - as well as any aversion and capacity for loss, to the risk of the recommendation or investment to ensure suitability based on risk. To do so, managers will work to understand:
• The willingness of the client to sustain volatility, drawdown and/or loss of capital, as well as the psychology to emotionally handle an investment loss.
• What the client means by risk. • The systems and controls needed to ensure the investment process operates to
achieve suitable client outcomes.
Suitability needs to be determined for all individuals, families, SIPPs, charities, trusts, and corporate customers who are classified as retail clients.
Suitability has been a focus of the FCA for the past 4 years. In 2010 and 2011 the FCA reviewed the suitability of advisory and discretionary private client management. Shortcomings identified led the FCA to issue a Dear CEO letter in June 2011. The FCA then moved onto review suitability in the private banking sector. Industry trade bodies’ current advice to member firms is that the FCA is likely to institute a S166 report and /or enforcement action if further significant shortcomings are identified.
The intent of this chapter is not to produce another circulation of what suitability is and is not, nor provide a perspective on the suitability debate. The purpose is to play back what the respondents thought concerning the relationship between suitability and a short-term approach.
58

Metrics and models used to assess company and investment performance
Suitability and the investment process Experts shared the perception that the regulator was over focused on suitability and subsequent enforcement action. A large majority of respondents believed strongly that as a result suitability has become too much of an influence on the private client and retail investment process. Respondents argued that suitability had the following four influences on the investment process that together contributed to an environment of short-term thinking:
1. Customers are able to complain too early. 2. Uncertainty about application. 3. De-risking clients. 4. Over-monitoring and line-by-line approach to portfolio suitability.
Each is now discussed in more detail.
Customers are able to complain too early Suitability leads an investment manager to establish a risk target and risk range for each client. Once the client investment portfolio has been established and is live, the client then has significant scope to complain following short-term departure of the portfolio from the target risk level and range. If the customer complains, the manager has a regulatory duty to log the complaint and the log of complaints goes to the FCA. The FCA uses the complaint log as evidence when determining investigation, enforcement action, and fine.
“Performance is now being filtered out. We cannot sell on performance any more. Firms almost always have to pay out if risk is wrong but if performance is wrong and risk is right then will not pay out. Risk of complaint, fine and payout is the meaning of risk to the sell side. Get risk wrong and get fined.”
One way managers can narrow the scope for clients to complain is to trade more frequently so that the portfolio stays close to the target risk level and well within the risk range.
Uncertainty about application Suitability was a concern for investment managers and advisers because the FCA does not say what suitability means nor offers prescriptive guidance which if followed will provide a ‘safe harbour’. The FCA decides ex-post if suitability has been achieved, which leaves managers both with ongoing uncertainty as to how they’re doing and a tendency to over-focus on short-term conformance to the detriment of the long-term.
“Practitioners serving retail investors are concerned about potential fines for not meeting suitability standards because the regulator decides suitability. The ambiguity of definition of risk becomes a major reason for uncertainty within decision making. A discretionary fund manager could potentially be fined for investing in a holding whose subsequent performance is good, investing in a holding whose subsequent performance is poor, as well as being sued by the investor for crystallising a loss.“
59

Metrics and models used to assess company and investment performance
De-risking clients Approximately one half of the respondents felt that a focus on suitability creates a situation whereby to ensure that a client has no basis for complaint, the investment manager must de-risk the client investments. . This was thought likely not be correct for most clients. De-risking was carried out through two steps. One was to put the client into a lower risk category than was probably warranted by emphasising client answers to questions on loss aversion. The second was to set a narrower risk range before portfolio rebalancing was triggered, leading to more portfolio turnover.
“The client risk profile questionnaire establishes risk tolerance and loss aversion. The emphasis we are putting on loss aversion because the regulator wishes us to leads many clients towards the low end of the risk spectrum. We have de-risked clients and reduced emphasis on return-based investment performance.”
Over-monitoring and line-by-line approach to portfolio suitability A significant number of respondents commented on the likelihood that an investment process following a suitability approach takes managers down a line-by-line approach to suitability whereby every stock in the portfolio must be separately and individually suitable. The portfolio becomes over monitored at a micro level.
“There may be ethical issues e.g. BAT and tobacco, BT and pornography. There may be stocks the client wishes to kick-out of the portfolio. The client may already be overweight certain stocks due to tax, there may be high or low yield needs depending on tax position. We may need to adjust the portfolio because the client holds employee shares in a large listed company that is a significant name within the model portfolio. The client may ask for restrictions expressed by reference to percentage exposures within the portfolio to particular sectors or individual holdings by market values. All of these take you down a line-by-line approach to suitability.”
The investment problem for managers was argued to be risk, line-by-line within the portfolio. This is a quite different outcome to the portfolio approach intended by the regulator. Within a portfolio approach, what matters is the risk that each security contributes to the portfolio as a whole.
One expert asked the rhetorical question “how did we get here?”
“We had a business need to ensure we could not run money on an inconsistent basis because that would not be treating customers fairly (TCF). This leads to all clients within a type having the same constituents, weights and timing of switching. We can then justify to the client the holdings because they are held in all portfolios. There is then TCF. One portfolio does not contain some telecom stocks while another a different set of telecom stocks of the same weight. No, this is same stocks, same weight, same model portfolio.
60

Metrics and models used to assess company and investment performance
If there are 2 clients, one client has invested a lump sum and the other drips money in as instalments both still have the same model portfolio irrespective of the level of the market. Both portfolios disregard market timing. Both buy at weight according to the model portfolio, and valuation is disregarded. We’ll never try to time the market stock-by-stock for clients. Timing the market leads to portfolio differences and that is off the model portfolio, and therefore violates TCF and suitability.”
Suitability and investment short-termism The short-term influences above contribute to investment short-termism for three reasons:
1. There are cycles and mean reversion in volatility and returns. 2. Following volatility can lead to poor timing judgement about when to trade. 3. Portfolio turnover is initiated to stop the portfolio stepping outside a volatility range.
Each is further discussed.
Cycles and mean reversion in volatility and returns Always keeping the portfolio close to the client’s risk profile was a situation thought correct in the short run but not in the long-run. The incorrect long-run position is due to the existence of market cycles and mean reversion. Short-run volatility and long-run volatility were not linearly related for cyclical asset classes, for example equities, real estate, or those that mean revert, for example bonds. By doing nothing the portfolio would in time move back within the suitable risk range.
“Short-run volatility management must mean under-risking client. Due to suitability we cannot take a long-term view of risk which may have volatility as later reverting to the mean for this can mean short-term client losses. If short-term volatility increases or decreases we have to rebalance back to the model portfolio regardless of our view on long-term risk.”
Following volatility can lead to poor timing judgements about when to trade The regulator’s preferred metric around which suitability is calibrated - volatility, measured by standard deviation, has a tendency to suggest portfolio turnover when a better option would be to not turnover the portfolio. Following volatility can lead a manager to buy at the top of the market and sell at the bottom of the market for clients.
“Virtually the whole of the private client wealth management industry has moved to some form of risk based asset allocation, with the principal driver a regulatory position that portfolio suitability for private clients be defined in terms of risk, where risk is expressed as investment volatility. But volatility is not a good encapsulation of risk because markets have tended to lose money following a period of low volatility and make money following a period of high volatility. Volatility is high at the bottom of the market following a fall so indicates to not
61

Metrics and models used to assess company and investment performance
buy, and low at top of the market so indicates not to sell. Volatility is a key piece – how wrong have we got this? A little, a lot?”
Poor timing judgement comes about due to a long-run empirical negative relationship between volatility and market level, or market valuation. Putting more capital into assets when volatility is low can cause clients to overinvest in an asset class following good performance. A market return sequence of +2%, +2%, +2%, +2%, +2%, +2%, +2%, +2%, has 0% volatility, but downside market risk is now high. Just what the actual investment outcomes for clients are will depend on the frequency and severity of market rises and drops.
One charity provided the following example of successfully not investing based on volatility within a suitability arrangement: In 2008 the trustees of a large charity made a sizeable shift into corporate bonds against the recommendation of the asset management company advising it. The asset management company cited high short-term volatility and high spread risk as reasons not to invest, but the trustees believed that in valuation terms higher spreads and higher volatility equated to low risk because on valuation grounds this meant greater safety margin and more limited downside risk. Ignoring the asset management company’s advice, the trustees switched a significant part of the portfolio into corporate bonds at the end of 2008 in time for good period of performance in the asset class.
Portfolio turnover is initiated once the portfolio steps outside a short-term volatility range The usual response to a portfolio or recommendation stepping outside a volatility range was correcting action by the manager or adviser. This usually entailed transactions and turnover. The ‘right’ answer was to do something, not nothing.
“At the heart of the piece the regulator drives short-termism. It sets the agenda in the retail/private client space. There has been a significant orientation by the regulator towards risk. This has established a culture that there never used to be. Risk is the principal driver of short-termism. Risk for us is the risk of not managing money within the client risk tolerance at all times – a quarter, a year, any period.”
“We cannot sit and do nothing. Far more is paid out in fines to clients and regulators due to the portfolio having the wrong investment risk than is paid out due to low returns.”
A clear emerging theme from the discussions with the experts was a belief that suitability requirements have brought heavier trading to high, medium and low risk client portfolios. Discussion was centred around the problem this particularly created for medium and low risk clients because expected returns for these portfolios are lower. The level of turnover is too high for the expected return. Higher fund level portfolio turnover was the result of the regulator’s suitability requirements.
“We have introduced an efficient process that the regulator desires but trading is now affected. We are trading to get the asset allocation
62

Metrics and models used to assess company and investment performance
correct because for us the problem is risk. We rebalance because volatility is outside bands. We would say we are getting the risk right for you, we would not say we are trading to get performance right for you.”
“We target risk consistent with that of the client. We will always trade when the portfolio risk steps outside the client risk band established as suitable for the client. We cannot trade to achieve the client’s investment objective, but the regulator seems unbothered by this.”
Trading and rebalancing Many experts used the term ‘rebalancing’ to describe the turnover they were undertaking. Rebalancing was often in relation to a ‘model’, or reference, portfolio. Rebalancing was said to have become more important as a result of the requirements for suitability. Platforms provide for this demand. By using a platform, managers and advisers can select automatic rebalancing options, for example each 3 months, 6 months, 9 or 12 months. Checking the box of a frequent rebalancing option significantly reduces manager and adviser risk of failing suitability. Some retail platforms report that 75% of transactions are ‘rebalancing’ to model portfolios.
Several experts believed that the investment industry doesn’t explain trading well. Respondents were also unsure about which terms - turnover, transactions, trades, switches, and rebalancing, to use for what type of portfolio turnover.
“Our trading is often hard to categorise. When we increase or reduce a holding in a stock because the stock’s contribution to overall portfolio risk is too low or too high is this a view on the stock or a view on the portfolio? If an asset class has performed well or badly and we sell from the portfolios and the proceeds are recycled by buying a little of everything across the portfolio to get to the model weights, is this rebalancing or do we say we are trading individual stocks? If we exit a whole asset class because of its valuation or risk do we put this down to views about stocks within the asset class in general or a view about the asset class? We’re not asked about this, about what the activity is, and why we are doing it.”
Experts who pursued a value investment style particularly disliked the pressure to rebalance because this made sticking with portfolio winners difficult to maintain. Rebalancing meant selling into price rises even if securities bought were cheap and buying into falling prices even if securities are expensive. The averaging meant you lose the skill of buying close to bottom and selling close to top.
Questions about disaggregated turnover The research sought to investigate further the link between suitability and portfolio turnover by asking experts the typology of their trading. The table below presents the results of this question.
63

Metrics and models used to assess company and investment performance
Table 3: Research on reasons for portfolio turnover Experts were asked how important the following factors were in generating portfolio turnover. The table below shows the approximate average percentage of turnover given by the respondents. Purpose Description % of total turnover Opinions about individual stocks or sectors
Views about securities, for example transparent business model, good governance, valuation
15
Asset class risk, valuation and expected return
Views about asset classes based on economic, sentiment, behavioural, financial, valuation, political indicators that describe market fears and expectations.
7
Maintain portfolio within risk bands
Reduce investment where volatility has risen and recycle to investments with volatility more in line with target portfolio volatility.
40
Automatically rebalance back to model portfolio
Rebalance based on time elapsed or on risk range.
25
Change in client life event or lifecycle
Changes made as life events and the lifecycle dictate.
5
Change of manager Crystallise investment with one manager and move to another manager.
3
Liability management To preserve capital through constant proportion portfolio insurance or asset liability model.
5
Results suggest that trading to maintain the portfolio within the risk band is the principal reason for portfolio turnover, accounting for 40% of all portfolio turnover. The second most important reason for turnover is rebalancing to the target weights of a model portfolio based on the elapse of time or a risk range. Both motivations link strongly to a need to demonstrate suitability. Together they account for two-thirds of all portfolio turnover within the private client and retail investment sample.
The message to the regulator is does the importance of suitability justify the amount of turnover identified? The message to companies is that some of the observable change in your shareholder register has no meaning. Often, the change you see is due to transactions initiated at the fund level and not reflective of opinions about the company or its shares. Only 15% of portfolio turnover was attributable to opinions about companies. Even for large active fund management companies the proportion of company level trades was no more than half of all trading.
“Turnover within the underlying funds is about 15% per annum, and turnover from unit switches and asset allocation between our funds is also about 15%, so about the same trading comes from active
64

Metrics and models used to assess company and investment performance
decisions as achieving model portfolios and desired top down asset allocation.”
The message to companies that most of the observable change in your shareholder register has no meaning links closely to Chapter B7 on Ownership Changes. In that Chapter there is also concern that corporate managers may take away a false impression of the meaning of ownership changes as shareholders exit interviews are suggested.
Discussion – general agreement There was strong consensus among interviewees that suitability requirements have contributed to more frequent portfolio turnover. They were in agreement that greater understanding of portfolio turnover should be a priority for getting the design of regulation and practice right for better consumer and corporate outcomes.
Research required The proportion of portfolio turnover due to changes at the fund level appears to be significantly greater than at the security or company level, but the picture is not entirely clear. There was confusion over which terms to use for which activity – transactions, trades, switches, turnover, rebalance. There may be merit in identifying this as an area for further analysis. This may help companies to better understand the meaning of changes in their shareholder register, help regulators better understand the impact of their actions, and help clients and customers to determine whether the level of portfolio turnover in their investments is commensurate with their investment objective, asset allocation and investment process.
65

Metrics and models used to assess company and investment performance
Suggestions Fixed price fund management One model suggested by a small minority of experts in order to reduce what was felt to be excessive portfolio turnover was fixed price fund management. The idea was that fund managers charge the client a pre agreed fixed total £ amount (e.g. £100) or a fixed % of the fund (e.g. 0.001% per £100) with all management costs, trading costs and commissions coming from this at the fund manager’s expense. The customer pays no more. An all-in-price agreed in advance of the service is widely evidenced in other industries, commercial aviation travel being one example. The idea was far from fully worked through in the minds of the few experts that mentioned fixed price fund management but the intent was to discourage the erosion of investment returns through excessive use of intermediaries and portfolio turnover. It was suggested that funds should not be able to charge the customer every time a trade is made irrespective of how beneficial the trade is for the fund. Fixed prices were thought to reduce turnover and allow easier fund comparison. Show client and regulator the modelling of expected portfolio turnover and width of suitability derived risk range There was interest in having managers show regulators and customers what portfolio turnover would look like if volatility bands were narrowed or widened slightly from their current position. This would encourage transparency and accountability because managers would have to justify in the round their choice of volatility band for the customer. A small change in band might mean a lot less or a lot more turnover. In turn, managers might select a more suitable volatility band for the customer. Disaggregated reporting of portfolio turnover to both clients and companies Disaggregated reporting of portfolio turnover by turnover category to both clients and companies was thought a potentially useful accountability device. Turnover is hugely important, as is accountability to those impacted, namely clients and companies. Clients need to be able to judge whether the level of turnover is proportionate. Fund manager reporting of turnover to companies would provide companies with new information that helps them sift the investor base for investors whose stewardship they should canvass and consider most. When companies are recipients of turnover unrelated to their own activity the proportionate corporate response to managers who trade that way should be less influence in engagement. This would help companies know who are the right investors to spend time with and hear long-term views from. As a start, disaggregated reporting on portfolio turnover by turnover category might separate out turnover due to:
• Opinions about individual stocks or sectors. • Asset class risk and expected return. • Rebalancing to return portfolio within the risk band. • Rebalance to return to model portfolio. • Change in client life event or lifecycle. • Change of manager. • Liability management.
66

Metrics and models used to assess company and investment performance
Part B: The asset manager-corporate manager relationship
67

Metrics and models used to assess company and investment performance
B1 ‘Narrow’ metrics and models
Financial analysts use a wide variety of metrics to measure company performance and populate valuation models. The key numbers involve forecasts that are sensitive to changes in macro-economic and market conditions, to a company’s competitive position and to judgments about management effectiveness.
In a CFA Society of the UK survey of its members, which informed its response to the Kay Review, the top five factors used by financial analysts to develop a forecast or recommendation were: cash flows; current share price relative to fundamental value; competitive advantage; balance sheet strength; and earnings outlook.28
Behind each of these lie common measures of performance that include earnings per share (EPS), free cash flow and net asset value, which feed into related valuation models. Each of the headline numbers can be broken down into dozens of line items. The following description of metrics and models is not comprehensive but covers some of the most common approaches.
Key metrics in forecasting and valuation models: pros and cons In practice, the profit/loss (P/L) account attracts the most attention (the exception is for sectors such as property, banks and insurers where asset values are critical and these are captured on the balance sheet). The cash-flow statement provides a vital cross-check between the P/L numbers and actual amounts received or spent, as well as important information on working capital changes and sources of finance. Most valuation models will use numbers derived either from the P/L, or from a blend of P/L and cash-flow figures.
The difficulties in using the cash flow statement alone as a measure of performance and for forecasting purposes include:
a) It does not run intuitively from sales at the top to profit after tax at the bottom. Instead it starts with a profit number, adds back non-cash items (e.g., depreciation of tangible assets) and takes off actual cash spent (e.g., capital spending on plant and equipment).
b) Cash inflows and outflows are lumpy: their timing does not follow the period to which they relate, e.g., advance payments for a long-term contract and capital spending on equipment that will last many years. This is addressed in the P/L account by the accrual accounting principle, which links the flows to the underlying economics and the relevant period, and to some extent smooths out the lumps.
While discounted cash flow models are often cited as the key to fundamental valuation (see below for an explanation of the DCF model), regular assessment of company performance and adjustments to the forecasting model draw most heavily on the P/L account.
28 CFA UK (2011)
68

Metrics and models used to assess company and investment performance
Key P/L metrics used to assess performance and for valuation using multiples Performance measures such as profit margins (e.g., operating profit as a percentage of sales) and the price/earnings ratio (share price divided by earning per share) involve qualitative assessments of a company’s competitive position and earnings outlook, as mentioned in the CFA UK survey. For all the metrics and models that follow, the questions include:
• How much time does the analyst have to assess the qualitative factors that affect the numbers?
• What is the purpose of the analysis: - to factor today’s news into the model and anticipate the share-price reaction? - to forecast long-term performance? - to value the company on a relative (to its peers) basis? - to value the company on a fundamental basis and compare that with today’s market
value?
Sales growth and profit margins: This entails assessment of the dynamics of the market the company serves: e.g., growth rates, competition and barriers to entry, and the company’s position within that market, e.g., pricing power and product mix. There are several measures of profit, depending on the costs and other charges that have been deducted from sales to calculate sales growth and profit margins. A few of the most common, with their pros and cons, are:
Ebitda: earnings before interest, tax, depreciation and amortisation. The advantage of this high-level number is that it comes after common, cash-flow-based business costs such as staff pay and raw materials. Because it excludes interest costs, it is neutral on capital structure (proportion of equity and debt). This makes it easy to use for comparative purposes, both for assessing performance and for valuation. For the latter, the multiple used is enterprise value (market value + net debt) to ebitda. Common uses of this multiple include for comparisons of different cross-border transactions and of highly leveraged acquisitions by private equity firms.
Ebitda is effectively a P/L-cash flow hybrid and so can provide a basis for cash-flow forecasts. But it does not include the cost of replacing the fabric of the business, i.e., neither the smoothed P/L proxy for capital spending – depreciation and amortisation (d&a), nor the actual cash amounts invested to replace operating assets, nor does it include other important cash items such as restructuring costs or changes in working capital. These caveats mean that it can be misleading to regard ebitda either as a proxy for cash flow or as a primary measure of performance.
Operating profit, or ebit: earnings before interest and tax. This does include a charge for capital spending in the form of d&a, and it should also include other recurring charges such as the restructuring costs of a complex company. It is a key profit number in that it is the amount made after all operating costs. This operating surplus can then be used to pay interest (reward lenders), taxes, dividends (reward shareholders) and to reinvest in the business.
69

Metrics and models used to assess company and investment performance
Expressed as a percentage of sales, operating profit is typically used to calculate profit margins. Analysts spend considerable time working out which way a company’s profit margins are heading. As one said: “Often costs move in line with sales, and then margins don’t change, but we are looking for particular things…that might introduce variability”. Since average profit margins vary between sectors, the main comparison is between peers. Relatively low profit margins might indicate a lack of cost control, or it might follow a burst of investment to improve future profitability. Relatively high margins might indicate best practice, or raise a question over sustainability. High margins might depend on high prices for goods and services, which competitors could undercut, eroding market share; or on a pause in investment, which will have to resume to renew the fabric of the business.
Operating profit numbers are crucial for both financial analysis and discussions between management and investors, so that judgment can be applied to what might be temporary under- (or over-) performance. But the picture is complicated by ‘adjusted’ profit numbers, which many companies produce in addition to the figures that follow accounting rules. Analysts looking for a ‘clean’ profit number on which to base forecasts are encouraged by companies to exclude all apparently ‘exceptional’ costs, such as for restructuring. Standard & Poor’s, in a RatingsDirect paper published in February this year29, looked at FTSE 100 non-financial companies’ financial reports over the past four years: Of the 82 companies studied, 43 presented “adjusted operating profit that was greater than the IFRS operating profit in every one of the four years that we analysed”.
Pre-tax profit: Popular with UK equity investors because it comes after interest and all other charges. Since management has control over the capital structure of the business and should be held to account for gains and losses on its assets, this is regarded as an important number for assessing performance. The inclusion of interest costs (viewed alongside levels of and trends in borrowing, as shown in the balance sheet and cash flow statements) indicates management’s attitude to financing risk. Management is not responsible for the corporation tax rate, although in a multi-national company it might be expected to achieve the most favourable “blend” of tax rates from the jurisdictions in which it operates.
Earnings per share (EPS) and the price:earnings (PE) ratio: profit after tax (also known as net income) divided by the number of shares in issue gives the EPS number. The PE ratio is the share price divided by the EPS. The EPS measure, used in the PE ratio, is most commonly associated with a one-year forecasting horizon, to give a prospective PE ratio using today’s share price. But analysts will typically take their P/L models forward for three years. Forecasts can, of course, be extended, but one analyst commented that the financial crisis and subsequent recession had made them “quite nervous about forecasting even beyond one year. They feel it is unrealistic with the volatility and how things have been for a number of years”.
One of the caveats to focusing on EPS is that the number can be increased even when sales and operating profits are flat through share buybacks. Management may do this because the company has generated more cash than can be redeployed in profitable projects. But the consequent addition to EPS cannot be regarded as “quality” earnings because it does not represent growth in the underlying business.
29 Standard and Poors (2014)
70

Metrics and models used to assess company and investment performance
The PE ratio is a well-understood benchmark that is easy to use in identifying relatively cheap or expensive stocks. The comparison may be with the market average PE or with peers in a sector via the “PE relative” metric. The disadvantage of a PE measure is that it is based on one year’s EPS, either the latest annual number or using a one-year-ahead forecast. The share price does, however, capture a longer-term view, e.g., a high PE indicates that profits will be growing at an above-average rate, either through the company’s growth prospects or because current earnings are temporarily depressed and will recover.
The focus on relative PEs may be seen as a problem because it detracts from fundamental valuation and, therefore, takes no account of market prices under- or over-shooting. The latter problem can be addressed by applying a longer-term benchmark, such as the cyclically adjusted PE ratio associated with Robert Shiller, of Yale University, a 10-year average measure. The former requires a discussion of the classic fundamental valuation technique: discounted cash flow (see below).
Dividends and dividend yield: Dividends link the P/L account to cash flows and the balance sheet. The “payout ratio”, or “dividend cover” multiple shows the proportion of EPS paid out in dividends per share. Dividends are discussed elsewhere in this report, but their significance as a metric is that a) they are a cash number, providing a reality check on cash generation that is especially useful for complex companies such as insurers; b) they are a smoothed form of return to shareholders because management tends to keep the payout at a sustainable level; and c) they are used in one form of cash-flow-based valuation method: the dividend discount model, which takes the value of all future dividend payments and discounts them to a present value for the company.
The dividend yield expresses the annual dividend as a percentage of the share price. It is a popular measure of whether a stock is cheap or expensive relative to the market average. However, a high dividend yield may indicate that a dividend cut is expected, so analysis of value must also take account of other factors. Analysts focusing on value, such as Andrew Lapthorne at Société Générale, apply screens that sift for cheap PE valuations, balance sheet strength and sustainable dividend streams.
Using dividends as a key metric is also complicated by tax issues. Dividends are not tax allowable for the company – whereas interest payments are – or for many shareholders. This is one of the factors behind the growth in popularity of share buybacks as a form of distribution that supports the share price. Another consideration is that share buybacks can be turned on and off by management, whereas dividend payments are regarded as a commitment.
Dividend-based metrics are orientated towards mature companies. Companies in sectors where markets are growing, such as technology, tend to have more young companies paying either no dividend or with a low payout ratio – and conversely with high P/Es reflecting hopes of long-term growth.
Other metrics from the cash flow statement and balance sheet Cash flow from operations and free cash flow. The cash flow statement and its notes allow comparisons between the P/L account and actual cash inflows and outflows. At an operating level, analysts are interested in the “cash conversion” of operating profits into
71

Metrics and models used to assess company and investment performance
cash flow. They can compare the d&a and tax charges, for instance, with actual capital spending and tax paid, and they can see the cash cost of dividends and share buybacks.
Free cash flow is less well defined than operating cash flow. Used as a cash equivalent of EPS, the calculation starts with cash inflow from operating activities (i.e. with d&a added back and working capital changes taken account of) and then deducts actual capital expenditure, net interest payments and tax. Balance sheet and debt metrics. For banks, insurers and property companies, analysts focus more on the balance sheet. This is partly because most of the assets are recorded there – in a property portfolio, for instance – and partly because the risks are too: insurance liabilities and banks’ exposure to different types of borrower, for instance. So for these sectors net asset value (total assets minus total liabilities – NAV) is an important metric. NAV, or NAV per share, feeds into valuation models that compare it with market value.
Other sectors, such as technology, media or pharmaceuticals, build value through innovation, training, and research and development. The spending on these items tends to be expensed through the P/L account and not capitalised. Hence, a big gap opens up between net assets and market value. “Where the balance sheet captures fewer assets, you focus on the P/L and cash flow,” explained one analyst.
Key issues for financial analysis are the quality of assets, and their sensitivity to changes in both economic conditions and market values. Assessments of these factors clearly require more than just mathematical calculations. Where assets are marked to market prices, which tend over- and under-shoot, important questions include whether the balance sheet is strong enough to absorb what might be temporary write-downs in value, and, conversely, whether a run-up in market values is sustainable. The balance sheet is only a historic snapshot of value on a particular date.
Another issue is that liabilities may be less downwardly flexible than the assets held to cover them, or their value may escalate unexpectedly, through compensation awards, for instance.
Judging whether a level of debt is sustainable or not involves another range of metrics: net debt: ebitda; interest cover (operating profit ÷ net interest charges); or a gearing ratio such as net debt as a percentage of net assets. The first has the drawback of not making interest costs clear; the first and second are very sensitive to the direction in which earnings are heading; falling cash inflows have a knock-on effect on debt; and net asset measures have the drawbacks mentioned above.
Valuation models other than P/E or ebitda multiples Discounted cash flow valuation model: With cash flows rated highest as the key to value creation, the most relevant “fundamental” valuation model is discounted cash flow (DCF). This entails forecasting cash flows for up to 10 years, discounting them to arrive at a present value and then adding a terminal value (applying an average market multiple to the final annual forecast) for the business beyond the forecasting period. As one analyst said, “using discounted cash flow forecasts is essentially a long-term call on the company”.
72

Metrics and models used to assess company and investment performance
But sustainable cash flows may be difficult to identify, as discussed above, in the interaction between the P/L account and the less complete cash flow statement. Apart from the inherent uncertainty of forecasting sales growth (or lack of it) and timing issues, judgment has to be applied to the capital spending profile.
Then there is the discount rate: the company’s weighted average cost of capital (equity and debt), or WACC. The tax deductibility of debt interest may encourage debt finance. The cost of equity is built up from the risk-free rate (benchmark 10-year government bonds), plus the equity risk premium adjusted for the company’s specific risk (its beta) compared with the market average.
The equity risk premium (the return that investors can expect to earn on equities in excess of risk- free government bonds) is surprisingly difficult to pin down. Elroy Dimson, Paul Marsh and Mike Staunton, at London Business School, reviewed its history for the CFA Institute30 in 2011 and found no consensus. Since 1978, estimates have varied from 3% to 10%, narrowing to 4-8% in the 2000s.
This means the DCF model is highly sensitive to changes in assumptions: in forecasts stretching up to 10 years into the future, in the terminal value and in discount rates that shift with government bond rates and equity risk premiums. So, this common fundamental valuation technique involves a high level of diligence and judgment. The plus points for the long-term investor is that the technique supports a “buy low” approach to investing by identifying companies trading below their fundamental value, and it counters the urge to sell quality stocks because of short-term share-price setbacks.
Several models calculate the return on invested capital (ROIC), where operating profits after tax, or free cash flow, are expressed as a percentage of invested capital – shareholders’ equity plus debt; or total assets minus cash and other current liabilities such as accounts payable. Looking for returns on a balance sheet number is a good way to spread judgment of performance beyond the P/L account, but, as mentioned above, this assumes the balance sheet presents a realistic picture of a company’s assets. As one analyst pointed out: “For, say, technology or media and for acquisitive businesses, the definition of invested capital can be distorted by a large slug of intangibles”, which are not on the balance sheet. This explains the declining popularity of the ‘Tobin’s q’ approach to valuation, which compares market value with the replacement value of balance sheet assets.
A narrower measure is return on equity (RoE), often used for banks. But its drawbacks were illustrated by the banking crisis where loss-absorbing equity had been suppressed through (over) distributions to staff and shareholders, flattering the RoE number. A ROIC approach would take account of debt as well as equity finance, and it is also worth asking why a broader cost-of-capital measure is not applied to banks. Another way of taking leverage into account for banks is to use the definitions set by the Basel rules. On a gross leverage basis (total assets/equity), prudential regulators have pointed out that returns on total assets often showed a much weaker performance in the run-up to the crisis than the RoE metric. The most commonly applied leverage measure for banks remains an equity-based, “core tier 1” ratio of loss-absorbing capital to risk-weighted assets.
30 CFA Institute (2011)
73

Metrics and models used to assess company and investment performance
All valuation models are subject to revisions to forecasts, and/or to the discount rate for DCF approaches, and/or to the composition of ‘capital’ in return-on-capital approaches. Even a ‘fundamental’ valuation is therefore fluid.
Investing on the basis of long-term cash-flow forecasting (or the detailed balance sheet analysis that is required for banks and insurers) requires patience. This is because momentum trading (following recent price trends) and other forms of herding (driven by fund managers’ fear of relative under-performance) lead prices to over-shoot and under-shoot their fundamental value. Dimitri Vayanos and Paul Woolley, of the London School of Economics, in their work on momentum and value (cash-flow-based) investing in 2011-1231, concluded that the longer the horizon, the more the investor should commit to fundamental value and the less to momentum. They found that the difference in risk over time was decisive in making the value approach superior to a succession of short-term bets, which also incur higher trading costs.
Most valuation techniques can be used for either short- or long-term investing purposes. The interesting question is why investors with a long time horizon do not focus more on fundamental value, which includes paying less attention to short-term share-price performance compared with a market-value-based benchmark.
What is the connection between models and the share price? The connections between long-term valuation methodologies and short-term share price movements can be divided into two categories: new information that causes changes to be made to forecasts on which valuations are based; and the degree to which the share price was already out of kilter with fundamental value.
One obvious example of news that is bound to affect the share price is a profit warning. According to EY, the accountancy firm, 255 profit warnings were issued last year by UK quoted companies. The average share price fall triggered by the warning, in the past five years, has been just over 10% for FTSE 100 companies and 14% for smaller companies.32 It is not only the numerical forecasts that are affected by such warnings. Management credibility is reduced, increasing forecasting risk.
The impact also depends on whether the company was on a high or low valuation, relative to its own share price history and the PEs of its peers. Keith McGregor, a restructuring partner at EY, said of the crop of Q4 2013 profit warnings: “Forecasts got a bit ahead of themselves, so it’s largely a correction of the rate of growth rather than a reversal.”33
Relative performance is an important issue. Metrics include the PE relative – a discount/premium to the sector average – and, in recommendations, whether the stock should be over- or under-weighted relative to its share of an index’s market value. The focus on relative values can distract attention from fundamentals and from absolute returns to the ultimate beneficiary.
31 Vayanos and Woolley (2011) 32 Ernst and Young (2014) 33 Financial Times, 13 February, 2014, “UK investors take stock after Rolls-Royce and
Tate & Lyle warnings”.
74

Metrics and models used to assess company and investment performance
Not all announcements that will have a negative impact on EPS are bad news. If a company is investing to expand its business, a case can be made that upfront costs will be more than recouped in later years. Yet managements fear the market’s reaction to a pause in earnings growth. A much-quoted paper by John R. Graham, Campbell R. Harvey and Shiva Rajgopal for the National Bureau of Economic Research34, included a survey of more than 400 US financial executives: “Because of the severe market reaction to missing an earnings target, we find that firms are willing to sacrifice economic value in order to meet a short-run earnings target. The preference for smooth earnings is so strong that 78% of the surveyed executives would give up economic value in exchange for smooth earnings.”
Leaving aside the intensity of US quarterly earnings seasons, which is not replicated in the UK, the attitude of the executives ignores evidence that analysts are aware of the dangers of earnings manipulation when companies are under pressure “to meet the numbers’. In an article for the Financial Analysts Journal last year, Messod D. Beneish, Charles M.C. Lee and D. Craig Nichols stated: “the ‘typical earnings manipulator’ is a company that is growing quickly, experiencing deteriorating fundamentals, and adopting aggressive accounting practices.”35
Analysts interviewed for this project were critical of managements that managed the business of the basis of quarterly returns. “History tells you that those are not the businesses you would want to invest in.” The main challenge for management is to explain the rationale for the investment, which would be seen as positive by investors looking for growth. Its record in delivering on promises would also be crucial: “Companies that have delivered good returns in the past will definitely be given time. For those with a bad record there will be more scepticism if they say earnings are going to be diluted.”
Different types of investor There has been much debate about the holding period of investors, amid claims that the average has fallen to a matter of months. Analysis for the Investment Management Association concluded that the ‘average’ figures were distorted by investment banks’ proprietary trading desks, hedge funds and other high frequency traders.36 Among ‘long only’ investors, accounting for nearly 40% of the UK equity market by capitalisation, it found average holding periods of 29-46 months in the first decade of this century – and no declining trend.
Clearly, traders thrive on news flow, but long-only investors will also look out for a short-term catalyst that will close the gap between a fundamental valuation and market value. A 2012 report by the Centre for the Study of Financial Innovation on the independent research sector found that ‘alpha capture’ systems (measuring market beating outcomes) were increasingly being used to track the performance of trading ideas.37
34 Graham, Harvey and Rajgopal (2004) 35 Beneish, Lee and Nichols (2013) 36 Investment Management Association (2011) 37 Heaney (2011)
75

Metrics and models used to assess company and investment performance
The danger lies in a bias towards ideas that generate trading activity. Portfolio churn creates fees that are passed on to end investors and often adds to momentum in share price movements, which then over- or under-shoot.
Another segment of the population is the ‘quant’, or data-based, investor, where decisions are based on mathematical metrics. Quants use sophisticated computer programmes to screen companies’ reported financial information. For short-term trading positions, this does not allow scope for judgment, which could accept a pause in earnings for the sake of future growth. Given a longer-term horizon, screens that sift for value metrics can be a valuable tool.
Within the long-only funds sector there has been a trend towards passive investment, which tracks the main equity indices.
The Investment Management Association, in its 2013 Asset Management Survey, found that 22% of assets under management in the UK were passively managed and that the annual growth rate in assets subject to passive mandates, at 11%, was twice that for actively managed assets. It also acknowledged that its survey under-estimated the role of exchange traded funds in the UK passive asset base.38
Others have identified a trend for “closet” index tracking. A report last year from the investment management firm, SCM Private, studied retail ‘active’ equity funds and found that, on average, 40% of each fund was identical to the index it was aiming to beat. Fees are significantly higher for active than passive management.39
The drawback of passive investment from the point of view of connecting share prices with companies’ fundamental worth is that it exercises no judgment on that worth, and so fails to counter herd behaviour and price-trend-driven momentum trading. According to Paul Woolley and Dimitri Vayanos, writing in the Financial Times: “If the bulk of professional investing neglects the value of the assets being traded, capital gets misallocated, markets are volatile and returns are puny.”40
For the index-tracking investor, the main tool in encouraging improved performance by the company is engagement with management, as advocated by the Kay review. The stewardship duties of fund managers have been a focus for corporate governance reform since the crisis.
Respondents to the CFA UK survey placed share price momentum at the bottom of the list of factors affecting their decisions. However there is a question as to how many institutional investors really avoid following the herd.
38 Investment Management Association (2013) 39 SCM Private (2013) 40 Financial Times 15 August 2012, “Investors must rediscover their patience”
76

Metrics and models used to assess company and investment performance
From metrics and models to short-term investment decisions It is clear that computing values for narrow metrics and models is not just a mechanical process, as has been outlined in this chapter: among other things, there are challenges in identifying cash flows and the level of capital invested in the presence of intangibles, and in determining what values to take for market-determined variables that can fluctuate, sometimes significantly, over short periods of time.
Given the uncertainties regarding the inputs to and output from metrics and models, investors have to analyse a broader mix of qualitative and quantitative factors before making investment decisions. One prominent asset manager investing in UK equities, for instance, related how a mix of sell-side analysis, visits to private companies in the same sector as the UK-quoted company being considered, focus groups of customers, customer surveys, expert consultations and background checks on management all influenced investment decisions. Considerable emphasis was also placed on the corporate strategies being pursued.
A broader perspective is, therefore, needed within a principal-agent framework to make the link between metrics and models and long-term investment decisions. In particular, while metrics and models signal company (and corporate manager) performance to asset managers, these numbers have the potential to be manipulated with the short-term in mind.
The key question is what drives corporate managers to behave in the abovementioned fashion and what can be done to improve the relationships they have with asset managers/end investors? The remainder of this part of the research aims to answer this this question with a focus on four topics: ownership changes, earnings guidance, sell-side analysis and dividend policy and cuts.
77

Metrics and models used to assess company and investment performance
B2 Ownership changes
Synopsis Changes in the holders of secondary equity (hereafter ownership changes) should not necessarily be used as a metric for investment decision-making. However, ownership changes could have an impact on share price and, consequently, bring about responses by the company’s managers as well as asset managers that could be detrimental to long-term objectives.
This chapter highlights the findings of in-depth interviews on this question and theory relevant to the responses of market participants. Companies appear to have the potential to be ‘distracted’ from the long-term as a result of ownership changes through share price movements that have the effect of changing the market value of the company’s managers’ compensation and trigger investors into considering/re-considering their investments.
Corporate managers may be taking corporate actions in response to changes in share ownership when they do not fully understand the reasons for these changes. In many cases these changes may not be motivated by company fundamentals but rather by other considerations on the part of asset managers and their clients, such as changes in asset allocation to equity over a wider portfolio of assets.
To remedy this, it may be beneficial for companies to have exit interviews, with significant shareholders and asset managers engaging in this process.
Theory Changes in share ownership, which have the effect of increasing or decreasing ownership concentration, should not affect company value systematically according to theory41: This is because the company's current and potential investors both make their decisions to maximise returns and sometimes the selling investors would be correct to sell while at other times the buying investors would be correct to buy.
As the in-depth interviews revealed, the management of companies are still concerned about changes in share ownership that they observe with the share price in mind, with liquidity also present as an intermediate concern. However, how relevant are these concerns of the management of companies, with regard to changes in share ownership and the share price, in the long-term?
It is contended that the answer lies in whether the level of liquidity allows for share prices to accurately reveal company value: if there is sufficient liquidity, potential investors will be willing to consider the investment proposition and allocate capital to it; however, if there is not, potential investors will not be willing to consider the investment proposition. In the previously mentioned sense, therefore, liquidity is important to the long-term.
41 Demsetz (1983)
78

Metrics and models used to assess company and investment performance
Two concepts are relevant with respect to liquidity: adverse selection and trading frequency. The presence of adverse selection has the potential to give rise to a lack of liquidity by discouraging trading between current shareholders (such as the management of companies and private equity funds of closely held companies) that have greater knowledge about future firm earnings than potential shareholders.42 While, greater trading frequency is linked to greater liquidity as investor portfolio turnover brings about reductions in transaction costs.43
In order to bring about a long-term focus, the abovementioned barriers to liquidity may be important to overcome – addressing differences in knowledge between current and potential shareholders (with regard to adverse selection) and establishing market/market microstructure to accommodate trading (with regard to trading frequency).
Interestingly, there is a countervailing consideration to bear in mind as regards liquidity, namely, that too much liquidity may give rise to short-termism insofar as investors may over-trade whenever share prices are dislocated from fundamental value. However, it is argued that this issue does not relate to a problem with liquidity but factors affecting the time horizons of market participants.
In-depth interview findings and discussion The in-depth interviews showed that company management and investors have liquidity, share price characteristics (namely, the level and volatility) and the concepts of adverse selection and trading frequency in mind when considering ownership changes.
Companies reflected on the costs and benefits of having relatively low levels of liquidity. The benefits of low levels of liquidity discussed revolved primarily around the share price perhaps having a higher value than it otherwise would due to there being greater demand than supply of shares; this observation was made by the management of companies whose remuneration was linked to share price, implicitly highlighting a greater interest in share price movements than perhaps should be warranted by changes in company value.
On the other hand, one company spoke frankly about how low levels of liquidity can be costly in the face of a large change in share ownership. The specific example provided related to a shareholder selling his/her 3% stake in the company:
“The impact was a huge decrease in share price, which took two months to recover… unsettling for other shareholders… ‘simpler and cleaner’ to have share price varying by performance rather than supply”
–Corporate
Another point made about the cost of having relatively low levels of liquidity was the associated inability to attract institutional funds – observations of this type were made clearly by both company management and asset managers. The mechanism that was
42 Glosten and Milgrom (1985) and Easley and O’Hara (1987) 43 Demsetz (1968)
79

Metrics and models used to assess company and investment performance
highlighted by most related to the fact that share price volatility overwhelmed consideration of the long-term value of the company and therefore, at an early stage, the fund manager would disregard the company as a potential investment prospect. In this context, one asset manager reflected on how “prices are 13 times more volatile than fundamentals”. A company manager described that “[the large asset managers] need scale – prices could work against them during downturns and then they would be stuck in the stock – this is why liquidity is important for us”.
One company manager framed quite interestingly how they viewed the abovementioned costs and benefits of having relatively low levels of liquidity in their stock, with regard to ‘inside’ and ‘outside’ shareholders:
“We are still [majority-owned] by a private equity house so our shares are held by a private equity house or management. Whilst at a personal level wealth is determined by the share price – only at the point you exercise does that crystallise. We can focus on the long-term… It is frustrating – I do not want to give the impression that we do not focus on [‘outside’] shareholders – we can spend days and days on the phone talking to investors and so on as that communication channel is important and we want them to understand the logic as to why short-term trends are not important”
–Corporate
In effect, this response communicated that the incentives of company management are well-aligned with the objective of creating long-term value and, in the face of relatively low levels of liquidity, communication with shareholders is required to address concerns about share price volatility. However, this process may be difficult and resource- and time-intensive.
Among companies whose stock is liquid and that are able to attract institutional funds, there appears to be less interest in share ownership changes: “Often no reaction to changes in ownership – if bought have an obligation to them to answer questions; if sold, just hope they will buy again in the future.”
One manager whose stock is liquid, however, commented on the value of having a star asset manager as a shareholder: “Investors treat holdings by star managers as a vote of confidence.” However, he also reflected that, equally, if star managers wish to sell, other investors follow: “Massive herding in investments – [a star manager] left and [another manager] followed”. Lastly, in carrying out discussions with investors around such events, investor relations’ managers construct favourable narratives:
“My thinking strategically moves along the spectrum of ‘if it is good enough for [star asset manager]’… to ‘don’t worry about [star asset manager]’… my job is to create the demand in an orderly way such that current investors that have been with us can exit and there is a ready market of potential investors”.
–Corporate
80

Metrics and models used to assess company and investment performance
Discussion and suggestions
Discussion The theory outlined above highlights the relevance of liquidity in enabling investors to make long-term decisions about company value. The importance of liquidity was also addressed by market participants in their in-depth interviews in connection to their thought processes and actions in relation to changes in share ownership.
One group of companies that appears to focus well on the long term is the group with liquid stocks that react very little to changes in share ownership. Ownership changes are viewed in terms of one investor having achieved his/her price target and wishing to exit and another seeing further progress in company value and therefore wishing to enter. This approach seems to be effective with regard to the long-term as management are not dedicating time that may be better spent on corporate activities and are not being influenced by changes in their share registers.
Another group of companies that appears to focus well on the long-term are those with less liquid stocks that respond to changes in share ownership by communicating to investors why the share price response does not reflect changes in the company fundamentals.
Alternatively, two observations were consistent with short-termism on the part of market participants: company management concentrating on changes in share ownership and share price movements; and herding by asset managers around the investment choices of star asset managers also hints at short-termism.
Suggestion – Exit interviews with significant shareholders
Addressing short-termism The discussion above highlighted how both a wide shareholder base and narrow shareholder base have the potential to allow companies to concentrate on the long-term. These models could therefore be useful for other firms to reflect on.
However, it is still important to note that representatives at corporates interviewed were conscious of the exit of significant shareholders and the share price implications of such events.
Corporate managers highlighted that it was usually unclear why significant shareholders disposed of their holdings in their companies. They may be able to gather some understanding of the reasons based on recent corporate activity undertaken or, for example, differences in strategic views with investors. However, the only source of feedback they usually were able to gather came from brokers to whom asset managers may describe the rationale for their transactions to; asset managers confirmed that this information is something that they rarely disclosed to corporates.
Corporate managers may be taking corporate actions in response to changes in share ownership when they do not fully understand the reasons for these changes, reflecting short-termism. In particular, two asset managers suggested that corporate managers’
81

Metrics and models used to assess company and investment performance
may over-react, as many times trades are not motivated by company fundamentals but other asset manager considerations (e.g., asset allocation). One example of this behaviour would be the modifying of corporate plans in response to perceptions of what short-term investor expectations may be. Suggestion description
Exit interviews or other forms of communication between corporate managers and shareholders that divest themselves of substantial holdings in a company are recommended. Simply, by having greater feedback from (existing) shareholders, corporate managers would be able to make more informed strategic decisions. This recommendation is in a similar to turnover reporting suggested in Part A. Implications for trust
Exit interviews and other forms of communication have the potential to improve trust between companies and asset managers. At the present time, there is sometimes a sense of mistrust between the two parties. Companies describe their corporate strategies to asset managers but face the risk that asset managers are only using this information as part of their market research into another investment proposition. Asset managers react to the information they are provided, but with a degree of uncertainty about how forthcoming corporate managers are, if they do not trust them.
Discussions at the time of a major shareholder divestment are useful because there is likely to be less reason to mistrust at this stage and asset managers may therefore be more willing to provide genuine insights to corporate managers. More broadly, these positive interactions may influence other corporate manager-asset manager interactions positively. Implementation considerations
One option might be to introduce a provision in the Corporate Governance Code to the effect that if a shareholder with a substantial holding of equity sells a significant of that holding, the Board should initiate an exit interview with the shareholder concerned.
82

Metrics and models used to assess company and investment performance
B3 Earnings guidance
Synopsis This chapter considers the relationship between earnings guidance and short-termism. Earnings guidance involves company management providing information relevant to future developments in a number of metrics.
As a starting point, earnings guidance may be beneficial as it provides more information on the prospects of the company to actual and potential investors on the basis of which they can make better long-term decisions.
Moreover, insofar as investor expectations are closer to company performance when it is realised as a result of receiving earnings guidance, share price volatility should also be dampened, re-orientating investors from short-term market fluctuations to the long-term.
However, there is a body of evidence suggesting that the provision of earnings guidance is problematic. As company management’s remuneration is often linked to share price performance, there are incentives to positively manipulate earnings guidance. Earnings guidance tends to focus on short-term metrics and, if a company is attempting to meet them, long-term goals may be neglected – for instance, investment into R&D. Indeed, a number of large corporates have ceased to provide earnings guidance, given these issues (e.g., Unilever and Coca-Cola).
Earnings guidance also tends to be focused on point estimates of future performance which can become targets for company management, and triggers for decisions by investors as to whether a company is on track to deliver against its strategy. The research suggests that if earnings guidance is being provided it should avoid providing point estimates and instead communicate uncertainty around forecasts using fan charts to dampen the potential for unwarranted reactions to differences between market expectations and realisations of earnings. A more sophisticated and nuanced approach to forward guidance on company performance, could be more closely linked to an improved dialogue between companies and investors on company strategy and risk management. A further suggestion is that companies and investors could have an annual meeting focused on forward looking strategy only – that is, separate from the reporting cycle and the AGM.
Theory The motivation for Earnings Guidance Companies may manage market expectations by providing earnings guidance.
Information provision One motivation for providing earnings guidance, consistent with a long-term perspective, is to improve investors’ information about the company. Companies have more information about their future prospects than do current or potential investors. Therefore, if they produce credible information about their own expectations, this can improve the accuracy
83

Metrics and models used to assess company and investment performance
of investors’ expectations for the company. The role of providing earnings guidance has been summarised as follows: “Information and incentive problems impede the efficient allocation of resources... disclosure and the institutions created to facilitate credible disclosure between managers and investors play an important role in mitigating these problems.”44
Dampening share price volatility An additional benefit of producing earnings guidance is that it may reduce the volatility of the share price. Since earnings guidance aims to guide market expectations towards the company’s beliefs, there is likely to be a reduction in the dispersion of investors’ forecasts of the company’s performance, thereby reducing the volatility of the share price.
Potential for short-termism There has been considerable concern that companies’ attempts to manage market expectation have led to short-termism by both managers and investors.
Since earnings guidance focuses on near-term profits, it conveys short-term rather than long-term company performance to investors. This has the potential to incentivise managers to give preference to activities that enable the company to meet short-term targets at the expense of long-term investments and lead to companies attracting a short-term investor base.
Short-term orientation Short-term targets can provide managers with incentives to “engage in questionable practices or suboptimal behaviour to meet earnings targets”.45
Firstly, by focusing on short-targets, company management may use a considerable amount of resources to meet earnings guidance. Secondly, it may lead to managers prioritising activities that will allow them to meet their forecasts, even if such activities would not be in the long-term interests of the company.
A compounding factor that possibly increases the management’s incentives to pursue earnings management could be their compensation structure, which is frequently based on share price movements.46
Attracting short-term investors An additional effect of companies’ provision of earnings guidance may be that it attracts a specific type of investor, notably short-term investors. Because earnings guidance highlights firms’ near term performance it is likely to “distract the market’s attention from the company’s long-term prospects”.47 Consequently, investors that are attracted to the
44 Healy and Palepu (2001) 45 Karageorgiou and Serafeim (2014), citing Fuller J., and M. Jensen. (2002): “Just Say No to Wall Street.” Journal of Applied Corporate Finance 14: 41-46. 46 Hall and Murphy (2003) 47 Karageourgiou and Serafeim (2014)
84
Metrics and models used to assess company and investment performance
company are disproportionately likely to be interested in short-term rather than long-term profits.
There is some evidence that shows that companies that issue regular earnings guidance are in practice likely to attract short-term investors.48
In addition, companies that issue earnings guidance tend to emphasise their short-term performance in their communications with investors.49
Reduced research and development expenditure If companies allocate resources to earnings management and ensuring they meet the market expectations they have set through earnings guidance, this may also lead to a reduction in investment in activities that boost long-term profits, such as research and development.
Examining differences between ‘dedicated guiders’ and ‘occasional guiders’, research has shown that dedicated guiders do meet or beat analyst consensus earnings forecasts more frequently than occasional guiders. However, they also have lower research and development expenditures. This research also shows that dedicated guiders have lower long-term earnings growth rates than those of occasional guiders.50
In-depth interview findings and discussion The statements made through in-depth interviews interestingly drew out how firms motivate the provision of earnings guidance. Firstly, one of the key positive focuses is reducing share price volatility, as mentioned in the previous section. Interestingly, another key focus is that by managing market expectations, firms discussed how the conversations they have with investors becomes more long-term-focused. This suggests that earnings guidance may not necessarily be associated with a short-term orientation.
Company managers are particularly interested in dampening share price volatility through earnings guidance as already mentioned. The threat of present investor exit and future investor non-entry is one reason why corporate managers try to influence share price volatility through earnings guidance; one company described this succinctly as follows, “If you have a volatile share price it puts long term investors off. Might overpower the value proposition”
Affecting share price expectations through earnings guidance is a means to keeping expectations in line with actual price developments. Interestingly, the company’s managers knew in quite some detail the reasons for asset managers holding their stocks and what was required, in terms of affecting their share price, to satisfy investment managers.
“Operating as an income stock… you are looking at a dividend yield of 5%... big dips can hit income… income fund is working on
48 Ibid. 49 Brochet, Loumioti and Serafeim (2014) 50 Cheng, Subramanyan and Zhang (2007)
85

Metrics and models used to assess company and investment performance
relatively thin share price growth and therefore looking for dividend but if there are fluctuations in the share price you are not a great play”
– Corporate
An interesting knock-on effect of volatility, however, is also that it influences the nature of engagement between corporate and investment managers. In the presence of volatility, short-term considerations dominate; but in its absence, the character of engagement appears to be in keeping with what one would envisage as a health, long-term corporate-investor relationship.
“[Share price falls]… are driven by actual short-term results rather than long-term – You sort of get tired of repeating the mantra of one quarter: You need to worry about us over three to five years.”
– Corporate
“[Given share price stability] talk about strategy rather than getting into the details of the numbers. [Investors] will have confidence that you are there or thereabouts. If you set expectations wrongly and drift and don’t meet the consensus then you get questions and nit-picking rather than focusing on the long-term. We have a well-established set of shareholders, know the business well, trust management -- conversations are [therefore] at a high level”
–Corporate
Another rationale for companies providing earnings guidance is to avoid market sentiment that is too positive because it may lead to short-termism in the form of the management of the company becoming pressured to meet this sentiment: “Company may feel stretched to meet the high.” This statement suggests that if the nature of earnings guidance is appropriate, it can help companies to avoid focusing on short-term targets.
Finally, and related to the previous point, company managers described how they are careful in their provision of earnings guidance because, while they want investor expectations to conform with their expectations of company performance, they are balancing this against being overly precise.
“As management do not want to pin your colours to the mast, need consensus within a range but do not want to commit. I think we get the balance about right."
–Corporate
86

Metrics and models used to assess company and investment performance
Discussion and suggestions
Discussion – mixed views The secondary research and in-depth interviews reveals that guidance appears to be beneficial as far as having market participants establish a long-term perspective is concerned. When market expectations are in line with results in the short-term, the resulting lower share price volatility implies prices may be communicating company fundamentals more accurately and communication between companies and investors is focused on the long-term.
Companies appear to be knowledgeable about communicating earnings guidance credibly without bringing about short-termism. As the in-depth interviews suggested, by narrowing market expectations rather than establishing precise earnings targets, companies avoid short-term price reactions that may arise through over-precision.
However, despite this relatively positive picture, the evidence described earlier in the chapter also sets out how earnings guidance has the potential to lead to short-termism internally within the company, attracting short-term investors and leading to fewer long-term investments (for example, into R&D).
Some companies now appear to believe the costs of earnings guidance outweigh its benefits. It has been reported that there has been a significant increase in the number of companies abandoning regular earnings guidance. Arguments that companies should stop earnings guidance appear to have been given more weight by the fact that a number of high-profile companies, including Coca Cola, Gillette and Unilever, have also announced that they are stopping regular earnings guidance driven by concerns about their short-term investor bases. For example, Unilever specifically stated the desire to attract a longer-term investor base as the main reason it abandoned regular earnings guidance.
Suggestion – communicating uncertainty in earnings guidance Addressing short-termism The aim of changing the nature of guidance provided would be with a view to managing investor expectations potentially better than they presently are because there is evidence of earnings guidance, in its present form, giving rise to various forms of short-termism (for example, reduced R&D investments). Suggestion description To dampen the potential for differences between market expectations and realisations of earnings, companies may wish to communicate uncertainty around forecasts as is the practice of the Bank of England Inflation Report, which uses ‘fan charts’51. In more simple terms, they may wish to communicate the path of metrics chosen within the bands of uncertainty set out.
51 Bank of England Inflation Report Fan Charts: http://www.bankofengland.co.uk/publications/pages/inflationreport/irfanch.aspx
87

Metrics and models used to assess company and investment performance
Implications for trust Communicating uncertainty is expected to have the effect of improving trust. Comparing guidance that forecasts earnings one quarter ahead and these same earnings forecasts with a ±5% range, there is a greater chance that the latter will not lead to investor expectations failing to be met. Considering the number of companies that could change the way they guide and the number of times they forecast each year, the opportunities to meet investor expectations (when previously they were not) may be quite large and consequently the footing on which corporate-investor discussions are had, improved. Relevance to executive compensation Communicating uncertainty may alleviate the potential for present executive compensation structures leading to short-termism on the part of corporate managers, as there is not such a pressure to meet short-term targets. However, if executive compensation was also linked to the medium- to long-term strategies of the company this could be beneficial in further shifting the orientation of companies towards the long-term. Implementation considerations Changes to guidance adopted by the likes of Coca-Cola and Unilever have been unilateral and therefore limited in terms of changing the nature of information provision by companies to investors more generally. It may be difficult for other companies to follow in the direction of Coca-Cola and Unilever without all companies within a sector doing the same. It may be beneficial for companies to discuss collectively the nature and format of information provided to investors as a starting point for changes. Government or industry bodies may have a role in facilitating such changes as there may not be another institution able to play a coordinating role; however it is important for changes to be company-led. Shareholder participation in these discussions would also be beneficial in a move towards generally increasing trust between companies and investors. A further suggestion is that companies and investors could have an annual meeting focused on forward looking strategy only – that is, separate from the reporting cycle and the AGM.
88

Metrics and models used to assess company and investment performance
B4 Sell-side analysis
Synopsis Sell-side analysts are important to the efficient functioning of capital markets due to the role they play as information intermediaries. With regard to earnings guidance discussed in the previous chapter, for instance, a key channel for information provision is through sell-side analysts who incorporate earnings guidance into their own earnings forecasts.
However, sell-side analysis may not be informative due to: • economic incentives and conflicts of interests: sell-side analysts may be
incentivised to provide optimistic suggestions in order to motivate stock trades and higher trading commissions and to earn corporate finance transactions fees;
• career considerations: sell-side analysts may adjust forecasts to please corporate management; and
• behavioural biases such as over-optimism.
Nonetheless, sell-side analysis may be important as market participants view its outcomes as a bellwether of market sentiment that may be used to inform momentum strategies that are costly to the long-term.
Policies are already in place to address the economic incentives sell-side analysis gives rise to, specifically, relating to the separation of equity research and other investment banking functions.
Additionally, the bias or lack thereof in sell-side analyst recommendations could be more transparently reported to investors (e.g., through the ratio of buy/sell recommendations made).
To go further in addressing the market for investment research, it may be beneficial to investigate what barriers pure research companies face to establishing a larger presence in the market for investment research, as they would not face the same incentives as sell-side analysts.
Theory52 In theory, sell-side analysts are important to the efficient functioning of capital markets due to the role they play as information intermediaries. With regard to earnings guidance, for instance, discussed in the previous chapter, a key channel for information provision is through sell-side analysts who incorporate earnings guidance into their own earnings forecasts.
However, sell-side analysis may not be informative and perhaps too optimistic.
Sell-side analysts are optimistic for a number of reasons. One set of explanations relates to the economic incentives the employing institutions of sell-side analysts have given rise
52 See Mokoaleli-Mokoteli, Taffler and Agarwal (2009) for details
89

Metrics and models used to assess company and investment performance
to, namely: sell-side analysts may be incentivised to provide optimistic recommendations (or at least recommendations to buy or sell, rather to hold) in order to motivate stock trades and higher trading commissions53; and sell-side analysts may also be optimistic in order to earn corporate finance transactions fees.54
Sell-side analyst optimism may also be driven by personal career considerations. Sell-side analysts may adjust forecasts to please corporate management.55 Research has shown that sell-side analyst career progression is more likely as a result of providing optimistic rather than accurate forecasts.56
A third set of reasons for sell-side analyst optimism is behavioural in nature. Optimism bias arises as market participants tend to be overly optimistic when the issues at hand are difficult to forecast due to incomplete or inaccurate information57, which leads them to under-estimate risk because they overestimate the precision of information they have collected and therefore its value58. Another interesting bias relevant to sell-side analysts is the representativeness heuristic, whereby judgments are made on the basis of existing stereotypes the analyst holds, rather than objectively. One study showed how sell-side analysts, may recommend expensive, high growth ‘glamour’ stocks and stocks with high prior returns even though such recommendations are costly in terms of price and future returns.59 ‘Contrarian’ analysis, characterised by the buying of poorly performing stocks, may also be driven by this bias as well60.
The conclusion that sell-side analysis may not be informative, is supported by research showing that investment strategies based on analyst stock recommendations are not more successful than the average61 or in the long run62.
Given that sell-side analysis may not be informative, the extent to which sell-side analyst views are taken into account both in arriving at investment decisions (on the part of asset managers) and in making corporate decisions (on the part of corporate management) is of concern. These issues were considered through our in-depth interviews, which are described below.
In-depth interviews The in-depth interviews suggested that sell-side analysis was seen as falling in quality. These views were framed by changes in the market for equity research observed in recent
53 Irvine (2004) and Jackson (2005) 54 Dugar and Nathan (1995) 55 Francis and Philbrick (1993) 56 Hong and Kubick (2003) 57 Shefrin (2008) 58 Daniel, Hirshleifer and Subrahmanyam (1998) 59 Jegadeesh et al. (2004) 60 Mokoaleli-Mokoteli, Taffler and Agarwal (2009) 61 Brown and Pfieffer (2008) 62 Womack (1996)
90
Metrics and models used to assess company and investment performance
years. One sell-side analyst noted that the quality of equity research had fallen with fewer sell-side analysts covering stocks and analysis of lower depth being carried out; which is a consequence of the falling profitability of equity research, for instance, due to fewer public offerings taking place.
Sell-side analysis content was previously perceived to involve a greater degree of qualitative judgment but now focuses on the result of quantitative analysis, which was seen to result in sell-side analysis of lower overall quality.
“Previously had teams with big databases and making judgments. Now it is a continuous battle to keep spread sheets up-to-date rather than strategic considerations, now very numbers hungry”
–Corporate
Further, the quantitative analysis is perceived to lack credibility: “Sell side lacks audit culture so the numbers are a bit ‘whatever’”.
A number of asset managers commented that they pay little attention to sell-side analysis in defining their investment strategies.
Nonetheless, even low quality sell-side analysis was considered to be important – “sell side research is useful on what the market is thinking about a stock”. In detail, one asset manager commented on how sell-side analysis influence market sentiment by the regularity with which they speak to their clients:
“Sentiment is more relevant for valuation purposes – Are they a high cost team? Are they prone to do buybacks? Do I trust them? Sentiment generated by the sell side. [Sell-side analysts] call 30-40 clients and give daily updates. Because news is not out there becomes a conversation – a narrative.”
–Asset manager
Reflecting on how market sentiment influences investment decisions, another asset manager reflected that: “Long-term fundamentals versus short-term factors: two years until fundamentals matter”.
Companies appear to respond to these issues by influencing sell-side analysis, which sell-side analysts appear to be open to due, for instance, to the career considerations mentioned above. Communication between companies and sell-side analysts is considered to be mutually beneficial: For companies, share price volatility may be dampened, as discussed in the previous chapter on earnings guidance; for the sell-side analysts, their reputation for making good predictions can be maintained with their clients.
“If I’m an analyst I want to achieve… numbers close to company numbers. Way too high or too low then as an analyst, when [I] report, I will be seen as out of touch (if too low) or overambitious (if too high) with the progression of the company and my numbers going forward.
91

Metrics and models used to assess company and investment performance
Company may feel stretched to meet the high. Helpful to them and us. Helpful to shareholders.”
–Corporate
Interestingly, assuming companies have better information on their prospects than others, this communication has the effect of reducing the gap between low quality and high quality analysis, but lowers the incentive to produce high quality analysis – while it may be in the immediate interest of the company to communicate with analysts, it may perpetuate a reduction in sell-side analysis quality.
“Reporting regularly helps level playing field between low quality and high quality which helps firms but also lowers value of research”
–Corporate
Despite these factors driving sell-side analysts towards a narrow range of company performance forecasts, analysts are still motivated to differentiate themselves from their peers.
“We have [xx] analysts… We are lucky enough that we have tier one brokers and tier two (though they are specialists in the sector). There is nothing to be gained in being the 10th analyst that produces a DCF (Discounted Cash Flow Analysis). To tell a story to investors they have to have a unique approach... If I can be a bit cynical, it is not about [our company] but about finding their voice and differentiating themselves from their peers."
–Corporate
A striking case in point relates to a company that described how a sell-side analyst provided mis-information in order to generate trading activity.
“People write all sorts… You can get into tense dialogue with analysts to indicate where their assumptions are wrong – unfortunately analysts sometimes have these incentives. Some of the things that get written are so wrong - mis-information."
–Corporate
In conclusion, sell-side analysis appears to suffer from a number of issues that may affect companies’ and asset managers’ ability to focus on the long-term.
92

Metrics and models used to assess company and investment performance
Discussion and suggestions
Discussion Users of third-party investment analysis, particularly sell-side analysis, appear to lack some degree of trust in third-party investment analysis. However, third-party investment analysis is important to the functioning of capital markets: some asset managers may not have the capacity to carry out all the required investment analysis necessary before arriving at an investment decision - for example, market research on a new technology; and others may not have the specialisation that third-party investment analysts may have gained as a result of spending many years focusing on one sector. The key question is what conditions would spur the growth in the market for third-party investment analysis that users could trust?
Suggestion – Research into barriers to growth in the independent research sector An important area of research would be to consider what conditions would allow the market for independent investment research to grow. A key issue market participants have with sell-side analysis is the potential for it to reflect the economic incentives of other arms of sell-side firms. Independent investment research firms do not have these same incentives but this raises the question of why the independent research sector is not larger than it presently is. A study that seeks to understand why this is would be useful. The study would benefit from a focus on the barriers independent research firms face in attracting asset manager clients that may be clients of sell-side firms. There is existing work in this area could be built upon. The CSFI has explored the state of the independent research sector63; and the IMA has considered the pros and cons of different arrangements for research procurement by asset managers64. Moreover, the study might usefully complement the recent work of the FCA to review the use of dealing commission and the market for research,65 and ongoing discussion about proposals to further decouple research from dealing commission as part of revisions to the EU Market in Financial Instruments Directive (MiFID).66
63 Heaney (2011) 64 Investment Management Association (2014) 65 FCA (2014) 66 European Securities and Markets Authority (ESMA) (2014)
93

Metrics and models used to assess company and investment performance
Part C: Dividends
94

Metrics and models used to assess company and investment performance
C1 Dividends
Synopsis This chapter is in two parts. The first part addresses dividends from an investment portfolio perspective. The second part focuses on dividends from a corporate decision making perspective. The first part reveals that many end investors find dividends useful, understandable, and valuable. Experts agreed that dividends can encourage long-term investment, both because a focus on yield often leads to investing on low valuation – a value investing style – and because attention paid to dividends encourages a long-term holding, to achieve a return it is not necessary to crystallise the investment. However, taxation of dividends was said to have reduced the level of interest in dividends and contributed to an investment culture based more around short-term capital gain. The preference for dividends in the absence of taxation would be significantly higher. It was also suggested that companies have responded to the reduced level of interest in dividends and greater interest in capital gain by designing capital gain into executive remuneration systems. This has led the system to increasingly orientate around capital gain, when despite the indication end investors would rather a more mixed split of investment return. It is suggested that funds provide information to help investors better understand the role of dividends as a source of investment return. Having established the presence of significant underlying investor interest in dividends, the second part of the chapter focuses on dividends from a corporate decision making perspective. Deviations from dividend policy in the form of dividend cuts signal deterioration in company and investment performance to investors. This is because companies set their dividend policy according to what they think they can deliver, so failing to deliver what has been promised sends a signal that management is not in control of the company. Due to the negative share price response which dividend cuts tend to elicit, corporate managers have the incentive to manage dividend realisations at the cost of the long-term (namely, by directing capital back to investors in the form of dividends at the cost of investments that exceed the company’s hurdle rate). The looming possibility of dividend cuts and the consequent impact it may have on the trust established between corporate managers and investors suggests reforms to the payments structure of dividend policies may be beneficial. Suggestions are made for changes in the design of dividend policy to reduce the extent to which investors disinvest in response to short-term dividend variability which does not reflect the long-term prospects of the company.
95

Metrics and models used to assess company and investment performance
Such is the interest in dividends that there was enough material by way of argument and evidence for a separate, stand-alone report. None of the experts suggested that companies in the early and rapid stages of growth would be advised to pay dividends to shareholders. But by the time companies publicly list and stocks become seasoned, that part of their growth cycle is often behind them. The question of whether to distribute or reinvest earnings was then less straightforward to answer and elicited many views.
This chapter is divided into two parts. The first part addresses dividends from an investment portfolio perspective. The second part focuses on dividends from a corporate decision making perspective.
Dividends from an investment portfolio perspective67
The long run context Several experts thought that the long-run story of dividends provides important context to debates about the potential role of dividends in short-termism. The story starts some 90 years ago when the Trustee Act 1925 set up a "Statutory Lists" system. Trustees used the approved lists to assess the suitability of equities within trusts. For a company to be on the list it needed to have demonstrated a track record of maintained and increasing dividends. The stock could then be read as suitable for trustee use within portfolios. On the stock exchange list a ‘T’ was placed alongside the stock. Making the list was desirable, the demand for shares was higher, and this created among listed companies a long-term distribution culture and a buy and hold approach among investors. US Trust law followed a similar pattern, and during the 1940s the average dividend yield on the US market was 6%, with 60% of the market’s return coming from dividends.68
The Trustee Investments Act 1961 removed the UK "Statutory Lists" system. Similar revision of trust law occurred in the US. During the 1960s, the average dividend yield fell in both the UK and US. To continue the US example, during the 1960s the average dividend yield fell to 3%, with 40% of the market’s return coming from dividends. In the decades that followed the market’s return coming from dividends continued to fall. During the 1990s the average dividend yield on the US market was 2.5%, with 15% of the market’s return coming from dividends. The UK experience is similar. Simultaneous to the fall over time in the dividend yield and the proportion of the market’s return coming from dividends is the rise in discussion about short-termism. Are the two linked? Views on the relationship between dividends and investment short-termism can be categorised into the following groups:
1. Dividends as a gap bridging discipline 2. Tax disadvantage of dividends 3. Short-term managerial mindset 4. Total return however delivered
67 By Paul Cox, University of Birmingham 68 Ibbotson SBBI Classic Yearbook; Market Returns for Stocks, Bonds, Bills, and Inflation,
Morningstar.
96

Metrics and models used to assess company and investment performance
Dividends as gap bridging discipline A small majority of experts believed dividends to be an important means of dealing with the principal-agent problem that arises between shareholders as principals and corporate managers as agents. A company that pays out a significant proportion of cash flow as dividend will need to go to shareholders or bondholders for future capital needs. Experts thought that having companies go to the market more often for capital was a way for shareholders to prevent companies from undertaking potentially wasteful capital expenditure 69. The activity improves the discipline and skill of managers. This accountability was thought to be important as for most UK listed companies there are no or few permanent long-term strategic shareholders, the discipline of the market is all there is.
“Dividends are among the most important ownership vehicles as they help sift information for agency problems. They take managerial culture away from short-term capital gain.”
Experts agreed that agency problems are potentially higher when a company's capital is largely self-financed through retained earnings as there is less ongoing discipline of capital markets. Paying dividends helps to prevent agency problems because the retention of earnings gives managers too much command over additional resources. This makes dividends a key gap bridging architecture for owners - they drive transparency in company internal investment.
“The dividend discipline does rein in some of the temptation to spend cash at high valuations. Plenty of dumb things are done with capital so dividends can be an effective discipline. The response by corporate management to our preference for higher dividends is “don’t you trust us to lead”, but this is not about distrust, this is about accountability”
In the case of many large companies, the build-up of earnings often outstrips attractive investment opportunities so paying dividends helps to get cash off the balance sheet.
Tax disadvantage of dividends Dividends paid by UK companies used to be tax free within investment vehicles such as Personal Equity Plans (PEPs) and pension funds. The removal of dividend tax relief for investors in the late 1990s means that tax is now payable on dividends by investors and investment vehicles. Taxation of capital gains is different. Using suitable tax wrappers and efficient financial management many investors never pay capital gains tax (CGT). Some experts claimed that this has led investors to focus less on long-term cash flow and dividend maintenance and more on short-term capital gains.
“A financial adviser can avoid tax on gains but not on dividends. The cost to the system has been a short-term outlook based on price gain
69 A different perspective, not mentioned by interviewees, is that companies can end up fixated on keeping the dividend stable, potentially at the cost of forgoing promising investment opportunities.
97

Metrics and models used to assess company and investment performance
rather than gradual growth in fund value derived from periodic income.”
“Government has created short-termism by taxing dividends and making them less popular than gains in price. There is a cult for quick returns based on the share price and a neglect of dividends.”
A majority of experts thought that dividends probably stopped rather than increased investment portfolio turnover. The focus on yield is positive because often this leads to investing on low valuation. With taxation of dividends there is now less incentive to find high yield and low valuation. A focus on dividends also leads to a culture of longer-term holding – to get to the return you do not need to crystallise the investment, and this makes dividends helpful in encouraging a long-term mindset. Several experts noted that the true propensity for dividends, i.e., in the absence of taxation, is significantly higher and that it was unfortunate that the slowing of the system due to interest in dividends is less as a result of dividend taxation.
The experts were quick to distinguish a long-term dividend culture from dedicated high yield funds that often sacrifice total return for a higher current dividend yield. High yield funds were considered to be a poor example of what a consideration of dividends and corporate cash flow within the investment process looked like. The main difference mentioned was that high yield funds often have high turnover near to company dividend dates to harvest a particular dividend and achieve high yield figures on the fund regardless of expected total return of individual stocks70.
“This happens regardless of price. The fund should really be looked at on a yield to maturity basis and investments traded on yield to maturity basis but this is not the focus of income funds and not what is reported.”
Short-term managerial mindset Many experts believed that the differential taxation of dividends and capital gains has shifted some amount of investor interest from dividends to capital gains. A rational shift in investor preference from dividends to capital gains has in turn inculcated within managerial culture a short-term capital gain mindset. There has been more pressure on corporate management to focus on earnings per share and share price targets rather than income, which in turn is straight forward to specify as targets within the design of executive remuneration. The type of mindset that a focus on capital gains encouraged was not helpful towards the longer term.
“We are forecasting a 4% prospective real return on equities. A great many of our long-term asset owners clients would be happy if we deliver a 4% real investment return world. If you can get dividends at
70 The current return of investor interest in dividends may simply be that flat yields elsewhere have led to focus on company management to return cash rather than reflecting a genuine propensity by all parties to provide and receive a higher proportion of the return on equities in the form of yield.
98
Metrics and models used to assess company and investment performance
inflation plus 2%, that is excellent. You then only need a small amount more from capital gain. If you are the CEO and you can grow dividends at 2% real this is great. But CEOs don’t think like that; they target double digit earnings growth, but how can they deliver? This cannot be done. The underlying economics don’t allow all companies to do this. All companies cannot grow more than twice as fast as the real growth rate of the economy. Yet that is what every CEO is in effect saying. Our CEO is one of the brightest yet wants double digit so that means financial engineering not dividends from operations and organic growth – this attitude that follows the financial crisis suggests business leaders have learnt nothing.
Total return however delivered A minority of experts believed that focusing on the trade-off between dividends versus capital gains was an old fashioned view. There are different types of companies, and both dividends and capital returns are needed. Quite what the balance is between selecting the shares of companies whose return is delivered by capital gain and distribution is the job of the investment manager in consideration of what’s best for the client. Portfolio total return is what matters. The discussion about dividends versus capital gains is really little more than how to split total return between distribution and retention.
Discussion – general agreement Investors find dividends understandable, and continue to like and want them. The principal-agent relationship is a key driver of demand for dividends as this helps investors to sift companies for potential agency problems. Investors’ true preference for dividends is higher than their revealed preference because the taxation of dividends has reduced some amount of interest in them. There was general agreement about the relationship between dividends and short-termism. Taxation of dividends has reduced the level of interest in finding high yield and in holding investments for a longer time period. Both have contributed to a short-term capital gain culture. Companies have responded with remuneration incentives weighted to capital gain rather than dividends and cash flow.
99
Metrics and models used to assess company and investment performance
Suggested metrics The broad appeal of dividends to a broad spread of investors suggests several potentially promising areas to increase a focus on dividends by funds. The following suggestions were proposed as metrics to help portfolio investors focus to a greater extent on dividends, and to provide a more balanced account of the sources of investment return: • Funds could report the proportion of fund return coming from capital gain and the
proportion coming from dividends. • Funds could report overall summary details of the track records on payment of
dividends by portfolio held companies. • Funds could report information on potential future dividends to bring investors clarity
and transparency given the increased use of current values in accounting which can increase difficulty for investors in understanding the proportion of profits in portfolio held companies that are distributable. In turn, this will drive demand for the component information from companies.
• Funds could report metrics about the security of payment of dividends, such as cash flow coverage and sources of dividend coverage in order to understand how the dividends are generated at the overall fund level. Barriers to dividend payment could be reported in light of the businesses of portfolio held companies, for example a summary of solvency and liquidity risks.
• Funds could reduce the existing focus on reporting current yield among income funds, and work towards funds reporting on something like a yield to maturity basis.
Dividends from a corporate decision making perspective71
Having established investor interest in dividends in the first part of the chapter, it comes as no surprise that companies are sensitive to this, and take a very planned approach to dividend policy. A company’s dividend policy decision determines how much of a cash dividend the company plans to return to investors each year; how it expects this dividend to change over time; and on what basis it expects the dividend to change.
Theory A company’s dividend policy decision determines: how much of a cash dividend the company plans to return to investors each year; how it expects this dividend to change over time; and on what basis it expects the dividend to change.
Conventional economic theory shows that the company’s dividend policy should not affect its value.72 According to the theory, this is because the company first allocates earnings to investment projects that exceed the corporate’s hurdle rate (thereby making the best long-term decisions) as per its investment policy and then distributes remaining earnings to investors as a dividend: the company’s investment policy should matter to its share price but its dividend policy should not. Put another way: if a company pays more in dividends, it
71 By London Economics 72 Miller and Modigliani (1961)
100
Metrics and models used to assess company and investment performance
will have to issue new equity to fund the same projects. By doing so, it will reduce expected price appreciation on the stock but it will be offset by a higher dividend yield.73
In practise, the company’s managers and investors (or, more usually, asset managers acting on their behalf) are engaged in principal-agent relationships, whereby the company’s managers (the agents) are expected to act in the best interests of investors (the principals) but where investors do not have full view of the activities of the company’s managers.
In this context, principal-agent theory shows that dividend cuts may signal the company’s perceived value to investors, reflected in its share price, but also bring about the potential for short-termism.74 According to this view, due to the presence of asymmetric information, where the company’s managers are better informed than the company’s investors, the company’s managers have the incentive to provide dividends at the cost of investment projects that exceed the corporate’s hurdle rate in order to affect the share price, thereby acting in the short-term. Additionally, investors may prefer to receive dividends instead of share price gains for a given level of total shareholder return due to behavioural reasons, reflecting short-termism as well.75
These theoretical results suggest that short-termism can arise as a result of the company’s managers setting dividend policy on any basis other than after first having established their investment plans in order to influence the company’s share price. In particular, the principal-agent relationship that characterises the company’s managers and investors engagement gives rise to short-termism as the company’s managers anticipate what dividend policy may be viewed favourably by investors and investors interpret what the company’s dividend policy may mean about company value.
It is important to take into account that these issues arise once the sector and point in the life-cycle the company is in are reflected, as for these fundamental reasons, dividend policy may differ also.
In-depth interview findings and discussion Evidence shows that each year between 1989 and 2008 for example, roughly 60% to 70% of companies did not change their dividends, and only a small percentage of 5% to 10% of companies decreased their dividends compared to the year before: Dividends are sticky. These results suggest a significant aversion on the part of companies to reducing dividends despite fluctuations in company value that may suggest reducing dividends may sometimes be required.76
73 This so-called dividend irrelevance holds given assumptions, particularly regarding the relative tax treatment of capital gains and dividends.
74 Miller and Rock (1985) 75 Shefrin and Statman (1984) 76 Damodaran (2003)
101

Metrics and models used to assess company and investment performance
Companies interviewed expressed implicitly their resolve to avoiding situations in which they cannot meet their dividend commitment, for instance, one FTSE250 company stated: "We never cut a dividend, we always maintain it through cycles".
Asset managers confirmed that the management of companies, particularly in mature, cash-generating businesses rather than those held for growth, are warranted in their aversion to cutting dividends because companies set their dividend policy according to what they think they can deliver, so failing to deliver what has been promised sends a signal that management is not in control of the company. As one asset manager emphasised: “[Dividend] increases are nice to have but cuts are bad news.”
Asset managers also discussed strategies of how the company’s managers use equity markets to maintain dividends and that these strategies are employed with executive remuneration in mind. One set out that:
“Companies know to avoid a dividend cut. I think companies have learned to manage this through buybacks and special dividends – [the management] goal is to hit personal goals – removing a special dividend and maintaining a dividend is not a cut”
Interestingly, this form of short-termism by corporate managers was viewed favourably by investors even though they claimed to have a long-term focus; especially given the background low yield environment investors are demanding income to move towards equity investments, as one asset manager described, “Investor dividends and buybacks are important in today’s low yield environment”.
Establishing and maintaining dividend credibility A great deal of effort is exerted by the company to ensure that market participants believe in the credibility of the dividend policy on a continuing basis. This effort begins with linking dividend policy to corporate strategy, as one company outlined: “Looking at our growth plans, we can safely give dividends and grow receivables. This is all well-communicated – anybody in the market is clear on this”.
Companies also carefully craft reports and interim management statements with a view to influencing analyst earnings forecasts (to which dividends may be linked). If a sell-side analyst’s forecast in particular differs from what the company expects, the sell-side analyst may revise his or her earnings forecast in response. This may not result in an effective dialogue about the fundamentals and strategy of the company.
"When we draft something it is pretty clear and someone will be able to put together an earnings forecast. We do not want to say this is the number, as we are then into the realm of profit forecasting. We can give key guidance on where profits will go. Giving scraps of information. They [analysts] can then go away and work out the rest. If we see a forecast out there that is way off we enter a dialogue on how they got there [emphasis added]”
– Corporate
102

Metrics and models used to assess company and investment performance
What is striking is the detailed way in which companies reflect on how to appeal to investors. Companies remarking in general described setting out a dividend policy as almost a necessary aspect of being a public company, as one firm described, “The point is that in our world – these are the strategies of the investor – if we want to make ourselves attractive to them we have to play to their rules."
Together the above findings suggest a potential mis-allocation of resources in three senses: firstly, it is important to the company’s managers and investors that the company honours its dividend policy though this may not be beneficial in the long-term (e.g., if dividend policy is met at the cost of positive NPV investment projects); secondly, establishing and maintaining a credible dividend policy is sustained or otherwise as a consequence of the sell-side analyst and investor perceptions; and thirdly, the company believes it has the ability to influence, and indeed invests time and resources to influencing investor perceptions.
Discussion – mixed views The discussion of dividend cuts was one area that elicited great variety of views. On the one hand, capital allocation in companies may be improved through dividend policy reform, targeted at dividend cuts, because companies may be redistributing profits at the cost of productive investments to avoid dividend cuts. On the other hand dividend policies, as they exist today, may be guiding managers towards growing real earnings over the long-term, a view put forward by some companies. For instance:
“Dividend is not for income per se but for the discipline – have to set some money aside. It is a signal of quality of financial performance. It is important for us to accept and put in place a dividend policy – commit. Acknowledges investor concerns and commits us to growth”
-Corporate
103
Metrics and models used to assess company and investment performance
Suggestions – new dividend payment structures
Addressing short-termism Suggestions are made in light of the mixed views presented above; that is, acknowledging the fact that market participants were divided on the role of dividend policy in carrying out assessments of company performance. Where there may be scope for change is in the design of dividend policies: The problem with dividend policies, particularly the threat of dividend cuts, is they give rise to short-termism in the way that corporates are managed. When dividend cuts occur they may not reflect the long-term prospects of the companies concerned; nonetheless, asset managers may withdraw client investments from said companies with associated share price responses. Perhaps more importantly, given the threat of dividend cuts, corporate managers seek to allocate capital to propping up dividends. To address this form of short-termism, new dividend payment structures may be beneficial. Suggestions One suggestion is for dividends to be split into two components: (i) a steady long-term component; and (ii) a fluctuating short-term component. The long-term component would be lower than the present dividend level and the short-term component would account for the rest. The fluctuating short-term component would be distinct from some discretionary/one-off mechanisms that already exist for returning income to shareholders (such as special dividends and share buybacks) because it would be rule-based insofar as it is linked to some, fundamental measure of corporate performance. Some companies already use special dividend payment structures such as this. The aim is for the short-term dividend component not to be viewed by companies and investors as the present dividend is (that is, leading to short-termism by both groups) because: a) it fluctuates rather than being fixed in nature; and b) would be linked to a measure of fundamental (rather than market-determined) performance. A further suggestion is that expected dividends could be linked more explicitly to the earnings guidance which provides information about expected performance in a range, rather than as a point estimate, as suggested in chapter B3. Implications for trust The aim is to change investors’ expectations from expecting a stable dividend to becoming comfortable with a varying dividend. The potential benefit is that rather than viewing dividend realisations as a single metric for company performance that has the potential to be misunderstood, it could be split into two metrics that more accurately separate out long-term fundamentals and short-term fluctuations. The implication for trust is that rather than a dividend cut being viewed extremely negatively by asset managers, and bringing into doubt the level of trust between company and investor, dividend increases and falls become the norm and therefore do
104

Metrics and models used to assess company and investment performance
not impact on corporate-asset manager relationships. Relevance to executive compensation If new dividend payment structures successfully dampen the share price response of dividend cuts then corporate managers would be less incentivised to use funds to paying out dividends, to the extent that pay is linked to short-term share price performance measures. A complementary suggestion to new dividend payment structures would of course be a continuing drive to lengthen the time horizon for corporate managers’ performance-related-pay. Implementation considerations New dividend payment structures may be more or less relevant in certain sectors; more important in mature companies with fewer growth prospects; and more important for so-called income stocks. Companies should therefore be free to consider participation in new structure dividend payment structures. Companies that do wish to split their dividends may, however, face problems at the present time: firstly, they may not be able to make changes because it is not what investors are ‘used to seeing’; and secondly, they may not have the market standing to make these changes unilaterally. It may therefore be useful an industry body to coordinate the introduction of new dividend payment structures among those that wish to take it up.
105

Metrics and models used to assess company and investment performance
Concluding remarks The research presented through this study was motivated by a desire to understand metrics and models used to assess company and investment performance with regard to orientating the functioning of the financial sector such that investment decision making does not create undue incentives on the corporate sector to focus excessively on short-term returns, to the detriment of the interests of investors with long-term investment horizons.
Metrics and models were viewed in the context of the principal-agent relationships relating corporate managers, asset managers and investors: corporate managers (agents) act on behalf of shareholders (principals) and shareholders being represented vis-à-vis corporate managers (agents) by asset managers (principals). That is, in lieu of the ability of principals to monitor agents, metrics and models are used to determine whether agents are acting in the best long-term interests of principals.
Metrics and models are imperfect, however. As the Kay Review highlighted, investors may place too great a reliance in a particular metrics or models to judge the performance of a company.
However, agents have incentives to promote the use of a particular metric or model, which prompts investment decisions in line with their interest rather than the principals', which in turn may shift investment decisions way from what is best in the long-term
With the abovementioned background in mind, this research sought to identify areas in which problems with metrics and models were observed.
A number of areas were highlighted:
• Fund manager procurement and selection
• Monitoring of stewardship by fund managers
• The not-for-profit institutional sector
• Organisational investment time horizons and client reporting;
• Investment funds, ratings and performance numbers;
• Investment suitability decisions;
• “Narrow” metrics and models;
• Ownership changes;
• Earnings guidance;
• Sell-side analysis; and
• Dividends.
106

Metrics and models used to assess company and investment performance
In each of these cases, an over-focus on metrics or models appears to detract the attention of corporates and asset managers away from the long-term. For example, out of a concern for the share price impact of cuts in potential dividends, corporate managers may overlook long-term investments.
Given the aim of improving principal-agent relationships and our observations on how metrics give rise to problems, the nature of the suggestions made are guided by the principle of avoiding substituting one set of problematic metrics with others.
Where the tone of suggestions in this report could have been related to improving metrics, given the eminent possibility that these new metrics would also be subject to misunderstanding, manipulation or misapplication, they are largely aimed at improving corporate manager and asset manager relationships in other ways, which it is believed would be more effective.
Trust is important in the asset manager-corporate manager relationship and indeed the asset owner-asset manager relationship; in the case of the former, asset managers are always very aware of the possibility that they may not have access to the right information. There is therefore a need to establish trust.
Remuneration is also important. As CEO performance-related-pay has increased, rather than increasing in turn the alignment of incentives between CEOs and shareholders, instances have arisen of the CEO maximising short-term share price performance at the cost of long-term value creation. In addition, similar issues arise for asset managers that may be motivated to achieve short-term returns as a means of managing business risk, in the sense of achieving performance that allows for the retention and growth of assets under management; and at the level of the individual asset manager, managing career risk by transferring capital from one investment to another based on the expectation of short-term share price performance.
Suggestions were made with these considerations in mind.
Overall, it is hoped that this research and the suggestions made will help to ensure that the institutions that are stewards of end investors’ assets can invest with an appropriately long-term focus, ensuring that UK companies are supported and challenged to create value for long-term.
107

Metrics and models used to assess company and investment performance
References Beneish, M. D., Lee, C. M. C. and Nichols, D. C. (2013), 'Earnings manipulation and expected returns', Financial Analysts Journal, 69, 2, 57-82
BIS (2012), ‘Industrial Strategy: UK Sector Analysis’, September 2012
Brochet, Loumioti and Serafeim (2014), ‘Short-termism, Investor Clientele, and Corporate Performance’, Harvard Business School Accounting & Management Unit, Working Paper 12-072
Brown, K.C., Harlow, W. V., & Starks, L. T. (1996). ‘Of tournaments and temptations: An analysis of managerial incentives in the mutual fund industry.’ The Journal of Finance, Vol. 51, No.1, pp.85-110.
Brown, W. and Pfeiffer, R. (2008), ‘Do Investors Under-React to Information in Analysts’ Earnings Forecasts?’, Journal of Business Finance & Accounting, 35, 7 & 8, 889–911.
CFA Institute (2011), ‘Rethinking the Equity Risk Premium’, Research Foundation of CFA Institute, 11, 4, 2011
CFAUK (2011), CFA Society of the UK (2011) Response to the Kay Review, available at: https://secure.cfauk.org/assets/2162/CFA_UK_response_to_the_UK_Equity_Market_Review_SENT.pdf
Cheng, Subramanyan and Zhang (2007), ‘Earnings guidance and managerial myopia’, mimeo
Damodaran, A (2003), Returning Cash to the Owners: Dividend Policy: http://people.stern.nyu.edu/adamodar/pdfiles/ovhds/ch10.pdf
Daniel, K., Hirshleifer, D. and Subrahmanyam, A. (1998), ‘Investor Psychology and Security Market Under- and Overreactions’, Journal of Finance, 53, 6, 1834–85
Demsetz, H. (1968), ‘The cost of transacting’, Quarterly Journal of Economics, 20, 267-291
Demsetz, H. (1983), 'The structure of ownership and the theory of the firm', Journal of Law and Economics, 26, 375–390
Dugar, A. and Nathan, S. (1995), ‘The Effect of Investment Banking Relationships on Financial Analysts’ Earnings Forecasts and Investment Recommendations’, Contemporary Accounting Research, 12, 1, 131–60
Dwyer, F. R., Schurr, P. and Oh, S. (1987), 'Developing buyer-seller relationships', Journal of Marketing, 51, 2, 11-27
108

Metrics and models used to assess company and investment performance
Easley, D. and M. O’Hara (1987), ‘Prices, trade size and information in security markets, Journal of Financial Economics, 33, 173-199
Ernst and Young (2014) News Profit warnings fall to three year low in 2013 but late spike takes shine off listed businesses’ performance with FTSE 350 bearing the brunt, 26 January 2014: http://www.ey.com/UK/en/Newsroom/News-releases/14-01-26---Profit-warnings-fall-to-three-year-low
European Securities and Markets Authority (ESMA) (2014) Consultation paper on MiFID II / MiFIR, May 2014: http://www.esma.europa.eu/consultation/Consultation-Paper-MiFID-IIMiFIR
FCA (2014), Discussion Paper DP 14/03 The use of dealing commission regime, July 2014: http://www.fca.org.uk/news/dp14-03-the-use-of-dealing-commission-regime
Francis, J. and Philbrick, D. (1993), 'Analysis' Decisions as Products of a Multi-Task Environment', Journal of Accounting Research, 31, 2, 216-30 Francis, J. and Philbrick, D. (1993), 'Analysis' Decisions as Products of a Multi-Task Environment', Journal of Accounting Research, 31, 2, 216-30
Fuller J., and M. Jensen. (2002): “Just Say No to Wall Street.” Journal of Applied Corporate Finance 14: 41-46.
Glosten L. R. and P. R. Milgrom (1985), ‘Bid, ask and transaction prices in a specialist market with heterogeneously informed traders’, Journal of Financial Economics, 14, 71-100
Guiso, L., Sapienza, P. and Zingales, L. (2008), 'Trusting the stock market, Journal of Finance, 63, 6, 2557-2600
Graham, J. R., Harvey, C. R. and Rajgopal, S. (2004), 'The Economic Implications of Corporate Financial Reporting', NBER Working Paper
Hall and Murphy (2003), ‘The trouble with stock options’, NBER Working Papers, 9784
He, Y. (2013), ‘Valuation of trust as an intangible asset’, mimeo
Healy and Palepu (2001), ‘The fall of Enron’, Journal of Economic Perspectives, 17, 2, 3-26
Heaney, V. (2011), 'Has independent research come of age', CSFI/EuroIRP report
Hong, H. and Kubik, J. D. (2003), ‘Analyzing the Analysts: Career Concerns and Biased Earnings Forecasts’, Journal of Finance, Vol. 58, No. 1, pp. 313–51
Howorth, C. and Moro, A. (2006), 'Trist within entrepreneur bank relationships: Insights from Italy', Entrepreneurship Theory and Practice, 30, 4, 495-517
Investment Management Association (2011), Understanding Equity Turnover Data: Initial Findings from IMA Research submitted to the Kay Review:
109

Metrics and models used to assess company and investment performance
http://www.investmentfunds.org.uk/assets/files/research/20111128-IMATurnoverResearchInitialFindings.pdf
Investment Management Association (2013) Asset Management Survey 2013: http://www.investmentfunds.org.uk/research/ima-annual-industry-survey/
Investment Management Association (2014) The Use of Dealing Commission for the Purchase of Investment Research: http://www.investmentfunds.org.uk/assets/files/research/2014/20140218-imadealingcommissionresearch.pdf
Irvine, P. J. (2004), ‘Analysts’ Forecasts and Brokerage-Firm Trading’, The Accounting Review’, 79, 1, 125–49
Jackson, A. R. (2005), ‘Trade Generation, Reputation and Sell-Side Analysts’, Journal of Finance, 60, 2, 673–717
Jegadeesh, N. and Karceski, J. (2004), ‘Long-Run Performance Evaluation: Correlation and Heteroskedasticity-Consistent Tests’, Working Paper (Goizueta Business School, Emory University)
Karageorgiou and Serafeim (2014), Earnings Guidance: Part of the Future or the Past?
The Kay Review of UK Equity Markets and Long-Term Decision Making, Final Report, July 2012), available at: http://www.bis.gov.uk/assets/biscore/business-law/docs/k/12-917-kay-review-of-equity-markets-final-report.pdf
Mokoaleli-Mokoteli, T., Taffler R. and Agarwal, V. (2009), ‘Behavioural bias and conflicts of interest in analyst stock recommendations’, Journal of Business Finance and Accounting, 36, 3 and 4, 384-418
Morningstar (2013). Beware Short Termism Among Fund Houses, 30 April, 2013. Accessed from the internet at http://www.morningstar.co.uk/uk/news/107939/beware-short-termism-among-fund-houses.aspx#sthash.l9KVzo7w.dpuf
Miller, M. H. and F. Modigliani (1961), ‘Dividend Policy, Growth and the Valuation of Shares’, The Journal of Business, 34 (4): 411-433, October
Miller, M. H. and K. Rock (1985), ‘Dividend Policy Under Asymmetric Information’, The Journal of Finance, 40 (4), 1035-1051, September
Principles for Responsible Investment (PRI) (2013), Aligning expectations: guidance for asset owners on incorporating ESG factors into manager selection, appointment and monitoring: http://www.unpri.org/wp-content/uploads/Aligning_Expectations_2013.pdf
SCM Private (2013) Closet Indexation Report, available at: http://www.scmprivate.com/content/file/knowledge/research/closet-indexation-report-full-sept-13.pdf
110

Metrics and models used to assess company and investment performance
Shapiro, S. (2012), ‘The grammar of trust’, in J. Pixley (ed.), New Perspectives on Emotional Finance, Oxford: Routledge
Shefrin, H. (2008), ‘A Behavioral Approach to Asset Pricing’, (2nd ed., Burlington, MA: Academic Press)
Shefrin, H. M. and M. Statman (1984), ‘Explaining investor preference for cash dividends’, Journal of Financial Economics, 13 (2), 253-282, June
Standard and Poors (2014) Why Inconsistent Reporting Of Exceptional Items Can Cloud Underlying Profitability At Nonfinancial FTSE 100 Companies, February 18, 2014: www.standardandpoors.com/ratingsdirect
Strätling, R., Wijbenga, F. H. and Dietz, G. (2012), 'The impact of contracts on trust in entrepreneur-venture capitalist relationships, International Small Business Journal, 30, 8, 193-212
Tuckett, D. and Taffler, R. J. (2012), ‘Fund management: An Emotional Finance Perspective’, CFA Institute
Vayanos D. and P. Woolley, (2011a), ‘An Institutional Theory of Momentum and Reversal’, Working paper, London School of Economics
Womack, K. L. (1996), ‘Do Brokerage Analysts’ Recommendations Have Investment Value?’, Journal of Finance, Vol. 51, No. 1, pp. 137–67.
111

Metrics and models used to assess company and investment performance
112

© Crown copyright 2014
You may re-use this information (not including logos) free of charge in any format or medium, under the terms of the Open Government Licence. Visit www.nationalarchives.gov.uk/doc/open-government-licence, write to the Information Policy Team, The National Archives, Kew, London TW9 4DU, or email: [email protected].
This publication available from www.gov.uk/bis
Any enquiries regarding this publication should be sent to: Department for Business, Innovation and Skills 1 Victoria Street London SW1H 0ET Tel: 020 7215 5000 If you require this publication in an alternative format, email [email protected], or call 020 7215 5000. BIS/14/1158