Embed Size (px)
Citation preview
Annual Report
Report

Metrode Madrid
MOST RELEVANT DATA
Supply and demand
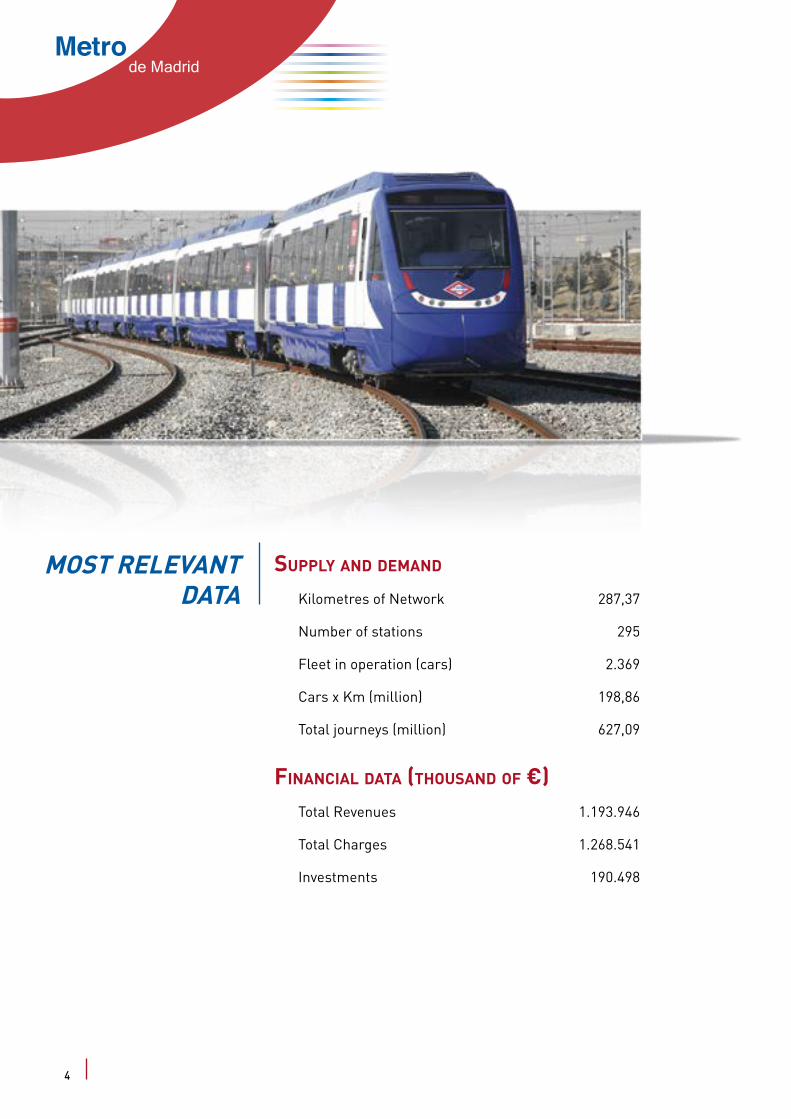
Kilometres of Network 287,37
Number of stations 295
Fleet in operation (cars) 2.369
Cars x Km (million) 198,86
Total journeys (million) 627,09
Financial data (thouSand oF €) Total Revenues 1.193.946
Total Charges 1.268.541
Investments 190.498
4

AnnualReport2010
contentS
PRESENTATION 7
BOARD OF DIRECTORS AND MANAGEMENT BOARD 11
ORGANISATIONAL STRUCTURE 14
MAP OF THE NETWORK OPERATED BY METRO DE MADRID, S.A 16
MANAGEMENT REPORT 19
Introduction 21 Metro de Madrid Strategy.Mission and Values 22 The Metro de Madrid integrated management system 22
Metro de Madrid in 2010 34 Network in Operation 34 Demand 36 Supply 38 The Charges Framework 41 Rolling Stock 44 Installations 47 Research, Development and Innovation 48
2009 financial Year Investments 52 Main Actions 55
Human Resources 65
Payroll 65 Labour Relations 66 Health and Safety at Work 66 Training 68 Internal Communication 69
Other Significant Variables 72 Service Quality 72 Safety 78 Rail Traffic Safety 79 Properties 80 IT Projects 80 Projects Overseas 83
External Relations 86 Media Awards and Profile 86 National and International Associations 87 Corporate Social Responsibility Associations 88 Institutional Campaigns 90
Management Data 91 Results 91 Metro de Madrid Evolution Ratios 93
ANNUAL ACCOUNTS 95
BALANCE SHEET 96PROFIT AND LOSS ACCOUNT 98STATEMENT OF CHANGES IN NET WORTH 99CASHFLOW STATEMENT 102ANNUAL REPORT 104AUDIT REPORT 177
5

de Madrid
Presentation

Metro de Madrid
Presentation
Metrode Madrid
8
AnnualReport2010
PRESENTATIONFor a further year, the economic crisis has defined Metro de Madrid’s activity, generating a loss of resources which has frequently demanded an additional effort on the company’s part to guarantee that service quality is maintained.
The major falloff throughout 2010 in demand, which was hardly more than 627 million passengers, caused a substantial loss of income, to which was added the decision of the governing administrations to hold spending in their fields with the application of austerity criteria which also affected the company via the funds it receives from the Regional Transport Consortium. Metro de Madrid was able, despite having to manage an increasingly extended network, to adjust to the new circumstances, guaranteeing the quality of a flagship public service, based fundamentally on the effort of each employee and their commitment to the job well done.
Thus it was possible for the Company to continue with most of the action planned in order to maintain the necessary level of improvement, ensuring the quality of the service committed to with clients, who continue to value that at historic highs, and with Madrid society which has yet again increased its assessment of the Company’s reputation.
Metro de Madrid also has a new station this year as a result of the extension of Line 11 to La Fortuna in Leganés, part of the 2007-2011 Enlargement Plan, work on which continues on Lines 2 and 9, making it possible to bring this form of transport, profoundly respectful of the environment, ever closer to the public.
The Company’s necessary application of the legal measures related to the reduction in the wages of all public employees had significant effect on labour relations, generating a conflict which went beyond the internal realm. The experience of the last days of June 2010, and the ultimate capacity to reach an agreement, must serve us in the future to remind those of us who share the pride of forming part of a company which has succeeded in becoming an international reference, that we must not forget that its rationale is to be at all times at the service of citizens.
Today more than ever, we must continue to work to ensure that Metro de Madrid remains in the position it has earned with more than 90 years of history, with a network whose sustainability must never be irreversibly impaired, and providing the best possible service, in line with its resources which are not just financial but above all human. This vision must always be compatible with the provision of all the mechanisms which make it possible to confront a scenario not very far off in time in which mobility will increase and, therefore, the demand for public transport, so that we will have to continue to work on measures not just at the technological but also at the operational and management levels.
I am absolutely certain that, notwithstanding the difficult situation we are at present going through, the effort and involvement of the entire organisation in these challenges will ensure corporate sustainability and enhance the value which Metro de Madrid represents for all the Region’s citizens.
Juan Bravo RiveraChairman
9
Metro de Madrid
Board of Directors and Management Board

Metrode Madrid
BOARD OF DIRECTORS
OF METRO DE MADRID, S. A.On 31 december 2010
CHAIRMAN
D. Juan BRAVO RIVERA
CEO
D. Ignacio GONZÁLEZ VELAYOS
MEMBERS
D. Luis ARMADA MARTÍNEZ-CAMPOS
D. José Manuel PRADILLO POMBO
D. Jesús Miguel TRABADA GUIJARRO
D. Jaime HADDAD SÁNCHEZ DE CUETO
Dª. Elena COLLADO MARTINEZ
D. Pedro Luis CALVO POCH
Dª. Mireya CORREDOR LANAS
D. Fernando AUTRÁN PÉREZ
D. Pedro Antonio AYUSO RUÍZ
Dª. Agustina LAGUNA TRUJILLO
D. Miguel Ángel RODRÍGUEZ RODRÍGUEZ
D. Ignacio ARRIBAS GARCÍA
D. Teodoro PIÑUELA PÉREZ
SECRETARY (NON-DIRECTOR)
Dª. Milagros AYUSO FERRERAS
12
AnnualReport2010
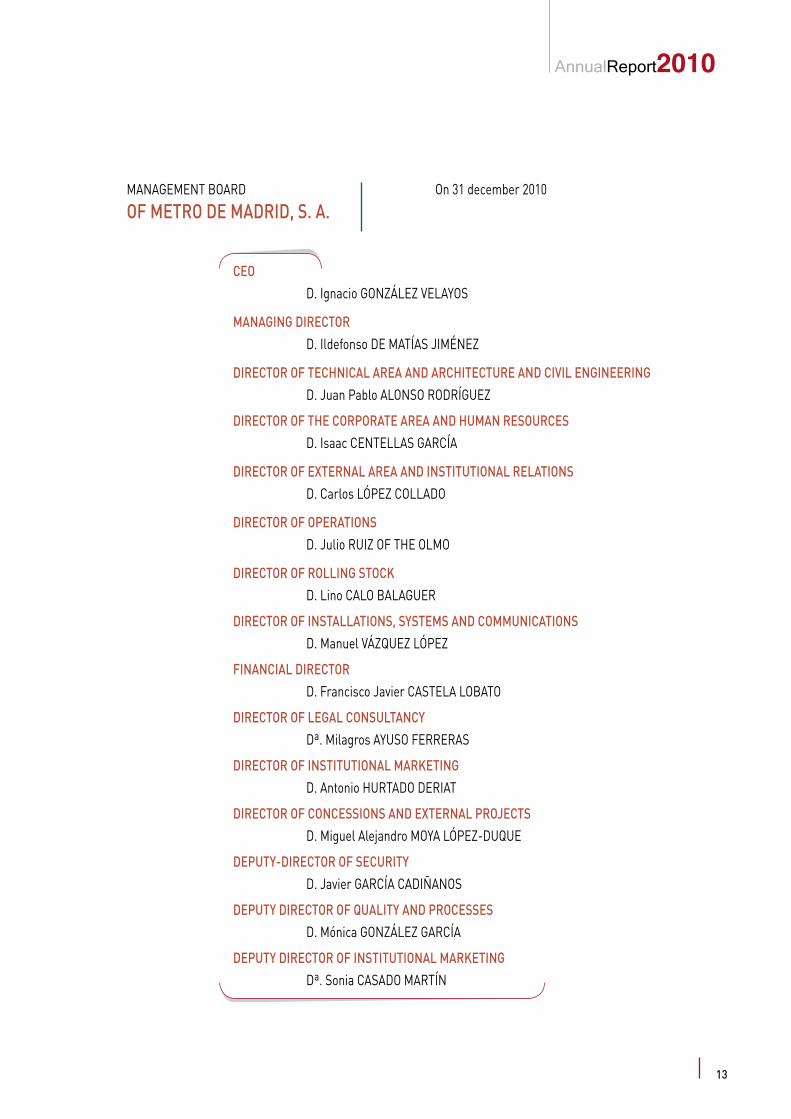
MANAGEMENT BOARD
OF METRO DE MADRID, S. A.On 31 december 2010
CEO
D. Ignacio GONZÁLEZ VELAYOS
MANAGING DIRECTOR
D. Ildefonso DE MATÍAS JIMÉNEZ
DIRECTOR OF TECHNICAL AREA AND ARCHITECTURE AND CIVIL ENGINEERING
D. Juan Pablo ALONSO RODRÍGUEZ
DIRECTOR OF THE CORPORATE AREA AND HUMAN RESOURCES
D. Isaac CENTELLAS GARCÍA
DIRECTOR OF EXTERNAL AREA AND INSTITUTIONAL RELATIONS
D. Carlos LÓPEZ COLLADO
DIRECTOR OF OPERATIONS
D. Julio RUIZ OF THE OLMO
DIRECTOR OF ROLLING STOCK
D. Lino CALO BALAGUER
DIRECTOR OF INSTALLATIONS, SYSTEMS AND COMMUNICATIONS
D. Manuel VÁZQUEZ LÓPEZ
FINANCIAL DIRECTOR
D. Francisco Javier CASTELA LOBATO
DIRECTOR OF LEGAL CONSULTANCY
Dª. Milagros AYUSO FERRERAS
DIRECTOR OF INSTITUTIONAL MARKETING
D. Antonio HURTADO DERIAT
DIRECTOR OF CONCESSIONS AND EXTERNAL PROJECTS
D. Miguel Alejandro MOYA LÓPEZ-DUQUE
DEPUTY-DIRECTOR OF SECURITY
D. Javier GARCÍA CADIÑANOS
DEPUTY DIRECTOR OF QUALITY AND PROCESSES
D. Mónica GONZÁLEZ GARCÍA
DEPUTY DIRECTOR OF INSTITUTIONAL MARKETING
Dª. Sonia CASADO MARTÍN
BOARD OF DIRECTORS On 31 december 2010
OF METRO DE MADRID, S. A.
CHAIRMAN
D. Juan BRAVO RIVERA
CEO
D. Ignacio GONZÁLEZ VELAYOS
MEMBERS
D. Luis ARMADA MARTÍNEZ-CAMPOS
D. José Manuel PRADILLO POMBO
D. Jesús Miguel TRABADA GUIJARRO
D. Jaime HADDAD SÁNCHEZ DE CUETO
Dª. Elena COLLADO MARTINEZ
D. Pedro Luis CALVO POCH
Dª. Mireya CORREDOR LANAS
D. Fernando AUTRÁN PÉREZ
D. Pedro Antonio AYUSO RUÍZ
Dª. Agustina LAGUNA TRUJILLO
D. Miguel Ángel RODRÍGUEZ RODRÍGUEZ
D. Ignacio ARRIBAS GARCÍA
D. Teodoro PIÑUELA PÉREZ
SECRETARY (NON-DIRECTOR)
Dª. Milagros AYUSO FERRERAS
13
Metrode Madrid
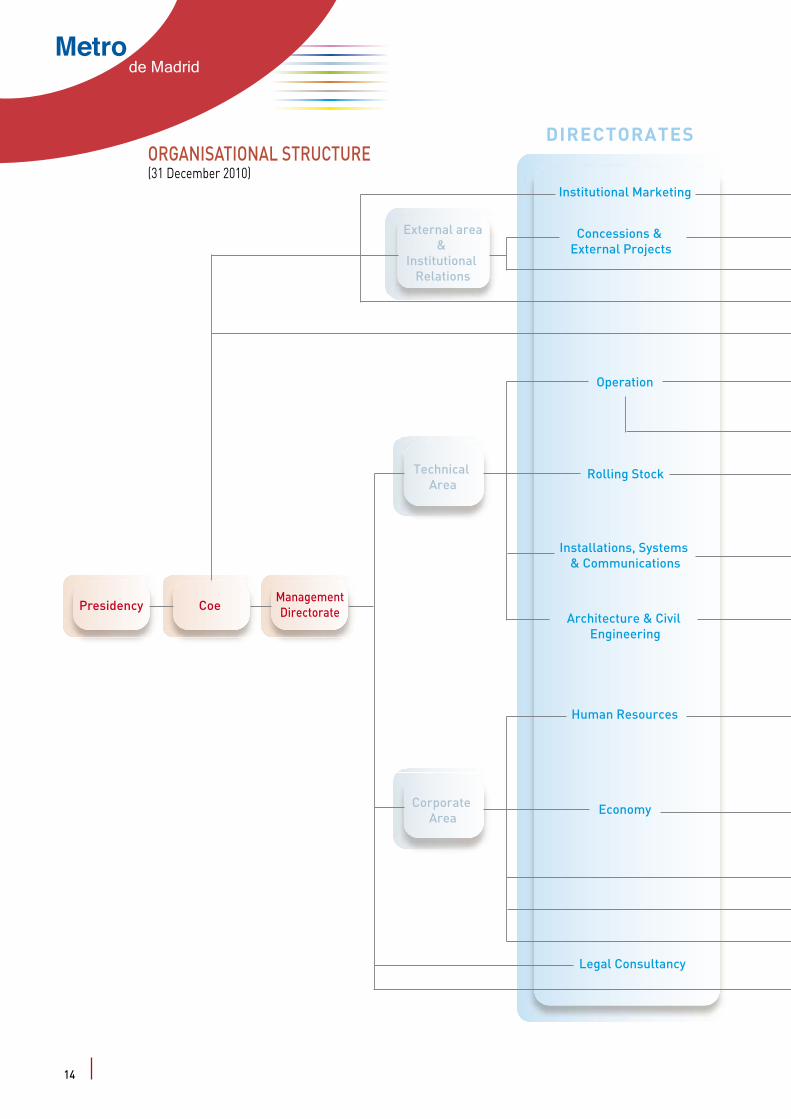
Concessions & External Projects
Patrimonial Management
Internal Audit
Budget Control
Operations
Central Post & Technical Development
Project Engineering Rolling Stock
Rolling Stock Maintenance
Engineering Project Installations
Maintenance of Installations
It Systems
Civil Engineering
Management of Human Resources & Labour Relations
Organization & Development Human Resources
Prevention & Health at Work
Economy & Management Control
Logistics
Contracting
Rail Traffic Safety
Customer Relations
External area&
Institutional Relations
Relations With the Sector
Presidency CoeManagementDirectorate
Technical Area
Corporate Area
Security
Quality & Processes
Institutional Marketing Institutional Marketing
Concessions & External Projects
Operation
Rolling Stock
Installations, Systems & Communications
Architecture & Civil Engineering
Human Resources
Economy
SUBDIRECTORATES
Legal Consultancy
DIRECTORATES UNITSORGANISATIONAL STRUCTURE (31 December 2010)
14

AnnualReport2010
Concessions & External Projects
Patrimonial Management
Internal Audit
Budget Control
Operations
Central Post & Technical Development
Project Engineering Rolling Stock
Rolling Stock Maintenance
Engineering Project Installations
Maintenance of Installations
It Systems
Civil Engineering
Management of Human Resources & Labour Relations
Organization & Development Human Resources
Prevention & Health at Work
Economy & Management Control
Logistics
Contracting
Rail Traffic Safety
Customer Relations
External area&
Institutional Relations
Relations With the Sector
Presidency CoeManagementDirectorate
Technical Area
Corporate Area
Security
Quality & Processes
Institutional Marketing Institutional Marketing
Concessions & External Projects
Operation
Rolling Stock
Installations, Systems & Communications
Architecture & Civil Engineering
Human Resources
Economy
SUBDIRECTORATES
Legal Consultancy
DIRECTORATES UNITS
15
Metrode Madrid
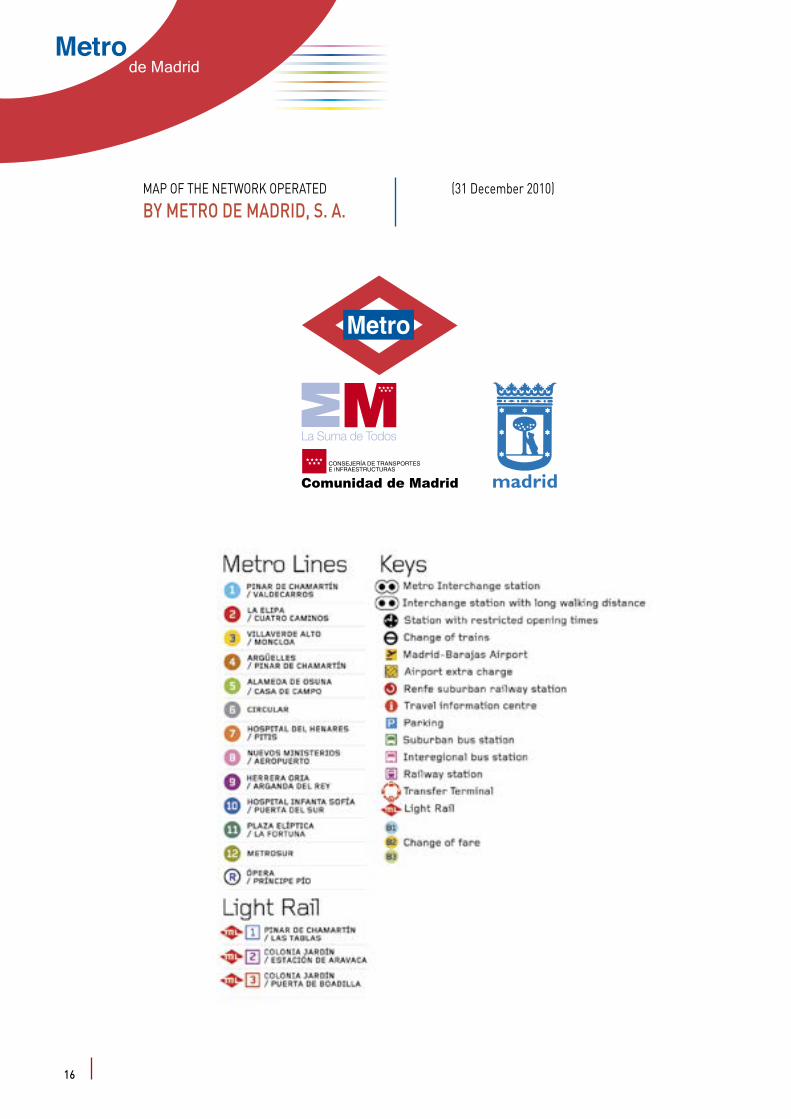
MAP OF THE NETWORK OPERATED
BY METRO DE MADRID, S. A.(31 December 2010)
16

AnnualReport2010
17

de Madrid
Management Report
Metro de Madrid
Management Report
Metrode Madrid
20

AnnualReport2010
INTRODUCTIONMetro de Madrid operates a network of 287.3 kilometres and 295 stations. Its trains were used for 627,000,000 trips in 2010 at an average speed of nearly 30 km/h, with a high degree of automation and with modern rail signalling, security and access systems.
Metro de Madrid has continued a major drive to improve in areas like technology, innovation, research, and in the on-going upgrading of the public passenger transport service model, reaffirming its status as a world reference in all aspects of urban rail passenger transport.
This Management Report set out the company’s activity during the 2010 financial year, inevitably influenced by the national economic situation and the financial crisis continuing to affect Spanish society.
Demand was slightly down compared with the previous financial year because of the reduced mobility of sectors of the population affected by the fall-off in business activity, directly related with the working population.
This trend in demand was already apparent in 2008 and 2009, and continued in the same direction in 2010, with greater impact on travel for leisure and commerce (non-obligatory), thus falling off to a greater degree at weekends.
Despite this tendency in demand in recent years, combating air pollution in the large cities, more rational use of private vehicles and the foreseeable recovery of the economic cycle mean that Metro de Madrid must be prepared to meet increased demand in a future which, sooner or later, will become a reality.
21
Metrode Madrid
MISSION ANDVALUES
The sustainability of any enterprise is to a large extent conditioned by its capacity to adapt to changes in the context, and the expectations of its stakeholders. Metro de Madrid incorporate this need into the definition of its Mission:
“To be the most socially profitable mobility option that is closer to customer’s expectations”
This need to remain in and maintain a position of leadership, sustainability in time, has led Metro de Madrid to reinforce its positioning in the direction of a concept of strategy needing a long term vision which defines the general guidelines for the Company to follow. Along these lines, Metro de Madrid began in 2010 to develop a Strategic Plan with a time horizon of 2011-2015 setting out the Company’s vision and long-term strategic lines, lines of action and future positioning, on the basis of the corporate values of Management Excellence, Public Service, Dynamism and Innovation.
Metro de Madrid must also have a flexible short term management (a strategic management system using command teams) enabling it to take the measures necessary to correct deviations, at all times ensuring on-going improvement.
In that context, and pursuing its search for Excellence Business Management, Metro is developing an Integrated Management System (IMS) to guarantee its competitiveness, survival and sustainability.
The Metro de Madrid integrated management system
Metro de Madrid’s activities can be grouped into complete value chains or processes. From this point of view, organisations can be considered to be a system of processes which are interrelated.
The orientation and objectives of these processes must be defined by the Strategic Plan in the medium and long term and by the Strategic Management System to a closer horizon, defining the specific strategic lines and objectives so that those in each process are completely aligned with those defined at the strategic level.
On the other hand, Metro de Madrid must manage the threats and opportunities which may influence it in attaining its objectives, in other words it has to manage its Corporate Risks.
The foregoing suggests that strategic management systems do not on their own ensure that exceptional, sustainable results will be achieved. This makes it necessary to complement the Strategic Management System based on the Balance Score Card (BSC) methodology with a System of Management by Processes and a Risk Management System, which makes up the Integrated Management System (IMS) Metro is developing.
Moreover, both expected results and those actually obtained must be focused and measured from the point of view of the Triple Balance, in other words it is necessary to secure results which are balanced from the economic, social and environmental standpoints, as implied in the definition of the Company’s Mission.
With the management focus provided by the Integrated Management System, movement is entirely consistent along the path of continuous improvement, a process which is fundamental in achieving results which meet the expectations of stakeholders and support the Company’s sustainability.
22

AnnualReport2010
The Strategic Management System
In 2010, Metro de Madrid’s Mission was given form in the development of the company’s strategic lines:
l To reach excellence in transport service
l To improve the customer experience
l To manage the network’s enlargement and transformation
l To be competitive in additional business lines
l To develop internal culture
To manage the strategy short term, use has continued to be made of the Balanced Scorecard (BSC) which, solidly backed by the Strategic Objectives and key business management indicators (KPIs), allows the business to be monitored from various perspectives, thereby improving the efficacy and efficiency of decision-making and fomenting continuing enhancement of all the company’s key processes.
To this end, 18 strategic objectives have been defined, with their related management indicators, as reflected in Metro de Madrid’s Corporate BSC:
23
Metrode Madrid
The tasks in the short-term management of the strategy include permanent monitoring of the alignment of the Company’s objectives with fulfilment of its Mission in the social, political and economic context at any time and at all levels (local, national, etc.). With this in mind, in mid-2010 the objectives were redirected to enhance the positioning of Metro’s strategy in key aspects such as financial and budgetary control.
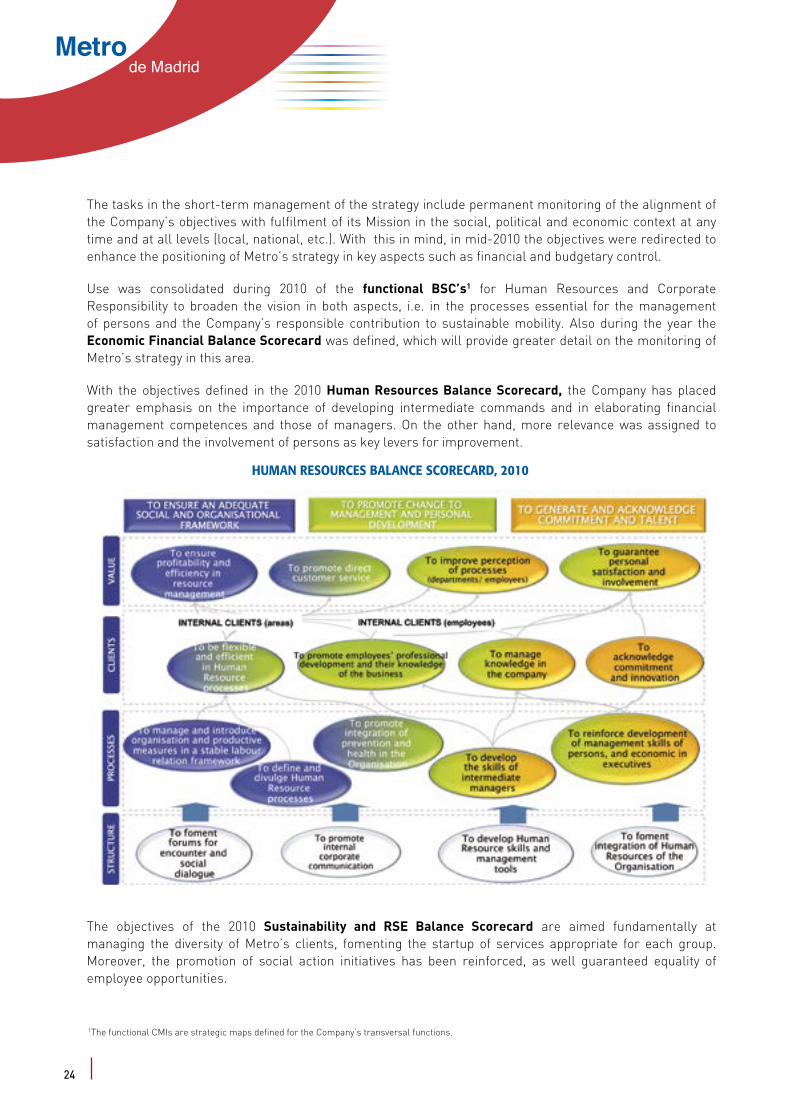
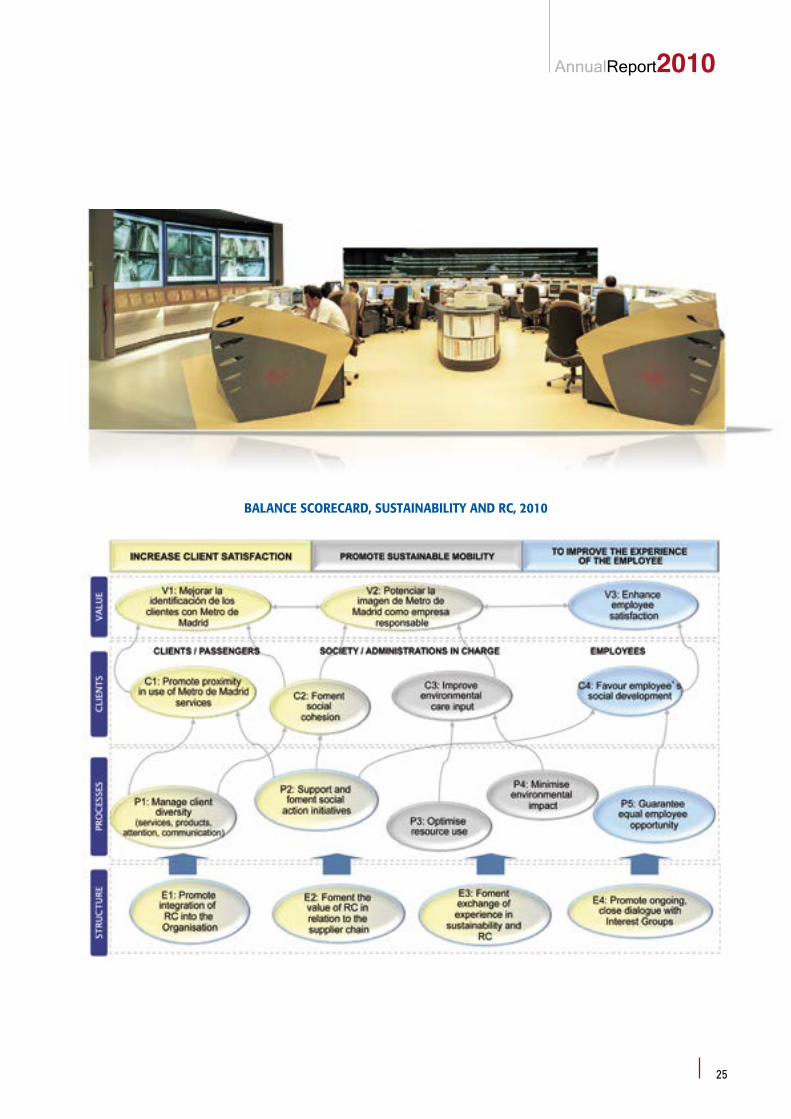
Use was consolidated during 2010 of the functional BSC’s1 for Human Resources and Corporate Responsibility to broaden the vision in both aspects, i.e. in the processes essential for the management of persons and the Company’s responsible contribution to sustainable mobility. Also during the year the Economic Financial Balance Scorecard was defined, which will provide greater detail on the monitoring of Metro’s strategy in this area.
With the objectives defined in the 2010 Human Resources Balance Scorecard, the Company has placed greater emphasis on the importance of developing intermediate commands and in elaborating financial management competences and those of managers. On the other hand, more relevance was assigned to satisfaction and the involvement of persons as key levers for improvement.
HUMAN RESOURCES BALANCE SCORECARD, 2010
The objectives of the 2010 Sustainability and RSE Balance Scorecard are aimed fundamentally at managing the diversity of Metro’s clients, fomenting the startup of services appropriate for each group. Moreover, the promotion of social action initiatives has been reinforced, as well guaranteed equality of employee opportunities.
1The functional CMIs are strategic maps defined for the Company’s transversal functions.
24
AnnualReport2010
BALANCE SCORECARD, SUSTAINABILITY AND RC, 2010
25
Metrode Madrid
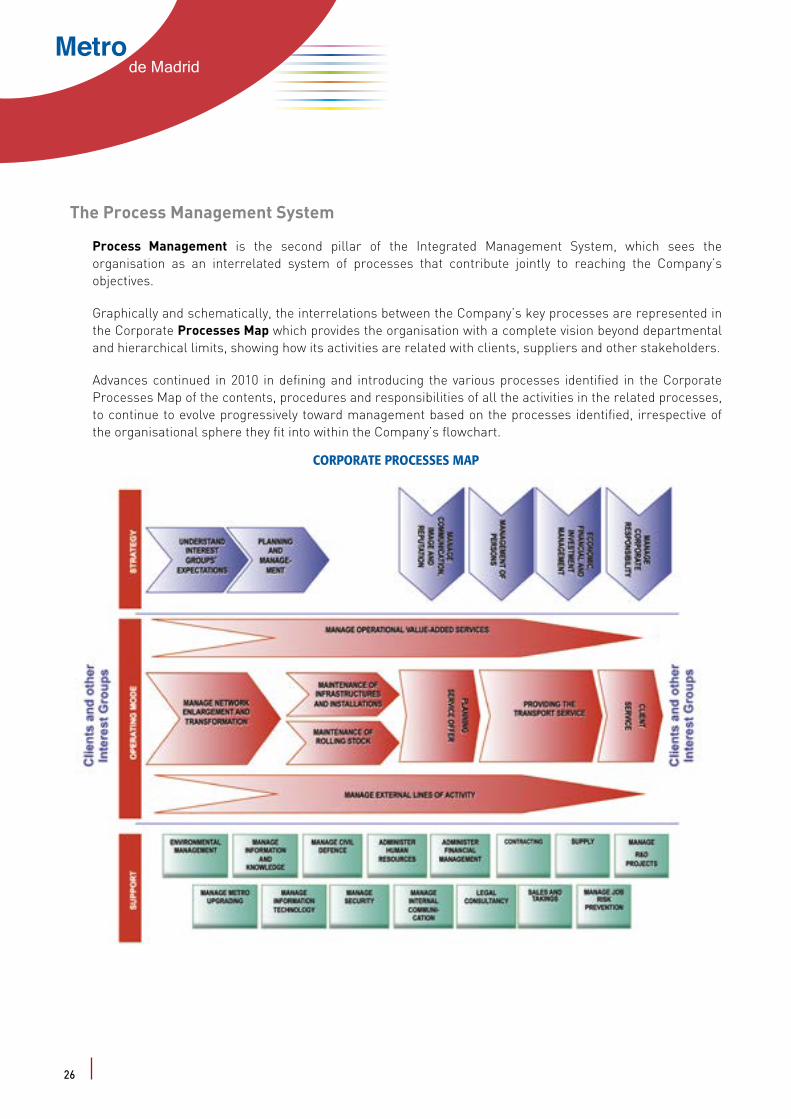
The Process Management System
Process Management is the second pillar of the Integrated Management System, which sees the organisation as an interrelated system of processes that contribute jointly to reaching the Company’s objectives.
Graphically and schematically, the interrelations between the Company’s key processes are represented in the Corporate Processes Map which provides the organisation with a complete vision beyond departmental and hierarchical limits, showing how its activities are related with clients, suppliers and other stakeholders.
Advances continued in 2010 in defining and introducing the various processes identified in the Corporate Processes Map of the contents, procedures and responsibilities of all the activities in the related processes, to continue to evolve progressively toward management based on the processes identified, irrespective of the organisational sphere they fit into within the Company’s flowchart.
CORPORATE PROCESSES MAP
26
AnnualReport2010
Risk Management System
Following definition of the corporate processes and identification of their objectives in line with those established by the Strategic Management System, the risks linked to the activities for reaching these objectives have to be managed.
The Risk Management System (RMS) is designed to help manage those risks both externally and internally with the aim on the one hand of mitigating developments which might negatively affect the attainment of the objectives and, on the other, to identify and evaluate those which may affect them positively.
This system takes on even greater importance in the current, constantly-changing environment which is far more difficult to handle and with new and greater challenges and/or risks for Metro de Madrid.
The Risk Management System will provide a fundamental lever in prioritising strategic objectives, aligning the aims of the various Managements while feeding into Metro de Madrid’s strategy with the expectations of its clients and stakeholders.
The Risk Management System will make it possible to deal effectively with uncertainty and its associated risks and opportunities, so enhancing the capacity to generate value.
Efficient Risk Management will provide better information and controls, and aid in decision-making, enabling the company to obtain relevant competitive advantages. The competitive advantages can be secured in terms of the internal and external benefits provided by the Risk Management System, notably the following:
Internal benefits:
l Greater certainty in attaining the objectives
l Improvement of results and their consistency
l A culture of identification and provision for risk
l Corporate Government
External benefits:
l Company image and reputation
l Compliance with regulations
l Support for the fulfilment of commitments with stakeholders
Advances were made during 2010 in defining and introducing the RMS. A Corporate Risks Map has been identified as a key tool making it possible to present the Company’s risks according to their impact and probability, so providing information for the prioritisation of their management.
To give meaning and coherence to the Integrated Management System, the relations have been established between the risks identified, corporative processes and the objectives set by the IMS.
27

Metrode Madrid
Strategic Projects
As happens every year, attainment of the objectives defined by the company are based on the implementation of the strategic projects, all of them pluriannual and which also enhance transversal work within the Organisation, using multidisciplinary teams.
28
AnnualReport2010
Strategic Projects
As happens every year, attainment of the objectives defined by the company are based on the implementation of the strategic projects, all of them pluriannual and which also enhance transversal work within the Organisation, using multidisciplinary teams.
l The EVOLUCIONA project foments cultural change and people’s development through the implantation of a system of management by jurisdictions. In 2010, the project focused above all on the intermediate levels of the Installation, Operational and Maintenance Units, defining the procedures for promotion, training and development. In addition, a training module was applied to enhance personal development competences targeting the Operative Unit commands.
l The Project to ENHANCE TRANSPORT CAPACITY, focusing on increasing passenger capacity in anticipation of a possible increase in demand, has been centred this year in consolidating and improving travel times and the introduction of technical measures for automatic return at the end of run. This strategic project is being implemented simultaneously with projects for the introduction of the CBTC rail signalling system on line 1, on line 6 with the startup of the new trains, and on line 7b with the reception of trains and startup of that CBTC system.
l The project to IMPROVE SALE AND TOLL SYSTEMS provides the context to complete the introduction of the commercial supervisor on lines 1 and 6. By offering improvements and facilities for Clients, this project guarantees better customer service in all aspects of ticket purchase for access to the service. It also provides homogeneity and aligns the technological projects necessary for the integrated implantation of contact-free cards as a toll procedure.
l The ACTIVA project, intended to reinforce customer service, pursued five lines of work during 2010: “Management of the Metro space” to organise and coordinate all action on Metro premises; “Attraction and loyalty” with activities to attract new client segments; “Branding and positioning” to identify the key brand attributes Metro wishes to transmit; “Commercial Agencies” to implant a new concept of information and sale centres to be introduced in the Metro Network; and “Customer Orientation” for action to reinforce this competence in employees with most direct contact with clients, to guide them in it.
l In relation to management systems and on-going improvement of the business processes, there has been further development of the VIA EXCELENCIA project, focused this year on the redesign and development of the processes for the Company’s existing Management System Certificates (9 in all) while running a single certification audit which led to considerable financial saving and a more efficient distribution of the efforts of the Company’s employees in these tasks. With the completion of the Process Maps for the various Certified Management Systems, the introduction of their processes has begun, while a start has been made on defining others, such as that for Financial Management and for Personal Management, directly aligned with the Company’s strategy following the guidelines defined in the Business Excellence Model (EFQM).
l INTEGRA is another key aspect in improving management and which focused in 2010 on the process for Management of the Operating Budget using the methodology proposed for the elaboration of the budget through activities. At the same time, the Economic Financial Balance Scorecard was defined and the design begun of training modules on economic concepts, processes and systems for executives.
l In the area of maintenance of the installations, development continues with the MI2 project (Integrated Improvement to Maintenance of Installations) with the challenge of on-going improvement to the efficient management of the large volume of installations for the network’s operation, encouraged with the application of new technologies. The work in 2010 has been directed fundamentally to cutting maintenance costs while enhancing the client’s perception of the quality of the service.
l The ENERGY EFFICIENCY project constitutes an advance in the Company’s commitment to its stakeholders from the broadest standpoint of Sustainability which positions Metro de Madrid as a
29

Metrode Madrid
company of reference in the field of energy efficiency, continuing to consolidate one of its main objectives: to create value for the Company at an efficient cost and minimum consumption of resources, especially water and energy.
This project began with the completion in February 2010 of an Energy Efficiency Master Plan whose overall objective is to make the Company a “reference in sustainable mobility by efficient consumption of energy resources and profitability in the triple Balance”. This objective breaks down into a further five partial objectives addressing more specific fields such as optimisation of Financial Charges, contribution to Climate Change and the Environment, improvement to the Corporate Image, Technical and Management
Innovation and the Awareness of all those making up Metro de Madrid. As part of this project, the standards applicable to Metro in the field of Energy Efficiency have been identified and a model has been designed and introduced to prioritise measures based on the triple Balance. There has also been an analysis in real tests in the network which will lead to significant cuts in costs and emissions in the coming months.
Corporate Social Responsibility
The Corporate Responsibility strategy has been configured as one of the basic pillars for the pursuit of Metro de Madrid’s Mission. 2010 was the year for the consolidation of this strategy and,
after comparison with the 2009 stakeholders, a start was made on defining the indicators corresponding to the objectives stated in the Corporate Responsibility BSC.
In its firm commitment to stakeholders, Metro de Madrid has advanced in the formulation of new models for relations with them, moving toward the so-called Advanced Models for Relations with clients, employees and suppliers.
The Company has continued to strengthen communication with its employees through the Internal Communication Management which handles the communication channels and coordinate the initiatives fomented by the Internal Communication Committee created as a consultative body and including representative members from all areas of the company and which was involved in 2010 in the design of the Communication Plan, the survey of the job environment and various awareness campaigns.
On the other hand, development has been furthered of the Involvement and Motivation Plan aimed at employees, the framework in which the Equality Plan, approved by the parity commission in December 2009, has been developed. The protocol has also been disclosed for action against sexual harassment, and the Model for Unremunerated Recognition, part of the Plan of the same name, was defined. In this sphere, a Designations Committee was set up to approve and frame proposals for recognition received from anywhere in the Company based on the values adopted.
30
AnnualReport2010
In connection with clients, the various segments were further classified by compiling information in the data base created in 2008, gathering travel habits and motives. As an innovation, information has been included in this data base on the segment of persons with a variety of capacities, including questions of accessibility in the questionnaires. The purpose of this knowledge and the design of profiles by segments is to indentify clients’ expectations more precisely; learning of them with exactitude is essential if the Mission is to be fulfilled.
For suppliers, and as part of the new model for the relation with them, there were a number of communication activities, with the identification of the groups key to the Company because of their impact on the image or in reaching Metro de Madrid’s objectives. There were also in-house workshops on the process of procurement which made it possible to open a process of reflection on potential areas of improvement in the relation with this important stakeholder.
It is also relevant to point to the Company’s clear commitment to the Environment and surroundings. The existence of a certified Environmental Management System covering all Metro de Madrid’s activity in accordance with international standard UNE-EN-ISO 14.001 since 2005 itself points to the commitment the Company has acquired on sustainable development.
The Environmental Management System was audited along with the remaining certified systems in November 2010 with satisfactory results, revealing a highly positive tendency in the culture of respect for the environment incorporated into all the Company’s activities. The Audit Report referred to the following strong points of the System:
l The good disposition of those involved in the audit process, with the Organisation pointing to a high degree of interest in the activities audited, and in the management systems.
l The participation in sector forums, including international forums of acknowledged standing, leading some of the working groups. Emphasis was placed specifically on the activities of the International Association of Public Transport and in the Latin American Metro and Underground Association (ALAMYS) which is engaged in the definition of common indicators for the sector.
31
Metrode Madrid
The following activities may be highlighted in the field of environmental management:
l As an upshot of the remodelling of the company’s structure in 2009, the composition was modified of the Environment Committee which collaborates very actively in the pursuit of objectives set as commitments in this area, in this way contributing definitively to the corporate BSC’s strategic objective to “foment and integrate into the Organisation for the Care of the Environment”.
l 2010 saw the initiation of the 2010-2013 Sustainable Water Management Plan whose main aim is to analyse water management and consumption, to draw up an associated improvement plan and to start up appropriate measures in Metro de Madrid’s facilities, promoting a culture of efficient and responsible use of resources.
32
AnnualReport2010
l Employee awareness has moved forward in the field of waste separation, with the installation in 2010 of containers in all areas allowing packaging to be sorted.
l To extend the commitment to sustainable development to clients and to society in general, the pilot programme for the selective recycling of waste in the network, implemented in 2009, has been redirected with the installation of container sets in the new station of La Fortuna, making separation simple depending on the type of waste.
Similarly, in line with the commitment to society, in 2010 Metro de Madrid endorsed its adhesion to the United Nations Global Compact designed to obtain a voluntary commitment from companies with the development of ten principles related to respect for human, labour and environmental rights, and combating corruption.
Through the initiative developed by the Foro de Reputación Corporativa “A better world for Joana2”, the Company’s activities have been described for reaching the Millennium Development Goals, made specific in 8 points.
l To eradicate extreme poverty and hunger.
l To achieve universal primary education.
l To promote gender equality and the autonomy of women.
l To reduce the mortality of children under 5.
l To improve maternal healthcare.
l To combat HIV/AIDS, malaria and other diseases.
l To guarantee environmental sustainability.
l To foment a world alliance for development.
Finally, Metro de Madrid has continued collaborating in the framework of the International Association of Public Transport (UITP) and as a member of the Sustainable Development Commission in activities for the design and development of indicators making it possible to measure the transport sector’s contribution to sustainability.
2http://www.2015unmundomejorparajoana.com
33
Metrode Madrid
METRO DE MADRIDIN 2010
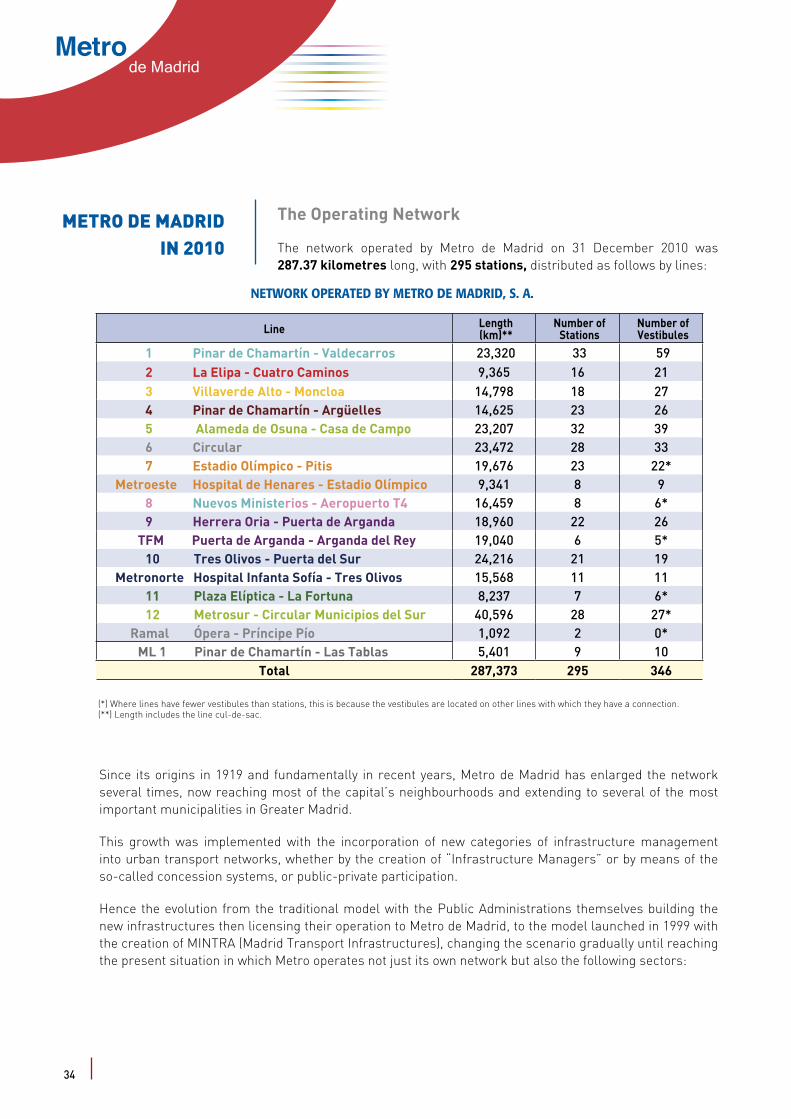
The Operating Network
The network operated by Metro de Madrid on 31 December 2010 was 287.37 kilometres long, with 295 stations, distributed as follows by lines:
NETWORK OPERATED BY METRO DE MADRID, S. A.
Line Length(km)**
Number ofStations
Number ofVestibules
1 Pinar de Chamartín - Valdecarros 23,320 33 592 La Elipa - Cuatro Caminos 9,365 16 213 Villaverde Alto - Moncloa 14,798 18 274 Pinar de Chamartín - Argüelles 14,625 23 265 Alameda de Osuna - Casa de Campo 23,207 32 396 Circular 23,472 28 337 Estadio Olímpico - Pitis 19,676 23 22*
Metroeste Hospital de Henares - Estadio Olímpico 9,341 8 98 Nuevos Ministerios - Aeropuerto T4 16,459 8 6*9 Herrera Oria - Puerta de Arganda 18,960 22 26
TFM Puerta de Arganda - Arganda del Rey 19,040 6 5*10 Tres Olivos - Puerta del Sur 24,216 21 19
Metronorte Hospital Infanta Sofía - Tres Olivos 15,568 11 1111 Plaza Elíptica - La Fortuna 8,237 7 6*12 Metrosur - Circular Municipios del Sur 40,596 28 27*
Ramal Ópera - Príncipe Pío 1,092 2 0*ML 1 Pinar de Chamartín - Las Tablas 5,401 9 10
Total 287,373 295 346
(*) Where lines have fewer vestibules than stations, this is because the vestibules are located on other lines with which they have a connection. (**) Length includes the line cul-de-sac.
34
Since its origins in 1919 and fundamentally in recent years, Metro de Madrid has enlarged the network several times, now reaching most of the capital’s neighbourhoods and extending to several of the most important municipalities in Greater Madrid.
This growth was implemented with the incorporation of new categories of infrastructure management into urban transport networks, whether by the creation of “Infrastructure Managers” or by means of the so-called concession systems, or public-private participation.
Hence the evolution from the traditional model with the Public Administrations themselves building the new infrastructures then licensing their operation to Metro de Madrid, to the model launched in 1999 with the creation of MINTRA (Madrid Transport Infrastructures), changing the scenario gradually until reaching the present situation in which Metro operates not just its own network but also the following sectors:
AnnualReport2010
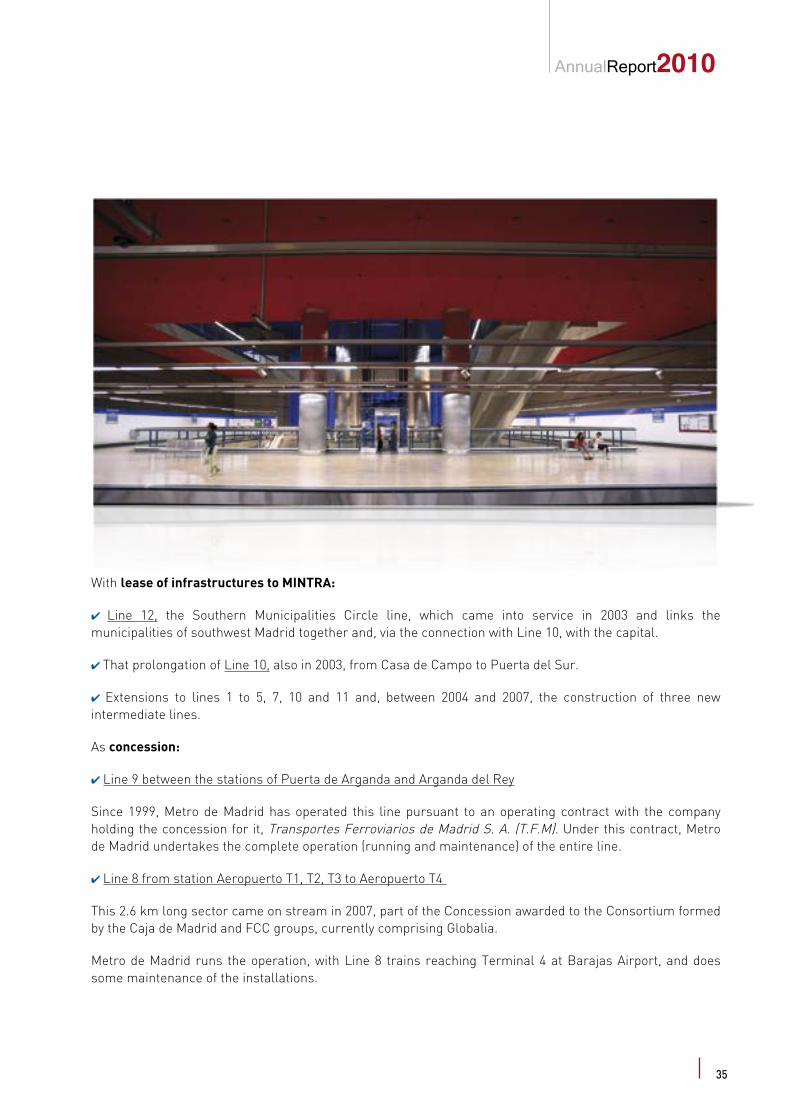
With lease of infrastructures to MINTRA:
4 Line 12, the Southern Municipalities Circle line, which came into service in 2003 and links the municipalities of southwest Madrid together and, via the connection with Line 10, with the capital.
4 That prolongation of Line 10, also in 2003, from Casa de Campo to Puerta del Sur.
4 Extensions to lines 1 to 5, 7, 10 and 11 and, between 2004 and 2007, the construction of three new intermediate lines.
As concession:
4 Line 9 between the stations of Puerta de Arganda and Arganda del Rey
Since 1999, Metro de Madrid has operated this line pursuant to an operating contract with the company holding the concession for it, Transportes Ferroviarios de Madrid S. A. (T.F.M). Under this contract, Metro de Madrid undertakes the complete operation (running and maintenance) of the entire line.
4 Line 8 from station Aeropuerto T1, T2, T3 to Aeropuerto T4
This 2.6 km long sector came on stream in 2007, part of the Concession awarded to the Consortium formed by the Caja de Madrid and FCC groups, currently comprising Globalia.
Metro de Madrid runs the operation, with Line 8 trains reaching Terminal 4 at Barajas Airport, and does some maintenance of the installations.
35

Metrode Madrid
4 Light Metro Line 1 of the Sanchinarro and Las Tablas Urban Action Plans.
2007 saw the startup of the Light Metro line in the new urban developments of Sanchinarro and Las Tablas in northern Madrid, 5.4 km long and with 9 stations. Metro de Madrid runs the whole line (operation and maintenance).
Demand
Metro de Madrid passenger demand in 2010 was 627.09 million trips, 3.5% down on the figure for 2009. The following graph shows its evolution over recent years:
EVOLUTION OF DEMAND 1999 - 2010
400,00
500,00
600,00
700,00
800,00
1999 2000 2001 2002 2003 2004 2005 2006 2007 2008 2009 2010
Mill
ions
of T
rips
36

AnnualReport2010
The following is a comparison by lines of the last two years:
DISTRIBUTION OF TRIPS BY LINE
1
101.
305
97.3
44
32.9
4130
.914
62.0
4961
.259
44.1
87
41.9
64
75.5
37
71.3
72
106.
740
103.
178
47.1
4646
.099
20.2
3020
.293
43.8
53
41.9
55
69.6
9367
.924
4.01
84.
172
38.5
6637
.419
3.71
23.
206
2 43 5 6 7 8 9 10 11 12 Ramal
150.000
120.000
90.000
60.000
30.000
0
Thou
sand
s of
ann
ual t
rips
Year 2009 Year 2010
Lines
Year 2009: 649.977.853 Year 2010: 627.099.957
There were 923 million stages in 2010. On the other hand, average monthly demand stood at 52.3 million trips, March and May standing out as the months of greatest demand and August with least demand:
MONTHLY TRENDS, PASSENGER NUMBERS
54,955,856,0
50,3
33,3
45,4
49,7
58,855,7
58,454,654,2
80,0
60,0
40,0
20,0Jan. Feb. Mar. Apr. May. June July Aug. Sept. Oct. Nov. Dec.
Mill
ions
of P
asse
nger
s
37
Metrode Madrid
December 17 was the day of maximum demand with a total of 2,428,045 passengers, and 25 December that with least demand, totalling 581,175.
Sol continues to be the station with most travellers, being the city’s nerve centre and the confluence of three metro lines and, since 28 June 2009, with a connection with RENFE rail with two Commuter lines. The following table shows entries and use (total entries, exits and transfer between lines) at the 15 most-used stations in the Network:
Name Entries Users
Sol 21.372.907 60.210.853
Avenida de América 12.848.211 54.941.765
Nuevos Ministerios 15.860.332 47.385.919
Moncloa 17.707.353 39.194.630
Príncipe Pío 14.689.475 36.744.138
Plaza de Castilla 11.760.658 35.074.764
Alonso Martínez 5.503.327 28.015.201
Cuatro Caminos 6.479.142 24.767.257
Gregorio Marañon 4.655.930 23.600.243
Legazpi 6.115.173 22.621.460
Diego de León 6.158.167 22.099.099
Plaza de España 7.843.280 21.743.455
Pacífico 4.327.283 21.424.271
Argüelles 8.271.793 21.407.883
Gran Vía 6.177.332 21.032.947
Comparing these fifteen stations with those of greatest demand in 2009, the most notable factor is the removal from the list of the Atocha-Renfe station where demand has dropped since the commuter station was opened in Sol and travellers shifted to it, also explaining the rise in the number of entries and the fewer numbers of transfers at Sol.
With the departure of Atocha-Renfe from the list, Plaza de España appears, with demand slightly up on 2009. Significant falls are also see at Argüelles and Príncipe Pío, influenced by closures for work on Line 4 and Ramal.
Supply
The year continued to fulfil the programming proposed by the Madrid Regional Transport Consortium in relation to supply, composition, frequency and service quality of the trains on each line and for the various seasons.
38

InformeAnual2010
Service supply was down a little, 1.03% on the previous year, with a total of 198.86 million cars x kilometre, with the detail by line shown in the following graph:
PRODUCTION BY LINE
24,0
522
,41
5,83
5,51
15,5
614
,86
10,4
49,
96
22,3
821
,76
20,6
0 22,0
2
17,5
417
,37
15,2
7 17,0
4
24,2
923
,89
6,43
6,42
2,33
2,39
0,61
0,43
2,72
2,70
14,2
714
,30
3,60
3,51 5,
014,
62
9,99
9,66
0,00
5,00
10,00
15,00
Mill
ions
of c
ar x
Km
Lines
Year 2009 Year 2010
Year 2010: 198.856.823 car x KmYear 2009: 200,920,620 car x Km
20,00
25,00
21 43 5 6 7A 7B 8 9 10 10BTFM 11 12 Ramal ML1
Average commercial speed was 29.91 Km/h on all the Network’s lines, higher than the previous year’s figure of 28.5 Km/h.
Line analysis shows that the highest speed was once more on Line 9 between Puerta de Arganda and Arganda del Rey (TFM sector), where the operating speed was 54.18 Km/h. at working day peak time.
39
Metrode Madrid
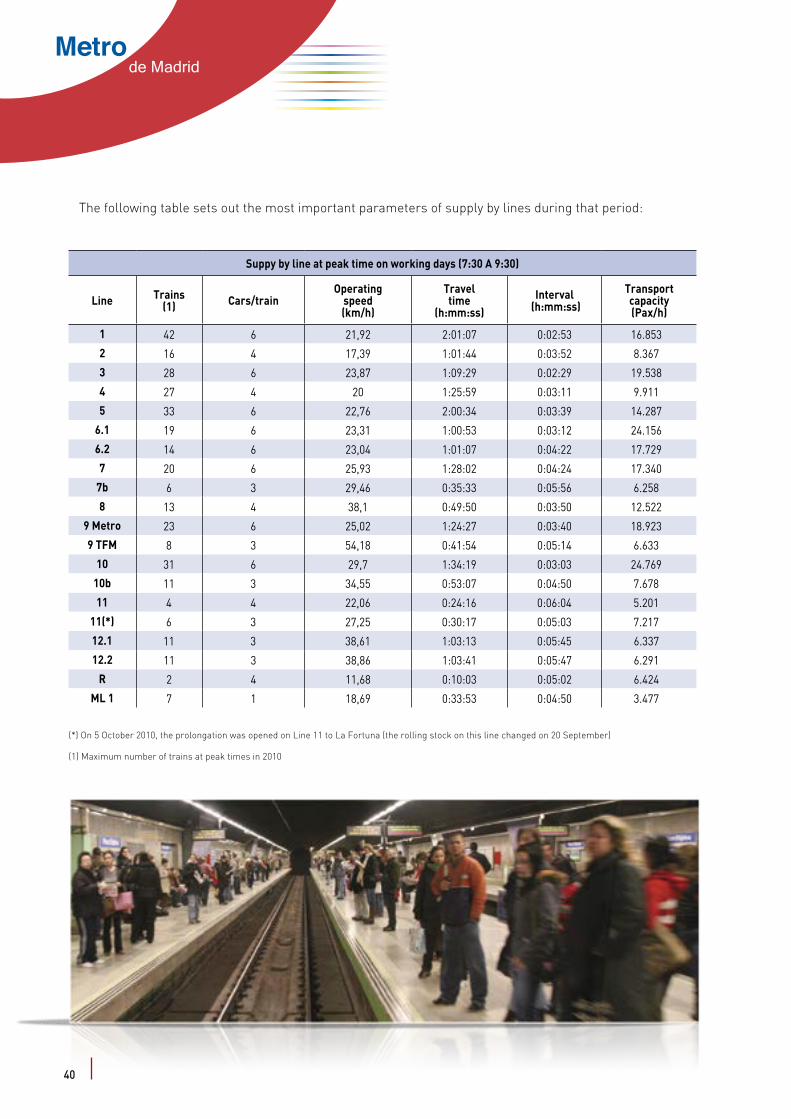
The following table sets out the most important parameters of supply by lines during that period:
Suppy by line at peak time on working days (7:30 A 9:30)
Line Trains(1) Cars/train
Operatingspeed(km/h)
Traveltime
(h:mm:ss)Interval
(h:mm:ss)Transportcapacity(Pax/h)
1 42 6 21,92 2:01:07 0:02:53 16.853
2 16 4 17,39 1:01:44 0:03:52 8.367
3 28 6 23,87 1:09:29 0:02:29 19.538
4 27 4 20 1:25:59 0:03:11 9.911
5 33 6 22,76 2:00:34 0:03:39 14.287
6.1 19 6 23,31 1:00:53 0:03:12 24.156
6.2 14 6 23,04 1:01:07 0:04:22 17.729
7 20 6 25,93 1:28:02 0:04:24 17.340
7b 6 3 29,46 0:35:33 0:05:56 6.258
8 13 4 38,1 0:49:50 0:03:50 12.522
9 Metro 23 6 25,02 1:24:27 0:03:40 18.923
9 TFM 8 3 54,18 0:41:54 0:05:14 6.633
10 31 6 29,7 1:34:19 0:03:03 24.769
10b 11 3 34,55 0:53:07 0:04:50 7.678
11 4 4 22,06 0:24:16 0:06:04 5.201
11(*) 6 3 27,25 0:30:17 0:05:03 7.217
12.1 11 3 38,61 1:03:13 0:05:45 6.337
12.2 11 3 38,86 1:03:41 0:05:47 6.291
R 2 4 11,68 0:10:03 0:05:02 6.424
ML 1 7 1 18,69 0:33:53 0:04:50 3.477
(*) On 5 October 2010, the prolongation was opened on Line 11 to La Fortuna (the rolling stock on this line changed on 20 September)
(1) Maximum number of trains at peak times in 2010
40
AnnualReport2010
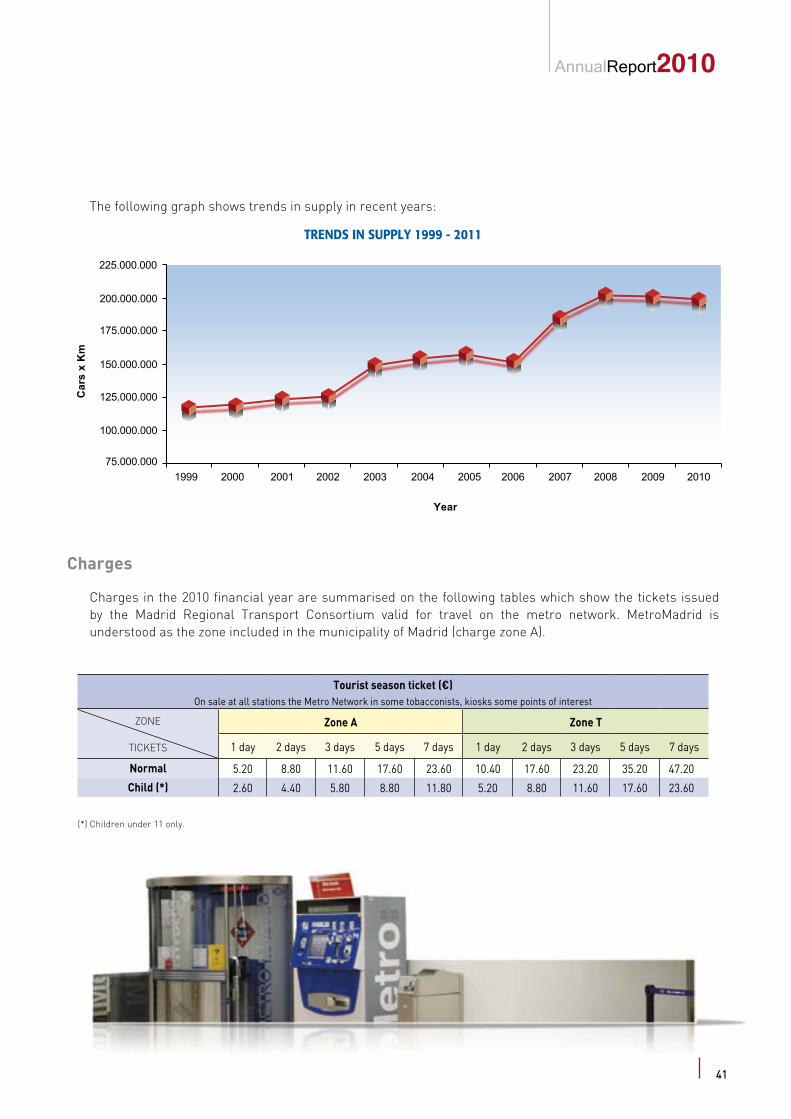
The following graph shows trends in supply in recent years:
TRENDS IN SUPPLY 1999 - 2011
200.000.000
175.000.000
150.000.000
125.000.000
100.000.000
75.000.000
225.000.000
1999 2000 2001 2002 2003 2004 2005 2006 2007 2008 2009 2010
Car
s x
Km
Year
Charges
Charges in the 2010 financial year are summarised on the following tables which show the tickets issued by the Madrid Regional Transport Consortium valid for travel on the metro network. MetroMadrid is understood as the zone included in the municipality of Madrid (charge zone A).
Tourist season ticket (€)On sale at all stations the Metro Network in some tobacconists, kiosks some points of interest
ZONE
TICKETS
Zone A Zone T
1 day 2 days 3 days 5 days 7 days 1 day 2 days 3 days 5 days 7 days
Normal 5.20 8.80 11.60 17.60 23.60 10.40 17.60 23.20 35.20 47.20
Child (*) 2.60 4.40 5.80 8.80 11.80 5.20 8.80 11.60 17.60 23.60
(*) Children under 11 only.
41

Metrode Madrid
Season tickets (€)
ZONE
TICKETS
A B1 B2 B3 C1 C2B1-B2B2-B3B3-C1C1-C2
E1 E2
Normal (Monthly) 46.00 53.70 60.60 69.00 75.30 83.50 40.40 93.00 111.00
Youth (Monthly) 29.50 33.50 38,00 43.40 47.40 52.10 25.60 65.90 82.10
Annual 506.00 590.70 666,60 759.00 828.30 918.50 - - -
Senior (Monthly) 10.90 -
Senior (Annual) 119.90 -
(*) From 1 July the Youth Ticket is extended by one year from 21 to 22 on application for a new card.
42

AnnualReport2010
Charges 2010
Tickets Validity Price
Single 1 trip
MetroMadrid MetroMadrid and MetroLigero ML1
1,00 €
MetroNorteStations of Line 10, from: La Granja - Hospital
Infanta Sofía (Zone B1)
MetroEsteStations of Line 7, from: Bº del Puerto - Hospital
del Henares (Zone B1)
MetroSurStations of Line 12 and Joaquín Vilumbrales
on Line 10 (Zone B1 et B2)
T.F.M.TFM network, Line 9, between
Puerta de Arganda and Arganda del Rey (Zone B1, B2 et B3)
Combined 1 tripAll Metro stations and MetroLigero:
ML1, ML2 y ML32,00 €
10 Trips
MetroBus MetroMadrid, EMT and MetroLigero ML1
9,00 €
MetroNorteStations on Line 10, from: La Granja - Hospital
Infanta Sofía (Zone B1)
MetroEsteStations on Line 7, from: Bº del Puerto - Hospital
del Henares (Zone B1)
MetroSurStations on Line 12 and Joaquín Vilumbrales
on Line 10 (Zone B1 et B2)
T.F.M.TFM network, on Line 9, between
Puerta de Arganda and Arganda del Rey (Zone B1, B2 et B3)
Combined 10 tripsAll Metro stations and MetroLigero:
ML1, ML2 y ML314,50 €
Airport
Single MetroMadrid + Supplement Airport
MetroMadrid, MetroLigero ML1 and to enter and leave the Airport T1-T2-T3 and T4
2,00 €
Combined + Supplement Airport
The entire Metro network and to enter and leave the Airport T1-T2-T3 and T4
3,00 €
Supplement AirportTo ender and leave Airport T1-T2-T3 and T4 with single or
combined ticket or METROBUS1,00 €
Children under 4 do not require a ticket.
43
Metrode Madrid
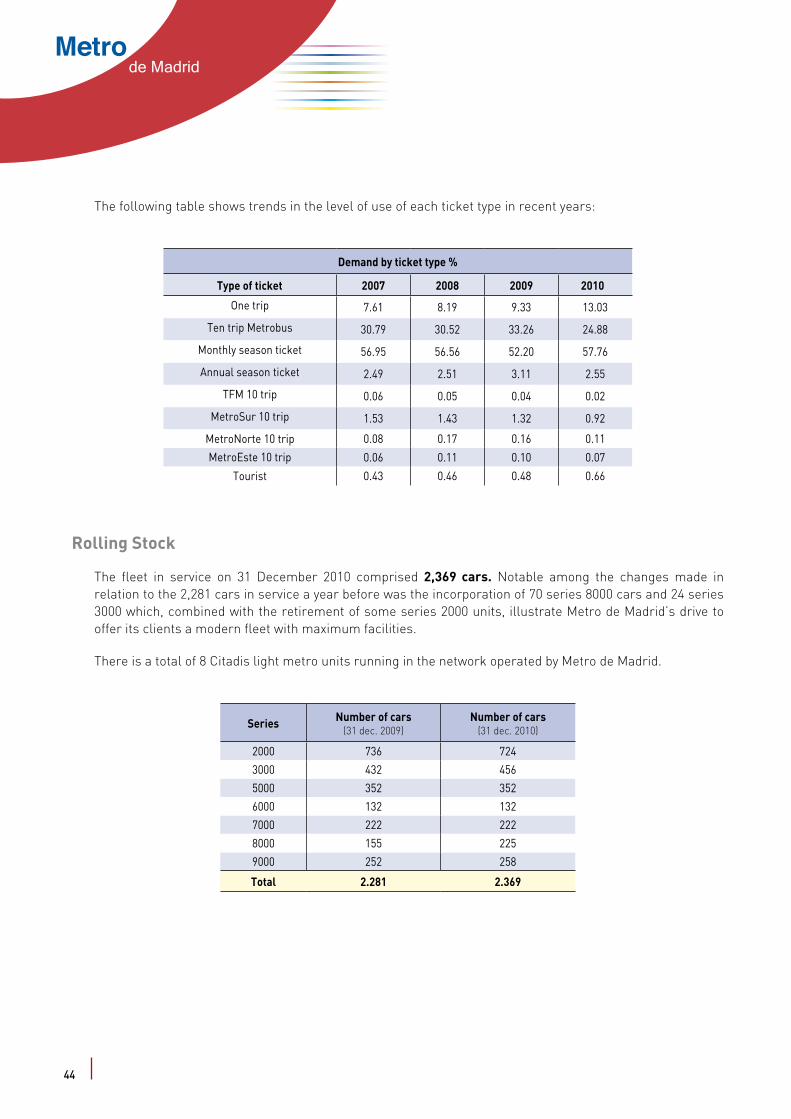
The following table shows trends in the level of use of each ticket type in recent years:
Demand by ticket type %
Type of ticket 2007 2008 2009 2010
One trip 7.61 8.19 9.33 13.03
Ten trip Metrobus 30.79 30.52 33.26 24.88
Monthly season ticket 56.95 56.56 52.20 57.76
Annual season ticket 2.49 2.51 3.11 2.55
TFM 10 trip 0.06 0.05 0.04 0.02
MetroSur 10 trip 1.53 1.43 1.32 0.92
MetroNorte 10 trip 0.08 0.17 0.16 0.11
MetroEste 10 trip 0.06 0.11 0.10 0.07
Tourist 0.43 0.46 0.48 0.66
Rolling Stock
The fleet in service on 31 December 2010 comprised 2,369 cars. Notable among the changes made in relation to the 2,281 cars in service a year before was the incorporation of 70 series 8000 cars and 24 series 3000 which, combined with the retirement of some series 2000 units, illustrate Metro de Madrid’s drive to offer its clients a modern fleet with maximum facilities.
There is a total of 8 Citadis light metro units running in the network operated by Metro de Madrid.
Series Number of cars(31 dec. 2009)
Number of cars(31 dec. 2010)
2000 736 724
3000 432 456
5000 352 352
6000 132 132
7000 222 222
8000 155 225
9000 252 258
Total 2.281 2.369
44
AnnualReport2010
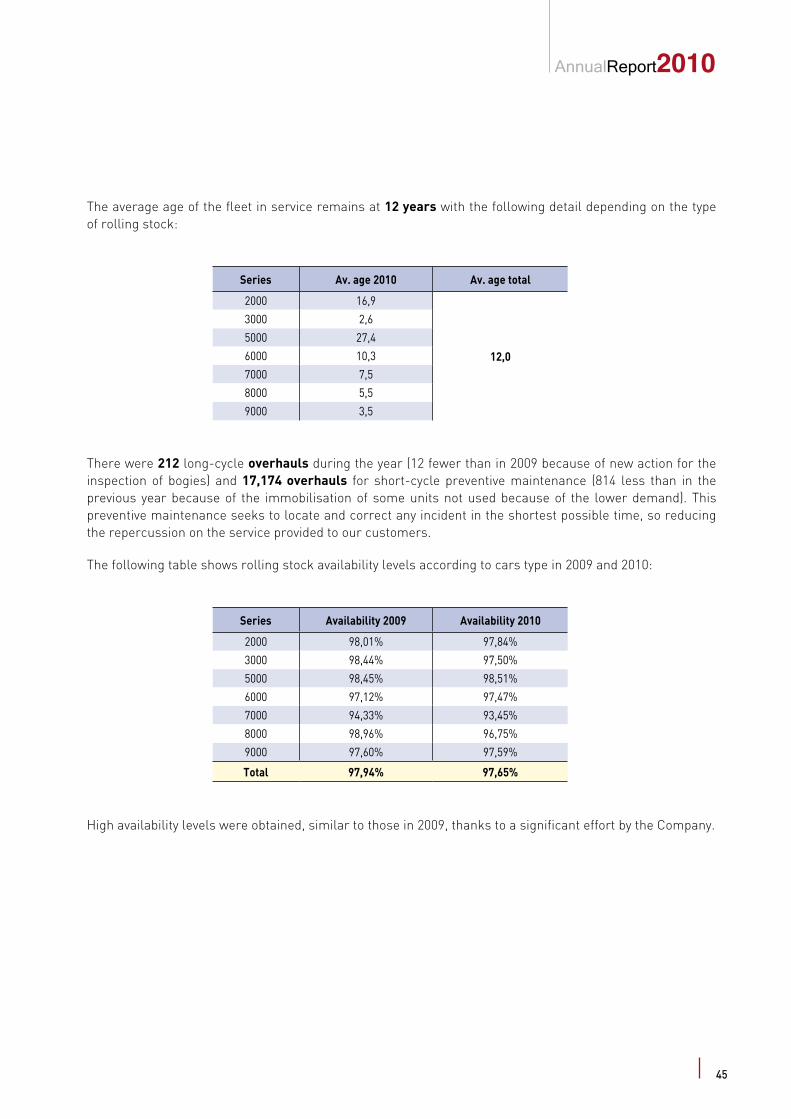
The average age of the fleet in service remains at 12 years with the following detail depending on the type of rolling stock:
Series Av. age 2010 Av. age total
2000 16,9
12,0
3000 2,6
5000 27,4
6000 10,3
7000 7,5
8000 5,5
9000 3,5
There were 212 long-cycle overhauls during the year (12 fewer than in 2009 because of new action for the inspection of bogies) and 17,174 overhauls for short-cycle preventive maintenance (814 less than in the previous year because of the immobilisation of some units not used because of the lower demand). This preventive maintenance seeks to locate and correct any incident in the shortest possible time, so reducing the repercussion on the service provided to our customers.
The following table shows rolling stock availability levels according to cars type in 2009 and 2010:
Series Availability 2009 Availability 2010
2000 98,01% 97,84%
3000 98,44% 97,50%
5000 98,45% 98,51%
6000 97,12% 97,47%
7000 94,33% 93,45%
8000 98,96% 96,75%
9000 97,60% 97,59%
Total 97,94% 97,65%
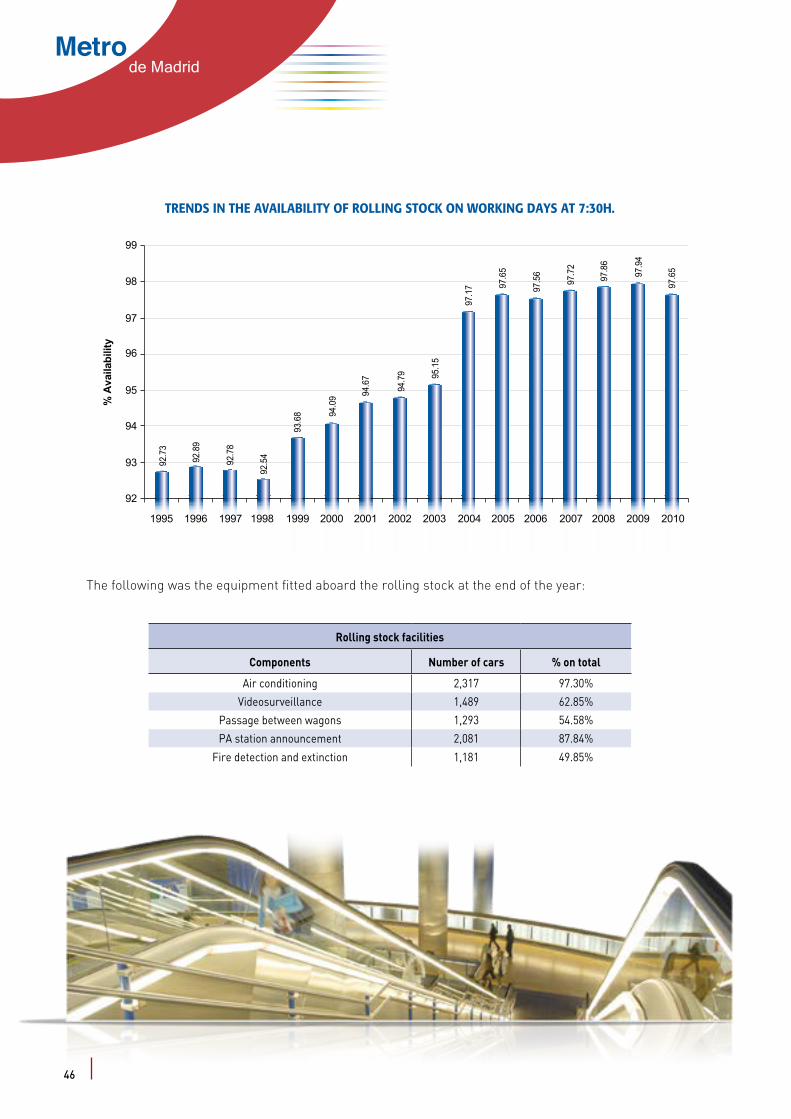
High availability levels were obtained, similar to those in 2009, thanks to a significant effort by the Company.
45
Metrode Madrid
TRENDS IN THE AVAILABILITY OF ROLLING STOCK ON WORKING DAYS AT 7:30H.
92.7
3
92.8
9
92.7
8
92.5
4
93.6
8 94.0
9 94.6
7
94.7
9 95.1
5
97.1
7 97.6
5
97.5
6
97.7
2
97.8
6
97.6
597.9
4
1995 1996 1997 1998 1999 2000 2001 2002 2003 2004 2005 2006 2007 2008 2009 2010
% A
vaila
bilit
y
99
98
97
96
95
94
93
92
The following was the equipment fitted aboard the rolling stock at the end of the year:
Rolling stock facilities
Components Number of cars % on total
Air conditioning 2,317 97.30%
Videosurveillance 1,489 62.85%
Passage between wagons 1,293 54.58%
PA station announcement 2,081 87.84%
Fire detection and extinction 1,181 49.85%
46
AnnualReport2010
TRENDS IN THE AVAILABILITY OF ROLLING STOCK ON WORKING DAYS AT 7:30H.
92.7
3
92.8
9
92.7
8
92.5
4
93.6
8 94.0
9 94.6
7
94.7
9 95.1
5
97.1
7 97.6
5
97.5
6
97.7
2
97.8
6
97.6
597.9
4
1995 1996 1997 1998 1999 2000 2001 2002 2003 2004 2005 2006 2007 2008 2009 2010
% A
vaila
bilit
y
99
98
97
96
95
94
93
92
The following was the equipment fitted aboard the rolling stock at the end of the year:
Rolling stock facilities
Components Number of cars % on total
Air conditioning 2,317 97.30%
Videosurveillance 1,489 62.85%
Passage between wagons 1,293 54.58%
PA station announcement 2,081 87.84%
Fire detection and extinction 1,181 49.85%
Installations
Metro de Madrid made a significant effort in 2010 to maintain availability ratios at values similar to those for 2009, while securing substantial cost reductions. There was also a notable increase during this year in the figures for equipment and systems maintained by Metro’s own personnel as the guarantees on most of the elements installed under the 2003-2007 Enlargement Plan came to an end.
Facilities at stations providing service in the network and their evolution during the last year are detailed in the following table:
Installations and equipment 2009 2010
CCTV monitors - TFT screens 330 686 (*)
Interphones 4,721 4,801
Teleindicators (Panels) 2,397 2,198 (**)
Power plants (CAT and CAI) 407 407
Automatic ticket vending machines 1,449 1,489
Turnstiles 2,552 2,609
Escalators, walkways and ramps 1,634 1,650
Elevators 492 499
Ventilation shafts 640 641
Station and substation anti-intruder systems 469 471
Transformer-rectifier substations 116 119
Medium-voltage transformer facilities 347 357
Transformers 1,070 1,073
General twin-track electrification (km) 285.2 290.7
* This category takes account of equipment such as vestibule video surveillance screens, the Metro Madrid Channel screens, Platform 0 screens and audiovisual rooms not included in the 2009 figure. ** Elevator indicator screens are not considered because they are considered to be elevator components, providing information only about the equipment and not of a general nature.
47
Metrode Madrid
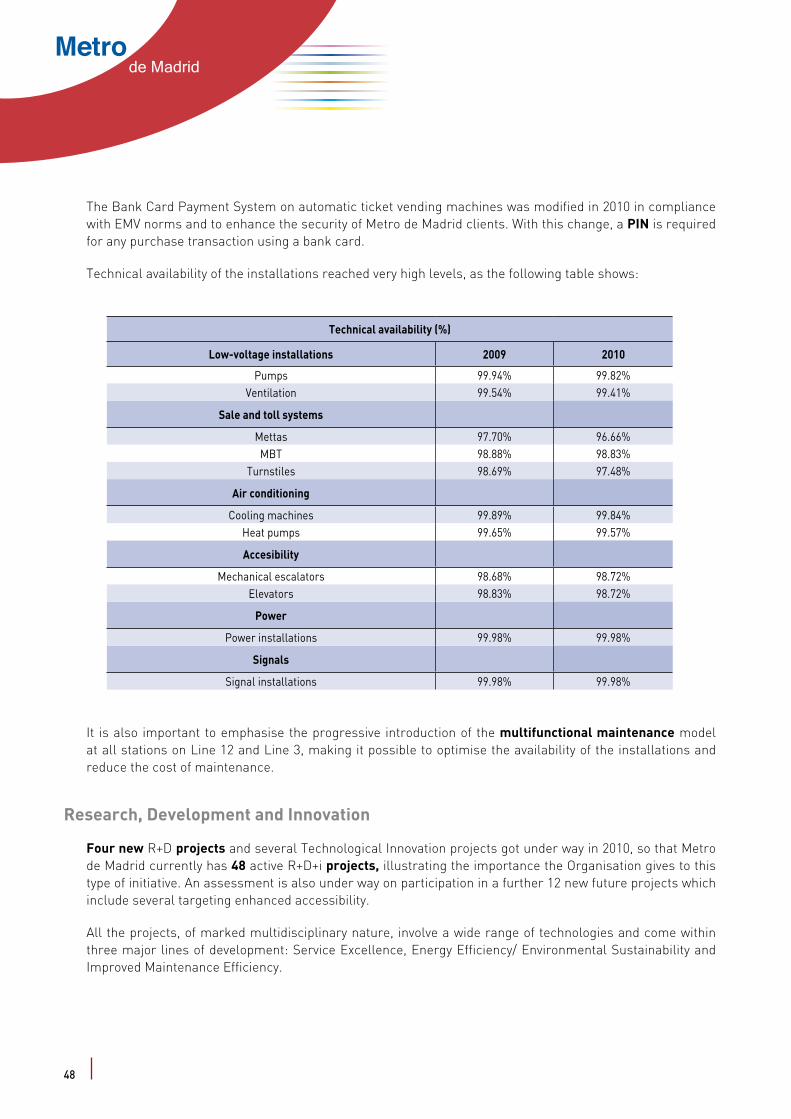
The Bank Card Payment System on automatic ticket vending machines was modified in 2010 in compliance with EMV norms and to enhance the security of Metro de Madrid clients. With this change, a PIN is required for any purchase transaction using a bank card.
Technical availability of the installations reached very high levels, as the following table shows:
Technical availability (%)
Low-voltage installations 2009 2010
Pumps 99.94% 99.82%Ventilation 99.54% 99.41%
Sale and toll systems
Mettas 97.70% 96.66%MBT 98.88% 98.83%
Turnstiles 98.69% 97.48%
Air conditioning
Cooling machines 99.89% 99.84%Heat pumps 99.65% 99.57%
Accesibility
Mechanical escalators 98.68% 98.72%Elevators 98.83% 98.72%
Power
Power installations 99.98% 99.98%
Signals
Signal installations 99.98% 99.98%
It is also important to emphasise the progressive introduction of the multifunctional maintenance model at all stations on Line 12 and Line 3, making it possible to optimise the availability of the installations and reduce the cost of maintenance.
Research, Development and Innovation
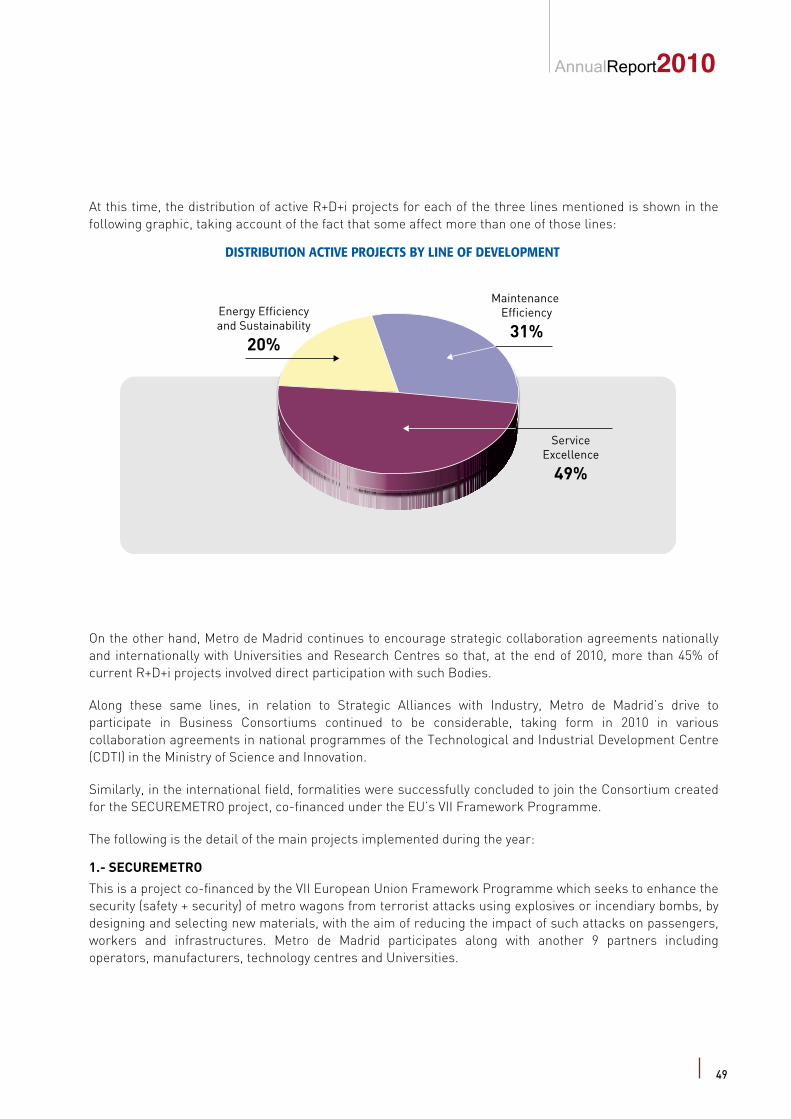
Four new R+D projects and several Technological Innovation projects got under way in 2010, so that Metro de Madrid currently has 48 active R+D+i projects, illustrating the importance the Organisation gives to this type of initiative. An assessment is also under way on participation in a further 12 new future projects which include several targeting enhanced accessibility.
All the projects, of marked multidisciplinary nature, involve a wide range of technologies and come within three major lines of development: Service Excellence, Energy Efficiency/ Environmental Sustainability and Improved Maintenance Efficiency.
48
AnnualReport2010
At this time, the distribution of active R+D+i projects for each of the three lines mentioned is shown in the following graphic, taking account of the fact that some affect more than one of those lines:
DISTRIBUTION ACTIVE PROJECTS BY LINE OF DEVELOPMENT
Energy Efficiencyand Sustainability
20%
Maintenance Efficiency
31%
ServiceExcellence
49%
On the other hand, Metro de Madrid continues to encourage strategic collaboration agreements nationally and internationally with Universities and Research Centres so that, at the end of 2010, more than 45% of current R+D+i projects involved direct participation with such Bodies.
Along these same lines, in relation to Strategic Alliances with Industry, Metro de Madrid’s drive to participate in Business Consortiums continued to be considerable, taking form in 2010 in various collaboration agreements in national programmes of the Technological and Industrial Development Centre (CDTI) in the Ministry of Science and Innovation.
Similarly, in the international field, formalities were successfully concluded to join the Consortium created for the SECUREMETRO project, co-financed under the EU’s VII Framework Programme.
The following is the detail of the main projects implemented during the year:
1.- SECUREMETRO
This is a project co-financed by the VII European Union Framework Programme which seeks to enhance the security (safety + security) of metro wagons from terrorist attacks using explosives or incendiary bombs, by designing and selecting new materials, with the aim of reducing the impact of such attacks on passengers, workers and infrastructures. Metro de Madrid participates along with another 9 partners including operators, manufacturers, technology centres and Universities.
49

Metrode Madrid
2.- SIMULATION OF ROLLING STOCK DYNAMICS ON STRETCHES OF REAL TRACK
Co-financed by the CDTI (Technological and Industrial Development Centre), the main objective here is research and development of an advanced, multi-body rail-vehicle simulation tool to analyse and evaluate their dynamic behaviour in certain real track conditions.
3.- GEOMETRO
This project is designed to develop a web navigation system allowing rapid, secure and flexible operational cartographic consultation to help in strategy decision-making at all Metro de Madrid network levels.
4.- DEVELOPMENT OF A FIRE-FIGHTING SECURITY SYSTEM FOR UNDER-FRAME METROPOLITAN RAIL EQUIPMENT
Subsidised by the Ministry of Development, this project seeks to identify the optimal design criteria for the rolling stock fire-fighting security system, considering the following:
l Various trials to analyse ignition conditions using infra-red thermography to scale in the analysis of flame propagation, and the surrounding aerodynamic conditions required during rolling-stock movement.
l Computational modelling of fire scenarios under the train in a tunnel.
l Full-scale fire trial making it possible to validate the extinction system’s performance.
5.- FACTEL
An innovation project involving development of an electronic billing and client and supplier consultation system, FACTEL arises in response to the need to implement a technical solution adapted to the requirements of the new national electronic billing provisions.
50
AnnualReport2010
6.- SCADA DE PEAJE
The purposes of this innovation project is to develop the management technologies for controlling access in the Metro de Madrid network from an operational point of view for the acquisition of real-time information from the Network’s sales and toll facilities.
7.- URBANTRACK
Although begun in 2009, as part of the activities in R+D+i in 2010 particular importance was given to the completion of the Urbantrack project integrated into the VI European Union Framework Programme, with a 20 million euro budget.
The main purpose of this project, in which a total of 38 European companies have participated, was to develop new rail track infrastructure technologies for the urban situation, improving the performance of existing track from the construction, functional, economic and environmental point of view.
4 Internal Innovation
Notable in-house has been Metro de Madrid’s drive to promote innovation among all its employees, receiving proposals from them through the project named Innova.
Metro de Madrid’s aim with the startup of Innova is to strengthen the culture of innovation in the company as a first step in the development of an integrated model for managing Innovation which, along with current action in Research and Development, will allow it to consolidate its leadership position in the sector.
Thirty-three innovative proposals were received during the 2010 financial year from all areas of the Organisation, and which have been studied from the technical and business standpoints, for prioritisation based on the added value contributed to the Company’s activity.
51
Metrode Madrid
INVESTMENTS IN THE 2010
FINANCIAL YEAR
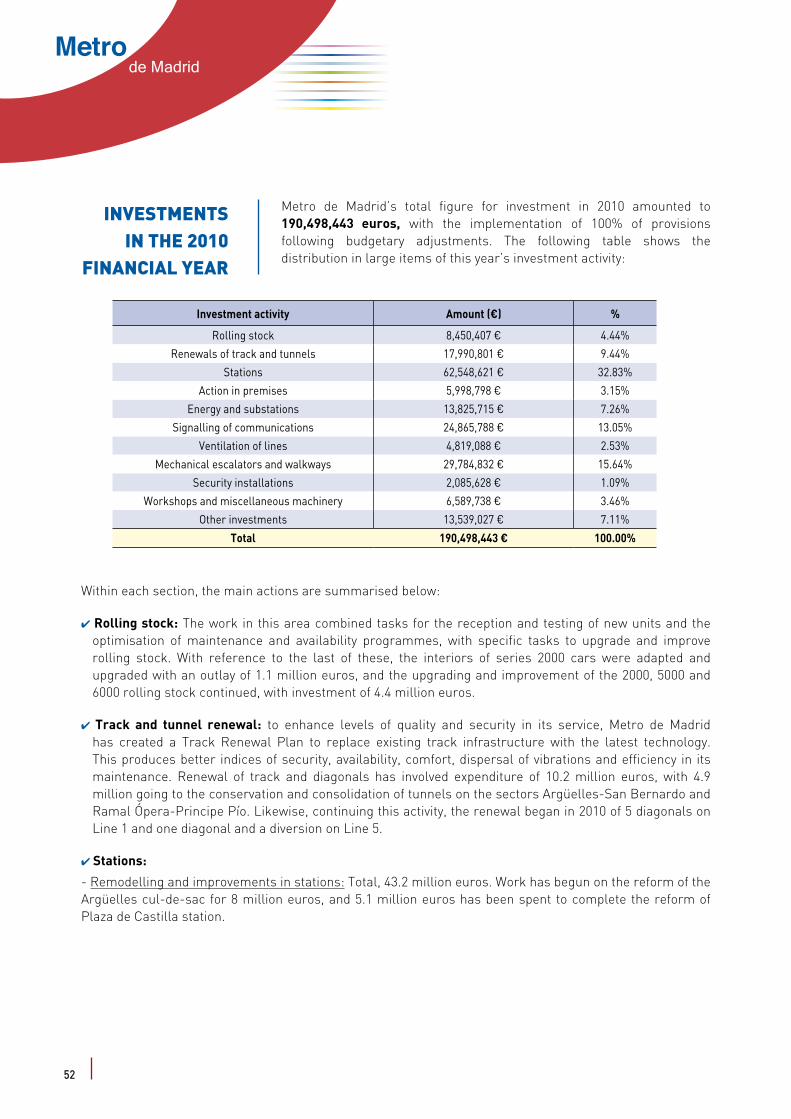
Metro de Madrid’s total figure for investment in 2010 amounted to 190,498,443 euros, with the implementation of 100% of provisions following budgetary adjustments. The following table shows the distribution in large items of this year’s investment activity:
Investment activity Amount (€) %
Rolling stock 8,450,407 € 4.44%
Renewals of track and tunnels 17,990,801 € 9.44%
Stations 62,548,621 € 32.83%
Action in premises 5,998,798 € 3.15%
Energy and substations 13,825,715 € 7.26%
Signalling of communications 24,865,788 € 13.05%
Ventilation of lines 4,819,088 € 2.53%
Mechanical escalators and walkways 29,784,832 € 15.64%
Security installations 2,085,628 € 1.09%
Workshops and miscellaneous machinery 6,589,738 € 3.46%
Other investments 13,539,027 € 7.11%
Total 190,498,443 € 100.00%
Within each section, the main actions are summarised below:
4 Rolling stock: The work in this area combined tasks for the reception and testing of new units and the optimisation of maintenance and availability programmes, with specific tasks to upgrade and improve rolling stock. With reference to the last of these, the interiors of series 2000 cars were adapted and upgraded with an outlay of 1.1 million euros, and the upgrading and improvement of the 2000, 5000 and 6000 rolling stock continued, with investment of 4.4 million euros.
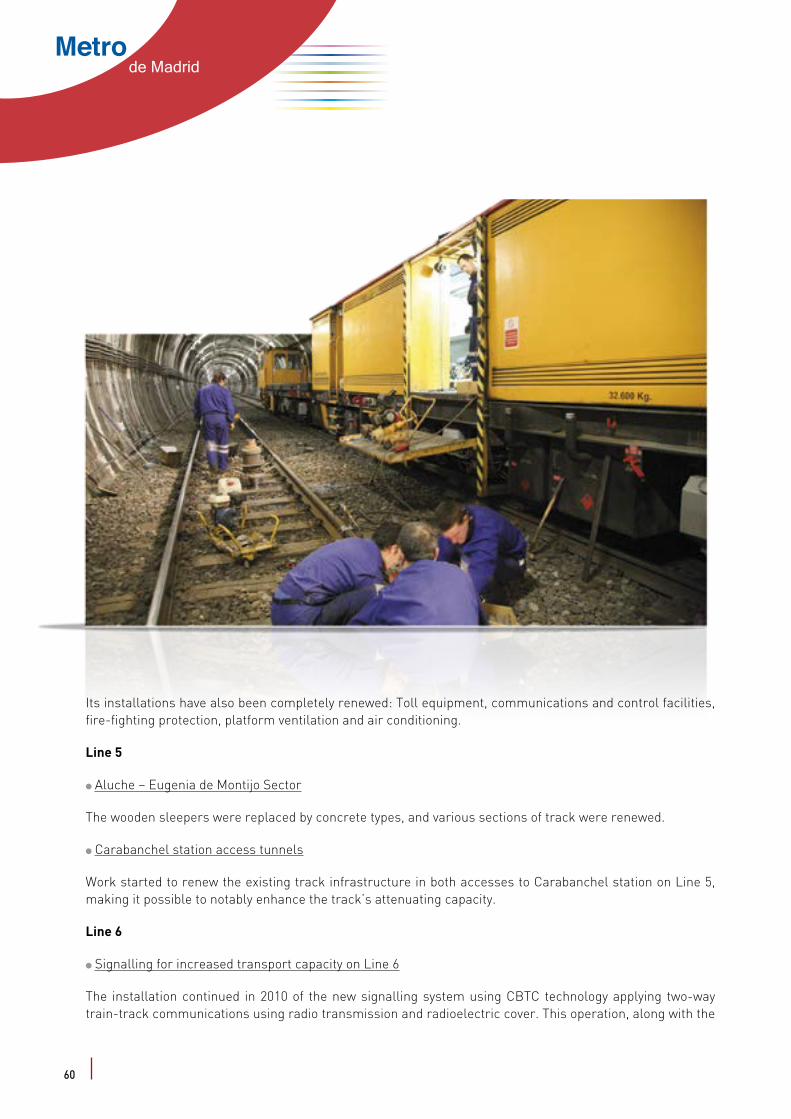
4 Track and tunnel renewal: to enhance levels of quality and security in its service, Metro de Madrid has created a Track Renewal Plan to replace existing track infrastructure with the latest technology. This produces better indices of security, availability, comfort, dispersal of vibrations and efficiency in its maintenance. Renewal of track and diagonals has involved expenditure of 10.2 million euros, with 4.9 million going to the conservation and consolidation of tunnels on the sectors Argüelles-San Bernardo and Ramal Ópera-Principe Pío. Likewise, continuing this activity, the renewal began in 2010 of 5 diagonals on Line 1 and one diagonal and a diversion on Line 5.
4 Stations:
- Remodelling and improvements in stations: Total, 43.2 million euros. Work has begun on the reform of the Argüelles cul-de-sac for 8 million euros, and 5.1 million euros has been spent to complete the reform of Plaza de Castilla station.
52
AnnualReport2010
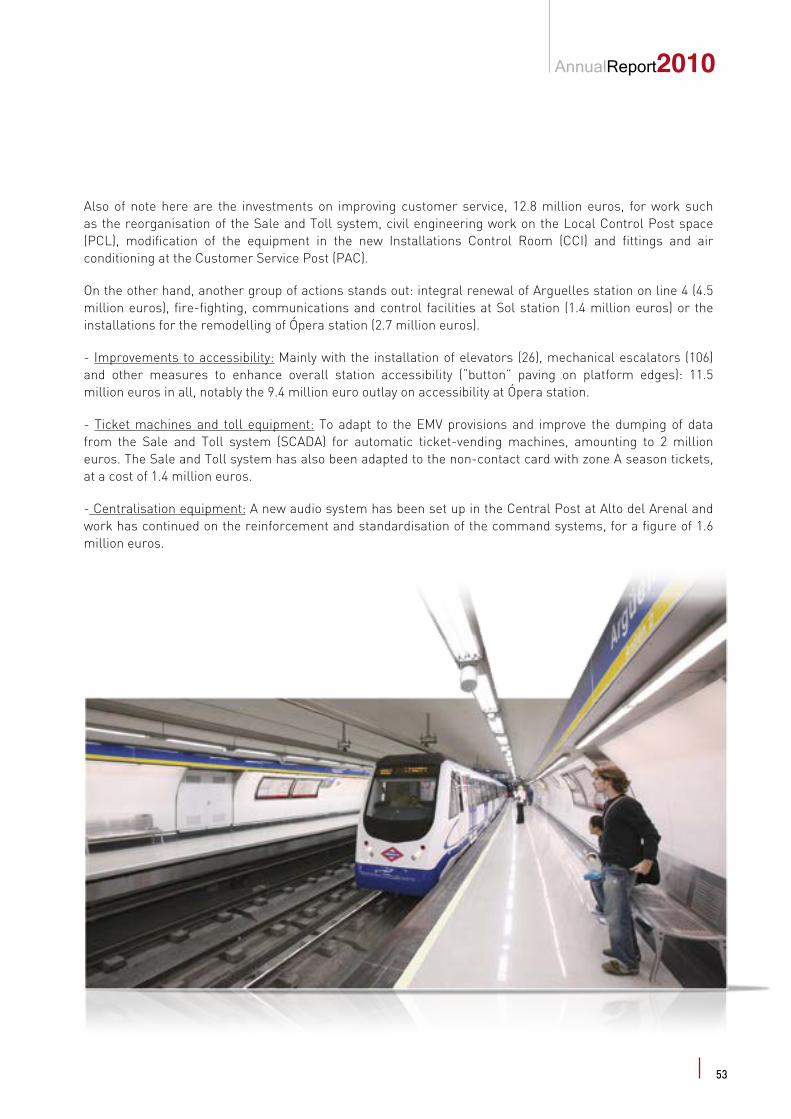
Also of note here are the investments on improving customer service, 12.8 million euros, for work such as the reorganisation of the Sale and Toll system, civil engineering work on the Local Control Post space (PCL), modification of the equipment in the new Installations Control Room (CCI) and fittings and air conditioning at the Customer Service Post (PAC).
On the other hand, another group of actions stands out: integral renewal of Arguelles station on line 4 (4.5 million euros), fire-fighting, communications and control facilities at Sol station (1.4 million euros) or the installations for the remodelling of Ópera station (2.7 million euros).
- Improvements to accessibility: Mainly with the installation of elevators (26), mechanical escalators (106) and other measures to enhance overall station accessibility (“button” paving on platform edges): 11.5 million euros in all, notably the 9.4 million euro outlay on accessibility at Ópera station.
- Ticket machines and toll equipment: To adapt to the EMV provisions and improve the dumping of data from the Sale and Toll system (SCADA) for automatic ticket-vending machines, amounting to 2 million euros. The Sale and Toll system has also been adapted to the non-contact card with zone A season tickets, at a cost of 1.4 million euros.
- Centralisation equipment: A new audio system has been set up in the Central Post at Alto del Arenal and work has continued on the reinforcement and standardisation of the command systems, for a figure of 1.6 million euros.
53
Metrode Madrid
4 On-site action: Notable here has been the work to upgrade and improve the Rolling Stock Maintenance Workshops in Canillejas (0.6 million euros), the fitting-out of the depots at Ventas, Canillejas and Aluche (0,9 million euros), renewal of the Engineering building (1.8 million euros) and reform of the offices and enclosure at Sacedal (1.1 million euros).
4 Energy and substations: This includes action to increase line capacity, changing the voltage from 600 V DC to 1500 DC, basically on Line 2 and the Ramal Ópera-Principe Pío, for 3.1 million euros. On the other hand, improvement has continued to the installations and auxiliary services and security in substations and transformer rooms, for an outlay of 2.3 million euros.
Also notable here has been the adaptation to the current provisions on low-tension facilities, amounting to 8 million euros.
4 Signalling and communications: this item includes the incorporation of new signalling based on CBTC technology on Lines 1 and 6 using on-board material, for 7.5 million euros, the implantation of the TETRA System on Line 6 for 3.2 million euros, and renewal of the IP communications system for 4.1 million euros in all.
Also included is the investment on the technological platform of the model for maintenance of the installations (COMMIT) amounting to 3 million euros.
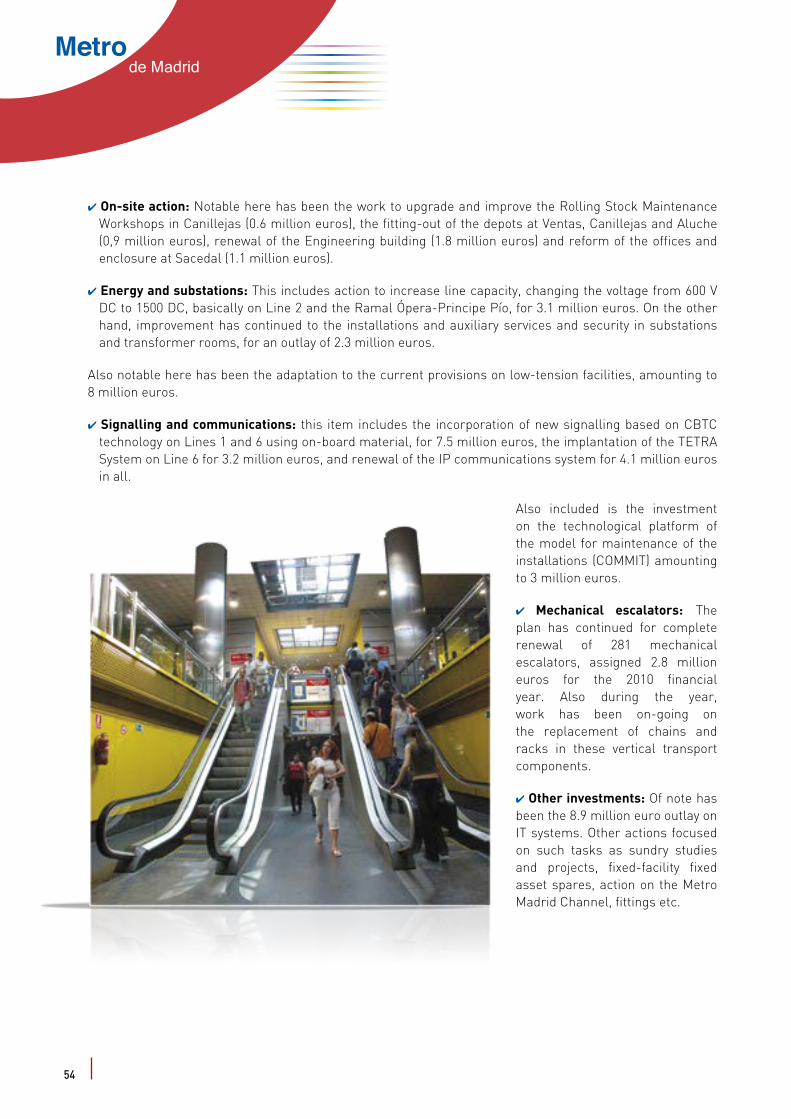
4 Mechanical escalators: The plan has continued for complete renewal of 281 mechanical escalators, assigned 2.8 million euros for the 2010 financial year. Also during the year, work has been on-going on the replacement of chains and racks in these vertical transport components.
4 Other investments: Of note has been the 8.9 million euro outlay on IT systems. Other actions focused on such tasks as sundry studies and projects, fixed-facility fixed asset spares, action on the Metro Madrid Channel, fittings etc.
54
AnnualReport2010
Main actions
The following is detail of the main activities during 2010, grouped into major projects:
4 Accessibility in stations
As part of the investment on stations, improved client accessibility to vestibules and platforms has continued to be a priority for the Company and the Plan has been maintained for the Installation and Renewal of Elevators and Mechanical Escalators:
lElevators
New elevators have been installed since 2004 not just in the stations remodelled but also those in the old network where such installation is technically feasible, to provide a more consistent service at all operational stations.
The project has also been continued for the complete replacement of some elevators at stations with higher passenger traffic, to enhance the service offered by these vertical transport elements.
Thus, in these two lines of work, new elevators were brought on line at the following stations in 2010:
In addition to the foregoing, the installation of three elevators at Ópera station is well advanced.
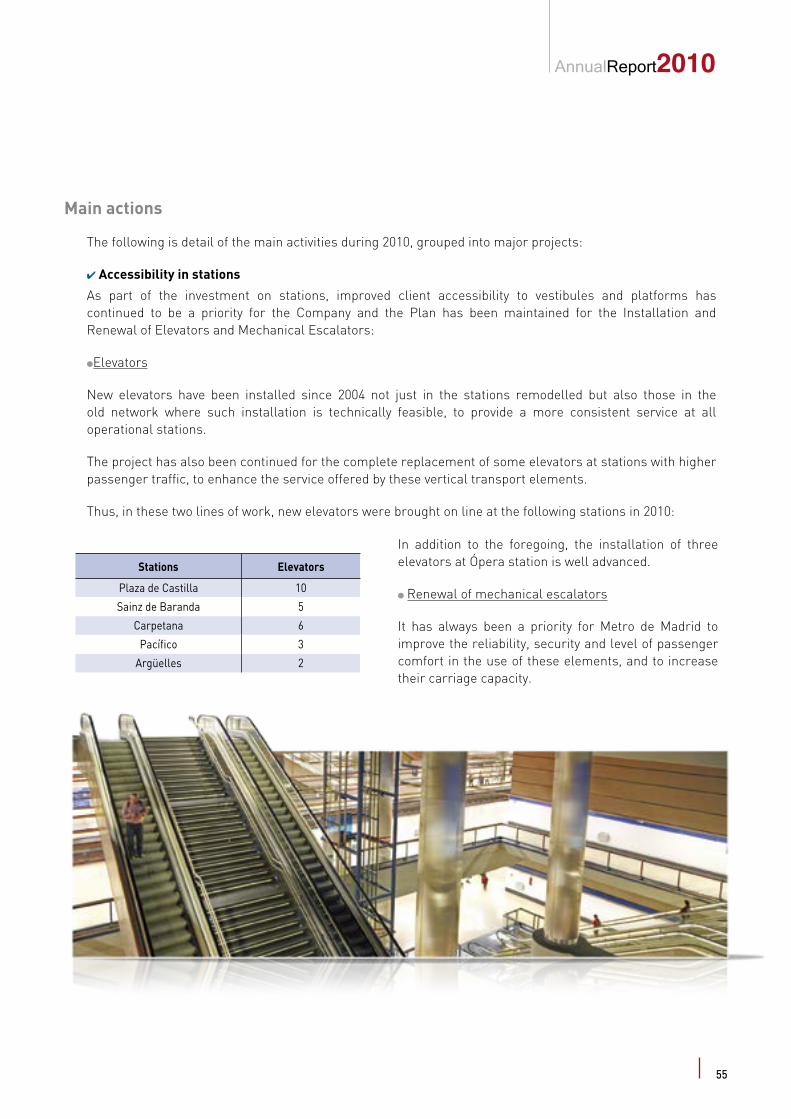
l Renewal of mechanical escalators
It has always been a priority for Metro de Madrid to improve the reliability, security and level of passenger comfort in the use of these elements, and to increase their carriage capacity.
Stations Elevators
Plaza de Castilla 10
Sainz de Baranda 5
Carpetana 6
Pacífico 3
Argüelles 2
55
Metrode Madrid
Thus 2010 has seen the continuation of the Mechanical Escalator Renewal Plan taking in the period 2008-2011, involving the comprehensive replacement of 281 escaleras in accordance with European Standard EN115 dealing with all aspects of their safety. 106 mechanical escalators were replaced in 2010, at the following stations:
Likewise, a new mobility facility has been incorporated at Plaza de Castilla station in the form of 2 pitless mobile ramps, as a new technological solution.
l Specific accessibility action on paving and signalling
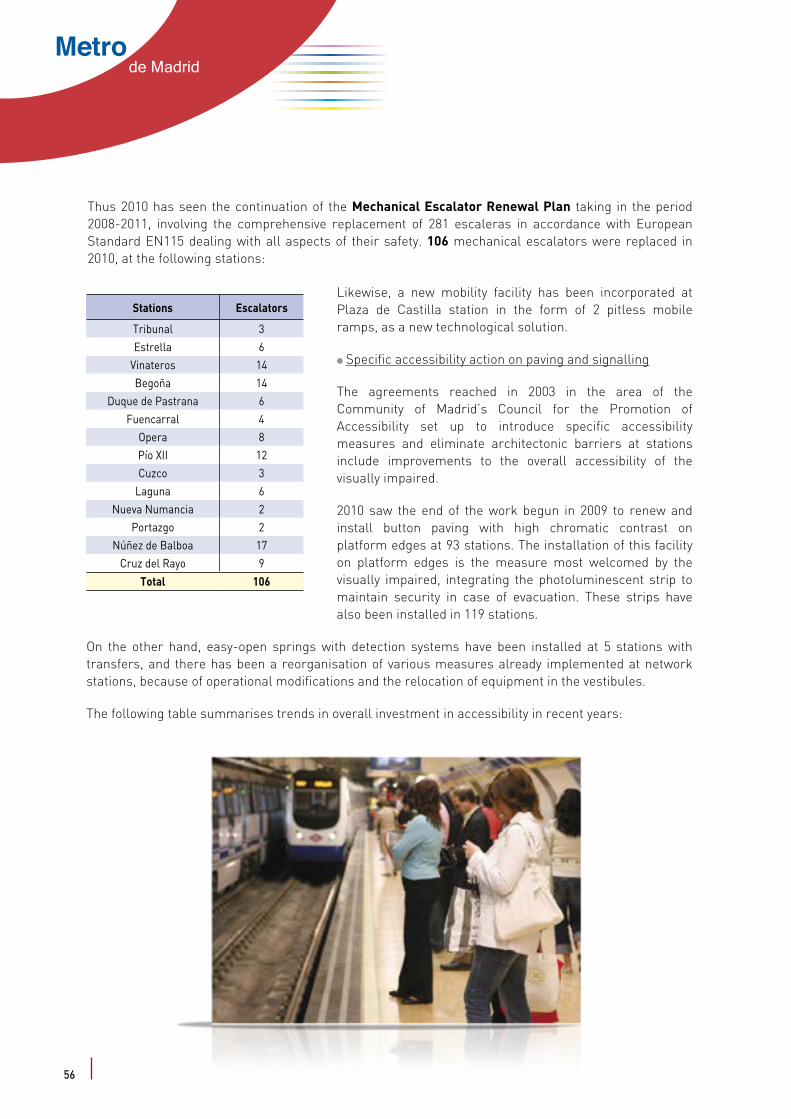
The agreements reached in 2003 in the area of the Community of Madrid’s Council for the Promotion of Accessibility set up to introduce specific accessibility measures and eliminate architectonic barriers at stations include improvements to the overall accessibility of the visually impaired.
2010 saw the end of the work begun in 2009 to renew and install button paving with high chromatic contrast on platform edges at 93 stations. The installation of this facility on platform edges is the measure most welcomed by the visually impaired, integrating the photoluminescent strip to maintain security in case of evacuation. These strips have also been installed in 119 stations.
On the other hand, easy-open springs with detection systems have been installed at 5 stations with transfers, and there has been a reorganisation of various measures already implemented at network stations, because of operational modifications and the relocation of equipment in the vestibules.
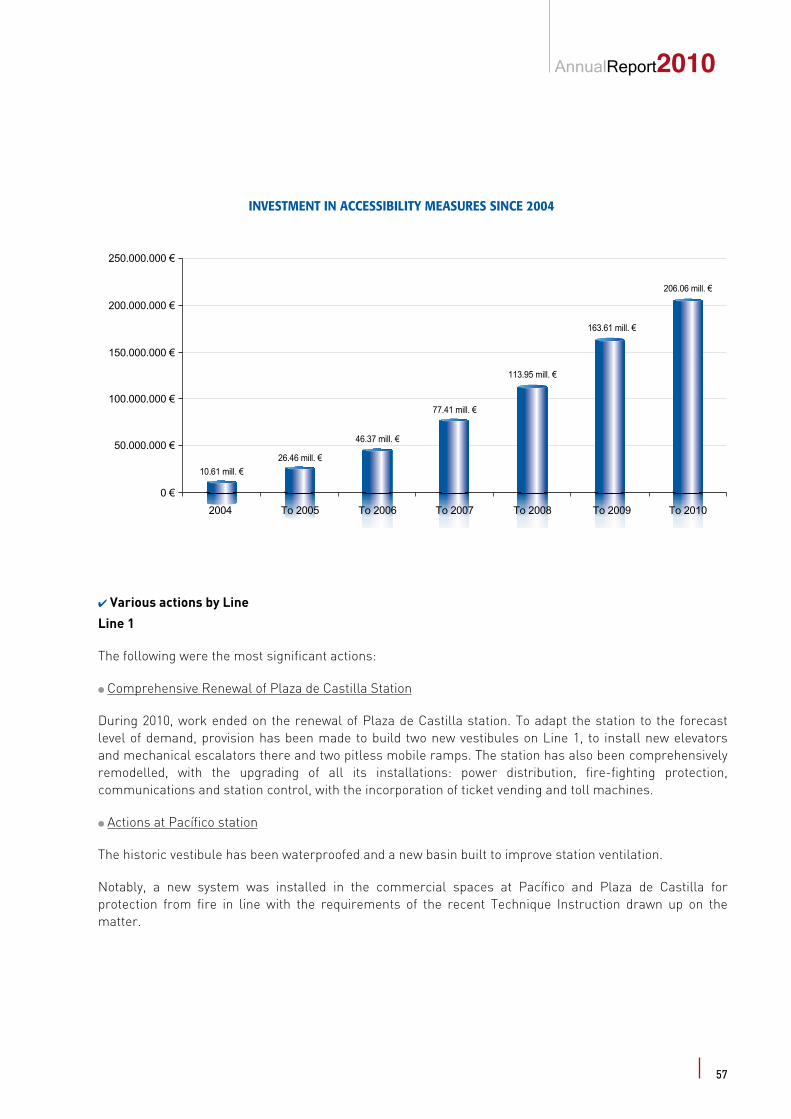
The following table summarises trends in overall investment in accessibility in recent years:
Stations Escalators
Tribunal 3Estrella 6
Vinateros 14Begoña 14
Duque de Pastrana 6Fuencarral 4
Opera 8Pío XII 12Cuzco 3
Laguna 6Nueva Numancia 2
Portazgo 2Núñez de Balboa 17
Cruz del Rayo 9
Total 106
56
AnnualReport2010
INVESTMENT IN ACCESSIBILITY MEASURES SINCE 2004
2004 To 2005 To 2006 To 2007 To 2008 To 2009 To 2010
250.000.000 €
200.000.000 €
150.000.000 €
100.000.000 €
50.000.000 €
0 €
10.61 mill. €26.46 mill. €
46.37 mill. €
77.41 mill. €
113.95 mill. €
163.61 mill. €
206.06 mill. €
4 Various actions by Line
Line 1
The following were the most significant actions:
l Comprehensive Renewal of Plaza de Castilla Station
During 2010, work ended on the renewal of Plaza de Castilla station. To adapt the station to the forecast level of demand, provision has been made to build two new vestibules on Line 1, to install new elevators and mechanical escalators there and two pitless mobile ramps. The station has also been comprehensively remodelled, with the upgrading of all its installations: power distribution, fire-fighting protection, communications and station control, with the incorporation of ticket vending and toll machines.
l Actions at Pacífico station
The historic vestibule has been waterproofed and a new basin built to improve station ventilation.
Notably, a new system was installed in the commercial spaces at Pacífico and Plaza de Castilla for protection from fire in line with the requirements of the recent Technique Instruction drawn up on the matter.
57

Metrode Madrid
l Signalling to increase transport capacity
In the 2010 financial year, the introduction has continued of the new CBTC signalling system and the on-board fitting of the new ATP/ATO system on the rolling stock. This activity has involved 68 type 2000 cars.
l Upgrading of stations to operate under the “Commercial Supervisor” Model
As on Line 6, the adaptation has been terminated of the local control posts (PCL) at 27 stations on Line 1, upgrading their facilities, creating the new installation control room (CCI) with its technical equipment for the purposes and providing the Customer Service Post fittings and air conditioning.
Line 2
l Track Renewal. Retiro – Banco de España Sector
These actions have made it possible to develop the technology of this sector of the track to one which is more modern, with high anti-vibration performance. The work included changing the track and its mooring system.
l Track Renewal. Cuatro Caminos Station
The activities here have permitted the installation of components using the most up to date technology such as elastic supports on floating slabs and articulated points. Overall, this has significantly improved the system’s anti-vibration behaviour.
l Renewal of Ópera Station
A flagship project in improving accessibility, 3 elevators and 8 new mechanical escalators have been installed. There have also been other improvements to the installations, like the construction of a new low-tension room and transformer centre, the addition of fire-fighting and atomised water systems, new commercial premises, installation of ventilation and adiabatic cooling by evaporation, communications facilities, etc.
58

AnnualReport2010
In conclusion, the station has acquired the function of a museum with the archaeological remains of the “Caños del Peral Fountain” uncovered, which have been put on public display.
l Actions to increase the capacity of Line 2
New facilities have been installed in the electrical installations and those in the existing substations have been renewed, changing the voltage from 600 V DC to 1,500 V DC.
Line 4
l Track Renewal. Argüelles - San Bernardo Sector
The work was done in 2010 to renew the track on the Argüelles - San Bernardo section of Line 4, changing from wooden sleepers on a ballast base to one with twin-block sleepers on a concrete slab and also changing the rail type.
Likewise, at turn-offs to depots, this action has made it possible to evolve from articulated point technology on a ballast base to track with floating slab type plate (elastic blanket) and elastic points.
Of note has been the installation at both Arguelles and Cuatro Caminos of a high-capacity vibration insulating system called floating slab which makes it possible to significantly reduce the vibrations transmitted to the surroundings.
l Track Renewal. Argüelles Depot
The track has been renewed in the link tunnel between line 4 and the Argüelles depot, on the track system at the depot, and depot tracks 1 and 4.
The track apparatus and platform change have evolved from technology using articulated points to elastic points.
l Track Renewal. Avda América - Prosperidad Sector
The comprehensive renewal of the track required the demolition of the existing concrete platform. The resulting track provides high-capacity support, attenuating vibrations. It was also possible to optimise the geometry.
l Tunnels
In addition to this track renewal, the tunnel between Argüelles and San Bernardo was reinforced structurally and waterproofed.
Various actions also began to allow the evacuation of people from tunnels with a single “eye” in the zone interconnecting lines 2 and 4 at Goya station.
l Reform of Argüelles Station
Work ended on the extension of the Argüelles cul-de-sac, to enlarge the platforms and for a new vestibule at the Line 4 station (Alberto Aguilera exit). This is intended to increase train braking distance at this end-of-line station, overall improving transport capacity and meeting forecast increased demand.
59
Metrode Madrid
Its installations have also been completely renewed: Toll equipment, communications and control facilities, fire-fighting protection, platform ventilation and air conditioning.
Line 5
l Aluche – Eugenia de Montijo Sector
The wooden sleepers were replaced by concrete types, and various sections of track were renewed.
l Carabanchel station access tunnels
Work started to renew the existing track infrastructure in both accesses to Carabanchel station on Line 5, making it possible to notably enhance the track’s attenuating capacity.
Line 6
l Signalling for increased transport capacity on Line 6
The installation continued in 2010 of the new signalling system using CBTC technology applying two-way train-track communications using radio transmission and radioelectric cover. This operation, along with the
60
AnnualReport2010
further implantation of the new ATP/ATO system in the onboard equipment on rolling stock on twenty-five 5000 cars, will enable transport capacity to be increased, reducing times between trains always compatible with safe operation.
A new ATS facility (Automatic Train Supervision) has also been installed for regulation and control from the Central Train Control Post.
l Ventilation System
The ventilation system in the oldest stretches of tunnel and stations was renewed, with the remodelling of 11 pits and new ventilation equipment and their electrical, control and acoustic systems, all to reduce the likely increased thermal charge when the service adapts to the new CBTC signalling system.
l TETRA digital radiotelephone system
In the 2010 financial year, action continued to introduce this digital mobile radiotelephone radiocommunications system on the line. Thus stations were deployed, with the installation of radiant cable, the cover base in tunnels and to the adjacent stations, integrating the combination of the station and TEBATRAIN radiofrequencies, providing band services on IP networks free of outages and interruptions between the onboard rolling stock systems and the network.
This project is aimed at designing a solution for a wireless-technology-based Train-Ground Two-Way Broad Band TCP/IP data transmission system to transmit video-surveillance images, audio and train data in real time to the ground control posts. In turn, the driver automatically receives images from the station platforms before arriving.
l Adaptation of stations to operate the “Commercial Supervisor” model on Line 6
The changes introduced following the increased number and reliability of ticket vending machines, including bank card payment, along with Metro de Madrid’s aim of increasing personalised user attention, have led to an evolution in operating systems to the model known as the “Commercial Supervisor”.
This system has been in place since 2003 with notable success at the stations on Line 12 and more recently on Line 3, and has been extended subsequently to station operation under the 2003-2007 Enlargement Plan. This operational model includes new technologies which make it possible to automate station personnel’s more routine tasks, enabling them to offer provide attention to passengers, eliminating the barrier effect of the previous local control posts (PCL).
2010 saw the completion on most of line 6 (just 4 stations remain pending) of the work needed to adapt the PCL rooms for the introduction of the new operating model. This involved the upgrading of the PCL installations and technical equipment, of the Sale and Toll systems and the communications and control networks: the engineering and the adaption of the communications facilities has been completed.
l Reform of the Low-Voltage installations on Line 6
The second stage of the project was begun in 2010 to bring the low-voltage components in areas accessible to the public into line at 27 stations on the whole of Line 6 to adapting them to the specifications in the Low-Voltage Electrical Engineering Regulations (Royal Decree No. 842/2002 of 2 August).
61
Metrode Madrid
Line 9
Work began on the replacement of some 500 sleepers on the Plaza de Castilla – Ventilla sector.
Line 11
The work was done in 2010 to adapt the narrow gauge to broad gauge on the line 11 station platforms because of the change of rolling stock from type 3000 to 8000.
Line 12 (MetroSur)
The Project on Prototype Platform Doors is part of the strategic project for the Improvement of Transport Capacity, and has been under way since 2007/08.
62

AnnualReport2010
Prototypes from several manufacturers were installed in 2010 at 4 MetroSur stations, and measurements and tests were run so that the structures tested could subsequently be dismantled.
With this pilot scheme, Metro de Madrid has verified and evaluated this new technology and its adaptability to the Company’s installations, gathering the information needed to draw up technical specifications for inclusion in potential future tenders for the procurement of these systems.
Ramal Ópera – P. Pío
l Track Renewal
Track has been renewed on three sections of the Ramal Ópera – Príncipe Pío line, including renewal of the rail and crossover, pad and elastomer under chock, replacement of sleepers in poor condition, etc.
l Consolidation of the tunnel
The tunnel was reinforced structurally and waterproofed.
4 Rolling stock
The technical improvements introduced this financial year were intended to enhance the reliability of the rolling stock and so increase transport efficiency, at the same time seeking to innovate in areas of aesthetics and comfort. Of course the necessary reforms differed for each train type given the characteristics of each series and the needs of each line and, when circumstances permitted, the inclusion in the car interiors of spaces reserved for persons with different capacities (improvements applied in large part to the oldest series).
The following were the main actions, classified by rolling stock series:
Notable among the main tasks carried out in 2010 were those for interior reform, with adaptations to improve accessibility (Series 2000 and 5000), improvements to the integration of the latest cars received (Series 6000 and 8000) and other activities linked to coordination and the monitoring of reforms, maintenance and supplies agreed with the manufacturer (Series 7000, 8000 and 9000 among others).
On the other hand, the division of Metro de Madrid engaged in Maintenance and the Engineering of Rolling Stock has completed various jobs linked to energy efficiency, implantation and improvement of signalling systems, and various types of tests and trials involving virtually all the series in operation.
Finally, work continued on the “Road Map” function on the new rolling stock forming part of the 2007-2011 Improvement-Enlargement Plan. This action is intended to generate data on road maps, driver identification for access to driving and other functions useful for further applications such as ARCO, video camera display, and for traffic control and regulation using onboard auxiliary systems.
4 Signalling and communications equipment
Work also continued in 2010 to enlarge the WiFi network on lines 7, 8, 9, 10 and 11, further enhancing the possibility for mobile voice and data services through the Integrated IP Multiservice network.
63
Metrode Madrid
Projects under the Systems Master Plan and the White Book on the Security of Systems and Telecommunications have also been started with the intention of establishing the technological, regulatory and organisational framework governing Metro de Madrid’s ICT in coming years, ensuring maximum guarantees of security, efficiency and innovation, which must provide the basis for the creation of a Road Map which will make it possible to improve current services.
Finally, action has continued on the extension and upgrading not just of the TETRA digital radiotelephone system but also of the Tebatrain system; 2010 saw the start of work for the introduction of both systems on Line 6, so moving forward in the security of communication and strengthening train-ground communication. This puts Metro de Madrid in a position to provide clients with value-added services such as video-entertainment on trains with the distribution of the contents of the Metro Madrid Channel.
4 Improvement in the new operating model at the centre for maintenance operations and monitoring of installations and telecommunications (COMMIT)
A new operational maintenance model had been designed in previous years which meant a transformation in the way maintenance was done, evolving from a reactive approach to a proactive one, making the most of the supervisory and tele-maintenance capacities facilitated by the field teams themselves and in the management of the data they provide, with the aim among others of resolving some incidents in the network installations by tele-command and reducing the times for resolving incidents.
The following actions continued throughout 2010:
- To integrate the new Network stations and the new types of equipment.
- To improve the information received from the field teams.
- To implement new supervisory and tele-maintenance functions.
- To introduce new technical services and track the development of internal processes according to the rules, market standards and good practice (ISO 20000).
- The creation in the system of classification trees for the equipment and their classes, reflecting the most important incidents representing savings in the costs of intervention and displacement if resolved from the second level of COMMIT.
64
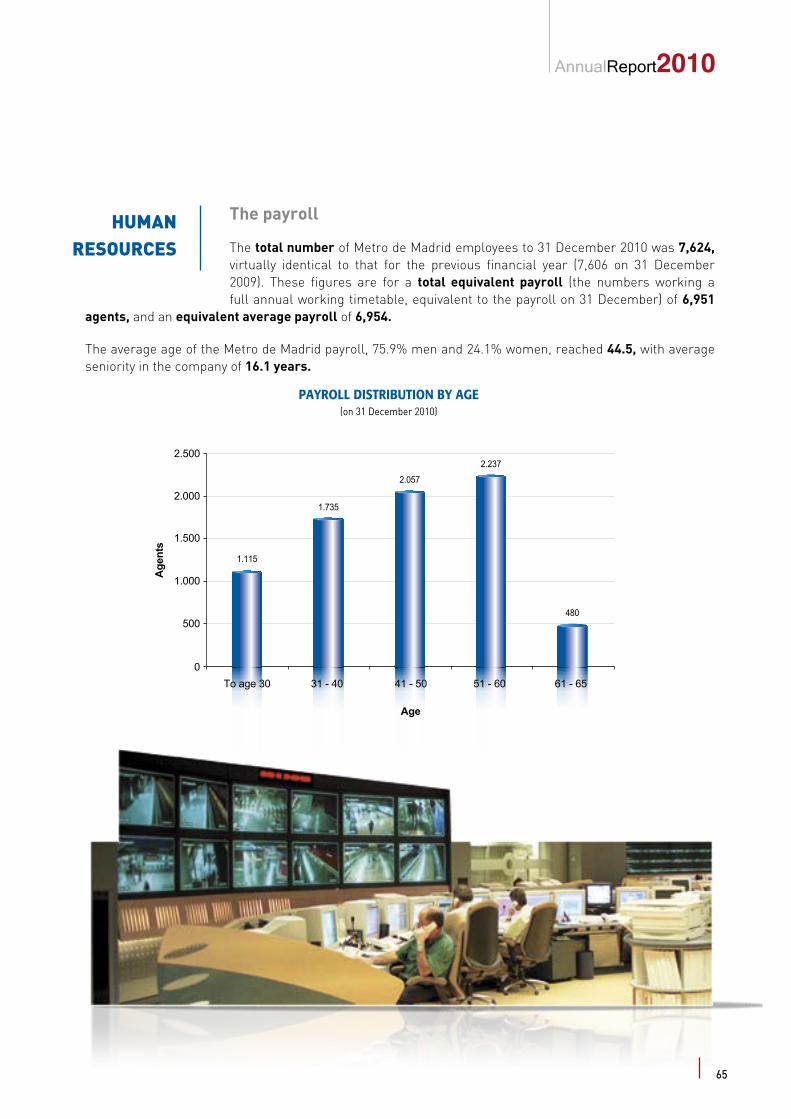
AnnualReport2010
HUMANRESOURCES
The payroll
The total number of Metro de Madrid employees to 31 December 2010 was 7,624, virtually identical to that for the previous financial year (7,606 on 31 December 2009). These figures are for a total equivalent payroll (the numbers working a full annual working timetable, equivalent to the payroll on 31 December) of 6,951
agents, and an equivalent average payroll of 6,954.
The average age of the Metro de Madrid payroll, 75.9% men and 24.1% women, reached 44.5, with average seniority in the company of 16.1 years.
PAYROLL DISTRIBUTION BY AGE(on 31 December 2010)
To age 30 31 - 40 41 - 50 51 - 60 61 - 65
2.500
2.000
1.000
500
0
1.500
Age
nts
Age
1.115
1.735
2.057
2.237
480
65
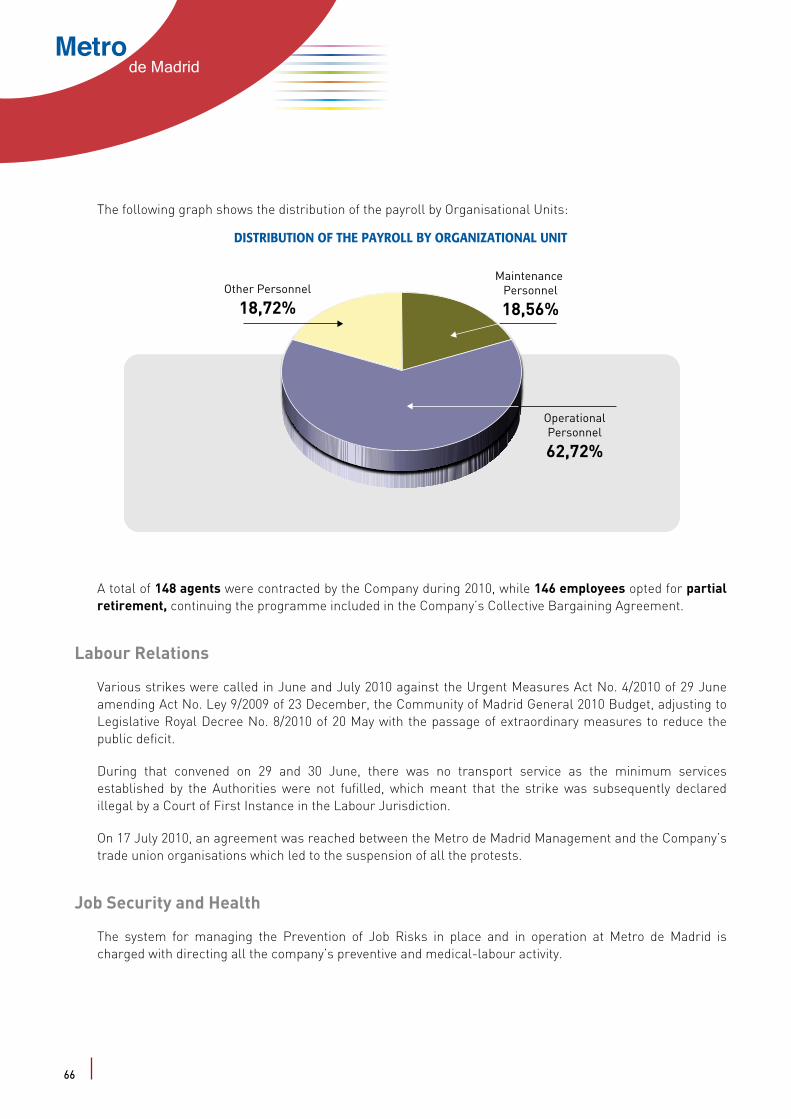
Metrode Madrid
The following graph shows the distribution of the payroll by Organisational Units:
DISTRIBUTION OF THE PAYROLL BY ORGANIZATIONAL UNIT
Other Personnel
18,72%
Maintenance Personnel
18,56%
OperationalPersonnel
62,72%
A total of 148 agents were contracted by the Company during 2010, while 146 employees opted for partial retirement, continuing the programme included in the Company’s Collective Bargaining Agreement.
Labour Relations
Various strikes were called in June and July 2010 against the Urgent Measures Act No. 4/2010 of 29 June amending Act No. Ley 9/2009 of 23 December, the Community of Madrid General 2010 Budget, adjusting to Legislative Royal Decree No. 8/2010 of 20 May with the passage of extraordinary measures to reduce the public deficit.
During that convened on 29 and 30 June, there was no transport service as the minimum services established by the Authorities were not fufilled, which meant that the strike was subsequently declared illegal by a Court of First Instance in the Labour Jurisdiction.
On 17 July 2010, an agreement was reached between the Metro de Madrid Management and the Company’s trade union organisations which led to the suspension of all the protests.
Job Security and Health
The system for managing the Prevention of Job Risks in place and in operation at Metro de Madrid is charged with directing all the company’s preventive and medical-labour activity.
66

AnnualReport2010
One of the procedures developed by the system refers to Health Monitoring and defines a comprehensive structure for medical examinations and checkups always based on the Prevention legislation and on the Prevention Services Regulations. Thus in 2010 7,338 periodic health checkups were carried out, and 238 of a more specific nature.
There were also various campaigns for the prevention of a number of conditions, to avoid harm to Metro personnel, and more important health actions. In addition, there were 168 security inspections during the year, and 377 preventive measures were put in place.
In November 2010, Metro de Madrid renewed the OHSAS 18001:2007 certification “Occupational health and safety management systems-requirements” following audit by AENOR. Also in that month, the regulation four-yearly audit was carried out, to assess the efficacy and the level of legal compliance in the field of Job Risk Prevention. The audit concluded that Metro de Madrid’s System of Job Risk Prevention Management is effective overall, and integrated into the company’s general management.
In the institutional field, Metro de Madrid is Coordinator of the EH&S group (Job Security and Health) in the Spanish Association of SAP Users and, in that context, has attended meetings and forums throughout the year to share experiences with different public bodies and companies.
The Company is also represented with one member on the Security Committee of the Spanish Maintenance Association (AEM) comprising a group of acknowledged experts whose mission is to integrate security into maintenance operations so as to provide a reference for institutions, bodies, technical and operational personnel connected with the matter. Notable among its normal activities are its action as Consultancy Committee in preparing Technical Sessions and Seminars and in the systematic readying of information for publication by the association, and to draw up reports and specialised studies.
4 Civil Defence
Linked to this field, Metro de Madrid’s efforts in the 2010 financial year focused on the following activities:
- The introduction of Self-Protection Plans on the premises at Fuencarral, Cuatro Caminos and Canillejas.
- Centralisation of the fire-fighting systems in premises, to monitor and remote-manage them from the Centralised Station Remote Control System (TCE) at the Command Post. This project will be completed in the first months of 2011.
- Elaboration of the Integral Evacuation Signalling Maintenance Plan in all the network’s tunnels, renewing and replacing more than 900 signals.
Metro has also collaborated in the training of the Community of Madrid Fire-fighter Corps, running drills in the centres at Fuencarral and Cuatro Caminos and, coordinated with Renfe’s Commuter network, at Sol station.
67

Metrode Madrid
Training
Increased use of new methodologies facilitating employee access to training continued to be a priority for Metro de Madrid, with the development and application of three new e-learning training units targeting large groups and dealing with the following subjects: Integrated Prevention Management, Service Quality and Sustainability.
The development has also continued of new functionalities in the driving simulators for dealing with incidents and breakdowns, and including driving of the new 8000 Series, among others.
Furthering steps taken in previous years, in the framework of the “Evoluciona” Strategic Project, the following lines of action have been followed during 2010:
- Monitoring and backup in the Development of the group of Metro de Madrid Managers.
- The Reinforcement Plan for the process of Development.
- Work Initiatives with Intermediates Cadres.
The following table shows the training, students and teaching hours totalised throughout the 2010 financial year, emphasising the effort to seek and receive training subsidies. To provide greater detail, the data on Internal Training (given by personnel on the Metro payroll) and those on External Training appear separately.
Training in 2010
Nº of Courses Student Nos. Hours
Internal Training 2.429 21.299 256.449
External Training 495 3.214 52.708
Total 2.924 24.513 309.157
The following table gives the 2010 training ratios.
Training Ratios 2010
Students/Course 8,38
Teaching Hours/Course 15,11
Hours/Student 12,61
Hours/Personnel Mean Equivalent 37,50
Hours/New Students 346,46
Students/Participant 4,42
Personnel Mean Equivalent 6.951
68
AnnualReport2010
In addition to training for new employees and that on internal promotion procedures, the following may be highlighted within the Company’s training activities during the year:
l Updating and Development Plan (PAD) which, in addition to updating the knowledge essential to their activity, continues the work begun in 2009 of teaching modules related to Attitude and Customer Service. In 2010, these modules targeted 327 drivers and 282 station agents with Commercial Supervisor functions.
l Simulators and videographics. The drive in previous years to develop and adapt simulators and videographics meant that 2010 was the year in which these resources were installed in the network’s classrooms. There continued to be a commitment to e-learning methodology so as to extend training to a larger number of employees while also enabling it to be more flexible.
l Pluriannual Job Risk Prevention Training Plan: This Plan continued to be implemented in 2010 in the priority groups, and the training was extended, with other related subjects (mainly related to legal provisions) as complement to the Plan. Also in 2010, a new module was incorporated, using e-learning technology, PRL Integrated Prevention Management.
l Language Training Programme: for all those with a critical need to learn or perfect a second language in order to adequately perform their job functions, including a General Language Programme, English for Executives and intensive English and French courses.
l Maintenance-related training: in 2010, the training was completed of the last 3 Multifunctional Team groups, resulting in 123 trained agents.
Internal Communication
During the 2010 financial year, Metro de Madrid made a substantial effort to transmit relevant information more openly to all staff, while also fomenting two-way communication designed to involve all those in the Company.
New initiatives were developed and internal campaigns started to make known the key projects in the corporate strategy, giving them a character of their own so as to encourage greater employee involvement. Of all these, the following were the most relevant:
l 12 lines, 12 causes: This project aims to disseminate good practice to provoke a cultural change, to learn new behaviours and to improve the sense of community. Applied to all jobs and disclosed through different channels and methodologies, it has been very well received and has become a channel of reference for the transmission of certain messages to be taken in by all staff.
The subjects dealt with in this initiative have included team work, innovation, sustainable saving, quality, equality, job risk prevention, time management and being proactive.
l Take the lid off your Idea: Designed to spread an understanding of the new model for managing Innovation in Metro de Madrid and to receive proposals from anyone in the Organisation.
69

Metrode Madrid
l All Equal: Created to make the Equality Plan known and increase employee awareness of these aspects.
l To Metro people: The slogan of the campaign inviting recognition of Metro staff who have stood out because of their professional commitment and other personal qualities.
4 Central Platform: the Metro de Madrid Employee Portal
Central Platform, the Metro de Madrid employee portal, consolidated finally in 2010 as the channel of communication between the company and its employees.
Work was completed at the beginning of the year permitting use of this tool from any equipment with Internet access, so facilitating connection to the Portal for all the employees currently without computer equipment at their work station. This measure took user numbers from 4,118 in 2009 to 5,886 in 2010, so that nearly 80% of the payroll now accesses and shares a single communication tool.
The employee portal seeks to facilitate all relevant information about the company, its strategy and management and the sector by fomenting the daily publication of news, incorporating thematic blocks such as “metros of the world”, “discover other areas”, etc., all reinforced with visual signs which are attractive to users, inviting them to read the most relevant content.
Central Platform has become a reference for employees in all matters of two-way communication, whether company-employee or employee-employee. So initiatives have been started like the Management Blog, seeking to facilitate dialogue between Metro de Madrid heads and all the employees, or another encouraging employee participation. Use of the “suggestion box” continues to be promoted; more than 450 messages were received in 2010.
Similarly, the Leisure Platform has backed specific employee campaigns such as sports, culture, solidarity, with employees’ children, etc.
All the activities and initiatives begun in the area of internal communication have been dealt with by the Internal Communication Committee set up in 2008, which also receives in ascending form the initiatives and levels of satisfaction concerning communication in the different areas of the company.
4 The Work Environment Survey
A survey was run in 2010 on the Work Environment among all Metro de Madrid employees addressed voluntarily and anonymously to learn the opinion of this stakeholder about aspects of the company which might influence their satisfaction and commitment. The 2005 survey took the pulse of Managers and Qualified Personnel, while that in 2010 was the first to target all staff.
To ensure greater participation, two channels were set up to gather these opinions: the external web and a questionnaire on paper. Nearly two thousand five hundred Metro employees (about 31% of the total) sent their opinion on various aspects relative to the Company. By groups, the participation of Managers and Qualified Personnel was notable, at 76.7%, followed by Intermediate Cadres (50.8%) and Operating Personnel (22.6%).
The overall valuation reached a score of 5.5 points out of 10, with slightly higher opinions among the support groups (6.3 points) than among the technical areas.
70

AnnualReport2010
Commitment to the company, the level of satisfaction and motivation and matters related to the metro image as a brand were, in that order, the aspects best valued in this questionnaire. On the other hand, questions connected with compensation and benefits, communication and professional development were identified as the main aspects requiring action for improvement.
The responses relative to the best-valued aspects lead to the conclusion that Metro employees are, in general, satisfied with the job stability this company offers, they demonstrate great pride in belonging and would recommend the company to a friend as a good place to work. Notable among responses to matters least valued was the perception that the company fails to acknowledge personal achievement by other than financial mechanisms and that, in general, information is received on important matters through informal channels.
Analysis of the results has allowed the corporate and specific management plans of action to be defined that will be initiated during 2011.
71
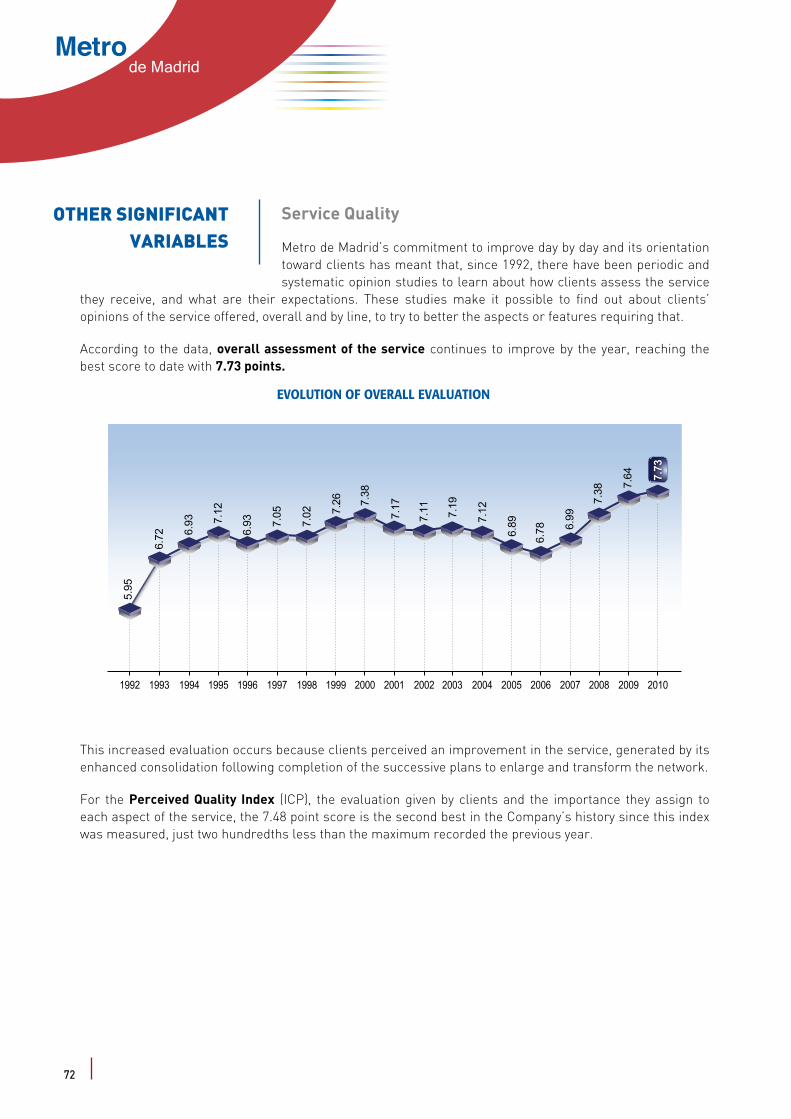
Metrode Madrid
OTHER SIGNIFICANT VARIABLES
Service Quality
Metro de Madrid’s commitment to improve day by day and its orientation toward clients has meant that, since 1992, there have been periodic and systematic opinion studies to learn about how clients assess the service
they receive, and what are their expectations. These studies make it possible to find out about clients’ opinions of the service offered, overall and by line, to try to better the aspects or features requiring that.
According to the data, overall assessment of the service continues to improve by the year, reaching the best score to date with 7.73 points.
EVOLUTION OF OVERALL EVALUATION
5.95
6.72 6.
93 7.12
6.93 7.
05
7.02 7.
26 7.38
7.17
7.11 7.19
7.12
6.89
6.78 6.
99
7.38 7.
64
2010200920082007200620052004200320022001200019991998199719961995199419931992
7.73
This increased evaluation occurs because clients perceived an improvement in the service, generated by its enhanced consolidation following completion of the successive plans to enlarge and transform the network.
For the Perceived Quality Index (ICP), the evaluation given by clients and the importance they assign to each aspect of the service, the 7.48 point score is the second best in the Company’s history since this index was measured, just two hundredths less than the maximum recorded the previous year.
72
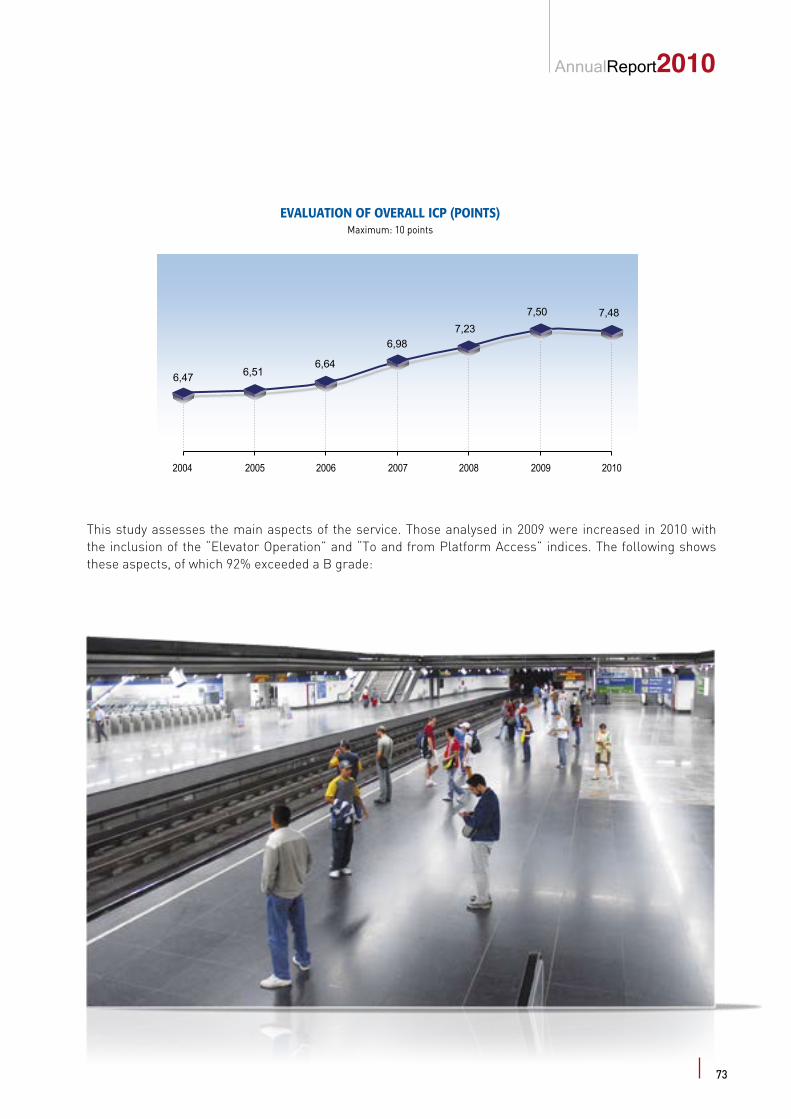
AnnualReport2010
EVALUATION OF OVERALL ICP (POINTS)Maximum: 10 points
2004 2005 2006 2007 2008 2009 2010
7,487,507,23
6,98
6,646,516,47
This study assesses the main aspects of the service. Those analysed in 2009 were increased in 2010 with the inclusion of the “Elevator Operation” and “To and from Platform Access” indices. The following shows these aspects, of which 92% exceeded a B grade:
73
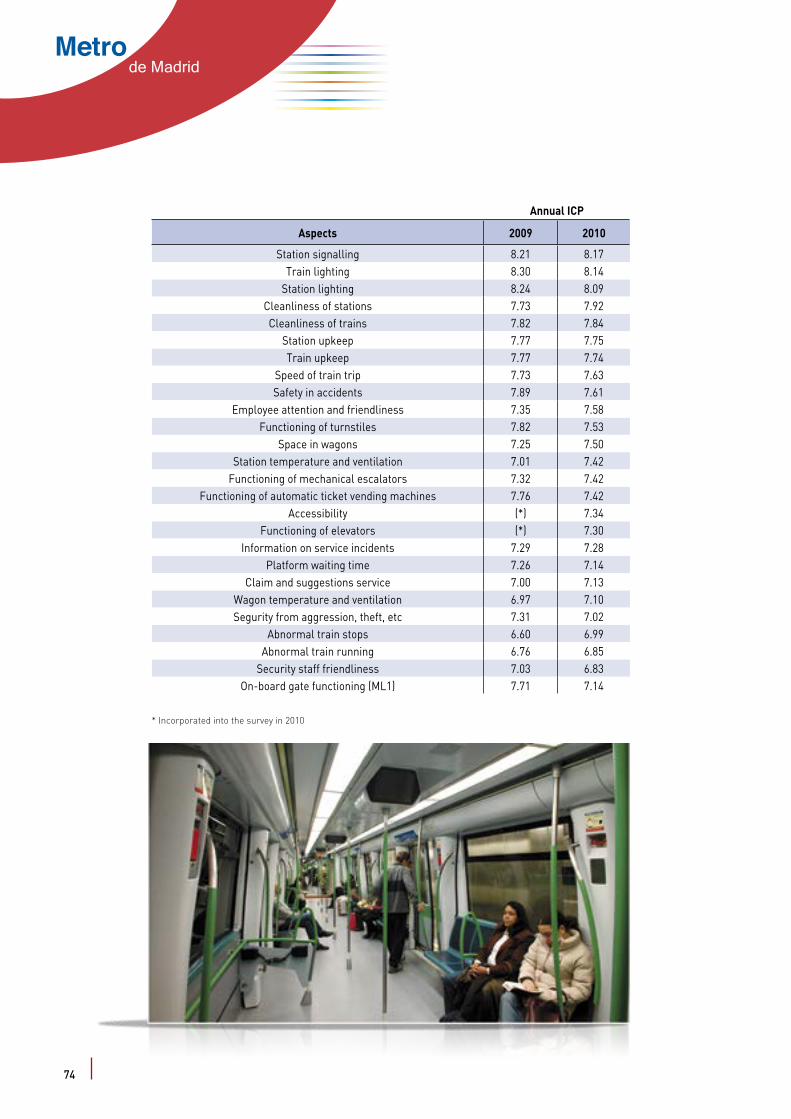
Metrode Madrid
Annual ICP
Aspects 2009 2010
Station signalling 8.21 8.17Train lighting 8.30 8.14
Station lighting 8.24 8.09Cleanliness of stations 7.73 7.92Cleanliness of trains 7.82 7.84
Station upkeep 7.77 7.75Train upkeep 7.77 7.74
Speed of train trip 7.73 7.63Safety in accidents 7.89 7.61
Employee attention and friendliness 7.35 7.58Functioning of turnstiles 7.82 7.53
Space in wagons 7.25 7.50Station temperature and ventilation 7.01 7.42
Functioning of mechanical escalators 7.32 7.42Functioning of automatic ticket vending machines 7.76 7.42
Accessibility (*) 7.34Functioning of elevators (*) 7.30
Information on service incidents 7.29 7.28Platform waiting time 7.26 7.14
Claim and suggestions service 7.00 7.13Wagon temperature and ventilation 6.97 7.10Segurity from aggression, theft, etc 7.31 7.02
Abnormal train stops 6.60 6.99Abnormal train running 6.76 6.85
Security staff friendliness 7.03 6.83On-board gate functioning (ML1) 7.71 7.14
* Incorporated into the survey in 2010
74

AnnualReport2010
Some aspects reached values representing a historic maximum, including the space available in the trains, silent-running trains, abnormal train stops, train/station temperature and ventilation, cleanliness of trains/stations, operation of mechanical escalators and attention and friendliness of the employees.
On the other hand, the Company draws up an annual indicator called the client Satisfaction Index to identify the gap between the quality of the service provided and that of the service expected, so that the lower the value of this indicator, the greater the client satisfaction. The 2010 figure was 1.08.
EVOLUTION OF S.I.
2002 2003 2004 2005 2006 2007 2008 2009 2010
1,47 1,55
2,23 2,19
1,85
1,511,44
1,171,08
Analysis of the tendency in this indicator reveals that clients are increasingly satisfied with the service received, with the best result in the historic series in 2010, backed up by the fact that 98.06% of those surveyed recommend the use of Metro de Madrid as means of transport, up on the figure for a year ago.
To measure quality in subjective aspects of the service such as cleanliness, upkeep, customer service etc., Metro de Madrid uses Mystery Shopper type techniques.
This involves the simulation of situations and scenarios by a team specialised in the technique to detect and evaluate specific and defined variables of the aspect of the service examined. There was a total of 22,540 Mystery Shopper visits in 2010, a monthly average of 1,878, gathering invaluable data for the Company’s on-going improvement.
As a complement to these, in 2010 Metro de Madrid ran other surveys to obtain its clients’ opinions about questions such as the perception of security, the information provided by Metro, its corporate website and the commercial publicity.
The Company’s efforts to offer these standards of quality have been recognised by society which places Metro de Madrid at a very high level in terms of reputation. Here, the Corporate Reputation Business Monitor (MERCO) is a world instrument of reference for evaluating reputations where the Company appears among those with the best corporate reputation operating in Spain.
75
Metrode Madrid
As the upshot of the commitment to continuous improvement in the Organisation, Metro has bettered the overall score of 7.7 out of 10 in 2009 on the TRACKINGmerco index (assessing companies from the consumers’ perspective) to 8.11 points, eight tenths above the mean for the transport sector.
4 Certifications
There was for the first time in 2010 an Integrated Audit of all the Certified Management Systems based on ISO 9001 Standards (Quality Management Systems), UNE-EN 13816 (Service Quality in Public Passenger Transport), ISO 14001 (Environmental Management System) and OHSAS 18001 (Systems for the Management of Work Safety and Health), concentrating in one month what Metro had been doing until then throughout the year. This made it possible to optimise times and the resources assigned to the systems, simplifying the certification process and its efficiency. The outcome was to detect a series of strong points which guarantee on-going improvement to the processes, reflected in the optimum result of the AENOR audit.
The Management Systems certified in Metro de Madrid according to the ISO 9001 standard are:
l Engineering Services for installations, rolling stock and auxiliary vehicles, supervision of work and redesign of the processes which are part of rail passenger transport.
l Integrated maintenance of rail rolling stock for passenger transport. Second-level integrated maintenance of electro-mechanical installations. Design, development and management of the manufacture of systems, equipment and electric rail subsets for passenger transport.
l Maintenance of the electrification, electro-mechanical and toll installations, operating systems and telecommunications. Reception and management of incidents in installations and equipment through the Centre for Maintenance Operations and Monitoring of Installations and Telecommunications (COMMIT).
l Management of contracting and the deliveries to work, services and supplies integrated with the organisation’s various departments.
l Management and direction of the design and development of IT corporate management solutions.
l Services to monitor compliance with the transport offer, the handling of incidents, information for users and coordination and supervision of tasks related to traffic.
In addition, the service of public passenger transport and maintenance of rolling stock and installations in the areas of environmental management and work safety and health are certified in turn according to standards ISO 14001 and OHSAS 18001.
76

AnnualReport2010
The service quality system, based on UNE-EN-13816 on Service Quality in public passenger transport, comprises a set of indicators making it possible to compare service quality from two points of view - client and operator.
UNE-EN-13816 Standard contains the so-called Reference Service, a management tool to monitor trends in the service, bringing together a substantial set of indicators measuring all service quality from the operator’s point of view. The basic feature of these indicators is that they are clearly client-focused.
Having passed the certification audit based on the Public Passenger Transport Quality Standard UNE-EN 13816, Metro de Madrid is now the top national metro service and internationally the largest which is certified according to this demanding standard on all the lines it operates on. The commitments taken on by Metro de Madrid are linked to the points of the standard relative to Service Offered, Accessibility, Information, Travel Times, Comfort, Security and Environmental Impact as perceived by clients in Company’s daily activity (closely related to the perception of this stakeholder of the service provided).
4 Customer service
The Company’s interest in and firm commitment to quality service encourages Metro year by year to improve aspects such the service provided to clients. In 2010, the Interactive Customer Service Centre dealt with 200,925 contacts.
77
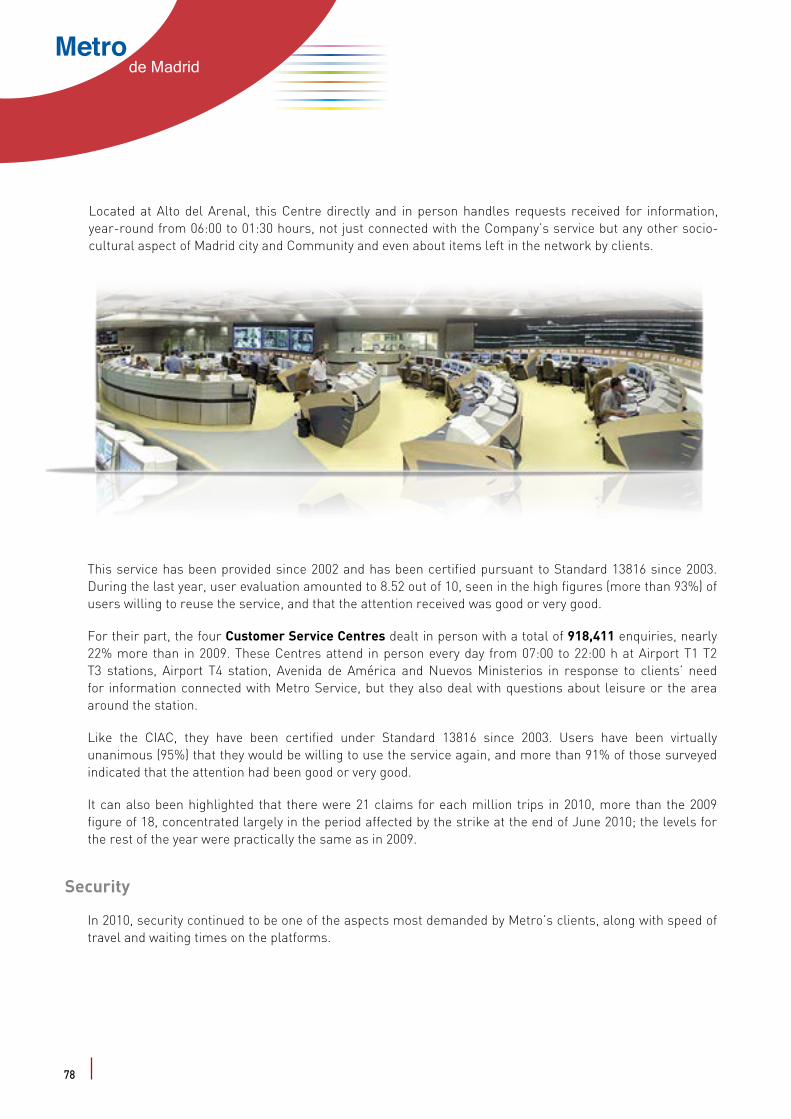
Metrode Madrid
Located at Alto del Arenal, this Centre directly and in person handles requests received for information, year-round from 06:00 to 01:30 hours, not just connected with the Company’s service but any other socio-cultural aspect of Madrid city and Community and even about items left in the network by clients.
This service has been provided since 2002 and has been certified pursuant to Standard 13816 since 2003. During the last year, user evaluation amounted to 8.52 out of 10, seen in the high figures (more than 93%) of users willing to reuse the service, and that the attention received was good or very good.
For their part, the four Customer Service Centres dealt in person with a total of 918,411 enquiries, nearly 22% more than in 2009. These Centres attend in person every day from 07:00 to 22:00 h at Airport T1 T2 T3 stations, Airport T4 station, Avenida de América and Nuevos Ministerios in response to clients’ need for information connected with Metro Service, but they also deal with questions about leisure or the area around the station.
Like the CIAC, they have been certified under Standard 13816 since 2003. Users have been virtually unanimous (95%) that they would be willing to use the service again, and more than 91% of those surveyed indicated that the attention had been good or very good.
It can also been highlighted that there were 21 claims for each million trips in 2010, more than the 2009 figure of 18, concentrated largely in the period affected by the strike at the end of June 2010; the levels for the rest of the year were practically the same as in 2009.
Security
In 2010, security continued to be one of the aspects most demanded by Metro’s clients, along with speed of travel and waiting times on the platforms.
78
AnnualReport2010
The drive in this area was seen in the more than 3.8 million hours’ surveillance designed mainly to ensure strong preventive action in any incident involving clients and employees.
There were in the network in 2010 more than 7,000 interventions with the National Police, 1,400 with the Municipal Police, and more than 5,000 people received medical attention involving SAMUR. Also in 2010, as a result of the agreement between Madrid City Corporation and Metro de Madrid, SAMUR receive two MOBILE INTENSIVE CARE ambulances funded by Metro.
Of note has been the important coordination work with the State Law Enforcement Agencies, particularly with the National Police Force where action significantly included more than 890 video reports for the Police in their investigation and clarification of offences all over Madrid, and a Course followed by a drill with the GEO, in addition to the daily coordination work with the National Police Force’s Mobile Brigade in Madrid.
In 2010, Metro de Madrid was authorised to standardise the uniforms all the security agents providing services to the Company, independently of the company they belong to. Metro’s agents this year wore a high-visibility uniform predominantly orange in colour and with photoluminescent components in its design. Following an extended procedure and negotiations and based on the special circumstances of this security service, the Ministry of the Interior granted Metro de Madrid this authorisation, so far the only one conferred on a company since Private Security appeared in society more than 40 years ago.
Finally, tenders were called in 2010 for nearly all Metro surveillance services which, to enhance the level of service offered to clients, redistributed these services in line with Metro’s current needs. This means, among other factors, the presence of security personnel in each and every one of the stations in the network throughout the public service timetable.
Rail Traffic Safety
Rail Traffic Safety is a key element in Metro de Madrid’s strategy and activity, as well as an essential requisite for it to fulfil its mission. In addition to high levels of comfort and speed, present-day society its particularly sensitive to any incidents or accidents so that, as part of Metro de Madrid’s commitment to be “the socially most beneficial mobility option”, it is essential to increasingly ensure greater rail safety.
Thus, and continuing with the definition and implantation of a Rail Traffic Safety Management System, Metro de Madrid’s 2010 activities have included the following:
l Revision and updating of the Metro and Light Metro Safety Provisions.
l Definition of the process to certify driving staff.
l Development of the process for Investigating Rail Traffic Accidents and Incidents.
l Definition and monitoring of the qualitative and quantitative objectives of rail safety, for on-going improvement.
79

Metrode Madrid
l Modification and drafting of Technical Standards for use of test channels including CBTC and Light Metro systems.
l Collaboration with national rail operators in the SEFER working group whose main objective is to pool the various operational aspects to adopt similar criteria and homogeneous measures.
Properties
An agreement was reached in 2010 between Madrid City Corporation and Metro de Madrid to adapt and upgrade some Metro premises which have deteriorated seriously, to the detriment of the city’s image and architecture.
Computer Projects
Among others, in 2010 the following IT projects were developed:
4 SMS message console
There has since mid-2009 been an application in production and at the disposal of various of the Company’s Organisational Units for management and delivery of messages to mobiles with information needed to optimise activity in those areas.
80
AnnualReport2010
l Modification and drafting of Technical Standards for use of test channels including CBTC and Light Metro systems.
l Collaboration with national rail operators in the SEFER working group whose main objective is to pool the various operational aspects to adopt similar criteria and homogeneous measures.
Properties
An agreement was reached in 2010 between Madrid City Corporation and Metro de Madrid to adapt and upgrade some Metro premises which have deteriorated seriously, to the detriment of the city’s image and architecture.
Computer Projects
Among others, in 2010 the following IT projects were developed:
4 SMS message console
There has since mid-2009 been an application in production and at the disposal of various of the Company’s Organisational Units for management and delivery of messages to mobiles with information needed to optimise activity in those areas.
During the first quarter of 2010, new functionalities were introduced to the application which allow greater flexibility in the administration of groups, providing greater information on activity and enhancing the security controls on such activity.
4 Implantation of new functionalities of the Electronic Tendering System (SRM)
The SRM system is used to manage corporate electronic tendering and, as a result of the development of Contracting procedures, new critical functionalities have been identified for development of the activity and whose introduction was completed during 2010. Notable among others are the following:
l Access to tender documentation. Specifications bids submitted.
l Automation of the process to include tenderers in tenders published.
l Automation of SRM user admission.
4 Computer-Assisted Education Unit Management Module
An application was completed in 2010 designed to facilitate management of computer-assisted training. This new development makes mainly the following possible:
l Provision of a shared management motor for the future Computer-Assisted Education Units (UEAO) integrated with the SAP/R3 corporate system.
l To adapt the length of each course to the contents programmed at any time.
l To standardise content for all groups involved.
l To assess the level of understanding of course subject-matter.
l To optimise the frequency of attendance at training classes by line personnel.
4 New functionalities on the www.metromadrid.es website
New functionalities were introduced this year on the www.metromadrid website, providing new utilities to users, notably the following:
l Information on emblematic installations and closed accesses.
l A news search-engine, and printing of historic plans.
l Improvements linked to communication with suppliers.
4 Implantation of new functionalities to Manage Collection and Sale
The GESREVE application (Collection and Sale Management) controls and handles the collection and sale of tickets on the network through both automatic vending machines and in ticket-office sales. 2010 saw the inclusion of processes which also increased the volume and type of data for processing, influenced the quality of the information received and considerably enhanced the financial control and the reliability of the information.
81

Metrode Madrid
4 Drafting of the White Paper on IT Security
The White Paper on IT Security will provide the basis for the creation of the Security Management System process, integrating all areas of IT including the following:
l Risk management.
l Revision of security-related processes.
l Definition of the IT Security policy.
l The Service Continuity Plan.
All that is coordinated with IT Security strategic projects such as Track Excellence and with other Metro de Madrid projects like Corporate Risk Management. Planned to last 26 months, the project will continue until 2012.
4 SAP/R3 change of version
The project was developed in 2010 to change the version of the Integrated Corporate Management System based on the SAP R/3 application serving some 1,300 direct internal users and 7,300 indirect.
Because of the special features of various areas providing permanent service year-round which are unable to stop operating as the version is changed, it was necessary to design parallel migration systems to enable these areas to continue their services without interruption.
4 Proyecto ARCO
As part of Metro de Madrid’s daily operations, it is necessary to manage the allocation of a driver to each train and the point for taking up and relieving services. The greater number of trains following the latest enlargement plans has increased the number of drivers to be managed on each line. As a result, although the Line Technicians’ working methodology on driver relief is correct, the volume of information they must handle far exceeds the capacity of the tools available until now.
The following are the objectives of the system:
l To automate routine tasks to enable Metro de Madrid personnel to focus their attention on other more complex tasks such as the monitoring and resolution of train and installation breakdowns.
l To facilitate driver relief work.
l To standardise working methodologies.
l To standardise all the information generated in one IT support.
l To improve personnel management in rotations.
82
AnnualReport2010
l To improve rolling stock management.
l To secure data on daily management relative to train movement and driving, individually or collectively.
ARCO also helps to optimise manoeuvre times and raise commercial speed and transport capacity. Development of the application began in 2009 and continued in 2010, and it is planned to bring it into production in the first months of 2011.
4 Feasibility Study for the introduction of RFID technology in Metro de Madrid and a pilot study in 3 diferent scenarios
With the main aim of assessing the feasibility of implanting RFID technology (Radio Frequency IDentification) in Metro de Madrid’s Stores, a concept test has been run to introduce this technology in 3 different scenarios:
l Automatic updating of consumption in Peripheral Stores, to increase the reliability of the stock stored and optimise the associated management costs by suggesting the labelling of all the stock with cards incorporating RFID technology, placing an arc-shaped fixed reader at the store material access, so automatically updating the data base and releasing Metro personnel from various tasks.
l Running of inventories in Peripheral Stores, aimed at preparing rapid, reliable inventories at the Alcance store, Canillejas.
l Identification of repairable spares for installation maintenance: the possibility, using a label, of identifying virtually all repairable spares throughout their entire life cycle, and facilitating recovery of the data recorded using a portable terminal for on-going operation.
Projects overseas
Extension plans undertaken since 1995 have installed Metro de Madrid as a reference for companies and bodies worldwide representing all rail transport-related areas: administrations, concession holders, financers, constructors, manufacturers, etc.
The efficiency demonstrated in relation to both construction costs and startup deadlines, the technological standard of the new infrastructures and the quality of the service offered have led to a general desire to learn about and apply the methodology so successfully used in the Enlargement, known around the world as the “Madrid case”.
As a result, Metro de Madrid has secured a leading position in the sector, both technologically and organisationally, in management and operation, generating a large number of requests for technical advice, the design of all sorts of projects, line operation and/or maintenance etc.
For this reason, in recent years Metro de Madrid has done jobs for bodies and companies (Overseas Activities) incorporated into its corporate strategy given form in the CMI, many of them operating in fields of action outside the Community of Madrid.
83
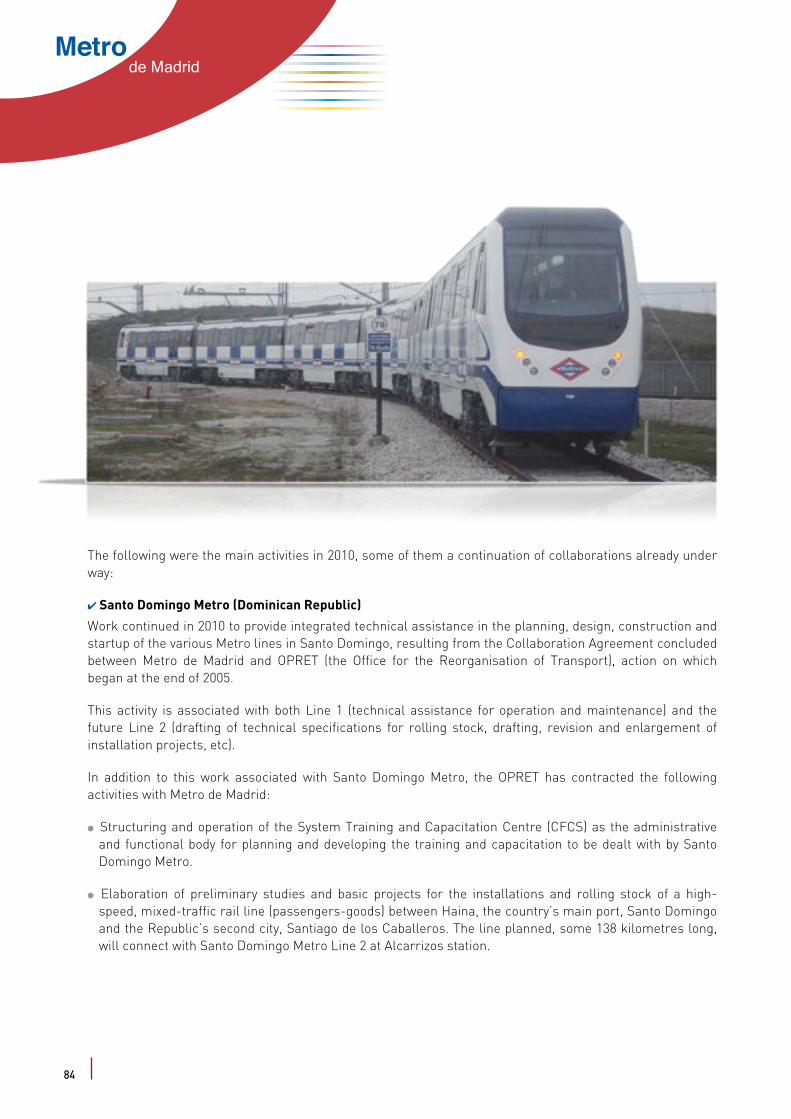
Metrode Madrid
The following were the main activities in 2010, some of them a continuation of collaborations already under way:
4 Santo Domingo Metro (Dominican Republic)
Work continued in 2010 to provide integrated technical assistance in the planning, design, construction and startup of the various Metro lines in Santo Domingo, resulting from the Collaboration Agreement concluded between Metro de Madrid and OPRET (the Office for the Reorganisation of Transport), action on which began at the end of 2005.
This activity is associated with both Line 1 (technical assistance for operation and maintenance) and the future Line 2 (drafting of technical specifications for rolling stock, drafting, revision and enlargement of installation projects, etc).
In addition to this work associated with Santo Domingo Metro, the OPRET has contracted the following activities with Metro de Madrid:
l Structuring and operation of the System Training and Capacitation Centre (CFCS) as the administrative and functional body for planning and developing the training and capacitation to be dealt with by Santo Domingo Metro.
l Elaboration of preliminary studies and basic projects for the installations and rolling stock of a high-speed, mixed-traffic rail line (passengers-goods) between Haina, the country’s main port, Santo Domingo and the Republic’s second city, Santiago de los Caballeros. The line planned, some 138 kilometres long, will connect with Santo Domingo Metro Line 2 at Alcarrizos station.
84
AnnualReport2010
4 Quito Metro (Republic of Ecuador)
On 21 October 2009, the Community of Madrid and the municipality of Quito signed a General Protocol for collaboration between the parties to provide the Metropolitan Area of the Municipality of the Metropolitan District of Quito with an integrated quality transport system. This agreement allows the municipality to benefit from the Community of Madrid’s accumulated experience and know-how in the field, with the intervention of entities from its public sector, thereby fomenting the creation of collaboration in the financial links between the parties.
With the implementation of that General Protocol and the conclusion of the process for the Contracting of Consultancy called for the purposes, the Metropolitan Public Corporation for Mobility and Public Works (EPMMOP) created by the Municipality of Quito Metropolitan District awarded Metro de Madrid the services for “Studies for the Conceptual Design of the Quito Integrated Mass Transport System and Feasibility of the First Line of Quito Metro”.
The work begun at the end of October 2010 will continue during the first half of 2011.
4 Parla Trantrack
Also originating in previous years are the services Metro de Madrid is developing through the Joint Venture with Alstom for the Parla Trantrack, to maintain and conserve the rolling stock and installations on Line 1.
4 West Light Metro (MLO)
Since opening in July 2007, Metro de Madrid has been providing services through the Joint Venture with Alstom for maintenance and upkeep of rolling stock and production resources of the workshop for the Light Metro lines to Pozuelo and Boadilla.
4Line 8, Barajas – T4
Metro de Madrid has also been collaborating since May 2007 with Operalia Infraestructuras in the maintenance and upkeep of the installations on the Barajas –T4 section of Line 8.
4 Dublin North Metro
The Metro North line is the first which will be built in the city of Dublin, forming part of the Transport 21 programme designed to renew the entire Irish transport system. The project is headed by the RPA (representing the Administration) which will publish the tender specifications and decide on the winning consortium. There are 2 groups of pre-qualified consortiums:
l CMG Celtic Metro Group (Iridium, Mitsui, OHL and Soares da Costa).
l Dublin Express Link (Acciona and Keolis).
Metro de Madrid is collaborating with the former, initially as technical consultant for preparation and submission of the tender. Subsequently, should it win, Metro de Madrid could collaborate as technical adviser during the development of the design project, construction and startup.
85

Metrode Madrid
OVERSEASRELATIONS
Metro de Madrid is internationally recognised as an exporter of know-how and technology to other world metro and transport systems and is therefore an international reference not just in the operation of the service but also in maintenance and research. The many visits by foreign delegations are a further demonstration of the position of Madrid as
a reference point for transport systems, allowing for the exchange of experience and practice. Awards are also an acknowledgement of the work, drive and commitment of Metro’s professionals and, in turn, reinforce the Company’s image and reputation.
Prizes and Media Profile
4 Prizes
Metro de Madrid has been rewarded for excellence in its management with the prize for “Madrid Excelente a la Confianza de los Clientes” granted by the Madrid Excellence Foundation which recognises the ten best companies in the Community of Madrid distinguished during the year in the quest for and attainment of high levels of excellence in their daily operation.
The Company had won special mention in the first edition of the “Madrid Excelente” Awards in 2005 in recognition of its on-going search for excellence, commitment and the drive to succeed.
Also as a pioneer in the transport sector in the startup of geothermal facilities, Metro de Madrid won the award for the “best geothermal installation in the industrial and services sector in the Community of Madrid” during the Seventh Annual Congress of the “Rafael Mariño Chair of New Energy Technologies”.
The Chair felt it appropriate to present the university community and professionals with the potential of the earth’s subsoil in providing a readily-available renewable energy which is economically satisfactory and with minimum environmental impact, with the example of the Metro facility at Pacífico station.
Metro de Madrid also won the “Diamante de la compra” award in the public sector category granted by the Spanish Association of Professionals in Procurement, Contracting and Provision (AERCE). The association’s prizes reward the work of those involved in Procurement and the institutions which stand out for their support and development in the field, in this sense a clear instrument for the disclosure of the best entrepreneurial practice and in promoting procurement as a key function in organisations. On the other hand, Metro de Madrid was fifty-third
86
AnnualReport2010
this year in the study of “Pulse España 2010 Reputación, the 100 companies with the best reputation in Spain”, an international ranking assessing national companies in terms of reputation and in which Metro de Madrid is the only one of exclusively regional scope to appear on the list.
The “Reputación Pulse España 2010” report is part of the Global Reputation Pulse Study 2010 carried out by the Reputation Institute in 34 countries, measuring the admiration, respect and trust generated by a company among its stakeholders.
Metro de Madrid’s score was 69.85, above the 64.82 overall average of companies in the sector of infrastructures, engineering and construction, and the 67.7 average of transport and logistics companies.
4 Media Profile
The strikes in June and July and their consequences took up a substantial part of the information which appeared on Metro de Madrid in all local, national and international media in 2010, arousing very wide news interest because of the consequences for the public arising from this situation.
However, other cultural and service information related to Metro de Madrid also won considerable space in the news media. The arrival of the new series 8,000 trains on Line 6, information concerning innovation such as the installation of the CBTC system or the activity of COMMIT, the introduction of the Commercial Supervisor, the work at Ópera or the extension of Line 11 to La Fortuna all generated expectation in the media.
Culturally notable because of its wide media repercussion was the organisation of the First Photographic Competition Metro desde tu Móvil (with reports on national television news) among others.
A major innovation in this sense has been the recent presence of Metro de Madrid in the social networks with the creation of the Company’s official Facebook page, consolidating as a new channel for information and to promote the Company overseas. In 2011, Metro enlarged its presence including new profiles in other social networks.
National and international associations
Throughout 2010, participation continued in the meetings of various national and international transport bodies such as the UITP (International Association of Public Transport), with involvement in a number of Committees and Subcommittees of the Assembly of Metros, while continuing in one of the Vice-Presidencies.
Metro de Madrid holds the General Secretariat of ALAMYS (the Latin American Metro and Underground Association) where it has attended a number of meetings during the year.
It also has two members on the Board of the Trustees of the Spanish Rail Foundation, attending various meetings, as well as those of the Rail Action Association (CETRAIN).
Metro de Madrid is a member and holds a post on the Executive Committee of ATUC (the Collective Urban Transport Association), having attended that Executive Committee’s meetings and those of other Committees.
87
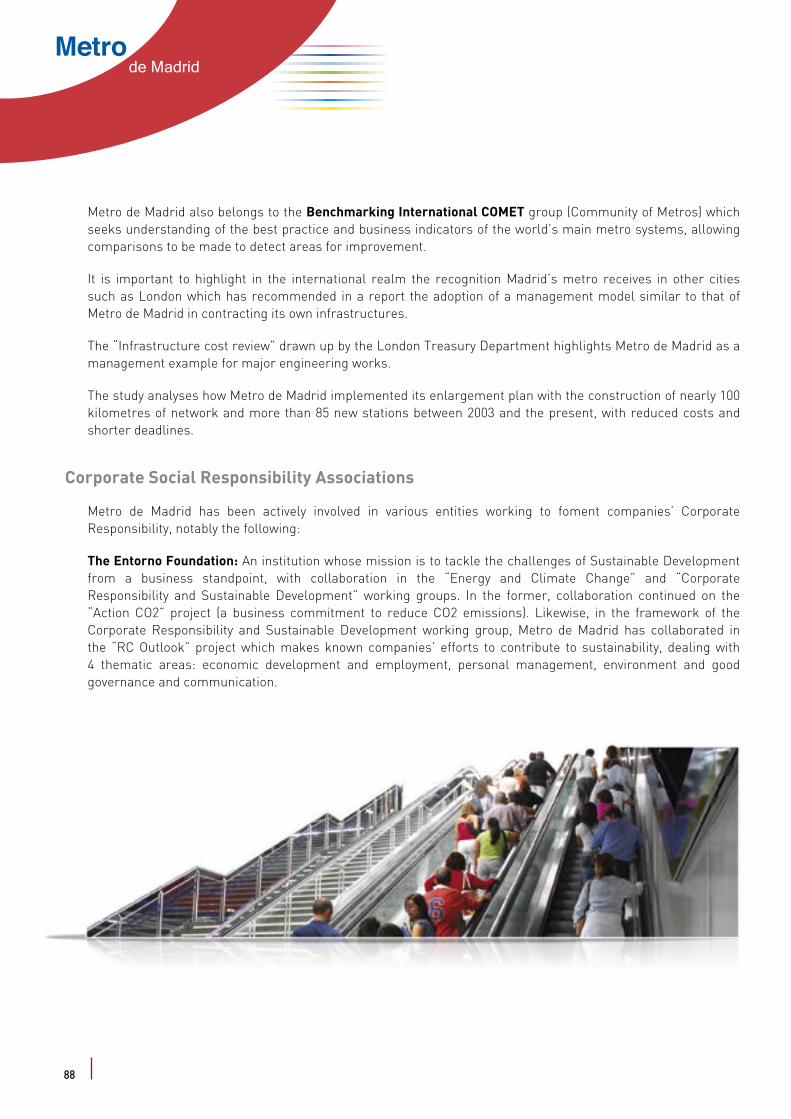
Metrode Madrid
Metro de Madrid also belongs to the Benchmarking International COMET group (Community of Metros) which seeks understanding of the best practice and business indicators of the world’s main metro systems, allowing comparisons to be made to detect areas for improvement.
It is important to highlight in the international realm the recognition Madrid’s metro receives in other cities such as London which has recommended in a report the adoption of a management model similar to that of Metro de Madrid in contracting its own infrastructures.
The “Infrastructure cost review” drawn up by the London Treasury Department highlights Metro de Madrid as a management example for major engineering works.
The study analyses how Metro de Madrid implemented its enlargement plan with the construction of nearly 100 kilometres of network and more than 85 new stations between 2003 and the present, with reduced costs and shorter deadlines.
Corporate Social Responsibility Associations
Metro de Madrid has been actively involved in various entities working to foment companies’ Corporate Responsibility, notably the following:
The Entorno Foundation: An institution whose mission is to tackle the challenges of Sustainable Development from a business standpoint, with collaboration in the “Energy and Climate Change” and “Corporate Responsibility and Sustainable Development” working groups. In the former, collaboration continued on the “Action CO2” project (a business commitment to reduce CO2 emissions). Likewise, in the framework of the Corporate Responsibility and Sustainable Development working group, Metro de Madrid has collaborated in the “RC Outlook” project which makes known companies’ efforts to contribute to sustainability, dealing with 4 thematic areas: economic development and employment, personal management, environment and good governance and communication.
88
AnnualReport2010
Metro de Madrid also belongs to the Benchmarking International COMET group (Community of Metros) which seeks understanding of the best practice and business indicators of the world’s main metro systems, allowing comparisons to be made to detect areas for improvement.
It is important to highlight in the international realm the recognition Madrid’s metro receives in other cities such as London which has recommended in a report the adoption of a management model similar to that of Metro de Madrid in contracting its own infrastructures.
The “Infrastructure cost review” drawn up by the London Treasury Department highlights Metro de Madrid as a management example for major engineering works.
The study analyses how Metro de Madrid implemented its enlargement plan with the construction of nearly 100 kilometres of network and more than 85 new stations between 2003 and the present, with reduced costs and shorter deadlines.
Corporate Social Responsibility Associations
Metro de Madrid has been actively involved in various entities working to foment companies’ Corporate Responsibility, notably the following:
The Entorno Foundation: An institution whose mission is to tackle the challenges of Sustainable Development from a business standpoint, with collaboration in the “Energy and Climate Change” and “Corporate Responsibility and Sustainable Development” working groups. In the former, collaboration continued on the “Action CO2” project (a business commitment to reduce CO2 emissions). Likewise, in the framework of the Corporate Responsibility and Sustainable Development working group, Metro de Madrid has collaborated in the “RC Outlook” project which makes known companies’ efforts to contribute to sustainability, dealing with 4 thematic areas: economic development and employment, personal management, environment and good governance and communication.
Forética: The mission of this Spanish organisation, a reference in Corporate Responsibility, is to foment the management ethic and social responsibility in organisations. Metro de Madrid, as well as a promoter partner of this body since 2009, participated in 2010 in the Forum for Sustainable Economic Development held in Seville, making known the Company’s contribution to the region’s sustainable mobility. Moreover, the Company participated in the Social Responsibility Business Market – Marketplace 2010 – organised by Forética in September, with the presentation of two projects: “Geothermal Air Conditioning at Pacífico station” and “Application of the 5 “S” methodology in Metro de Madrid’s stores”. The first of these was also presented at the European edition – Enterprise 2020 Marketplace – held on 28 October in Brussels.
Forum of Rail Companies for Sustainability (FEFS): This is a group of entities which pursue their activity in the rail sector, with the main aim of contributing to the development of sustainable mobility in Spain by coordinating and combining member companies’ management strategies.
Metro de Madrid, which took over the Forum’s Secretariat General, participated in the following working groups:
l Energy Efficiency.
l Accessibility.
l Environmental action at work projects.
l Communicating Sustainability.
l Noise and vibrations.
l Corporate Social Responsibility (CSR).
The Company is represented in all the working groups, leading coordination of those dealing with Noise and Vibrations and CSR.
The CONAMA Foundation: Metro de Madrid collaborates with this entity which every two years organises the National Environment Congress (CONAMA, Sustainable Development Summit) last held in November 2010 in Madrid with the Company present at:
l A stand in the exhibition zone making environmental policy and efficient resource management known.
l The round table on “Sustainability and global development”.
l Presentation of a technical communication on the Social Benefit Index, an indicator developed by Metro de Madrid.
The International Association of Public Transport (UITP): in 2009, Metro de Madrid participated in the working group organised to define indicators on companies’ contribution to Sustainable Development. Then, in 2010, it collaborated in the report on those indicators as signatory since 2005 to the Sustainable Development Charter.
The Corporate Reputation Forum (fRC): in 2010, Metro de Madrid collaborated in different workshops and seminars along with remaining fRC member companies, sharing know-how on the multiple aspects of reputation management involving various areas of the Organisation.
89
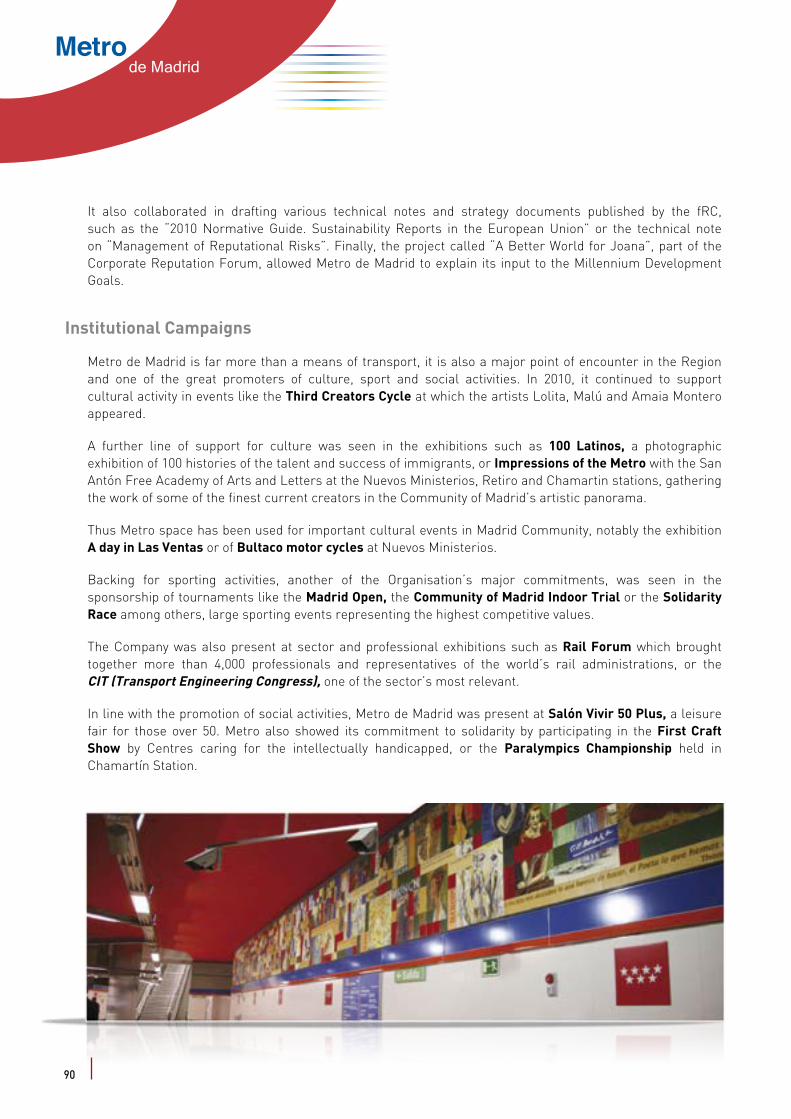
Metrode Madrid
It also collaborated in drafting various technical notes and strategy documents published by the fRC, such as the “2010 Normative Guide. Sustainability Reports in the European Union” or the technical note on “Management of Reputational Risks”. Finally, the project called “A Better World for Joana”, part of the Corporate Reputation Forum, allowed Metro de Madrid to explain its input to the Millennium Development Goals.
Institutional Campaigns
Metro de Madrid is far more than a means of transport, it is also a major point of encounter in the Region and one of the great promoters of culture, sport and social activities. In 2010, it continued to support cultural activity in events like the Third Creators Cycle at which the artists Lolita, Malú and Amaia Montero appeared.
A further line of support for culture was seen in the exhibitions such as 100 Latinos, a photographic exhibition of 100 histories of the talent and success of immigrants, or Impressions of the Metro with the San Antón Free Academy of Arts and Letters at the Nuevos Ministerios, Retiro and Chamartin stations, gathering the work of some of the finest current creators in the Community of Madrid’s artistic panorama.
Thus Metro space has been used for important cultural events in Madrid Community, notably the exhibition A day in Las Ventas or of Bultaco motor cycles at Nuevos Ministerios.
Backing for sporting activities, another of the Organisation’s major commitments, was seen in the sponsorship of tournaments like the Madrid Open, the Community of Madrid Indoor Trial or the Solidarity Race among others, large sporting events representing the highest competitive values.
The Company was also present at sector and professional exhibitions such as Rail Forum which brought together more than 4,000 professionals and representatives of the world’s rail administrations, or the CIT (Transport Engineering Congress), one of the sector’s most relevant.
In line with the promotion of social activities, Metro de Madrid was present at Salón Vivir 50 Plus, a leisure fair for those over 50. Metro also showed its commitment to solidarity by participating in the First Craft Show by Centres caring for the intellectually handicapped, or the Paralympics Championship held in Chamartín Station.
90
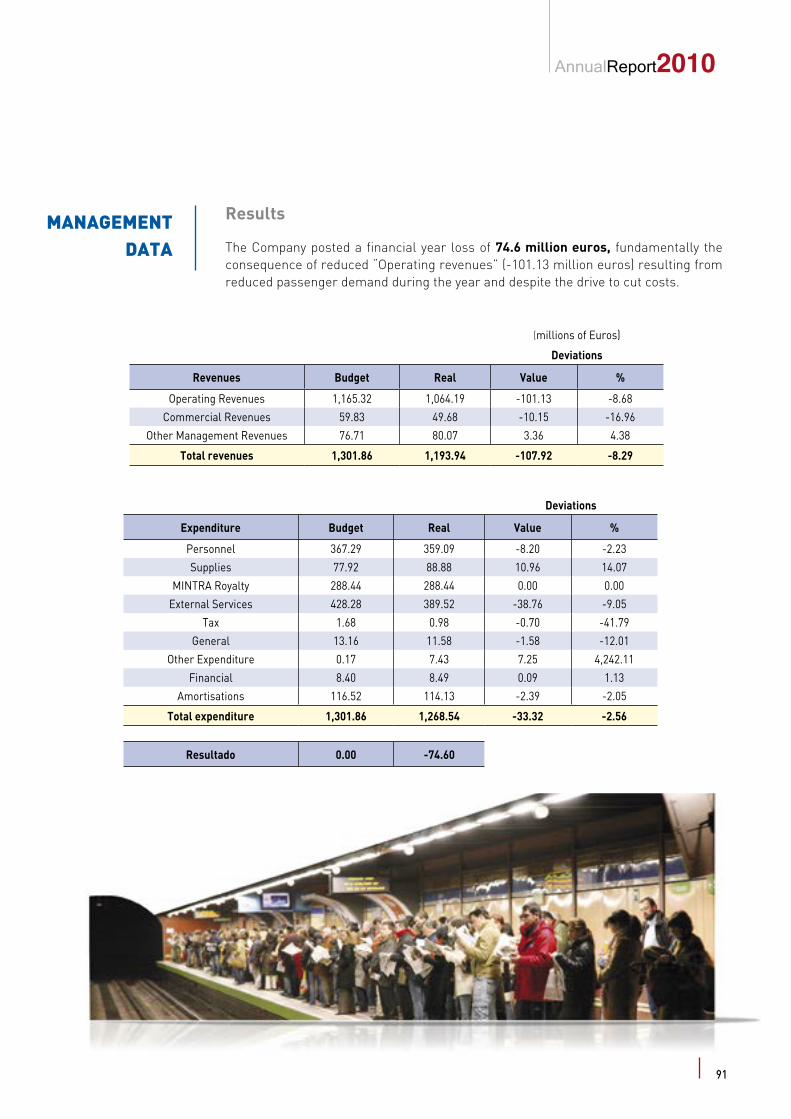
AnnualReport2010
It also collaborated in drafting various technical notes and strategy documents published by the fRC, such as the “2010 Normative Guide. Sustainability Reports in the European Union” or the technical note on “Management of Reputational Risks”. Finally, the project called “A Better World for Joana”, part of the Corporate Reputation Forum, allowed Metro de Madrid to explain its input to the Millennium Development Goals.
Institutional Campaigns
Metro de Madrid is far more than a means of transport, it is also a major point of encounter in the Region and one of the great promoters of culture, sport and social activities. In 2010, it continued to support cultural activity in events like the Third Creators Cycle at which the artists Lolita, Malú and Amaia Montero appeared.
A further line of support for culture was seen in the exhibitions such as 100 Latinos, a photographic exhibition of 100 histories of the talent and success of immigrants, or Impressions of the Metro with the San Antón Free Academy of Arts and Letters at the Nuevos Ministerios, Retiro and Chamartin stations, gathering the work of some of the finest current creators in the Community of Madrid’s artistic panorama.
Thus Metro space has been used for important cultural events in Madrid Community, notably the exhibition A day in Las Ventas or of Bultaco motor cycles at Nuevos Ministerios.
Backing for sporting activities, another of the Organisation’s major commitments, was seen in the sponsorship of tournaments like the Madrid Open, the Community of Madrid Indoor Trial or the Solidarity Race among others, large sporting events representing the highest competitive values.
The Company was also present at sector and professional exhibitions such as Rail Forum which brought together more than 4,000 professionals and representatives of the world’s rail administrations, or the CIT (Transport Engineering Congress), one of the sector’s most relevant.
In line with the promotion of social activities, Metro de Madrid was present at Salón Vivir 50 Plus, a leisure fair for those over 50. Metro also showed its commitment to solidarity by participating in the First Craft Show by Centres caring for the intellectually handicapped, or the Paralympics Championship held in Chamartín Station.
MANAGEMENTDATA
Results
The Company posted a financial year loss of 74.6 million euros, fundamentally the consequence of reduced “Operating revenues” (-101.13 million euros) resulting from reduced passenger demand during the year and despite the drive to cut costs.
(millions of Euros)
Deviations
Revenues Budget Real Value %
Operating Revenues 1,165.32 1,064.19 -101.13 -8.68
Commercial Revenues 59.83 49.68 -10.15 -16.96
Other Management Revenues 76.71 80.07 3.36 4.38
Total revenues 1,301.86 1,193.94 -107.92 -8.29
Deviations
Expenditure Budget Real Value %
Personnel 367.29 359.09 -8.20 -2.23
Supplies 77.92 88.88 10.96 14.07
MINTRA Royalty 288.44 288.44 0.00 0.00
External Services 428.28 389.52 -38.76 -9.05
Tax 1.68 0.98 -0.70 -41.79
General 13.16 11.58 -1.58 -12.01
Other Expenditure 0.17 7.43 7.25 4,242.11
Financial 8.40 8.49 0.09 1.13
Amortisations 116.52 114.13 -2.39 -2.05
Total expenditure 1,301.86 1,268.54 -33.32 -2.56
Resultado 0.00 -74.60
91
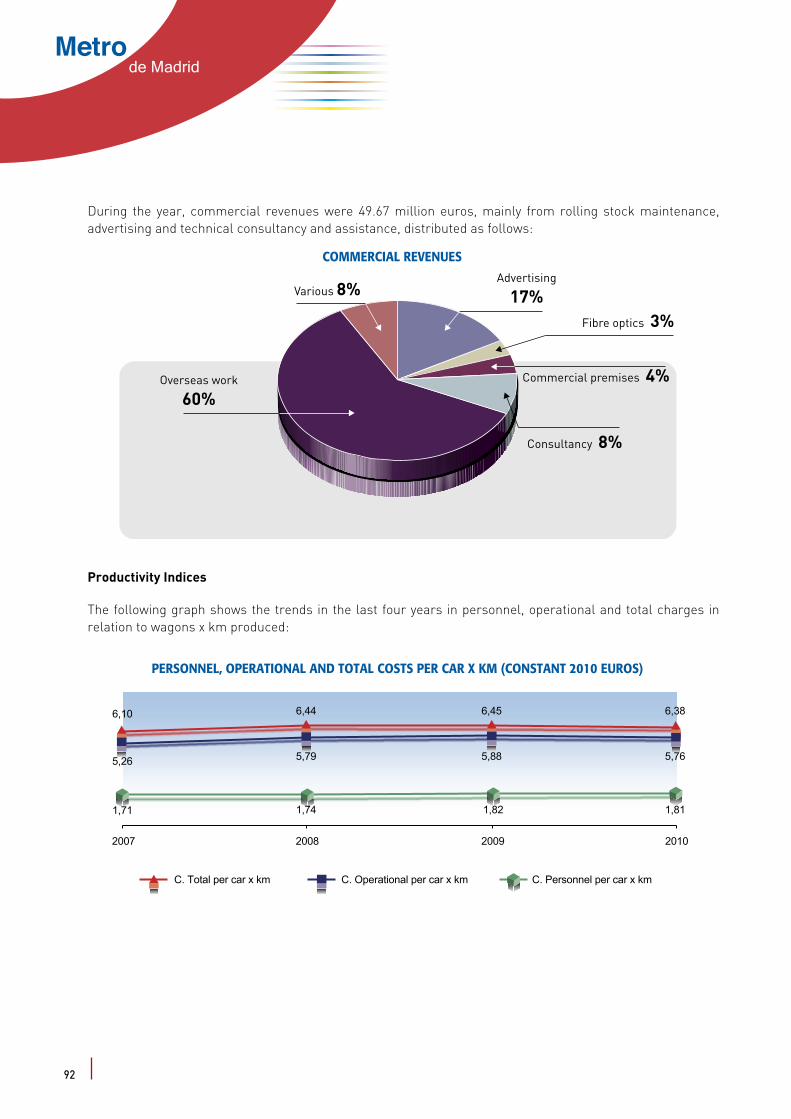
Metrode Madrid
During the year, commercial revenues were 49.67 million euros, mainly from rolling stock maintenance, advertising and technical consultancy and assistance, distributed as follows:
COMMERCIAL REVENUES
Overseas work
60%
Advertising
17%Various 8%
Consultancy 8%
Commercial premises 4%
Fibre optics 3%
Productivity Indices
The following graph shows the trends in the last four years in personnel, operational and total charges in relation to wagons x km produced:
PERSONNEL, OPERATIONAL AND TOTAL COSTS PER CAR X KM (CONSTANT 2010 EUROS)
2007 2008 2009 2010
1,71
5,26
6,10 6,44 6,45 6,38
5,79 5,88 5,76
1,74 1,82 1,81
C. Total per car x km C. Operational per car x km C. Personnel per car x km
92
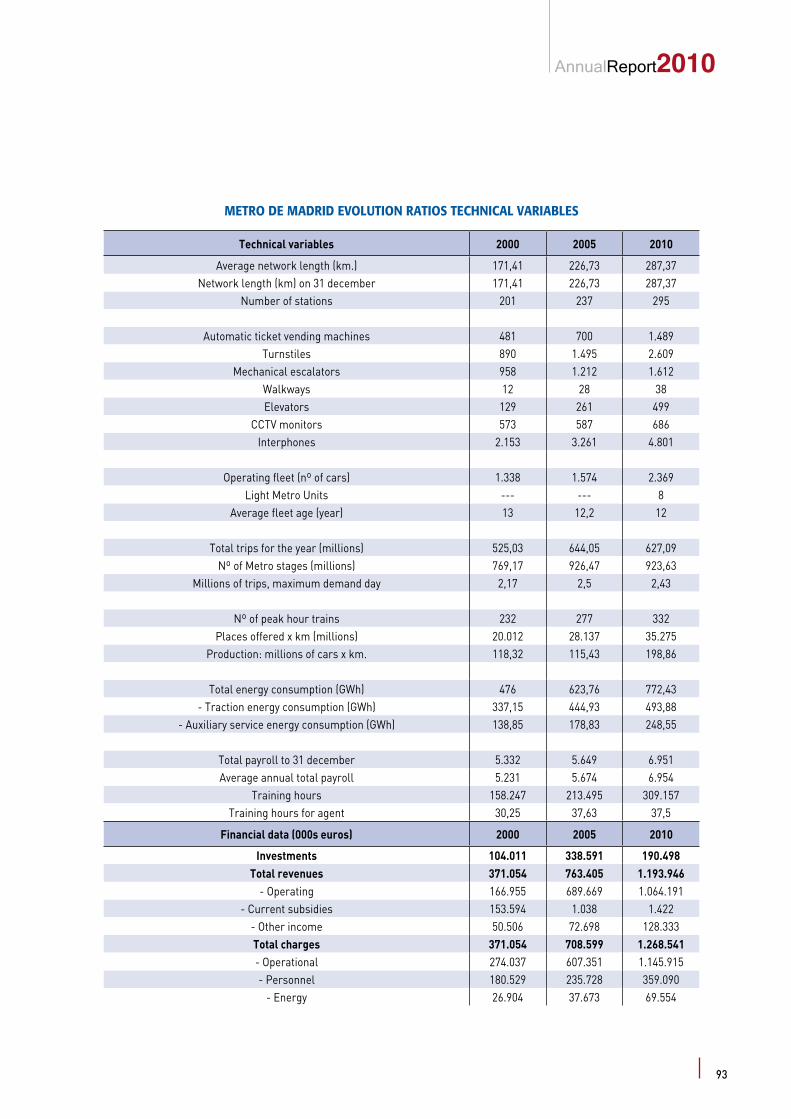
AnnualReport2010
METRO DE MADRID EVOLUTION RATIOS TECHNICAL VARIABLES
Technical variables 2000 2005 2010
Average network length (km.) 171,41 226,73 287,37Network length (km) on 31 december 171,41 226,73 287,37
Number of stations 201 237 295
Automatic ticket vending machines 481 700 1.489Turnstiles 890 1.495 2.609
Mechanical escalators 958 1.212 1.612Walkways 12 28 38Elevators 129 261 499
CCTV monitors 573 587 686Interphones 2.153 3.261 4.801
Operating fleet (nº of cars) 1.338 1.574 2.369Light Metro Units --- --- 8
Average fleet age (year) 13 12,2 12
Total trips for the year (millions) 525,03 644,05 627,09Nº of Metro stages (millions) 769,17 926,47 923,63
Millions of trips, maximum demand day 2,17 2,5 2,43
Nº of peak hour trains 232 277 332Places offered x km (millions) 20.012 28.137 35.275
Production: millions of cars x km. 118,32 115,43 198,86
Total energy consumption (GWh) 476 623,76 772,43- Traction energy consumption (GWh) 337,15 444,93 493,88
- Auxiliary service energy consumption (GWh) 138,85 178,83 248,55
Total payroll to 31 december 5.332 5.649 6.951Average annual total payroll 5.231 5.674 6.954
Training hours 158.247 213.495 309.157Training hours for agent 30,25 37,63 37,5
Financial data (000s euros) 2000 2005 2010
Investments 104.011 338.591 190.498Total revenues 371.054 763.405 1.193.946
- Operating 166.955 689.669 1.064.191- Current subsidies 153.594 1.038 1.422
- Other income 50.506 72.698 128.333Total charges 371.054 708.599 1.268.541- Operational 274.037 607.351 1.145.915- Personnel 180.529 235.728 359.090
- Energy 26.904 37.673 69.554
93

Metro de Madrid
Annual Accounts

Metrode Madrid
BALANCE SHEET
ASSETSBalances on 31/12/2010
(euros)Balances on 31/12/2009
(euros)
A) NON-CURRENT ASSETSI. INTANGIBLE FIXED ASSETS 15.577.966,95 14.434.434,42
3. Patents, licences, trademarks and the like 60.000,00 60.000,005. IT applications 9.629.159,72 8.214.340,896. Other intangible fixed assets 5.888.807,23 6.160.093,53
II. TANGIBLE FIXED ASSETS 1.636.690.658,91 1.554.674.637,051. Land and improvements 747.591.081,59 721.239.124,902. Technical installations, machinery, tools, furmishings and other tangible fixed assets 684.349.420,25 639.12.825,573. Current tangible fixed assets and advances 204.750157,07 194.309.686,58
IV. LONG-TERM GROUP AND ASSOCIATE COMPANY INVESTMENTS 38.957.732,52 42.328.025,121. Equity instruments 38.675.975,14 42.056.846,262. Credits to companies 281.757,38 271.178,86
V. LONG-TERM FINANCIAL INVESTMENTS 19.783.546,77 16.925.991,312. Credits to third parties 12.155.267,62 9.432.329,045. Other financial assets 7.628.279,15 7.493.662,27
VI. DEFERRED TAX ASSETS 455.426,20 241.576,611. Advance profit tax 455.426,20 241.576,61
TOTAL NON-CURRENT ASSETS 1.711.465.331,35 1.628.604.664,51
B) CURRENT ASSETSII. STOCKS 14.500.500,36 21.323.797,33
2. Raw materials and other supplies 14.500.500,36 21.323.797,33III. COMMERCIAL DEBTORS AND OTHER RECEIVABLES 151.420.096,31 113.303.141,37
1. Clients, sales and services 85.465.777,93 57.587.593,952. Clients, group and associate companies 4.711.508,91 3.817.152,873. Sundry debtors 7.895.051,67 5.857.423,874. Personnel 483.339,83 1.315.554,585. Current tax assents 316.680,75 0,006. Other credits with the Public Administrations 52.547.737,22 44.725.416,10
IV. SHORT-TERM GROUP AND ASSOCIATE COMPANY INVESTMENTS 6.843,62 6.493,432. Credits to associate companies 6.843,62 6.493,43
V. SHORT-TERM FINANCIAL INVESTMENTS 311.552,37 372.320,175. Other financial assets 311.552,37 372.320,17
VI. SHORT-TERM SCHEDULING 46.277.401,00 32.546.901,93VII. CASH AND OTHER EQUIVALENT NET ASSETS 164.309.214,73 287.548.439,49
1. Cash and banks 164.309.214,73 277.558.881,522. Other equivalent net assets 0,00 9.989.557,97
TOTAL CURRENT ASSETS 376.825.608,39 455.101.093,72
TOTAL ASSETS 2.088.290.939,74 2.083.705.758,23
96
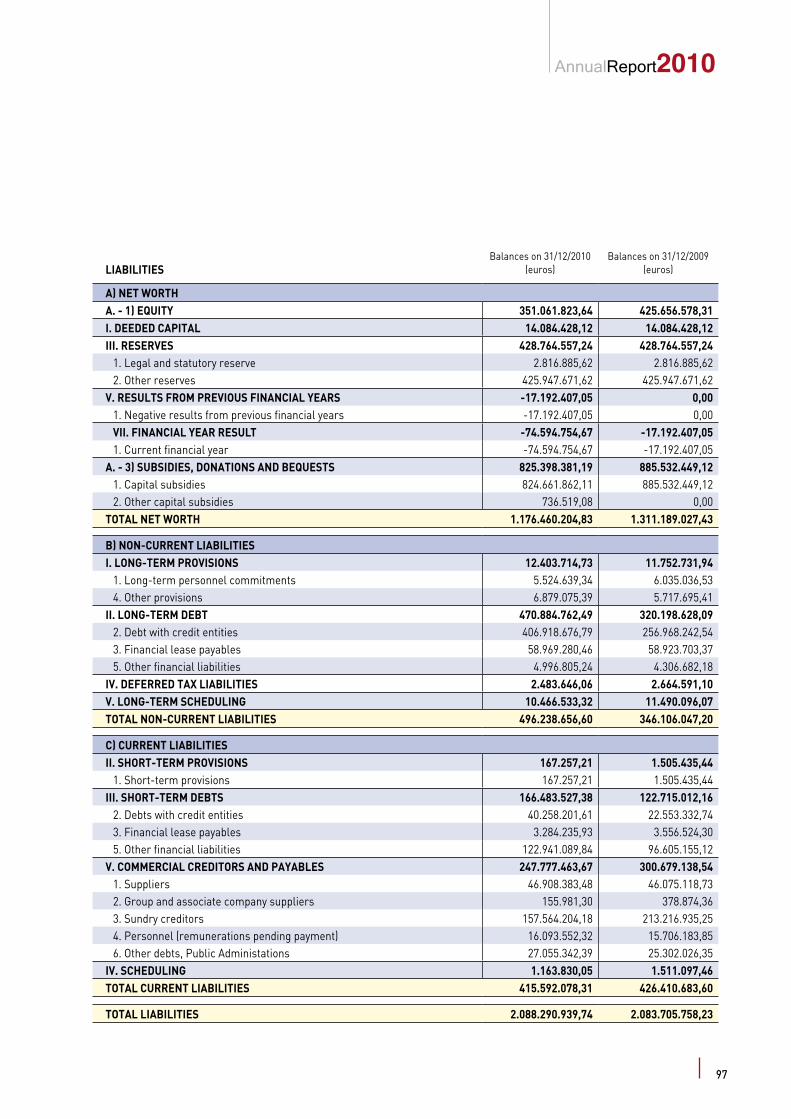
AnnualReport2010
LIABILITIESBalances on 31/12/2010
(euros)Balances on 31/12/2009
(euros)
A) NET WORTHA. - 1) EQUITY 351.061.823,64 425.656.578,31I. DEEDED CAPITAL 14.084.428,12 14.084.428,12III. RESERVES 428.764.557,24 428.764.557,24
1. Legal and statutory reserve 2.816.885,62 2.816.885,622. Other reserves 425.947.671,62 425.947.671,62
V. RESULTS FROM PREVIOUS FINANCIAL YEARS -17.192.407,05 0,001. Negative results from previous financial years -17.192.407,05 0,00VII. FINANCIAL YEAR RESULT -74.594.754,67 -17.192.407,051. Current financial year -74.594.754,67 -17.192.407,05
A. - 3) SUBSIDIES, DONATIONS AND BEQUESTS 825.398.381,19 885.532.449,121. Capital subsidies 824.661.862,11 885.532.449,122. Other capital subsidies 736.519,08 0,00
TOTAL NET WORTH 1.176.460.204,83 1.311.189.027,43
B) NON-CURRENT LIABILITIESI. LONG-TERM PROVISIONS 12.403.714,73 11.752.731,94
1. Long-term personnel commitments 5.524.639,34 6.035.036,534. Other provisions 6.879.075,39 5.717.695,41
II. LONG-TERM DEBT 470.884.762,49 320.198.628,092. Debt with credit entities 406.918.676,79 256.968.242,543. Financial lease payables 58.969.280,46 58.923.703,375. Other financial liabilities 4.996.805,24 4.306.682,18
IV. DEFERRED TAX LIABILITIES 2.483.646,06 2.664.591,10V. LONG-TERM SCHEDULING 10.466.533,32 11.490.096,07TOTAL NON-CURRENT LIABILITIES 496.238.656,60 346.106.047,20
C) CURRENT LIABILITIESII. SHORT-TERM PROVISIONS 167.257,21 1.505.435,44
1. Short-term provisions 167.257,21 1.505.435,44III. SHORT-TERM DEBTS 166.483.527,38 122.715.012,16
2. Debts with credit entities 40.258.201,61 22.553.332,743. Financial lease payables 3.284.235,93 3.556.524,305. Other financial liabilities 122.941.089,84 96.605.155,12
V. COMMERCIAL CREDITORS AND PAYABLES 247.777.463,67 300.679.138,541. Suppliers 46.908.383,48 46.075.118,732. Group and associate company suppliers 155.981,30 378.874,363. Sundry creditors 157.564.204,18 213.216.935,254. Personnel (remunerations pending payment) 16.093.552,32 15.706.183,856. Other debts, Public Administations 27.055.342,39 25.302.026,35
IV. SCHEDULING 1.163.830,05 1.511.097,46TOTAL CURRENT LIABILITIES 415.592.078,31 426.410.683,60
TOTAL LIABILITIES 2.088.290.939,74 2.083.705.758,23
97
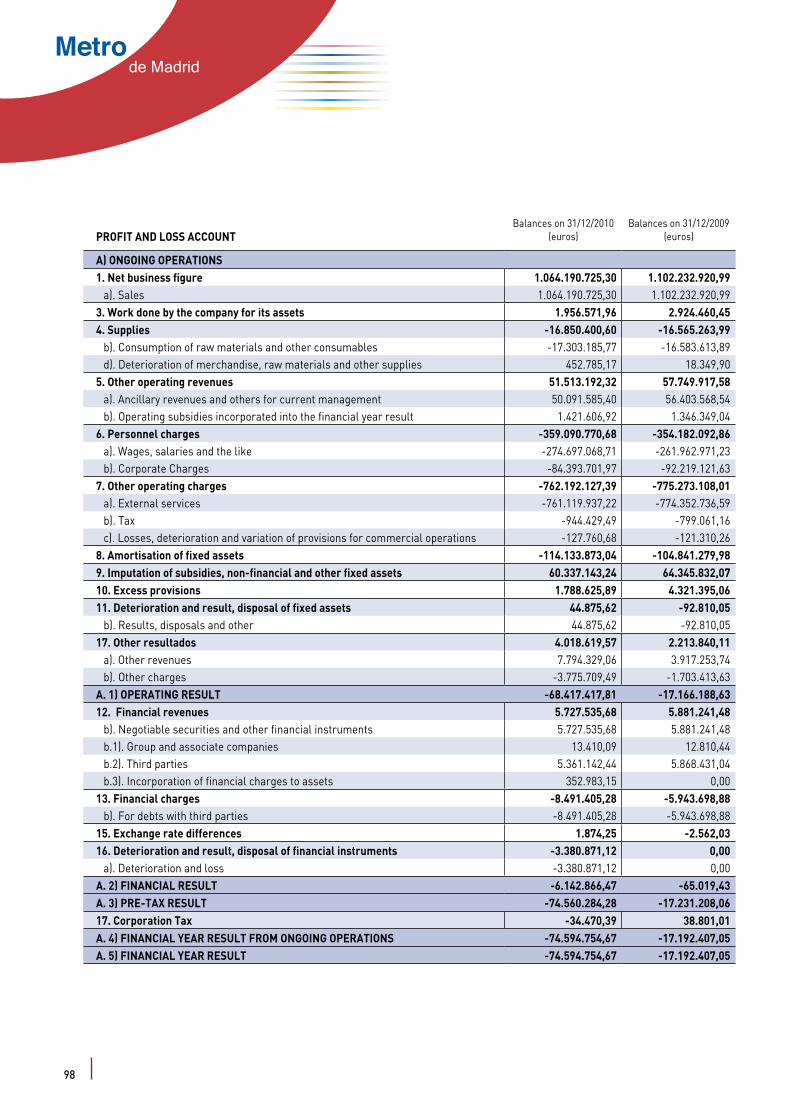
Metrode Madrid
PROFIT AND LOSS ACCOUNTBalances on 31/12/2010
(euros)Balances on 31/12/2009
(euros)
A) ONGOING OPERATIONS1. Net business figure 1.064.190.725,30 1.102.232.920,99
a). Sales 1.064.190.725,30 1.102.232.920,993. Work done by the company for its assets 1.956.571,96 2.924.460,454. Supplies -16.850.400,60 -16.565.263,99
b). Consumption of raw materials and other consumables -17.303.185,77 -16.583.613,89d). Deterioration of merchandise, raw materials and other supplies 452.785,17 18.349,90
5. Other operating revenues 51.513.192,32 57.749.917,58a). Ancillary revenues and others for current management 50.091.585,40 56.403.568,54b). Operating subsidies incorporated into the financial year result 1.421.606,92 1.346.349,04
6. Personnel charges -359.090.770,68 -354.182.092,86a). Wages, salaries and the like -274.697.068,71 -261.962.971,23b). Corporate Charges -84.393.701,97 -92.219.121,63
7. Other operating charges -762.192.127,39 -775.273.108,01a). External services -761.119.937,22 -774.352.736,59b). Tax -944.429,49 -799.061,16c). Losses, deterioration and variation of provisions for commercial operations -127.760,68 -121.310,26
8. Amortisation of fixed assets -114.133.873,04 -104.841.279,989. Imputation of subsidies, non-financial and other fixed assets 60.337.143,24 64.345.832,0710. Excess provisions 1.788.625,89 4.321.395,0611. Deterioration and result, disposal of fixed assets 44.875,62 -92.810,05
b). Results, disposals and other 44.875,62 -92.810,0517. Other resultados 4.018.619,57 2.213.840,11
a). Other revenues 7.794.329,06 3.917.253,74b). Other charges -3.775.709,49 -1.703.413,63
A. 1) OPERATING RESULT -68.417.417,81 -17.166.188,6312. Financial revenues 5.727.535,68 5.881.241,48
b). Negotiable securities and other financial instruments 5.727.535,68 5.881.241,48b.1). Group and associate companies 13.410,09 12.810,44b.2). Third parties 5.361.142,44 5.868.431,04b.3). Incorporation of financial charges to assets 352.983,15 0,00
13. Financial charges -8.491.405,28 -5.943.698,88b). For debts with third parties -8.491.405,28 -5.943.698,88
15. Exchange rate differences 1.874,25 -2.562,0316. Deterioration and result, disposal of financial instruments -3.380.871,12 0,00
a). Deterioration and loss -3.380.871,12 0,00A. 2) FINANCIAL RESULT -6.142.866,47 -65.019,43A. 3) PRE-TAX RESULT -74.560.284,28 -17.231.208,0617. Corporation Tax -34.470,39 38.801,01A. 4) FINANCIAL YEAR RESULT FROM ONGOING OPERATIONS -74.594.754,67 -17.192.407,05A. 5) FINANCIAL YEAR RESULT -74.594.754,67 -17.192.407,05
98
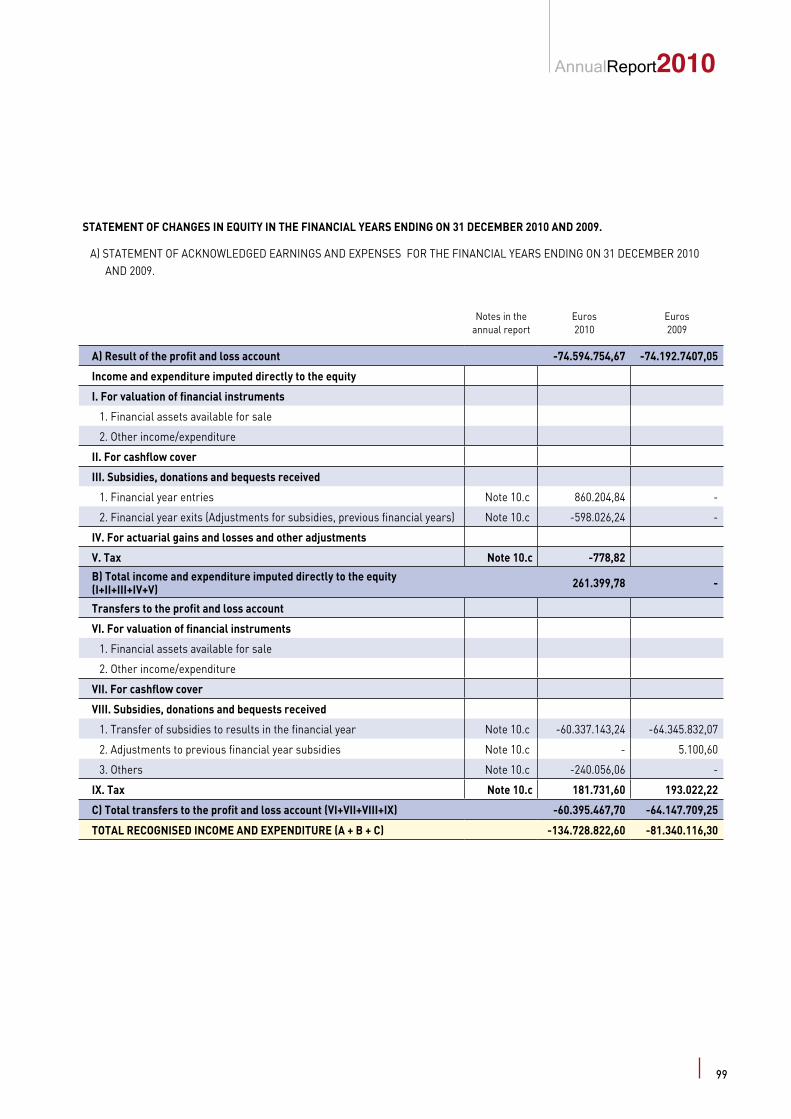
AnnualReport2010
STATEMENT OF CHANGES IN EQUITY IN THE FINANCIAL YEARS ENDING ON 31 DECEMBER 2010 AND 2009.
A) STATEMENT OF ACKNOWLEDGED EARNINGS AND EXPENSES FOR THE FINANCIAL YEARS ENDING ON 31 DECEMBER 2010 AND 2009.
Notes in the annual report
Euros2010
Euros2009
A) Result of the profit and loss account -74.594.754,67 -74.192.7407,05
Income and expenditure imputed directly to the equity
I. For valuation of financial instruments
1. Financial assets available for sale
2. Other income/expenditure
II. For cashflow cover
III. Subsidies, donations and bequests received
1. Financial year entries Note 10.c 860.204,84 -
2. Financial year exits (Adjustments for subsidies, previous financial years) Note 10.c -598.026,24 -
IV. For actuarial gains and losses and other adjustments
V. Tax Note 10.c -778,82
B) Total income and expenditure imputed directly to the equity (I+II+III+IV+V) 261.399,78 -
Transfers to the profit and loss account
VI. For valuation of financial instruments
1. Financial assets available for sale
2. Other income/expenditure
VII. For cashflow cover
VIII. Subsidies, donations and bequests received
1. Transfer of subsidies to results in the financial year Note 10.c -60.337.143,24 -64.345.832,07
2. Adjustments to previous financial year subsidies Note 10.c - 5.100,60
3. Others Note 10.c -240.056,06 -
IX. Tax Note 10.c 181.731,60 193.022,22
C) Total transfers to the profit and loss account (VI+VII+VIII+IX) -60.395.467,70 -64.147.709,25
TOTAL RECOGNISED INCOME AND EXPENDITURE (A + B + C) -134.728.822,60 -81.340.116,30
99

Metrode Madrid
B) TOTAL STATEMENT OF CHANGES IN EQUITY IN THE FINANCIAL YEARS ENDING ON 31 DECEMBER 2010 AND 31 DECEMBER 2009.
Capital
Deeded Uncalled Issue premium Reserves (Treasury stock
and holdings)
Results from previus financial
years
Contributions from other
partners
Financial year result
(Interim dividend)
Other equity instruments
Adjustments for changes of
value
Subsidies, donations and
bequestsTOTAL
B. ADJUSTED BALANCE, BEGINNING OF 2009 14.084.428,12 - - 390.871.510,21 - - - 37.893.047,03 - - - 949.680.158,37 1.392.529.143,73
I. Total income and expenditure recognised - - - - - - - -17.192.407,05 - - - -64.147.709,25 -81.340.116,30
II. Operations with partners or proprietors - - - - - - - - - - - - -
1. Capital increases
2. (-) Capital decreases
3. Conversion of financial liabilities into equity (conversion of bonds, debt write-offs)
4. (-) Dividend payments - - - - - - - - - - - - -5. Operations with treasury stock or holdings
(net)6. Increased (reduced) net equity arising from
a business combination7. Other operations with partners or
propietors
III. Other equity variations - - - 37.893.047,03 - - - -37.893.047,03 - - - - -
C. BALANCE, END OF 2009 14.084.428,12 - - 428.764.557,24 - - - -17.192.407,05 - - - 885.532.449,12 1.311.189.027,43
I. Total income and expenditure recognised - - - - - - - -74.594.754,67 - - - -60.134.067,93 -134.728.822,60
II. Operations with partners or proprietors - - - - - - - - - - - - -
1. Capital increases
2. (-) Capital decreases
3. Conversion of financial liabilities into equity (conversion of bonds, debt write-offs)
4. (-) Dividend payments - - - - - - - - - - - - -5. Operations with treasury stock or holdings
(net)6. Increased (reduced) net equity arising from
a business combination7. Other operations with partners or
propietors
III. Other equity variations - - - - - -17.192.407,05 - -17.192.407,05 - - - - -
B. BALANCE, END OF 2010 14.084.428,12 - - 428.764.557,24 - -17.192.407,05 - -74.594.754,67 - - 825.398.381,19 1.176.460.204,83
100
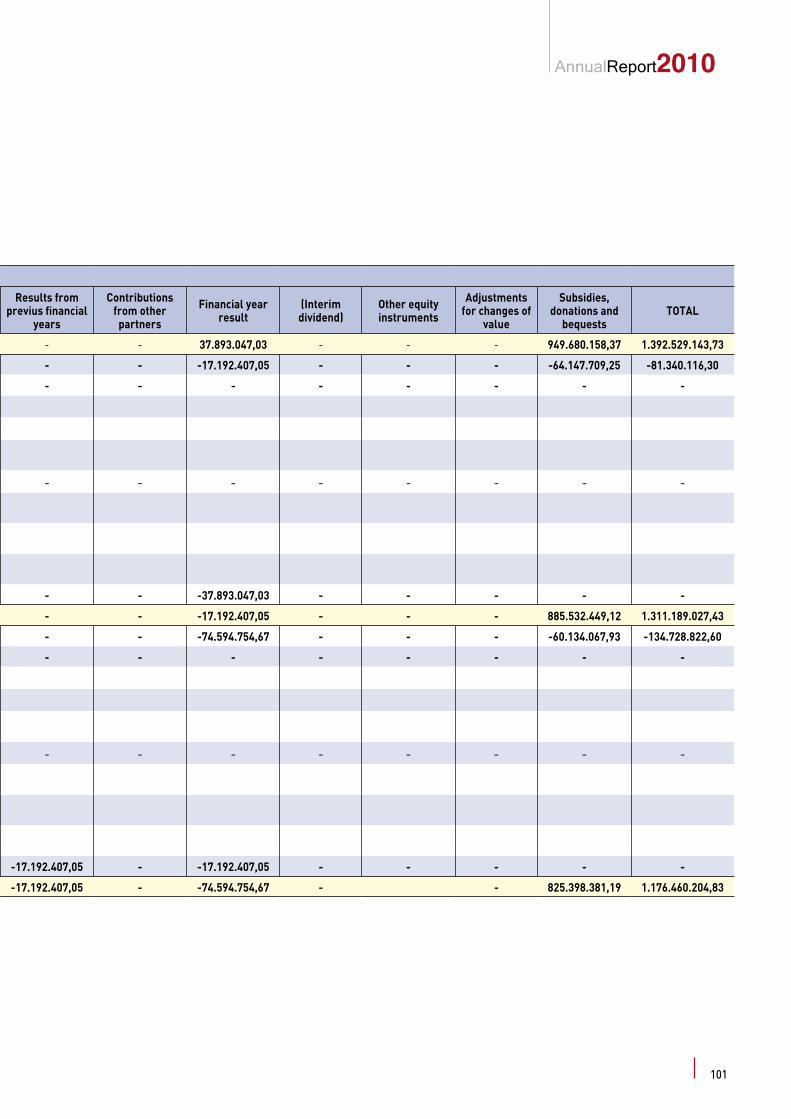
AnnualReport2010
B) TOTAL STATEMENT OF CHANGES IN EQUITY IN THE FINANCIAL YEARS ENDING ON 31 DECEMBER 2010 AND 31 DECEMBER 2009.
Capital
Deeded Uncalled Issue premium Reserves (Treasury stock
and holdings)
Results from previus financial
years
Contributions from other
partners
Financial year result
(Interim dividend)
Other equity instruments
Adjustments for changes of
value
Subsidies, donations and
bequestsTOTAL
- - 37.893.047,03 - - - 949.680.158,37 1.392.529.143,73
- - -17.192.407,05 - - - -64.147.709,25 -81.340.116,30
- - - - - - - -
- - - - - - - -
- - -37.893.047,03 - - - - -
- - -17.192.407,05 - - - 885.532.449,12 1.311.189.027,43
- - -74.594.754,67 - - - -60.134.067,93 -134.728.822,60
- - - - - - - -
- - - - - - - -
-17.192.407,05 - -17.192.407,05 - - - - -
-17.192.407,05 - -74.594.754,67 - - 825.398.381,19 1.176.460.204,83
B. ADJUSTED BALANCE, BEGINNING OF 2009 14.084.428,12 - - 390.871.510,21 -
I. Total income and expenditure recognised - - - - -
II. Operations with partners or proprietors - - - - -
1. Capital increases
2. (-) Capital decreases
3. Conversion of financial liabilities into equity (conversion of bonds, debt write-offs)
4. (-) Dividend payments - - - - -5. Operations with treasury stock or holdings
(net)6. Increased (reduced) net equity arising from
a business combination7. Other operations with partners or
propietors
III. Other equity variations - - - 37.893.047,03 -
C. BALANCE, END OF 2009 14.084.428,12 - - 428.764.557,24 -
I. Total income and expenditure recognised - - - - -
II. Operations with partners or proprietors - - - - -
1. Capital increases
2. (-) Capital decreases
3. Conversion of financial liabilities into equity (conversion of bonds, debt write-offs)
4. (-) Dividend payments - - - - -5. Operations with treasury stock or holdings
(net)6. Increased (reduced) net equity arising from
a business combination7. Other operations with partners or
propietors
III. Other equity variations - - - - -
B. BALANCE, END OF 2010 14.084.428,12 - - 428.764.557,24 -
101
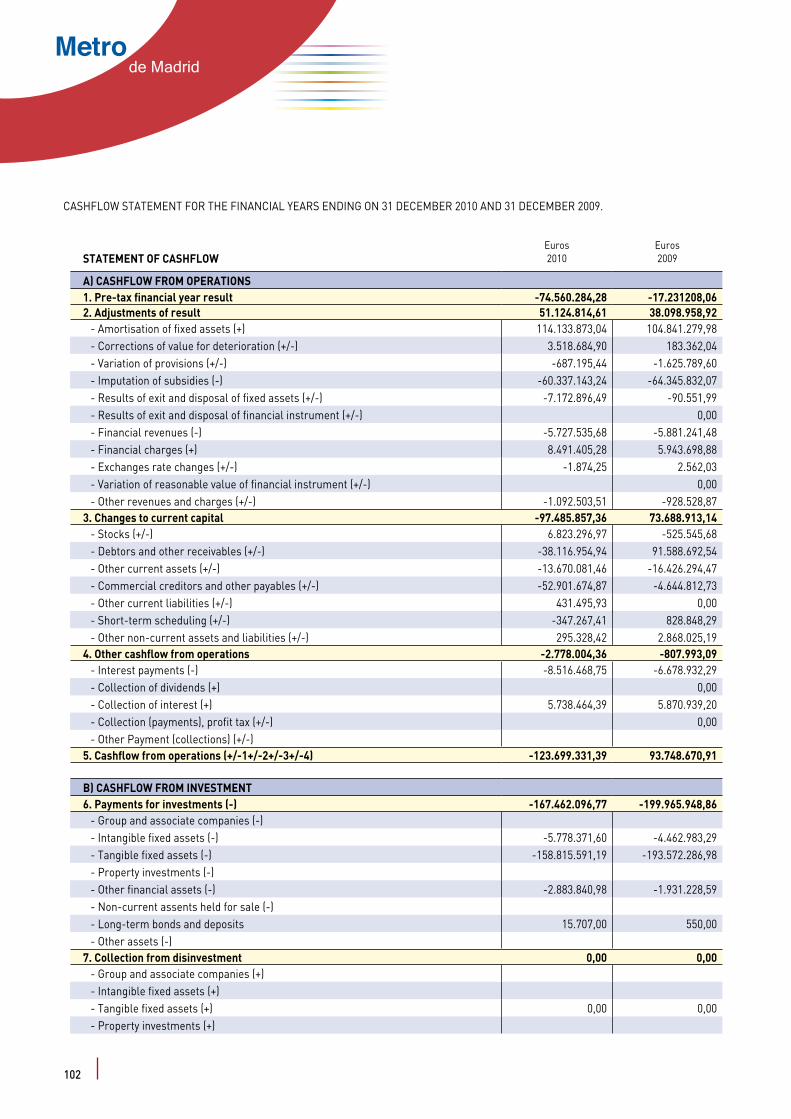
Metrode Madrid
CASHFLOW STATEMENT FOR THE FINANCIAL YEARS ENDING ON 31 DECEMBER 2010 AND 31 DECEMBER 2009.
STATEMENT OF CASHFLOWEuros2010
Euros2009
A) CASHFLOW FROM OPERATIONS1. Pre-tax financial year result -74.560.284,28 -17.231208,062. Adjustments of result 51.124.814,61 38.098.958,92
- Amortisation of fixed assets (+) 114.133.873,04 104.841.279,98- Corrections of value for deterioration (+/-) 3.518.684,90 183.362,04- Variation of provisions (+/-) -687.195,44 -1.625.789,60- Imputation of subsidies (-) -60.337.143,24 -64.345.832,07- Results of exit and disposal of fixed assets (+/-) -7.172.896,49 -90.551,99- Results of exit and disposal of financial instrument (+/-) 0,00- Financial revenues (-) -5.727.535,68 -5.881.241,48- Financial charges (+) 8.491.405,28 5.943.698,88- Exchanges rate changes (+/-) -1.874,25 2.562,03- Variation of reasonable value of financial instrument (+/-) 0,00- Other revenues and charges (+/-) -1.092.503,51 -928.528,87
3. Changes to current capital -97.485.857,36 73.688.913,14- Stocks (+/-) 6.823.296,97 -525.545,68- Debtors and other receivables (+/-) -38.116.954,94 91.588.692,54- Other current assets (+/-) -13.670.081,46 -16.426.294,47- Commercial creditors and other payables (+/-) -52.901.674,87 -4.644.812,73- Other current liabilities (+/-) 431.495,93 0,00- Short-term scheduling (+/-) -347.267,41 828.848,29- Other non-current assets and liabilities (+/-) 295.328,42 2.868.025,19
4. Other cashflow from operations -2.778.004,36 -807.993,09- Interest payments (-) -8.516.468,75 -6.678.932,29- Collection of dividends (+) 0,00- Collection of interest (+) 5.738.464,39 5.870.939,20- Collection (payments), profit tax (+/-) 0,00- Other Payment (collections) (+/-)
5. Cashflow from operations (+/-1+/-2+/-3+/-4) -123.699.331,39 93.748.670,91
B) CASHFLOW FROM INVESTMENT6. Payments for investments (-) -167.462.096,77 -199.965.948,86
- Group and associate companies (-)- Intangible fixed assets (-) -5.778.371,60 -4.462.983,29- Tangible fixed assets (-) -158.815.591,19 -193.572.286,98- Property investments (-)- Other financial assets (-) -2.883.840,98 -1.931.228,59- Non-current assents held for sale (-)- Long-term bonds and deposits 15.707,00 550,00- Other assets (-)
7. Collection from disinvestment 0,00 0,00- Group and associate companies (+)- Intangible fixed assets (+)- Tangible fixed assets (+) 0,00 0,00- Property investments (+)
102
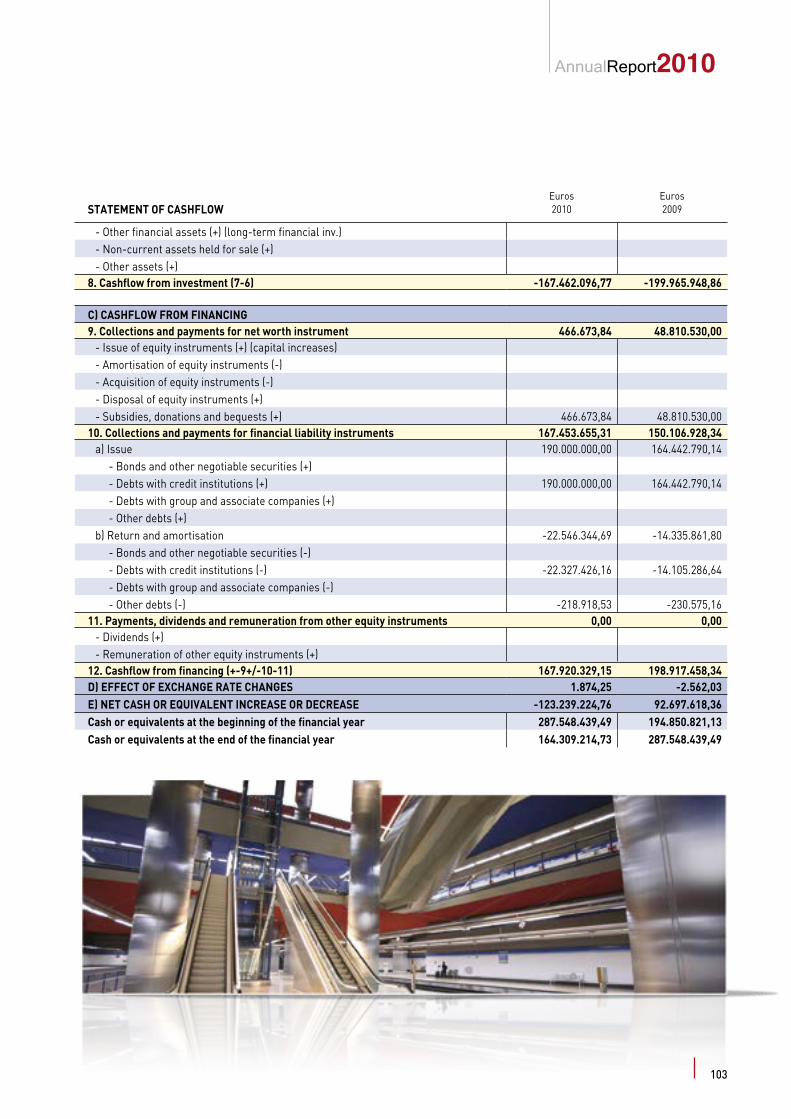
AnnualReport2010
STATEMENT OF CASHFLOWEuros2010
Euros2009
- Other financial assets (+) (long-term financial inv.)- Non-current assets held for sale (+)- Other assets (+)
8. Cashflow from investment (7-6) -167.462.096,77 -199.965.948,86
C) CASHFLOW FROM FINANCING9. Collections and payments for net worth instrument 466.673,84 48.810.530,00
- Issue of equity instruments (+) (capital increases)- Amortisation of equity instruments (-)- Acquisition of equity instruments (-)- Disposal of equity instruments (+)- Subsidies, donations and bequests (+) 466.673,84 48.810.530,00
10. Collections and payments for financial liability instruments 167.453.655,31 150.106.928,34a) Issue 190.000.000,00 164.442.790,14 - Bonds and other negotiable securities (+) - Debts with credit institutions (+) 190.000.000,00 164.442.790,14 - Debts with group and associate companies (+) - Other debts (+)b) Return and amortisation -22.546.344,69 -14.335.861,80 - Bonds and other negotiable securities (-) - Debts with credit institutions (-) -22.327.426,16 -14.105.286,64 - Debts with group and associate companies (-) - Other debts (-) -218.918,53 -230.575,16
11. Payments, dividends and remuneration from other equity instruments 0,00 0,00- Dividends (+)- Remuneration of other equity instruments (+)
12. Cashflow from financing (+-9+/-10-11) 167.920.329,15 198.917.458,34D) EFFECT OF EXCHANGE RATE CHANGES 1.874,25 -2.562,03E) NET CASH OR EQUIVALENT INCREASE OR DECREASE -123.239.224,76 92.697.618,36Cash or equivalents at the beginning of the financial year 287.548.439,49 194.850.821,13Cash or equivalents at the end of the financial year 164.309.214,73 287.548.439,49
103

Metrode Madrid
ANNUALREPORT
1. The company´s activity
Metro de Madrid, S.A. was incorporated on 24 January 1917 as a private limited company. With passage of Legislative Royal Decree No. 13/1978 of 7 June, Act No. 32/1979 of 8 November declared the utility and
requirement of urgent occupancy for the purposes of forced expropriation in acquisition of the Company’s shares, the beneficiaries of the expropriation being the Madrid Provincial and Municipal Authorities with holdings in each case of twenty-five and seventy-five per cent.
In 1986, the Compañia Metropolitano de Madrid, S.A. shares were delivered to the Madrid Regional Community and Madrid City Corporation.
Royal Decree No. 869/1986 of 11 April among others provides in Article 2-1 for transfer of State assets subject to the operation of the service to the Regional Community of Madrid.
On 24 and 30 December 1986, the Community and the City Corporation transferred the share rights of aforesaid Compañia Metropolitano de Madrid, S.A. to the Madrid Regional Regular Public Transport Consortium.
Pursuant to Number 2 of its Articles, the purpose of the Company is:
a) Management and operation of the Madrid public metropolitan rail service.
104
AnnualReport2010
b) Design, construction, management and operation of means of transport for persons or luggage.
c) Design, construction, management and operation of means of transport, with or without cable, of signals or communications, directly or in collaboration with others, after obtaining the appropriate licenses when necessary.
d) To manage and generate returns on its assets by any means, directly or in collaboration with others, and any types of civil engineering works and constructions, save activities for which special requisites are demanded by law and which are not met by this Company.
The activities making up the corporate purpose may be carried on by the Company indirectly by holding shares or stakes in Companies with the same or a similar purpose.
The Company’s main activity is the integrated operation of public rail transport in the Region of Madrid, regulated in a Framework Agreement concluded with the Madrid Regional Transport Consortium.
In line with the financial system in place since 1 January 2003, regulated in Act No. 6/2002 of 27 June partially amending Act No. 5/1985 creating the Madrid Regional Consortium of Regular Public Trasport (CRTM), the Framework Agreement signed by Metro de Madrid and the CRTM provides for a financial regime for public transport services governed by the principle of sufficient charge to cover all true costs in normal conditions of productivity and organisation, based on a mean charge per trip. As a result, on 1 January 2003, operating subsidies ended and were replaced by compensation directly coupled to the service provided.
Metro de Madrid S.A. holds stakes in associate companies and, as a result, dominates a Corporate Group in the terms provided for in the current legislation. According to generally accepted accounting principles and norms it is a requirement to submit consolidated Annual Accounts that present a true reflection of the financial situation and the results of operations, of changes in the Group’s Net Worth and Cashflow. However, the Company does not submit consolidated Annual Accounts because it participates solely in dependent companies which, as a whole, are not of significant interest in such true reflection (see note 8.2).
The Company created a branch in the 2010 financial year with the name of “Metro de Madrid S.A, Sucursal en Ecuador” to deal with consultancy projects under way in Ecuador.
Metro de Madrid, S.A. is domiciled in Madrid at calle Cavanilles No. 58.
2. Bases for the presentation of the annual accounts
a) A true reflection
The attached Annual Accounts were taken from the Company’s accounting records and are presented in accordance with R. 1514/2007 approving the General Accounting Plan and its amendments and Order EHA/733/2010 on accounting aspects of public corporations operating in certain circumstances, to show a true reflection of the Company’s assets, financial situation, results and cashflow during that financial
105
Metrode Madrid
period. These Annual Accounts, drawn up the Company’s Administrators, will be tabled at the Annual General Meeting of Shareholders for its approval and are expected to be approved unmodified.
b) Non-compulsory accounting principles applied
No non-compulsory accounting principles were applied. Additionally, in formulating these Annual Accounts, the Administrators considered all the mandatory accounting principles and rules whose effect on said Annual Accounts is deemed to be considerable.
c) Critical aspects of valuation and estimate of uncertainty
Preparation of the Annual Accounts demands application of relevant accounting estimates and the making of judgements, evaluations and hypotheses in the application of the Company’s accounting policies. The following were the aspects which involved a greater degree of judgement or complexity or in which the hypotheses and estimates in the elaboration of the Annual Accounts were significant:
l The hypotheses used for the actuarial calculation of liabilities from obligations for personnel benefits (see Note 16).
l Classification of leases as operational or financial (see Note 7).
l Deterioration of value of fixed and intangible fixed assets (see note 4.d).
l Deteriorations in the value of investments in associate companies (see note 4.f).
Calculation of provisions (see Note 11)
Although these estimates are based on the best data available at the close of the 2010 financial period, it is possible that future events may make it necessary to amend them (up or down) in coming years, which would in any case be done prospectively.
d) Comparison of information.
The 2010 Annual Accounts are the first the Company’s Administrators have drawn up with application of the modifications made to the General Accounting Plan (Royal Decree No. 1514/2007) in Royal Decree No. 1159/2010 and the transitional regime included in said Royal Decree.
The Company took 1 January 2010 as the transition date and, in that sense, pursuant to point a) of Transitional Provision Five in Royal Decree No. 1159/2010, these Annual Accounts are deemed to be initial Annual Accounts, not required to the criteria concerning comparative figures from the previous financial year, so that comparison of the two financial periods must take this factor into account.
The Company applied Order EHA/733/2010 of 25 March for the first time in 2010 in connection with the criteria for calculating the deterioration in the value of assets not generating cashflow, the Annual Accounts for 2009 having been drawn up before that Order came into effect. Therefore, and as permitted under the sole Transitional Provision of the Order, these 2010 Annual Accounts have not adapted the comparative data to the new criteria.
106
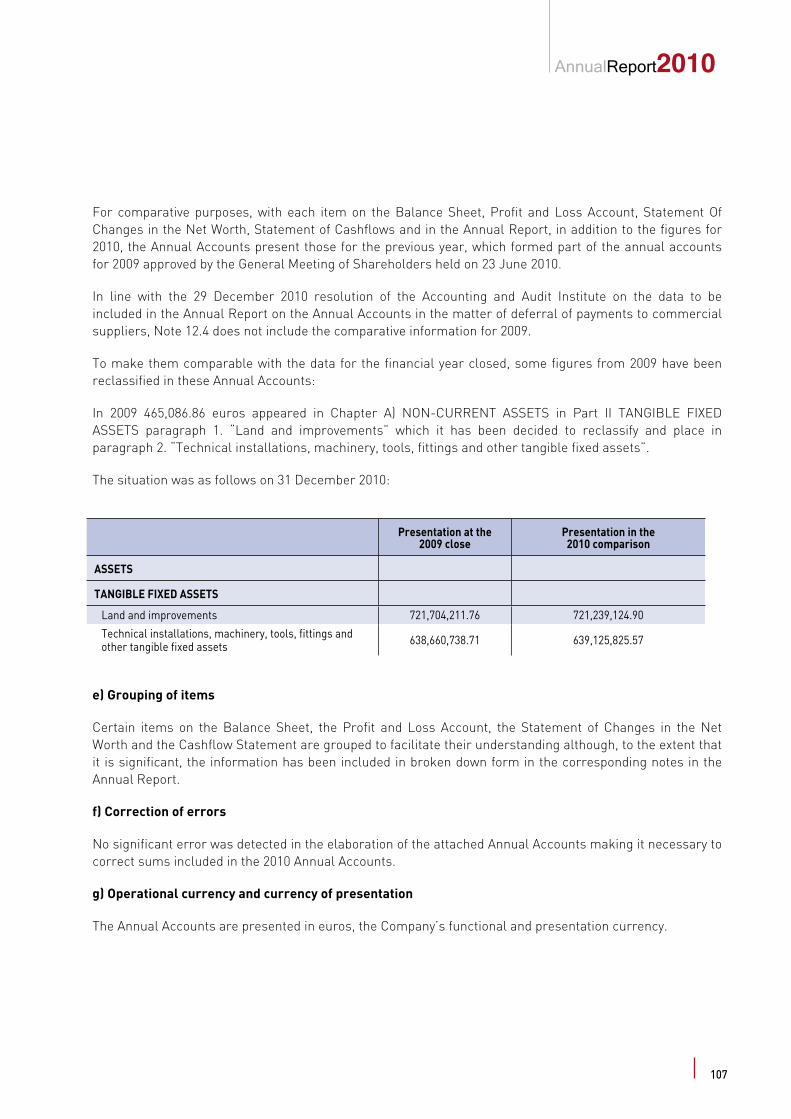
AnnualReport2010
For comparative purposes, with each item on the Balance Sheet, Profit and Loss Account, Statement Of Changes in the Net Worth, Statement of Cashflows and in the Annual Report, in addition to the figures for 2010, the Annual Accounts present those for the previous year, which formed part of the annual accounts for 2009 approved by the General Meeting of Shareholders held on 23 June 2010.
In line with the 29 December 2010 resolution of the Accounting and Audit Institute on the data to be included in the Annual Report on the Annual Accounts in the matter of deferral of payments to commercial suppliers, Note 12.4 does not include the comparative information for 2009.
To make them comparable with the data for the financial year closed, some figures from 2009 have been reclassified in these Annual Accounts:
In 2009 465,086.86 euros appeared in Chapter A) NON-CURRENT ASSETS in Part II TANGIBLE FIXED ASSETS paragraph 1. “Land and improvements” which it has been decided to reclassify and place in paragraph 2. “Technical installations, machinery, tools, fittings and other tangible fixed assets”.
The situation was as follows on 31 December 2010:
Presentation at the 2009 close
Presentation in the 2010 comparison
ASSETS
TANGIBLE FIXED ASSETS
Land and improvements 721,704,211.76 721,239,124.90
Technical installations, machinery, tools, fittings and other tangible fixed assets 638,660,738.71 639,125,825.57
e) Grouping of items
Certain items on the Balance Sheet, the Profit and Loss Account, the Statement of Changes in the Net Worth and the Cashflow Statement are grouped to facilitate their understanding although, to the extent that it is significant, the information has been included in broken down form in the corresponding notes in the Annual Report.
f) Correction of errors
No significant error was detected in the elaboration of the attached Annual Accounts making it necessary to correct sums included in the 2010 Annual Accounts.
g) Operational currency and currency of presentation
The Annual Accounts are presented in euros, the Company’s functional and presentation currency.
107
Metrode Madrid
h) Principle of a going concern
The Company’s working capital on 31 December 2010 was negative by 38,766,470 euros so that its capacity to continue operating, sell its assets and liquidate its liabilities as appearing in the Annual Accounts depends on obtaining sufficient outside financing and/or on the Shareholders’ financial backing. However, the Administrators have drawn up these accounts in accordance with the principle of a going concern based on the fact that the Company’s very activity will, as a result of the foreseeable recovery of mobility in the Community of Madrid, be able in coming years to recuperate the imbalance posted on 31 December 2010.
The Company also has credit contracts not drawn down amounting to 42 million euros (see note 8.1). Finally, the estimated cashflow for the coming 12 months does not anticipate cash tensions.
3. Distribution of results
The proposal for the application of the financial year result as formulated by the Company’s Administrators, to be tabled at the General Meeting of Shareholders for its approval, is to transfer it to the “Negative Results, Previous Financial Years” Account in the Equity”.
Euros
DISTRIBUTION FIGURE
Negative results, previus financial years -74,594,754.67
TOTAL -74,594,754.67
There were no limitations on dividend payments on 31 December 2010.
4. Registration and valuation standards
a) Capitalisation of financial charges
The Company includes the financial charges related to specific financing, directly attributable to acquisition, construction or production in the cost of the tangible and intangible fixed assets requiring more than one year to come into conditions for use, operation or sale.
To the extent that financing was secured specifically, the sum of the interest to be capitalised depends on the financial charges accruing on it.
Interest begins to capitalise when the charges associated with the assets have been incurred, interest is accrued and the necessary work is under way to prepare the assets or parts thereof for use, operation or sale, ending when all or virtually all the necessary work is finished, irrespective of whether the administrative permits required have been obtained, and without taking interruptions into account.
108
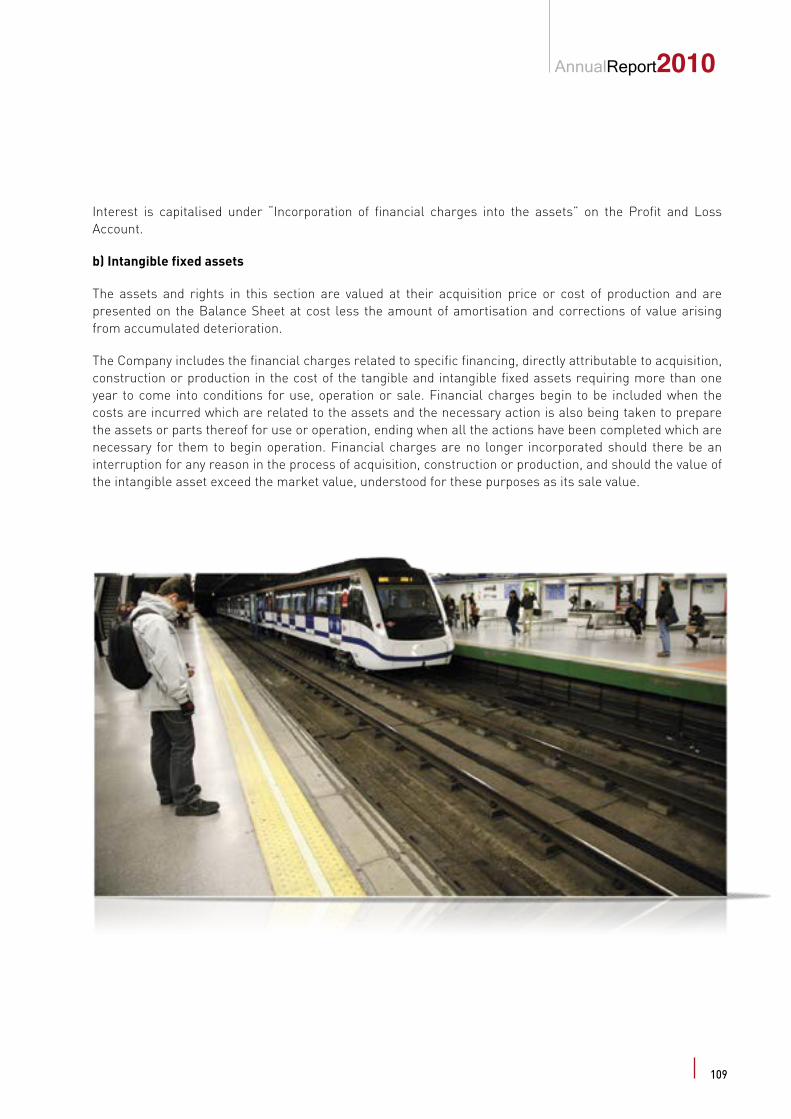
AnnualReport2010
Interest is capitalised under “Incorporation of financial charges into the assets” on the Profit and Loss Account.
b) Intangible fixed assets
The assets and rights in this section are valued at their acquisition price or cost of production and are presented on the Balance Sheet at cost less the amount of amortisation and corrections of value arising from accumulated deterioration.
The Company includes the financial charges related to specific financing, directly attributable to acquisition, construction or production in the cost of the tangible and intangible fixed assets requiring more than one year to come into conditions for use, operation or sale. Financial charges begin to be included when the costs are incurred which are related to the assets and the necessary action is also being taken to prepare the assets or parts thereof for use or operation, ending when all the actions have been completed which are necessary for them to begin operation. Financial charges are no longer incorporated should there be an interruption for any reason in the process of acquisition, construction or production, and should the value of the intangible asset exceed the market value, understood for these purposes as its sale value.
109
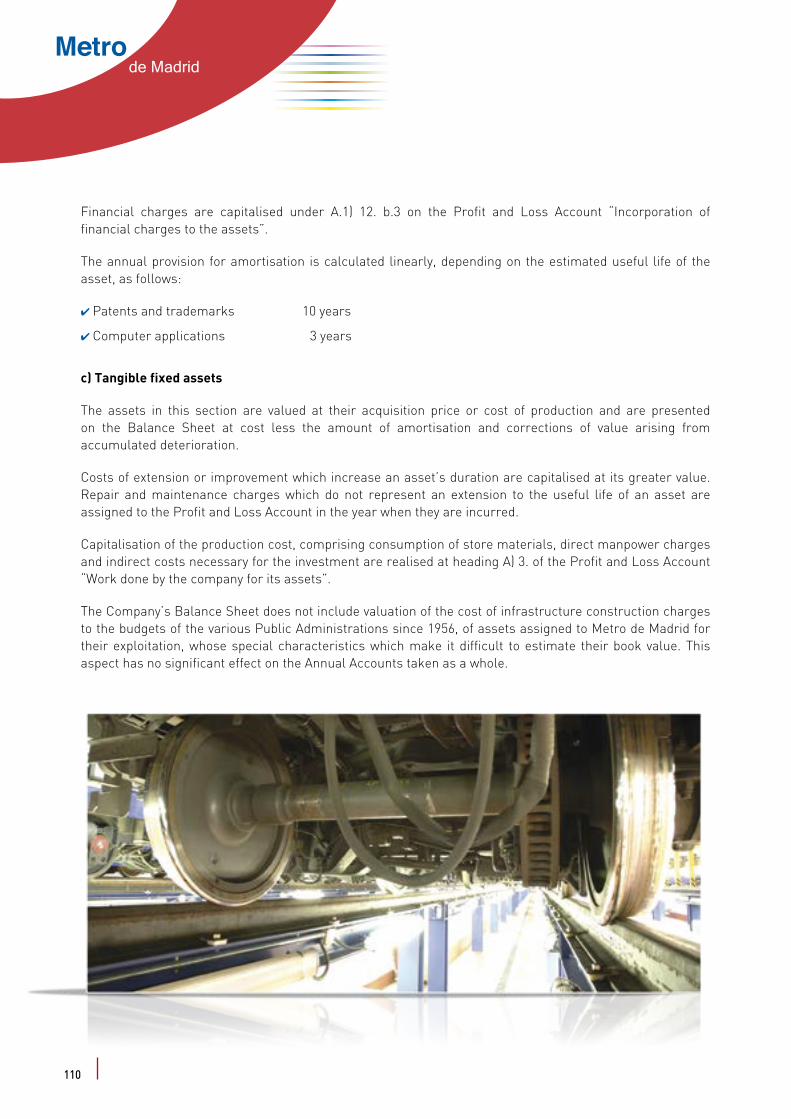
Metrode Madrid
Financial charges are capitalised under A.1) 12. b.3 on the Profit and Loss Account “Incorporation of financial charges to the assets”.
The annual provision for amortisation is calculated linearly, depending on the estimated useful life of the asset, as follows:
4 Patents and trademarks 10 years
4 Computer applications 3 years
c) Tangible fixed assets
The assets in this section are valued at their acquisition price or cost of production and are presented on the Balance Sheet at cost less the amount of amortisation and corrections of value arising from accumulated deterioration.
Costs of extension or improvement which increase an asset’s duration are capitalised at its greater value. Repair and maintenance charges which do not represent an extension to the useful life of an asset are assigned to the Profit and Loss Account in the year when they are incurred.
Capitalisation of the production cost, comprising consumption of store materials, direct manpower charges and indirect costs necessary for the investment are realised at heading A) 3. of the Profit and Loss Account “Work done by the company for its assets”.
The Company’s Balance Sheet does not include valuation of the cost of infrastructure construction charges to the budgets of the various Public Administrations since 1956, of assets assigned to Metro de Madrid for their exploitation, whose special characteristics which make it difficult to estimate their book value. This aspect has no significant effect on the Annual Accounts taken as a whole.
110
AnnualReport2010
The Company includes the financial charges related to specific financing, directly attributable to acquisition, construction or production in the cost of the intangible fixed assets requiring more than one year to come into conditions for use, operation or sale. Financial charges begin to be included when the costs are incurred which are related to the assets and the necessary action is also being taken to prepare the assets or parts thereof for use or operation, ending when all the actions have been completed which are necessary for them to begin operation. Financial charges are no longer incorporated should there be an interruption for any reason in the process of acquisition, construction or production, and should the value of the tangible asset exceed the market value, understood for these purposes as its sale value.
Financial charges are capitalised under A.1) 12. b.3 on the Profit and Loss Account “Incorporation of financial charges to the assets”.
The annual provision for the amortisation fund is calculated linearly, distributing the amortizable sum systematically throughout the estimated useful life, estimated as follows for the assets:
4 Infrastructure and superstructure 67 years
4 Commercial premises 14 years
4 Track 10 years
4 Buildings and industrial constructions 33 years
4 Administrative buildings 50 years
4 Buildings outside operations 50 years
4 Technical installations and machinery 17-10 years
4 Other installations, tooling and fittings 10-3 years
4 Transport items 17-7 years
4 Other fixed assets 17-4 years
Transport items admitted in 2010 under that heading have been assigned a useful life of 25 years.
Metro de Madrid, S.A. periodically revises the residual value, useful life and amortisation procedure for the tangible fixed assets. Modifications to the initial criteria are recognised as a change of estimate.
d) Deterioration of value of non-financial assets subject to amortisation or depreciation
The Company’s tangible and intangible fixed assets include items which do not generate cashflow, and takes account of the deterioration in value only where there are indicators of a deterioration of value inherent to this type of asset, not based on commercial indicators.
In any case, such events or circumstances must be significant and above all have long-term effects.
Should the indicators suggest that a value is deteriorating, the recoverable value is the value in use and the reasonable value less the costs of sale, whichever is greater. In 2010, in application of Order EHA/733/2010, the value in use is the asset’s current value maintaining its service potential, and is calculated by reference
111

Metrode Madrid
to the depreciated replacement cost. Until 2009, the value in use was calculated according to the General Accounting Plan in accordance with the current value of future cashflows.
The deterioration in the value of assets not generating cashflow is calculated on the individual assets, unless the identification of the service potential is not clear, in which case the recoverable figure is calculated according to the operating unit or service to which it belongs.
In 2010, the lower numbers of passengers noted since 2008 was considered an indicator of a possible deterioration of the value of the assets. However, following consideration of the replacement value of the tangible and intangible fixed assets, it was not felt necessary to enter any figure for deterioration of the value of the assets.
e) Leases.
Leases which initially substantially transfer to the Company the risks and benefits inherent to ownership of the assets are classified as financial leases, otherwise as operative leases.
Modification of the terms of the lease agreements other than renewal and which imply a different classification are, if considered at the commencement of the contract, deemed to be a contract during the residual term. Changes of estimate or modifications to the circumstances do not however imply a new classification.
e.1. Financial Lease
In financial leasing transactions in which the Company acts as lessee, the cost of the leased assets is presented in the Balance Sheet according to the nature of the asset which is the subject of the contract and, simultaneously, as a liability for the same sum. That figure is the reasonable value of the asset leased, or the true value of the minimum amounts agreed on at the beginning of the lease, including the option to buy if there are no reasonable doubts that it will be used, whichever is lower. Its calculation does not include contingent quotas, the cost of the services and any taxes which lessor may pass on. The total financial weight of the contract is placed in the Profit and Loss Account for the year in which it accrues, applying the effective interest rate method. Contingent quotas are acknowledged as charges in the financial period in which they are incurred.
Assets registered in this type of transaction are amortised using criteria similar to those applied to the tangible assets as a whole, depending on their nature.
e.2. Sale transactions with subsequent lease
Operations for the sale of assets associated with subsequent lease transactions which meet the conditions inherent to a financial lease are treated as financing operations, the nature of the asset is not altered, and no result is recognised.
e.3. Operational lease
Quotas arising from operational lease contracts are charged to the Profit and Loss Account in linear form during the term of the lease.
112
AnnualReport2010
f) Financial instruments
Financial instruments are classified at the time of initial acknowledgement as a financial asset, a financial liability or as net worth depending on the economic basis of the contractual agreement and the definitions of financial asset, financial liability or net worth.
f.1. Recognition
The Company recognises a financial instrument when it becomes a party bound by the contract or legal business in the terms thereof.
Debt instruments are recognised as of the date of the legal entitlement to receive or the legal obligation to pay, effective. Financial liabilities are recognised on the date when contracted.
Operations to buy or sell financial assets take the form of conventional contracts, understood as those where the parties’ mutual obligations must be fulfilled within a period of time established by regulation or market conventions and which may not be settled by means of differences, are acknowledged according to the type of asset on the contracting or settlement date. Notwithstanding the foregoing, contracts which may be settled according to differences or which are not completed within the regulatory time-span are recognised as a derivative financial instrument during the period between the contracting and settlement dates.
Stock market operations are registered on the date of settlement, while financial assets traded on secondary Spanish securities markets are, if they are net worth instruments, acknowledged on the contracting date, and if securities representing debt, on the settlement date.
f.2. Financial assets
f.2.1 Classification
The Company’s financial assets are classified in the following categories:
a) Loans and receivables: financial assets originating in the sale of assets or the provision of services in the company’s business operations, or those of commercial origin which are not proprietary instruments or derivatives, receipts from which are a fixed or calculable sum and they are not traded on an active market.
b) Investments in the net worth of associate companies: Associate companies are considered to be those over which the Company directly or indirectly through dependents exercises a significant influence. Such significant influence is the power to intervene in a company’s financial policy and operational decisions without implying control or joint control over it. An assessment of the existence of significant influence takes account of potential voting rights or rights which are convertible on the closing date of each financial period, together with potential voting rights held by the Company or another enterprise.
c) Cash and other equivalent liquid assets: this includes cash in hand and bank deposits on call in credit entities, together with other highly liquid short-term investments if easily convertible into determined
113
Metrode Madrid
cash figures and risk of change of value is insignificant. This includes investments maturing in less than three months following the date of acquisition
f.2.2 Valuation
Initial valuation
Loans and receivables as well as investments in the assets of associate companies are initially entered at the reasonable value of the counterpart delivered, plus the costs of the transaction which may be directly assigned to it.
Subsequent valuation
Loans and receivables are valued at their amortised cost using the effective interest rate method. However, financial assets are valued at their par value if no interest rate was established, the sum matures or is expected to be received short-term and the effect of updating is not significant.
Investments in associate companies are valued at cost, less any accumulated amount of corrections in value due to deterioration. Such corrections are calculated as the difference between the book value and the recoverable sum, understood as its reasonable value less sale costs or its value in use, whichever is greater. The value in use is calculated according to the company’s stake in the current value of the estimated cashflows from ordinary activities and final disposal, or the estimated flows anticipated from payment of dividends and final disposal of the investment.
At least at the close of the financial period, the Company runs a test on the deterioration for financial assets not entered at a reasonable value. In such cases, the deterioration is placed on the Profit and Loss Account as the difference between the book value and the financial asset’s recoverable value.
In particular, and the matter of corrections in value related to commercial debtors and other receivables, the Company continues the criterion of entering any corrections of value when there is a reduction or delay in estimated future flows as a result of a debtor’s insolvency. The criterion applied by Metro de Madrid, S.A. in calculating any such corrections of value is based on their individual review.
The Company discharges a financial asset or part thereof when the contractual rights to its cashflows expire or are assigned, provided that the risks and benefits inherent to its possession are transferred substantially.
f.3. Financial liabilities
Financial liabilities are the Company’s debits and payables arising from the purchase of goods and services in its business operations, or also those not of commercial origin which cannot be treated as derivative financial instruments.
Debits and payables are initially assessed at the reasonable value of the counterpart received, adjusted by the directly attributable costs of the transaction. These liabilities are subsequently valued according to their amortised cost, using the effective interest rate method.
114
AnnualReport2010
The Company discharges a financial liability when the obligation is extinguished.
g) Stocks
Materials in storage for consumption and replacement are valued at the average weighted price, which may under no circumstances exceed market prices.
The Company makes provisions for deterioration in the value of stocks when their market value is below the cost of acquisition or production and the reduction is reversible. If irreversible, it is discharged at the cost of acquisition/production of those stocks, taking their market value as their sale value.
There are no limitations on the availability of stocks for guarantees, pledges, bonds and for other similar reasons.
h) Foreign currency transactions and balances
Foreign currency transactions were converted to euros at the cash exchange rate for the sum in foreign currency on the dates when they took place.
Money assets and liabilities denominated in foreign currency were converted to euros at the rate in place at the close of the financial year, while those of a non-monetary nature valued at their historic cost were converted by applying the exchange rate on the date when the transactions took place.
Positive and negative differences which come to light in the settlement of foreign currency transactions and the euro conversion of monetary assets and liabilities denominated in foreign currency are acknowledged in the results.
i) Profit tax
Expenditure or income from profit tax includes the part relative to current tax expenditure or income and that related to deferred tax expenditure or income.
Current tax is the amount the Company pays as an upshot of profit tax settlements for a financial period. Deductions and other fiscal benefits for the liability, excluding withholdings and interim payments and fiscal losses which may be compensated from previous financial periods and effectively applied in the present one, reduce the current tax figure.
Deferred tax expenditure or income relates to the recognition and cancellation of deferred-tax assets and liabilities, including temporary differences identified as sums likely to be payable or recoverable as a consequence of differences between the book sums for the assets and liabilities and their fiscal value, along with credits for tax deductions not applied fiscally. Those figures are entered by applying the rate of assessment at which it is expected to recover or settle them to the associated temporary difference or credit.
115

Metrode Madrid
In general, a deferred tax liability is recognised for all the temporary taxable differences unless arising from the following:
a) Initial acknowledgement of goodwill. However, deferred-tax liabilities related to goodwill are entered provided that they did not arise from their initial acknowledgement.
b) Initial recognition of an asset or liability in a transaction which is not a combination of businesses and also does not impinge upon the book result or the taxable base for the levy.
For their part, deferred tax assets are only recognised to the extent that it is deemed likely that the Company will post future fiscal gains with which to realise them.
Deferred tax assets and liabilities originating in operations with direct charge or payments in the capital accounts are also recorded with a counterpart in the Net Worth.
The deferred-tax assets entered are reconsidered at each accounting close and duly corrected to the extent that there are doubts about their recovery in the future. Also at each close, deferred-tax assets not entered on the Balance Sheet are reconsidered and acknowledged to the extent that they are likely to be recovered with future fiscal benefits.
j) Income and expenditure
Income and expenditure are acknowledged according to the criterion of accrual, that is when the real movement of goods and services they represent takes place, irrespective of the time of the resulting monetary or financial current.
k) Provisions and contingencies
Provisions are acknowledged when the Company has a current obligation, whether legal, contractual, implicit or tacit, as a result of past event, and resources are likely to emerge which incorporate future economic benefits with which to cancel the obligation. They are assessed at the present value of the best possible estimate for cancelling or transferring the obligation.
The financial effect of the provisions is acknowledged as a financial charge on the Profit and Loss Account.
Provisions revert to results if no resources are likely to emerge to cancel the obligation.
l) Indemnifications for dismissal
The Company considers there are no reasons which may lead to abnormal dismissals of significance, so that it is not considered necessary to make provisions for this aspect, indemnification for a hypothetical dismissal being treated as current charge for the financial year.
2010 produced no significant developments in this sense.
116
AnnualReport2010
m) Subsidies, donations and legacies received
Subsidies, donations and legacies associated with the acquisition of company fixed assets are entered as income acknowledged in the net worth when officially granted, the conditions have been met for their assignment and there is no reasonable doubt as to their collection.
Subsidies received for activities linked to operations are entered with payment in the Profit and Loss Account of each financial year.
Non-reimbursable capital subsidies, donations and legacies are assessed at the reasonable value of the sum or property assigned, depending on whether or not of a monetary character, and are assigned to the results in proportion to the endowment or amortisation made in the period for the items subsidised or, where applicable, when disposed of or their value is corrected for deterioration.
117
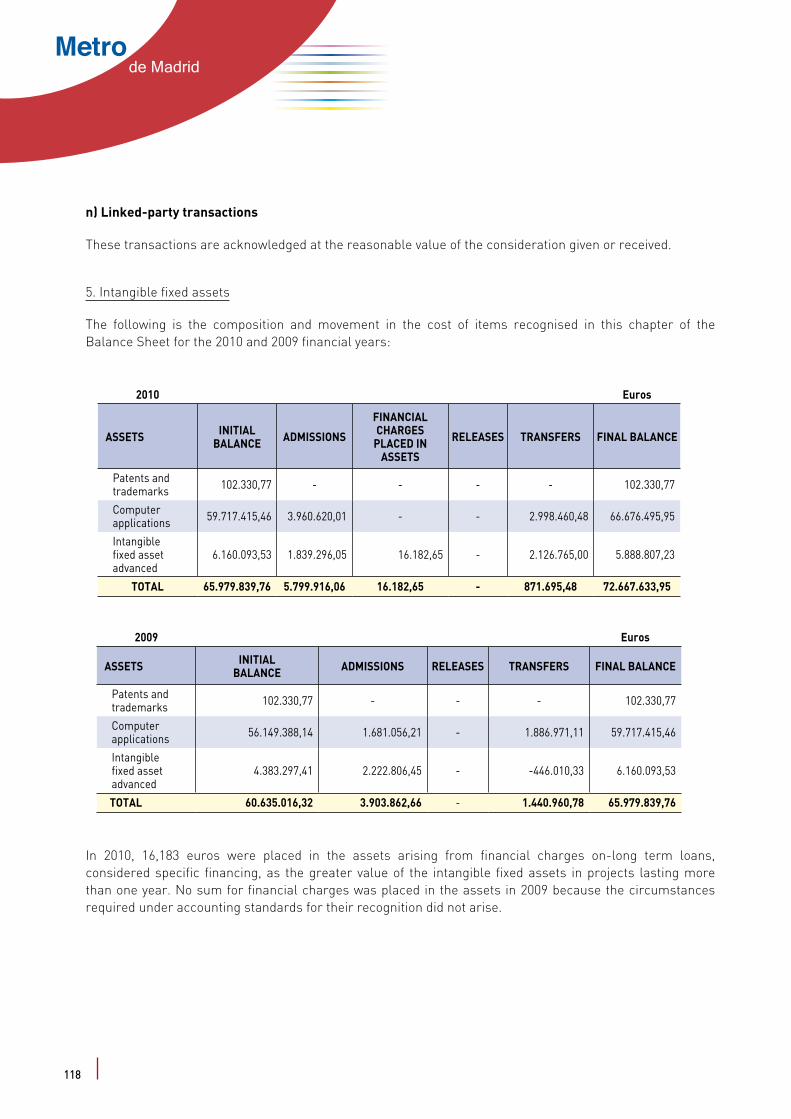
Metrode Madrid
n) Linked-party transactions
These transactions are acknowledged at the reasonable value of the consideration given or received.
5. Intangible fixed assets
The following is the composition and movement in the cost of items recognised in this chapter of the Balance Sheet for the 2010 and 2009 financial years:
2010 Euros
ASSETS INITIAL BALANCE ADMISSIONS
FINANCIAL CHARGES
PLACED IN ASSETS
RELEASES TRANSFERS FINAL BALANCE
Patents and trademarks 102.330,77 - - - - 102.330,77
Computer applications 59.717.415,46 3.960.620,01 - - 2.998.460,48 66.676.495,95
Intangible fixed asset advanced
6.160.093,53 1.839.296,05 16.182,65 - 2.126.765,00 5.888.807,23
TOTAL 65.979.839,76 5.799.916,06 16.182,65 - 871.695,48 72.667.633,95
2009 Euros
ASSETS INITIAL BALANCE ADMISSIONS RELEASES TRANSFERS FINAL BALANCE
Patents and trademarks 102.330,77 - - - 102.330,77
Computer applications 56.149.388,14 1.681.056,21 - 1.886.971,11 59.717.415,46
Intangible fixed asset advanced
4.383.297,41 2.222.806,45 - -446.010,33 6.160.093,53
TOTAL 60.635.016,32 3.903.862,66 - 1.440.960,78 65.979.839,76
In 2010, 16,183 euros were placed in the assets arising from financial charges on-long term loans, considered specific financing, as the greater value of the intangible fixed assets in projects lasting more than one year. No sum for financial charges was placed in the assets in 2009 because the circumstances required under accounting standards for their recognition did not arise.
118
AnnualReport2010
The following were the variations in the accumulated amortisation in 2010 and 2009:
2010 Euros
ASSETS USEFUL LIFE IN YEARS
INITIAL BALANCE PROVISION FINAL
BALANCE
FULLY AMORTISED FIXED
ASSETS
Patents and trademarks 10 42.330,77 - 42.330,77 42.330,77
Computer applications 3 51.503.074,57 5.544.261,66 57.047.336,23 50.300.285,69
TOTAL 51.545.405,34 5.544.261,66 57.089.667,00 50.342.616,46
2009 Euros
ASSETSUSEFUL LIFE IN YEARS
INITIAL BALANCE PROVISION CORRECTION
AMORTISATIONFINAL
BALANCE
FULLY AMORTISED
FIXED ASSETS
Patents and trademarks 10 44.097,73 4.233,04 -6.000,00 42.330,77 42.330,77
Computer applications 3 44.882.720,78 6.620.353,79 - 51.503.074,57 40.281.811,86
TOTAL 44.926.818,51 6.624.586,83 -6.000,00 51.545.405,34 40.324.142,63
The respective figures for fully amortised assets of this nature at the close of the 2010 and 2009 financial years were 50,342,616 euros and 40,324,143 euros.
119
Metrode Madrid
6. Tangible fixed assets
The following was the composition and movements in 2010 and 2009 of the items in this section of the Balance Sheet:
Variations in the cost of the tangible fixed assets were as follows in 2010:
2010 INITIAL BALANCE ENTRIES EXITS INTEREST TO ASSETS TRANSFERS FINAL BALANCE
1. LAND AND IMPROVEMENTS 894.389.040,63 29.834.189,04 0,00 0,00 17.413.153,03 941.636.382,70INFRASTRUCTURE AND SUPERSTRUCTURE 629.537.203,87 23.200.138,91 - - 9.750.490,81 662.487.833,59TRACK 94.706.459,23 4.924.253,48 - - 7.084.953,48 106.715.666,19OC-GALLERIES 20.493.927,67 - - - - 20.493.927,67ADMINISTRATIVE BUILDINGS 15.649.280,84 303.535,68 - - 29.016,02 15.981.832,54ADM. BUILDINGS THIRD PARTIES - 599.788,36 - - - 599.788,36INDUSTRIAL BUILDINGS 134.002.169,02 806.472,61 - - 548.692,72 135.357.334,352. TECHNICAL INSTALLATIONS AND MACHINERY 717.801.319,59 44.353.091,46 0,00 0,00 53.971.941,04 816.126.352,09MACHINERY IN INDUSTRIAL BUILDINGS 25.176.956,21 432.988,64 - - 92.622,01 25.702.566,86MACHINERY IN ELECTRICAL SUBSTATIONS 70.277.533,50 3.327.428,85 - - 6.318.373,18 79.923.335,53TRANSFORMER ROOMS 2.838.675,26 448.402,83 - - 934.255,53 4.221.333,62ELECTRICAL AND ELECTROMECHANICAL INSTALLATIONS 115.793.969,20 5.696.743,22 - - 12.654.040,97 134.144.753,39ELECTRONIC INSTALLATIONS AND AUTOMATISMS 290.480.110,85 10.910.574,26 - - 21.486.783,25 322.877.468,36ESCALATORS AND ELEVATORS 147.818.809,43 20.476.161,05 - - 10.940.306,34 179.235.276,82OTHER TECHNICAL INSTALLATIONS 62.462.800,95 2.912.459,55 - - 1.199.441,40 66.574.701,90THIRD-PARTY SIGNALS - 120.761,97 - - 346.118,36 466.880,33INTERNAL TRANSPORT ELEMENTS 2.259.179,19 21.766,86 - - - 2.280.946,05SANITARY INSTALLATIONS 693.285,00 5.804,23 - - - 699.089,233. OTHER INSTALLATIONS, TOOLING AND FITTINGS 25.471.024,09 1.827.296,25 100.000,00 0,00 409.644,94 27.607.965,28FITTINGS 12.284.646,15 1.114.559,26 - - 198.643,17 13.597.848,58UTENSILS AND REPRODUCTION MACHINES 3.214.327,90 48.261,18 100.000,00 - 141.048,94 3.303.638,02TOOLING 9.972.050,04 664.475,81 - - 69.952,83 10.706.478,684. TRANSPORT ELEMENTS 914.916.854,00 5.734.493,55 0,00 0,00 14.866.253,48 935.517.601,03RAIL MATERIAL 855.918.445,38 4.994.683,06 - - 14.616.027,32 875.529.155,76AUTOMOBILE MATERIAL 463.836,41 - - - - 463.836,41THIRD-PARTY CARS - 739.810,49 - - 250.226,16 990.036,65FINANC. LEASED ASSET RIGHTS 58.534.572,21 - - - - 58.534.572,215. OTHER FIXED ASSETS 63.239.067,14 3.650.354,83 774.515,00 0,00 8.482.614,97 74.597.521,94DATA PROCESSING EQUIPMENT 33.125.109,61 2.356.603,60 - - 1.288.825,56 36.770.538,77SPARES FOR RAIL FIXED ASSETS 24.206.660,27 788.935,30 567.610,44 - 4.851.953,13 29.279.938,26SPARES FOR TECHNICAL INSTALLATION FIXED ASSETS 5.907.297,26 253.371,66 206.904,56 - 2.341.836,28 8.295.600,64THIRD-PARTY SPARES - 251.444,27 - - - 251.444,276. CURRENT TANGIBLE FIXED ASSETS 194.309.686,58 99.128.807,90 42,07 336.800,51 -89.025.095,85 204.750.157,07RAIL MATERIAL 13.324.753,82 5.383.153,85 - 25.788,27 -5.132.413,12 13.601.282,82TECHNICAL INSTALLATIONS BEING ASSEMBLED 149.163.818,40 62.043.372,38 - 211.573,28 -53.101.651,14 158.317112,92MACHINERY BEING ASSEMBLED 1.011.790,00 - - - - 1.011.790,00DATA PROCESSING EQUIPMENT BEING ASSEMBLED 717.167,28 1.098.733,06 - - -722.566,70 1.093.333,64CURRENT CONSTRUCTIONS 15.915.105,65 11.619.122,00 - 99.438,96 -15.891.455,53 11.742.211,08OTHER CURRENT INVESTMENTS 14.177.051,43 18.984.426,61 42,07 - -14.177.009,36 18.984.426,61TOTAL 2.810.126.992,03 184.528.233,03 874.557,07 336.800,51 6.118.511,61 3.000.235.980,11
120
AnnualReport2010
2010 INITIAL BALANCE ENTRIES EXITS INTEREST TO ASSETS TRANSFERS FINAL BALANCE
0,00 0,00 17.413.153,03 941.636.382,70- - 9.750.490,81 662.487.833,59- - 7.084.953,48 106.715.666,19- - - 20.493.927,67- - 29.016,02 15.981.832,54- - - 599.788,36- - 548.692,72 135.357.334,35
0,00 0,00 53.971.941,04 816.126.352,09- - 92.622,01 25.702.566,86- - 6.318.373,18 79.923.335,53- - 934.255,53 4.221.333,62- - 12.654.040,97 134.144.753,39- - 21.486.783,25 322.877.468,36- - 10.940.306,34 179.235.276,82- - 1.199.441,40 66.574.701,90- - 346.118,36 466.880,33- - - 2.280.946,05- - - 699.089,23
100.000,00 0,00 409.644,94 27.607.965,28- - 198.643,17 13.597.848,58
100.000,00 - 141.048,94 3.303.638,02- - 69.952,83 10.706.478,68
0,00 0,00 14.866.253,48 935.517.601,03- - 14.616.027,32 875.529.155,76- - - 463.836,41- - 250.226,16 990.036,65- - - 58.534.572,21
774.515,00 0,00 8.482.614,97 74.597.521,94- - 1.288.825,56 36.770.538,77
567.610,44 - 4.851.953,13 29.279.938,26206.904,56 - 2.341.836,28 8.295.600,64
- - - 251.444,2742,07 336.800,51 -89.025.095,85 204.750.157,07
- 25.788,27 -5.132.413,12 13.601.282,82- 211.573,28 -53.101.651,14 158.317112,92- - - 1.011.790,00- - -722.566,70 1.093.333,64- 99.438,96 -15.891.455,53 11.742.211,08
42,07 - -14.177.009,36 18.984.426,61874.557,07 336.800,51 6.118.511,61 3.000.235.980,11
1. LAND AND IMPROVEMENTS 894.389.040,63 29.834.189,04INFRASTRUCTURE AND SUPERSTRUCTURE 629.537.203,87 23.200.138,91TRACK 94.706.459,23 4.924.253,48OC-GALLERIES 20.493.927,67 -ADMINISTRATIVE BUILDINGS 15.649.280,84 303.535,68ADM. BUILDINGS THIRD PARTIES - 599.788,36INDUSTRIAL BUILDINGS 134.002.169,02 806.472,612. TECHNICAL INSTALLATIONS AND MACHINERY 717.801.319,59 44.353.091,46MACHINERY IN INDUSTRIAL BUILDINGS 25.176.956,21 432.988,64MACHINERY IN ELECTRICAL SUBSTATIONS 70.277.533,50 3.327.428,85TRANSFORMER ROOMS 2.838.675,26 448.402,83ELECTRICAL AND ELECTROMECHANICAL INSTALLATIONS 115.793.969,20 5.696.743,22ELECTRONIC INSTALLATIONS AND AUTOMATISMS 290.480.110,85 10.910.574,26ESCALATORS AND ELEVATORS 147.818.809,43 20.476.161,05OTHER TECHNICAL INSTALLATIONS 62.462.800,95 2.912.459,55THIRD-PARTY SIGNALS - 120.761,97INTERNAL TRANSPORT ELEMENTS 2.259.179,19 21.766,86SANITARY INSTALLATIONS 693.285,00 5.804,233. OTHER INSTALLATIONS, TOOLING AND FITTINGS 25.471.024,09 1.827.296,25FITTINGS 12.284.646,15 1.114.559,26UTENSILS AND REPRODUCTION MACHINES 3.214.327,90 48.261,18TOOLING 9.972.050,04 664.475,814. TRANSPORT ELEMENTS 914.916.854,00 5.734.493,55RAIL MATERIAL 855.918.445,38 4.994.683,06AUTOMOBILE MATERIAL 463.836,41 -THIRD-PARTY CARS - 739.810,49FINANC. LEASED ASSET RIGHTS 58.534.572,21 -5. OTHER FIXED ASSETS 63.239.067,14 3.650.354,83DATA PROCESSING EQUIPMENT 33.125.109,61 2.356.603,60SPARES FOR RAIL FIXED ASSETS 24.206.660,27 788.935,30SPARES FOR TECHNICAL INSTALLATION FIXED ASSETS 5.907.297,26 253.371,66THIRD-PARTY SPARES - 251.444,276. CURRENT TANGIBLE FIXED ASSETS 194.309.686,58 99.128.807,90RAIL MATERIAL 13.324.753,82 5.383.153,85TECHNICAL INSTALLATIONS BEING ASSEMBLED 149.163.818,40 62.043.372,38MACHINERY BEING ASSEMBLED 1.011.790,00 -DATA PROCESSING EQUIPMENT BEING ASSEMBLED 717.167,28 1.098.733,06CURRENT CONSTRUCTIONS 15.915.105,65 11.619.122,00OTHER CURRENT INVESTMENTS 14.177.051,43 18.984.426,61TOTAL 2.810.126.992,03 184.528.233,03
121
Metrode Madrid
Variation in the accumulated amortisation of the tangible fixed assets was as follows in 2010:
INITIAL BALANCE PROVISION EXITS TRANSFERS FINAL BALANCE FULLY AMORTISED
1. LAND AND IMPROVEMENTS 173.149.915,73 20.895.385,38 0,00 0,00 194.045.301,11 43.861.271,40
INFRASTRUCTURE AND SUPERSTRUCTURE 65.799.828,21 9.479.005,04 - - 75.278.833,25 -
TRACK 57.078.819,98 6.336.355,65 - - 63.415.175,63 37.806.399,96
OC-GALLERIES 10.511.261,85 557.414,93 - - 11.068.676,78 6.054.871,44
ADMINISTRATIVE BUILDINGS 2.763.357,92 597.133,47 - - 3.360.491,39 -
THIRD PARTY ADMINISTRATIVE BUILDINGS - 71.334,67 - - 71.334,67 -
INDUSTRIAL BUILDINGS 36.996.647,77 3.854.141,62 - - 40.850.789,39 -2. TECHNICAL INSTALLATIONS AND MACHINERY 348.427.618,07 45.387.072,66 0,00 16.533,80 393.798.156,93 164.865.541,96MACHINERY IN INDUSTRIAL BUILDINGS 16.278.220,21 1.372.953,26 - - 17.651.173,47 12.348.594,64
MACHINERY IN ELECTRICAL SUBSTATIONS 22.707.614,27 3.673.377,61 - - 26.380.991,88 10.827.468,56
TRANSFORMER ROOMS 662.130,74 209.532,35 - - 871.663,09 -
ELECTRICAL AND ELECTROMECHANICAL INSTALLATIONS 55.686.628,05 5.823.249,94 - - 61.509.877,99 27.976.847,03
ELECTRONIC INSTALLATIONS AND AUTOMATISMS 147.696.156,99 19.407.557,92 - - 167.103.714,91 61.813.062,48
ESCALATORS AND ELEVATORS 69.439.023,94 10.555.361,57 - - 79.994.385,51 38.007.806,80
OTHER TECHNICAL INSTALLATIONS 33.474.993,83 4.231.739,04 - - 37.706.732,87 11.721.724,29
THIRD-PARTY SIGNALS - 24.033,72 - 16.533,80 7.499,92 -
INTERNAL TRANSPORT ELEMENTS 1.807.244,21 86.463,07 - - 1.893.707,28 1.497.139,18
SANITARY INSTALLATIONS 675.605,83 2.804,18 - - 678.410,01 672.898,983. OTHER INSTALLATIONS, TOOLING AND FITTINGS 17.528.702,57 1.778.287,30 61.000,00 0,00 19.245.989,87 14.139.278,25FITTINGS 6.717.632,81 891.061,29 - - 7.608.694,10 4.316.546,06
UTENSILS AND REPRODUCTION MACHINES 2.311.267,54 178.475,23 61.000,00 - 2.428.742,77 1.783.272,84
TOOLING 8.499.802,22 708.750,78 - - 9.208.553,00 8.039.459,354. TRANSPORT ELEMENTS 667.868.626,92 33.147.409,62 0,00 2.492,90 701.013.543,64 403.790.496,82RAIL MATERIAL 614.904.734,34 29.934.965,24 0,00 - 644.839.699,58 387.911.010,16
AUTOMOBILE MATERIAL 233.233,44 58.914,52 0,00 2.492,90 289.655,06 41.615,69
RIGHTS ON FINANC. LEASE ASSETS 52.730.659,14 3.135.027,59 0,00 - 55.865.686,73 15.837.870,97
THIRD-PARTY CARS 0,00 18.502,27 0,00 - 18.502,27 -5. OTHER FIX 48.477.491,69 7.381.456,42 435.645,16 -19.026,70 55.442.329,65 38.086.779,69DATA PROCESSING EQUIPMENT 28.044.824,44 2.654.549,47 - - 30.699.373,91 24.988.733,36
SPARES FOR RAIL TANGIBLE FIXED ASSETS 17.450.499,00 3.298.254,68 361.750,41 -19.026,70 20.406.029,97 11.824.535,63
SPARES FOR TECHNICAL INSTALLATION FIXED ASSETS 2.982.168,25 1.427.476,77 73.894,75 - 4.335.750,27 1.273.510,70
THIRD-PARTY SPARES 0,00 1.175,50 - - 1.175,50 -
TOTAL 1.255.452.354,98 108.589.611,38 496.645,16 0,00 1.363.545.321,20 664.743.368,12
122
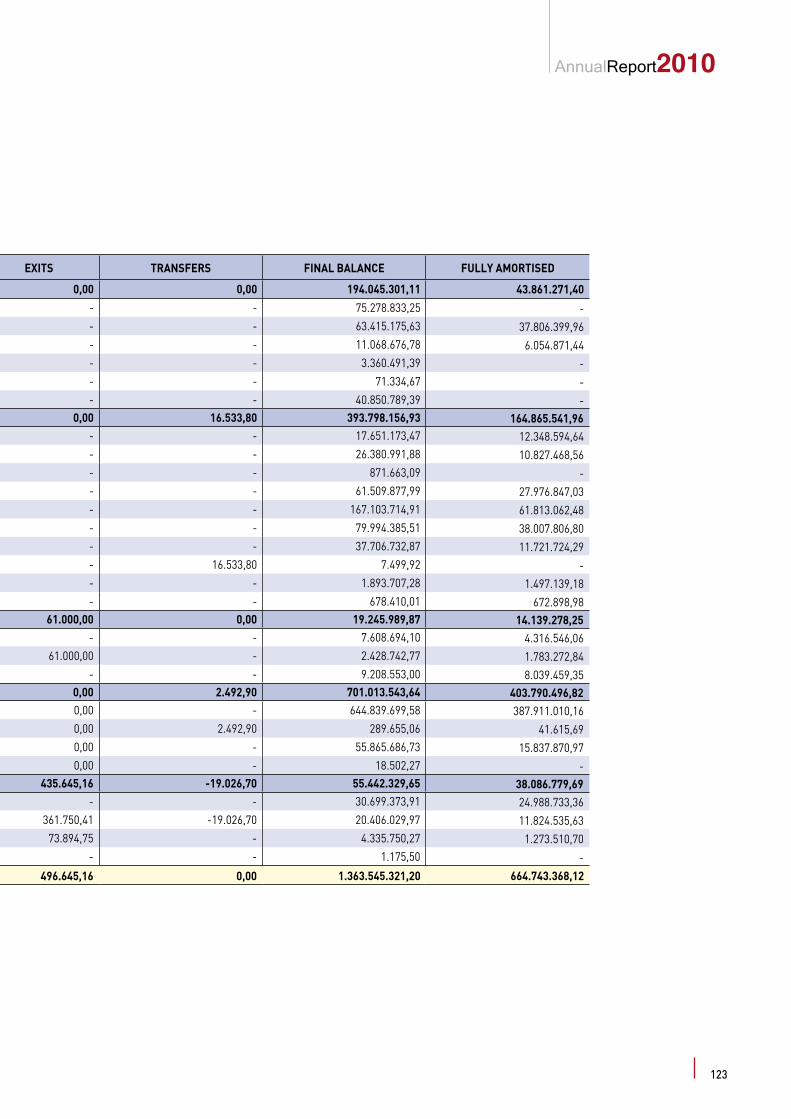
AnnualReport2010
Variation in the accumulated amortisation of the tangible fixed assets was as follows in 2010:
INITIAL BALANCE PROVISION EXITS TRANSFERS FINAL BALANCE FULLY AMORTISED
0,00 0,00 194.045.301,11 43.861.271,40
- - 75.278.833,25 -- - 63.415.175,63 37.806.399,96- - 11.068.676,78 6.054.871,44- - 3.360.491,39 -- - 71.334,67 -- - 40.850.789,39 -
0,00 16.533,80 393.798.156,93 164.865.541,96- - 17.651.173,47 12.348.594,64- - 26.380.991,88 10.827.468,56- - 871.663,09 -- - 61.509.877,99 27.976.847,03- - 167.103.714,91 61.813.062,48- - 79.994.385,51 38.007.806,80- - 37.706.732,87 11.721.724,29- 16.533,80 7.499,92 -- - 1.893.707,28 1.497.139,18- - 678.410,01 672.898,98
61.000,00 0,00 19.245.989,87 14.139.278,25- - 7.608.694,10 4.316.546,06
61.000,00 - 2.428.742,77 1.783.272,84- - 9.208.553,00 8.039.459,35
0,00 2.492,90 701.013.543,64 403.790.496,820,00 - 644.839.699,58 387.911.010,160,00 2.492,90 289.655,06 41.615,690,00 - 55.865.686,73 15.837.870,970,00 - 18.502,27 -
435.645,16 -19.026,70 55.442.329,65 38.086.779,69- - 30.699.373,91 24.988.733,36
361.750,41 -19.026,70 20.406.029,97 11.824.535,6373.894,75 - 4.335.750,27 1.273.510,70
- - 1.175,50 -
496.645,16 0,00 1.363.545.321,20 664.743.368,12
1. LAND AND IMPROVEMENTS 173.149.915,73 20.895.385,38
INFRASTRUCTURE AND SUPERSTRUCTURE 65.799.828,21 9.479.005,04
TRACK 57.078.819,98 6.336.355,65
OC-GALLERIES 10.511.261,85 557.414,93
ADMINISTRATIVE BUILDINGS 2.763.357,92 597.133,47
THIRD PARTY ADMINISTRATIVE BUILDINGS - 71.334,67
INDUSTRIAL BUILDINGS 36.996.647,77 3.854.141,622. TECHNICAL INSTALLATIONS AND MACHINERY 348.427.618,07 45.387.072,66
MACHINERY IN INDUSTRIAL BUILDINGS 16.278.220,21 1.372.953,26
MACHINERY IN ELECTRICAL SUBSTATIONS 22.707.614,27 3.673.377,61
TRANSFORMER ROOMS 662.130,74 209.532,35
ELECTRICAL AND ELECTROMECHANICAL INSTALLATIONS 55.686.628,05 5.823.249,94
ELECTRONIC INSTALLATIONS AND AUTOMATISMS 147.696.156,99 19.407.557,92
ESCALATORS AND ELEVATORS 69.439.023,94 10.555.361,57
OTHER TECHNICAL INSTALLATIONS 33.474.993,83 4.231.739,04
THIRD-PARTY SIGNALS - 24.033,72
INTERNAL TRANSPORT ELEMENTS 1.807.244,21 86.463,07
SANITARY INSTALLATIONS 675.605,83 2.804,183. OTHER INSTALLATIONS, TOOLING AND FITTINGS 17.528.702,57 1.778.287,30
FITTINGS 6.717.632,81 891.061,29
UTENSILS AND REPRODUCTION MACHINES 2.311.267,54 178.475,23
TOOLING 8.499.802,22 708.750,784. TRANSPORT ELEMENTS 667.868.626,92 33.147.409,62
RAIL MATERIAL 614.904.734,34 29.934.965,24
AUTOMOBILE MATERIAL 233.233,44 58.914,52
RIGHTS ON FINANC. LEASE ASSETS 52.730.659,14 3.135.027,59
THIRD-PARTY CARS 0,00 18.502,275. OTHER FIX 48.477.491,69 7.381.456,42
DATA PROCESSING EQUIPMENT 28.044.824,44 2.654.549,47
SPARES FOR RAIL TANGIBLE FIXED ASSETS 17.450.499,00 3.298.254,68
SPARES FOR TECHNICAL INSTALLATION FIXED ASSETS 2.982.168,25 1.427.476,77
THIRD-PARTY SPARES 0,00 1.175,50
TOTAL 1.255.452.354,98 108.589.611,38
123

Metrode Madrid
Variations in the cost of the tangible fixed assets were as follows in 2009:
INITIAL BALANCE ENTRIES EXITS TRANSFERS FINAL BALANCE
1. LAND AND IMPROVEMENTS 810.789.589,34 34.031.466,36 - 49.567.984,93 894.389.040,63
INFRASTRUCTURE AND SUPERSTRUCTURE 579.950.256,08 21.635.553,84 - 27.951.393,95 629.537.203,87
TRACK 86.766.788,22 1.821.512,80 - 6.118.158,21 94.706.459,23
ADMINISTRATIVE BUILDINGS 126.260.421,64 1.740,00 - 15.191,00 126.277.352,64
THIRD PARTY ADMINISTRATIVE BUILDINGS - - - - -
INDUSTRIAL BUILDINGS 17.812.123,40 10.572.659,72 - 15.483.241,77 43.868.024,892. TECHNICAL INSTALLATIONS AND MACHINERY 623.617.111,71 47.326.197,06 108.599,04 46.966.609,86 717.801.319,59MACHINERY IN INDUSTRIAL BUILDINGS 23.258.152,49 963.191,73 108.599,04 1.064.211,03 25.176.956,21
MACHINERY IN ELECTRICAL SUBSTATIONS 53.374.647,11 1.649.676,63 - 15.253.209,76 70.277.533,50
TRANSFORMER ROOMS 1.959.503,18 282.208,15 - 596.963,93 2.838.675,26
ELECTRICAL AND ELECTROMECHANICAL INSTALLATIONS 93.360.447,38 19.567.440,28 - 2.866.081,54 115.793.969,20
ELECTRONIC INSTALLATIONS AND AUTOMATISMS 272.089.520,51 7.077.449,72 - 11.313.140,62 290.480.110,85
ESCALATORS AND ELEVATORS 119.913.449,94 14.385.423,91 - 13.519.935,58 147.818.809,43
OTHER TECHNICAL INSTALLATIONS 56.830.037,28 3.315.892,27 - 2.316.871,40 62.462.800,95
INTERNAL TRANSPORT ELEMENTS 2.147.929,19 83.050,00 - 28.200,00 2.259.179,19
SANITARY INSTALLATIONS 683.424,63 1.864,37 - 7.996,00 693.285,003. OTHER INSTALLATIONS, TOOLING AND FITTINGS 23.841.293,85 1.559.016,88 108.482,36 179.195,72 25.471.024,09FITTINGS 11.407.182,70 794.099,94 - 83.363,51 12.284.646,15
UTENSILS AND REPRODUCTION MACHINES 3.241.235,61 66.881,24 108.482,36 14.693,41 3.214.327,90
TOOLING 9.192.875,54 698.035,70 - 81.138,80 9.972.050,044. TRANSPORT ELEMENTS 899.039.866,18 2.937.078,79 - 12.939.909,03 914.916.854,00RAIL MATERIAL 840.041.457,56 2.937.078,79 - 12.939.909,03 855.918.445,38
AUTOMOBILE MATERIAL 463.836,41 - - - 463.836,41
RIGHTS ON FINANCIAL LEASE ASSETS 58.534.572,21 - - - 58.534.572,215. OTHER FIXED ASSETS 61.518.721,77 1.623.486,39 358.036,53 454.895,51 63.239.067,14DATA PROCESSING EQUIPMENT 31.797.167,31 1.123.154,66 - 204.787,64 33.125.109,61
SPARES FOR RAIL TANGIBLE FIXED ASSETS 24.423.500,22 67.980,05 305.776,38 20.956,38 24.206.660,27
SPARES FOR TECHNICAL INSTALLATION FIXED ASSETS 5.298.054,24 432.351,68 52.260,15 229.151,49 5.907.297,266. CURRENT TANGIBLE FIXED ASSETS 224.612.879,96 81.844.388,69 598.026,24 -111.549.555,83 194.308.686,58RAIL MATERIAL 15.280.981,15 6.853.957,98 - -8.810.185,31 13.324.753,82
TECHNICAL INSTALLATIONS BEING ASSEMBLED 173.593.827,10 45.079.450,03 - -69.509.458,73 149.163.818,40
MACHINERY BEING ASSEMBLED 10.763.291,59 - - -9.751.501,59 1.011.790,00
DATA PROCESSING EQUIPMENT BEING ASSEMBLED 199.342,98 217.167,28 - 300.657,02 717.167,28
CURRENT CONSTRUCTIONS 13.656.307,56 15.516.761,97 - -13.257.963,88 15.915.105,65
OTHER CURRENT INVESTMENTS 11.119.129,58 14.177.051,43 598.026,24 -10.521103,34 14.177.051,43
TOTAL 2.643.419.462,81 169.321.634,17 1.173.144,17 -1.440.960,78 2.810.126.992,03
124

AnnualReport2010
Variations in the cost of the tangible fixed assets were as follows in 2009:
INITIAL BALANCE ENTRIES EXITS TRANSFERS FINAL BALANCE
34.031.466,36 - 49.567.984,93 894.389.040,63
21.635.553,84 - 27.951.393,95 629.537.203,871.821.512,80 - 6.118.158,21 94.706.459,23
1.740,00 - 15.191,00 126.277.352,64- - - -
10.572.659,72 - 15.483.241,77 43.868.024,8947.326.197,06 108.599,04 46.966.609,86 717.801.319,59
963.191,73 108.599,04 1.064.211,03 25.176.956,211.649.676,63 - 15.253.209,76 70.277.533,50
282.208,15 - 596.963,93 2.838.675,2619.567.440,28 - 2.866.081,54 115.793.969,20
7.077.449,72 - 11.313.140,62 290.480.110,8514.385.423,91 - 13.519.935,58 147.818.809,43
3.315.892,27 - 2.316.871,40 62.462.800,9583.050,00 - 28.200,00 2.259.179,19
1.864,37 - 7.996,00 693.285,001.559.016,88 108.482,36 179.195,72 25.471.024,09
794.099,94 - 83.363,51 12.284.646,1566.881,24 108.482,36 14.693,41 3.214.327,90
698.035,70 - 81.138,80 9.972.050,042.937.078,79 - 12.939.909,03 914.916.854,002.937.078,79 - 12.939.909,03 855.918.445,38
- - - 463.836,41- - - 58.534.572,21
1.623.486,39 358.036,53 454.895,51 63.239.067,141.123.154,66 - 204.787,64 33.125.109,61
67.980,05 305.776,38 20.956,38 24.206.660,27432.351,68 52.260,15 229.151,49 5.907.297,26
81.844.388,69 598.026,24 -111.549.555,83 194.308.686,586.853.957,98 - -8.810.185,31 13.324.753,82
45.079.450,03 - -69.509.458,73 149.163.818,40- - -9.751.501,59 1.011.790,00
217.167,28 - 300.657,02 717.167,2815.516.761,97 - -13.257.963,88 15.915.105,6514.177.051,43 598.026,24 -10.521103,34 14.177.051,43
169.321.634,17 1.173.144,17 -1.440.960,78 2.810.126.992,03
1. LAND AND IMPROVEMENTS 810.789.589,34
INFRASTRUCTURE AND SUPERSTRUCTURE 579.950.256,08
TRACK 86.766.788,22
ADMINISTRATIVE BUILDINGS 126.260.421,64
THIRD PARTY ADMINISTRATIVE BUILDINGS -
INDUSTRIAL BUILDINGS 17.812.123,402. TECHNICAL INSTALLATIONS AND MACHINERY 623.617.111,71
MACHINERY IN INDUSTRIAL BUILDINGS 23.258.152,49
MACHINERY IN ELECTRICAL SUBSTATIONS 53.374.647,11
TRANSFORMER ROOMS 1.959.503,18
ELECTRICAL AND ELECTROMECHANICAL INSTALLATIONS 93.360.447,38
ELECTRONIC INSTALLATIONS AND AUTOMATISMS 272.089.520,51
ESCALATORS AND ELEVATORS 119.913.449,94
OTHER TECHNICAL INSTALLATIONS 56.830.037,28
INTERNAL TRANSPORT ELEMENTS 2.147.929,19
SANITARY INSTALLATIONS 683.424,633. OTHER INSTALLATIONS, TOOLING AND FITTINGS 23.841.293,85
FITTINGS 11.407.182,70
UTENSILS AND REPRODUCTION MACHINES 3.241.235,61
TOOLING 9.192.875,544. TRANSPORT ELEMENTS 899.039.866,18
RAIL MATERIAL 840.041.457,56
AUTOMOBILE MATERIAL 463.836,41
RIGHTS ON FINANCIAL LEASE ASSETS 58.534.572,215. OTHER FIXED ASSETS 61.518.721,77
DATA PROCESSING EQUIPMENT 31.797.167,31
SPARES FOR RAIL TANGIBLE FIXED ASSETS 24.423.500,22
SPARES FOR TECHNICAL INSTALLATION FIXED ASSETS 5.298.054,246. CURRENT TANGIBLE FIXED ASSETS 224.612.879,96
RAIL MATERIAL 15.280.981,15
TECHNICAL INSTALLATIONS BEING ASSEMBLED 173.593.827,10
MACHINERY BEING ASSEMBLED 10.763.291,59
DATA PROCESSING EQUIPMENT BEING ASSEMBLED 199.342,98
CURRENT CONSTRUCTIONS 13.656.307,56
OTHER CURRENT INVESTMENTS 11.119.129,58
TOTAL 2.643.419.462,81
125
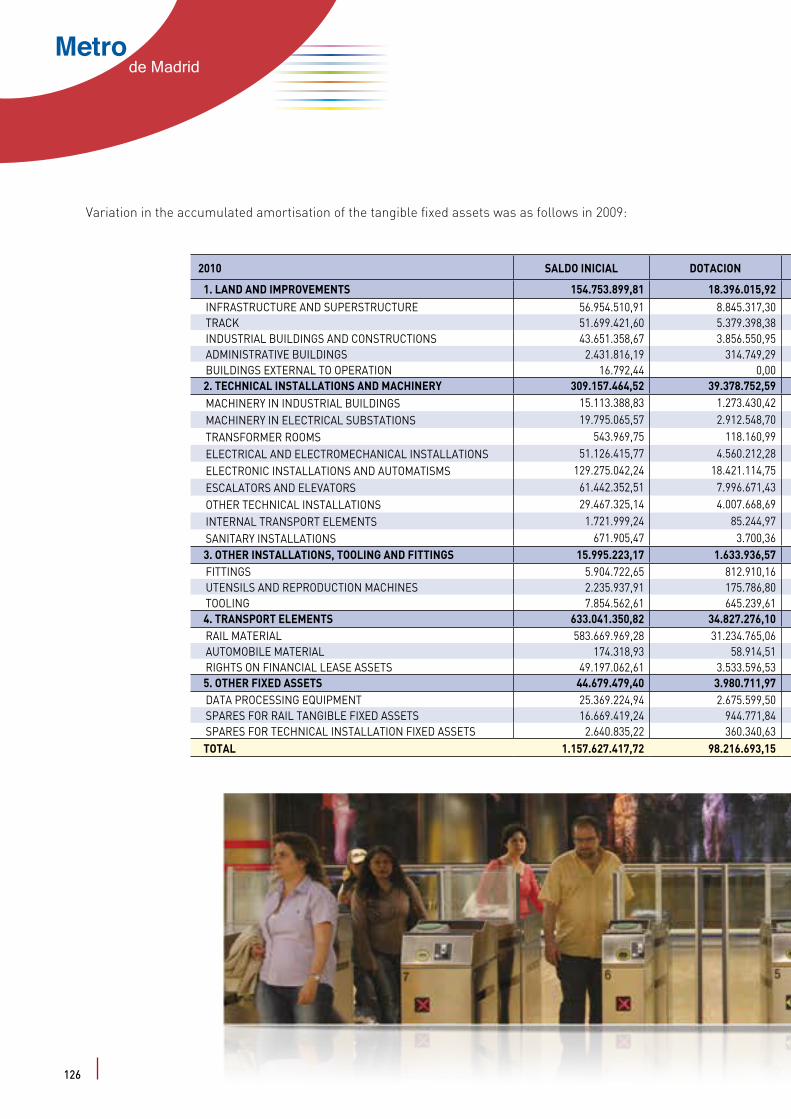
Metrode Madrid
Variation in the accumulated amortisation of the tangible fixed assets was as follows in 2009:
2010 SALDO INICIAL DOTACION BAJAS TRASPASOS SALDO FINAL TOTALMENTE AMORTIZADO
1. LAND AND IMPROVEMENTS 154.753.899,81 18.396.015,92 - - 173.149.915,73 42.841.889,85INFRASTRUCTURE AND SUPERSTRUCTURE 56.954.510,91 8.845.317,30 - - 65.799.828,21 -TRACK 51.699.421,60 5.379.398,38 - - 57.078.819,98 37.160.963,26INDUSTRIAL BUILDINGS AND CONSTRUCTIONS 43.651.358,67 3.856.550,95 - - 47.507.909,62 5.680.926,59ADMINISTRATIVE BUILDINGS 2.431.816,19 314.749,29 - - 2.746.565,48 -BUILDINGS EXTERNAL TO OPERATION 16.792,44 0,00 - - 16.792,44 -2. TECHNICAL INSTALLATIONS AND MACHINERY 309.157.464,52 39.378.752,59 108.599,04 - 348.427.618,07 143.719.144,53MACHINERY IN INDUSTRIAL BUILDINGS 15.113.388,83 1.273.430,42 108.599,04 - 16.278.220,21 11.554.203,11MACHINERY IN ELECTRICAL SUBSTATIONS 19.795.065,57 2.912.548,70 - - 22.707.614,27 10.717.505,28TRANSFORMER ROOMS 543.969,75 118.160,99 - - 662.130,74 -ELECTRICAL AND ELECTROMECHANICAL INSTALLATIONS 51.126.415,77 4.560.212,28 - - 55.686.628,05 23.533.545,53ELECTRONIC INSTALLATIONS AND AUTOMATISMS 129.275.042,24 18.421.114,75 - - 147.696.156,99 51.356.524,75ESCALATORS AND ELEVATORS 61.442.352,51 7.996.671,43 - - 69.439.023,94 35.462.819,88OTHER TECHNICAL INSTALLATIONS 29.467.325,14 4.007.668,69 - - 33.474.993,83 9.033.679,39INTERNAL TRANSPORT ELEMENTS 1.721.999,24 85.244,97 - - 1.807.244,21 1.394.548,69SANITARY INSTALLATIONS 671.905,47 3.700,36 - - 675.605,83 666.317,903. OTHER INSTALLATIONS, TOOLING AND FITTINGS 15.995.223,17 1.633.936,57 100.457,17 - 17.528.702,57 13.044.370,25FITTINGS 5.904.722,65 812.910,16 - - 6.717.632,81 3.875.735,68UTENSILS AND REPRODUCTION MACHINES 2.235.937,91 175.786,80 100.457,17 - 2.311.267,54 1.730.203,17TOOLING 7.854.562,61 645.239,61 - - 8.499.802,22 7.438.431,404. TRANSPORT ELEMENTS 633.041.350,82 34.827.276,10 - - 667.868.626,92 341.315.251,39RAIL MATERIAL 583.669.969,28 31.234.765,06 - - 614.904.734,34 341.273.635,70AUTOMOBILE MATERIAL 174.318,93 58.914,51 - - 233.233,44 41.615,69RIGHTS ON FINANCIAL LEASE ASSETS 49.197.062,61 3.533.596,53 - - 52.730.659,14 -5. OTHER FIXED ASSETS 44.679.479,40 3.980.711,97 182.699,68 - 48.477.491,69 34.072.868,73DATA PROCESSING EQUIPMENT 25.369.224,94 2.675.599,50 - - 28.044.824,44 22.925.773,43SPARES FOR RAIL TANGIBLE FIXED ASSETS 16.669.419,24 944.771,84 163.692,08 - 17.450.499,00 10.138.252,79SPARES FOR TECHNICAL INSTALLATION FIXED ASSETS 2.640.835,22 360.340,63 19.007,60 - 2.982.168,25 1.008.842,51TOTAL 1.157.627.417,72 98.216.693,15 391.755,89 - 1.255.452.354,98 574.993.524,75
126

AnnualReport2010
Variation in the accumulated amortisation of the tangible fixed assets was as follows in 2009:
2010 SALDO INICIAL DOTACION BAJAS TRASPASOS SALDO FINAL TOTALMENTE AMORTIZADO
- - 173.149.915,73 42.841.889,85- - 65.799.828,21 -- - 57.078.819,98 37.160.963,26- - 47.507.909,62 5.680.926,59- - 2.746.565,48 -- - 16.792,44 -
108.599,04 - 348.427.618,07 143.719.144,53108.599,04 - 16.278.220,21 11.554.203,11
- - 22.707.614,27 10.717.505,28- - 662.130,74 -- - 55.686.628,05 23.533.545,53- - 147.696.156,99 51.356.524,75- - 69.439.023,94 35.462.819,88- - 33.474.993,83 9.033.679,39- - 1.807.244,21 1.394.548,69- - 675.605,83 666.317,90
100.457,17 - 17.528.702,57 13.044.370,25- - 6.717.632,81 3.875.735,68
100.457,17 - 2.311.267,54 1.730.203,17- - 8.499.802,22 7.438.431,40- - 667.868.626,92 341.315.251,39- - 614.904.734,34 341.273.635,70- - 233.233,44 41.615,69- - 52.730.659,14 -
182.699,68 - 48.477.491,69 34.072.868,73- - 28.044.824,44 22.925.773,43
163.692,08 - 17.450.499,00 10.138.252,7919.007,60 - 2.982.168,25 1.008.842,51
391.755,89 - 1.255.452.354,98 574.993.524,75
1. LAND AND IMPROVEMENTS 154.753.899,81 18.396.015,92INFRASTRUCTURE AND SUPERSTRUCTURE 56.954.510,91 8.845.317,30TRACK 51.699.421,60 5.379.398,38INDUSTRIAL BUILDINGS AND CONSTRUCTIONS 43.651.358,67 3.856.550,95ADMINISTRATIVE BUILDINGS 2.431.816,19 314.749,29BUILDINGS EXTERNAL TO OPERATION 16.792,44 0,002. TECHNICAL INSTALLATIONS AND MACHINERY 309.157.464,52 39.378.752,59MACHINERY IN INDUSTRIAL BUILDINGS 15.113.388,83 1.273.430,42MACHINERY IN ELECTRICAL SUBSTATIONS 19.795.065,57 2.912.548,70TRANSFORMER ROOMS 543.969,75 118.160,99ELECTRICAL AND ELECTROMECHANICAL INSTALLATIONS 51.126.415,77 4.560.212,28ELECTRONIC INSTALLATIONS AND AUTOMATISMS 129.275.042,24 18.421.114,75ESCALATORS AND ELEVATORS 61.442.352,51 7.996.671,43OTHER TECHNICAL INSTALLATIONS 29.467.325,14 4.007.668,69INTERNAL TRANSPORT ELEMENTS 1.721.999,24 85.244,97SANITARY INSTALLATIONS 671.905,47 3.700,363. OTHER INSTALLATIONS, TOOLING AND FITTINGS 15.995.223,17 1.633.936,57FITTINGS 5.904.722,65 812.910,16UTENSILS AND REPRODUCTION MACHINES 2.235.937,91 175.786,80TOOLING 7.854.562,61 645.239,614. TRANSPORT ELEMENTS 633.041.350,82 34.827.276,10RAIL MATERIAL 583.669.969,28 31.234.765,06AUTOMOBILE MATERIAL 174.318,93 58.914,51RIGHTS ON FINANCIAL LEASE ASSETS 49.197.062,61 3.533.596,535. OTHER FIXED ASSETS 44.679.479,40 3.980.711,97DATA PROCESSING EQUIPMENT 25.369.224,94 2.675.599,50SPARES FOR RAIL TANGIBLE FIXED ASSETS 16.669.419,24 944.771,84SPARES FOR TECHNICAL INSTALLATION FIXED ASSETS 2.640.835,22 360.340,63TOTAL 1.157.627.417,72 98.216.693,15
127
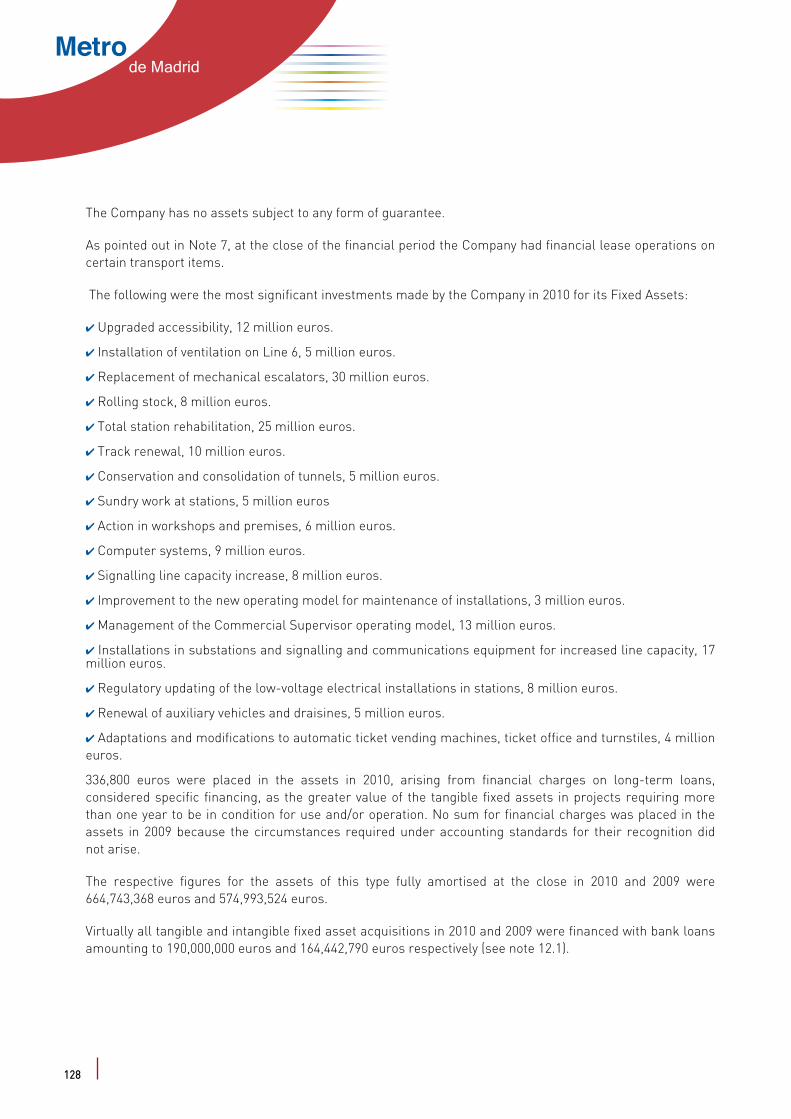
Metrode Madrid
The Company has no assets subject to any form of guarantee.
As pointed out in Note 7, at the close of the financial period the Company had financial lease operations on certain transport items.
The following were the most significant investments made by the Company in 2010 for its Fixed Assets:
4 Upgraded accessibility, 12 million euros.
4 Installation of ventilation on Line 6, 5 million euros.
4 Replacement of mechanical escalators, 30 million euros.
4 Rolling stock, 8 million euros.
4 Total station rehabilitation, 25 million euros.
4 Track renewal, 10 million euros.
4 Conservation and consolidation of tunnels, 5 million euros.
4 Sundry work at stations, 5 million euros
4 Action in workshops and premises, 6 million euros.
4 Computer systems, 9 million euros.
4 Signalling line capacity increase, 8 million euros.
4 Improvement to the new operating model for maintenance of installations, 3 million euros.
4 Management of the Commercial Supervisor operating model, 13 million euros.
4 Installations in substations and signalling and communications equipment for increased line capacity, 17 million euros.
4 Regulatory updating of the low-voltage electrical installations in stations, 8 million euros.
4 Renewal of auxiliary vehicles and draisines, 5 million euros.
4 Adaptations and modifications to automatic ticket vending machines, ticket office and turnstiles, 4 million euros.
336,800 euros were placed in the assets in 2010, arising from financial charges on long-term loans, considered specific financing, as the greater value of the tangible fixed assets in projects requiring more than one year to be in condition for use and/or operation. No sum for financial charges was placed in the assets in 2009 because the circumstances required under accounting standards for their recognition did not arise.
The respective figures for the assets of this type fully amortised at the close in 2010 and 2009 were 664,743,368 euros and 574,993,524 euros.
Virtually all tangible and intangible fixed asset acquisitions in 2010 and 2009 were financed with bank loans amounting to 190,000,000 euros and 164,442,790 euros respectively (see note 12.1).
128
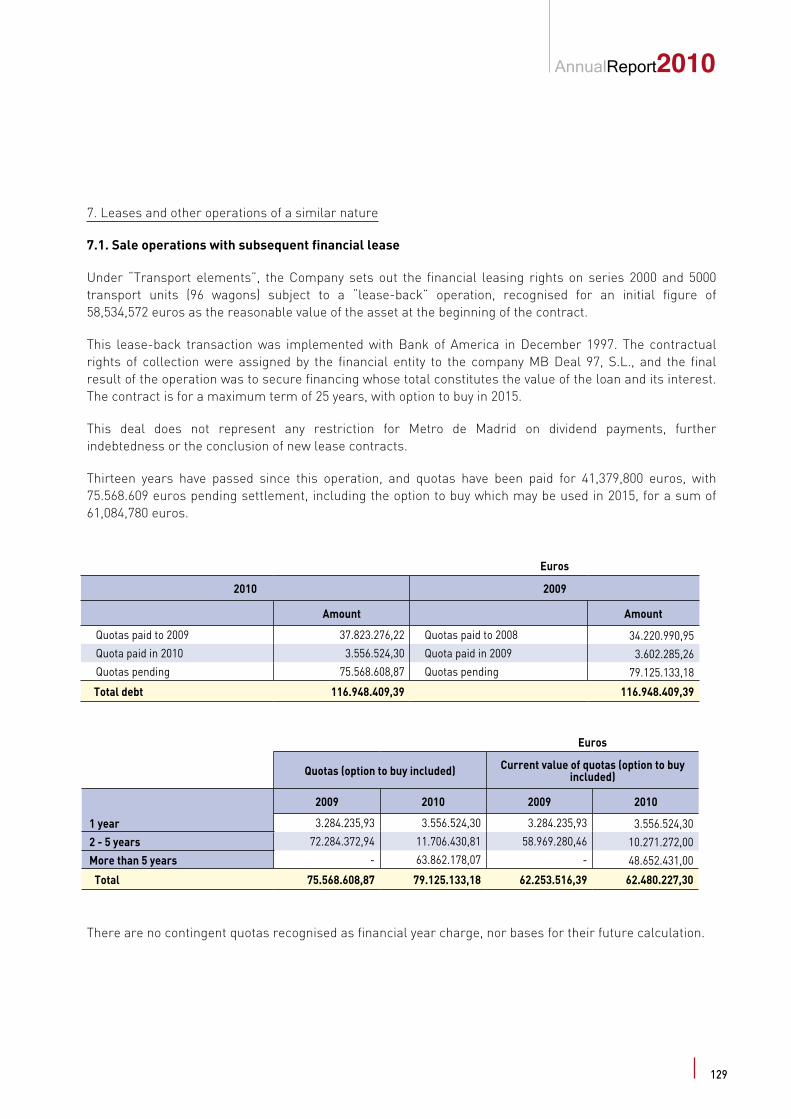
AnnualReport2010
7. Leases and other operations of a similar nature
7.1. Sale operations with subsequent financial lease
Under “Transport elements”, the Company sets out the financial leasing rights on series 2000 and 5000 transport units (96 wagons) subject to a “lease-back” operation, recognised for an initial figure of 58,534,572 euros as the reasonable value of the asset at the beginning of the contract.
This lease-back transaction was implemented with Bank of America in December 1997. The contractual rights of collection were assigned by the financial entity to the company MB Deal 97, S.L., and the final result of the operation was to secure financing whose total constitutes the value of the loan and its interest. The contract is for a maximum term of 25 years, with option to buy in 2015.
This deal does not represent any restriction for Metro de Madrid on dividend payments, further indebtedness or the conclusion of new lease contracts.
Thirteen years have passed since this operation, and quotas have been paid for 41,379,800 euros, with 75.568.609 euros pending settlement, including the option to buy which may be used in 2015, for a sum of 61,084,780 euros.
Euros
2010 2009
Amount Amount
Quotas paid to 2009 37.823.276,22 Quotas paid to 2008 34.220.990,95Quota paid in 2010 3.556.524,30 Quota paid in 2009 3.602.285,26Quotas pending 75.568.608,87 Quotas pending 79.125.133,18
Total debt 116.948.409,39 116.948.409,39
Euros
Quotas (option to buy included) Current value of quotas (option to buy included)
2009 2010 2009 2010
1 year 3.284.235,93 3.556.524,30 3.284.235,93 3.556.524,30
2 - 5 years 72.284.372,94 11.706.430,81 58.969.280,46 10.271.272,00
More than 5 years - 63.862.178,07 - 48.652.431,00
Total 75.568.608,87 79.125.133,18 62.253.516,39 62.480.227,30
There are no contingent quotas recognised as financial year charge, nor bases for their future calculation.
129

Metrode Madrid
7.2. Operational leases
The Company has evaluated all the operations described in this section in line with accounting standards and has classified them as operational lease operations. The lease payments are charged to the Profit and Loss Account linearly throughout the term of the lease.
Operational rolling stock lease deals include all maintenance by the lessor.
In these operations, the lessor passes the cost of insurance for damage to assets belonging to it on to the lessee. These operations do not involve any restriction on Metro de Madrid in paying dividends, additional indebtedness or further lease contracts.
The cost of operational lease during 2010 and 2009 is broken down in the following classification:
Euros
2010 2009
Operational leases. Financial year charge Amount Amount
Caixarenting 7000 5.915.833,13 5.915.732,52Caixarenting 6000 1.223.416,32 1.223.416,32Ferromóvil 3000 S. L. 43.125.913,11 48.182.839,81Ferromóvil 9000 S. L. 27.496.835,00 31.422.432,26Plan Azul S. L. 33.761.423,70 33.533.396,60Canon Mitra 288.445.350,36 280.044.029,28Plan Metro S. A. 343.880,15 -Other leases 8.923.114,75 10.483.467,73
Total 409.235.766,52 410.805.314,52
130

AnnualReport2010
7.2. Operational leases
The Company has evaluated all the operations described in this section in line with accounting standards and has classified them as operational lease operations. The lease payments are charged to the Profit and Loss Account linearly throughout the term of the lease.
Operational rolling stock lease deals include all maintenance by the lessor.
In these operations, the lessor passes the cost of insurance for damage to assets belonging to it on to the lessee. These operations do not involve any restriction on Metro de Madrid in paying dividends, additional indebtedness or further lease contracts.
The cost of operational lease during 2010 and 2009 is broken down in the following classification:
Euros
2010 2009
Operational leases. Financial year charge Amount Amount
Caixarenting 7000 5.915.833,13 5.915.732,52Caixarenting 6000 1.223.416,32 1.223.416,32Ferromóvil 3000 S. L. 43.125.913,11 48.182.839,81Ferromóvil 9000 S. L. 27.496.835,00 31.422.432,26Plan Azul S. L. 33.761.423,70 33.533.396,60Canon Mitra 288.445.350,36 280.044.029,28Plan Metro S. A. 343.880,15 -Other leases 8.923.114,75 10.483.467,73
Total 409.235.766,52 410.805.314,52
At the close of the 2010 financial period, the Company had lease contracts which will remain in force during the coming years in the form of payment obligations classified as follows according to maturity:
Operational leases - future quotas Euros
Maturing after 1 year 2010 2009
Caixarenting 7000 5.915.732,52 5.915.732,52Caixarenting 6000 1.223.416,32 1.223.416,32Ferromóvil 3000 S. L. 58.380.584,74 59.893.379,26Ferromóvil 9000 S. L. 37.261.513,59 38.222.563,53Plan Azul S. L. 34.622.340,22 33.761.423,70Plan Metro S. A. 27.996.999,85 4.046.535,83Mitra 297.102.557,15 288.445.350,17Other leases 6.516.754,12 7.517.906,38
Total 469.019.898,51 439.026.307,71
Maturing from 2 - 5 years 2010 2009
Caixarenting 7000 23.662.930,08 23.662.930,08Caixarenting 6000 4.893.665,28 4.893.665,28Ferromóvil 3000 S. L. 218.463.145,96 224.512.967,10Ferromóvil 9000 S. L. 139.480.381,81 143.323.264,12Plan Azul S. L. 138.489.360,90 135.045.695,66Plan Metro S. A. 149.695.953,75 138.871.626,06Mitra 1.280.251.503,96 1.242.964.842,52Other leases 14.966.666.67 15.847.134,60
Total 1.969.903.608,41 1.929.122.125,42
Maturing in more than 5 years 2010 2009
Caixarenting 7000 20.705.063,82 26.620.796,34Caixarenting 6000 2.956.589,44 4.180.005,76Ferromóvil 3000 S. L. 364.306.329,79 416.637.093,39Ferromóvil 9000 S. L. 232.841.402,34 266.260.033,62Plan Azul S. L. 242.356.381,57 270.091.391,31Plan Metro S. A. 563.689.701,50 602.511.029,01Mitra 2.877.261.110,82 3.211.650.329,41Other leases 20.798.387,10 8.566.666,67
Total 4.324.914.966,38 4.806.517.345,51
131
Metrode Madrid
In its position as lessee, the Company’s most significant lease contracts at the 2010 close were:
a) Lease contracts for rolling stock to operate the existing network and new extensions.
a.1) A lease contract was concluded in 2001 with CAIXARENTING, S.A. for lease of six broad-gauge type MRSSRM, dual-voltage 600 V DC/1,500 V DC units, for commercial passenger traffic, maturing in 2019. The lease quotas acknowledged as charges during 2010 and 2009 amounted in turn to 5.915.833 euros and 5,915,733 euros, including maintenance charges and insurance for 1,652,259 euros for each period. There are no contingent charges or renewal terms, nor options to buy this material.
Euros
Caixarenting 7000 1 year 2 - 5 years More than 5 years
Quotas 5.915.732,52 23.662.930,08 20.705.063,82
a.2) In June 2002, the lease was contracted with CAIXARENTING, S.A. of thirteen series 6000 trailer wagons, maturing in 2018. Lease charges recognised as expenditure in 2010 and 2009 amounted to 1,223,416 euros in each period, including maintenance and insurance costs of 416,716 euros. There are neither contingent charges nor options to buy on this material.
Euros
Caixarenting 6000 1 year 2 - 5 years More than 5 years
Quotas 1.223.416,32 4.893.665,28 2.956.589,44
a.3) Two contracts were concluded in 2006 with the Companies Ferromóvil 3000, S.L. and Ferromóvil 9000, S.L. for lease of rolling stock to meet the requirements for the extended network in 2007. The following material was the subject of this lease:
Series Subseries Number of units Composition Gauge Lessor3000 1 36 MRSSRM Narrow Ferromóvil 30003000 3 54 MRSM Narrow Ferromóvil 30009000 1 26 MRSSRM Broad Ferromóvil 90009000 2 6 MRSSRM Broad Ferromóvil 90009000 3 20 MRM Broad Ferromóvil 9000
These leases are for 17 years, and both contracts end on 31 December 2023. In 2010 and 2009 the lease quotas met under them amounted to 84,348,076 euros and 96,045,539 euros, including contingent quotas of 13,767,867 euros in 2010 and 4,780,171 euros in 2009, entered as lesser financial year charge. Metro de Madrid has no options to buy this material.
132

AnnualReport2010
Under these contracts, the lease quotas are not linear. The Company has recognised expenditure of 70.622.748 euros in the profit and loss account for the cost passed on linearly in 2010, less the impact of contingent quotas. The difference between the cost acknowledged during the period and the lease charges paid to the lessors since the contracts began are entered under the Balance Sheet heading “VI. Short term scheduling” (See note 15).
The total future minimum payments of the lease in this case are as follows:
Euros
Ferromóvil 3000, S. L. 1 year 2 - 5 years More than 5 years
Quotas 58.380.584,74 218.463.145,96 364.306.329,79
Euros
Ferromóvil 9000, S. L. 1 year 2 - 5 years More than 5 years
Quotas 37.261.513,59 139.480.381,81 232.841.402,34
Under the lease contract with Ferromóvil 9000, S.L. and as a consequence of the delay in the delivery of the rolling stock according to the schedules agreed, in 2008 the final amount was determined with the manufacturer of the trains for penalties accrued for the delay, and amounting to 17,258,173 euros. It was arranged that this would be paid by the train manufacturer on delivery of a 9000 dual-voltage train, and its maintenance for 21 years. This train was delivered in 2010, and is in operation.
a.4) An operational lease agreement was signed in 2007 with the company Plan Azul 07, S.L. for rail rolling stock, which came into effect in 2008 and is for a 15 year non-renewable term, for the following material:
Series Number of units Composition Gauge6000 22 Trailer wagons Broad7000 31 6 wagon units Broad8000 53 3 wagon units Broad
The lease quota recognised as a charge during the 2010 financial period amounted to 33,761,424 euros including 622,382 euros making up the contingent part generated by the 85% increase in the CPI over previous years. In 2009, the lease quotas recognised as charge were 33,533,397 euros, including a 394,355 euro contingent quota.
There is an option to buy under this contract, but is not expected to be used as it is thought it will exceed the value of the goods at the moment when the contract ends.
133
Metrode Madrid
The following table sets out the total future minimum payments of this lease:
Euros
Plan azul O7, S . L. 1 year 2 - 5 years More than 5 years
Quotas 34.622.340,22 138.489.360,90 242.356.381,57
a.5) An operational lease agreement was signed in 2008 with the company Plan Metro S.A. for rail rolling stock and for a term of 17 years, designed to upgrade and extend the transport service in the coming years. The first quotas accrued in 2010, for 343,880 euros, with the reception and commissioning of the first 14 units of material leased.
There is an option to buy under this contract, but is not expected to be used as it is thought it will exceed the value of the goods at the moment when the contract ends.
Total future minimum payments for this lease appear on this table:
Euros
Plan metro, S . A. 1 year 2 - 5 years More than 5 years
Quotas 27.996.999,85 149.695.953,75 563.689.701,50
134
AnnualReport2010
b) Infrastructure lease agreements
A lease agreement was signed in 2001 with “Madrid Infraestructuras del Transporte (MINTRA)”, a public corporation created under Act No. 22/1999 of the Assembly of Madrid of 21 December, for rail infrastructure intended to link the main municipalities in the south of the Community of Madrid, called Line 12, and the completely upgraded and remodelled infrastructure on line 10.
An addendum was included in that contract during the 2007 financial period to adjust the terms for lease of the rolling stock to be run on those infrastructures, extending it to December 2022. The charges recognised as cost during the 2010 and 2009 financial years amounted in turn to 126.284.663 euros and 122,606,468 euros.
In 2007, a lease agreement was concluded with “Madrid Infraestructuras del Transporte (MINTRA)” for the new rail infrastructures included in the 2003-2007 Enlargement Plan promoted by the Madrid Regional Government and made available to Metro de Madrid, S.A. for commercial operation on the extensions to Lines 1-5, 7, 10 and 11, and the construction of three new intermediate stations. The contract is for a 15 year term ending in the 2023 financial period. The quotas recognised as charge in 2010 and 2009 were 162,160,687 euros and 157,437,561 euros respectively.
There are no contingent quotas added to the lease charge for 2010 nor terms of renewal nor options to buy on these infrastructures.
The following are the total minimum future payments of this lease:
Euros
Mitra 1 year 2 - 5 years More than 5 years
Quotas 297.102.557,15 1.280.251.503,96 2.877.261.110,82
135
Metrode Madrid
8. Financial assets
8.1.- Long- and short-term financial assets (except Investments in Associate Companies)
The book value of financial assets corresponds to their reasonable value.
Classification of financial assets in 2010 and 2009 by category and class, excluding investments in Group and Associated Companies, is as follows:
Euros
Non current
Amortised cost or costBook value
2010 2009
Loans and receivables
Credits 12.155.267,62 9.432.329,04Deposits and bonds 279.302,10 295.009,10Other financial assets 7.348.977,05 7.198.653,17Commercial debtors and other receivables
l Clients, sales and services - - l Other receivables - -
Total loans and receivables 19.783.546,77 16.925.991,31
Euros
Current
Amortised cost or costBook value
2010 2009
Loans and receivables
Credits - -Deposits and bonds - -Other financial assets 311.552,37 372.320,17Commercial debtors and other receivables 151.420.096,31 113.303.141,37 l Clients, sales and services 90.177.286,84 61.404.746,82 l Other receivables 61.242.809,47 51.898.394,55
Total loans and receivables 151.731.648,68 113.675.461,54
Cash and other equivalent liquid assets
l Cash & Banks 164.309.214,73 277.558.881,52l Other equivalent liquid assets - 9.989.557,97
Total cash and other liquid assets 164.309.214,73 287.548.439,49
136
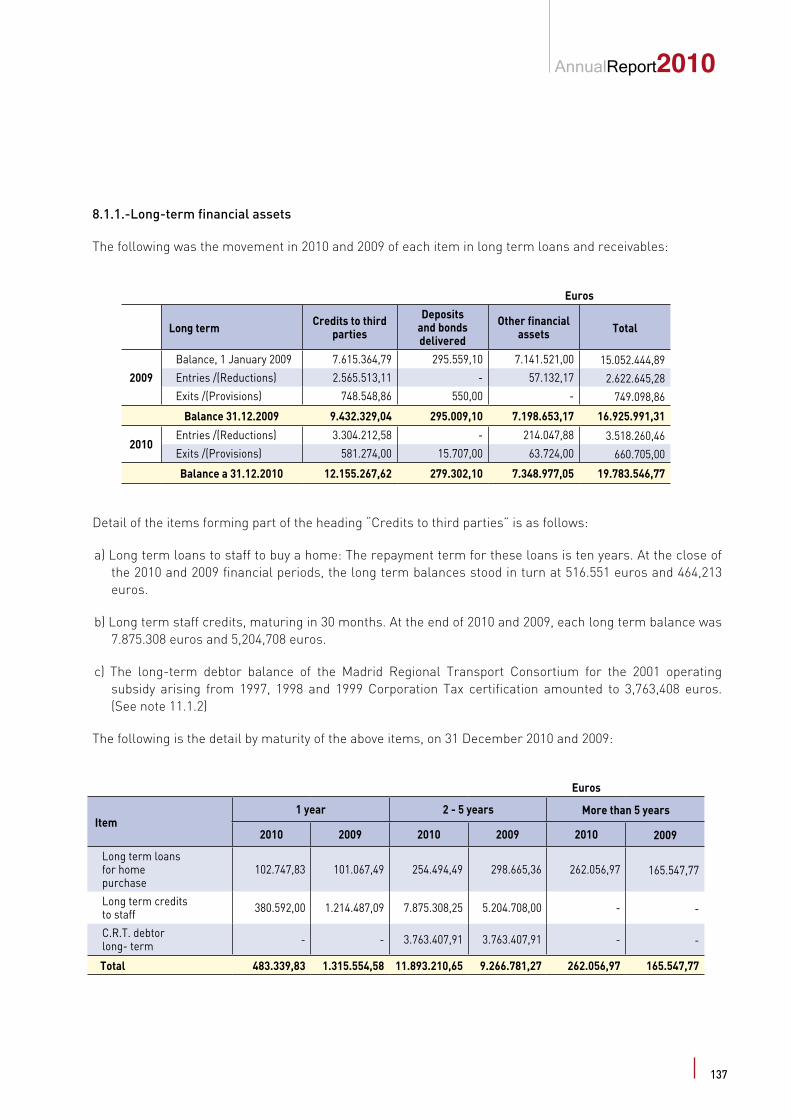
AnnualReport2010
8.1.1.-Long-term financial assets
The following was the movement in 2010 and 2009 of each item in long term loans and receivables:
Euros
Long term Credits to third parties
Deposits and bonds delivered
Other financial assets Total
2009
Balance, 1 January 2009 7.615.364,79 295.559,10 7.141.521,00 15.052.444,89Entries /(Reductions) 2.565.513,11 - 57.132,17 2.622.645,28Exits /(Provisions) 748.548,86 550,00 - 749.098,86
Balance 31.12.2009 9.432.329,04 295.009,10 7.198.653,17 16.925.991,31
2010Entries /(Reductions) 3.304.212,58 - 214.047,88 3.518.260,46Exits /(Provisions) 581.274,00 15.707,00 63.724,00 660.705,00
Balance a 31.12.2010 12.155.267,62 279.302,10 7.348.977,05 19.783.546,77
Detail of the items forming part of the heading “Credits to third parties” is as follows:
a) Long term loans to staff to buy a home: The repayment term for these loans is ten years. At the close of the 2010 and 2009 financial periods, the long term balances stood in turn at 516.551 euros and 464,213 euros.
b) Long term staff credits, maturing in 30 months. At the end of 2010 and 2009, each long term balance was 7.875.308 euros and 5,204,708 euros.
c) The long-term debtor balance of the Madrid Regional Transport Consortium for the 2001 operating subsidy arising from 1997, 1998 and 1999 Corporation Tax certification amounted to 3,763,408 euros. (See note 11.1.2)
The following is the detail by maturity of the above items, on 31 December 2010 and 2009:
Euros
Item1 year 2 - 5 years More than 5 years
2010 2009 2010 2009 2010 2009
Long term loans for home purchase
102.747,83 101.067,49 254.494,49 298.665,36 262.056,97 165.547,77
Long term credits to staff 380.592,00 1.214.487,09 7.875.308,25 5.204.708,00 - -
C.R.T. debtor long- term - - 3.763.407,91 3.763.407,91 - -
Total 483.339,83 1.315.554,58 11.893.210,65 9.266.781,27 262.056,97 165.547,77
137
Metrode Madrid
The heading “Other financial assets” contains the long term figure for the penalty for delay in the delivery of trains under the lease contract with Ferromóvil 9000 SL (see note 7).
There is no significant difference between the book value and the reasonable value of the Company’s financial assets.
8.1.2.- Short-term financial assets
The following is the detail of the items included under “commercial debtors and other receivables” (in euros):
2010 2009
Clients, sales and services 85.465.777,93 57.587.593,95Clients, group and associate companies 4.711.508,91 3.817.152,87Sundry debtors 7.895.051,67 5.857.423,87Personnel 483.339,83 1.315.554,58Other credits, Public Administrations (see note 14.1) 52.864.417,97 44.725.416,10
Total 151.420.096,31 113.303.141,37
In 2010, the Company made provision for a correction for deterioration in the figure for commercial debtors amounting to 127,761 euros (the 2009 figure for this item was 119,257 euros).
Euros
Commercial accounts receivable Deterioration of value
Initial balance 2009 19.827,16Provisions 119.256,91Aplications and cancellations -
Final balance 2009 139.084,07
Provisions 136.997,60Aplications and cancellations 9.236,92
Final balance 2010 266.844,75
The following is the detail under the heading Cash and Other Equivalent Assets:
Euros
Item 2010 2009
Cash 12.968.234,83 11.839.577,99Banks 151.340.979,90 265.719.303,53Other equivalent assets - 9.989.557,97
Total 164.309.214,73 287.548.439,49
138
AnnualReport2010
The 2009 “equivalent liquid assets” took the form of placement of excess cash in Public Treasury Notes with a buyback pact in financial institutions for deposits not exceeding 3 months.
There was a cash placement on 31 December 2009 using Public Treasury Notes with a buy-back option through Bankinter in the following conditions:
Euros
Entity Amount in euros Maturity Rate Cash, euros
Bankinter 9.989.557,97 04/01/2010 0,30% 9.989.968,50
Total 9.989.557,97 - - 9.989.968,50
The interest accrued in the Company’s favour is entered on the maturity of the investment concerned, and does not vary throughout their term of maturity because of the scant repercussion such deferral would have in determining the results of each financial period.
139
Metrode Madrid
To ensure liquidity and to meet all the payment commitments arising from its activity, the Company has the cash and banks shown on its Balance Sheet, together with credit and financing lines, on which credit has not been drawn, amounting to 42 million euros.
Euros
CREDIT POLICIES 2010 2009
BANK Drawn Limit Maturity Drawn Limit Maturity
SANTANDER - 18.000.000 19/11/2011 - 18.000.000 19/11/2010LA CAIXA - 12.000.000 19/11/2011 - 12.000.000 19/11/2010SABADELL ATLANTICO - 12.000.000 19/11/2011 - 12.000.000 19/11/2010
CAJA MADRID - - - - 10.000.000 19/11/2010
42.000.000 52.000.000
Likewise, at the close of the 2010 and 2009 financial periods there was a balance in the bank accounts of 151,340,980 euros and 265,719,304 euros respectively.
8.2.- Investments in associate companies
The following was the movement of each item in this section in the 2010 and 2009 financial years:
Euros
Long-term Associate Company Holdings
Credits to Associate Companies Totals
2009
Initial balance 42.056.846,26 260.876,58 42.317.722,84Entries/(reductions) - 10.302,28 10.302,28Exits/(provisions) - - -
Final balance 2009 42.056.846,26 271.178,86 42.328.025,12
2010Entries/(reductions) - 10.578,52 10.578,52Exits/(provisions) -3.380.871,12 - -3.380.871,12
Final balance 2010 38.675.975,14 281.757,38 38.957.732,52
On 30 November 2007, Metro de Madrid, S.A. provided a loan to Metros Ligeros de Madrid, S.A. for 255,000 euros at 4.75% annual interest, maturing in 2034. In June 2009 and 2010, the interest accrued on those dates was capitalised so that the totals drawn down were 271,178.86 and 281.757 euros respectively. Interest accrued on 31 December 2010 and 2009 and pending collection amounted in turn to 6,493.43 euros and 6,844 euros.
140
AnnualReport2010
The most significant information connected with associate companies at the end of the financial year is as follows: in all cases, the percentage holdings set out coincide with the Company’s voting rights in the enterprises in which it has a stake:
Transportes Ferroviarios de Madrid, S.A., With a 42.5 per cent holding, Metro de Madrid, S.A.’s total investment stands at 17,859,316 euros represented by 297,160 registered shares each of a par value of 60,10 euros not listed on the Stock Exchange and fully paid up. Transportes Ferroviarios de Madrid, S. A. holds the concession for the construction and operation of the extension of Line 9 between Puerta de Arganda and Arganda del Rey.
The Company’s Annual Accounts are being audited to 31 December 2010. No dividends were paid during the financial year.
On 31 December 2010, the Company had made a provision for deterioration amounting to 3,380,871 as an upshot of the analysis of Transportes Ferroviarios’ business using the most probable future hypotheses.
The amount recoverable from Transportes Ferroviarios de Madrid S.A. has been calculated as the current value of the Company’s stake in the cashflow expected to be generated by that associate company from its ordinary activity and from its alienation.
Calculation of the current value of the cashflow was based on the following hypotheses:
1. Cashflow was projected based on the operating results set in the concession’s business plan to 19 years.
2. The discount rate used was 6.27%, estimated on the base of the Weighted Mean Cost of Capitals of the sector corrected by the specified risk premium of the dependent entity.
000s of euros
Investee Company Year % Holding Capital Res.
Other net worth items
Financial year result
Total net worth
Deteriorating value of holding
Value of the investment
Transportes Ferroviarios de Madrid S.A. Dr. Esquerdo, 136 - 28007 MADRID
2010 42,50% 42.022 - 1.566 2.065 45.653 (3.381) 14.478
2009 42,50% 42.022 - 2.134 (438) 43.718 - 17.859
Metrocall, S.A. Metro de Madrid, S.A. has a 40% investment in the company, at an acquisition price of 1,502,530 euros. The Company’s capital is 2,750,000 euros in 62,500 registered shares each of a par value of 44 euros, not listed on the Stock Exchange. The company’s function is to introduce, manage and run a public telecommunications network able to provide mobile telephone service in Metro de Madrid’s network and installations.
141
Metrode Madrid
The Company’s Annual Accounts are being audited to 31 December 2010. No dividends were paid during the financial year.
000s of euros
Investee company Year % Holding Capital Res.
Other net worth items
Financial year result
Ajustments for change
of valueTotal net
worthValue of the investment
Metrocall, S. A. C/ Josefa Valcarcel, 26 MADRID
2010 40,00% 2.750 - (536) 864 (307) 2.771 1.503
2009 40,00% 2.750 - (1.020) 438 (340) 1.873 1.503
Metros Ligeros de Madrid S.A., with a 42.5% stake in the capital, Metro de Madrid S.A.’s total investment amounts to 22,695,000 euros. The Company’s Annual Accounts are being audited to 31 December 2010. Metros Ligeros de Madrid, S.A. holds the concession for the construction and operation of Light Metro Line ML1. No dividend payments were made during the financial year.
142
AnnualReport2010
The Company’s Annual Accounts are being audited to 31 December 2010. No dividends were paid during the financial year.
000s of euros
Investee company Year % Holding Capital Res.
Other net worth items
Financial year result
Ajustments for change
of valueTotal net
worthValue of the investment
Metrocall, S. A. C/ Josefa Valcarcel, 26 MADRID
2010 40,00% 2.750 - (536) 864 (307) 2.771 1.503
2009 40,00% 2.750 - (1.020) 438 (340) 1.873 1.503
Metros Ligeros de Madrid S.A., with a 42.5% stake in the capital, Metro de Madrid S.A.’s total investment amounts to 22,695,000 euros. The Company’s Annual Accounts are being audited to 31 December 2010. Metros Ligeros de Madrid, S.A. holds the concession for the construction and operation of Light Metro Line ML1. No dividend payments were made during the financial year.
000 of euros
Investee company Year % Holding Capital Res.
Other net worth items
Financial year result
Ajustments for change
of valueTotal net
worthValue of the investment
Metros Ligeros de Madrid, S. A. - Dr. Esquerdo, 136 - 28007 MADRID
2010 42,50% 19.800 - 33.679 1.579 (18.125) 36.933 22.695
2009 42,50% 19.800 - 33.076 604 (13.838) 39.642 22.695
8.3.- Information on the nature and level of risk of financial instruments
Management of the Company’s financial risks is centralised in the Economic Directorate which has the necessary mechanisms in place to control exposure to credit and liquidity hazards. The following are the main financial risks impacting the Company:
a) Credit risk:
The Company considers that there is no significant credit risk on its financial assets.
143
Metrode Madrid
b) Liquidity risk:
The Company has its cash and equivalent liquid assets in high-credit-level financial institutions in line with the conditions for investments of Public Corporations net surpluses defined in the Regional Government of Madrid’s General Budgets Act.
c) Market risk:
The Company considers the interest rate risk in its financial instruments to be negligible, nor is it engaged in operations which may bear an exchange rate risk. In 2010, a consultancy contract was concluded in Ecuador where there is an exchange rate risk. The Company is at this time examining the convenience of possibly covering it.
On the other hand, under the current Framework Agreement with the Madrid Regional Transport Consortium based on a financial regime governed by the principle of sufficient charges to meet all real costs in normal conditions of productivity and organisation, the risk of a variation in prices cannot be significant for the Company (see note 1).
9. Stocks
The following was the movement in procurements and consumption in the 2010 and 2009 financial periods:
Euros
Item Sundry materials Spares Office
material Ticketing UniformsValue
correction for deterioration
of stocksTotals
2009
Initial balance 2009 2.155.136,33 20.368.356,90 255.516,61 49,043,81 174.301,48 -2.174.103,48 20.798.251,65
Purchases 5.339.341,21 8.627.161,08 785.961,28 1.240.196,64 1.098.149,46 - 17.090.809,67Consumption -4.898.334,95 -8.414.312,76 -812.422,91 -1.282.080,89 -1.176.462,38 - -16.583.613,89Reversion/(Provision) - - - - - 18.349,90 18.349,90
Final balance 2009 2.596.142,59 20.581.205,22 199.054,98 7.159,56 95.988,56 -2.155.753,58 21.323.797,33
2010
Purchases 5.388.323,87 8.786.803,93 887.732,22 1.172.706,20 781.744,50 - 17.017.310,72Consumption -5.839.787,50 -8.616.571,10 -908.554,25 -1.161.541,41 -776.731,51 - -17.303.185,77Transfers (exits) -194.260,77 -6.795.946,32 - - - - -6.990.207,09
Reversion/(Provision) - - - - - 452.785,17 452.785,17
Final balance 2010 1.950.417,98 13.955.491,65 178.232,67 18.324,71 101.001,09 -1.702.968,41 14.500.500,36
144
AnnualReport2010
There are no firm commitments for purchase of stocks nor limitations on their availability due to guarantees, pledges, bonds and other similar factors.
At the close in 2010 and 2009, provision for deterioration in the value of stocks was in turn 1.702.968 euros and 2.155.754 euros as a consequence of the loss of value of stocks held by the Company.
In 2010, as a consequence of a new system for classification of spares, 6,990,207 euros were transferred to the tangible fixed assets (See note 6).
10. Net worth and equity
The composition and movement of the net worth is presented in the Statement of Changes of the Net Worth.
a) Capital
The Company’s capital on 31 December 2009 amounted to 14,084,428 euros divided into 4,679,212 bearer shares each of a par value of 3.01 euros, fully subscribed and paid up and all with the same rights.
There are no other rights incorporated, benefit debentures, convertible bonds, securities and similar financial liabilities.
According to data in the Company’s hands, the shareholders accounting for the capital are the Regional Government of Madrid and Madrid City Corporation with holdings in turn of twenty-five and seventy-five per cent. The rights on these shares are assigned to the Madrid Regional Regular Public Transport Consortium (see note 1).
b) Reserves
Pursuant to Article 214 of the Limited Companies Act, the “Legal Reserve” is paid up to the minimum required, of 20% of the capital.
The total under 2. “Other reserves” represents voluntary reserves and so is freely disposable.
c) Subsidies, donations and legacies
c.1) Capital Subsidies granted by the Regional Transport Consortium (C.R.T.M.)
These refer to the following non-reimbursable capital subsidies granted since 1991 by the Madrid Regional Transport Consortium for the procurement of assets:
145

Metrode Madrid
Euros
Equity 2010 2009
Balance on 1 january 885.532.449,12 949.680.158,00
AdmissionsGross figure - -Fiscal effect - -Transfer to resultsGross value -60.215.665,95 -64.345.832,00Fiscal effect 180.647,00 193.038,12Other adjustmentsAdjustment of subsidies from previous years -838.082,30 5.100.00
Fiscal effect 2.514,25 -15,00
Balance on 31 December 824.661.862,12 885.532.449,12
All capital subsidies received from the C.R.T.M. were used to acquire tangible and intangible assets.
In line with the Framework Agreement concluded with the Madrid Regional Transport Consortium, in 2010 and 2009 the Company accrued no sums by way of subsidies to acquire tangible and intangible fixed assets.
There is a figure of 598,026 euros under the heading “adjustment of subsidies from previous years” for the subsidy received in 2008 and not used to acquire fixed assets, and a figure of 240,056 euros for subsidies related with fixed assets discharged during the 2010 financial year.
c.2) Capital Subsidies granted by other Bodies
These are non-reimbursable Capital Subsidies arising from interest not applied to sums granted by Public Bodies for the conversion of assets for public activities such as museums and as aid for Research, Development and Innovation projects. Movement of these subsidies was as follows:
Euros
Equity 2010
Balance on 1 january -
Admissions
Gross figure 860.204.84
Fiscal effect -2.572,90
Transfer to results
Gross value -121.477,29
Fiscal effect 364,43
146
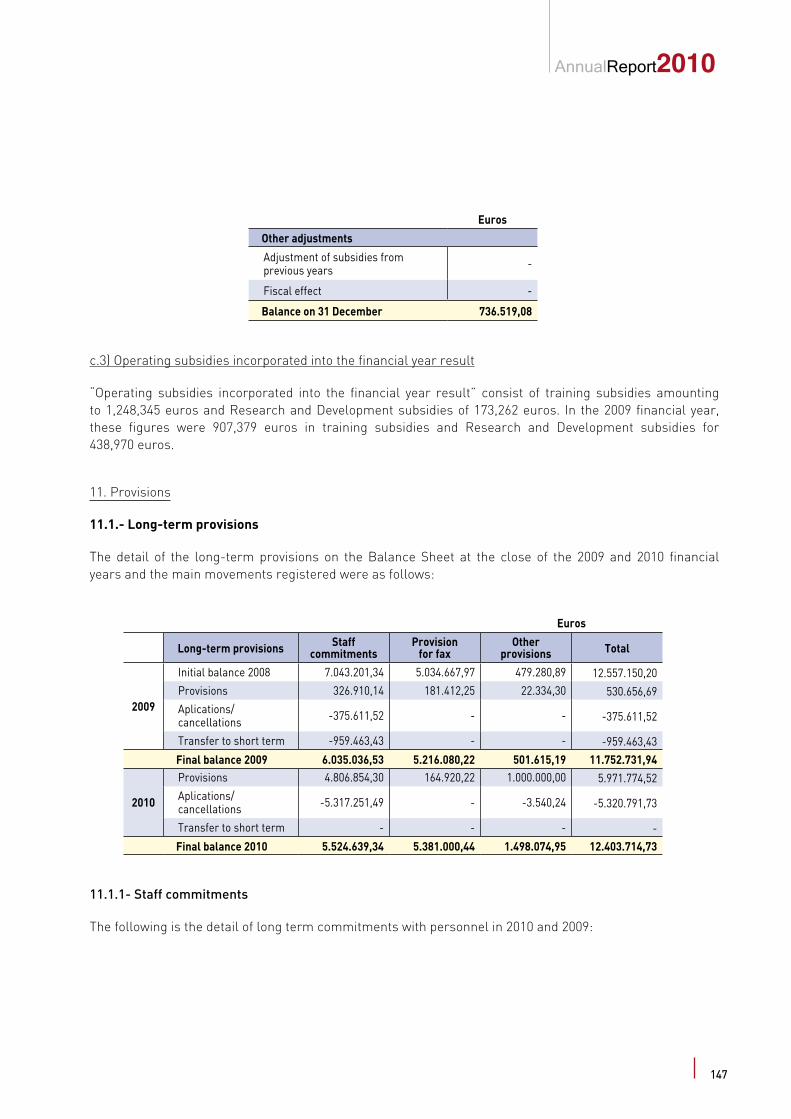
AnnualReport2010
Euros
Other adjustments
Adjustment of subsidies from previous years -
Fiscal effect -
Balance on 31 December 736.519,08
c.3) Operating subsidies incorporated into the financial year result
“Operating subsidies incorporated into the financial year result” consist of training subsidies amounting to 1,248,345 euros and Research and Development subsidies of 173,262 euros. In the 2009 financial year, these figures were 907,379 euros in training subsidies and Research and Development subsidies for 438,970 euros.
11. Provisions
11.1.- Long-term provisions
The detail of the long-term provisions on the Balance Sheet at the close of the 2009 and 2010 financial years and the main movements registered were as follows:
Euros
Long-term provisions Staff commitments
Provision for fax
Other provisions Total
2009
Initial balance 2008 7.043.201,34 5.034.667,97 479.280,89 12.557.150,20Provisions 326.910,14 181.412,25 22.334,30 530.656,69Aplications/ cancellations -375.611,52 - - -375.611,52
Transfer to short term -959.463,43 - - -959.463,43
Final balance 2009 6.035.036,53 5.216.080,22 501.615,19 11.752.731,94
2010
Provisions 4.806.854,30 164.920,22 1.000.000,00 5.971.774,52Aplications/ cancellations -5.317.251,49 - -3.540,24 -5.320.791,73
Transfer to short term - - - -
Final balance 2010 5.524.639,34 5.381.000,44 1.498.074,95 12.403.714,73
11.1.1- Staff commitments
The following is the detail of long term commitments with personnel in 2010 and 2009:
147
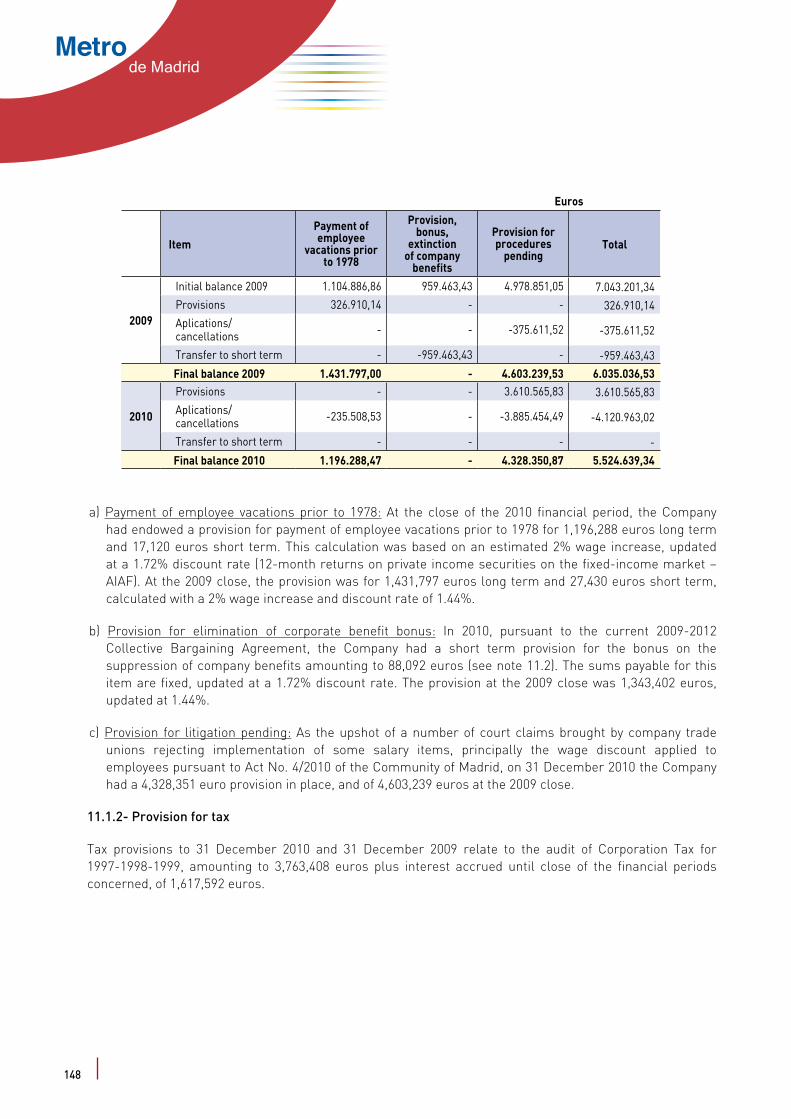
Metrode Madrid
Euros
Item
Payment of employee
vacations prior to 1978
Provision, bonus,
extinction of company
benefits
Provision for procedures
pendingTotal
2009
Initial balance 2009 1.104.886,86 959.463,43 4.978.851,05 7.043.201,34Provisions 326.910,14 - - 326.910,14Aplications/ cancellations - - -375.611,52 -375.611,52
Transfer to short term - -959.463,43 - -959.463,43
Final balance 2009 1.431.797,00 - 4.603.239,53 6.035.036,53
2010
Provisions - - 3.610.565,83 3.610.565,83Aplications/ cancellations -235.508,53 - -3.885.454,49 -4.120.963,02
Transfer to short term - - - -
Final balance 2010 1.196.288,47 - 4.328.350,87 5.524.639,34
a) Payment of employee vacations prior to 1978: At the close of the 2010 financial period, the Company had endowed a provision for payment of employee vacations prior to 1978 for 1,196,288 euros long term and 17,120 euros short term. This calculation was based on an estimated 2% wage increase, updated at a 1.72% discount rate (12-month returns on private income securities on the fixed-income market – AIAF). At the 2009 close, the provision was for 1,431,797 euros long term and 27,430 euros short term, calculated with a 2% wage increase and discount rate of 1.44%.
b) Provision for elimination of corporate benefit bonus: In 2010, pursuant to the current 2009-2012 Collective Bargaining Agreement, the Company had a short term provision for the bonus on the suppression of company benefits amounting to 88,092 euros (see note 11.2). The sums payable for this item are fixed, updated at a 1.72% discount rate. The provision at the 2009 close was 1,343,402 euros, updated at 1.44%.
c) Provision for litigation pending: As the upshot of a number of court claims brought by company trade unions rejecting implementation of some salary items, principally the wage discount applied to employees pursuant to Act No. 4/2010 of the Community of Madrid, on 31 December 2010 the Company had a 4,328,351 euro provision in place, and of 4,603,239 euros at the 2009 close.
11.1.2- Provision for tax
Tax provisions to 31 December 2010 and 31 December 2009 relate to the audit of Corporation Tax for 1997-1998-1999, amounting to 3,763,408 euros plus interest accrued until close of the financial periods concerned, of 1,617,592 euros.
148
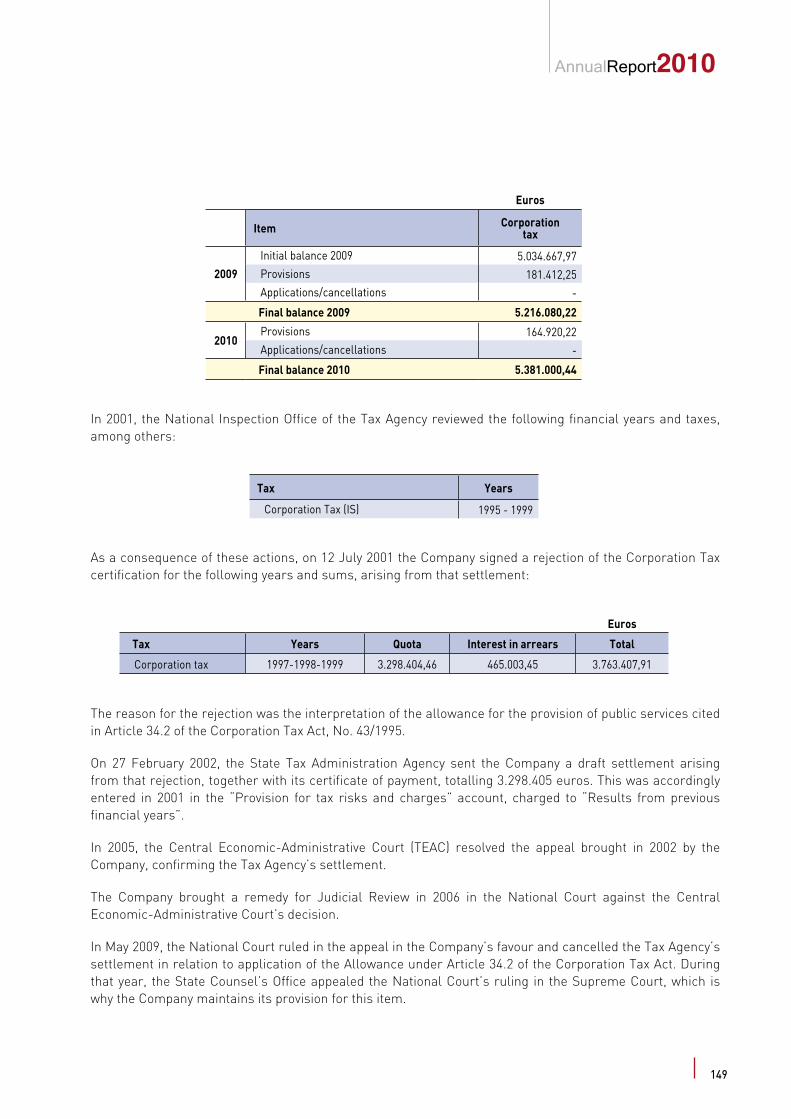
AnnualReport2010
Euros
Item Corporation tax
2009
Initial balance 2009 5.034.667,97Provisions 181.412,25Applications/cancellations -
Final balance 2009 5.216.080,22
2010Provisions 164.920,22Applications/cancellations -
Final balance 2010 5.381.000,44
In 2001, the National Inspection Office of the Tax Agency reviewed the following financial years and taxes, among others:
Tax Years
Corporation Tax (IS) 1995 - 1999
As a consequence of these actions, on 12 July 2001 the Company signed a rejection of the Corporation Tax certification for the following years and sums, arising from that settlement:
Euros
Tax Years Quota Interest in arrears Total
Corporation tax 1997-1998-1999 3.298.404,46 465.003,45 3.763.407,91
The reason for the rejection was the interpretation of the allowance for the provision of public services cited in Article 34.2 of the Corporation Tax Act, No. 43/1995.
On 27 February 2002, the State Tax Administration Agency sent the Company a draft settlement arising from that rejection, together with its certificate of payment, totalling 3.298.405 euros. This was accordingly entered in 2001 in the “Provision for tax risks and charges” account, charged to “Results from previous financial years”.
In 2005, the Central Economic-Administrative Court (TEAC) resolved the appeal brought in 2002 by the Company, confirming the Tax Agency’s settlement.
The Company brought a remedy for Judicial Review in 2006 in the National Court against the Central Economic-Administrative Court’s decision.
In May 2009, the National Court ruled in the appeal in the Company’s favour and cancelled the Tax Agency’s settlement in relation to application of the Allowance under Article 34.2 of the Corporation Tax Act. During that year, the State Counsel’s Office appealed the National Court’s ruling in the Supreme Court, which is why the Company maintains its provision for this item.
149

Metrode Madrid
11.1.3- Other provisions
In 2010, the Company made a 1,000,000 euro provision to meet possible contingencies related to a number of civil legal suits being heard in the courts.
Pursuant to the Ministerial Order of 20 April 1998 on “company collaboration in management of the General Social Security System” and specifically on self-assurance for Temporal Disability in both Work Accidents and Common Contingencies, at the close in 2010 and 2009 the Company had made provision for 498.074 euros and 501,615 euros respectively to cover possible future negative results arising from such collaboration, amounting to 15% of listings made in collaboration between Metro de Madrid and the Social Security in 2010 and 2009.
11.2.- Short-term provisions
The following is the detail of short term provisions and contingencies on the Balance Sheet at the close of 2010 and 2009, together with the main movements registered:
150
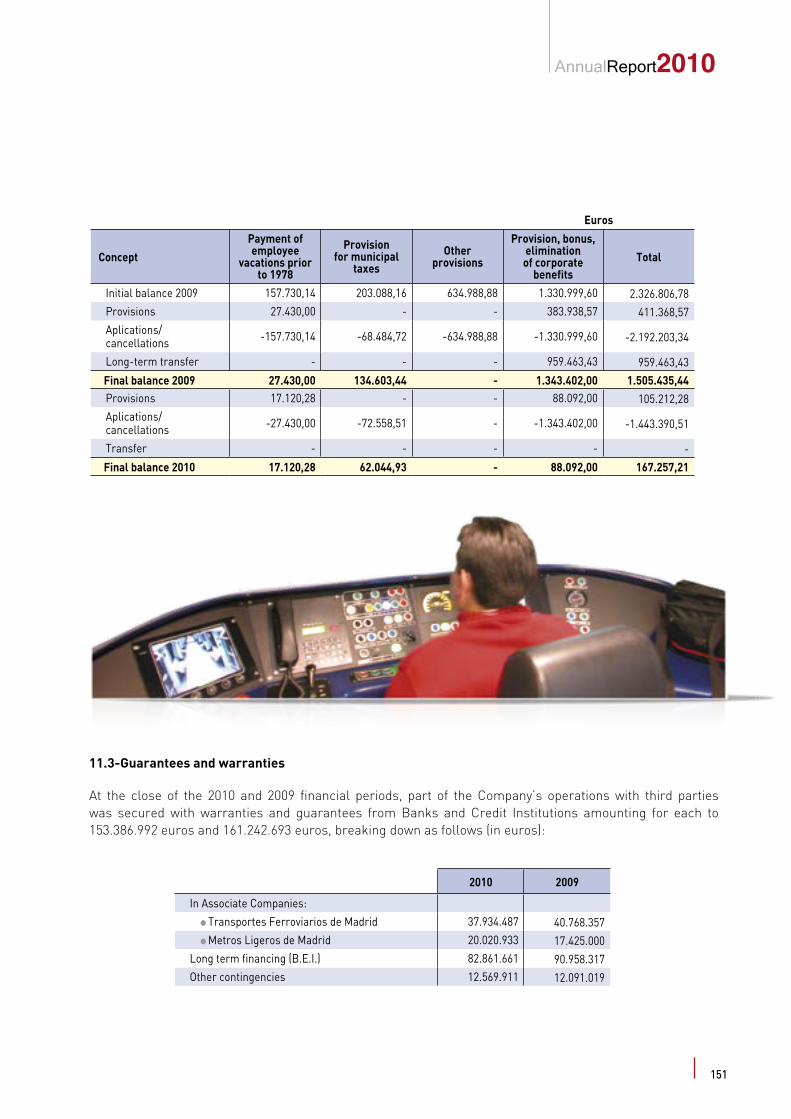
AnnualReport2010
Euros
Concept
Payment of employee
vacations prior to 1978
Provision for municipal
taxesOther
provisions
Provision, bonus, elimination of corporate
benefits Total
Initial balance 2009 157.730,14 203.088,16 634.988,88 1.330.999,60 2.326.806,78Provisions 27.430,00 - - 383.938,57 411.368,57Aplications/ cancellations -157.730,14 -68.484,72 -634.988,88 -1.330.999,60 -2.192.203,34
Long-term transfer - - - 959.463,43 959.463,43
Final balance 2009 27.430,00 134.603,44 - 1.343.402,00 1.505.435,44Provisions 17.120,28 - - 88.092,00 105.212,28Aplications/ cancellations -27.430,00 -72.558,51 - -1.343.402,00 -1.443.390,51
Transfer - - - - -
Final balance 2010 17.120,28 62.044,93 - 88.092,00 167.257,21
11.3-Guarantees and warranties
At the close of the 2010 and 2009 financial periods, part of the Company’s operations with third parties was secured with warranties and guarantees from Banks and Credit Institutions amounting for each to 153.386.992 euros and 161.242.693 euros, breaking down as follows (in euros):
2010 2009
In Associate Companies:
l Transportes Ferroviarios de Madrid 37.934.487 40.768.357 l Metros Ligeros de Madrid 20.020.933 17.425.000Long term financing (B.E.I.) 82.861.661 90.958.317Other contingencies 12.569.911 12.091.019
151
Metrode Madrid
The Company’s Administrators do not expect future liabilities to arise from the granting of these guarantees.
12. Long and short-term debt
The following is the classification of financial liabilities by category and class in 2010 and 2009:
Euros
Non-current
Amortised cost or costBook value
2010 2009
Debits and payables
Variable-rate debts with credit entities 406.918.676,79 256.968.242,54Financial lease creditors (See note 7.1.) 58.969.280,46 58.923.703,37
Other financial liabilities 4.996.805,24 4.306.682,18
Total debt 470.884.762,49 320.198.628,09
Suppliers (including group companies) - -Other payables - -
Total commercial creditors and other payables - -
Total loans and payables 470.884.762,49 320.198.628,09
Euros
Current
Amortised cost or costBook value
2010 2009
Debits and payables
Variable-rate debts with credit entities 40.258.201,61 22.553.332,74Financial lease creditors (See note 7.1.) 3.284.235,93 3.556.524,30
Other financial liabilities 122.941.089,84 96.605.155,12
Total debt 166.483.527,38 122.715.012,16
Suppliers (including group companies) 47.064.364,78 46.453.993,09Other payables 200.713.098,89 254.225.145,45
Total commercial creditors and other payables 247.777.463,67 300.679.138,54
Total loans and payables 414.260.991,05 423.394.150,70
152
AnnualReport2010
12.1. Debts with credit entities
Balances, interest rates and the short- and long-term breakdown on 31 December 2010 and 2009 were as follows:
2010 Thousands of euros
InstitutionAverage
interest rate (%)
Short-term Long-term Total Maturing in
B.E.I. (I) 0,83 3.756 22.538 26.294 2017B.E.I. (II) 0,85 4.341 52.088 56.429 2023La Caixa 2001 1,29 6.008 12.017 18.025 2013Bankinter 2009 1,91 3.000 25.500 28.500 2020Banco Popular 2009 1,99 3.000 25.500 28.500 2020Banco Sabadell 2009 2,26 3.000 25.500 28.500 2020BBVA 2009 2,31 1.861 15.819 17.680 2020Santander 2009 2,31 1.861 15.819 17.680 2020La Caixa 2009 2,31 1.861 15.819 17.680 2020Caja de Madrid 2009 2,31 1.861 15.819 17.680 2020Santander 2010 3,74 1.500 28.500 30.000 2021BBVA 2010 3,74 2.500 47.500 50.000 2021La Caixa 2010 3,24 2.500 47.500 50.000 2021Caixa Galicia 2010 3,74 1.500 28.500 30.000 2021Caja de Madrid 2010 3,39 1.500 28.500 30.000 2021
Total 40.049 406.919 446.968
2009 Thousands of euros
InstitutionAverage
interest rate (%)
Short-term Long-term Total Maturing in
B.E.I. (I) 1,89 3.756 26.295 30.051 2017B.E.I. (II) 1,90 4.341 56.427 60.768 2023La Caixa 2001 2,33 6.008 18.026 24.034 2013Bankinter 2009 1,89 1.500 28.500 30.000 2020Banco Popular 2009 1,97 1.500 28.500 30.000 2020Banco Sabadell 2009 2,24 1.500 28.500 30.000 2020BBVA 2009 2,29 931 17.680 18.611 2020Santander 2009 2,29 931 17.680 18.611 2020La Caixa 2009 2,29 931 17.680 18.611 2020Caja de Madrid 2009 2,29 931 17.680 18.611 2020
Total 22.329 256.968 279.297
To meet investments made in 2010 (see notes 5 and 6), during that year the Company concluded bank loans with five institutions for a total 190,000,000 euros for ten years. In 2009, to finance investments in that year, the Company subscribed seven loans for 164.442.790 euros in all, for a ten-year term.
153
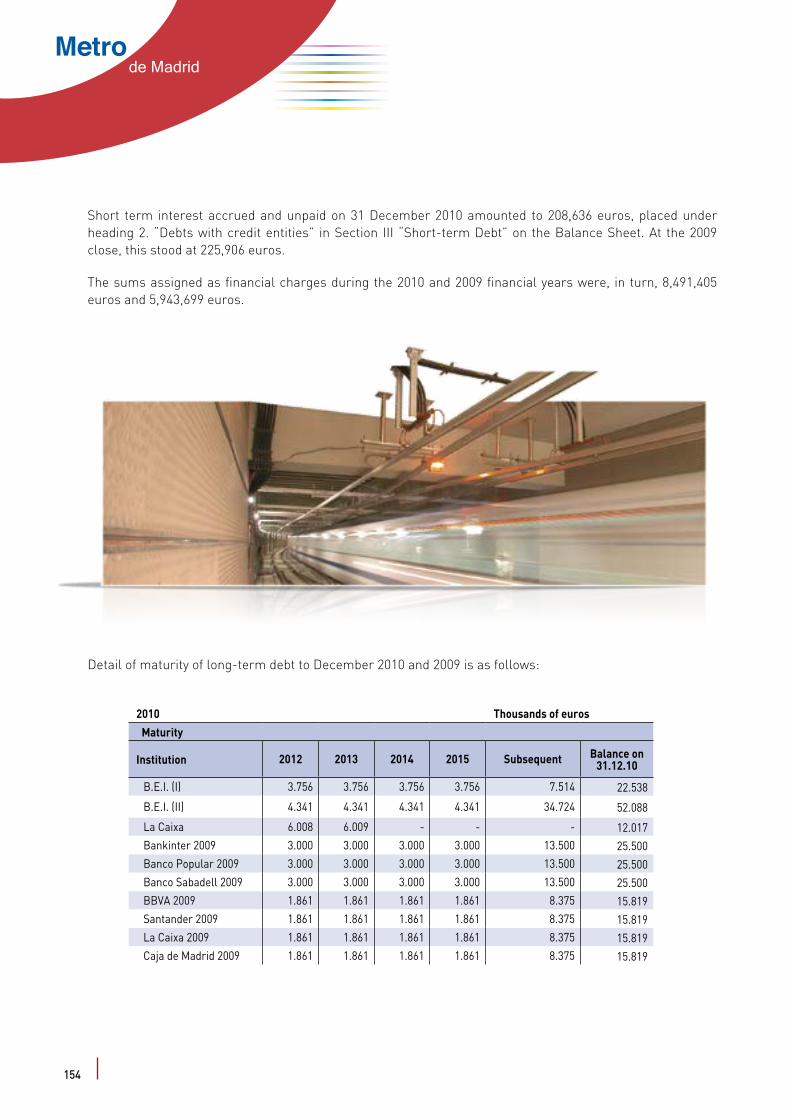
Metrode Madrid
Short term interest accrued and unpaid on 31 December 2010 amounted to 208,636 euros, placed under heading 2. “Debts with credit entities” in Section III “Short-term Debt” on the Balance Sheet. At the 2009 close, this stood at 225,906 euros.
The sums assigned as financial charges during the 2010 and 2009 financial years were, in turn, 8,491,405 euros and 5,943,699 euros.
Detail of maturity of long-term debt to December 2010 and 2009 is as follows:
2010 Thousands of euros
Maturity
Institution 2012 2013 2014 2015 Subsequent Balance on 31.12.10
B.E.I. (I) 3.756 3.756 3.756 3.756 7.514 22.538
B.E.I. (II) 4.341 4.341 4.341 4.341 34.724 52.088
La Caixa 6.008 6.009 - - - 12.017Bankinter 2009 3.000 3.000 3.000 3.000 13.500 25.500Banco Popular 2009 3.000 3.000 3.000 3.000 13.500 25.500Banco Sabadell 2009 3.000 3.000 3.000 3.000 13.500 25.500BBVA 2009 1.861 1.861 1.861 1.861 8.375 15.819Santander 2009 1.861 1.861 1.861 1.861 8.375 15.819La Caixa 2009 1.861 1.861 1.861 1.861 8.375 15.819Caja de Madrid 2009 1.861 1.861 1.861 1.861 8.375 15.819
154
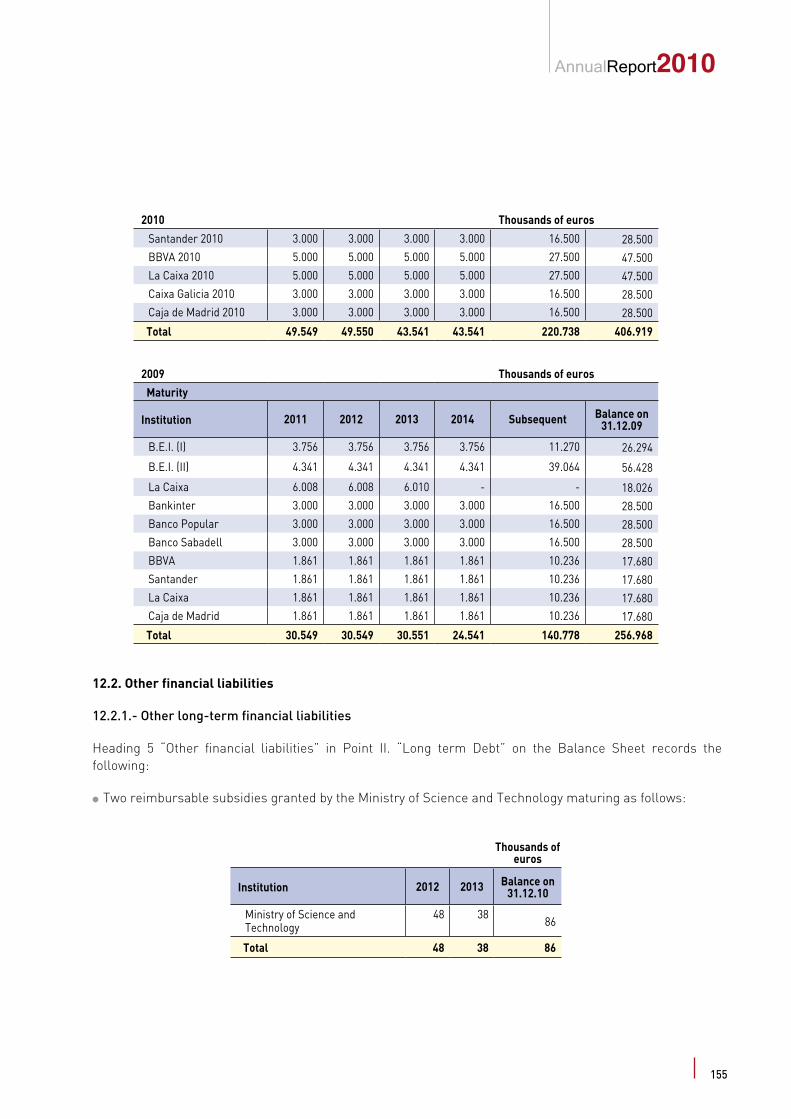
AnnualReport2010
2010 Thousands of euros
Santander 2010 3.000 3.000 3.000 3.000 16.500 28.500BBVA 2010 5.000 5.000 5.000 5.000 27.500 47.500La Caixa 2010 5.000 5.000 5.000 5.000 27.500 47.500Caixa Galicia 2010 3.000 3.000 3.000 3.000 16.500 28.500Caja de Madrid 2010 3.000 3.000 3.000 3.000 16.500 28.500
Total 49.549 49.550 43.541 43.541 220.738 406.919
2009 Thousands of euros
Maturity
Institution 2011 2012 2013 2014 Subsequent Balance on 31.12.09
B.E.I. (I) 3.756 3.756 3.756 3.756 11.270 26.294
B.E.I. (II) 4.341 4.341 4.341 4.341 39.064 56.428
La Caixa 6.008 6.008 6.010 - - 18.026Bankinter 3.000 3.000 3.000 3.000 16.500 28.500Banco Popular 3.000 3.000 3.000 3.000 16.500 28.500Banco Sabadell 3.000 3.000 3.000 3.000 16.500 28.500BBVA 1.861 1.861 1.861 1.861 10.236 17.680Santander 1.861 1.861 1.861 1.861 10.236 17.680La Caixa 1.861 1.861 1.861 1.861 10.236 17.680Caja de Madrid 1.861 1.861 1.861 1.861 10.236 17.680
Total 30.549 30.549 30.551 24.541 140.778 256.968
12.2. Other financial liabilities
12.2.1.- Other long-term financial liabilities
Heading 5 “Other financial liabilities” in Point II. “Long term Debt” on the Balance Sheet records the following:
l Two reimbursable subsidies granted by the Ministry of Science and Technology maturing as follows:
Thousands of euros
Institution 2012 2013 Balance on 31.12.10
Ministry of Science and Technology
48 3886
Total 48 38 86
155
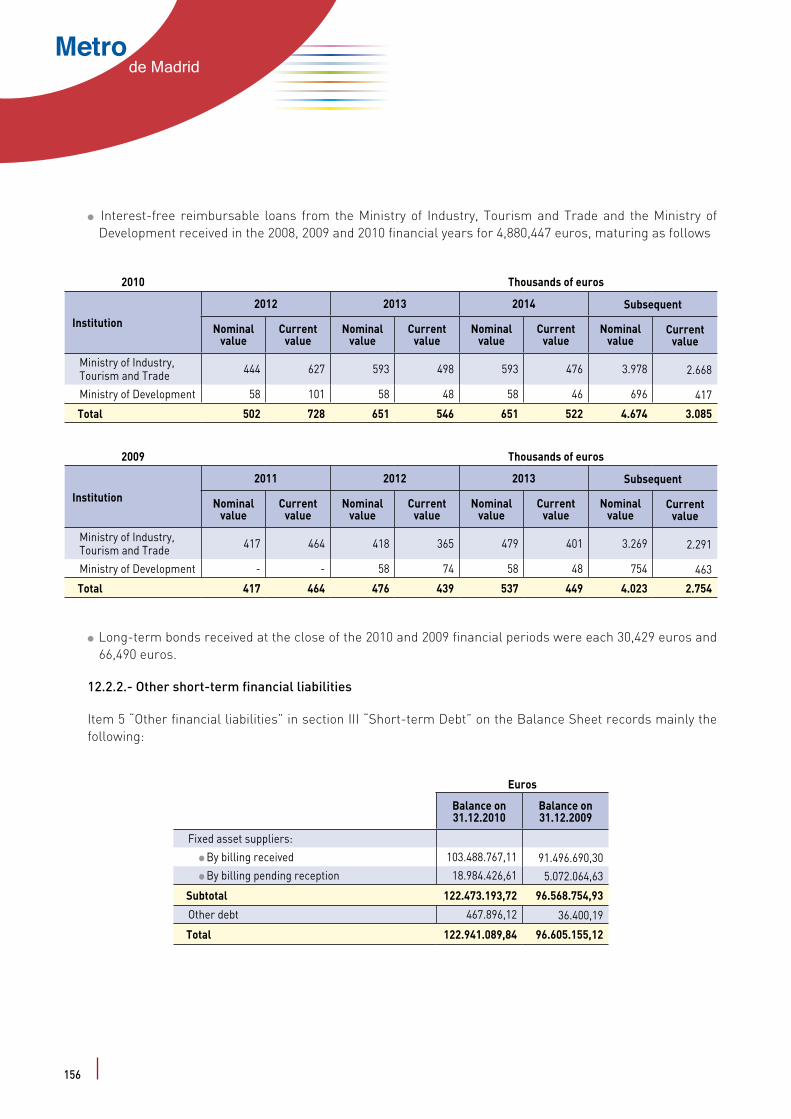
Metrode Madrid
l Interest-free reimbursable loans from the Ministry of Industry, Tourism and Trade and the Ministry of Development received in the 2008, 2009 and 2010 financial years for 4,880,447 euros, maturing as follows
2010 Thousands of euros
Institution
2012 2013 2014 Subsequent
Nominal value
Current value
Nominal value
Current value
Nominal value
Current value
Nominal value
Current value
Ministry of Industry, Tourism and Trade 444 627 593 498 593 476 3.978 2.668
Ministry of Development 58 101 58 48 58 46 696 417
Total 502 728 651 546 651 522 4.674 3.085
2009 Thousands of euros
Institution
2011 2012 2013 Subsequent
Nominal value
Current value
Nominal value
Current value
Nominal value
Current value
Nominal value
Current value
Ministry of Industry, Tourism and Trade 417 464 418 365 479 401 3.269 2.291
Ministry of Development - - 58 74 58 48 754 463
Total 417 464 476 439 537 449 4.023 2.754
l Long-term bonds received at the close of the 2010 and 2009 financial periods were each 30,429 euros and 66,490 euros.
12.2.2.- Other short-term financial liabilities
Item 5 “Other financial liabilities” in section III “Short-term Debt” on the Balance Sheet records mainly the following:
Euros
Balance on 31.12.2010
Balance on 31.12.2009
Fixed asset suppliers:
l By billing received 103.488.767,11 91.496.690,30 l By billing pending reception 18.984.426,61 5.072.064,63
Subtotal 122.473.193,72 96.568.754,93
Other debt 467.896,12 36.400,19
Total 122.941.089,84 96.605.155,12
156
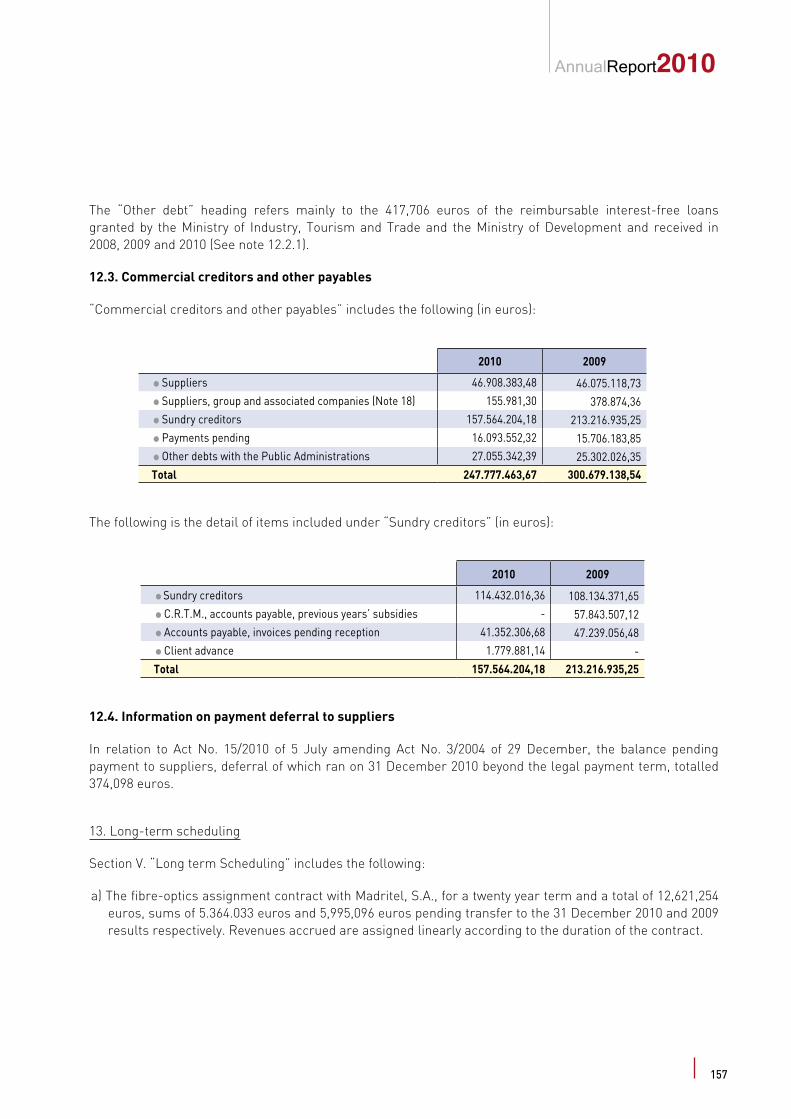
AnnualReport2010
The “Other debt” heading refers mainly to the 417,706 euros of the reimbursable interest-free loans granted by the Ministry of Industry, Tourism and Trade and the Ministry of Development and received in 2008, 2009 and 2010 (See note 12.2.1).
12.3. Commercial creditors and other payables
“Commercial creditors and other payables” includes the following (in euros):
2010 2009
l Suppliers 46.908.383,48 46.075.118,73l Suppliers, group and associated companies (Note 18) 155.981,30 378.874,36l Sundry creditors 157.564.204,18 213.216.935,25l Payments pending 16.093.552,32 15.706.183,85l Other debts with the Public Administrations 27.055.342,39 25.302.026,35Total 247.777.463,67 300.679.138,54
The following is the detail of items included under “Sundry creditors” (in euros):
2010 2009
l Sundry creditors 114.432.016,36 108.134.371,65l C.R.T.M., accounts payable, previous years’ subsidies - 57.843.507,12l Accounts payable, invoices pending reception 41.352.306,68 47.239.056,48l Client advance 1.779.881,14 -Total 157.564.204,18 213.216.935,25
12.4. Information on payment deferral to suppliers
In relation to Act No. 15/2010 of 5 July amending Act No. 3/2004 of 29 December, the balance pending payment to suppliers, deferral of which ran on 31 December 2010 beyond the legal payment term, totalled 374,098 euros.
13. Long-term scheduling
Section V. “Long term Scheduling” includes the following:
a) The fibre-optics assignment contract with Madritel, S.A., for a twenty year term and a total of 12,621,254 euros, sums of 5.364.033 euros and 5,995,096 euros pending transfer to the 31 December 2010 and 2009 results respectively. Revenues accrued are assigned linearly according to the duration of the contract.
157
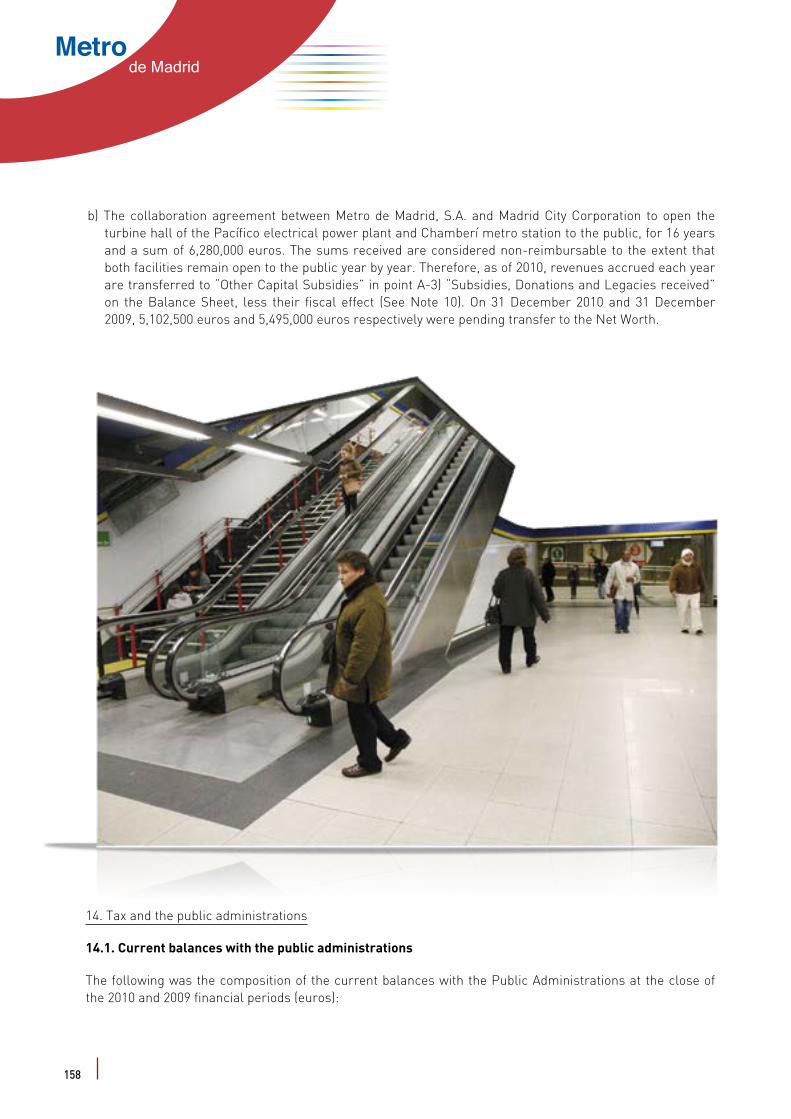
Metrode Madrid
b) The collaboration agreement between Metro de Madrid, S.A. and Madrid City Corporation to open the turbine hall of the Pacífico electrical power plant and Chamberí metro station to the public, for 16 years and a sum of 6,280,000 euros. The sums received are considered non-reimbursable to the extent that both facilities remain open to the public year by year. Therefore, as of 2010, revenues accrued each year are transferred to “Other Capital Subsidies” in point A-3) “Subsidies, Donations and Legacies received” on the Balance Sheet, less their fiscal effect (See Note 10). On 31 December 2010 and 31 December 2009, 5,102,500 euros and 5,495,000 euros respectively were pending transfer to the Net Worth.
14. Tax and the public administrations
14.1. Current balances with the public administrations
The following was the composition of the current balances with the Public Administrations at the close of the 2010 and 2009 financial periods (euros):
158

AnnualReport2010
Accounts payable, public institutions 2010 2009
Spain
Inland Revenue, Personal Income Tax 19.656.023,98 18.178.672,72 Social Security Bodies 7.379.881,14 7.123.353,63Ecuador (see note 1)
Inland Revenue, Personal Income Tax/VAT 19.437,27 -Total 27.055.342,39 25.302.026,35
Accounts receivable, public institutions 2010 2009
Spain
Inland Revenue, tax repayment 937.699.34 891.080,78 Inland Revenue, VAT 41.516.360,66 33.835.667,22 Inland Revenue, unaccrued VAT paid 10.070.753,77 9.998.668,10 Inland Revenue, return of improper revenues 316.680,75 -Ecuador (see note 1)
Inland Revenue, Personal Income Tax 22.923,45 -Total 52.864.417,97 44.725.416,10
The sum entered under “Inland Revenue receivables, unaccrued VAT paid” refers to deductions pending for current fixed asset invoices pending payment on maturity as provided for in Article 75.two of Act No. 37/1992.
The Company has applied to the Tax Authorities for repayment of 316,681 euros in a procedure for improper revenues, as a consequence of the interpretation by the Directorate-General of Taxation, in a response to a binding enquiry, for exemption from Personal Income Tax of sums defrayed by the companies for the collective carriage of employees of the Transport Season Ticket regulated in Royal Decree No. 6/2010 of 9 April on measures to foment the economic recovery and employment.
In 2010, the upshot of the ruling of the National Court in the Company’s favour concerning the application of the rebate in Article 34.2 of the Corporation Tax Act, the Company has filed four procedures for improper payments for the 2003-2006 Corporation Tax returns, claiming a total of 2,713,895 euros, together with a complementary return for 2007 with a payable sum of 248,320 euros. In March 2011, the Company received the monies claimed from the Public Administration along with the interest in arrears.
14.2. Reconciliation of the book result and the taxable base
Because the Company’s main activity is metropolitan public transport, it is able to avail itself of the rebate in Article 34.2 of the Corporation Tax Act, so that the whole quota bears a 99% rebate.
159

Metrode Madrid
The following table shows the reconciliation of the book result and the Corporation Tax base for 2010:
Euros
Item Profit and loss account Income and expenditure assigned directly to the net worth Total
Balance ofrevenuesand charges inthe financialperiod
-74.594.754,67 -60.134.067,93 -134.728.822,60
Increases Reductions Balance Increases Reductions Balance Total
Corporation Tax 248.319,98 213.849,60 34.470,38 - 181.731,59 -181.731,59 -141.261,21Permanent differences 3.277.085,90 - 3.277.085,90 - - - 3.277.085,90
Temporary differences:
- Originating in the financial year 11.392.277,26 - 11.392.277,26 60.315.799,52 - 60.315.799,52 71.708.076,78
- Originating in previous financial years
- 32.509.977,94 -32.509.977,94 - - - -32.509.977,94
Compensation of negative taxable bases from previous financial years
- - - - - - -
Taxable base - - -92.400.899,87 - - - -92.400.899,87
160
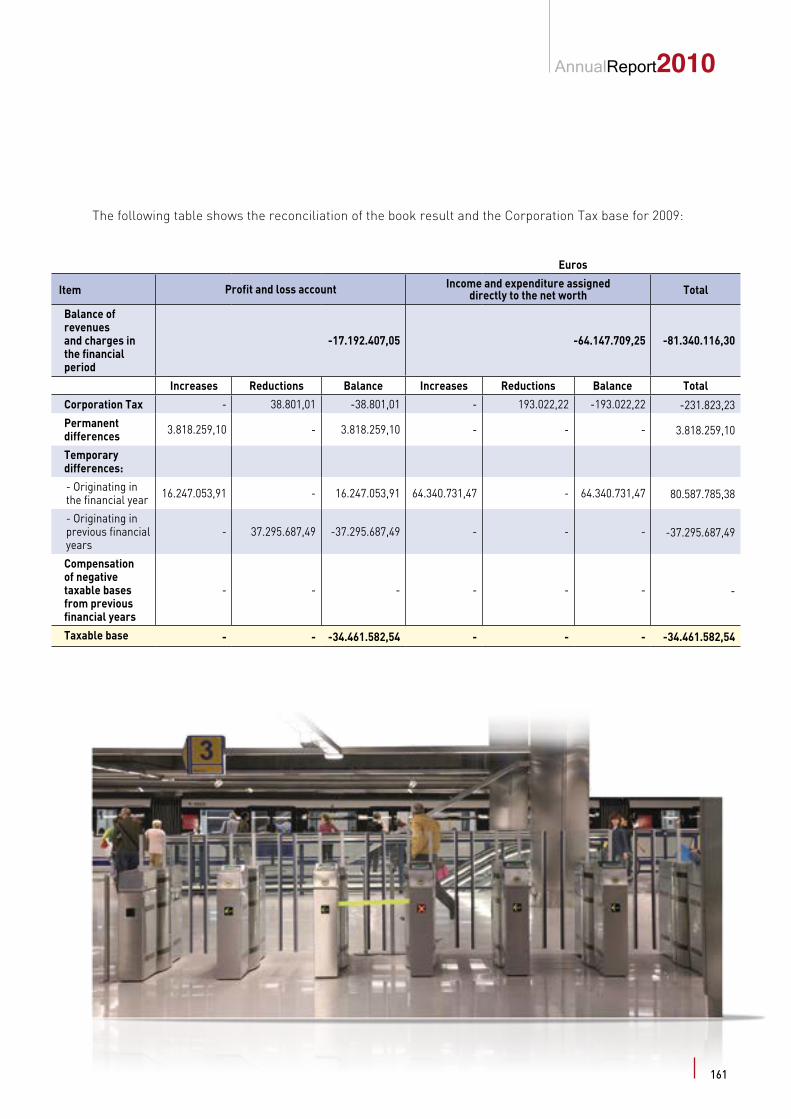
AnnualReport2010
The following table shows the reconciliation of the book result and the Corporation Tax base for 2009:
Euros
Item Profit and loss account Income and expenditure assigned directly to the net worth Total
Balance ofrevenuesand charges inthe financialperiod
-17.192.407,05 -64.147.709,25 -81.340.116,30
Increases Reductions Balance Increases Reductions Balance Total
Corporation Tax - 38.801,01 -38.801,01 - 193.022,22 -193.022,22 -231.823,23Permanent differences 3.818.259,10 - 3.818.259,10 - - - 3.818.259,10
Temporary differences:
- Originating in the financial year 16.247.053,91 - 16.247.053,91 64.340.731,47 - 64.340.731,47 80.587.785,38
- Originating in previous financial years
- 37.295.687,49 -37.295.687,49 - - - -37.295.687,49
Compensation of negative taxable bases from previous financial years
- - - - - - -
Taxable base - - -34.461.582,54 - - - -34.461.582,54
161
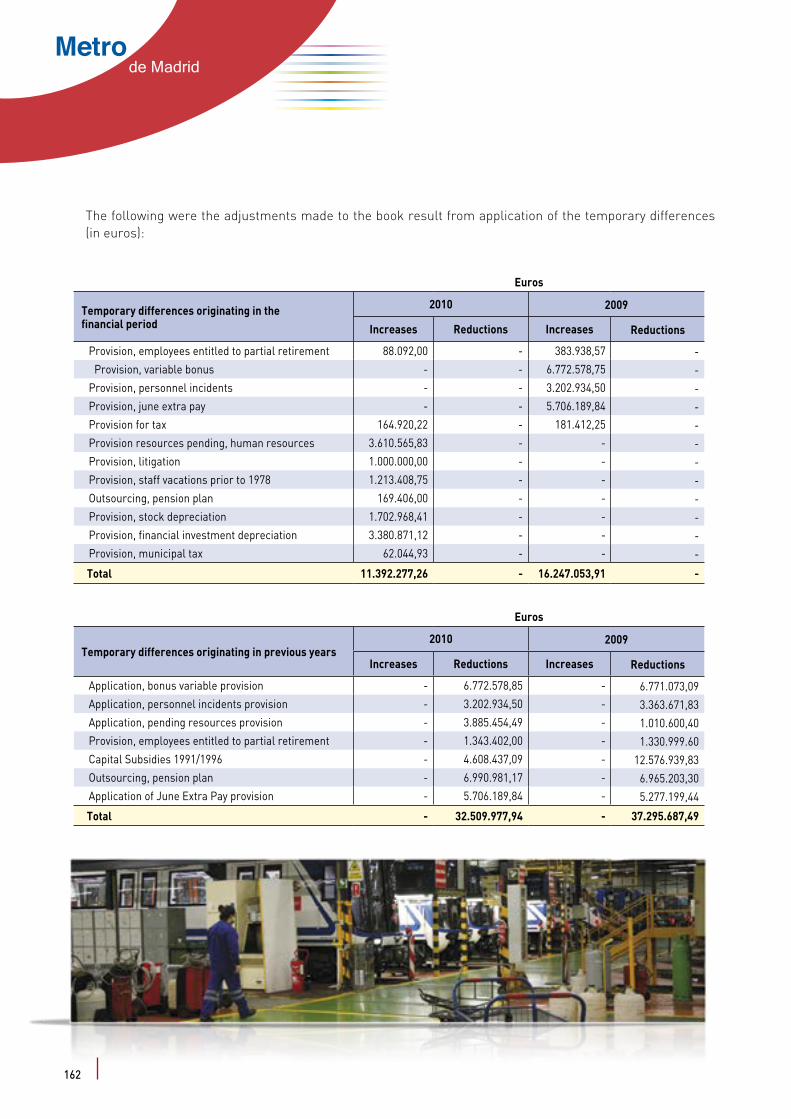
Metrode Madrid
The following were the adjustments made to the book result from application of the temporary differences (in euros):
Euros
Temporary differences originating in the financial period
2010 2009
Increases Reductions Increases Reductions
Provision, employees entitled to partial retirement 88.092,00 - 383.938,57 -Provision, variable bonus - - 6.772.578,75 -
Provision, personnel incidents - - 3.202.934,50 -Provision, june extra pay - - 5.706.189,84 -Provision for tax 164.920,22 - 181.412,25 -Provision resources pending, human resources 3.610.565,83 - - -Provision, litigation 1.000.000,00 - - -Provision, staff vacations prior to 1978 1.213.408,75 - - -Outsourcing, pension plan 169.406,00 - - -Provision, stock depreciation 1.702.968,41 - - -Provision, financial investment depreciation 3.380.871,12 - - -Provision, municipal tax 62.044,93 - - -
Total 11.392.277,26 - 16.247.053,91 -
Euros
Temporary differences originating in previous years2010 2009
Increases Reductions Increases Reductions
Application, bonus variable provision - 6.772.578,85 - 6.771.073,09Application, personnel incidents provision - 3.202.934,50 - 3.363.671,83Application, pending resources provision - 3.885.454,49 - 1.010.600,40Provision, employees entitled to partial retirement - 1.343.402,00 - 1.330.999.60Capital Subsidies 1991/1996 - 4.608.437,09 - 12.576.939,83Outsourcing, pension plan - 6.990.981,17 - 6.965.203,30Application of June Extra Pay provision - 5.706.189,84 - 5.277.199,44
Total - 32.509.977,94 - 37.295.687,49
162
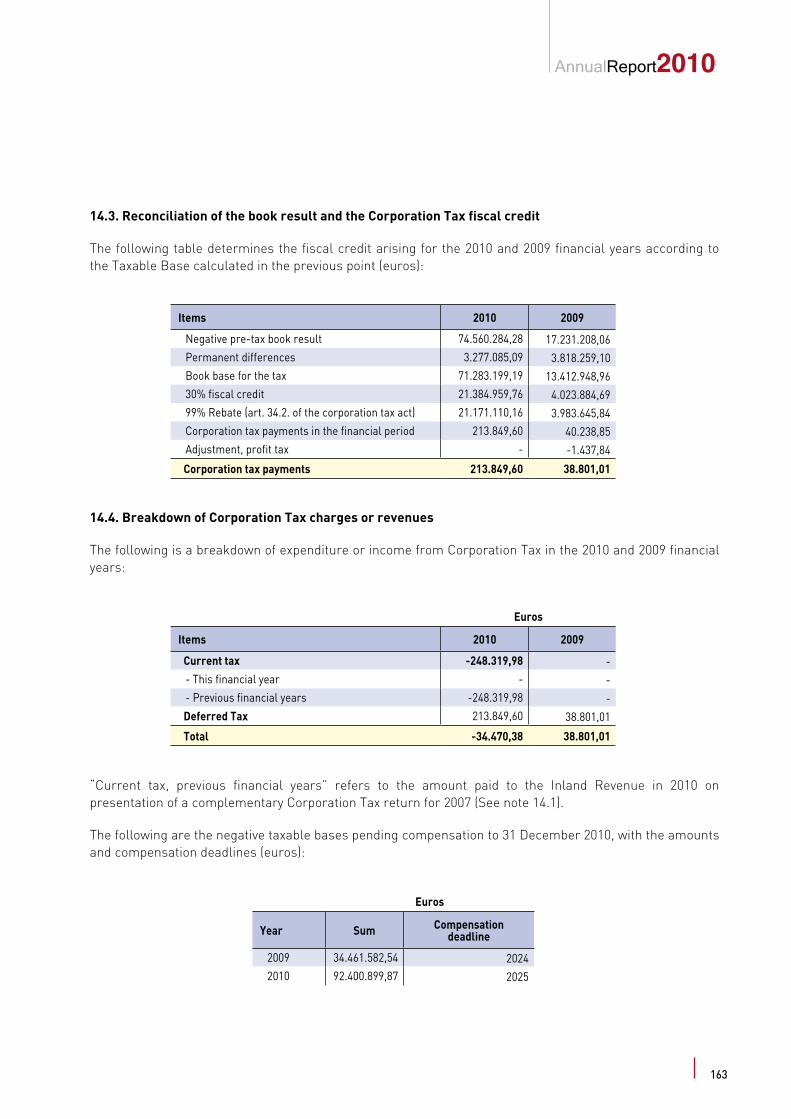
AnnualReport2010
14.3. Reconciliation of the book result and the Corporation Tax fiscal credit
The following table determines the fiscal credit arising for the 2010 and 2009 financial years according to the Taxable Base calculated in the previous point (euros):
Items 2010 2009
Negative pre-tax book result 74.560.284,28 17.231.208,06Permanent differences 3.277.085,09 3.818.259,10Book base for the tax 71.283.199,19 13.412.948,9630% fiscal credit 21.384.959,76 4.023.884,6999% Rebate (art. 34.2. of the corporation tax act) 21.171.110,16 3.983.645,84Corporation tax payments in the financial period 213.849,60 40.238,85Adjustment, profit tax - -1.437,84
Corporation tax payments 213.849,60 38.801,01
14.4. Breakdown of Corporation Tax charges or revenues
The following is a breakdown of expenditure or income from Corporation Tax in the 2010 and 2009 financial years:
Euros
Items 2010 2009
Current tax -248.319,98 -- This financial year - -- Previous financial years -248.319,98 -Deferred Tax 213.849,60 38.801,01
Total -34.470,38 38.801,01
“Current tax, previous financial years” refers to the amount paid to the Inland Revenue in 2010 on presentation of a complementary Corporation Tax return for 2007 (See note 14.1).
The following are the negative taxable bases pending compensation to 31 December 2010, with the amounts and compensation deadlines (euros):
Euros
Year Sum Compensation deadline
2009 34.461.582,54 20242010 92.400.899,87 2025
163
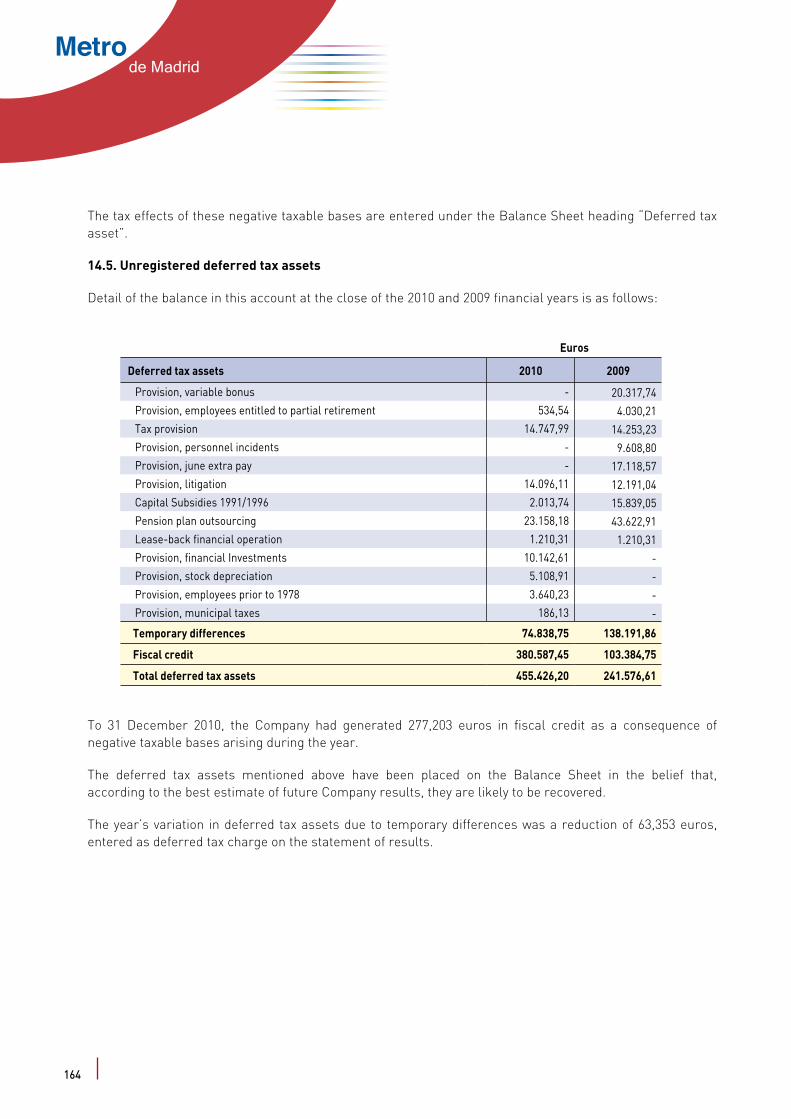
Metrode Madrid
The tax effects of these negative taxable bases are entered under the Balance Sheet heading “Deferred tax asset”.
14.5. Unregistered deferred tax assets
Detail of the balance in this account at the close of the 2010 and 2009 financial years is as follows:
Euros
Deferred tax assets 2010 2009
Provision, variable bonus - 20.317,74Provision, employees entitled to partial retirement 534,54 4.030,21Tax provision 14.747,99 14.253,23Provision, personnel incidents - 9.608,80Provision, june extra pay - 17.118,57Provision, litigation 14.096,11 12.191,04Capital Subsidies 1991/1996 2.013,74 15.839,05Pension plan outsourcing 23.158,18 43.622,91Lease-back financial operation 1.210,31 1.210,31Provision, financial Investments 10.142,61 -Provision, stock depreciation 5.108,91 -Provision, employees prior to 1978 3.640,23 -Provision, municipal taxes 186,13 -
Temporary differences 74.838,75 138.191,86
Fiscal credit 380.587,45 103.384,75
Total deferred tax assets 455.426,20 241.576,61
To 31 December 2010, the Company had generated 277,203 euros in fiscal credit as a consequence of negative taxable bases arising during the year.
The deferred tax assets mentioned above have been placed on the Balance Sheet in the belief that, according to the best estimate of future Company results, they are likely to be recovered.
The year’s variation in deferred tax assets due to temporary differences was a reduction of 63,353 euros, entered as deferred tax charge on the statement of results.
164

AnnualReport2010
14.6. Unregistered deferred tax assets
The Company has not placed certain deferred tax assets on the attached Balance Sheet as it considers their application unlikely short- and medium-term. The detail of those unregistered assets is as follows:
Euros
Deductions pending 2010 2009 Maturity
2006 training charges 143.603,64 143.603,64 20162007 training charges 144.407,40 144.407,40 20172008 training charges 122.106,80 122.106,80 20182009 training charges 71.770,33 71.770,33 20192010 training charges 26.002,39 - 20202005 R+D+i charges 66.769,72 66.769,72 20202006 R+D+i charges 143.168,67 143.168,67 20212007 R+D+i charges 283.285,92 283.285,92 20222008 R+D+i charges 2.105.873,91 2.105.873,91 20232009 R+D+i charges 2.720.249,79 2.720.249,79 20242010 R+D+i charges* 1.000.000,00 - 2025Donations to non-profit institutions, 2009 57.069,16 57.069,16 2019Donations to non-profit institutions, 2010 35.000,00 - 2020
Total deferred tax assets 6.919.307,73 5.858.305,34
* estimate
14.7. Deferred tax liabilities
With application of valuation standard eighteen on Subsidies, capital subsidies are entered as revenues directly imputed to the net worth. These revenues must be set out less their tax effects and are entered as a deferred tax liability. The balance for this item at the end of the 2009 financial year was 2,483,646 euros and the variation in this deferred figure, a 193,022 euro reduction, is assigned to the Net Worth. At the close of 2008, this balance was 2,857,613 euros and the variation in this deferred figure, a reduction of 180,945 euros, was assigned to the Net Worth.
14.8. Years pending verification and audit
Under the current legislation, taxes are not considered finally settled until the returns filed have been audited by the tax authorities or the four-year statute of limitations has passed. Thus, on 31 December 2010, the Company had all main taxes applicable to it open for inspection since December 2006, except for Corporation Tax since 1 January 2006 and in those financial periods where procedures are open for claims filed by the Company. The Administrators do no expect significant further liabilities to arise from audit.
165

Metrode Madrid
15. Short term scheduling of assets
The composition of the balance under “VI. Short term Scheduling” is as follows (see note 7):
Euros
Scheduling 2010 2009
Ferromóvil 3000 operating lease 28.475.339,79 20.091.606,70Ferromóvil 9000 operating lease 17.802.061,27 12.455.295,22
Total 46.277.401,00 32.546.901,93
16. Long-term staff remuneration liabilities
The Company’s commitments are set out in the Company Collective Bargaining Agreement for 2009-2012, under which it was agreed to incorporate the arbitration awards handed down on 18 December 1999 and 2 February 2000 as an integral part.
The following are the Company’s commitments:
4 Early retirement benefits between 60 and 63 according to the employee’s age on 31 December 1999 for those active in the company on 1 January 2001 and who entered prior to 18 March 1998 and have listings accredited to the employment Welfare Society prior to 1 January 1967.
4 Lifelong immediate and immediate earnings for personnel on pensions or benefiting from the defunct FAS (Socil Welfare Fund) receiving retirement income prior to 30 June 1998, widowed or orphaned or permanently disabled pursuant to the 18 December 1999 Arbitration Award and the explanatory award of 2 February 2000.
4 Death contingencies for any cause, death from accident and absolute and permanent disability from any cause.
4 Retirement and death benefits for assets and death for liabilities concerning active and beneficiary personnel (the retired and the absolutely and permanently disabled) who joined the company prior to 18 March 1998.
All commitments are underwritten and updated to 31 December 2009 in insurance policies adapted to Additional Provision One of Legislative Royal Decree No. 1/2002 of 29 November passing the Reform Pension Plan and Funds Act, and Royal Decree No. 1588/1999 of 15 October passing the Regulation on the implementation of company pension commitments with employees and beneficiaries.
The current value of pension commitments outsourced in 2001 for beneficiary personnel was calculated on the basis of the following parameters:
166
AnnualReport2010
4 Technical interest rate: 5.97% for the first 40 annuities and 3.05% for the rest.
4 Mortality table: PERM/F-2000P.
To 31 December 2009, the Company maintained the commitment of the death contingencies (widowhood) and total and permanent professional disability for personnel in active company service, save those who joined the company after 18 March 1998. As a result of the collective bargaining in place, in 2010 the policy securing it was cancelled and the employees were compensated with a sum in their Plus Convenio wage. In 2009, the Company paid the associated premium of 2,325,390 euros for these commitments and the premium payments were entered on the Profit and Loss Account.
The technical bases used to update the insurance premiums for these commitments in the 2010 financial year were:
4 Mortality Table: GR95.
4 Technical interest rate: 3.82% to 30 years, 2.15 % for the rest.
The technical bases used to update the insurance premiums for these commitments in the 2009 financial year were:
4 Mortality Table: GR95.
4 Technical interest rate: 2.11% for the entire operation.
The Company considers that all commitments were fully and correctly insured on the date of the accounting statements, so that no commitment is acknowledged on the Balance Sheet.
The sum accruing is assigned to charges in each financial year, scheduling any differences against the sum settled with the bodies to whom these commitments were outsourced.
17. Income and expenditure
a) Wages, salaries and corporate charges
The following is the detail of wages and salaries in 2010 and 2009:
Euros
Item 2010 2009
Remuneration 270.069.360,32 256.807.786,11Accident and illness 3.635.463,00 3.697.049,59Professional training allowances 419.622,13 525.520,59Other payroll items 568.214,84 928.828,64Directors’ allowances 4.408,42 3.786,30
Total 274.697.068,71 261.962.971,23
167

Metrode Madrid
Corporate charges break down as follows:
Euros
Item 2010 2009
Social Security 78.128.307,03 76.201.765,36Other corporate charges 6.265.394,94 10.171.008,83
Total 84.393.701,97 86.372.774,19
b) External services
The detail of this item on the Profit and Loss Account was as follows in 2010 and in 2009:
Euros
Item 2010 2009
Royalties and leases 409.235.766,52 410.805.314,52Repairs and upkeep 81.012.860,55 76.315.798,99Supplies 71.321.513,50 78.465.451,49External jobs 173.414.524,41 181.945.169,30Insurance premiums 5.921.484,97 6.393.349,61Banking and similar services 2.436.198,10 2.899.536,50Transport and freight 18.742,44 34.781,31Communications 2.685.203,45 2.760.733,29Public Relations 2.030.003,11 2.229.225,54Advertising and communications 4.937.247,43 5.738.230,79Legal charges 1.366.839,81 792.477,01Consultants 4.146.406,86 5.187.624,49Various 2.593.146,07 785.043,75
Total 761.119.937,22 774.352.736,59
“Royalties and Leases” include among other things the royalty for the public entity MINTRA for lease of infrastructures; that for lease of series 3000 and 9000 rolling stock to Ferromóvil 3000,S.L. and Ferromóvil 9000, S.L., and the sum for the lease of series 6000R, 7000 and 8000 rolling stock to Plan Azul, S.L. (see note 7.2).
The main annotations under “External Jobs” are the services for surveillance of installations and rolling stock, cleaning and de-insecting services and those for transport of funds.
168

AnnualReport2010
Euros
External work 2010 2009
Surveillance services 93.558.514,66 92.782.953,26Cleaning services 65.952.578,69 66.661.866,23Service for Transport of Funds 2.460.630,24 2.885.411,93Other external work 11.442.800,82 19.614.938,00
Total 173.414.524,41 181.945.169,42
c) Sales
The 2010 and 2009 sales figures were distributed as follows:
Euros
Item 2010 2009
Passenger transport revenues 1.025.621.979,67 1.063.038.778,58Ticket sale commission revenues, Madrid Regional Transport Consortium 20.677.005,23 20.387.762,97
Operating revenues, Transportes Ferroviarios Madrid S A 10.709.873,35 11.475.829,63
Operating revenues, Metros Ligeros Madrid S A 7.181.867,05 7.330.549,81
Sales 1.064.190.725,30 1.102.232.920,99
4 Passenger transport revenues: this heading contains the figure for remuneration of public rail transport services in the network in the Community of Madrid based on an average charge per passenger carried pursuant to the Framework Agreement concluded with the Madrid Regional Transport Consortium (see note 1).
2010 and 2009 were regulated by the Framework Agreement of 16 January 2009 for 2009-2012 with the Madrid Regional Transport Consortium using the system of “compensatory charge” per passenger carried.
4 Ticket sale revenues: under the Framework Agreement with the Madrid Regional Transport Consortium (CRTM), the Company is assigned the service for the sale of transport tickets, for which it receives a fee per ticket sold.
4 Operating Revenues from the Transportes Ferroviarios de Madrid, S.A. (TFM) network: the Company has a contract for the full operation of the rail concession on Line 9B between the stations of Puerta de Arganda and Arganda del Rey, from the Company Transportes Ferroviarios de Madrid, S.A.
169
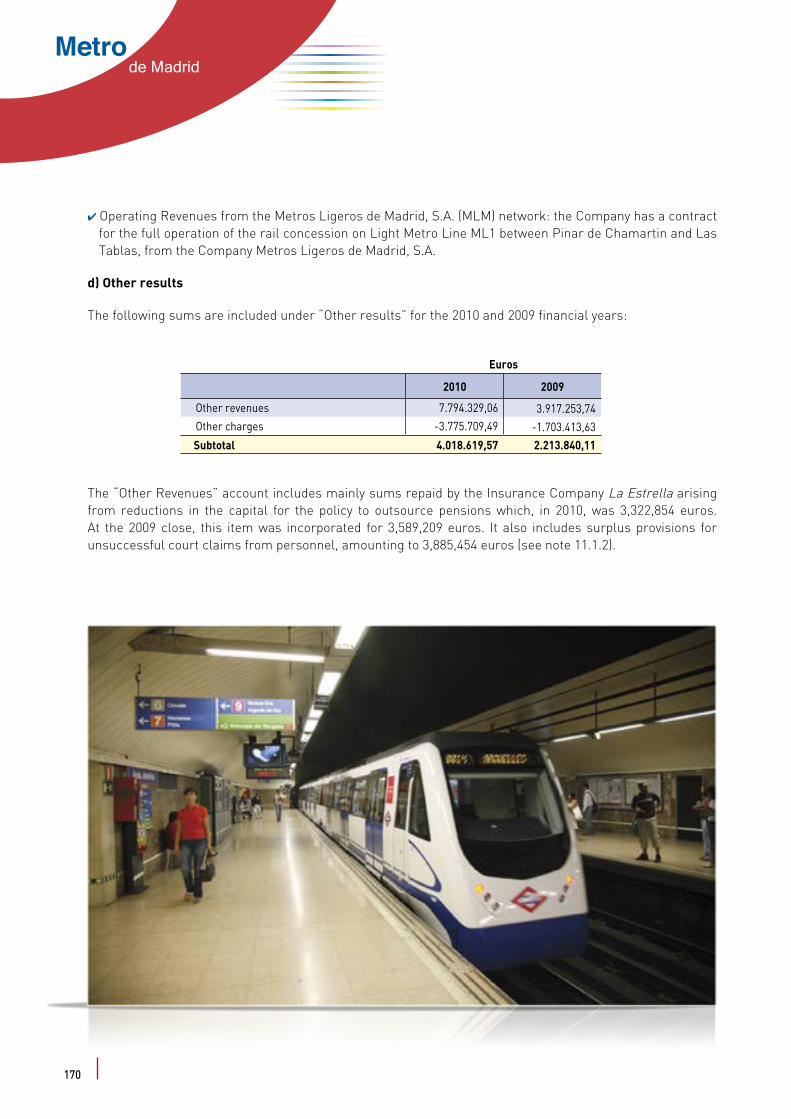
Metrode Madrid
4 Operating Revenues from the Metros Ligeros de Madrid, S.A. (MLM) network: the Company has a contract for the full operation of the rail concession on Light Metro Line ML1 between Pinar de Chamartin and Las Tablas, from the Company Metros Ligeros de Madrid, S.A.
d) Other results
The following sums are included under “Other results” for the 2010 and 2009 financial years:
Euros
2010 2009
Other revenues 7.794.329,06 3.917.253,74Other charges -3.775.709,49 -1.703.413,63
Subtotal 4.018.619,57 2.213.840,11
The “Other Revenues” account includes mainly sums repaid by the Insurance Company La Estrella arising from reductions in the capital for the policy to outsource pensions which, in 2010, was 3,322,854 euros. At the 2009 close, this item was incorporated for 3,589,209 euros. It also includes surplus provisions for unsuccessful court claims from personnel, amounting to 3,885,454 euros (see note 11.1.2).
170
AnnualReport2010
4 Operating Revenues from the Metros Ligeros de Madrid, S.A. (MLM) network: the Company has a contract for the full operation of the rail concession on Light Metro Line ML1 between Pinar de Chamartin and Las Tablas, from the Company Metros Ligeros de Madrid, S.A.
d) Other results
The following sums are included under “Other results” for the 2010 and 2009 financial years:
Euros
2010 2009
Other revenues 7.794.329,06 3.917.253,74Other charges -3.775.709,49 -1.703.413,63
Subtotal 4.018.619,57 2.213.840,11
The “Other Revenues” account includes mainly sums repaid by the Insurance Company La Estrella arising from reductions in the capital for the policy to outsource pensions which, in 2010, was 3,322,854 euros. At the 2009 close, this item was incorporated for 3,589,209 euros. It also includes surplus provisions for unsuccessful court claims from personnel, amounting to 3,885,454 euros (see note 11.1.2).
In 2010, “Other Charges” includes provision for court claims for 1,709,667 euros arising from wage discounts made pursuant to Act No. 4/2010 of the Community of Madrid and other court claims pending decision for a total of 1,900,899 euros. At the 2009 close, this account included mainly indemnifications for 685,000 euros and regularisation of 2008 Corporation Tax for 751,929 euros.
18. Operations with linked parties
The following were the transactions with associate companies during the 2010 and 2009 financial years:
Euros
CompanyRevenues Charges
2010 2009 2010 2009
Transportes Ferroviarios de Madrid, S.A.
Services 10.109.456,21 11.475.830,00 - -Advertising - - 21.081,23 20.818,00
10.109.456,21 11.475.830,00 21.081,23 20.818,00
Metros Ligeros de Madrid, S.A.
Operation of Light Metro Line ML1 7.004.328,37 7.277.720,00 - -Other revenues 55.771,40 55.329,00 - -Assignment of use of depots in Hortaleza and other charges - - 985.154,28 1.324.897,00
Interest on Loans 13.410,09 12.810,44 - -7.073.509,86 7.345.859,44 985.154,28 1.324.897,00
Total 17.182.966,07 18.821.689,44 1.006.235,51 1.345.715,00
Those companies held the following balances on 31 December 2010 and 2009:
Euros
Company
Debit balance Credit balance
(See note 8.1.2) (See note 12.3)
2010 2009 2010 2009
Transportes Ferroviarios de Madrid, S.A. 3.349.219,32 2.512.546,00 155.981,30 174.601,00Metros Ligeros de Madrid, S.A. 1.362.289,59 1.304.607,00 - 204.274,00
Total 4.711.508,91 3.817.153,00 155.981,30 378.875,00
171
Metrode Madrid
Transactions with linked companies during the 2010 and 2009 financial years were as follows:
Euros
Madrid Regional Transport Consortium 2010 2009
REVENUES FROM SALES 1.025.621.979,67 1.063.038.778,58REVENUES COMMISSION ON SEASON TICKET SALES 20.677.005,23 20.387.762,97REVENUES, REPERCUSSION OF MATERIALS 1.151.028,82 1.345.292,00
The following are the balances with that company:
Euros
CompanyDebit balance Credit balance
2010 2009 2010 2009
Madrid Regional Transport Consortium 71.669.670,33 44.326.139,00 38.487.846,50 94.448.928,00
Total 71.669.670,33 44.326.139,00 38.487.846,50 94.448.928,00
19. Developments following the close
a) No significant development had occurred by the date on which these Annual Accounts were drawn up which might affect them and knowledge of which may be useful in interpreting those accounts.
b) In application of the principle of a going concern, the General Budgets of the Community of Madrid for the 2011 financial year reflect a credit of 1,281,038,768 euros in Metro de Madrid, S.A.’s favour, with the following detail:
Charges
Chapter 1: Personnel charges 357.562.719Chapter 2: Current goods and services charges 788.543.210Chapter 3: Financial charges 13.117.794Chapter 6: Real investments 81.765.479Chapter 9: Financial liabilities 40.049.566
1.281.038.768
Revenues
Chapter 5: Capital additions 1.199.227.714Chapter 7: Capital transfers -Chapter 9: Financial liabilities 81.811.054
1.281.038.768
172
AnnualReport2010
20. Further information
20.1. 2010 and 2009 payrolls
Average number 2010
Situation on 31.12.2010
Average number 2009
Situation on 31.12.2009
Directors 15 15 15 15Men 12 12 13 13Women 3 3 2 2Management personnel 48 48 49 49
Men 41 41 43 43Women 7 7 6 6Technical and administrative personnel
1.376 1.379 1.279 1.282
Men 1.001 1.003 923 925Women 375 376 356 357Operational personnel 4.770 4.782 4.762 4.773
Men 3.350 3.356 3.343 3.350Women 1.420 1.426 1.419 1.423Operating personnel 1.411 1.415 1.499 1.502Men 1.381 1.384 1.461 1.464Women 30 31 38 38
Total 7.620 7.639 7.604 7.621
20.2. Remuneration of members of the Board of Directors and Senior Management
Members of the Board of Directors of Metro de Madrid, S.A. accrued allowances and other remuneration in 2010 and 2009 of 4,408 euros and 3,786 euros respectively.
It may also be pointed out that no advances or credits or pension or life insurance liabilities accrued for Board members, nor was any indemnification paid for resignation or based on patrimonial instruments with Board members in 2010 and 2009.
Pursuant to Act No. 53/1984 of 26 December, the personnel coming within its scope of application may receive no allowances for membership of more than two Boards of Directors. Senior Community of Madrid officers are prevented under their specific Incompatibilities Act, Act No. 14/1995 of 21 April, from receiving any allowances which represent an increase to the remuneration for the posts to which they are appointed.
The Company’s senior management accrued wages and salaries, allowances and other remuneration in turn in 2010 and 2009 for 1,666,838 euros and 1,590,989 euros.
173
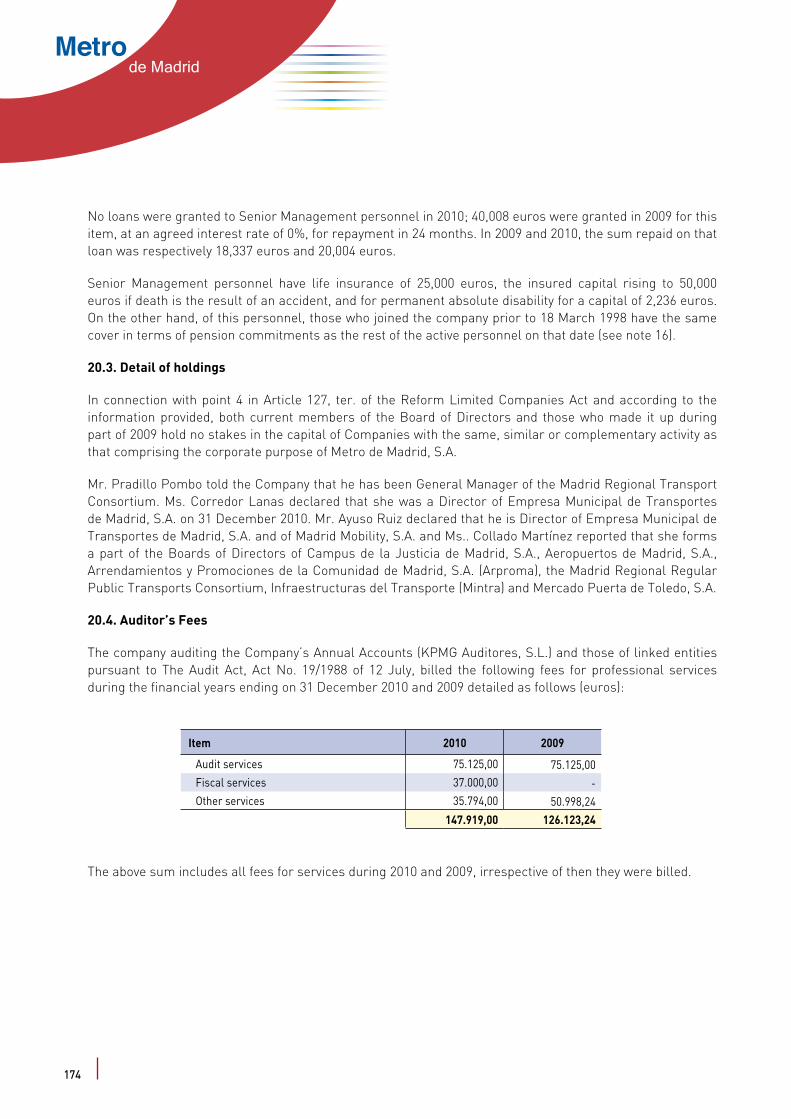
Metrode Madrid
No loans were granted to Senior Management personnel in 2010; 40,008 euros were granted in 2009 for this item, at an agreed interest rate of 0%, for repayment in 24 months. In 2009 and 2010, the sum repaid on that loan was respectively 18,337 euros and 20,004 euros.
Senior Management personnel have life insurance of 25,000 euros, the insured capital rising to 50,000 euros if death is the result of an accident, and for permanent absolute disability for a capital of 2,236 euros. On the other hand, of this personnel, those who joined the company prior to 18 March 1998 have the same cover in terms of pension commitments as the rest of the active personnel on that date (see note 16).
20.3. Detail of holdings
In connection with point 4 in Article 127, ter. of the Reform Limited Companies Act and according to the information provided, both current members of the Board of Directors and those who made it up during part of 2009 hold no stakes in the capital of Companies with the same, similar or complementary activity as that comprising the corporate purpose of Metro de Madrid, S.A.
Mr. Pradillo Pombo told the Company that he has been General Manager of the Madrid Regional Transport Consortium. Ms. Corredor Lanas declared that she was a Director of Empresa Municipal de Transportes de Madrid, S.A. on 31 December 2010. Mr. Ayuso Ruiz declared that he is Director of Empresa Municipal de Transportes de Madrid, S.A. and of Madrid Mobility, S.A. and Ms.. Collado Martínez reported that she forms a part of the Boards of Directors of Campus de la Justicia de Madrid, S.A., Aeropuertos de Madrid, S.A., Arrendamientos y Promociones de la Comunidad de Madrid, S.A. (Arproma), the Madrid Regional Regular Public Transports Consortium, Infraestructuras del Transporte (Mintra) and Mercado Puerta de Toledo, S.A.
20.4. Auditor’s Fees
The company auditing the Company’s Annual Accounts (KPMG Auditores, S.L.) and those of linked entities pursuant to The Audit Act, Act No. 19/1988 of 12 July, billed the following fees for professional services during the financial years ending on 31 December 2010 and 2009 detailed as follows (euros):
Item 2010 2009
Audit services 75.125,00 75.125,00Fiscal services 37.000,00 -Other services 35.794,00 50.998,24
147.919,00 126.123,24
The above sum includes all fees for services during 2010 and 2009, irrespective of then they were billed.
20.5. Environmental aspects
In line with environmental policy in place, activities and projects are under way with the management in this field. Charges and investments during the 2010 financial period were insignificant and so are not broken down in the Annual Accounts. Those actions are however entered, in turn on the Profit and Loss Account and the Balance Sheet.
There is no provision for environmental contingencies, as it is considered that there is no significant risk.
174

AnnualReport2010
20.5. Environmental aspects
In line with environmental policy in place, activities and projects are under way with the management in this field. Charges and investments during the 2010 financial period were insignificant and so are not broken down in the Annual Accounts. Those actions are however entered, in turn on the Profit and Loss Account and the Balance Sheet.
There is no provision for environmental contingencies, as it is considered that there is no significant risk.
175

Metro de Madrid
Audit Report
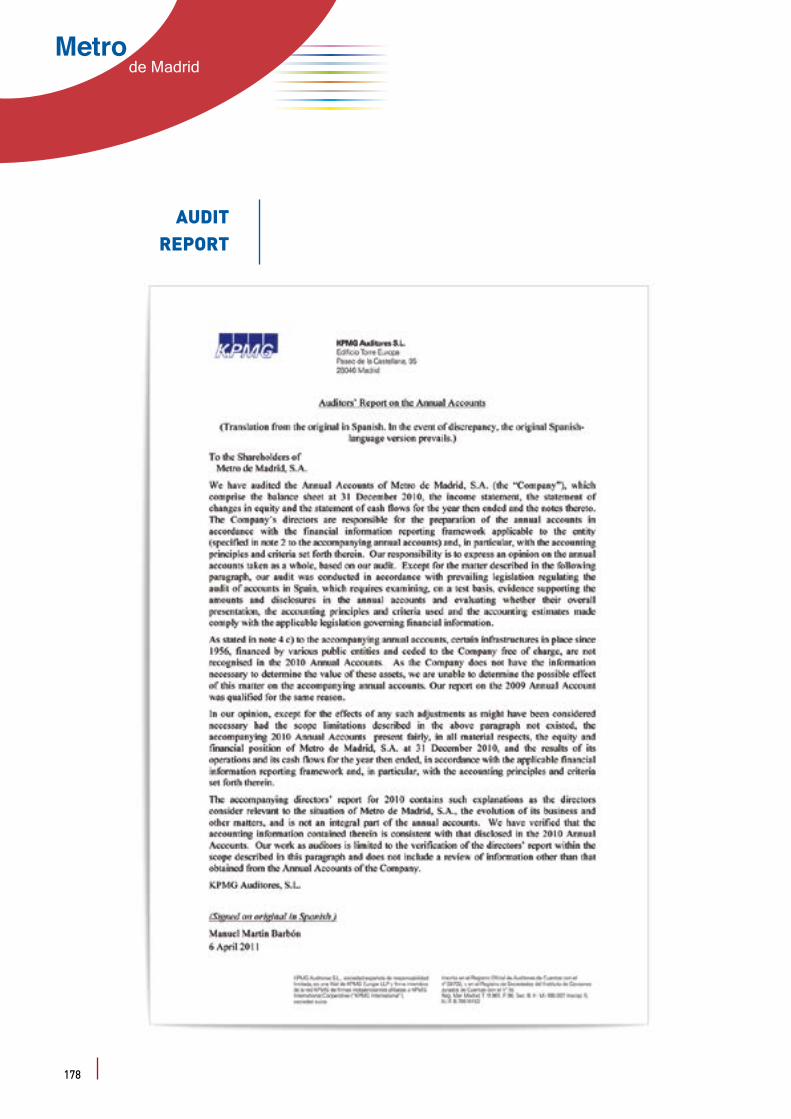
Metrode Madrid
AUDIT REPORT
178

AnnualReport2010
179


Edita: METRO DE MADRID S.A.Imprime: Boceto S.L.Depósito Legal: M-43485-2011This book has been printed using respectful materials with the environment.


Cavanilles, 58 - 28007 Madrid