Embed Size (px)
Citation preview
1
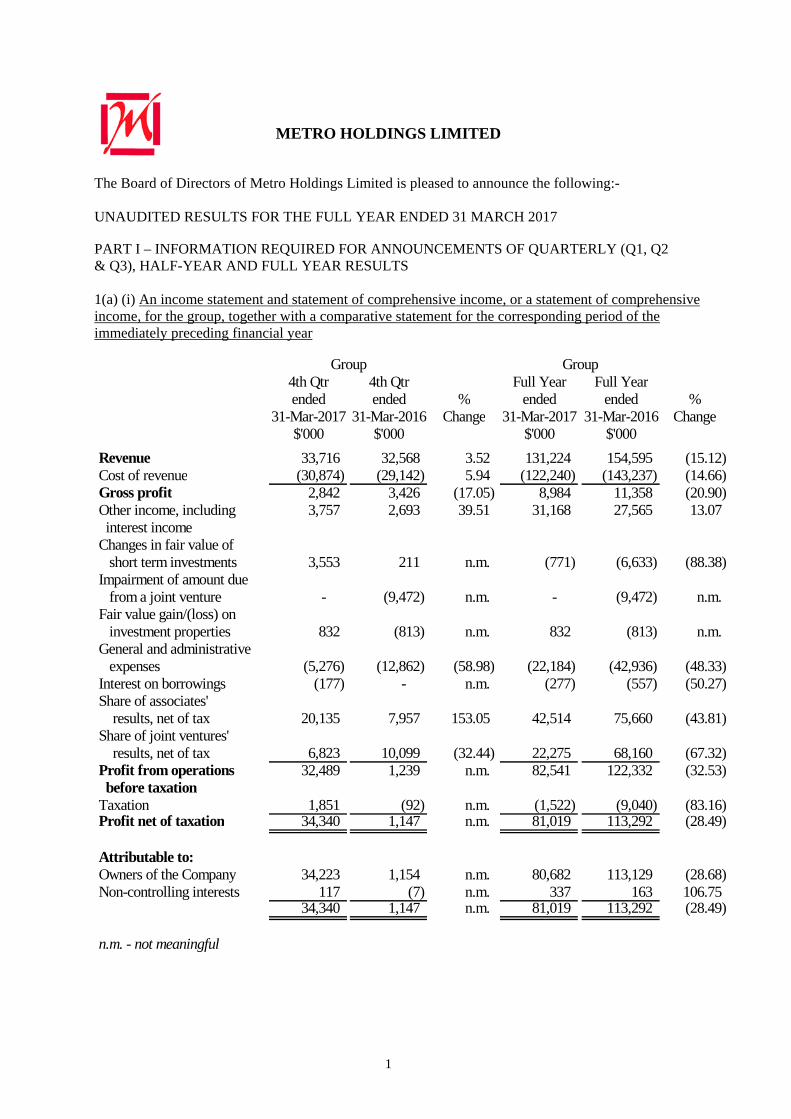
METRO HOLDINGS LIMITED
The Board of Directors of Metro Holdings Limited is pleased to announce the following:- UNAUDITED RESULTS FOR THE FULL YEAR ENDED 31 MARCH 2017 PART I – INFORMATION REQUIRED FOR ANNOUNCEMENTS OF QUARTERLY (Q1, Q2 & Q3), HALF-YEAR AND FULL YEAR RESULTS 1(a) (i) An income statement and statement of comprehensive income, or a statement of comprehensive income, for the group, together with a comparative statement for the corresponding period of the immediately preceding financial year
4th Qtr 4th Qtr Full Year Full Yearended ended % ended ended %
31-Mar-2017 31-Mar-2016 Change 31-Mar-2017 31-Mar-2016 Change$'000 $'000 $'000 $'000
Revenue 33,716 32,568 3.52 131,224 154,595 (15.12) Cost of revenue (30,874) (29,142) 5.94 (122,240) (143,237) (14.66) Gross profit 2,842 3,426 (17.05) 8,984 11,358 (20.90) Other income, including 3,757 2,693 39.51 31,168 27,565 13.07 interest incomeChanges in fair value of short term investments 3,553 211 n.m. (771) (6,633) (88.38) Impairment of amount due from a joint venture - (9,472) n.m. - (9,472) n.m.Fair value gain/(loss) on investment properties 832 (813) n.m. 832 (813) n.m.General and administrative expenses (5,276) (12,862) (58.98) (22,184) (42,936) (48.33) Interest on borrowings (177) - n.m. (277) (557) (50.27) Share of associates' results, net of tax 20,135 7,957 153.05 42,514 75,660 (43.81) Share of joint ventures' results, net of tax 6,823 10,099 (32.44) 22,275 68,160 (67.32) Profit from operations 32,489 1,239 n.m. 82,541 122,332 (32.53) before taxationTaxation 1,851 (92) n.m. (1,522) (9,040) (83.16) Profit net of taxation 34,340 1,147 n.m. 81,019 113,292 (28.49)
Attributable to:Owners of the Company 34,223 1,154 n.m. 80,682 113,129 (28.68) Non-controlling interests 117 (7) n.m. 337 163 106.75
34,340 1,147 n.m. 81,019 113,292 (28.49)
n.m. - not meaningful
Group Group

2
Statement of Comprehensive Income
4th Qtr 4th Qtr Full Year Full Yearended ended % ended ended %
31-Mar-2017 31-Mar-2016 Change 31-Mar-2017 31-Mar-2016 Change$'000 $'000 $'000 $'000
Profit net of taxation 34,340 1,147 n.m. 81,019 113,292 (28.49)
Other comprehensive income/ (expense):
Items that will not bereclassified to profit or loss: Share of other comprehensive income of an associate 290 42 590.48 290 42 590.48 Items that may be reclassifiedsubsequently to profit or loss: Currency translation adjustments on foreign subsidiaries, associates and joint ventures (25,855) (35,607) (27.39) (14,105) (36,228) (61.07) Available-for-sale financial assets - net fair value changes 1,273 (952) n.m. (4,273) 8,868 n.m. - net fair value changes reclassified to profit or loss (2,146) (536) 300.37 (5,482) (2,234) 145.39 Translation and other reserve of joint ventures transferred to profit or loss upon disposal (see note under 1(a)(v) on page 6) - - n.m. - (12,329) n.m. Share of other comprehensive expense of associates and joint ventures (16,860) (4,995) 237.54 (28,279) (19,554) 44.62 Other comprehensive
expense, net of tax: (43,298) (42,048) 2.97 (51,849) (61,435) (15.60)
Total comprehensive (expense) /income for the period (8,958) (40,901) (78.10) 29,170 51,857 (43.75)
Total comprehensive (expense) /income attributable to:Owners of the Company (8,692) (40,643) (78.61) 30,542 51,362 (40.54) Non-controlling interests (266) (258) 3.10 (1,372) 495 n.m.
(8,958) (40,901) (78.10) 29,170 51,857 (43.75)
n.m. - not meaningful
Group Group
Note:
Currency translation adjustments on foreign subsidiaries, associates and joint ventures are mainly a result of the Group’s exposure to the effects of fluctuations in foreign currency exchange rates in relation to Chinese Renminbi as the Group’s investment properties and development projects are situated in the People’s Republic of China. There is also a small exposure to British pounds in respect of the projects in the United Kingdom. Whenever possible, the Group seeks to maintain a natural hedge through the matching of liabilities, including borrowings, against assets in the same currency. Share of other comprehensive income/(expense) of associates and joint ventures mainly relate to similar currency translation adjustments.

3
Changes in fair value of available-for-sale financial assets mainly relate to fluctuations in the fair value of the Group’s investments classified under Investments (Non-current assets). 1(a) (ii) Revenue Revenue of the Group comprises sales of goods and services and net commission from concessionaires. Revenue of the Group reported on a gross transaction basis, which includes the value of the overall activity of the Group based on the gross value achieved by the concessionaire on the sale, is presented as follows:-
4th Qtr 4th Qtr Full Year Full Yearended ended % ended ended %
31-Mar-2017 31-Mar-2016 Change 31-Mar-2017 31-Mar-2016 Change$'000 $'000 $'000 $'000
Retail 51,728 51,544 0.36 198,617 241,482 (17.75) Property 1,612 1,761 (8.46) 6,513 8,500 (23.38)
53,340 53,305 0.07 205,130 249,982 (17.94)
Group Group

4
1(a) (iii) Profit from operations before taxation is arrived at after accounting for:-
4th Qtr 4th Qtr Full Year Full Yearended ended % ended ended %
31-Mar-2017 31-Mar-2016 Change 31-Mar-2017 31-Mar-2016 Change$'000 $'000 $'000 $'000
Cost of revenue and general and administrative expenses includes:- Inventories recognised as an (18,849) (16,870) 11.73 (74,849) (79,540) (5.90) expense Depreciation of plant and equipment (465) (397) 17.13 (1,727) (2,674) (35.42) (Allowance for)/write-back (108) - n.m. (641) 93 n.m. of obsolete inventories Inventories written back/(down) 120 (17) n.m. (471) (1,080) (56.39) Rental expense (5,834) (6,189) (5.74) (23,375) (29,035) (19.49) Foreign exchange loss - (8,311) n.m. - (8,311) n.m.
Other income including interest income includes:- Interest income 3,082 2,749 12.11 11,129 11,473 (3.00) Dividends from quoted investments 308 562 (45.20) 3,123 4,091 (23.66) Gain/(loss) on disposal of short term investments 782 (115) n.m. 1,639 448 265.85 Gain on disposal of available-for-sale investments - - n.m. - 255 n.m. Distribution from available-for-sale investments 2,146 536 300.37 5,482 2,234 145.39 Gain on disposal of an investment property * - - n.m. - 4,430 n.m. Management fee income from associates 215 220 (2.27) 910 938 (2.99) (Reversal of)/foreign exchange gain (5,652) (2,771) 103.97 3,328 6 n.m. Foreign exchange gain realised on liquidation of an associate and subsidiaries 1,144 - n.m. 2,392 - n.m.
n.m. - not meaningful
Group Group
* In the previous year ended 31 March 2016, the gain on disposal of an investment property refers
to the gain arising on the sale of Frontier Koishikawa Building being net proceeds over and above the valuation as at 31 March 2015.
5
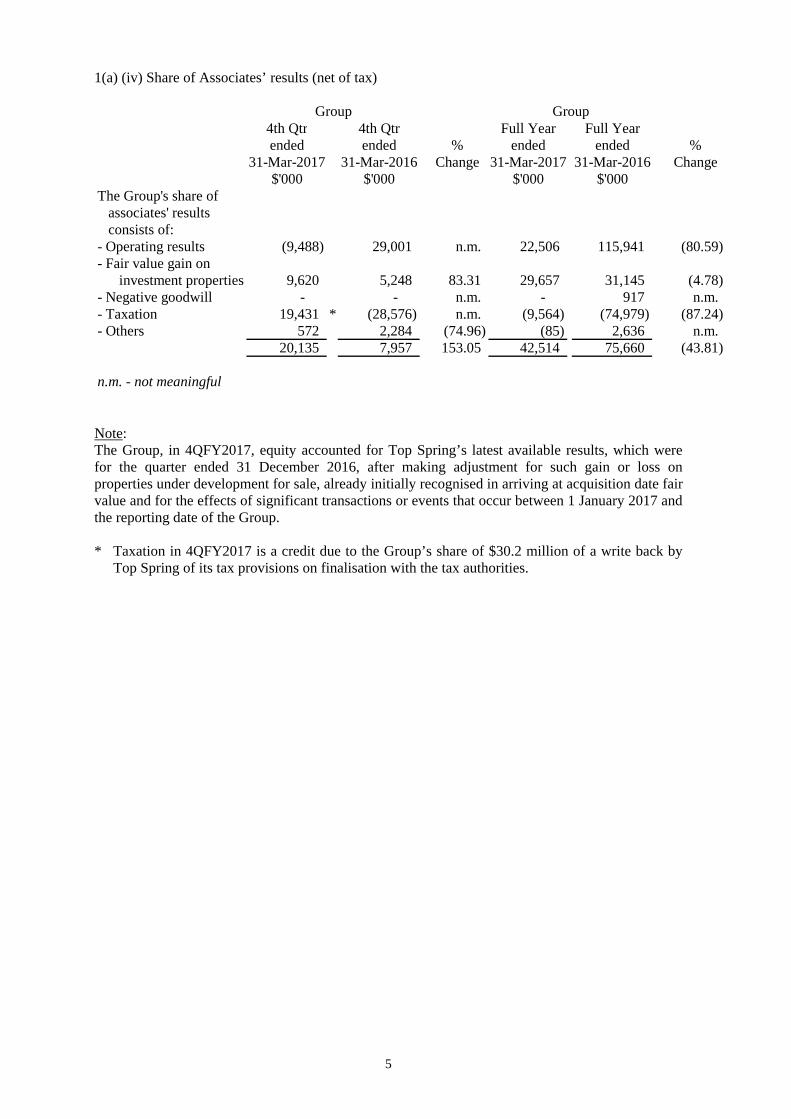
1(a) (iv) Share of Associates’ results (net of tax)
4th Qtr 4th Qtr Full Year Full Yearended ended % ended ended %
31-Mar-2017 31-Mar-2016 Change 31-Mar-2017 31-Mar-2016 Change$'000 $'000 $'000 $'000
The Group's share of associates' results consists of:- Operating results (9,488) 29,001 n.m. 22,506 115,941 (80.59) - Fair value gain on investment properties 9,620 5,248 83.31 29,657 31,145 (4.78) - Negative goodwill - - n.m. - 917 n.m.- Taxation 19,431 * (28,576) n.m. (9,564) (74,979) (87.24) - Others 572 2,284 (74.96) (85) 2,636 n.m.
20,135 7,957 153.05 42,514 75,660 (43.81)
n.m. - not meaningful
Group Group
Note: The Group, in 4QFY2017, equity accounted for Top Spring’s latest available results, which were for the quarter ended 31 December 2016, after making adjustment for such gain or loss on properties under development for sale, already initially recognised in arriving at acquisition date fair value and for the effects of significant transactions or events that occur between 1 January 2017 and the reporting date of the Group. * Taxation in 4QFY2017 is a credit due to the Group’s share of $30.2 million of a write back by
Top Spring of its tax provisions on finalisation with the tax authorities.

6
1(a) (v) Share of Joint Ventures’ results (net of tax)
% %31-Mar-2017 31-Mar-2016 Change 31-Mar-2017 31-Mar-2016 Change
$'000 $'000 $'000 $'000The Group's share of joint ventures' results consists of:- Operating results 9,405 9,504 (1.04) 36,263 35,906 0.99 - Fair value (loss)/gain on investment properties (302) 884 n.m. (6,611) (4,252) 55.48 - Negative goodwill - 2,270 n.m. - 2,270 n.m.- Non-operating results * - - n.m. - 53,747 n.m.- Taxation * (2,280) (2,559) (10.90) (7,377) (19,511) (62.19)
6,823 10,099 (32.44) 22,275 68,160 (67.32)
Note:Revenue 26,409 15,101 74.88 117,894 79,266 48.73 Direct expenses (15,866) (5,359) 196.06 (80,118) (42,097) 90.32 Gross profit 10,543 9,742 8.22 37,776 37,169 1.63 Other income, including interest income (76) 457 n.m. 1,917 55,741 (96.56) Fair value (loss)/gain on investment properties (302) 884 n.m. (6,611) (4,252) 55.48 Negative goodwill - 2,270 n.m. - 2,270 n.m.General and administrative expenses (817) (692) 18.06 (3,185) (3,248) (1.94) Profit from operating 9,348 12,661 (26.17) 29,897 87,680 (65.90) activitiesInterest on borrowings (245) (3) n.m. (245) (9) n.m.Profit from operations 9,103 12,658 (28.09) 29,652 87,671 (66.18) before taxationTaxation (2,280) (2,559) (10.90) (7,377) (19,511) (62.19) Profit net of taxation 6,823 10,099 (32.44) 22,275 68,160 (67.32)
n.m. - not meaningful
Group4th Qtr ended
GroupFull Year
Note: Results of joint ventures include the results of Metro City, Metro Tower and The Crest. * For the previous year ended 31 March 2016, the non-operating results of joint ventures of $53.7
million pertain to a divestment gain from the disposal of the Group’s effective interest of 50% in the joint ventures owning EC Mall, Beijing, People’s Republic of China in 1QFY2016. This included exchange difference on translation and other reserves of the joint ventures, totaling $12.3 million, transferred to profit or loss upon disposal. The taxation charge included a tax expense incurred in respect of this divestment gain of $12.0 million.
Other expenses relating to this divestment, offset by realised exchange gains on repayment of
shareholders’ loans, totaling about $3.6 million are classified under general and administrative expenses of the Group of $42.9 million for the previous year ended 31 March 2016.
The net gain on this divestment included for the previous year ended 31 March 2016 was $38.1
million.

7
1(a) (vi) Taxation
4th Qtr 4th Qtr Full Year Full Yearended ended % ended ended %
31-Mar-2017 31-Mar-2016 Change 31-Mar-2017 31-Mar-2016 Change$'000 $'000 $'000 $'000
Current Year Tax 2,895 360 704.17 3,997 6,497 (38.48) Over-provision in respect of prior year (3,041) 91 n.m. (3,053) 90 n.m.Deferred Tax (1,705) (359) 374.93 575 2,447 (76.50) Withholding Tax - - n.m. 3 6 (50.00)
(1,851) 92 n.m. 1,522 9,040 (83.16)
n.m. - not meaningful
Group Group
The tax charge of the Group for the fourth quarter period ended 31 March 2017, excluding share of results of associates and joint ventures which is already stated net of tax, is higher mainly due to expenditure not deductible for tax purposes. The tax charge of the Group for the year ended 31 March 2017, excluding share of results of associates and joint ventures which is already stated net of tax, is higher than that derived by applying the Singapore statutory income tax rate of 17% applicable to company profits, mainly due to deferred tax expense being withholding tax provided on undistributed profits of joint ventures and an associate and expenditure not deductible for tax purposes.

8
1(b) (i) A statement of financial position (for the issuer and group), together with a comparative statement as at the end of the immediately preceding financial year Balance Sheets as at
31-Mar-2017 31-Mar-2016 31-Mar-2017 31-Mar-2016$'000 $'000 $'000 $'000
Non-current assetsPlant and equipment 5,062 4,872 73 58 Investment properties 104,423 106,653 - - Subsidiaries - - 17,790 17,790 Amounts due from subsidiaries - - 493,239 318,972 Associates 373,542 396,785 500 500 Amounts due from associates 134,108 70,266 - - Joint ventures 203,800 216,249 - - Amounts due from joint ventures 178,874 128,972 - - Investments 94,921 51,429 - - Deferred tax assets 1,102 1,441 - -
1,095,832 976,667 511,602 337,320 Current assetsInventories 19,433 19,296 - - Prepayments 1,073 721 - 8 Accounts and other receivables 7,819 10,492 212 172 Tax recoverable 250 267 - - Short term investments 42,208 33,919 - - Pledged fixed bank deposits 111,278 - - - Cash and cash equivalents 278,164 493,606 9,192 18,805
460,225 558,301 9,404 18,985 Current liabilitiesBank borrowings 65,915 - - - Accounts and other payables 39,641 52,683 5,680 15,943 Amount due to an associate 67,457 69,050 - - Provision for taxation 2,234 4,813 69 75
175,247 126,546 5,749 16,018
Net current assets 284,978 431,755 3,655 2,967 Non-current liabilitiesAmounts due to subsidiaries - - 244,226 46,065 Deferred income 13,352 12,010 - - Deferred taxation 16,759 16,920 11 9
(30,111) (28,930) (244,237) (46,074)
Net assets 1,350,699 1,379,492 271,020 294,213
Equity attributable to owners of the CompanyShare capital 169,717 169,717 169,717 169,717 Treasury shares (1,768) (1,768) (1,768) (1,768) Reserves 1,180,277 1,207,698 103,071 126,264
1,348,226 1,375,647 271,020 294,213 Non-controlling interests 2,473 3,845 - - Total equity 1,350,699 1,379,492 271,020 294,213
Group Company

9
1(b) (ii) Aggregate amount of group’s borrowings and debt securities Amount repayable in one year or less, or on demand
As at 31-Mar-2017 As at 31-Mar-2016 Secured Unsecured Secured Unsecured
65,915,000 - - - Amount repayable after one year
As at 31-Mar-2017 As at 31-Mar-2016 Secured Unsecured Secured Unsecured
- - - - Details of any collateral for banking facilities Subsidiaries: Fixed deposits totaling S$111.3 million have been mortgaged to banks for banking facilities of GBP58.0 million granted to certain subsidiaries. Total loans drawn on such facilities as at 31 March 2017 amounted to GBP37.9 million (equivalent to S$65.9 million).

10
1(c) A statement of cash flows (for the group), together with a comparative statement for the corresponding period of the immediately preceding financial year Consolidated Statement of Cash Flows for the period ended
4th Qtr 4th Qtr Full Year Full Yearended ended ended ended
31-Mar-2017 31-Mar-2016 31-Mar-2017 31-Mar-2016$'000 $'000 $'000 $'000
Cash flows from operating activitiesOperating profit/(loss) before reinvestment in working capital 1,313 (7,176) (5,100) (18,176) Decrease/(increase) in inventories 300 1,728 (1,249) 6,695 (Increase)/decrease in accounts and other receivables (153) (1,137) 2,336 441 Decrease in accounts and other payables (6,815) (6,029) (13,042) (8,008)
Cash used in operations (5,355) (12,614) (17,055) (19,048)
Interest expense paid (177) - (277) (557)
Interest income received 3,552 2,628 8,949 8,936
Income taxes paid (2,651) (367) (3,619) (5,712)
Net cash flows used in operating activities (4,631) (10,353) (12,002) (16,381)
Cash flows from investing activitiesPurchase of plant & equipment (954) (1,421) (1,973) (1,792) (Increase)/decrease in investments (54,050) (31) (51,908) 457 Purchase of short term investments - - (19,999) (2,321) Proceeds from liquidation of associates - - 128 - Proceeds from disposal of an investment property - - - 60,233 Proceeds from disposal of plant and equipment 3 112 44 329 Proceeds from disposal of short term investments 6,545 3,352 12,579 12,079 Proceeds from disposal of available-for-sale investments - - - 3,417 Proceeds from distribution from available-for-sale investments 2,146 536 5,482 1,557 Investment in associates 8,696 (625) (6,746) (31,532) Investment in a joint venture - (2,012) - (2,012) Increase/(decrease) in amount due to an associate - - 389 (37,276) (Increase)/decrease in amounts due from associates (22,004) (9,832) (64,601) 2,123 (Increase)/decrease in amounts due from joint ventures (34,230) (38) (49,703) 75,199 Dividends received from quoted investments 308 562 3,123 4,091 Dividends received from associates 29,588 1,552 43,230 25,703 Dividends received from joint ventures - - 27,804 136,919 Changes in pledged fixed bank deposits (47,000) - (111,278) 28,849
Currency realignment 2,203 (3,085) 3,014 (1,269)
Net cash flows (used in)/generated from investing activities (108,749) (10,930) (210,415) 274,754
Cash flows from financing activitiesDrawdown of bank borrowings 31,966 - 66,554 - Repayment of bank borrowings - - - (60,357) Dividend paid - - (57,963) (49,682) Currency realignment (683) - (639) 918 Net cash flows generated from/(used in) financing activities 31,283 - 7,952 (109,121)
Net (decrease)/increase in cash and cash equivalents (82,097) (21,283) (214,465) 149,252
Effect of exchange rate changes in cash and cash equivalents (8,243) (3,368) (977) (5,633) Cash & cash equivalents at beginning of financial period 368,504 518,257 493,606 349,987
Cash & cash equivalents at end of financial period 278,164 493,606 278,164 493,606
Group Group

11
Consolidated Statement of Cash Flows for the period ended (Cont’d)
4th Qtr 4th Qtr Full Year Full Yearended ended ended ended
31-Mar-2017 31-Mar-2016 31-Mar-2017 31-Mar-2016$'000 $'000 $'000 $'000
Reconciliation between profit from operations before taxation and operating cash flows before changes in working capital:
Profit from operations before taxation 32,489 1,239 82,541 122,332 Adjustments for: Fair value (gain)/loss on investment properties (832) 813 (832) 813 Interest expense 177 - 277 557 Depreciation of plant and equipment 465 397 1,727 2,674 Share of results of associates (20,135) (7,957) (42,514) (75,660) Share of results of joint ventures (6,823) (10,099) (22,275) (68,160) Interest and investment income (3,390) (3,311) (14,252) (15,564) Inventories written (back)/down (120) 17 471 1,080 Allowance for/(write-back of) obsolete inventories 108 - 641 (93) Allowance for/(write-back of) doubtful debts 4 (48) 2 (48) Plant and equipment written off (12) 151 53 269 Impairment of amount due from a joint venture - 9,472 - 9,472 Gain on disposal of an investment property - - - (4,430) (Gain)/loss on disposal of plant and equipment - (101) (41) (318) Changes in fair value of short term investments (3,553) (211) 771 6,633 (Gain)/loss on disposal of short term investments (782) 115 (1,639) (448) Gain on disposal of available-for-sale investments - - - (255) Distribution from available-for-sale investments (2,146) (536) (5,482) (2,234) Foreign exchange adjustments 5,863 2,883 (4,548) 5,204
1,313 (7,176) (5,100) (18,176)
Group Group
Operating profit/(loss) before reinvestment in working capital

12
1 (d) (i) A statement (for the issuer and group) showing either (i) all changes in equity or (ii) changes in equity other than those arising from capitalisation issues and distributions to shareholders, together with a comparative statement for the corresponding period of the immediately preceding financial year Statement of Changes in Shareholders’ Equity
ShareCapital
TreasuryShares
Fair ValueReserve
ForeignCurrency
TranslationReserve
Statutory reserve
OtherReserve
RevenueReserve Total
Non-controllingInterests
TotalEquity
Group $'000 $'000 $'000 $'000 $'000 $'000 $'000 $'000 $'000 $'000At 1 April 2016 169,717 (1,768) 12,555 (8,144) 10,144 682 1,192,461 1,375,647 3,845 1,379,492
Profit for the period - - - - - - 46,459 46,459 220 46,679 Other comprehensive income/(expense)Currency translation adjustments on foreign subsidiaries, associates and joint ventures - - - 12,543 - - - 12,543 (793) 11,750 Available-for-sale financial assets - net fair value changes - - (5,213) - - - - (5,213) (333) (5,546) - net fair value changes reclassified to profit or loss - - (3,136) - - - - (3,136) (200) (3,336) Share of other comprehensive (expense)/ income of associates and joint ventures - - - (11,924) - 505 - (11,419) - (11,419) Other comprehensive expense/(income) for the financial period, net of tax - - (8,349) 619 - 505 - (7,225) (1,326) (8,551) Total comprehensive (expense)/income for the financial period - - (8,349) 619 - 505 46,459 39,234 (1,106) 38,128
Contributions by and distributions to ownersDividends paid - - - - - - (57,963) (57,963) - (57,963) Total contributions by and distributions to owners - - - - - - (57,963) (57,963) - (57,963)
OthersTransfer to statutory reserve fund - - - - 134 - (134) - - - At 31 December 2016 169,717 (1,768) 4,206 (7,525) 10,278 1,187 1,180,823 1,356,918 2,739 1,359,657
13
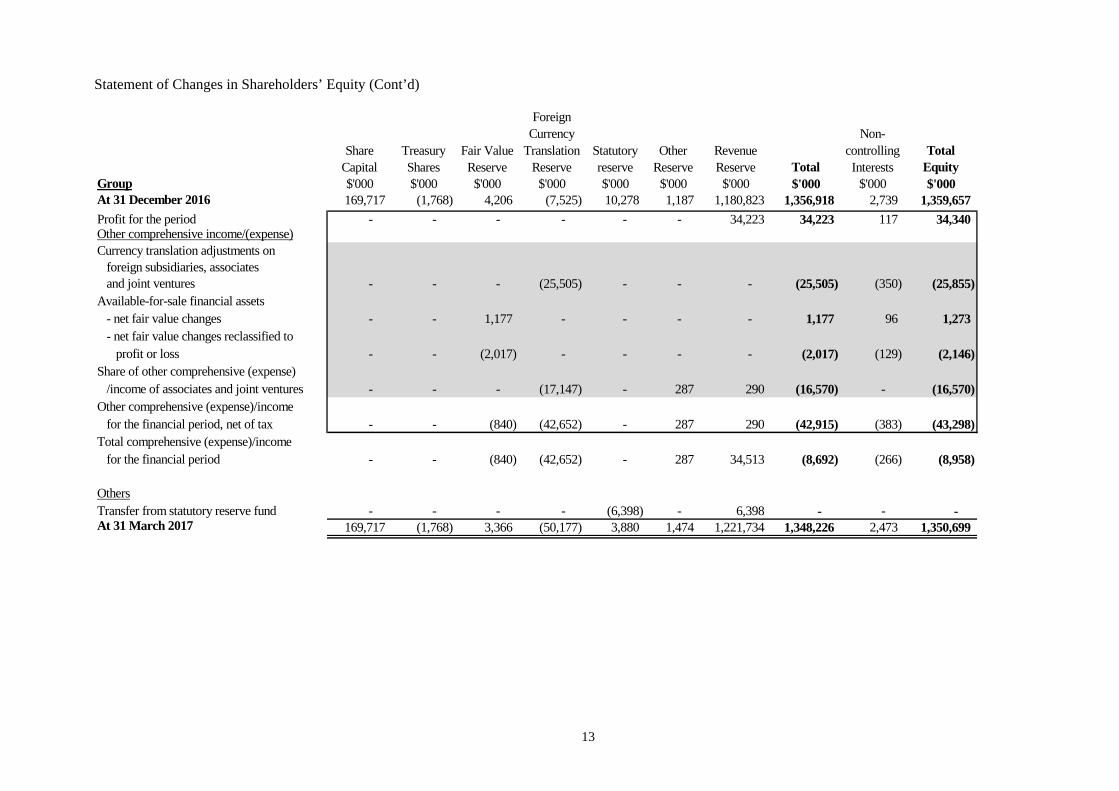
Statement of Changes in Shareholders’ Equity (Cont’d)
ShareCapital
TreasuryShares
Fair ValueReserve
ForeignCurrency
TranslationReserve
Statutory reserve
OtherReserve
RevenueReserve Total
Non-controllingInterests
TotalEquity
Group $'000 $'000 $'000 $'000 $'000 $'000 $'000 $'000 $'000 $'000At 31 December 2016 169,717 (1,768) 4,206 (7,525) 10,278 1,187 1,180,823 1,356,918 2,739 1,359,657
Profit for the period - - - - - - 34,223 34,223 117 34,340 Other comprehensive income/(expense)Currency translation adjustments on foreign subsidiaries, associates and joint ventures - - - (25,505) - - - (25,505) (350) (25,855) Available-for-sale financial assets - net fair value changes - - 1,177 - - - - 1,177 96 1,273 - net fair value changes reclassified to profit or loss - - (2,017) - - - - (2,017) (129) (2,146) Share of other comprehensive (expense) /income of associates and joint ventures - - - (17,147) - 287 290 (16,570) - (16,570) Other comprehensive (expense)/income for the financial period, net of tax - - (840) (42,652) - 287 290 (42,915) (383) (43,298) Total comprehensive (expense)/income for the financial period - - (840) (42,652) - 287 34,513 (8,692) (266) (8,958)
OthersTransfer from statutory reserve fund - - - - (6,398) - 6,398 - - - At 31 March 2017 169,717 (1,768) 3,366 (50,177) 3,880 1,474 1,221,734 1,348,226 2,473 1,350,699

14
Statement of Changes in Shareholders’ Equity (Cont’d)
ShareCapital
TreasuryShares
CapitalReserve
Fair ValueReserve
ForeignCurrency
TranslationReserve
Statutory reserve
OtherReserve
RevenueReserve Total
Non-controllingInterests
TotalEquity
Group $'000 $'000 $'000 $'000 $'000 $'000 $'000 $'000 $'000 $'000 $'000
At 1 April 2015 169,717 (1,768) 9,954 6,319 50,314 3,395 315 1,135,721 1,373,967 3,350 1,377,317
Profit for the period - - - - - - - 111,975 111,975 170 112,145 Other comprehensive income/(expense)Currency translation adjustments on foreign subsidiaries, associates and joint ventures - - - - (717) - - - (717) 96 (621) Available-for-sale financial assets - net fair value changes - - - 9,231 - - - - 9,231 589 9,820 - net fair value changes reclassified to profit or loss - - - (1,596) - - - - (1,596) (102) (1,698) Translation and other reserve of joint ventures transferred to profit or loss upon disposal - - (9,954) - (2,375) - - - (12,329) - (12,329) Share of other comprehensive expense of associates and joint ventures - - - - (14,242) - (317) - (14,559) - (14,559) Other comprehensive (expense)/income for the financial period, net of tax - - (9,954) 7,635 (17,334) - (317) - (19,970) 583 (19,387) Total comprehensive (expense)/income for the financial period - - (9,954) 7,635 (17,334) - (317) 111,975 92,005 753 92,758
Contributions by and distributions to ownersDividends paid - - - - - - - (49,682) (49,682) - (49,682) Total contributions by and distributions to owners - - - - - - - (49,682) (49,682) - (49,682)
OthersTransfer to statutory reserve fund - - - - - 6,993 - (6,993) - - - At 31 December 2015 169,717 (1,768) - 13,954 32,980 10,388 (2) 1,191,021 1,416,290 4,103 1,420,393

15
Statement of Changes in Shareholders’ Equity (Cont’d)
ShareCapital
TreasuryShares
CapitalReserve
Fair ValueReserve
ForeignCurrency
TranslationReserve
Statutory reserve
OtherReserve
RevenueReserve Total
Non-controllingInterests
TotalEquity
Group $'000 $'000 $'000 $'000 $'000 $'000 $'000 $'000 $'000 $'000 $'000
At 31 December 2015 169,717 (1,768) - 13,954 32,980 10,388 (2) 1,191,021 1,416,290 4,103 1,420,393
Profit for the period - - - - - - - 1,154 1,154 (7) 1,147 Other comprehensive income/(expense)Currency translation adjustments on foreign subsidiaries, associates and joint ventures - - - - (35,445) - - - (35,445) (162) (35,607) Available-for-sale financial assets - net fair value changes - - - (895) - - - - (895) (57) (952) - net fair value changes reclassified to profit or loss - - - (504) - - - - (504) (32) (536) Share of other comprehensive (expense)/ income of associates and joint ventures - - - - (5,679) - 684 42 (4,953) - (4,953) Other comprehensive (expense)/income for the financial period, net of tax - - - (1,399) (41,124) - 684 42 (41,797) (251) (42,048) Total comprehensive (expense)/income for the financial period - - - (1,399) (41,124) - 684 1,196 (40,643) (258) (40,901)
OthersTransfer from statutory reserve fund - - - - - (244) - 244 - - - At 31 March 2016 169,717 (1,768) - 12,555 (8,144) 10,144 682 1,192,461 1,375,647 3,845 1,379,492

16
Statement of Changes in Shareholders’ Equity (Cont’d)
ShareCapital
TreasuryShares
RevenueReserve
TotalEquity
Company $'000 $'000 $'000 $'000
At 1 April 2016 169,717 (1,768) 126,264 294,213 Loss for the period, representing total comprehensive expense for the financial period - - (1,850) (1,850)
Contributions by and distributions to ownersDividends paid - - (57,963) (57,963)
At 31 December 2016 169,717 (1,768) 66,451 234,400 Profit for the period, representing total comprehensive expense for the financial period - - 36,620 36,620
At 31 March 2017 169,717 (1,768) 103,071 271,020
At 1 April 2015 169,717 (1,768) 103,720 271,669 Profit for the period, representing total comprehensive income for the financial period - - 68,867 68,867
Contributions by and distributions to ownersDividends paid - - (49,682) (49,682)
At 31 December 2015 169,717 (1,768) 122,905 290,854 Profit for the period, representing total comprehensive expense for the financial period - - 3,359 3,359
At 31 March 2016 169,717 (1,768) 126,264 294,213
1(d) (ii) Details of any changes in the company's share capital arising from rights issue, bonus issue, share buy-backs, exercise of share options or warrants, conversion of other issues of equity securities, issue of shares for cash or as consideration for acquisition or for any other purpose since the end of the previous period reported on. State the number of shares that may be issued on conversion of all the outstanding convertibles, if any, against the total number of issued shares excluding treasury shares and subsidiary holdings of the issuer, as at the end of the current financial period reported on and as at the end of the corresponding period of the immediately preceding financial year. State also the number of shares held as treasury shares and the number of subsidiary holdings, if any, and the percentage of the aggregate number of treasury shares and subsidiary holdings held against the total number of shares outstanding in a class that is listed as at the end of the current financial period reported on and as at the end of the corresponding period of the immediately preceding financial year. Changes in the Company’s share capital and treasury shares are as follows: As at 31 March 2017, there were 3,512,800 treasury shares (as at 31 March 2016: 3,512,800). The Company did not issue any shares during the 3 months ended 31 March 2017. There were no convertible instruments outstanding as at 31 March 2017 (31 March 2016: Nil).
17
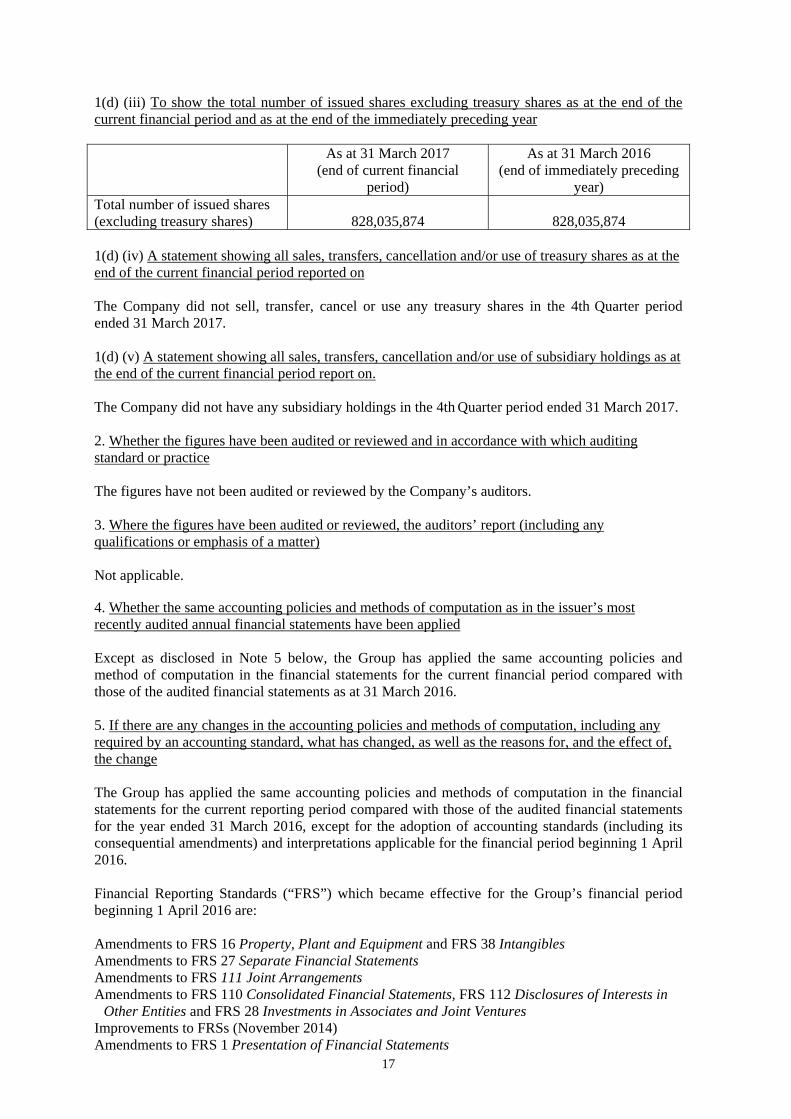
1(d) (iii) To show the total number of issued shares excluding treasury shares as at the end of the current financial period and as at the end of the immediately preceding year As at 31 March 2017
(end of current financial period)
As at 31 March 2016 (end of immediately preceding
year) Total number of issued shares (excluding treasury shares)
828,035,874
828,035,874
1(d) (iv) A statement showing all sales, transfers, cancellation and/or use of treasury shares as at the end of the current financial period reported on The Company did not sell, transfer, cancel or use any treasury shares in the 4th Quarter period ended 31 March 2017. 1(d) (v) A statement showing all sales, transfers, cancellation and/or use of subsidiary holdings as at the end of the current financial period report on. The Company did not have any subsidiary holdings in the 4th Quarter period ended 31 March 2017. 2. Whether the figures have been audited or reviewed and in accordance with which auditing standard or practice The figures have not been audited or reviewed by the Company’s auditors. 3. Where the figures have been audited or reviewed, the auditors’ report (including any qualifications or emphasis of a matter) Not applicable. 4. Whether the same accounting policies and methods of computation as in the issuer’s most recently audited annual financial statements have been applied Except as disclosed in Note 5 below, the Group has applied the same accounting policies and method of computation in the financial statements for the current financial period compared with those of the audited financial statements as at 31 March 2016. 5. If there are any changes in the accounting policies and methods of computation, including any required by an accounting standard, what has changed, as well as the reasons for, and the effect of, the change The Group has applied the same accounting policies and methods of computation in the financial statements for the current reporting period compared with those of the audited financial statements for the year ended 31 March 2016, except for the adoption of accounting standards (including its consequential amendments) and interpretations applicable for the financial period beginning 1 April 2016. Financial Reporting Standards (“FRS”) which became effective for the Group’s financial period beginning 1 April 2016 are: Amendments to FRS 16 Property, Plant and Equipment and FRS 38 Intangibles Amendments to FRS 27 Separate Financial Statements Amendments to FRS 111 Joint Arrangements Amendments to FRS 110 Consolidated Financial Statements, FRS 112 Disclosures of Interests in
Other Entities and FRS 28 Investments in Associates and Joint Ventures Improvements to FRSs (November 2014) Amendments to FRS 1 Presentation of Financial Statements

18
The Group has adopted all the new and revised standards which are effective for annual financial periods beginning on or after 1 April 2016. The adoption of these standards did not have any effect on the financial performance or position of the Group. 6. Earnings per ordinary share of the group for the current period reported on and the corresponding period of the immediately preceding financial year, after deducting any provision for preference dividends Earnings Per Share
Group Figures Latest Period Previous
corresponding period
Earnings per ordinary share based on net profit attributable to shareholders and after deducting any provision for preference dividends
(a) Based on existing issued share capital 9.7 cents 13.7 cents (b) On a fully diluted basis 9.7 cents 13.7 cents
Earnings per share is calculated on the Group’s profit attributable to shareholders of the Company of $80,682,000 (period ended 31 March 2016: $113,129,000) divided by the weighted average number of ordinary shares of 828,035,874 for the period ended 31 March 2017 (period ended 31 March 2016: 828,035,874). Diluted earnings per ordinary share is computed based on the same basis as earnings per share by applying the weighted average number of ordinary shares in issuance during the periods under review and adjusted to include all potential dilutive ordinary shares up to 31 March 2017. 7. Net asset value (for the issuer and group) per ordinary share based on the total number of issued shares excluding treasury shares of the issuer at the end of the (a) current financial period reported on and (b) immediately preceding financial year Net Asset Value
Group Company Net asset value per ordinary share based on issued share capital at end of the period reported on
(a) Current Period - 31 March 2017 $1.63 $0.33 (b) 31 March 2016 $1.66 $0.36
Net asset value for the Group is calculated on the equity attributable to owners of the Company as at 31 March 2017 of $1,348,226,000 (31 March 2016: $1,375,647,000) divided by the total number of issued shares excluding treasury shares as at 31 March 2017 of 828,035,874 (31 March 2016: 828,035,874).

19
8. A review of the performance of the group, to the extent necessary for a reasonable understanding of the group’s business. It must include a discussion of the following: (a) any significant factors that affected the turnover, costs, and earnings of the group for the current financial period reported on, including (where applicable) seasonal or cyclical factors; and (b) any material factors that affected the cash flow, working capital, assets or liabilities of the group during the current financial period reported on 8(a) Review of Group Results for 4th Quarter ended 31 March 2017 against 4th Quarter ended 31 March 2016 The Group’s turnover of $33.7 million for the fourth financial quarter to 31 March 2017 (“4QFY2017”) increased by 3.5% over 4QFY2016’s $32.6 million as the retail division reported higher sales. However, gross profit for 4QFY2017 decreased to $2.8 million as compared to 4QFY2016’s $3.4 million due to higher operating expenses. Changes in fair value of short term investments relate to an unrealised fair value gain of $3.6 million in 4QFY2017 as compared to $0.2 million in 4QFY2016, of the Group’s portfolio of short term equity investments in REITs held by the property division. In the previous 4QFY2016, impairment of amount due from a joint venture of $9.5 million arose from an assessment of the carrying amount of shareholder loan due from a joint venture. General and administrative expenses decreased to $5.3 million in 4QFY2017 from $12.9 million in 4QFY2016 mainly due to the absence of unrealised exchange losses of $8.3 million incurred in the previous 4QFY2016. Share of results of associates increased to $20.1 million in 4QFY2017 from $8.0 million in 4QFY2016 mainly due to the Group’s $30.2 million share of a write back by Top Spring of its tax provisions on finalisation with the tax authorities. At the operating level, Top Spring reported lower recognition on handover, of sales of properties. Share of results of joint ventures decreased to $6.8 million in 4QFY2017 from $10.1 million in 4QFY2016 mainly because the previous 4QFY2016 included a negative goodwill of $2.3 million on acquisition of a joint venture as well as a fair value loss on investment properties of $0.3 million in 4QFY2017 as compared to a fair value gain of $0.9 million in 4QFY2016. As a result of the foregoing, profit before taxation increased to $32.5 million in 4QFY2017 from $1.2 million in 4QFY2016.

20
Segmental Results for 4th Quarter ended 31 March Business segment
2017Property Retail Group
$'000 $'000 $'000
Segment revenue 1,612 32,104 33,716
Segment results 238 1,085 1,323 Changes in fair value of short term investments 3,553 - 3,553 Fair value gain on investment properties 832 - 832 Interest on borrowings (177) - (177) Share of associates' results, net of tax 19,558 577 20,135 Share of joint ventures' results,
net of tax (Note) 6,823 - 6,823 Profit from operations before taxation 30,827 1,662 32,489 Taxation 1,851 Profit net of taxation 34,340
Attributable to:Owners of the Company 34,223 Non-controlling interests 117
34,340
Note:Share of joint ventures' results, net of tax
$'000Segment revenue 26,409
Segment results 9,650 Fair value loss on investment properties (302) Interest on borrowings (245) Profit from operations before taxation 9,103 Taxation (2,280) Profit net of taxation 6,823
21
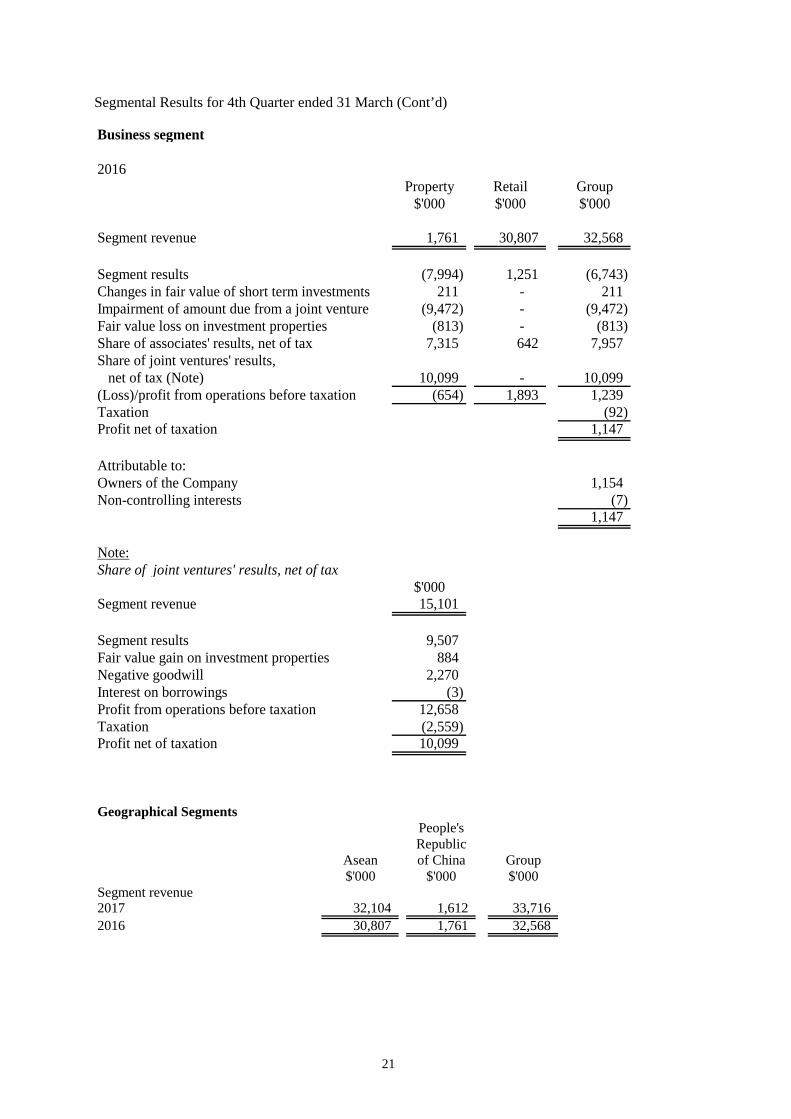
Segmental Results for 4th Quarter ended 31 March (Cont’d) Business segment
2016Property Retail Group
$'000 $'000 $'000
Segment revenue 1,761 30,807 32,568
Segment results (7,994) 1,251 (6,743) Changes in fair value of short term investments 211 - 211 Impairment of amount due from a joint venture (9,472) - (9,472) Fair value loss on investment properties (813) - (813) Share of associates' results, net of tax 7,315 642 7,957 Share of joint ventures' results, net of tax (Note) 10,099 - 10,099 (Loss)/profit from operations before taxation (654) 1,893 1,239 Taxation (92) Profit net of taxation 1,147
Attributable to:Owners of the Company 1,154 Non-controlling interests (7)
1,147
Note:Share of joint ventures' results, net of tax
$'000Segment revenue 15,101
Segment results 9,507 Fair value gain on investment properties 884 Negative goodwill 2,270 Interest on borrowings (3) Profit from operations before taxation 12,658 Taxation (2,559) Profit net of taxation 10,099
Geographical Segments
People'sRepublic
Asean of China Group$'000 $'000 $'000
Segment revenue2017 32,104 1,612 33,716 2016 30,807 1,761 32,568

22
Segmental Results - Property Division Turnover of the property division, comprising the 100% directly held GIE Tower, for 4QFY2017 decreased to $1.6 million from 4QFY2016’s $1.8 million due to a weakening of the Renminbi of 4.2%. Segment results of the property division, excluding associates and joint ventures, reported a gain of $0.2 million in 4QFY2017 against a loss of $8.0 million in 4QFY2016 mainly due to unrealised exchange differences on bank balances. Sales recognised by our associate, Top Spring, were 72% lower than in our previous 4QFY2016 due to the timing of completion and handover of properties. However, our share of Top Spring’s results rose as it wrote back tax provisions on finalisation with the tax authorities. Metro City, Shanghai, reported higher rental income with the completion of certain phases of asset enhancement. This softened the impact of a weakening Renminbi on results of Metro City, Shanghai, and Metro Tower, Shanghai. The average occupancy of the Group’s three investment properties held by a subsidiary and joint ventures as at 31 March 2017 was 91.5%. The portfolio summary of the Group’s Investment Properties as at 31 March 2017 was as follows: Percentage
Owned
Tenure No. of Tenants
Occupancy Rate (%)
Owned by a Subsidiary GIE Tower, Guangzhou
100% 50 year term from 1994
33 86.4%
Owned by Joint Ventures Metro City, Shanghai 60% 36 year term
from 1993 172 95.5%
Metro Tower, Shanghai 60% 50 year term
from 1993 30 92.7%
Segmental Results - Retail Division Turnover of the Singapore operations of the retail division for 4QFY2017 increased to $32.1 million from 4QFY2016’s $30.8 million as overall sales of the continuing department stores improved slightly. However, pressures on margins and operating and overhead costs affected profitability. The retail division’s associated company in Indonesia operated in a sector where negative growth prevailed, particularly in Jakarta.

23
8(b) Cash Flow, Working Capital, Assets and Liabilities of the group during the current financial period reported on Associates (Non-current assets) decreased from $423.5 million as at 31 December 2016 to $373.5 million as at 31 March 2017 mainly due to currency translation adjustments of foreign associates and capital distribution (net of capital contributions) from InfraRed NF China Real Estate Fund II (A), L.P. of $8.7 million, partially offset by share of associates’ results for 4QFY2017 of $20.1 million. Amounts due from associates (Non-current assets) increased from $112.7 million as at 31 December 2016 to $134.1 million as at 31 March 2017 mainly due to a dividend receivable of $28.7 million from an associate. This was partially offset by a $6.7 million repayment of shareholder loans from proceeds of the disposal of properties at Shama Century Park, Shanghai. Amounts due from joint ventures (Non-current assets) increased from $144.8 million as at 31 December 2016 to $178.9 million as at 31 March 2017 mainly due to the grant of a shareholder loan of $27.7 million to a joint venture and $6.4 million advanced to a United Kingdom joint venture during 4QFY2017. Investments (Non-current assets) increased to $94.9 million as at 31 March 2017 from $43.8 million as at 31 December 2016 with a $56.4 million investment in a private trust in Singapore, Mapletree Global Student Accommodation Private Trust. This was funded by Bank borrowings (Current liabilities) of $25.5 million as at 31 March 2017 and internal cash of $30.9 million. As a result, Bank borrowings (Current liabilities) increased from $34.6 million as at 31 December 2016 to $65.9 million as at 31 March 2017. Pledged fixed bank deposits rose accordingly. Consequently, Cash and cash equivalents fell from $368.5 million as at 31 December 2016 to $278.2 million as at 31 March 2017. There were no other material factors that affected the cash flow, working capital, assets and liabilities of the Group during the current financial quarter reported on.
9. Where a forecast, or a prospect statement, has been previously disclosed to shareholders, any variance between it and the actual results
There have been no material variances with forecast or prospect statements issued for the period being reported.
10. A commentary at the date of the announcement of the significant trends and competitive conditions of the industry in which the group operates and any known factors or events that may affect the group in the next reporting period and the next 12 months Rental income of the GIE Tower investment property of the property division is expected to remain steady. At the joint ventures’ level, rental income of Metro City, Shanghai and Metro Tower, Shanghai, is expected to remain stable with Metro City, Shanghai’s rental improving with the completion of asset enhancement work. Sales of the residential project, The Crest at Prince Charles Crescent in Singapore, remains slow with the take up rate at 34.5% as at 31 March 2017. With about two thirds of its property inventory completed and handed over including almost all its residential property inventory, the future contribution from our associate in Nanchang will be principally from the recognition of the presales of office and retail space. Gross margins of the office component are significantly below those previously achieved for Nanchang’s residential properties.

24
10. A commentary at the date of the announcement of the significant trends and competitive conditions of the industry in which the group operates and any known factors or events that may affect the group in the next reporting period and the next 12 months (Cont’d)
The Group’s portfolio of quoted equity investments will continue to be subject to fluctuations in their fair value due to volatile market conditions. The Group will continue to be subject to significant currency translation adjustments on foreign operations which will affect the results and other comprehensive income and the balance sheet, due to volatility in foreign currency exchange rates, as a major portion of its net assets which mainly represent investment properties and projects situated in the People’s Republic of China, are denominated in the Chinese Renminbi. A small proportion of the Group’s net assets are also denominated in British pounds. The retail division continues to operate in a challenging trading environment, coupled with high operating costs.
11. If a decision regarding dividend has been made:- (a) Whether an final ordinary dividend has been declared (recommended);
Yes (b) (i) Amount per share (cents)
Name of Dividend Tax exempt (one tier) Final Dividend Type Cash Dividend Amount per share (in cent) 2 cents per ordinary share
Name of Dividend Special Tax exempt (one-tier) Final Dividend Type Cash Dividend Amount per share (in cent) 3 cents per ordinary share
(ii) Previous corresponding period (cents)
Name of Dividend Tax exempt (one tier) Final Dividend Type Cash Dividend Amount per share (in cent) 2 cents per ordinary share
Name of Dividend Special Tax exempt (one-tier) Final Dividend Type Cash Dividend Amount per share (in cent) 5 cents per ordinary share
(c) Whether the dividend is before tax, net of tax or tax exempt. If before tax or net of tax, state the
tax rate and the country where the dividend is derived. If the dividend is not taxable in the hands of shareholders, this must be stated.
The proposed final dividend is a tax exempt dividend.
(d) The date the dividend is payable.
The dividend payment date will be announced later.

25
(e) The date on which Registrable Transfers received by the company (up to 5.00 pm) will be
registered before entitlements to the dividend are determined.
The notice of the closure of the Register of Members and Transfer Books of the Company for the purposes of determining the entitlement to the dividend will be announced later.
12. If no dividend has been declared (recommended), a statement to that effect Not applicable. 13. If the Group has obtained a general mandate from shareholders for IPTs, the aggregate value of such transactions as required under Rule 920(1)(a)(ii). If no IPT mandate has been obtained, a statement to that effect. The Company did not seek and does not have a shareholders’ general mandate pursuant to Rule 920 of the Listing Manual. 14. Confirmation that the issuer has procured undertakings from all its directors and executive officers (in the format set out in Appendix 7.7) under Rule 720(1) The Company hereby confirms that it has procured undertakings from all its directors and executive officers under Rule 720(1) of the Listing Manual.

26
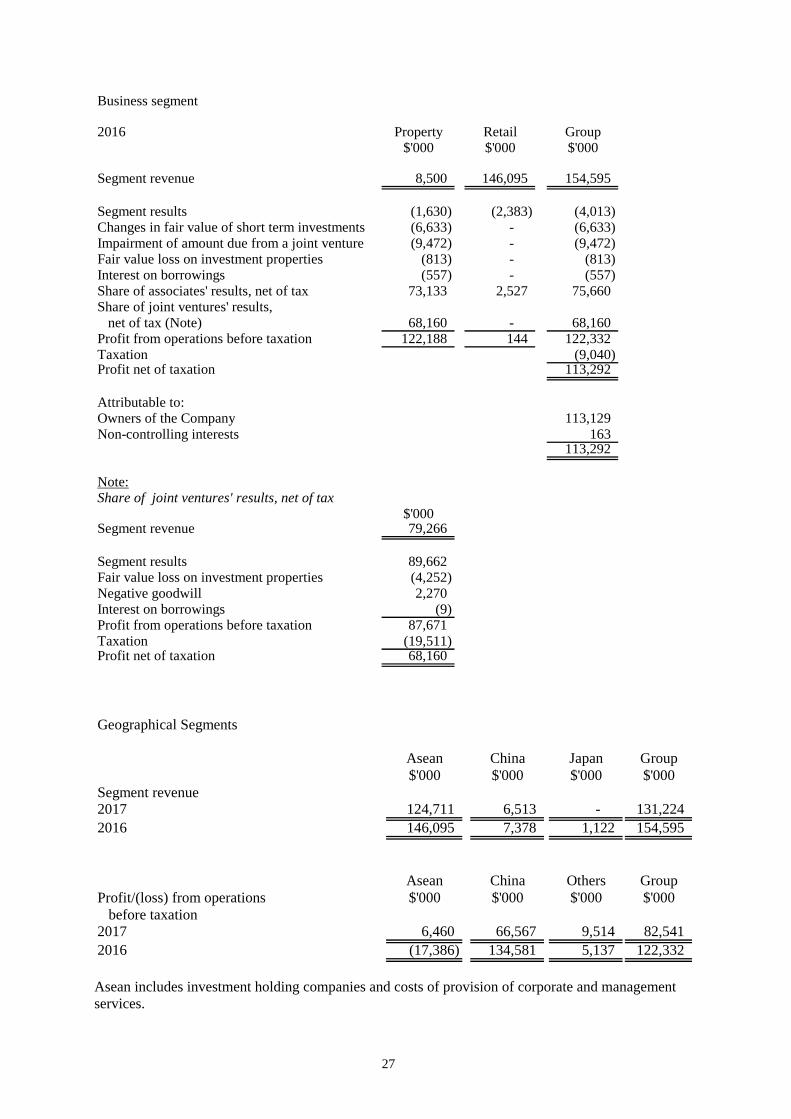
PART II – ADDITIONAL INFORMATION REQUIRED FOR FULL YEAR ANNOUNCEMENT 15. Segmental revenue and results for business or geographical segments (of the group) in the form presented in the issuer’s most recently audited annual financial statements, with comparative information for the immediately preceding year. Business segment
2017 Property Retail Group$'000 $'000 $'000
Segment revenue 6,513 124,711 131,224
Segment results 19,990 (2,022) 17,968 Changes in fair value of short term investments (771) - (771) Fair value gain on investment properties 832 - 832 Interest on borrowings (277) - (277) Share of associates' results, net of tax 39,192 3,322 42,514 Share of joint ventures' results, net of tax (Note) 22,275 - 22,275 Profit from operations before taxation 81,241 1,300 82,541 Taxation (1,522) Profit net of taxation 81,019
Attributable to:Owners of the Company 80,682 Non-controlling interests 337
81,019
Note:Share of joint ventures' results, net of tax
$'000Segment revenue 117,894
Segment results 36,508 Fair value loss on investment properties (6,611) Interest on borrowings (245) Profit from operations before taxation 29,652 Taxation (7,377) Profit net of taxation 22,275
27
Business segment
2016 Property Retail Group$'000 $'000 $'000
Segment revenue 8,500 146,095 154,595
Segment results (1,630) (2,383) (4,013) Changes in fair value of short term investments (6,633) - (6,633) Impairment of amount due from a joint venture (9,472) - (9,472) Fair value loss on investment properties (813) - (813) Interest on borrowings (557) - (557) Share of associates' results, net of tax 73,133 2,527 75,660 Share of joint ventures' results, net of tax (Note) 68,160 - 68,160 Profit from operations before taxation 122,188 144 122,332 Taxation (9,040) Profit net of taxation 113,292
Attributable to:Owners of the Company 113,129 Non-controlling interests 163
113,292
Note:Share of joint ventures' results, net of tax
$'000Segment revenue 79,266
Segment results 89,662 Fair value loss on investment properties (4,252) Negative goodwill 2,270 Interest on borrowings (9) Profit from operations before taxation 87,671 Taxation (19,511) Profit net of taxation 68,160
Geographical Segments
Asean China Japan Group$'000 $'000 $'000 $'000
Segment revenue2017 124,711 6,513 - 131,224 2016 146,095 7,378 1,122 154,595
Asean China Others GroupProfit/(loss) from operations $'000 $'000 $'000 $'000 before taxation2017 6,460 66,567 9,514 82,541 2016 (17,386) 134,581 5,137 122,332
Asean includes investment holding companies and costs of provision of corporate and management services.
28
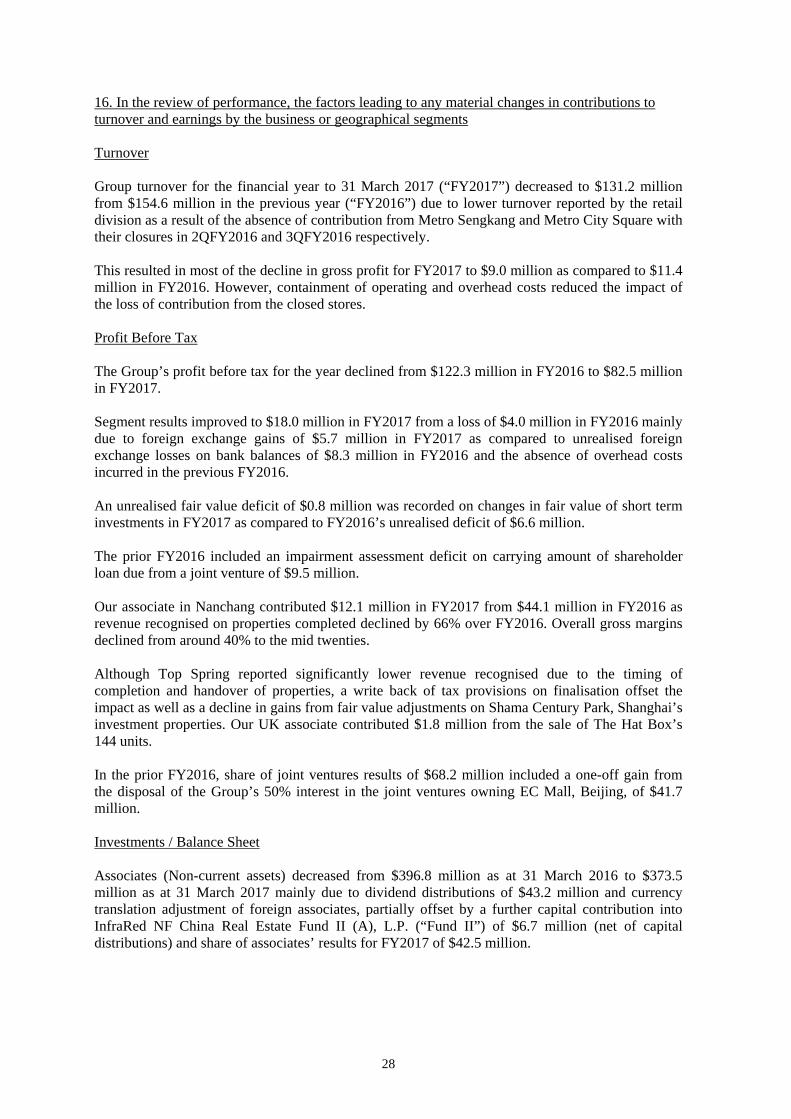
16. In the review of performance, the factors leading to any material changes in contributions to turnover and earnings by the business or geographical segments
Turnover Group turnover for the financial year to 31 March 2017 (“FY2017”) decreased to $131.2 million from $154.6 million in the previous year (“FY2016”) due to lower turnover reported by the retail division as a result of the absence of contribution from Metro Sengkang and Metro City Square with their closures in 2QFY2016 and 3QFY2016 respectively. This resulted in most of the decline in gross profit for FY2017 to $9.0 million as compared to $11.4 million in FY2016. However, containment of operating and overhead costs reduced the impact of the loss of contribution from the closed stores. Profit Before Tax The Group’s profit before tax for the year declined from $122.3 million in FY2016 to $82.5 million in FY2017. Segment results improved to $18.0 million in FY2017 from a loss of $4.0 million in FY2016 mainly due to foreign exchange gains of $5.7 million in FY2017 as compared to unrealised foreign exchange losses on bank balances of $8.3 million in FY2016 and the absence of overhead costs incurred in the previous FY2016. An unrealised fair value deficit of $0.8 million was recorded on changes in fair value of short term investments in FY2017 as compared to FY2016’s unrealised deficit of $6.6 million. The prior FY2016 included an impairment assessment deficit on carrying amount of shareholder loan due from a joint venture of $9.5 million. Our associate in Nanchang contributed $12.1 million in FY2017 from $44.1 million in FY2016 as revenue recognised on properties completed declined by 66% over FY2016. Overall gross margins declined from around 40% to the mid twenties. Although Top Spring reported significantly lower revenue recognised due to the timing of completion and handover of properties, a write back of tax provisions on finalisation offset the impact as well as a decline in gains from fair value adjustments on Shama Century Park, Shanghai’s investment properties. Our UK associate contributed $1.8 million from the sale of The Hat Box’s 144 units. In the prior FY2016, share of joint ventures results of $68.2 million included a one-off gain from the disposal of the Group’s 50% interest in the joint ventures owning EC Mall, Beijing, of $41.7 million. Investments / Balance Sheet Associates (Non-current assets) decreased from $396.8 million as at 31 March 2016 to $373.5 million as at 31 March 2017 mainly due to dividend distributions of $43.2 million and currency translation adjustment of foreign associates, partially offset by a further capital contribution into InfraRed NF China Real Estate Fund II (A), L.P. (“Fund II”) of $6.7 million (net of capital distributions) and share of associates’ results for FY2017 of $42.5 million.

29
16. In the review of performance, the factors leading to any material changes in contributions to turnover and earnings by the business or geographical segments (cont’d) Investments / Balance Sheet (cont’d) Amounts due from associates (Non-current assets) increased from $70.3 million as at 31 March 2016 to $134.1 million as at 31 March 2017 with the extension of a shareholders loan of $40.5 million to newly incorporated associate, South Bright Investment Limited (“South Bright”), as the Group’s share of funding for a mezzanine loan investment made by South Bright, advances of $27.9 million to a United Kingdom associate and a dividend receivable of $28.7 million. These were partially offset by a $32.4 million repayment of shareholder loans from proceeds of the disposal of properties in Shama Century Park, Shanghai. Joint Ventures (Non-current assets) decreased from $216.2 million as at 31 March 2016 to $203.8 million as at 31 March 2017, mainly due to dividend distributions of $27.8 million, partially offset by the Group’s share of joint ventures' results for FY2017 of $22.3 million. Amounts due from joint ventures (Non-current assets) increased to $178.9 million as at 31 March 2017 from $129.0 million as at 31 March 2016, mainly due to the grant of a shareholder loan of $28.3 million to a joint venture and $21.3 million advanced to a United Kingdom joint venture during the year. Investments (Non-current assets) increased to $94.9 million as at 31 March 2017 from $51.4 million as at 31 March 2016 with a $56.4 million investment in Mapletree Global Student Accommodation Private Trust (“MGSA”). This was partially offset by a decline in the fair value of available-for-sale investment, Shui On Land Ltd and distributions from an available-for-sale investment. Short term investments (Current assets) increased to $42.2 million as at 31 March 2017 from $33.9 million as at 31 March 2016 mainly due to an investment of $20.0 million. The Group’s portfolio of short term investments was reduced, through disposals, in order to lock in previously unrealised gains. Bank borrowings (Current liabilities) increased to $65.9 million as at 31 March 2017 due to loans drawn on banking facilities for the investment in MGSA private trust and amounts advanced to an associate and a joint venture in the United Kingdom. Pledged fixed bank deposits rose accordingly. As a result of the above redeployment of funds and after taking into account a dividend of $58.0 million paid to shareholders, Cash and cash equivalents declined from $493.6 million as at 31 March 2016 to $278.2 million as at 31 March 2017.

30
17. A breakdown of sales
18. A breakdown of the total annual dividend (in dollar value) for the issuer’s latest full year and its previous full year
Total Annual Dividend Year Ended 31-Mar-2017 31-Mar-2016 S$’000 S$’000 Ordinary final dividend 16,561 16,561 Special dividend (Final) 24,841 41,402 Total 41,402 57,963
19. Disclosure of person occupying a managerial position in the issuer or any of its principal subsidiaries who is a relative of a director or chief executive officer or substantial shareholder of the issuer pursuant to Rule 704 (13) in the format below. If there are no such persons, the issuer must make an appropriate negative statement.
Name
Age
Family relationship with any director and/or substantial shareholder
Current position and duties, and the year the position was held
Details of changes in duties and position held, if any, during the year
Mdm Ong Sioe Hong
67
Aunt of substantial shareholders, Ong Ling Ling, Ong Jenn, Ong Ching Ping and Ong Sek Hian (Wang ShiXian)
Managing Director of Metro (Pte) Ltd since March 1994 and appointed Executive Chairman in 2012. Responsible for overall corporate strategies of Metro (Pte) Ltd and its subsidiaries, the retail division of the Group.
N.A.
BY ORDER OF THE BOARD Tan Ching Chek and Lee Chin Yin Joint Company Secretaries Date 30 May 2017
31-Mar-2017 31-Mar-2016 %
Group Group Increase/$'000 $'000 (Decrease)
a) Sales reported for the first half year 60,208 81,021 (25.69)
b) Operating profit after tax beforededucting non-controlling interests reported for the first half year 26,189 56,196 (53.40)
c) Sales reported for the second half year 71,016 73,574 (3.48)
d) Operating profit after tax before 54,830 57,096 (3.97) deducting non-controlling interests reported for the second half year