Embed Size (px)
Citation preview
Decentralized Evaluation
Dec
entr
aliz
ed e
valu
atio
n fo
r ev
iden
ce-b
ased
dec
isio
n m
akin
g
Prepared by Sophia Dunn, Team Leader, The KonTerra Group Jean-Pierre Silvéréano-Vélis, Evaluator Sovith Sin, Evaluator Covadonga Canteli, Statistician Ferdous Jahan, Evaluator
Endline Evaluation of United States Department of Agriculture (USDA) McGovern-Dole Grant Food for Education (FFE) Programme for WFP Cambodia 2013-2016
Evaluation Report November 2017 Commissioned by WFP Cambodia Country Office Evaluation Manager: Martin Fisher (The KonTerra Group)
Acknowledgements This evaluation report was developed through wide consultation with programme partners and stakeholders of the USDA McGovern Dole Programme. The Evaluation Team would like to acknowledge the input from the WFP Cambodia Team, the WFP Bangkok Regional Bureau, the Royal Government of Cambodia including the Ministry of Education, Youth and Sport at national, provincial and district levels, other partner ministries, and other stakeholders for their contribution towards the evaluation. Special thanks to the World Food Programme in Cambodia for their time and contributions, especially the Education Unit and Kannitha Kong and Bun Thang. Our thanks are also due to Jonathan Rivers and Yav Long who served as focal points from inception through the fieldwork and reporting phases. The Evaluation Team also extends special thanks to the Head of WFP Sub-Office in Siem Reap, Um Nisith, and the WFP Field Office team for Battambang. Siem Reap and Kampong Thom. The KonTerra Evaluation Team would also like to thank Indochina Research Limited team especially Mike Coquilla, Chandara Gnim, Pisei Im and the enumeration team for their dedication to the survey. Special thanks are also due to Len Leng and Ravuth Chang for translation during the qualitative field mission. Finally, the team gratefully acknowledges the community participants in the evaluation process – households, teachers, cooks, parents and school children.
Disclaimer
The opinions expressed in this report are those of the Evaluation Team, and do not necessarily reflect those of the World Food Programme. Responsibility for the opinions expressed in this report rests solely with the authors. Publication of this document does not imply endorsement by WFP of the opinions expressed. The designation employed and the presentation of material in maps do no imply the expression of any opinion whatsoever on the part of WFP concerning the legal or constitutional status of any country, territory or sea area, or concerning the delimitation of frontiers.
Table of Contents
1 Introduction ............................................................................................... 1 1.1 Overview of the evaluation subject ........................................................ 2 1.2 Context ................................................................................................. 4 1.3 Evaluation methodology and limitations .............................................. 7
2 Evaluation Findings ................................................................................... 11 2.1 Evaluation Question 1: How appropriate is the programme? ............... 11
2.1.1 Appropriateness to needs ...................................................................................... 11 2.1.2 Alignment with national policies and strategies ................................................... 13 2.1.3 Alignment with WFP corporate strategies, policies & normative guidance ......... 14 2.1.4 Alignment with other development partners ........................................................ 16
2.2 Evaluation Question 2: What are the results of the programme? ........ 18 2.2.1 Results Framework 1: Improved literacy of school aged children ........................ 18 2.2.2 Overall achievement of Strategic Objective 1: Improved literacy of school-age children ............................................................................................................................ 30 2.2.3 Results Framework 2: Increased use of health and dietary practices ................. 32 2.2.4 Overall achievement of Strategic Objective 2: Increased use of health and dietary practices ............................................................................................................................ 37
2.3 Evaluation Question 3: How & why has the programme achieved its results? ....................................................................................................... 40
2.3.1 Internal factors ...................................................................................................... 40 2.3.2 External factors ..................................................................................................... 42
2.4 Evaluation Question 4: How sustainable is the programme? .............. 43
3 Conclusions and Recommendations ......................................................... 47 3.1 Overall Assessment/Conclusions ........................................................ 47 3.2 Recommendations .............................................................................. 49
4 Bibliography ............................................................................................. 52
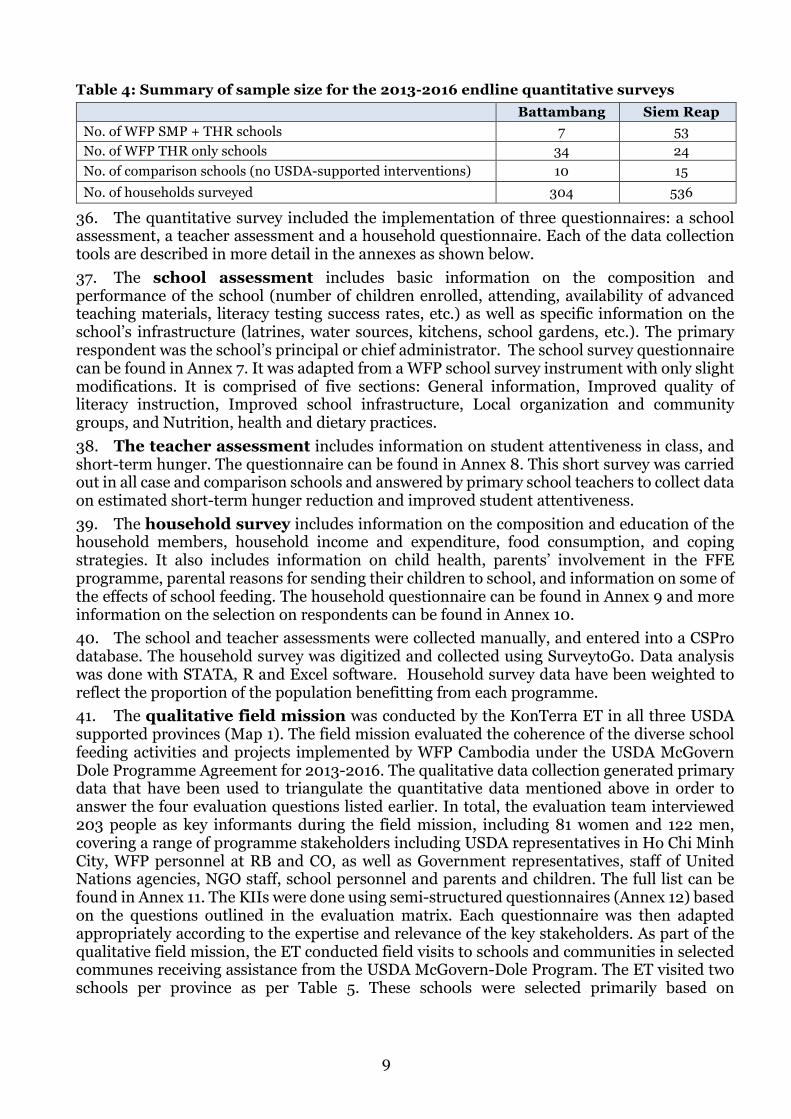
List of Tables
Table 1: Number of schools receiving each type of FFE intervention .................................................... 3Table 2: Number of schools receiving infrastructure support ............................................................... 3Table 3: Key events in Cambodia (2013-2016) ....................................................................................... 7Table 4: Summary of sample size for the 2013-2016 endline quantitative surveys ............................... 9Table 5: FFE sites visited during qualitative field mission ................................................................... 10Table 6: Summary of key results - Evaluation Question 1 ..................................................................... 17Table 7: Percentage of surveyed students consuming daily school meals ............................................ 19Table 8: Overall totals of direct and indirect beneficiaries reached (2013-2016) ............................... 20Table 9: School infrastructure by type of intervention ......................................................................... 20Table 10: School gardens by type of intervention .................................................................................. 21Table 11: Provision of THR .................................................................................................................... 22Table 12: Provision of separate latrines for girls and boys ................................................................... 22Table 13: Provision of separate latrines for girls and boys by type of intervention ............................. 22Table 14: Absence due to illness ............................................................................................................ 22Table 15: Benefits of primary education ............................................................................................... 23Table 16: Participation in PTAs ............................................................................................................. 23Table 17: Average annual total contributions received from parents .................................................. 23Table 18: Student enrolment ................................................................................................................. 24Table 19: Student enrolment by intervention type ............................................................................... 24Table 20: Student attendance ............................................................................................................... 24Table 21: Teacher attendance rate ........................................................................................................ 26Table 22: Teacher attendance rate according to type of food support provided ................................. 26Table 23: Provision of school supplies and materials .......................................................................... 26Table 24: Provision of learning package at endline by type of intervention ........................................ 27Table 25: Literacy materials and curriculum supply and utilization ................................................... 27Table 26: Teacher training .................................................................................................................... 27Table 27: School administrators’ training ............................................................................................ 28Table 28: Hunger and attentiveness of students .................................................................................. 28Table 29: Hunger and attentiveness of students, by intervention type ............................................... 29Table 30: Operational procedures and tools for school feeding .......................................................... 29Table 31: Improved policy and regulatory framework for school feeding ........................................... 30Table 32: Presence of a national school feeding unit ........................................................................... 30Table 33: Engagement of local and community groups in school feeding ........................................... 30Table 34: Results of Grade 6 reading comprehension ........................................................................... 31Table 35: Grade 6 reading comprehension results by FFE intervention ............................................. 32Table 36: Planned vs. actual beneficiaries – Strategic Objective 2 ...................................................... 33Table 37: Students’ and parents’ knowledge of health/hygiene practices ........................................... 33Table 38: Cooks’ and storekeepers’ knowledge on safe food preparation and storage ....................... 34Table 39: Knowledge on good nutrition and dietary practices ............................................................ 35Table 40: Improvement of school water and sanitation facilities ........................................................ 35Table 41: Increased access to preventive health interventions ............................................................ 35Table 42: Provision of micronutrient fortified commodities ............................................................... 36Table 43: Schools with improved food preparation and storage equipment ....................................... 36Table 44: Results indicator - Improvement of Government capacity on health, hygiene and nutrition
........................................................................................................................................................ 37Table 45: RF2 outcome indicators - USDA supported schools ........................................................... 37Table 46: Consumption coping strategies (percentage of households reporting using each strategy at
least once a week) ........................................................................................................................... 39Table 47: Adequacy of household diets ................................................................................................. 39Table 48: Household food consumption ............................................................................................... 39Table 49: National Capacity Index (NCI) ............................................................................................. 44

List of Figures
Figure 1: Cambodia’s net primary school enrolment rate (2013-2016) ...................................................... 11 Figure 2: Commodities provided by USDA ..................................................................................................... 19 Figure 3: Number of students benefiting from school meals and take-home rations ............................ 20 Figure 4: Drop-out rates Grades 1-6, total (2013-2016) ............................................................................... 25 Figure 5: Primary school drop-out rates, by gender (2015-2016) .............................................................. 25
List of Acronyms
ASEAN Association of Southeast Asian Nations BMI Body Mass Index BTB Battambang Province CARD Council for Agriculture and Rural Development CO Country Office (WFP) CP Country Programme CPAP Country Programme Action Plan DAC Development Assistance Committee (OECD) D&D Decentralization and deconcentration DEQAS Decentralised Evaluation Quality Assurance System (WFP) DSFC District School Feeding Committee EMIS Education Management and Information System (MoEYS) EQAD Education Quality Assurance Department (MoEYS) ESP Education Strategic Plan ESWG Education Sector Working Group ET Evaluation Team FAO (United Nations) Food and Agriculture Organization FIRD Foundation for Integration of Rural Development FFE Food for Education FGD Focus Group Discussion FY Financial Year g gram(s) GDP Gross Domestic Product GII Gender Inequity Index HDI Human Development Index HGSF Home-grown school feeding HH Household HQ (WFP) Headquarters IDS Institute for Development Studies IRL Indochina Research Limited KAPE Kampuchean Action for Primary Education KII Key Informant Interview KTM Kampong Thom Province LMIC Lower-Middle Income Country LSFC Local School Feeding Committee MAFF Ministry of Agriculture, Forestry and Fisheries MDG Millennium Development Goals MERVAM Monitoring Evaluation Reporting Vulnerability Analysis and Mapping MoEYS Ministry of Education, Youth and Sport MoH Ministry of Health MoI Ministry of Interior MRD Ministry of Rural Development mt metric tonne MTE mid-term evaluation NCI National Capacity Index NGO Non-Governmental Organization NLC National Literacy Curriculum NSDP National Strategic Development Plan NSFSN National Strategy for Food Security and Nutrition OECD Organisation for Economic Cooperation and Development OEV Office of Evaluation (WFP) PCC Project Coordination Committee PDAFF Provincial Department of Agriculture, Forestry and Fisheries
PED Primary Education Department (MoEYS) POE Provincial Office of Education (MoEYS) PMP Performance Monitoring Plan PRISM Platforms for Real-time Information SysteMs PSFC Provincial School Feeding Committee PSM Propensity Score Matching PTA Parents and Teachers Association RBB Regional Bureau in Bangkok (WFP) RF Results Framework RS Rectangular Strategy SABER Systems Approach for Better Education Results SAPF Social Assistance Policy Framework SDG Sustainable Development Goals SFTF School Feeding Taskforce SMP School Meal Programme SO Strategic Objective SRF Strategic Results Framework SRP Siem Reap Province SSC School Support Committee SY School year THR Take Home Ration ToR Terms of Reference UN United Nations UNDAF United Nations Development Assistance Framework UNDP United Nations Development Programme UNEG United Nations Evaluation Group UNESCO United Nations Educational, Scientific and Cultural Organization UNICEF United Nations Children’s Fund USAID United States Agency for International Development US$ United States dollar USDA United States Department of Agriculture WASH Water, sanitation and hygiene WFP (United Nations) World Food Programme WHO (United Nations) World Health Organization YSP Yellow split peas
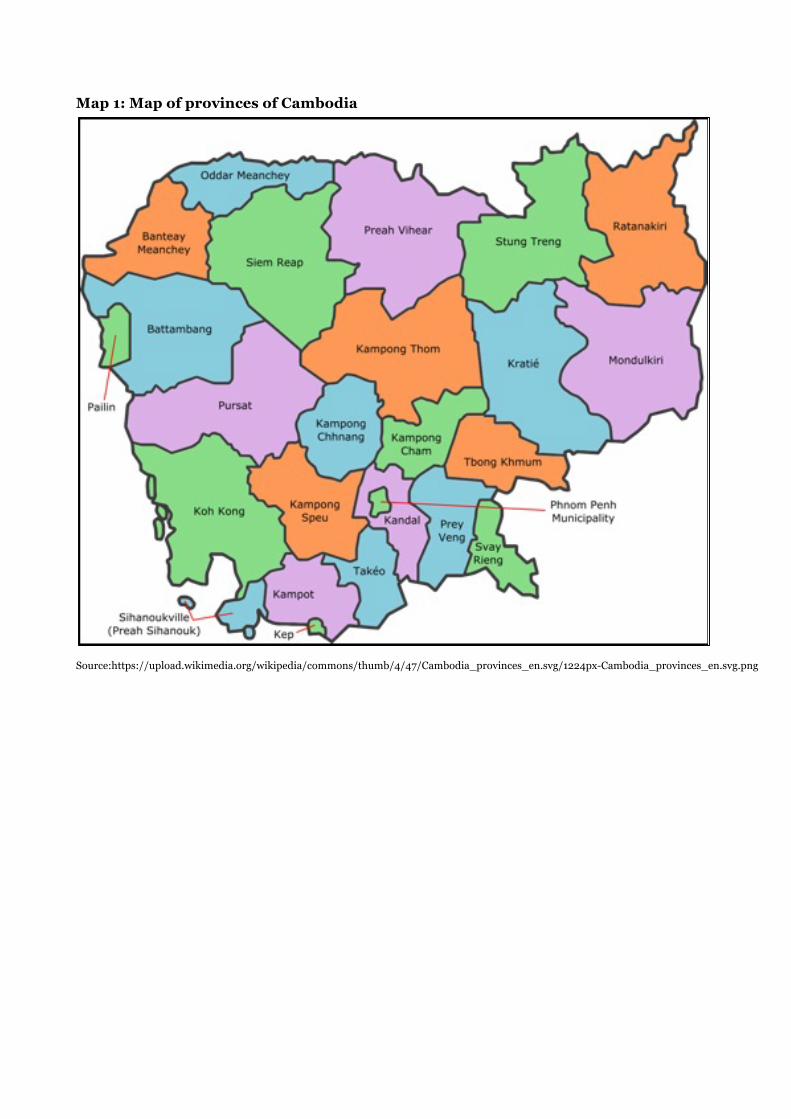
Map 1: Map of provinces of Cambodia
Source:https://upload.wikimedia.org/wikipedia/commons/thumb/4/47/Cambodia_provinces_en.svg/1224px-Cambodia_provinces_en.svg.png
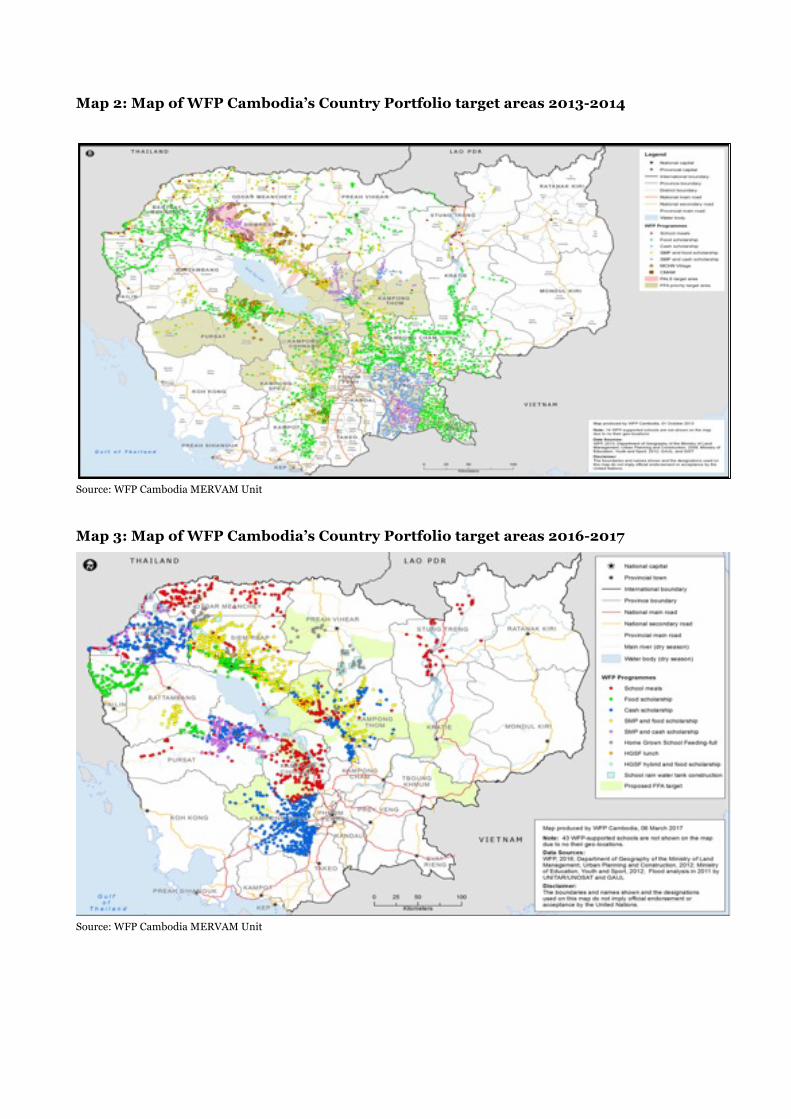
Map 2: Map of WFP Cambodia’s Country Portfolio target areas 2013-2014
Source: WFP Cambodia MERVAM Unit
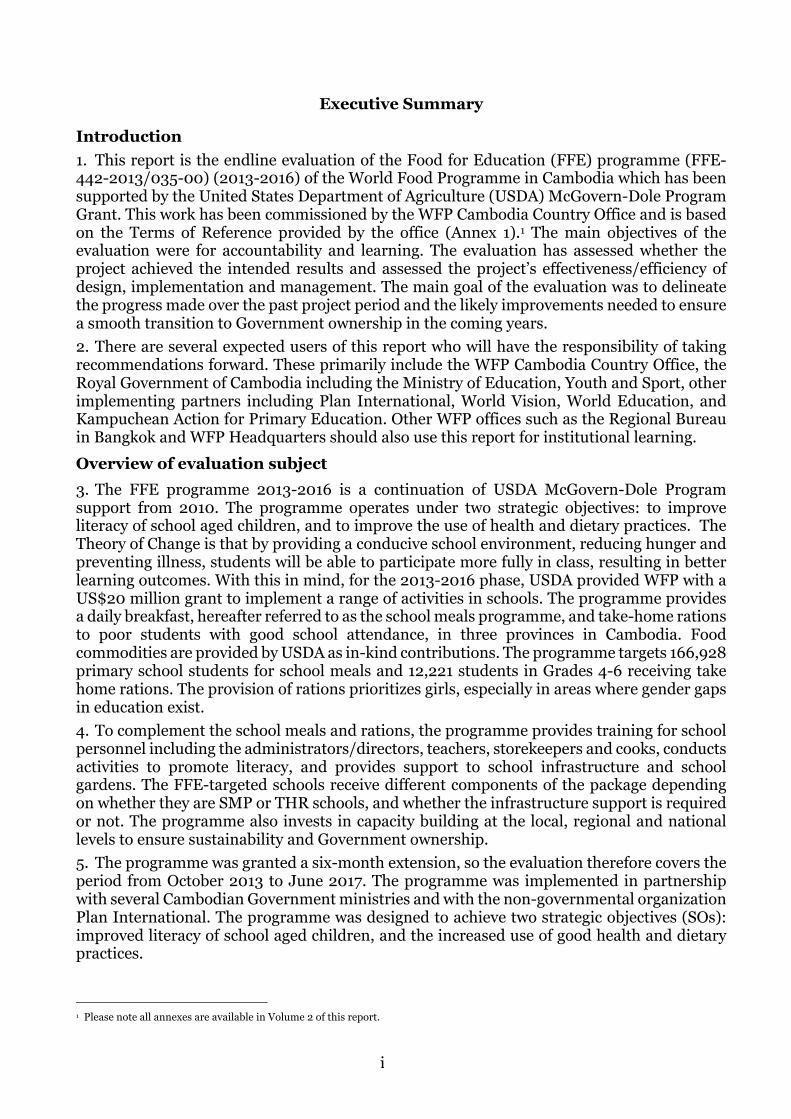
Map 3: Map of WFP Cambodia’s Country Portfolio target areas 2016-2017
Source: WFP Cambodia MERVAM Unit
i
Executive Summary Introduction 1. This report is the endline evaluation of the Food for Education (FFE) programme (FFE-442-2013/035-00) (2013-2016) of the World Food Programme in Cambodia which has been supported by the United States Department of Agriculture (USDA) McGovern-Dole Program Grant. This work has been commissioned by the WFP Cambodia Country Office and is based on the Terms of Reference provided by the office (Annex 1).1 The main objectives of the evaluation were for accountability and learning. The evaluation has assessed whether the project achieved the intended results and assessed the project’s effectiveness/efficiency of design, implementation and management. The main goal of the evaluation was to delineate the progress made over the past project period and the likely improvements needed to ensure a smooth transition to Government ownership in the coming years. 2. There are several expected users of this report who will have the responsibility of taking recommendations forward. These primarily include the WFP Cambodia Country Office, the Royal Government of Cambodia including the Ministry of Education, Youth and Sport, other implementing partners including Plan International, World Vision, World Education, and Kampuchean Action for Primary Education. Other WFP offices such as the Regional Bureau in Bangkok and WFP Headquarters should also use this report for institutional learning. Overview of evaluation subject 3. The FFE programme 2013-2016 is a continuation of USDA McGovern-Dole Program support from 2010. The programme operates under two strategic objectives: to improve literacy of school aged children, and to improve the use of health and dietary practices. The Theory of Change is that by providing a conducive school environment, reducing hunger and preventing illness, students will be able to participate more fully in class, resulting in better learning outcomes. With this in mind, for the 2013-2016 phase, USDA provided WFP with a US$20 million grant to implement a range of activities in schools. The programme provides a daily breakfast, hereafter referred to as the school meals programme, and take-home rations to poor students with good school attendance, in three provinces in Cambodia. Food commodities are provided by USDA as in-kind contributions. The programme targets 166,928 primary school students for school meals and 12,221 students in Grades 4-6 receiving take home rations. The provision of rations prioritizes girls, especially in areas where gender gaps in education exist. 4. To complement the school meals and rations, the programme provides training for school personnel including the administrators/directors, teachers, storekeepers and cooks, conducts activities to promote literacy, and provides support to school infrastructure and school gardens. The FFE-targeted schools receive different components of the package depending on whether they are SMP or THR schools, and whether the infrastructure support is required or not. The programme also invests in capacity building at the local, regional and national levels to ensure sustainability and Government ownership. 5. The programme was granted a six-month extension, so the evaluation therefore covers the period from October 2013 to June 2017. The programme was implemented in partnership with several Cambodian Government ministries and with the non-governmental organization Plan International. The programme was designed to achieve two strategic objectives (SOs): improved literacy of school aged children, and the increased use of good health and dietary practices.
1 Please note all annexes are available in Volume 2 of this report.
ii
Methodology 6. The evaluation took place between June and December 2017. The evaluation followed a quasi-experimental approach employing a case-control methodology as per the 2014 baseline methodology. However, the baseline ‘comparison group’ was later found to include schools with some interventions by other agencies, meaning that the group was neither representative nor clean. Nevertheless, the same comparison group was utilized again for the midline, and now the endline survey. 7. The evaluation used mixed data collection methods, including quantitative and qualitative survey techniques, and triangulated information from different methods and sources to enhance the reliability of findings. Participatory methods, including focus group discussions and key informant interviews were used where relevant to highlight lessons learned. The evaluation included three main components of work: • A secondary document review • A quantitative survey to enable comparison of results against the 2014 baseline and the
2015 midline surveys (August/September 2017) • Qualitative field work to obtain input from key stakeholders (September/October 2017).
8. The qualitative data collection generated primary data that have been used to triangulate the quantitative survey data. In total, the quantitative survey covered a sample of 118 of the total 861 USDA supported schools, as well as 25 comparison schools. The evaluation team also interviewed 203 people as key informants during the field mission, including 81 women and 121 men, covering a range of programme stakeholders including USDA representatives in Ho Chi Minh City, WFP personnel at WFP’s Regional Bureau in Bangkok and the country office, as well as Government representatives, staff of United Nations agencies, partners’ staff, school personnel and parents and children. Key findings 9. The key findings of the evaluation team are summarized below, structured according to the main evaluation questions. Evaluation question 1: How appropriate is the programme? 10. The objectives of the FFE programme broadly align with Government policies and strategies. Provision of school feeding also aligns with WFP’s own corporate guidance, but there is a misalignment between the food security and nutrition objectives of WFP’s other school feeding activities and the USDA’s literacy objective of the FFE programme. Similarly, there is a growing disconnect in the modality of the FFE programme, with in-kind support not being the preferred model of the Government. To resolve this difference, WFP is currently piloting other school feeding models that utilize local commodities. The school feeding activities and the complementary activities within the FFE programme also align well with the work of other development actors. Overall, this evaluation found the FFE programme to be appropriate to the education, food security and gender contexts, and coherent to the policy framework of the Government, as well as to WFP corporate guidance. Evaluation question 2: What are the results of the programme? 11. The evaluation finds that the FFE activities have been well implemented and most of the output targets have been achieved. WFP has effectively contributed to Cambodia’s policy direction by supporting the development of Government policies, strategies and guidelines particularly related to school feeding and school health. The Roadmap2 indicates that a policy,
2 Ministry of Education, Youth and Sports and WFP School Feeding Roadmap. Signed 28 April 2015
iii
dedicated implementation/coordination institution and budget allocation will be formalized in the period 2017-2020. 12. The evaluation found that both USDA McGovern-Dole Program’s Strategic Objectives have been met. Activities implemented under Strategic Objective 1 have resulted in most students in all surveyed schools performing well in the Grade 6 reading comprehension test, and performing better than the national average in literacy. Under Strategic Objective 2, more school meals and take-home rations schools were storing food off the ground (57 percent), having year-round access to clean water (72 percent) and providing soap handwashing facilities (96 percent). 13. USDA support has enabled WFP to reach over 400,000 beneficiaries (129 percent of overall plan) including school children who have benefited from school meals or take-home rations, and cooks, storekeepers, parents, teachers and school administrators having benefitted from training. The school meals have been effective at improving children’s attentiveness in morning classes, and household interviews indicate that the presence of the school meal has acted as an important social safety net for poor households who might otherwise be unable to provide breakfast for their children. The evaluation finds that the training activities have been effective in enabling school personnel to implement and manage the programme more effectively. Community awareness campaigns have also been effective, with most parents (80 percent) now able to name at least three benefits of education. 14. School infrastructure has improved, with those schools implementing school meals and take-home rations having considerably better infrastructure than the take-home ration and comparison schools. Most school meals and take-home rations schools now have dedicated kitchens (93 percent), food storerooms (75 percent), school gardens (87 percent), and functioning latrines (100 percent). Almost half of these schools (45 percent) also use energy efficient stoves, while none were found in the take-home ration only or comparison schools. In addition, 80 percent of the school meals and take-home rations schools had separate latrines for boys and girls. This is similar to the comparison schools, but considerably higher than in take-home ration only schools (67 percent). Evaluation question 3: How and why has the programme achieved its results? 15. Most programme stakeholders have had partnerships with WFP over an extended period, well beyond this period of FFE implementation. Overall, stakeholders recognized WFP Cambodia as a well-managed, strong, innovative and flexible office and reported that programme implementation has been well managed. WFP has rolled out a phone-based standardized feedback mechanism this period that has been successful at identifying problems with programme implementation, each of which has been appropriately addressed. 16. Plan International’s implementation and monitoring of the programme has been strong, and the local school communities have made significant inputs into the programme including providing cooks, firewood, water and vegetables to the schools so that school meals can be regularly provided. Evaluation question 4: How sustainable is the programme? 17. The current FFE modality of providing imported food commodities is not a sustainable model as the Government prefers cash-based assistance and/or models that support local farmers. Through WFP’s support, the Government is currently piloting different modalities to determine which are most effective and which ones the Government has the capacity and resourcing to implement. Furthermore, the evaluation rates the current capacity of the
iv
MoEYS at Stage 1 of the transition stages according to the SABER approach.3 Given that there is still some discussion on the modalities of a nationally-owned school feeding programme, and the capacity of the Government to manage it, the evaluation finds the timeline outlined in the Roadmap for transitioning to national ownership to be too ambitious. Overall conclusions 18. The evaluation finds the FFE programme to be relevant to the Cambodian context, and efficiently implemented. The FFE programme has enabled WFP to implement multiple capacity building activities and provide support to the Ministry of Education, Youth and Sports, including funding research into other school feeding modalities. The evaluation found that the WFP system of delivering food to schools was efficient. WFP provided high quality food commodities with no complaints, and minimal loss of food during transportation. 19. The programme has contributed to gender equality and improving the school environment. The construction and rehabilitation of separate latrines for girls and boys has contributed to a more conducive school environment, and is likely to result in more regular attendance for girls, although there is no monitoring data available on this. The take-home rations have been provided to both boys or girls based on poverty criteria, with girls being prioritized in locations with gender inequality in schooling. Over half the take-home ration beneficiaries were girls (56 percent), although data indicates higher drop-out rates in boys. 20. Overall, the evaluation found that school meals and take-home rations schools have received more support, and therefore performed better on multiple programme indicators. USDA support has resulted in a parallel system of assistance to schools in the three targeted provinces. Schools supported by USDA have received multiple interventions over a long period of time, while other schools are behind. It will therefore be of key importance for WFP and the Ministry of Education, Youth and Sports to take note of the activities that have been particularly effective, and scale up these activities. This should include literacy related activities, training for parents and community sensitization, infrastructure development and the provision of a school meal. Recommendations 21. As part of the process of developing the USDA grant proposal for 2017-2019, WFP’s Country Office management has already taken decisions about the new USDA-supported programme. This includes establishing new partnerships (World Education and Kampuchean Action for Primary Education) to strengthen the implementation of the literacy component, removing yellow split peas from the school meals, and supporting the MoEYS to undertake research on Government-preferred school feeding models. The evaluation team believes that the current implementation approach is appropriately moving forward so the team has prioritized recommendations related to the transition to a nationally-owned school feeding programme. The recommendations are listed in priority order. Immediate priority – to be initiated or completed within six months Recommendation 1: Continue implementation of the USDA McGovern Dole Program as per the current agreement (2016). Recommendation 2: In recognition that ongoing Ministry of Education, Youth and Sports research findings are imminent on the cost effectiveness of the cash scholarship model, and the Government’s capacity to implement a home-grown school feeding model of school 3 The SABER approach (School Feeding) is a Government-led process that helps to build effective school feeding policies and systems. The approach was developed by the World Bank in 2013, and outlines five quality standards that should provide the foundation for strong nationally-led and sustainable school feeding programme: strong policy frameworks, strong institutional structure and coordination, stable funding and budgeting, sound programme design and implementation, including evaluation, and strong community participation and ownership.
v
feeding, the evaluation team recommends that WFP and the Government counterparts review the research findings as priority. This review should result in decisions that will guide the short/medium term development of a national school feeding approach. Recommendation 3: Based on the research findings and decisions made above, the Roadmap should be reviewed. This should focus on identifying the priority actions required to coordinate and oversee implementation of a nationally owned school feeding programme (including budget). Recommendation 4: Recognizing that most WFP personnel have skills in programme implementation but not in governance and capacity building per se, the evaluation recommends steps be taken to strengthen the capacity of the WFP Country Office in this regard. Medium priority – to be implemented by the end of the 2017-2019 phase Recommendation 5: The Government planning and budgeting processes for 2018 have already been finalized, so no additional Government contributions to school feeding are likely to be made before 2019. The evaluation team therefore recommends that for the next phase of planning the WFP Country Office works closely with Government counterparts at central and local levels to ensure that school feeding is appropriately reflected the next Government budget cycle. Recommendation 6: The WFP Country Office and implementing partners should aim to have a minimum package of infrastructure facilities including kitchens, energy efficient stoves, store rooms, handwashing facilities and separate latrines for girls and boys in all USDA supported schools with the school meals programme. This should help ensure that schools would be able to function efficiently under a national school feeding programme. Recommendation 7: The ET recommends that the WFP Country Office considers opportunities to undertake additional pieces of research: • Effectiveness of USDA support: The evaluation team recommends that the
Regional Bureau, with support from Country Offices and Headquarters as appropriate, undertakes a meta-analysis of the successes and weaknesses of the USDA McGovern-Dole Program approach to school feeding.
• Increasing micronutrient content of the school meal: the evaluation team recommends that WFP Country Office conducts research on alternative, cost-effective strategies to provide a nutrient rich school meal. These strategies can then be considered by the Government in addition to the ongoing work to promote local fortification in Cambodia.
1
1 Introduction
1. This report is the endline evaluation of the Food for Education (FFE) programme (FFE-442-2013/035-00) (2013-2016) of the World Food Programme (WFP) in Cambodia which has been supported by the United States Department of Agriculture (USDA) McGovern-Dole Grant. This work has been commissioned by the WFP Cambodia Country Office (CO) and is based on the Terms of Reference (ToR) provided by the CO (Annex 1).4 The evaluation took place between June and December 2017. The main objectives of the evaluation were: • Accountability: The evaluation was to assess and report on the performance and results
of all USDA McGovern-Dole funded activities as per the Performance Monitoring Plan (PMP).
• Learning: The evaluation was to determine the reasons why certain results occurred or not, to draw lessons, derive good practices and pointers for learning. It was expected to provide evidence-based findings to inform operational and strategic decision-making. WFP will be responsible for actively disseminating the evaluation findings and to ensure that lessons are incorporated into relevant lesson sharing systems.
2. The evaluation assessed whether the project achieved the results outlined in the results framework as well as assessing the projects’ effectiveness/efficiency of design, implementation and management. The main goal of the evaluation is to delineate the progress made over the past project period and the likely improvements needed in the coming project period to ensure a smooth transition to Government ownership in the coming years. The evaluation was designed to answer four questions: • How appropriate was the programme? • What are the results of the programme? • How and why has the programme achieved its results? • How sustainable is the programme?
3. There are several expected users of this evaluation report including the following: • WFP Cambodia CO and its main implementing partner, the Ministry of Education, Youth
and Sport (MoEYS), notably with respect to decision-making related to programme implementation and/or design, country strategy and partnerships. The Royal Government of Cambodia is expected to take over the management and monitoring of the school feeding programme by 2021, therefore information on whether the programme is yielding the desired results is of primary importance.
• Ministry of Health (MoH), Ministry of Agriculture, Forestry and Fisheries (MAFF), and the Council for Agriculture and Rural Development (CARD) (as appropriate).
• Implementing partners past and present, including Plan International (PLAN), World Education, Kampuchean Action for Primary Education (KAPE) and World Vision as well as others involved in programme design, including school committees. Findings will also be shared with education development partners, including USAID and other key education, nutrition and health stakeholders.
• USDA will use the evaluation findings to inform project strategy, results frameworks and critical assumptions.
• WFP’s Regional Bureau in Bangkok is (RBB) expected to use the evaluation findings to provide strategic guidance, programme support, oversight, and to extract lessons for sharing across the region.
• WFP Headquarters (HQ) may use evaluations for wider organizational learning and accountability.
4 Please note all annexes are available in Volume 2 of this report.
2
• WFP’s Office of Evaluation (OEV) may use the evaluation findings, as appropriate, to feed into evaluation syntheses.
4. Other WFP Regional Bureaux and COs under their oversight may also benefit from the findings, which can contribute to corporate learning on implementation of capacity development interventions. There are currently multiple USDA FFE evaluations taking place in the Asia region, so this evaluation will also contribute to regional WFP learning, and allow for a meta-analysis of results across programmes. 1.1 Overview of the evaluation subject 5. The FFE programme 2013-2016 is a continuation of USDA McGovern-Dole Program support from 2010. The programme operates under two strategic objectives: to improve literacy of school aged children, and to improve the use of health and dietary practices. The Theory of Change is that by providing a conducive school environment, reducing hunger and preventing illness, students will be able to participate more fully in class, resulting in better learning outcomes. For the 2013-2016 phase, USDA has provided WFP with a US$20 million grant to implement a range of activities in schools. The programme provides a daily breakfast, forthwith referred to as the school meal programme (SMP) and take-home rations (THR) to poor students with good school attendance in three provinces in Cambodia: Battambang (BTB), Siem Reap (SRP) and Kampong Thom (KTM). Food commodities are provided by USDA as in-kind contributions for use in the programme as follows: • School meal (per child/meal/day): 115g (grams) rice, 5g Vitamin A-fortified oil, 3g iodized
salt, 20g canned fish and 10g yellow split peas for children in pre-school and Grades 1-6. • THR (per child): 10kg rice per month to children in Grades 4-6.
6. The programme targeted 204,536 primary school students for SMP (100,223 girls; 104,313 boys) and 20,375 students in Grades 4-6 receiving THR (11,209 girls; 9,166 boys). The provision of THR prioritizes girls, especially in areas where gender gaps in education exist. 7. To complement the SMP and THR, the programme provides training for school personnel including the administrator/director, teachers, storekeepers and cooks, conducts activities to promote literacy, and provides support to school infrastructure and school gardens. The FFE targeted schools receive different components of the package depending on whether they are SMP or THR schools, and whether the infrastructure support is required or not. The programme also invests in capacity building at the local, regional and national levels to ensure sustainability and Government ownership. Overall, the agreement between USDA and WFP indicates 18 project activities, more details of which can be found in Annex 2. 8. The original agreement for this USDA McGovern-Dole Program was for implementation over a three-year period, covering three United States financial years - 2013/14, 2014/15 and 2015/16. The programme was granted a six-month extension, so the evaluation therefore covers the period from October 2013 to June 2017. The programme is implemented in partnership with several Government ministries and with PLAN. Aside from the extension, there has been no change to the programme design since the original agreement was signed. 9. The key Government partner is the MoEYS which is responsible for the implementation of the programme in the schools. Within the MoEYS, WFP works closely with several departments including the Primary Education Department/Scholarship Office (which supports the implementation and monitoring of the programme), the School Health Department, and the Policy Department. Other ministries involved include the MoH, MAFF, the Ministry of Interior (MoI) and CARD. 10. Several other United Nations agencies also provide support to the FFE programme. These include:
3
• UNICEF - Currently the Head of Education Sector Working Group • UNESCO - The previous head of Education Sector Working Group and support to Teacher
Development Plans • FAO - Provision of technical support, particularly to the school gardens • World Bank - Involved in handover to government of the THR component • WHO – Technical support to health and nutrition components.
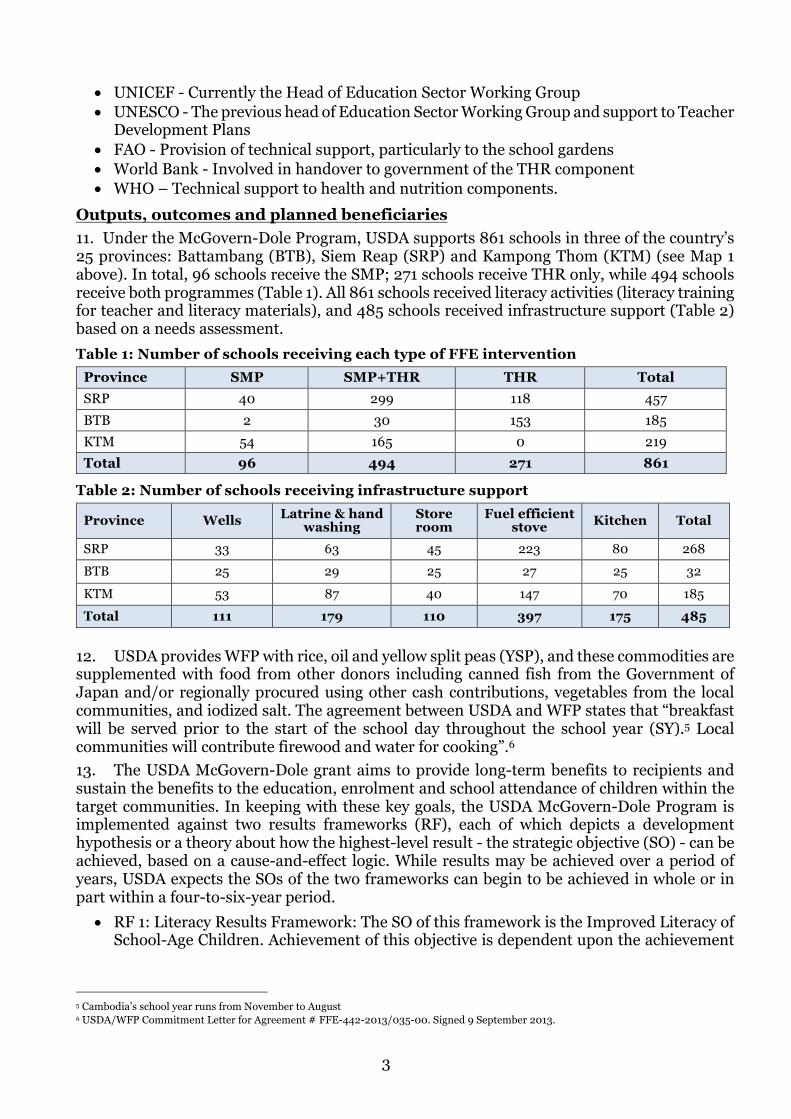
Outputs, outcomes and planned beneficiaries 11. Under the McGovern-Dole Program, USDA supports 861 schools in three of the country’s 25 provinces: Battambang (BTB), Siem Reap (SRP) and Kampong Thom (KTM) (see Map 1 above). In total, 96 schools receive the SMP; 271 schools receive THR only, while 494 schools receive both programmes (Table 1). All 861 schools received literacy activities (literacy training for teacher and literacy materials), and 485 schools received infrastructure support (Table 2) based on a needs assessment. Table 1: Number of schools receiving each type of FFE intervention
Province SMP SMP+THR THR Total SRP 40 299 118 457 BTB 2 30 153 185 KTM 54 165 0 219 Total 96 494 271 861
Table 2: Number of schools receiving infrastructure support
Province Wells Latrine & hand washing
Store room
Fuel efficient stove Kitchen Total
SRP 33 63 45 223 80 268 BTB 25 29 25 27 25 32
KTM 53 87 40 147 70 185 Total 111 179 110 397 175 485
12. USDA provides WFP with rice, oil and yellow split peas (YSP), and these commodities are supplemented with food from other donors including canned fish from the Government of Japan and/or regionally procured using other cash contributions, vegetables from the local communities, and iodized salt. The agreement between USDA and WFP states that “breakfast will be served prior to the start of the school day throughout the school year (SY).5 Local communities will contribute firewood and water for cooking”.6 13. The USDA McGovern-Dole grant aims to provide long-term benefits to recipients and sustain the benefits to the education, enrolment and school attendance of children within the target communities. In keeping with these key goals, the USDA McGovern-Dole Program is implemented against two results frameworks (RF), each of which depicts a development hypothesis or a theory about how the highest-level result - the strategic objective (SO) - can be achieved, based on a cause-and-effect logic. While results may be achieved over a period of years, USDA expects the SOs of the two frameworks can begin to be achieved in whole or in part within a four-to-six-year period. • RF 1: Literacy Results Framework: The SO of this framework is the Improved Literacy of
School-Age Children. Achievement of this objective is dependent upon the achievement
5 Cambodia’s school year runs from November to August 6 USDA/WFP Commitment Letter for Agreement # FFE-442-2013/035-00. Signed 9 September 2013.
4
of three ‘result streams’ related to Improved Student Attendance, Improved Quality of Literacy Instruction, and Improved Attentiveness.
• RF 2: Health and Dietary Practices Results Framework: The SO of this framework is the Increased Use of Health and Dietary Practices, primarily by school age children but also by those who influence these children’s health and well-being, such as parents, families and school staff. The achievement of the SO is intended to support the IR Reduced Health-Related Absences in RF 1. RF 2 is complementary to RF 1.7
14. Over the next phase of programming (2017-2019), WFP intends to reduce their THR activities to zero as they are slowly handed over to the MoEYS Scholarship Office. The next phase of implementation will also focus on developing an agreed nationally owned school feeding model as per the Roadmap of 2015.8 More information on the Roadmap can be found in Section 2.4. 1.2 Context 15. Cambodia attained lower-middle-income country (LMIC) status in mid-2016, with GDP per capita reaching US$1,159.9 Cambodia is currently ranked 143 out of 188 countries on the United Nations Development Programme’s 2015 Human Development Index. Cambodia's growth is expected to remain strong at around seven percent, driven by solid performances in garment manufacture, construction, tourism, and the production of food and cash crops. Despite economic growth and ongoing development in urban areas, rural development lags. 16. Poverty: Rural communities still make up 79 percent of the population, and account for most of the country's poor.10 A significant proportion of Cambodians live on the brink of poverty; it has been estimated that losing just US$0.30 a day per person in income would double the poverty rate.11 This means that natural disasters such as storms, floods, droughts or serious illness could cause profound setbacks to fragile livelihoods. A recent joint WFP, UNICEF, FAO Household Resilience survey12 showed that 13 percent of households acquired additional debts because of the 2015/2016 El Niño event, increasing the overall percentage of indebted households to nearly 50 percent. While the poor are often disproportionally affected by shocks, near-poor and middle-class households are also put under considerable stress. Over the past two decades, Cambodia has seen a significantly reduced poverty rate, dropping from 50 percent in 1992 to 13.5 percent in 2014.13 Although the official poverty rate has fallen dramatically, the poor have not made it very far above the poverty line, the rate of poverty reduction has tapered off sharply since 2009, and multidimensional poverty remains high.14 17. Gender: Cambodia ranks 112th out of 159 countries on the 2015 Gender Inequality Index (GII value 0.479) as persistent gender inequality still exists. Cambodia’s 2015 Gender Development Index value is 0.892.15 Women in Cambodia have lower levels of literacy than their male peers. In the 18-24 age group, more women than men are illiterate16 and the rate of illiteracy grows with older cohorts of women. Gender-based violence is also a barrier for women’s development and participation. According to the Cambodian Demographic and Health Survey (2014) about one in five women aged 15-49 have experienced physical violence since the age of 15; and four percent of pregnant women experienced physical violence during their pregnancy.17 Despite these significant challenges, women are increasingly earning income 7 FY 2016 Food Aid Proposal Guidance. Annex III: Manual for the Use of Results Frameworks and Indicators. Food Assistance Division, Office of Capacity Building and Development, Foreign Agricultural Service, USDA. 8 MoEYS/WFP School Feeding Roadmap. Signed 28 April 2015. 9 WB. World Bank Open Data: http://data.worldbank.org/ 10 Cambodia Inter-Censal Population Survey, 2013 11 WB Policy Note on Poverty Monitoring and Analysis, October 2013 12 Household Resilience in Cambodia: A review of livelihoods, food security and health, May 2016, WFP. 13 Ministry of Planning. Poverty Estimate in 2014 in Cambodia 14 Asian Development Bank (2014) Cambodia Country Poverty Analysis. 15 UNDP. 2016. Human Development Report 2015. 16 Commune database 2013 17 National Institute of Statistics, 2015
5
and starting small businesses from their homes. The number of women having their primary occupation in the private sector is higher than men in many provinces,18 largely due to employment in the garment sector. However, women are typically employed at lower levels and paid less: estimates suggest an average 30 percent less than men for commensurate work.19 A 2014 study found that women-headed households are disproportionately affected by floods,20,21 and women’s unemployment after natural disasters is high because agricultural and the informal sectors – the top employment sectors for women – are often the worst affected. 18. In recent years WFP Cambodia has undertaken several pieces of gender-related work in order to better understand the gender context. This includes joining the programme partnership on gender mainstreaming with the Institute of Development Studies (IDS) at the end of 2015, engaging in a Participatory Action Learning processes with IDS in February 2016,22 conducting a review of gender in Cambodia’s food security and nutrition policies,23 and a study into gender in household decision-making.24 The latter indicates that women are often the sole decision-makers in determining how food and cash transfers are utilized for their household. 19. Education: In the last three decades, Cambodia has made good strides in improving primary education programmes in rural areas. The net primary school enrolment figure increased from 81 percent in 2001 to 98.4 percent in 2015-2016. The dropout rate at primary level has been consistently around 10 percent, and lower secondary education at about 20 percent. Recent data however indicates that the primary school dropout reduced in the 2015/16 school year to 6.2 percent.25 Though not captured at aggregate level, attendance and absenteeism are of concern. Available national statistics do not show substantial differences between boys and girls on any indicator of participation in education. 20. The fourth Education Strategic Plan (2014-2018)26 cites numerous remaining challenges including the need to focus on expanding equitable access to primary school education for remote, often marginalized, communities. It also highlights improving the quality of education by developing an accountability framework and by providing highly qualified teachers as well as better textbooks and learning materials. Cambodia’s integration into Association of South-East Asian Nations (ASEAN) in 2015 and its desire to be a middle-income country by 2030 requires the authorities to make considerable investment in education. The Royal Government of Cambodia is expected to increase investment in this area, with much of this budget allocated for the recruitment, training and retention of teachers. 21. Food and nutrition security: The 2014 Cambodia Socioeconomic survey suggests that 14 percent of households continued to consume less than the minimum dietary energy requirement, while 11.6 percent had inadequate dietary diversity.27 As with the other indicators, between 2000 and 2010 Cambodia made significant progress in improving the health of its children. The infant mortality rate declined from 95 to 45 deaths per 1,000 live births, setting Cambodia on track to reach its Millennium Development Goal (MDG) 4 to reduce child mortality.28 However, malnutrition remains a significant problem and is a
18 Commune Database 2013, Ministry of Planning 19 CSO report on Cambodian gender issues. 2009 20 ActionAid. 2014. Flood Impacts on Women: Exploring the Possibility of Gender Sensitive DRR Planning. 21 An earlier study provides an illustrative example of this trend: a majority of households affected by the 2011 floods in the Plains and Tonle Sap zones were female-headed (53 percent in both zones). WFP, ActionAid, ADB, Danish Red Cross, Save the Children and UNICEF. 2012. Cambodia Post-Flood Relief and Recovery Survey. 22 WFP (2016) Cambodia County Progress Report. Innovations from the field: Gender mainstreaming from the ground up. Institute of Development Studies. 23 Sokrathna, P. (2016) Gender review of food security and nutrition policies. Sustainable Development Goals 2,5 and 17. Cambodia. 24 WFP (2016) Gendered nature of intra-household decision-making in Cambodia. WFP Cambodia. Phnom Penh. 25 MoEYS. Education Management and Information System data. 26 The Royal Government of Cambodia (2014) Education Strategic Plan 2014-2018. Ministry of Education, Youth and Sport. Phnom Penh. 27 Cambodia Socioeconomic Survey, 2014, National Institute of Statistics, Ministry of Planning; Available at: https://www.unicef.org/cambodia/6.Maternal.pdf 28 Ibid.
6
contributing cause in approximately one third of child deaths.29 Recent national statistics on nutrition show that the number of children suffering from both chronic (stunting) and acute malnutrition have decreased since 2010. The 2014 Cambodia Demographic Health Survey30 found that the stunting rate fell from 49.2 percent in 2010 to 32.4 percent in 2014. Although this represents a significant improvement, this level is still considered to be high.31 Acute malnutrition (wasting) is at ten percent32 which is classified by the World Health Organization as serious. Micronutrient deficiencies remain widespread. Anaemia is common among children under five, with a prevalence of more than 80 per cent among children under two. It also affects a significant percentage of pregnant women. Nutrition statistics for school-aged children in Cambodia are limited, but an impact evaluation of the WFP School Feeding Programme in 201033 found prevalence rates of iron-deficiency anaemia of between 59 percent among the control group and 83 percent in the SMP+THR for children 8-17 years of age. WHO classify rates >40 percent as severe anaemia. The impact evaluation report does not mention any gender differences in anaemia rates. 22. It is important to note that while under-nutrition continues to play an important role in determining population wellness and productivity, over-nutrition is on the rise; while 14 percent of women between 15 and 49 years of age have a body mass index (BMI) below 18.5 (thin), 18 percent are overweight.34 This double burden is indicative of economic shifts and predicts greater challenges in future, including those associated with non-communicable diseases, unless addressed in a timely manner. 23. Social protection. Cambodia has been heading towards a unified social health protection system since 2003, with the adoption of the Master Plan for the Development of Social Health Insurance.35 Since then, the Government has been making efforts to develop social protection systems. Currently, there are several social welfare programmes provided by different line ministries. The Government’s Rectangular Strategy (RS) Phase III and the National Strategic Development Plan (NSDP) prioritize the creation of social safety nets to support the health and nutrition of the most vulnerable, including during emergencies or disasters.36,37 The new National Social Protection Policy Framework (2016-2025) includes mention of both school meals and scholarships. 24. Other WFP activities in Cambodia: WFP has been implementing programmes in Cambodia since 1979, including school feeding activities since 1999. Currently, WFP Cambodia implements a Country Programme (CP) 38 which will finish in December 2018. The USDA-supported FFE programme is just one component of the broader country portfolio (Map 2). The CP focuses on education, nutrition and rural development, and seeks to strengthen food and cash-based social safety nets in Cambodia, and craft sustainable and scalable implementation models that can eventually be managed efficiently by the Royal Government of Cambodia. 25. The education component of the CP consists of a school meals programme and both food or cash-based scholarships, and constitutes 75 percent of all WFP programming in the country. The SMP provides daily, on-site, hot and nutritious breakfasts to primary school students attending the morning shift of classes. During the SY 2016/17, the SMP was implemented in 29 Ibid. 30 Royal Government of Cambodia (2014) Cambodia Demographic and Health Survey. National Institute of Statistics and Director General of Health. Phnom Penh 31 http://www.who.int/nutgrowthdb/about/introduction/en/index5.html 32 Royal Government of Cambodia (2014) Cambodia Demographic and Health Survey. National Institute of Statistics and Director General of Health. Phnom Penh 33 Nielsen, N et al (2010) WFP Cambodia School Feeding 2000-2010: A mixed method impact evaluation. DARA. For WFP Office of Evaluation, Rome. OE/2011/008. 34 BMI >25 35 UNDP. 2015. Adaptive Social Protection in Cambodia. Strategy Paper. 36 Royal Government of Cambodia (RGoC). 2013. “Rectangular Strategy” for Growth, Employment, Equity and Efficiency. Phase III. Page 37. 37 RGoC. 2014. National Strategic Development Plan 2014-2018. Pages 86, 180-198. 38 CP 200202 (2011-2018). WFP/EB.A/2011/9/1
7
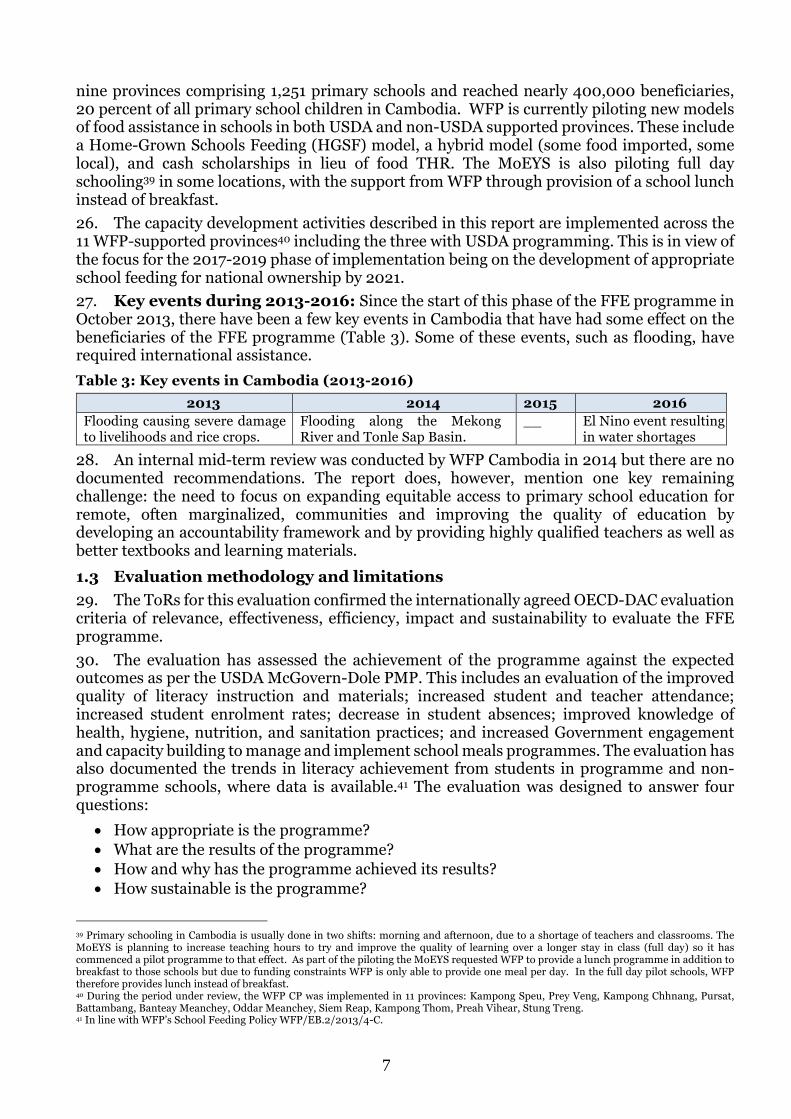
nine provinces comprising 1,251 primary schools and reached nearly 400,000 beneficiaries, 20 percent of all primary school children in Cambodia. WFP is currently piloting new models of food assistance in schools in both USDA and non-USDA supported provinces. These include a Home-Grown Schools Feeding (HGSF) model, a hybrid model (some food imported, some local), and cash scholarships in lieu of food THR. The MoEYS is also piloting full day schooling39 in some locations, with the support from WFP through provision of a school lunch instead of breakfast. 26. The capacity development activities described in this report are implemented across the 11 WFP-supported provinces40 including the three with USDA programming. This is in view of the focus for the 2017-2019 phase of implementation being on the development of appropriate school feeding for national ownership by 2021. 27. Key events during 2013-2016: Since the start of this phase of the FFE programme in October 2013, there have been a few key events in Cambodia that have had some effect on the beneficiaries of the FFE programme (Table 3). Some of these events, such as flooding, have required international assistance. Table 3: Key events in Cambodia (2013-2016)
2013 2014 2015 2016 Flooding causing severe damage to livelihoods and rice crops.
Flooding along the Mekong River and Tonle Sap Basin.
__ El Nino event resulting in water shortages
28. An internal mid-term review was conducted by WFP Cambodia in 2014 but there are no documented recommendations. The report does, however, mention one key remaining challenge: the need to focus on expanding equitable access to primary school education for remote, often marginalized, communities and improving the quality of education by developing an accountability framework and by providing highly qualified teachers as well as better textbooks and learning materials. 1.3 Evaluation methodology and limitations 29. The ToRs for this evaluation confirmed the internationally agreed OECD-DAC evaluation criteria of relevance, effectiveness, efficiency, impact and sustainability to evaluate the FFE programme. 30. The evaluation has assessed the achievement of the programme against the expected outcomes as per the USDA McGovern-Dole PMP. This includes an evaluation of the improved quality of literacy instruction and materials; increased student and teacher attendance; increased student enrolment rates; decrease in student absences; improved knowledge of health, hygiene, nutrition, and sanitation practices; and increased Government engagement and capacity building to manage and implement school meals programmes. The evaluation has also documented the trends in literacy achievement from students in programme and non-programme schools, where data is available.41 The evaluation was designed to answer four questions: • How appropriate is the programme? • What are the results of the programme? • How and why has the programme achieved its results? • How sustainable is the programme?
39 Primary schooling in Cambodia is usually done in two shifts: morning and afternoon, due to a shortage of teachers and classrooms. The MoEYS is planning to increase teaching hours to try and improve the quality of learning over a longer stay in class (full day) so it has commenced a pilot programme to that effect. As part of the piloting the MoEYS requested WFP to provide a lunch programme in addition to breakfast to those schools but due to funding constraints WFP is only able to provide one meal per day. In the full day pilot schools, WFP therefore provides lunch instead of breakfast. 40 During the period under review, the WFP CP was implemented in 11 provinces: Kampong Speu, Prey Veng, Kampong Chhnang, Pursat, Battambang, Banteay Meanchey, Oddar Meanchey, Siem Reap, Kampong Thom, Preah Vihear, Stung Treng. 41 In line with WFP’s School Feeding Policy WFP/EB.2/2013/4-C.
8
31. Annex 3 shows the evaluation matrix that was developed to provide an overview of the direction of the evaluation. Aside from the evaluation matrix, the United Nations Evaluation Group (UNEG) Guidance on integrating human rights and gender into evaluations42 has also been used to shape the evaluation approach. The evaluation methodology has integrated a gender equity lens as part of the overall analysis, addressing the substantive aspects related to gender and equity issues within the programme. The evaluation applied gender analysis where possible and assessed the extent to which the different needs, priorities, voices and vulnerabilities of women, men, boys and girls have been considered in the design, selection, implementation and monitoring of the programme. 32. The evaluation followed a quasi-experimental approach employing a case-control methodology as per the 2014 baseline methodology. However, the baseline ‘comparison group’ was later found to include schools with some interventions by other agencies, meaning that the group was neither representative nor clean. Nevertheless, the same comparison group was utilized again for the midline, and now the endline survey. The evaluation used mixed data collection methods, including quantitative and qualitative survey techniques, and triangulated information from different methods and sources to enhance the reliability of findings. Participatory methods, including focus group discussions (FGDs) and key informant interviews (KIIs) were used where relevant to highlight lessons learned. The evaluation included three main components of work: • Secondary document review • A quantitative survey to enable comparison of results against the 2014 baseline and the
2015 midline surveys (August/September 2017) • Qualitative field work to obtain input from key stakeholders (September/October 2017).
33. The secondary document review included many project documents including the assessments on which the programme was designed, WFP and Government policies and normative guidance, as well as the baseline and midline survey reports. The list of documents reviewed can be found in Annex 4, and should be read together with the bibliography. 34. The quantitative survey intentionally replicated the same methodology as the 2014 baseline and the 2015 midline surveys to enable direct comparison. To conduct the quantitative survey, KonTerra partnered with a local research firm – Indochina Research Limited (IRL) - who conducted the survey with support from the ET. The survey utilized local enumerators for the data collection, ensuring that language and cultural barriers were minimized, and political sensitivities were addressed. Enumerators spoke the local language (Khmer) to ensure both questions and responses were well understood. The quantitative survey generated primary data that has been utilized together with secondary sources of quantitative data including WFP monitoring data, and data from implementing partners. 35. The quantitative survey was conducted in two of the three USDA supported provinces: (Battambang and Siem Reap) (Map 1) and in all the same schools selected for the baseline and midline surveys. Kampong Thom was originally excluded from the baseline and midline surveys because only the SMP was being implemented with USDA support, and the food scholarships were provided by other donors. The survey therefore covers SMP+THR schools, and THR only schools. No SMP only schools were included. In total, the survey covered a sample of 118 of the total 861 USDA supported schools originally included in the FFE programme (Table 4), as well as 25 comparison schools with no USDA supported interventions. More details on how these schools were originally selected can be found in Annex 5. The full list of schools can be found in Annex 6.
42 UNEG (2014) Integrating Human Rights and Gender Equality in Evaluations. Guidance document. August 2014.
9
Table 4: Summary of sample size for the 2013-2016 endline quantitative surveys Battambang Siem Reap
No. of WFP SMP + THR schools 7 53 No. of WFP THR only schools 34 24 No. of comparison schools (no USDA-supported interventions) 10 15 No. of households surveyed 304 536
36. The quantitative survey included the implementation of three questionnaires: a school assessment, a teacher assessment and a household questionnaire. Each of the data collection tools are described in more detail in the annexes as shown below. 37. The school assessment includes basic information on the composition and performance of the school (number of children enrolled, attending, availability of advanced teaching materials, literacy testing success rates, etc.) as well as specific information on the school’s infrastructure (latrines, water sources, kitchens, school gardens, etc.). The primary respondent was the school’s principal or chief administrator. The school survey questionnaire can be found in Annex 7. It was adapted from a WFP school survey instrument with only slight modifications. It is comprised of five sections: General information, Improved quality of literacy instruction, Improved school infrastructure, Local organization and community groups, and Nutrition, health and dietary practices. 38. The teacher assessment includes information on student attentiveness in class, and short-term hunger. The questionnaire can be found in Annex 8. This short survey was carried out in all case and comparison schools and answered by primary school teachers to collect data on estimated short-term hunger reduction and improved student attentiveness. 39. The household survey includes information on the composition and education of the household members, household income and expenditure, food consumption, and coping strategies. It also includes information on child health, parents’ involvement in the FFE programme, parental reasons for sending their children to school, and information on some of the effects of school feeding. The household questionnaire can be found in Annex 9 and more information on the selection on respondents can be found in Annex 10. 40. The school and teacher assessments were collected manually, and entered into a CSPro database. The household survey was digitized and collected using SurveytoGo. Data analysis was done with STATA, R and Excel software. Household survey data have been weighted to reflect the proportion of the population benefitting from each programme. 41. The qualitative field mission was conducted by the KonTerra ET in all three USDA supported provinces (Map 1). The field mission evaluated the coherence of the diverse school feeding activities and projects implemented by WFP Cambodia under the USDA McGovern Dole Programme Agreement for 2013-2016. The qualitative data collection generated primary data that have been used to triangulate the quantitative data mentioned above in order to answer the four evaluation questions listed earlier. In total, the evaluation team interviewed 203 people as key informants during the field mission, including 81 women and 122 men, covering a range of programme stakeholders including USDA representatives in Ho Chi Minh City, WFP personnel at RB and CO, as well as Government representatives, staff of United Nations agencies, NGO staff, school personnel and parents and children. The full list can be found in Annex 11. The KIIs were done using semi-structured questionnaires (Annex 12) based on the questions outlined in the evaluation matrix. Each questionnaire was then adapted appropriately according to the expertise and relevance of the key stakeholders. As part of the qualitative field mission, the ET conducted field visits to schools and communities in selected communes receiving assistance from the USDA McGovern-Dole Program. The ET visited two schools per province as per Table 5. These schools were selected primarily based on
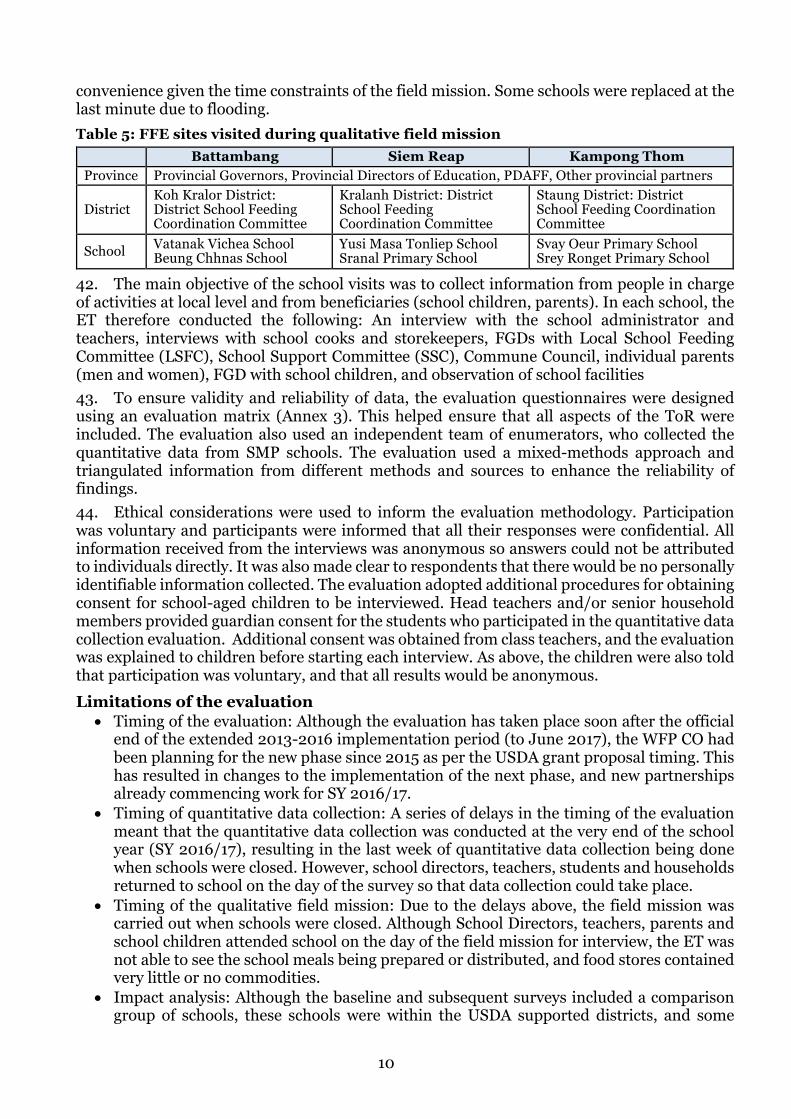
10
convenience given the time constraints of the field mission. Some schools were replaced at the last minute due to flooding. Table 5: FFE sites visited during qualitative field mission
Battambang Siem Reap Kampong Thom Province Provincial Governors, Provincial Directors of Education, PDAFF, Other provincial partners
District Koh Kralor District: District School Feeding Coordination Committee
Kralanh District: District School Feeding Coordination Committee
Staung District: District School Feeding Coordination Committee
School Vatanak Vichea School Beung Chhnas School
Yusi Masa Tonliep School Sranal Primary School
Svay Oeur Primary School Srey Ronget Primary School
42. The main objective of the school visits was to collect information from people in charge of activities at local level and from beneficiaries (school children, parents). In each school, the ET therefore conducted the following: An interview with the school administrator and teachers, interviews with school cooks and storekeepers, FGDs with Local School Feeding Committee (LSFC), School Support Committee (SSC), Commune Council, individual parents (men and women), FGD with school children, and observation of school facilities 43. To ensure validity and reliability of data, the evaluation questionnaires were designed using an evaluation matrix (Annex 3). This helped ensure that all aspects of the ToR were included. The evaluation also used an independent team of enumerators, who collected the quantitative data from SMP schools. The evaluation used a mixed-methods approach and triangulated information from different methods and sources to enhance the reliability of findings. 44. Ethical considerations were used to inform the evaluation methodology. Participation was voluntary and participants were informed that all their responses were confidential. All information received from the interviews was anonymous so answers could not be attributed to individuals directly. It was also made clear to respondents that there would be no personally identifiable information collected. The evaluation adopted additional procedures for obtaining consent for school-aged children to be interviewed. Head teachers and/or senior household members provided guardian consent for the students who participated in the quantitative data collection evaluation. Additional consent was obtained from class teachers, and the evaluation was explained to children before starting each interview. As above, the children were also told that participation was voluntary, and that all results would be anonymous. Limitations of the evaluation • Timing of the evaluation: Although the evaluation has taken place soon after the official
end of the extended 2013-2016 implementation period (to June 2017), the WFP CO had been planning for the new phase since 2015 as per the USDA grant proposal timing. This has resulted in changes to the implementation of the next phase, and new partnerships already commencing work for SY 2016/17.
• Timing of quantitative data collection: A series of delays in the timing of the evaluation meant that the quantitative data collection was conducted at the very end of the school year (SY 2016/17), resulting in the last week of quantitative data collection being done when schools were closed. However, school directors, teachers, students and households returned to school on the day of the survey so that data collection could take place.
• Timing of the qualitative field mission: Due to the delays above, the field mission was carried out when schools were closed. Although School Directors, teachers, parents and school children attended school on the day of the field mission for interview, the ET was not able to see the school meals being prepared or distributed, and food stores contained very little or no commodities.
• Impact analysis: Although the baseline and subsequent surveys included a comparison group of schools, these schools were within the USDA supported districts, and some
11
received support from other agencies. The comparison group has also not been adequately matched to the case schools to enable impact assessment without the possibility of confounding. Impact analysis of the data is therefore not possible.
• Language and cultural barriers were constraints for the two international team members involved in the qualitative field mission, but were partially ameliorated by the presence of the national evaluator and the use of translators.
2 Evaluation Findings
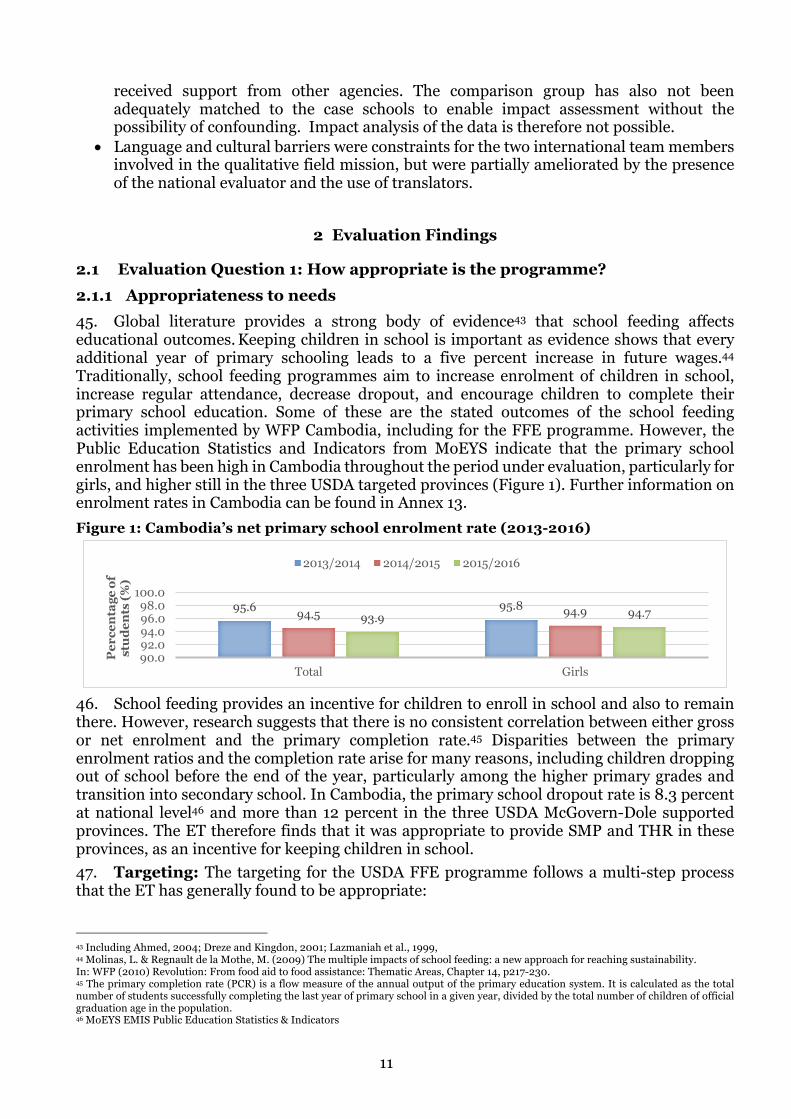
2.1 Evaluation Question 1: How appropriate is the programme? 2.1.1 Appropriateness to needs 45. Global literature provides a strong body of evidence43 that school feeding affects educational outcomes. Keeping children in school is important as evidence shows that every additional year of primary schooling leads to a five percent increase in future wages.44 Traditionally, school feeding programmes aim to increase enrolment of children in school, increase regular attendance, decrease dropout, and encourage children to complete their primary school education. Some of these are the stated outcomes of the school feeding activities implemented by WFP Cambodia, including for the FFE programme. However, the Public Education Statistics and Indicators from MoEYS indicate that the primary school enrolment has been high in Cambodia throughout the period under evaluation, particularly for girls, and higher still in the three USDA targeted provinces (Figure 1). Further information on enrolment rates in Cambodia can be found in Annex 13. Figure 1: Cambodia’s net primary school enrolment rate (2013-2016)
46. School feeding provides an incentive for children to enroll in school and also to remain there. However, research suggests that there is no consistent correlation between either gross or net enrolment and the primary completion rate.45 Disparities between the primary enrolment ratios and the completion rate arise for many reasons, including children dropping out of school before the end of the year, particularly among the higher primary grades and transition into secondary school. In Cambodia, the primary school dropout rate is 8.3 percent at national level46 and more than 12 percent in the three USDA McGovern-Dole supported provinces. The ET therefore finds that it was appropriate to provide SMP and THR in these provinces, as an incentive for keeping children in school. 47. Targeting: The targeting for the USDA FFE programme follows a multi-step process that the ET has generally found to be appropriate:
43 Including Ahmed, 2004; Dreze and Kingdon, 2001; Lazmaniah et al., 1999, 44 Molinas, L. & Regnault de la Mothe, M. (2009) The multiple impacts of school feeding: a new approach for reaching sustainability. In: WFP (2010) Revolution: From food aid to food assistance: Thematic Areas, Chapter 14, p217-230. 45 The primary completion rate (PCR) is a flow measure of the annual output of the primary education system. It is calculated as the total number of students successfully completing the last year of primary school in a given year, divided by the total number of children of official graduation age in the population. 46 MoEYS EMIS Public Education Statistics & Indicators
95.6 95.894.5 94.993.9 94.7
90.092.094.096.098.0
100.0
Total Girls
Per
cent
age
of
stud
ents
(%)
2013/2014 2014/2015 2015/2016
12
• Geographic targeting: For this phase of programming, the three target provinces were pre-determined by USDA in their call for proposals as a continuance of support from previous years. At the time of the design of this phase, they were not areas with the highest levels of poverty, poor education or malnutrition. The CO then used their own data from the Monitoring, Evaluation, Reporting, Vulnerability Analysis and Mapping (MERVAM) Unit to determine the districts most in need. Aside from the pre-determined provinces, this targeting process aligns well with WFP’s targeting methodology for their other activities in Cambodia that are not supported by USDA – i.e. an emphasis on locations with high rates of poverty, poor education outcomes, and high levels of malnutrition.
• School selection: Both the SMP and THR activities are implemented in schools in poor districts, with low education outcomes. SMP school selection is made according to WFP’s SMP Guidelines47 to ensure support is directed to the demand areas. The SMP beneficiary schools are selected on education performance indicators48 provided through the national Education Management and Information System (EMIS). All schools within the target SMP districts are then entitled to THR regardless of whether schools have SMP or not. The THR is distributed to poor students in grades 4, 5 and 6, subject to a minimum 80 percent attendance rate. Schools with no Grade 4-6 are therefore not included in the programme. This leaves few SMP only schools.
• Household selection: THR students are selected by their teachers based on household poverty, and selection is verified by PLAN and WFP. The selection process is transparent, and clearly presented in the Food and Cash Scholarship Operation Guidelines (2015) and School Meal Programme Guidelines (2016). Generally, THR children are selected through poverty criteria, primarily whether their household has an IDPoor Card – an identification card provided to the most vulnerable families by local government (see Box 1).49 Stakeholders felt that in general, the use of IDPoor was an appropriate means of targeting poorer children. Poor households that are not present (and thus not captured) in the rotating IDPoor classification rounds are able to be included in the THR targeting through assessment of household poverty as per the verification criteria.50
48. Teacher training: In 2013-14, the teaching staff represented 83 percent of the total MoEYS staff in Cambodia.51 According to MoEYS, one of the fundamental staffing problems was that more than 2,000 teachers per year leave the profession, many permanently. For the quality of teaching to improve in the short and medium term, the immediate priority for the ministry is to improve the attractiveness of the profession, provide additional training for high qualification holders, and diversify entry points into teaching that will allow the best university graduates quick entry into classrooms. The MoEYS currently plans to train and supply 2,000 to 2,500 teachers per year. Teacher training as one of the USDA McGovern-Dole Program activities is therefore fully appropriate.
47 MoEYS/WFP (2016) Updated School Meal Programme Guidelines 48 Lower levels of enrolment and higher drop-out rates 49 Since 2005, Cambodia’s Ministry of Planning has developed a standardized questionnaire and procedure to identify poor households in rural areas. This information can be used by policy decision-makers, government institutions and non-governmental organizations to plan poverty reduction programs and to target their support to the poorest areas or households in Cambodia. 50 In many schools, teachers also select students without IDPoor cards by assessing the students with the following criteria: 1) housing condition; 2) family owned farmland and crops; 3) owned animals and livestock; 4) owned asset such as radio, TV, etc.; 5) main livelihood and sources of income; 6) family food security situation; and 7) Household debts. 51 There were 88,818 teachers in the system, of whom approximately 52 percent taught in primary schools.
Box 1: The IDPoor System The IDPoor system is officially referred to as the Identification of Poor Households Programme. It is a standardized procedure, developed by the Ministry of Planning (MoP), to identify and classify poor households throughout the country. The IDPoor classification process occurs annually, on a rolling geographic basis, with the whole country covered every three years. IDPoor status is widely used, by both the government and the international community, as a key criterion for targeting assistance.
13
49. Other programme activities: The FFE programme provides a breakfast at school before children start studying. This school feeding modality is appropriate as there is global evidence that poor health and poor nutrition among school-age children diminish their cognitive performance either through physiological changes or by reducing their ability to participate in learning experiences, or both.52 The FFE programme’s complementary activities of infrastructure construction and rehabilitation support, training, and focus on health and nutrition activities are all also appropriate for the local context. The provision of THR to reduce drop-out aligns with the Government's cash scholarship for the poor programme in Grades 7 to 9. Although at national level boys are more likely to drop out of school than girls,53 the ET found that allowing schools to provide THR to both girls and boys depending on the individual circumstances was appropriate. Overall, the ET finds that the activities included in the FFE programme are appropriate to the needs of school-aged children in Cambodia. 2.1.2 Alignment with national policies and strategies 50. The Royal Government of Cambodia has developed several policies and strategies to support economic growth and development, each of which have some relevance to school feeding in general, and to the USDA FFE programme. The main strategy is the Rectangular Strategy (RS) that provides a framework for the country’s long-term development vision. The first RS was developed in 2004 and Phase III (2014-2018) is currently being implemented. The RS III is the ‘Socio-Economic Policy Agenda’ of the Royal Government of Cambodia. A new RS will be released in 2019. The RS aligns with the National Strategic Development Plan (NSDP) (2014-2018). School feeding will also have significant alignment with the next phase of the RS (Rectangle IV), especially in relation to strengthening and enhancing education and technical training, promotion of health and nutrition, and the development of a social protection system. More details on the next RS and other Government policies can be found in Annex 14. 51. The goal and objectives of WFP’s overall school feeding portfolio aligns well with the focus of the NSDP on the “creation of social safety nets” and to Priority 6 of the strategy to strengthen institutional capacity on food security, nutrition and social protection.54 Both the RS-III and the NSDP also support the primary education sub-sector on the promotion of early childhood capacity of reading and writing. 52. In addition, the Government has a National Strategy for Food Security and Nutrition (NSFSN) (2014-2018). The NSFSN is a coordination framework of multi-sectoral activities to enhance food security and nutrition, reducing child and maternal malnutrition and enhancing human and economic development. The FFE programme activities of the provision of food, improvement of water and sanitation facilities, and provision of training on health and nutrition, are aligned with the five priority areas of intervention within the NSFSN. More information on the objectives of the NSFSN can be found in Annex 14. 53. The Government has also recently developed a National Social Protection Policy Framework (2016-2025), encompassing both social assistance and social insurance measures, which will serve as the basis for reducing and preventing poverty, vulnerability and inequality, as well as strengthening human resource development in the country. The framework mentions School Feeding as a safety net. 54. The MoEYS follows the Educational Strategic Plan (ESP) (2014-2018) to “establish and develop human resources of the very highest quality and ethically sound to develop a knowledge-based society within Cambodia.” The ESP’s overall objective is to “ensure that all Cambodian children and youth have equal opportunity to access quality education.” More
52 Rethinking School Feeding: Social Safety Nets, Child Development, and the Education Sector, by Donald Bundy, Carmen Burbano, Margaret Grosh, Aulo Gelli, Matthew Jukes, Lesley Drake, WFP/The World Bank, 2009. 53 MoEYS EMIS Public Education Statistics & Indicators 54 “Strengthen institutional capacity, partnerships, and fund-raising capacity to increase the effectiveness of social services) that focused on: a) food security and nutrition; and b) social protection”.
14
specific objectives include a focus on strengthening basic education and quality, especially building reading and mathematics skills during the early grades of primary education. The USDA McGovern-Dole Program is in line with these objectives, particularly through its first SO. In addition, the provision of scholarships for children in Grades 4-6 and the provision of a school feeding programme for primary schools are parts of the programmes and activities planned by MoEYS to increase student enrolment to primary schools within the national ESP. 55. Another key strategy is the move towards decentralization and deconcentration (D&D). In recent years, the central Government has been moving towards a less centralized governance model, and actively supporting local administration at provincial and district levels to become more efficient, reliable and responsive, with stronger financial, human resource and decision-making capacities.55 The first D&D programme was launched in 2000 and now the communes have received funds from the national budget to finance local affairs (including components of school feeding). More details can be found in Annex 15. The D&D process is likely to have significant effects on the management of the school feeding activities in future, particularly under national ownership. 56. In addition to all the above, WFP has not only aligned with, but has actively supported, the development of some Government policies and tools. WFP supported the MoEYS/School Health Department to develop a new National School Health Policy which is expected to be finalized in 2017. The policy highlights the importance of the school feeding programme in child development and educational achievement. WFP also supported the MoEYS School Health Department to develop water/sanitation and hygiene (WASH) guidelines for use in training school personnel. In parallel, WFP has supported the CARD to prepare a Social Assistance Policy Framework (SAPF), which includes the key targets and benchmarks of the school feeding Roadmap. The SAPF has been merged with social insurance activities into the country’s new national social protection policy framework (2016-2025). 57. The recent WFP review of gender in Cambodia’s food security and nutrition policies56 found that not all policies and strategies were clearly linked to international and national frameworks and commitments on gender equality.57 Gender Mainstreaming Action Plans while generally required are not updated or are lacking. In addition, only a few strategies or policies were informed by a gender analysis and described how the policy should address or impacted men, women, boys and girls differently. As a result, most training and programme activities do not target men, women, boys or girls based on informed learnings, but on traditional gender norms for participation. 2.1.3 Alignment with WFP corporate strategies, policies & normative guidance 58. In addition to the Government policies and strategies mentioned above, the FFE programme aligns with several of WFP’s own corporate policies and strategies, as follows: • WFP Strategic Plan (2014-2017):58 The FFE programme contributes to SO4 – to
reduce under-nutrition and break the intergenerational cycle of hunger. The Strategic Plan specifies that school feeding programmes contribute to this goal by providing quality food and contributing to addressing micronutrient deficiencies. The second goal of the Strategic Plan is to increase access to education and health services.
55 GIZ Website.2017. Decentralisation and Administrative Reform Programme. https://www.giz.de/en/worldwide/17335.html accessed 23 August. 56 Sokrathna, P. (2016) Gender review of food security and nutrition policies. Sustainable Development Goals 2,5 and 17. Cambodia. 57 Including the Convention on the Elimination of Discrimination Against Women (CEDAW), Sustainable Development Goal 5, the Rectangular Strategy, the National Strategic Development Plan, and Neary Rattanak IV. 58 WFP (2014) WFP Strategic Plan (2014-2017) https://www.wfp.org/about/strategic-plan
15
• The WFP Gender Policy (2012)59 provides guidance to ensure that WFP’s programmes promote gender equality and women’s empowerment. The FFE programme targets both girls and boys, with girls prioritized where gender differences in education still exist.
• The WFP School Feeding Policy (2009)60 was revised in 201361 to increase alignment with the Strategic Plan 2014-17, the Strategic Results Framework, and the safety net and nutrition policies. The revised school feeding policy has five objectives (Annex 16) including strengthening national capacity for school feeding. The change in corporate direction to strengthen the national capacity is currently in process in Cambodia with WFP and MoEYS signing a Roadmap for transitioning to a nationally owned school feeding programme by 2021.
59. A World Bank and WFP paper62 also highlights that the transition to sustainable national programmes depends on mainstreaming school feeding into national policies and plans, especially education sector plans. The research aligns with WFP Cambodia’s plan to transition the programme to national ownership. 60. Although overall the USDA FFE programme aligns well with Government priorities and with WFP’s own corporate policies and guidance, the ET notes two misalignments in the FFE programme: • Operational objectives: The mid-term evaluation of the Cambodia CP63 confirmed
that its education component was in line with WFP SO464 and SO565 of the 2008-2011 Strategic Plan. Outside of the USDA McGovern-Dole Programme, WFP Cambodia’s school feeding activities operate under a food security and nutrition objective, and do not specifically target an improvement in student learning. Instead the activities are intended to contribute solely to reduced short term hunger which contributes to active learning. The USDA SO1 - improved literacy of school children - is not among WFP’s stated objectives. Furthermore, the evaluation found that most programme stakeholders66 were unaware of the literacy and health objectives of the FFE.
• Food assistance modalities and commodities: Cambodia has had several years of rice surplus, and the Government prefers a school feeding model that supports local production, due in part to the economic benefits to local farmers. The wider WFP school feeding activities are focused on developing modality options suitable for transition to national ownership. Also, while key informants appreciated the provision of fortified products with their high micronutrient content, it is unclear if the government will have the resources to fortify local products in the foreseeable future. More information about the Government’s preferred school feeding models can be found in Section 4: Sustainability.
61. The evaluation recognizes that with support from USDA, WFP is already considering alternative modalities. A HGSF pilot project was launched in two USDA schools in Siem Reap province in November 2014, reaching 1,062 pre-primary and primary school students. At the request of the MoEYS, the school meal was changed in these two schools from WFP delivery of USDA-funded food commodities to locally purchased commodities. The schools still receive infrastructure and other materials through USDA support. The success of this model means that it has since been scaled up to 84 schools in four provinces including two USDA supported
59 WFP (2009) Gender policy: promoting gender equality and the empowerment of women in addressing food and nutrition challenges. WFP/EB.1/2009/5-A/Rev.1 60 WFP/EB.2/2009/4-A 61 WFP/EB.2/2013/4-C 62 Bundy, D (2009) “Rethinking School Feeding: Social Safety Nets, Child Development, and the Education Sector 63 Reed S. et al (2014) Operational Evaluation - WFP Cambodia Country Programme 200202. A mid-term evaluation of WFP’s Country Programme 2011-2016. The KonTerra Group. 64 SO4; Reduce chronic hunger and undernutrition 65 SO5: Strengthen the capacities of countries to reduce hunger, including through hand-over strategies and local purchase 66 Aside from WFP and PLAN
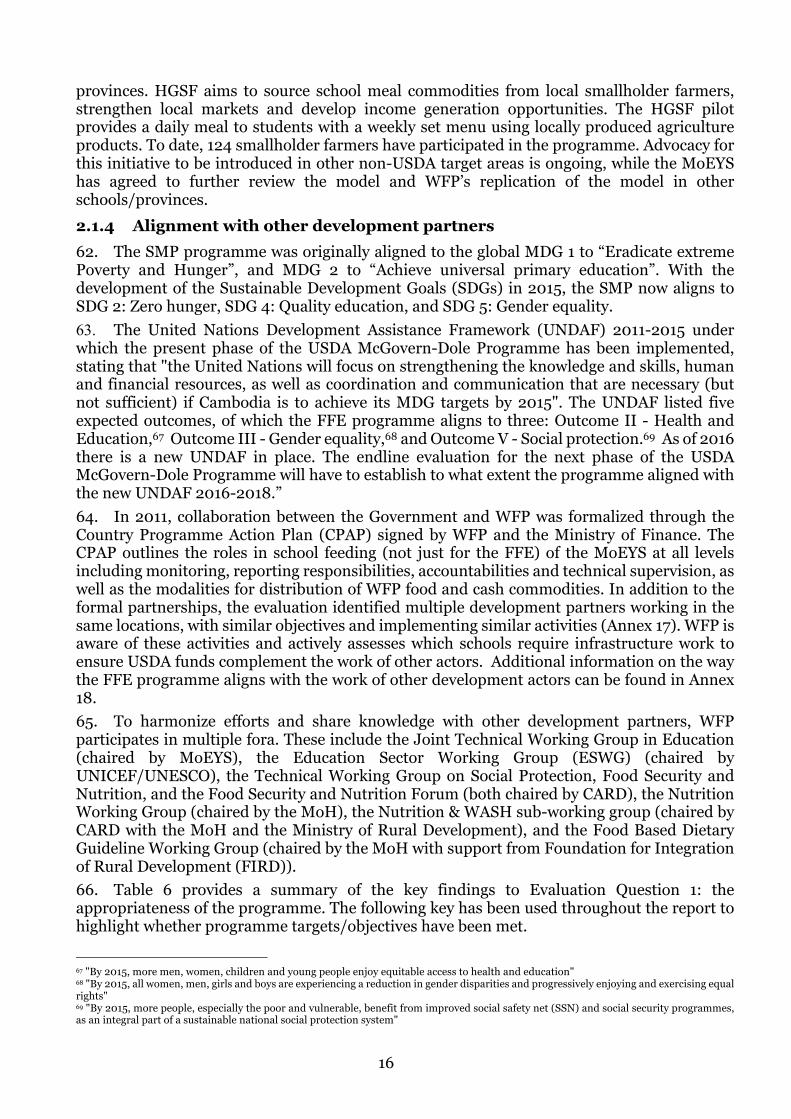
16
provinces. HGSF aims to source school meal commodities from local smallholder farmers, strengthen local markets and develop income generation opportunities. The HGSF pilot provides a daily meal to students with a weekly set menu using locally produced agriculture products. To date, 124 smallholder farmers have participated in the programme. Advocacy for this initiative to be introduced in other non-USDA target areas is ongoing, while the MoEYS has agreed to further review the model and WFP’s replication of the model in other schools/provinces. 2.1.4 Alignment with other development partners 62. The SMP programme was originally aligned to the global MDG 1 to “Eradicate extreme Poverty and Hunger”, and MDG 2 to “Achieve universal primary education”. With the development of the Sustainable Development Goals (SDGs) in 2015, the SMP now aligns to SDG 2: Zero hunger, SDG 4: Quality education, and SDG 5: Gender equality. 63. The United Nations Development Assistance Framework (UNDAF) 2011-2015 under which the present phase of the USDA McGovern-Dole Programme has been implemented, stating that "the United Nations will focus on strengthening the knowledge and skills, human and financial resources, as well as coordination and communication that are necessary (but not sufficient) if Cambodia is to achieve its MDG targets by 2015". The UNDAF listed five expected outcomes, of which the FFE programme aligns to three: Outcome II - Health and Education,67 Outcome III - Gender equality,68 and Outcome V - Social protection.69 As of 2016 there is a new UNDAF in place. The endline evaluation for the next phase of the USDA McGovern-Dole Programme will have to establish to what extent the programme aligned with the new UNDAF 2016-2018.” 64. In 2011, collaboration between the Government and WFP was formalized through the Country Programme Action Plan (CPAP) signed by WFP and the Ministry of Finance. The CPAP outlines the roles in school feeding (not just for the FFE) of the MoEYS at all levels including monitoring, reporting responsibilities, accountabilities and technical supervision, as well as the modalities for distribution of WFP food and cash commodities. In addition to the formal partnerships, the evaluation identified multiple development partners working in the same locations, with similar objectives and implementing similar activities (Annex 17). WFP is aware of these activities and actively assesses which schools require infrastructure work to ensure USDA funds complement the work of other actors. Additional information on the way the FFE programme aligns with the work of other development actors can be found in Annex 18. 65. To harmonize efforts and share knowledge with other development partners, WFP participates in multiple fora. These include the Joint Technical Working Group in Education (chaired by MoEYS), the Education Sector Working Group (ESWG) (chaired by UNICEF/UNESCO), the Technical Working Group on Social Protection, Food Security and Nutrition, and the Food Security and Nutrition Forum (both chaired by CARD), the Nutrition Working Group (chaired by the MoH), the Nutrition & WASH sub-working group (chaired by CARD with the MoH and the Ministry of Rural Development), and the Food Based Dietary Guideline Working Group (chaired by the MoH with support from Foundation for Integration of Rural Development (FIRD)). 66. Table 6 provides a summary of the key findings to Evaluation Question 1: the appropriateness of the programme. The following key has been used throughout the report to highlight whether programme targets/objectives have been met.
67 "By 2015, more men, women, children and young people enjoy equitable access to health and education" 68 "By 2015, all women, men, girls and boys are experiencing a reduction in gender disparities and progressively enjoying and exercising equal rights" 69 "By 2015, more people, especially the poor and vulnerable, benefit from improved social safety net (SSN) and social security programmes, as an integral part of a sustainable national social protection system"
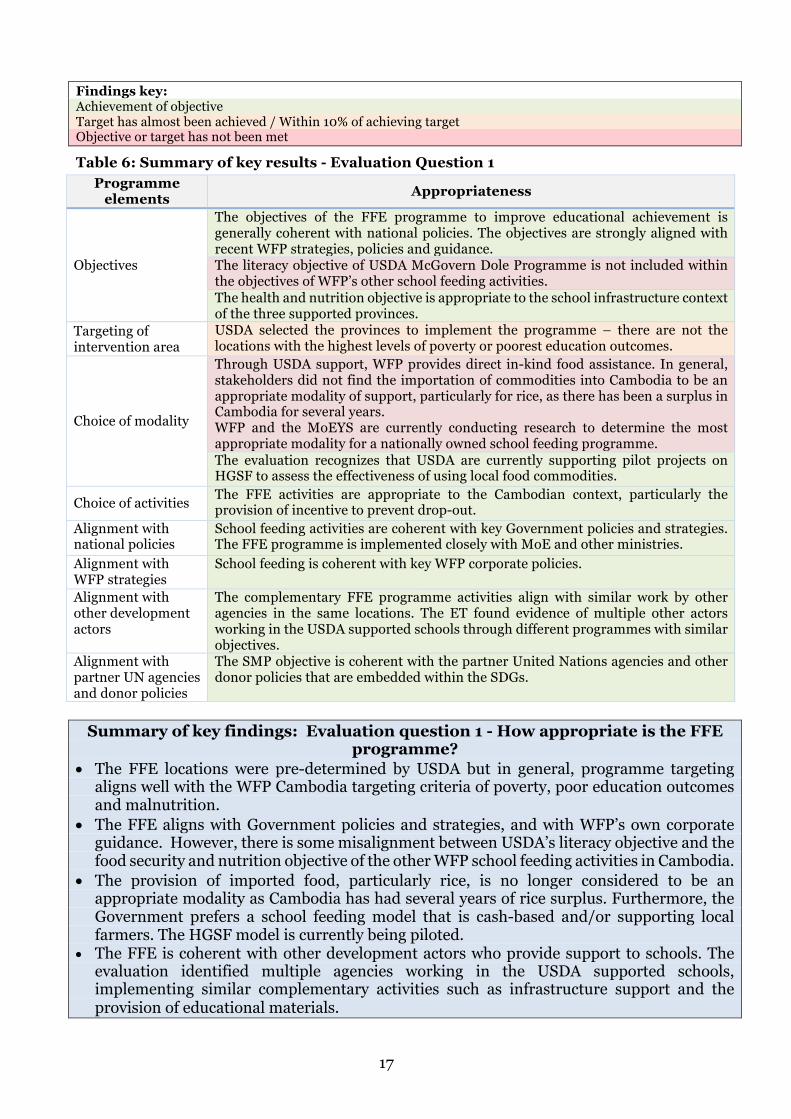
17
Findings key: Achievement of objective Target has almost been achieved / Within 10% of achieving target Objective or target has not been met
Table 6: Summary of key results - Evaluation Question 1
Summary of key findings: Evaluation question 1 - How appropriate is the FFE
programme? • The FFE locations were pre-determined by USDA but in general, programme targeting
aligns well with the WFP Cambodia targeting criteria of poverty, poor education outcomes and malnutrition.
• The FFE aligns with Government policies and strategies, and with WFP’s own corporate guidance. However, there is some misalignment between USDA’s literacy objective and the food security and nutrition objective of the other WFP school feeding activities in Cambodia.
• The provision of imported food, particularly rice, is no longer considered to be an appropriate modality as Cambodia has had several years of rice surplus. Furthermore, the Government prefers a school feeding model that is cash-based and/or supporting local farmers. The HGSF model is currently being piloted.
• The FFE is coherent with other development actors who provide support to schools. The evaluation identified multiple agencies working in the USDA supported schools, implementing similar complementary activities such as infrastructure support and the provision of educational materials.
Programme elements Appropriateness
Objectives
The objectives of the FFE programme to improve educational achievement is generally coherent with national policies. The objectives are strongly aligned with recent WFP strategies, policies and guidance. The literacy objective of USDA McGovern Dole Programme is not included within the objectives of WFP’s other school feeding activities. The health and nutrition objective is appropriate to the school infrastructure context of the three supported provinces.
Targeting of intervention area
USDA selected the provinces to implement the programme – there are not the locations with the highest levels of poverty or poorest education outcomes.
Choice of modality
Through USDA support, WFP provides direct in-kind food assistance. In general, stakeholders did not find the importation of commodities into Cambodia to be an appropriate modality of support, particularly for rice, as there has been a surplus in Cambodia for several years. WFP and the MoEYS are currently conducting research to determine the most appropriate modality for a nationally owned school feeding programme. The evaluation recognizes that USDA are currently supporting pilot projects on HGSF to assess the effectiveness of using local food commodities.
Choice of activities The FFE activities are appropriate to the Cambodian context, particularly the provision of incentive to prevent drop-out.
Alignment with national policies
School feeding activities are coherent with key Government policies and strategies. The FFE programme is implemented closely with MoE and other ministries.
Alignment with WFP strategies
School feeding is coherent with key WFP corporate policies.
Alignment with other development actors
The complementary FFE programme activities align with similar work by other agencies in the same locations. The ET found evidence of multiple other actors working in the USDA supported schools through different programmes with similar objectives.
Alignment with partner UN agencies and donor policies
The SMP objective is coherent with the partner United Nations agencies and other donor policies that are embedded within the SDGs.
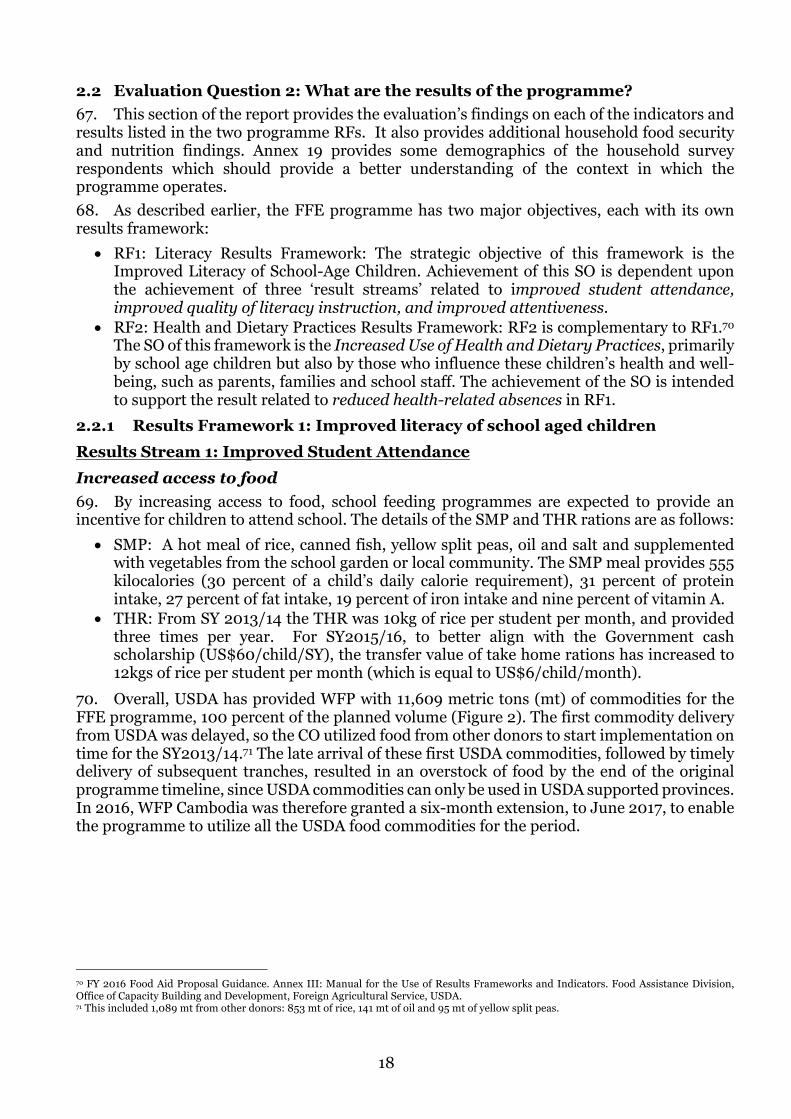
18
2.2 Evaluation Question 2: What are the results of the programme? 67. This section of the report provides the evaluation’s findings on each of the indicators and results listed in the two programme RFs. It also provides additional household food security and nutrition findings. Annex 19 provides some demographics of the household survey respondents which should provide a better understanding of the context in which the programme operates. 68. As described earlier, the FFE programme has two major objectives, each with its own results framework: • RF1: Literacy Results Framework: The strategic objective of this framework is the
Improved Literacy of School-Age Children. Achievement of this SO is dependent upon the achievement of three ‘result streams’ related to improved student attendance, improved quality of literacy instruction, and improved attentiveness.
• RF2: Health and Dietary Practices Results Framework: RF2 is complementary to RF1.70 The SO of this framework is the Increased Use of Health and Dietary Practices, primarily by school age children but also by those who influence these children’s health and well-being, such as parents, families and school staff. The achievement of the SO is intended to support the result related to reduced health-related absences in RF1.
2.2.1 Results Framework 1: Improved literacy of school aged children Results Stream 1: Improved Student Attendance Increased access to food 69. By increasing access to food, school feeding programmes are expected to provide an incentive for children to attend school. The details of the SMP and THR rations are as follows: • SMP: A hot meal of rice, canned fish, yellow split peas, oil and salt and supplemented
with vegetables from the school garden or local community. The SMP meal provides 555 kilocalories (30 percent of a child’s daily calorie requirement), 31 percent of protein intake, 27 percent of fat intake, 19 percent of iron intake and nine percent of vitamin A.
• THR: From SY 2013/14 the THR was 10kg of rice per student per month, and provided three times per year. For SY2015/16, to better align with the Government cash scholarship (US$60/child/SY), the transfer value of take home rations has increased to 12kgs of rice per student per month (which is equal to US$6/child/month).
70. Overall, USDA has provided WFP with 11,609 metric tons (mt) of commodities for the FFE programme, 100 percent of the planned volume (Figure 2). The first commodity delivery from USDA was delayed, so the CO utilized food from other donors to start implementation on time for the SY2013/14.71 The late arrival of these first USDA commodities, followed by timely delivery of subsequent tranches, resulted in an overstock of food by the end of the original programme timeline, since USDA commodities can only be used in USDA supported provinces. In 2016, WFP Cambodia was therefore granted a six-month extension, to June 2017, to enable the programme to utilize all the USDA food commodities for the period.
70 FY 2016 Food Aid Proposal Guidance. Annex III: Manual for the Use of Results Frameworks and Indicators. Food Assistance Division, Office of Capacity Building and Development, Foreign Agricultural Service, USDA. 71 This included 1,089 mt from other donors: 853 mt of rice, 141 mt of oil and 95 mt of yellow split peas.
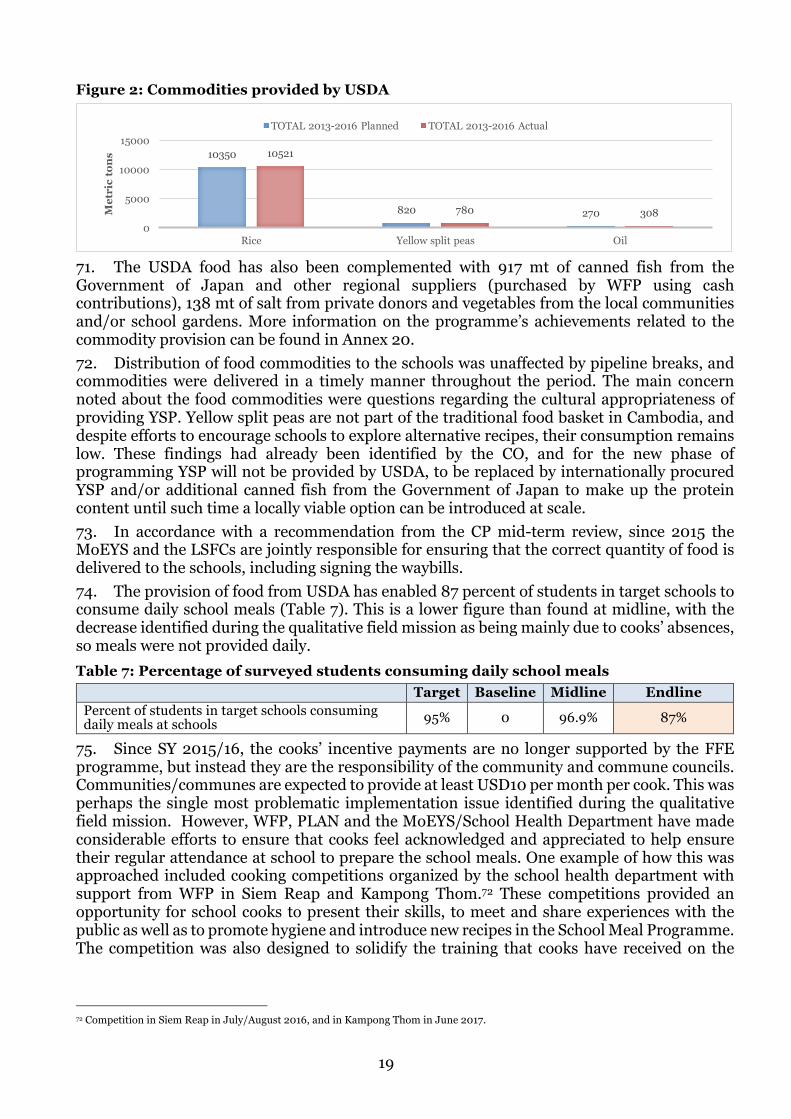
19
Figure 2: Commodities provided by USDA
71. The USDA food has also been complemented with 917 mt of canned fish from the Government of Japan and other regional suppliers (purchased by WFP using cash contributions), 138 mt of salt from private donors and vegetables from the local communities and/or school gardens. More information on the programme’s achievements related to the commodity provision can be found in Annex 20. 72. Distribution of food commodities to the schools was unaffected by pipeline breaks, and commodities were delivered in a timely manner throughout the period. The main concern noted about the food commodities were questions regarding the cultural appropriateness of providing YSP. Yellow split peas are not part of the traditional food basket in Cambodia, and despite efforts to encourage schools to explore alternative recipes, their consumption remains low. These findings had already been identified by the CO, and for the new phase of programming YSP will not be provided by USDA, to be replaced by internationally procured YSP and/or additional canned fish from the Government of Japan to make up the protein content until such time a locally viable option can be introduced at scale. 73. In accordance with a recommendation from the CP mid-term review, since 2015 the MoEYS and the LSFCs are jointly responsible for ensuring that the correct quantity of food is delivered to the schools, including signing the waybills. 74. The provision of food from USDA has enabled 87 percent of students in target schools to consume daily school meals (Table 7). This is a lower figure than found at midline, with the decrease identified during the qualitative field mission as being mainly due to cooks’ absences, so meals were not provided daily. Table 7: Percentage of surveyed students consuming daily school meals
Target Baseline Midline Endline Percent of students in target schools consuming daily meals at schools 95% 0 96.9% 87%
75. Since SY 2015/16, the cooks’ incentive payments are no longer supported by the FFE programme, but instead they are the responsibility of the community and commune councils. Communities/communes are expected to provide at least USD10 per month per cook. This was perhaps the single most problematic implementation issue identified during the qualitative field mission. However, WFP, PLAN and the MoEYS/School Health Department have made considerable efforts to ensure that cooks feel acknowledged and appreciated to help ensure their regular attendance at school to prepare the school meals. One example of how this was approached included cooking competitions organized by the school health department with support from WFP in Siem Reap and Kampong Thom.72 These competitions provided an opportunity for school cooks to present their skills, to meet and share experiences with the public as well as to promote hygiene and introduce new recipes in the School Meal Programme. The competition was also designed to solidify the training that cooks have received on the
72 Competition in Siem Reap in July/August 2016, and in Kampong Thom in June 2017.
10350
820 270
10521
780 3080
5000
10000
15000
Rice Yellow split peas Oil
Met
ric
ton
s
TOTAL 2013-2016 Planned TOTAL 2013-2016 Actual
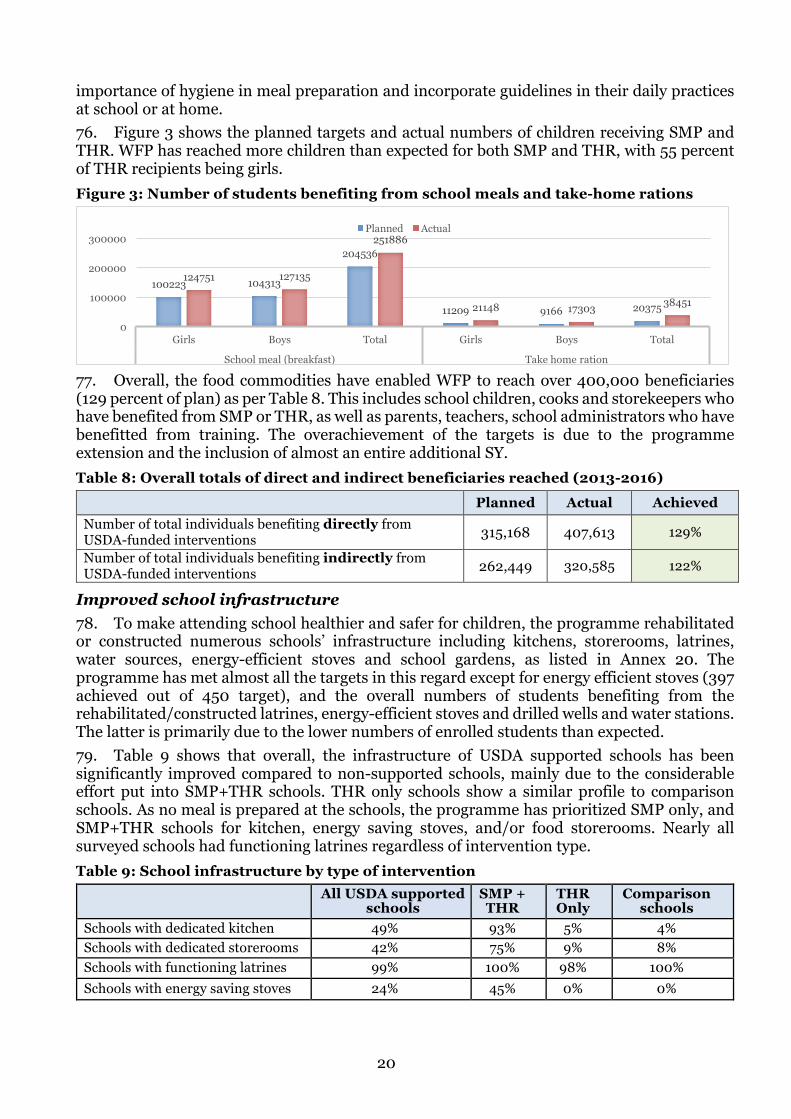
20
importance of hygiene in meal preparation and incorporate guidelines in their daily practices at school or at home. 76. Figure 3 shows the planned targets and actual numbers of children receiving SMP and THR. WFP has reached more children than expected for both SMP and THR, with 55 percent of THR recipients being girls. Figure 3: Number of students benefiting from school meals and take-home rations
77. Overall, the food commodities have enabled WFP to reach over 400,000 beneficiaries (129 percent of plan) as per Table 8. This includes school children, cooks and storekeepers who have benefited from SMP or THR, as well as parents, teachers, school administrators who have benefitted from training. The overachievement of the targets is due to the programme extension and the inclusion of almost an entire additional SY. Table 8: Overall totals of direct and indirect beneficiaries reached (2013-2016)
Planned Actual Achieved Number of total individuals benefiting directly from USDA-funded interventions 315,168 407,613 129%
Number of total individuals benefiting indirectly from USDA-funded interventions 262,449 320,585 122%
Improved school infrastructure 78. To make attending school healthier and safer for children, the programme rehabilitated or constructed numerous schools’ infrastructure including kitchens, storerooms, latrines, water sources, energy-efficient stoves and school gardens, as listed in Annex 20. The programme has met almost all the targets in this regard except for energy efficient stoves (397 achieved out of 450 target), and the overall numbers of students benefiting from the rehabilitated/constructed latrines, energy-efficient stoves and drilled wells and water stations. The latter is primarily due to the lower numbers of enrolled students than expected. 79. Table 9 shows that overall, the infrastructure of USDA supported schools has been significantly improved compared to non-supported schools, mainly due to the considerable effort put into SMP+THR schools. THR only schools show a similar profile to comparison schools. As no meal is prepared at the schools, the programme has prioritized SMP only, and SMP+THR schools for kitchen, energy saving stoves, and/or food storerooms. Nearly all surveyed schools had functioning latrines regardless of intervention type. Table 9: School infrastructure by type of intervention
All USDA supported schools
SMP + THR
THR Only
Comparison schools
Schools with dedicated kitchen 49% 93% 5% 4% Schools with dedicated storerooms 42% 75% 9% 8% Schools with functioning latrines 99% 100% 98% 100% Schools with energy saving stoves 24% 45% 0% 0%
100223 104313
204536
11209 9166 20375
124751 127135
251886
21148 17303 38451
0
100000
200000
300000
Girls Boys Total Girls Boys Total
School meal (breakfast) Take home ration
Planned Actual
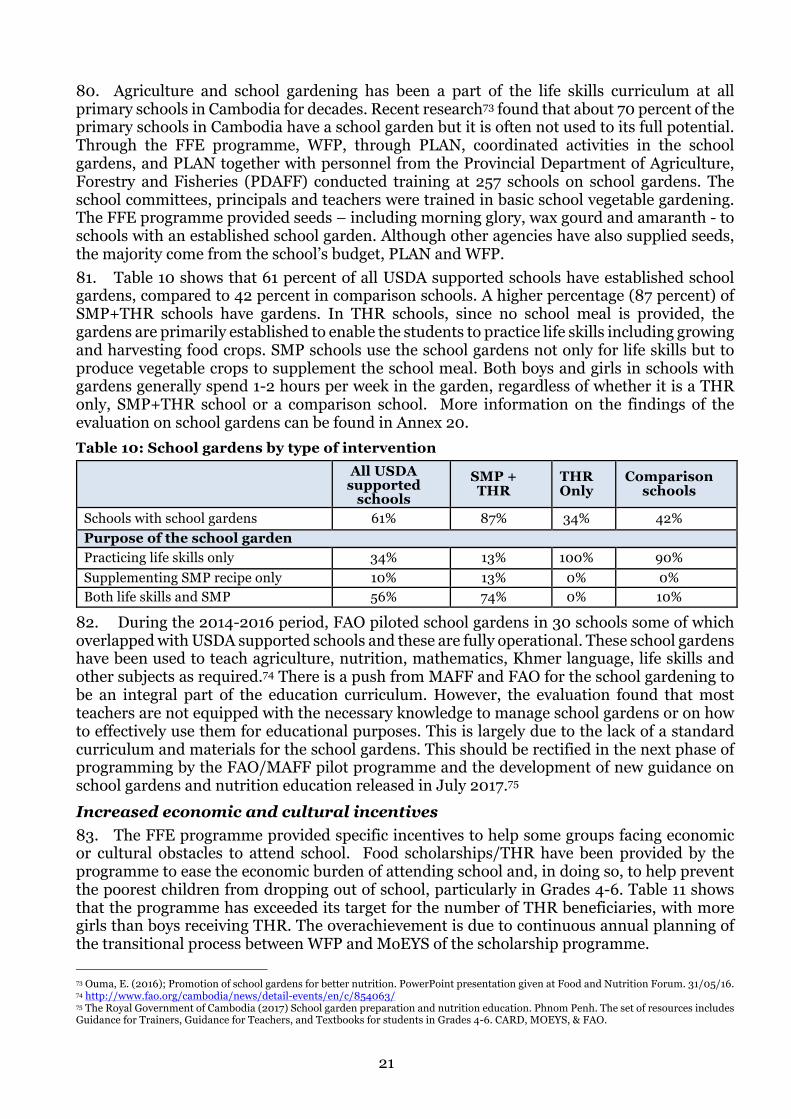
21
80. Agriculture and school gardening has been a part of the life skills curriculum at all primary schools in Cambodia for decades. Recent research73 found that about 70 percent of the primary schools in Cambodia have a school garden but it is often not used to its full potential. Through the FFE programme, WFP, through PLAN, coordinated activities in the school gardens, and PLAN together with personnel from the Provincial Department of Agriculture, Forestry and Fisheries (PDAFF) conducted training at 257 schools on school gardens. The school committees, principals and teachers were trained in basic school vegetable gardening. The FFE programme provided seeds – including morning glory, wax gourd and amaranth - to schools with an established school garden. Although other agencies have also supplied seeds, the majority come from the school’s budget, PLAN and WFP. 81. Table 10 shows that 61 percent of all USDA supported schools have established school gardens, compared to 42 percent in comparison schools. A higher percentage (87 percent) of SMP+THR schools have gardens. In THR schools, since no school meal is provided, the gardens are primarily established to enable the students to practice life skills including growing and harvesting food crops. SMP schools use the school gardens not only for life skills but to produce vegetable crops to supplement the school meal. Both boys and girls in schools with gardens generally spend 1-2 hours per week in the garden, regardless of whether it is a THR only, SMP+THR school or a comparison school. More information on the findings of the evaluation on school gardens can be found in Annex 20. Table 10: School gardens by type of intervention
All USDA supported
schools SMP + THR
THR Only
Comparison schools
Schools with school gardens 61% 87% 34% 42% Purpose of the school garden Practicing life skills only 34% 13% 100% 90% Supplementing SMP recipe only 10% 13% 0% 0% Both life skills and SMP 56% 74% 0% 10%
82. During the 2014-2016 period, FAO piloted school gardens in 30 schools some of which overlapped with USDA supported schools and these are fully operational. These school gardens have been used to teach agriculture, nutrition, mathematics, Khmer language, life skills and other subjects as required.74 There is a push from MAFF and FAO for the school gardening to be an integral part of the education curriculum. However, the evaluation found that most teachers are not equipped with the necessary knowledge to manage school gardens or on how to effectively use them for educational purposes. This is largely due to the lack of a standard curriculum and materials for the school gardens. This should be rectified in the next phase of programming by the FAO/MAFF pilot programme and the development of new guidance on school gardens and nutrition education released in July 2017.75 Increased economic and cultural incentives 83. The FFE programme provided specific incentives to help some groups facing economic or cultural obstacles to attend school. Food scholarships/THR have been provided by the programme to ease the economic burden of attending school and, in doing so, to help prevent the poorest children from dropping out of school, particularly in Grades 4-6. Table 11 shows that the programme has exceeded its target for the number of THR beneficiaries, with more girls than boys receiving THR. The overachievement is due to continuous annual planning of the transitional process between WFP and MoEYS of the scholarship programme. 73 Ouma, E. (2016); Promotion of school gardens for better nutrition. PowerPoint presentation given at Food and Nutrition Forum. 31/05/16. 74 http://www.fao.org/cambodia/news/detail-events/en/c/854063/ 75 The Royal Government of Cambodia (2017) School garden preparation and nutrition education. Phnom Penh. The set of resources includes Guidance for Trainers, Guidance for Teachers, and Textbooks for students in Grades 4-6. CARD, MOEYS, & FAO.
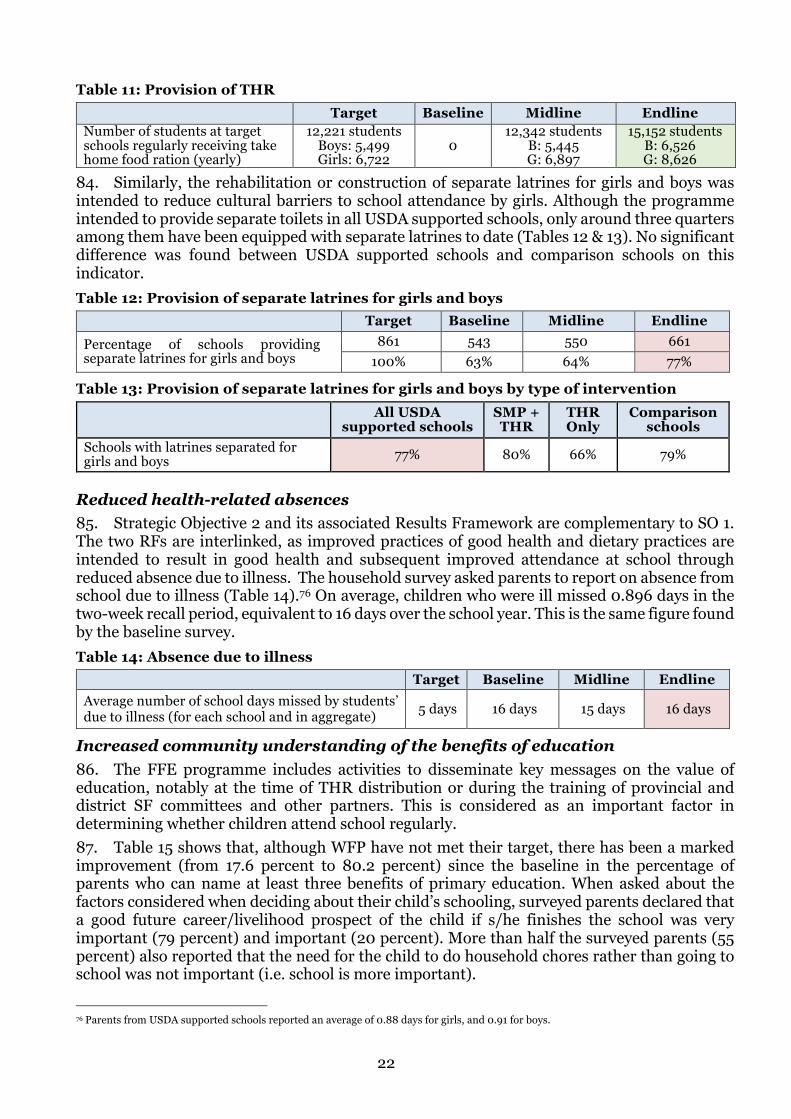
22
Table 11: Provision of THR Target Baseline Midline Endline Number of students at target schools regularly receiving take home food ration (yearly)
12,221 students Boys: 5,499 Girls: 6,722
0 12,342 students
B: 5,445 G: 6,897
15,152 students B: 6,526 G: 8,626
84. Similarly, the rehabilitation or construction of separate latrines for girls and boys was intended to reduce cultural barriers to school attendance by girls. Although the programme intended to provide separate toilets in all USDA supported schools, only around three quarters among them have been equipped with separate latrines to date (Tables 12 & 13). No significant difference was found between USDA supported schools and comparison schools on this indicator. Table 12: Provision of separate latrines for girls and boys
Target Baseline Midline Endline Percentage of schools providing separate latrines for girls and boys
861 543 550 661 100% 63% 64% 77%
Table 13: Provision of separate latrines for girls and boys by type of intervention
All USDA supported schools
SMP + THR
THR Only
Comparison schools
Schools with latrines separated for girls and boys 77% 80% 66% 79%
Reduced health-related absences 85. Strategic Objective 2 and its associated Results Framework are complementary to SO 1. The two RFs are interlinked, as improved practices of good health and dietary practices are intended to result in good health and subsequent improved attendance at school through reduced absence due to illness. The household survey asked parents to report on absence from school due to illness (Table 14).76 On average, children who were ill missed 0.896 days in the two-week recall period, equivalent to 16 days over the school year. This is the same figure found by the baseline survey. Table 14: Absence due to illness
Target Baseline Midline Endline Average number of school days missed by students’ due to illness (for each school and in aggregate) 5 days 16 days 15 days 16 days
Increased community understanding of the benefits of education 86. The FFE programme includes activities to disseminate key messages on the value of education, notably at the time of THR distribution or during the training of provincial and district SF committees and other partners. This is considered as an important factor in determining whether children attend school regularly. 87. Table 15 shows that, although WFP have not met their target, there has been a marked improvement (from 17.6 percent to 80.2 percent) since the baseline in the percentage of parents who can name at least three benefits of primary education. When asked about the factors considered when deciding about their child’s schooling, surveyed parents declared that a good future career/livelihood prospect of the child if s/he finishes the school was very important (79 percent) and important (20 percent). More than half the surveyed parents (55 percent) also reported that the need for the child to do household chores rather than going to school was not important (i.e. school is more important).
76 Parents from USDA supported schools reported an average of 0.88 days for girls, and 0.91 for boys.
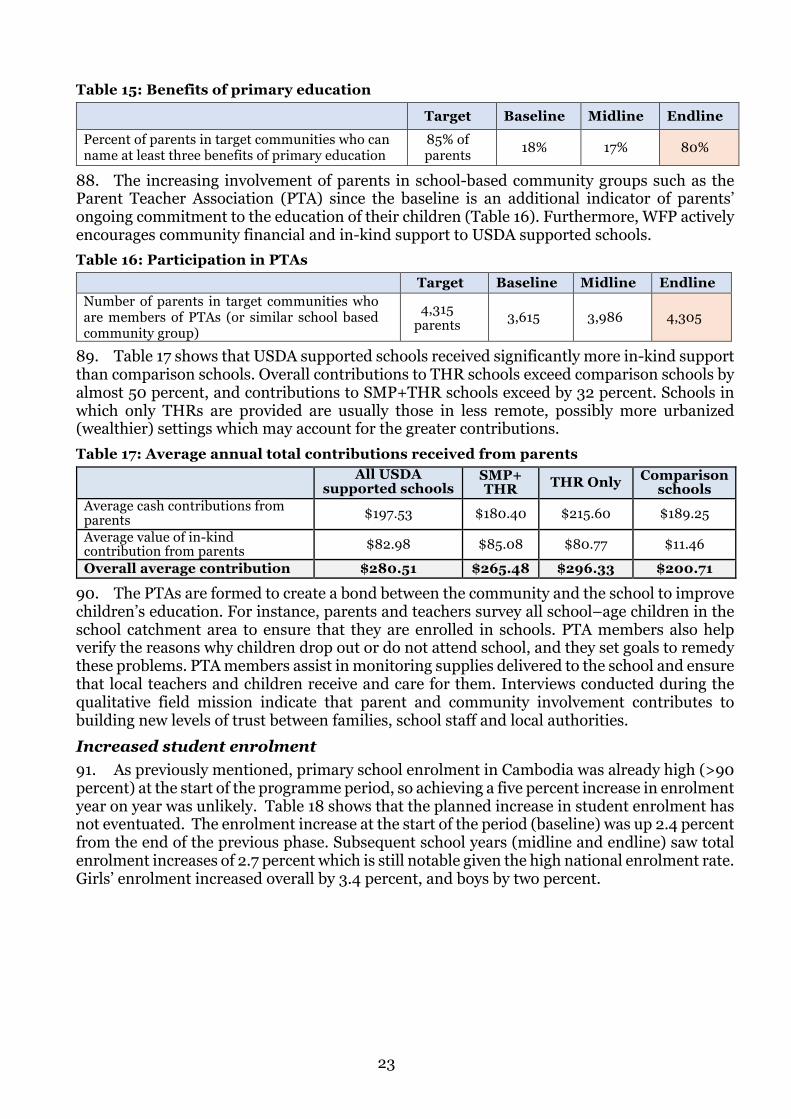
23
Table 15: Benefits of primary education
Target Baseline Midline Endline Percent of parents in target communities who can name at least three benefits of primary education
85% of parents 18% 17% 80%
88. The increasing involvement of parents in school-based community groups such as the Parent Teacher Association (PTA) since the baseline is an additional indicator of parents’ ongoing commitment to the education of their children (Table 16). Furthermore, WFP actively encourages community financial and in-kind support to USDA supported schools. Table 16: Participation in PTAs
Target Baseline Midline Endline Number of parents in target communities who are members of PTAs (or similar school based community group)
4,315 parents 3,615 3,986 4,305
89. Table 17 shows that USDA supported schools received significantly more in-kind support than comparison schools. Overall contributions to THR schools exceed comparison schools by almost 50 percent, and contributions to SMP+THR schools exceed by 32 percent. Schools in which only THRs are provided are usually those in less remote, possibly more urbanized (wealthier) settings which may account for the greater contributions. Table 17: Average annual total contributions received from parents
All USDA supported schools
SMP+ THR THR Only Comparison
schools Average cash contributions from parents $197.53 $180.40 $215.60 $189.25 Average value of in-kind contribution from parents $82.98 $85.08 $80.77 $11.46
Overall average contribution $280.51 $265.48 $296.33 $200.71
90. The PTAs are formed to create a bond between the community and the school to improve children’s education. For instance, parents and teachers survey all school–age children in the school catchment area to ensure that they are enrolled in schools. PTA members also help verify the reasons why children drop out or do not attend school, and they set goals to remedy these problems. PTA members assist in monitoring supplies delivered to the school and ensure that local teachers and children receive and care for them. Interviews conducted during the qualitative field mission indicate that parent and community involvement contributes to building new levels of trust between families, school staff and local authorities. Increased student enrolment 91. As previously mentioned, primary school enrolment in Cambodia was already high (>90 percent) at the start of the programme period, so achieving a five percent increase in enrolment year on year was unlikely. Table 18 shows that the planned increase in student enrolment has not eventuated. The enrolment increase at the start of the period (baseline) was up 2.4 percent from the end of the previous phase. Subsequent school years (midline and endline) saw total enrolment increases of 2.7 percent which is still notable given the high national enrolment rate. Girls’ enrolment increased overall by 3.4 percent, and boys by two percent.
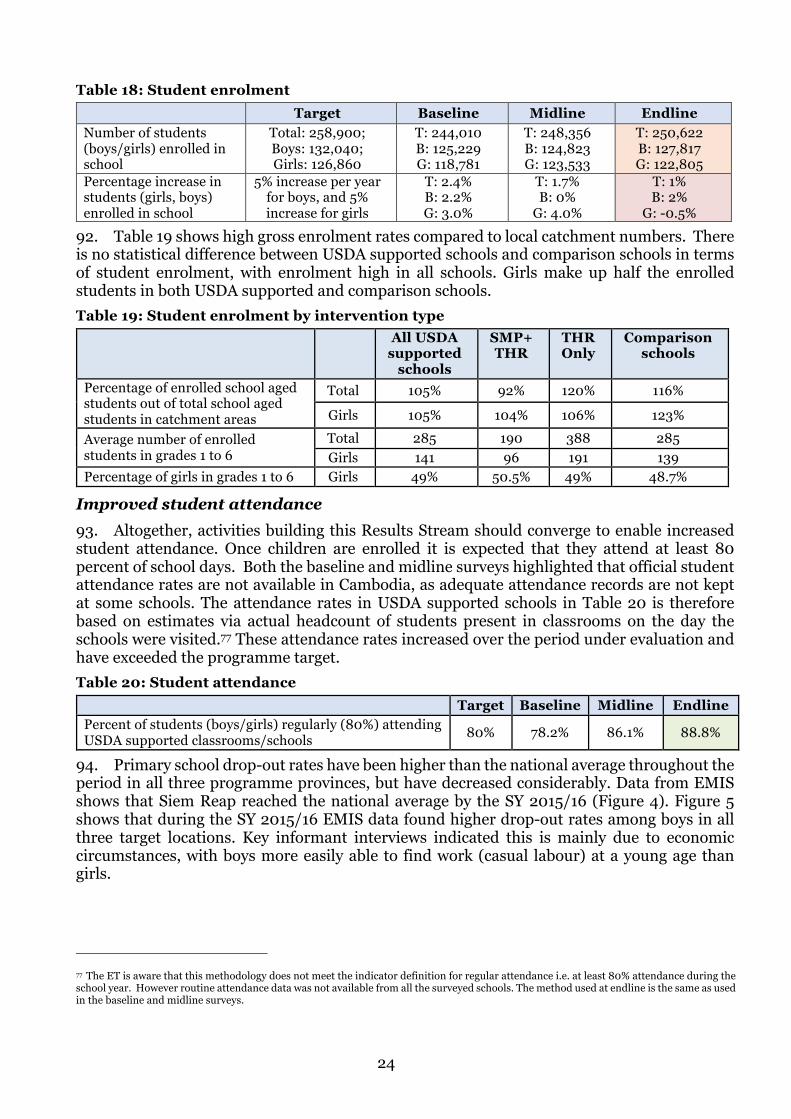
24
Table 18: Student enrolment Target Baseline Midline Endline
Number of students (boys/girls) enrolled in school
Total: 258,900; Boys: 132,040; Girls: 126,860
T: 244,010 B: 125,229 G: 118,781
T: 248,356 B: 124,823 G: 123,533
T: 250,622 B: 127,817 G: 122,805
Percentage increase in students (girls, boys) enrolled in school
5% increase per year for boys, and 5% increase for girls
T: 2.4% B: 2.2% G: 3.0%
T: 1.7% B: 0%
G: 4.0%
T: 1% B: 2%
G: -0.5%
92. Table 19 shows high gross enrolment rates compared to local catchment numbers. There is no statistical difference between USDA supported schools and comparison schools in terms of student enrolment, with enrolment high in all schools. Girls make up half the enrolled students in both USDA supported and comparison schools. Table 19: Student enrolment by intervention type
All USDA supported
schools
SMP+ THR
THR Only
Comparison schools
Percentage of enrolled school aged students out of total school aged students in catchment areas
Total 105% 92% 120% 116%
Girls 105% 104% 106% 123%
Average number of enrolled students in grades 1 to 6
Total 285 190 388 285 Girls 141 96 191 139
Percentage of girls in grades 1 to 6 Girls 49% 50.5% 49% 48.7%
Improved student attendance 93. Altogether, activities building this Results Stream should converge to enable increased student attendance. Once children are enrolled it is expected that they attend at least 80 percent of school days. Both the baseline and midline surveys highlighted that official student attendance rates are not available in Cambodia, as adequate attendance records are not kept at some schools. The attendance rates in USDA supported schools in Table 20 is therefore based on estimates via actual headcount of students present in classrooms on the day the schools were visited.77 These attendance rates increased over the period under evaluation and have exceeded the programme target. Table 20: Student attendance
Target Baseline Midline Endline Percent of students (boys/girls) regularly (80%) attending USDA supported classrooms/schools 80% 78.2% 86.1% 88.8%
94. Primary school drop-out rates have been higher than the national average throughout the period in all three programme provinces, but have decreased considerably. Data from EMIS shows that Siem Reap reached the national average by the SY 2015/16 (Figure 4). Figure 5 shows that during the SY 2015/16 EMIS data found higher drop-out rates among boys in all three target locations. Key informant interviews indicated this is mainly due to economic circumstances, with boys more easily able to find work (casual labour) at a young age than girls.
77 The ET is aware that this methodology does not meet the indicator definition for regular attendance i.e. at least 80% attendance during the school year. However routine attendance data was not available from all the surveyed schools. The method used at endline is the same as used in the baseline and midline surveys.
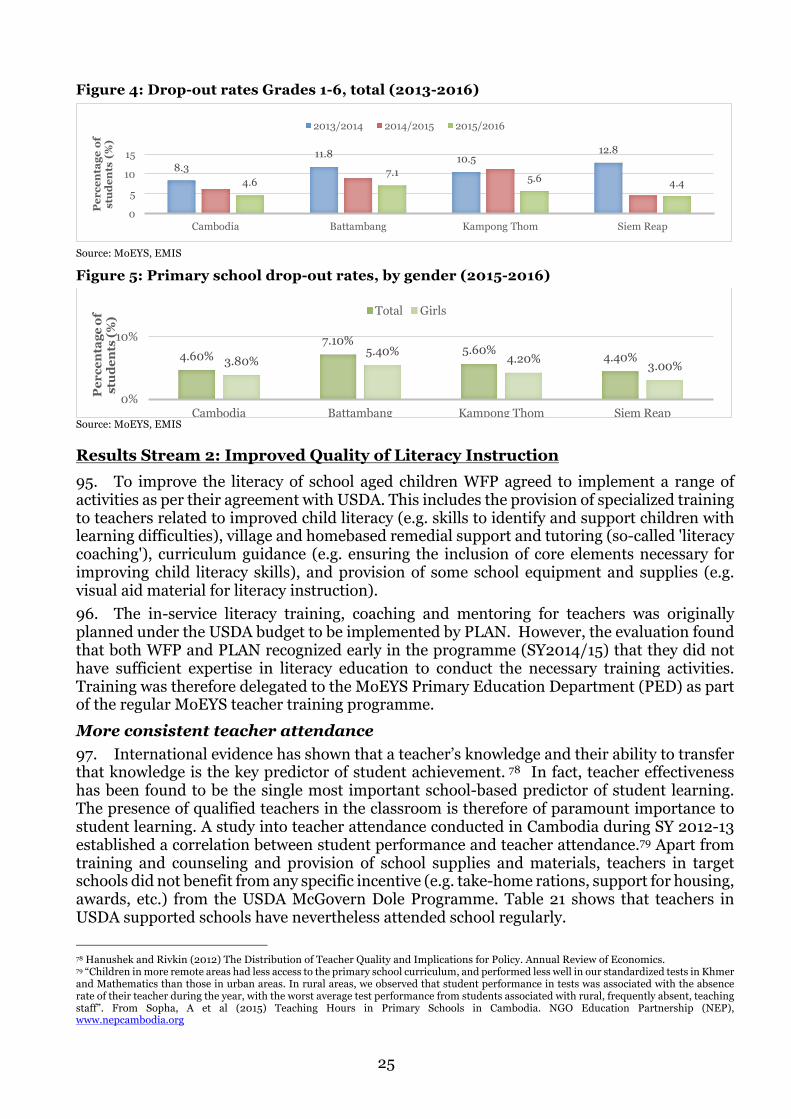
25
Figure 4: Drop-out rates Grades 1-6, total (2013-2016)
Source: MoEYS, EMIS
Figure 5: Primary school drop-out rates, by gender (2015-2016)
Source: MoEYS, EMIS
Results Stream 2: Improved Quality of Literacy Instruction 95. To improve the literacy of school aged children WFP agreed to implement a range of activities as per their agreement with USDA. This includes the provision of specialized training to teachers related to improved child literacy (e.g. skills to identify and support children with learning difficulties), village and homebased remedial support and tutoring (so-called 'literacy coaching'), curriculum guidance (e.g. ensuring the inclusion of core elements necessary for improving child literacy skills), and provision of some school equipment and supplies (e.g. visual aid material for literacy instruction). 96. The in-service literacy training, coaching and mentoring for teachers was originally planned under the USDA budget to be implemented by PLAN. However, the evaluation found that both WFP and PLAN recognized early in the programme (SY2014/15) that they did not have sufficient expertise in literacy education to conduct the necessary training activities. Training was therefore delegated to the MoEYS Primary Education Department (PED) as part of the regular MoEYS teacher training programme. More consistent teacher attendance 97. International evidence has shown that a teacher’s knowledge and their ability to transfer that knowledge is the key predictor of student achievement. 78 In fact, teacher effectiveness has been found to be the single most important school-based predictor of student learning. The presence of qualified teachers in the classroom is therefore of paramount importance to student learning. A study into teacher attendance conducted in Cambodia during SY 2012-13 established a correlation between student performance and teacher attendance.79 Apart from training and counseling and provision of school supplies and materials, teachers in target schools did not benefit from any specific incentive (e.g. take-home rations, support for housing, awards, etc.) from the USDA McGovern Dole Programme. Table 21 shows that teachers in USDA supported schools have nevertheless attended school regularly. 78 Hanushek and Rivkin (2012) The Distribution of Teacher Quality and Implications for Policy. Annual Review of Economics. 79 “Children in more remote areas had less access to the primary school curriculum, and performed less well in our standardized tests in Khmer and Mathematics than those in urban areas. In rural areas, we observed that student performance in tests was associated with the absence rate of their teacher during the year, with the worst average test performance from students associated with rural, frequently absent, teaching staff”. From Sopha, A et al (2015) Teaching Hours in Primary Schools in Cambodia. NGO Education Partnership (NEP), www.nepcambodia.org
8.311.8 10.5
12.8
4.67.1 5.6 4.4
0
5
10
15
Cambodia Battambang Kampong Thom Siem Reap
Per
cen
tage
of
stud
ents
(%
)
2013/2014 2014/2015 2015/2016
4.60%7.10%
5.60% 4.40%3.80%5.40% 4.20% 3.00%
0%
10%
Cambodia Battambang Kampong Thom Siem Reap
Per
cent
age
of
stud
ents
(%) Total Girls
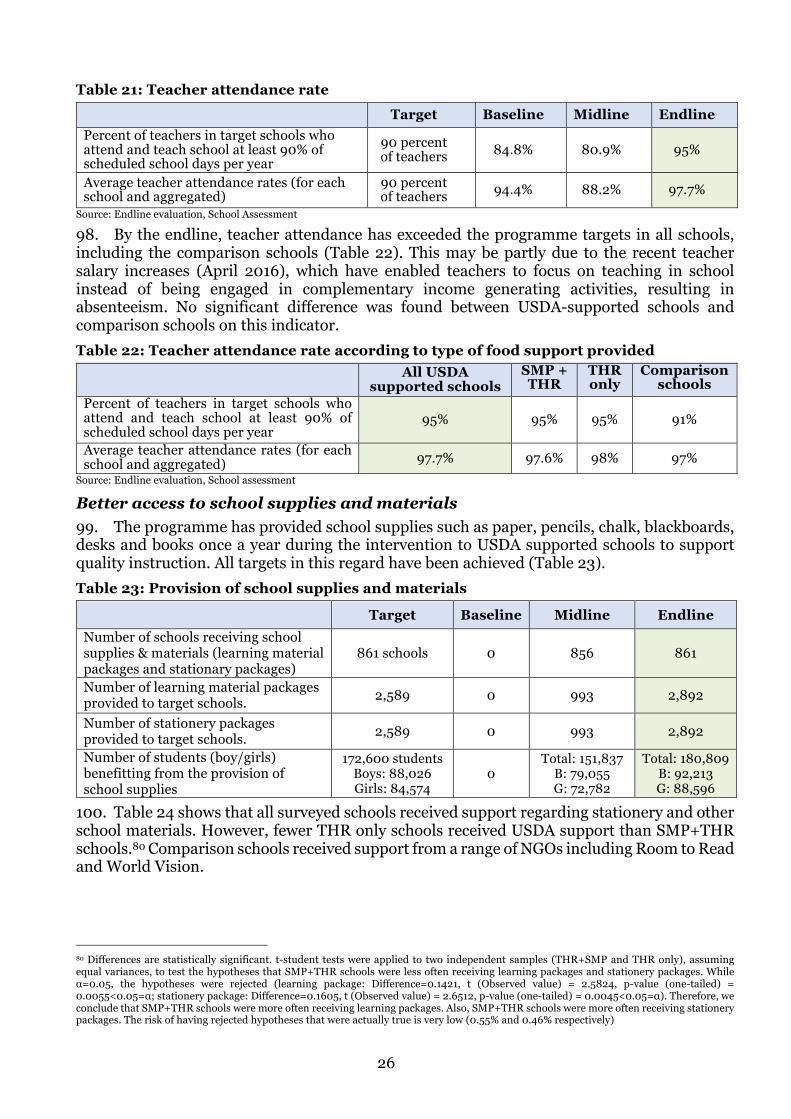
26
Table 21: Teacher attendance rate Target Baseline Midline Endline
Percent of teachers in target schools who attend and teach school at least 90% of scheduled school days per year
90 percent of teachers 84.8% 80.9% 95%
Average teacher attendance rates (for each school and aggregated)
90 percent of teachers 94.4% 88.2% 97.7%
Source: Endline evaluation, School Assessment
98. By the endline, teacher attendance has exceeded the programme targets in all schools, including the comparison schools (Table 22). This may be partly due to the recent teacher salary increases (April 2016), which have enabled teachers to focus on teaching in school instead of being engaged in complementary income generating activities, resulting in absenteeism. No significant difference was found between USDA-supported schools and comparison schools on this indicator. Table 22: Teacher attendance rate according to type of food support provided
All USDA supported schools
SMP + THR
THR only
Comparison schools
Percent of teachers in target schools who attend and teach school at least 90% of scheduled school days per year
95% 95% 95% 91%
Average teacher attendance rates (for each school and aggregated) 97.7% 97.6% 98% 97%
Source: Endline evaluation, School assessment
Better access to school supplies and materials 99. The programme has provided school supplies such as paper, pencils, chalk, blackboards, desks and books once a year during the intervention to USDA supported schools to support quality instruction. All targets in this regard have been achieved (Table 23). Table 23: Provision of school supplies and materials
Target Baseline Midline Endline Number of schools receiving school supplies & materials (learning material packages and stationary packages)
861 schools 0 856 861
Number of learning material packages provided to target schools. 2,589 0 993 2,892
Number of stationery packages provided to target schools. 2,589 0 993 2,892
Number of students (boy/girls) benefitting from the provision of school supplies
172,600 students Boys: 88,026 Girls: 84,574
0 Total: 151,837
B: 79,055 G: 72,782
Total: 180,809 B: 92,213 G: 88,596
100. Table 24 shows that all surveyed schools received support regarding stationery and other school materials. However, fewer THR only schools received USDA support than SMP+THR schools.80 Comparison schools received support from a range of NGOs including Room to Read and World Vision.
80 Differences are statistically significant. t-student tests were applied to two independent samples (THR+SMP and THR only), assuming equal variances, to test the hypotheses that SMP+THR schools were less often receiving learning packages and stationery packages. While α=0.05, the hypotheses were rejected (learning package: Difference=0.1421, t (Observed value) = 2.5824, p-value (one-tailed) = 0.0055<0.05=α; stationery package: Difference=0.1605, t (Observed value) = 2.6512, p-value (one-tailed) = 0.0045<0.05=α). Therefore, we conclude that SMP+THR schools were more often receiving learning packages. Also, SMP+THR schools were more often receiving stationery packages. The risk of having rejected hypotheses that were actually true is very low (0.55% and 0.46% respectively)

27
Table 24: Provision of learning package at endline by type of intervention
All USDA supported schools
SMP + THR
THR only
Comparison schools
Schools receiving learning package 89% 97% 82% 100% Schools receiving stationery package 86% 95% 78% 100% Classrooms with adequate literacy materials 92% 92% 93% 98%
Improved literacy instructional materials 101. The national literacy curriculum (NLC) and related instructional materials were provided to teachers in USDA supported schools, and classrooms equipped with literacy materials for improved instruction. The midline survey highlighted that while there was an increasing utilization of the NLC by teachers after two years of programme implementation, the number of classrooms with sufficient literacy instructional materials was decreasing. This has now been addressed, with more classrooms with more materials than planned (Table 24). The percentage of teachers using the NLC showed a considerable decline from 75 percent at midline to only 9.3 percent at endline (Table 25). This decrease can be explained by the MoEYS effectively changing the curriculum at the start of SY 2016/17, and shifting the focus to basic Early Grade Reading (EGR) pedagogy to align with the introduction of the new governmental National Reading Standards (Benchmarks) and associated assessment workbooks for Grades 1 and 2, and Guidelines for Grade 3. The curriculum being measured at baseline and at endline are therefore not the same, and cannot be directly compared. Table 25: Literacy materials and curriculum supply and utilization
Target Baseline Midline Endline Number of classrooms in target schools with literacy instructional materials sufficient for effective instruction
3,452 classrooms 2,969 2,645 4,788
Percentage of teachers using the national literacy curriculum and the related instrumental materials
85 percent of teachers 59.8% 75% 9.3%
Increased skills and knowledge of teachers 102. With support from the PED, the programme has met, or almost met, its planned targets for all these activities (Table 26). For the next phase of programme (2017-2019) WFP will partner with World Education and KAPE to support the implementation of the new EGR literacy curriculum. More information on this new partnership can be found in Annex 21. Table 26: Teacher training
Target Baseline Midline Endline
Number of teachers/educators/ teaching assistants trained of certified.
5,178 teachers/ educators/ teaching
assistants 664 3,162 4,867
Number of teachers/educators/ teaching assistants who successfully completed in service or received intensive coaching or mentoring
5,178 teachers/ educators/ teaching
assistants 0 3,257 4,867
Number of teachers in target schools with recognized teacher certification credentials
3,452 1,976 2,787 3,894
Increased skills and knowledge of School Administrators 103. Training for School Administrators/Directors was organized with support of either PLAN or the PED on topics such as administrative management, leadership, classroom management, problem solving, creation of study games, use of multiple resources, reading development, writing development, assessment of student learning achievements, support to slow learners,
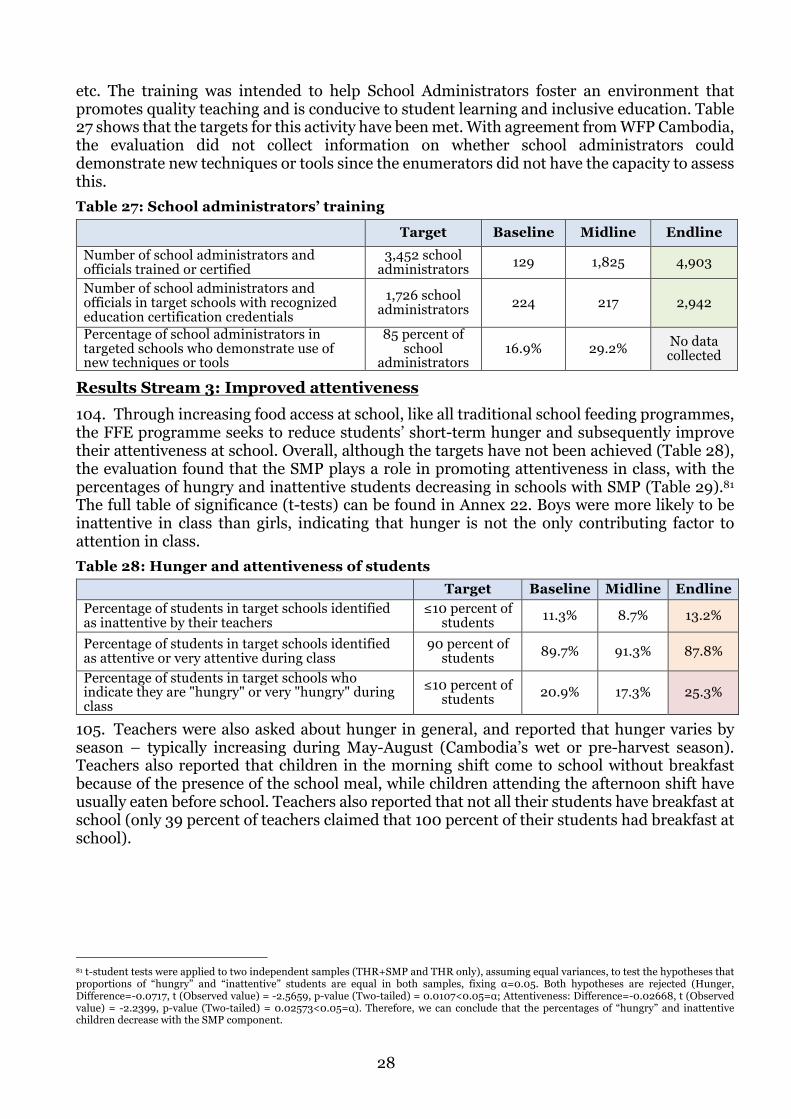
28
etc. The training was intended to help School Administrators foster an environment that promotes quality teaching and is conducive to student learning and inclusive education. Table 27 shows that the targets for this activity have been met. With agreement from WFP Cambodia, the evaluation did not collect information on whether school administrators could demonstrate new techniques or tools since the enumerators did not have the capacity to assess this. Table 27: School administrators’ training
Target Baseline Midline Endline Number of school administrators and officials trained or certified
3,452 school administrators 129 1,825 4,903
Number of school administrators and officials in target schools with recognized education certification credentials
1,726 school administrators 224 217 2,942
Percentage of school administrators in targeted schools who demonstrate use of new techniques or tools
85 percent of school
administrators 16.9% 29.2% No data
collected
Results Stream 3: Improved attentiveness 104. Through increasing food access at school, like all traditional school feeding programmes, the FFE programme seeks to reduce students’ short-term hunger and subsequently improve their attentiveness at school. Overall, although the targets have not been achieved (Table 28), the evaluation found that the SMP plays a role in promoting attentiveness in class, with the percentages of hungry and inattentive students decreasing in schools with SMP (Table 29).81 The full table of significance (t-tests) can be found in Annex 22. Boys were more likely to be inattentive in class than girls, indicating that hunger is not the only contributing factor to attention in class. Table 28: Hunger and attentiveness of students
Target Baseline Midline Endline Percentage of students in target schools identified as inattentive by their teachers
≤10 percent of students 11.3% 8.7% 13.2%
Percentage of students in target schools identified as attentive or very attentive during class
90 percent of students 89.7% 91.3% 87.8%
Percentage of students in target schools who indicate they are "hungry" or very "hungry" during class
≤10 percent of students 20.9% 17.3% 25.3%
105. Teachers were also asked about hunger in general, and reported that hunger varies by season – typically increasing during May-August (Cambodia’s wet or pre-harvest season). Teachers also reported that children in the morning shift come to school without breakfast because of the presence of the school meal, while children attending the afternoon shift have usually eaten before school. Teachers also reported that not all their students have breakfast at school (only 39 percent of teachers claimed that 100 percent of their students had breakfast at school).
81 t-student tests were applied to two independent samples (THR+SMP and THR only), assuming equal variances, to test the hypotheses that proportions of “hungry” and “inattentive” students are equal in both samples, fixing α=0.05. Both hypotheses are rejected (Hunger, Difference=-0.0717, t (Observed value) = -2.5659, p-value (Two-tailed) = 0.0107<0.05=α; Attentiveness: Difference=-0.02668, t (Observed value) = -2.2399, p-value (Two-tailed) = 0.02573<0.05=α). Therefore, we can conclude that the percentages of “hungry” and inattentive children decrease with the SMP component.
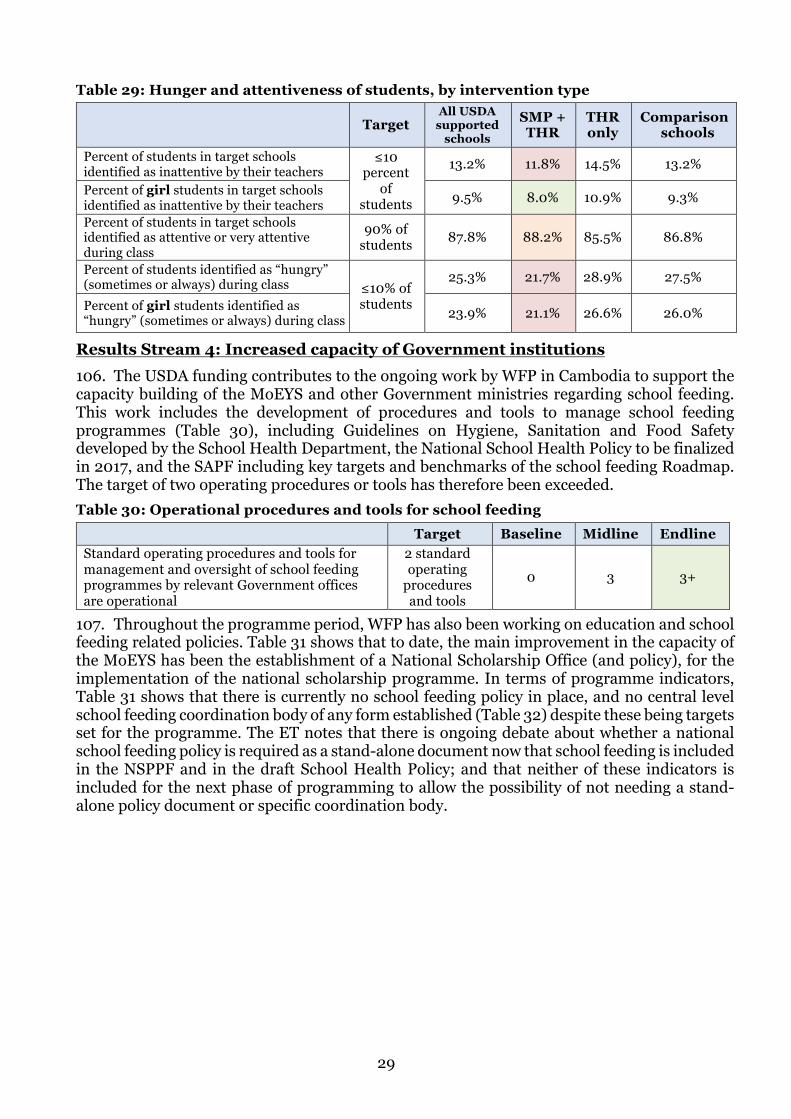
29
Table 29: Hunger and attentiveness of students, by intervention type
Target All USDA
supported schools
SMP + THR
THR only
Comparison schools
Percent of students in target schools identified as inattentive by their teachers
≤10 percent
of students
13.2% 11.8% 14.5% 13.2%
Percent of girl students in target schools identified as inattentive by their teachers 9.5% 8.0% 10.9% 9.3%
Percent of students in target schools identified as attentive or very attentive during class
90% of students 87.8% 88.2% 85.5% 86.8%
Percent of students identified as “hungry” (sometimes or always) during class ≤10% of
students
25.3% 21.7% 28.9% 27.5%
Percent of girl students identified as “hungry” (sometimes or always) during class 23.9% 21.1% 26.6% 26.0%
Results Stream 4: Increased capacity of Government institutions 106. The USDA funding contributes to the ongoing work by WFP in Cambodia to support the capacity building of the MoEYS and other Government ministries regarding school feeding. This work includes the development of procedures and tools to manage school feeding programmes (Table 30), including Guidelines on Hygiene, Sanitation and Food Safety developed by the School Health Department, the National School Health Policy to be finalized in 2017, and the SAPF including key targets and benchmarks of the school feeding Roadmap. The target of two operating procedures or tools has therefore been exceeded. Table 30: Operational procedures and tools for school feeding
Target Baseline Midline Endline Standard operating procedures and tools for management and oversight of school feeding programmes by relevant Government offices are operational
2 standard operating
procedures and tools
0 3 3+
107. Throughout the programme period, WFP has also been working on education and school feeding related policies. Table 31 shows that to date, the main improvement in the capacity of the MoEYS has been the establishment of a National Scholarship Office (and policy), for the implementation of the national scholarship programme. In terms of programme indicators, Table 31 shows that there is currently no school feeding policy in place, and no central level school feeding coordination body of any form established (Table 32) despite these being targets set for the programme. The ET notes that there is ongoing debate about whether a national school feeding policy is required as a stand-alone document now that school feeding is included in the NSPPF and in the draft School Health Policy; and that neither of these indicators is included for the next phase of programming to allow the possibility of not needing a stand-alone policy document or specific coordination body.
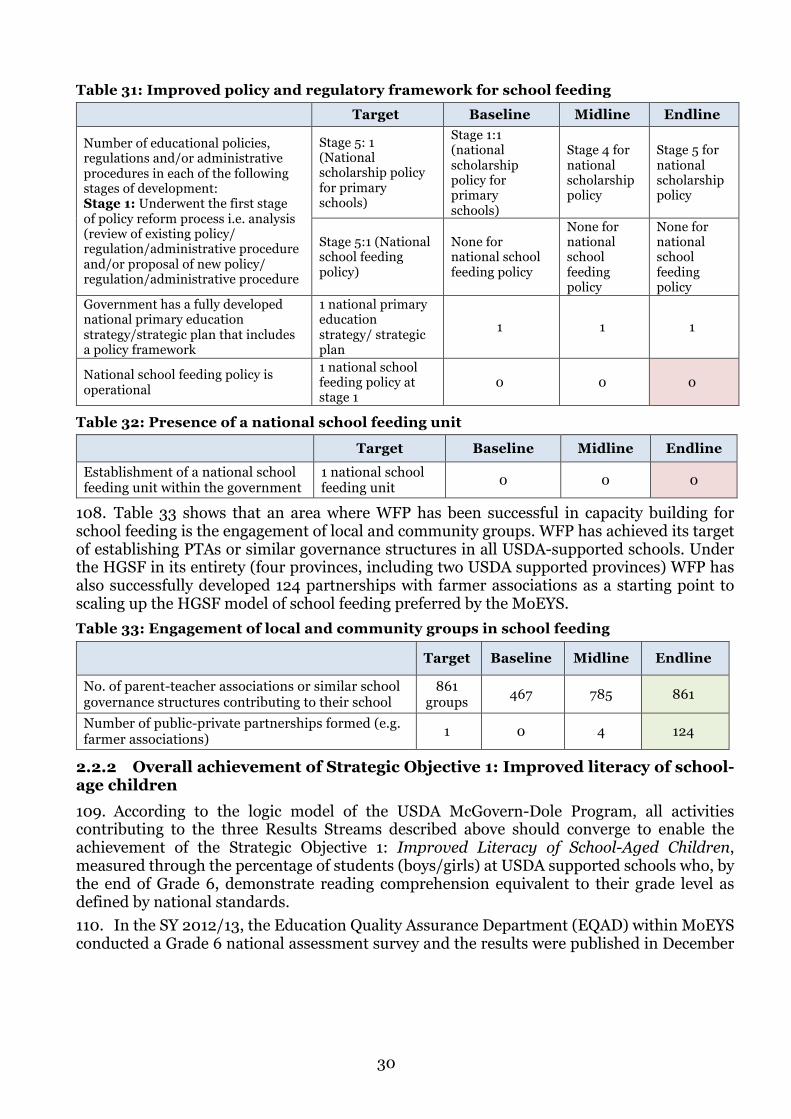
30
Table 31: Improved policy and regulatory framework for school feeding Target Baseline Midline Endline
Number of educational policies, regulations and/or administrative procedures in each of the following stages of development: Stage 1: Underwent the first stage of policy reform process i.e. analysis (review of existing policy/ regulation/administrative procedure and/or proposal of new policy/ regulation/administrative procedure
Stage 5: 1 (National scholarship policy for primary schools)
Stage 1:1 (national scholarship policy for primary schools)
Stage 4 for national scholarship policy
Stage 5 for national scholarship policy
Stage 5:1 (National school feeding policy)
None for national school feeding policy
None for national school feeding policy
None for national school feeding policy
Government has a fully developed national primary education strategy/strategic plan that includes a policy framework
1 national primary education strategy/ strategic plan
1 1 1
National school feeding policy is operational
1 national school feeding policy at stage 1
0 0 0
Table 32: Presence of a national school feeding unit
Target Baseline Midline Endline Establishment of a national school feeding unit within the government
1 national school feeding unit 0 0 0
108. Table 33 shows that an area where WFP has been successful in capacity building for school feeding is the engagement of local and community groups. WFP has achieved its target of establishing PTAs or similar governance structures in all USDA-supported schools. Under the HGSF in its entirety (four provinces, including two USDA supported provinces) WFP has also successfully developed 124 partnerships with farmer associations as a starting point to scaling up the HGSF model of school feeding preferred by the MoEYS. Table 33: Engagement of local and community groups in school feeding
Target Baseline Midline Endline
No. of parent-teacher associations or similar school governance structures contributing to their school
861 groups 467 785 861
Number of public-private partnerships formed (e.g. farmer associations) 1 0 4 124
2.2.2 Overall achievement of Strategic Objective 1: Improved literacy of school-age children 109. According to the logic model of the USDA McGovern-Dole Program, all activities contributing to the three Results Streams described above should converge to enable the achievement of the Strategic Objective 1: Improved Literacy of School-Aged Children, measured through the percentage of students (boys/girls) at USDA supported schools who, by the end of Grade 6, demonstrate reading comprehension equivalent to their grade level as defined by national standards. 110. In the SY 2012/13, the Education Quality Assurance Department (EQAD) within MoEYS conducted a Grade 6 national assessment survey and the results were published in December
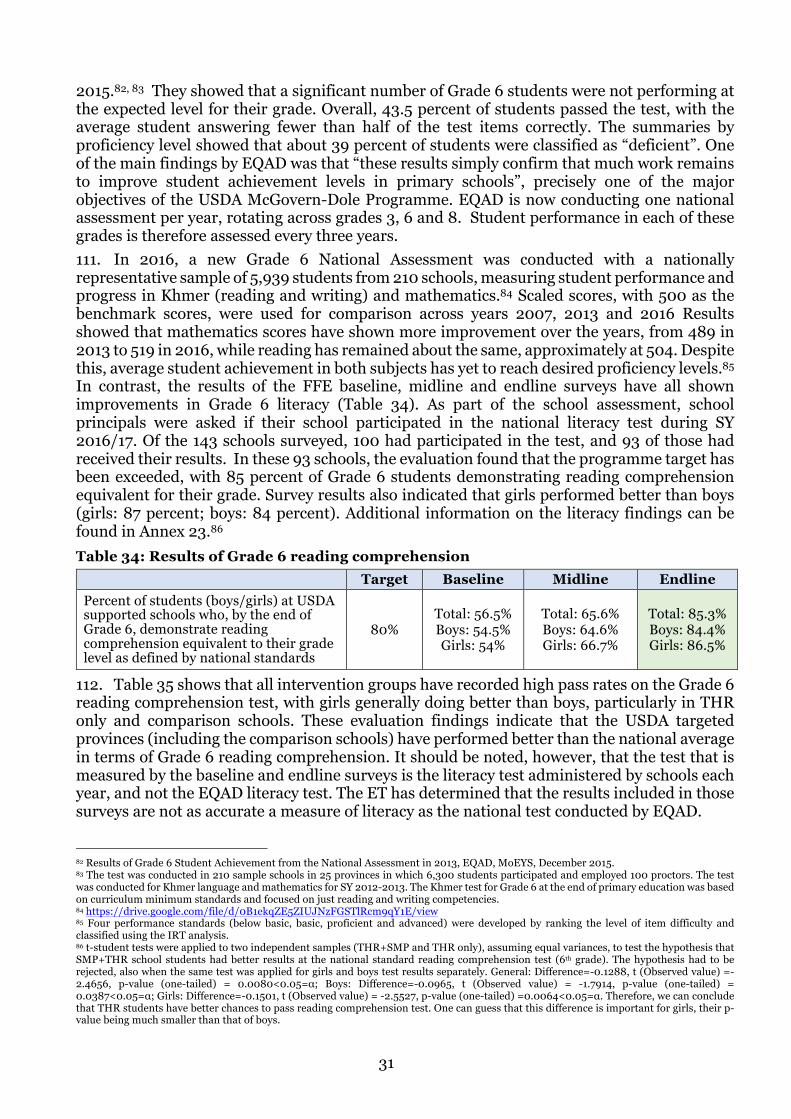
31
2015.82, 83 They showed that a significant number of Grade 6 students were not performing at the expected level for their grade. Overall, 43.5 percent of students passed the test, with the average student answering fewer than half of the test items correctly. The summaries by proficiency level showed that about 39 percent of students were classified as “deficient”. One of the main findings by EQAD was that “these results simply confirm that much work remains to improve student achievement levels in primary schools”, precisely one of the major objectives of the USDA McGovern-Dole Programme. EQAD is now conducting one national assessment per year, rotating across grades 3, 6 and 8. Student performance in each of these grades is therefore assessed every three years. 111. In 2016, a new Grade 6 National Assessment was conducted with a nationally representative sample of 5,939 students from 210 schools, measuring student performance and progress in Khmer (reading and writing) and mathematics.84 Scaled scores, with 500 as the benchmark scores, were used for comparison across years 2007, 2013 and 2016 Results showed that mathematics scores have shown more improvement over the years, from 489 in 2013 to 519 in 2016, while reading has remained about the same, approximately at 504. Despite this, average student achievement in both subjects has yet to reach desired proficiency levels.85 In contrast, the results of the FFE baseline, midline and endline surveys have all shown improvements in Grade 6 literacy (Table 34). As part of the school assessment, school principals were asked if their school participated in the national literacy test during SY 2016/17. Of the 143 schools surveyed, 100 had participated in the test, and 93 of those had received their results. In these 93 schools, the evaluation found that the programme target has been exceeded, with 85 percent of Grade 6 students demonstrating reading comprehension equivalent for their grade. Survey results also indicated that girls performed better than boys (girls: 87 percent; boys: 84 percent). Additional information on the literacy findings can be found in Annex 23.86 Table 34: Results of Grade 6 reading comprehension
Target Baseline Midline Endline Percent of students (boys/girls) at USDA supported schools who, by the end of Grade 6, demonstrate reading comprehension equivalent to their grade level as defined by national standards
80% Total: 56.5% Boys: 54.5% Girls: 54%
Total: 65.6% Boys: 64.6% Girls: 66.7%
Total: 85.3% Boys: 84.4% Girls: 86.5%
112. Table 35 shows that all intervention groups have recorded high pass rates on the Grade 6 reading comprehension test, with girls generally doing better than boys, particularly in THR only and comparison schools. These evaluation findings indicate that the USDA targeted provinces (including the comparison schools) have performed better than the national average in terms of Grade 6 reading comprehension. It should be noted, however, that the test that is measured by the baseline and endline surveys is the literacy test administered by schools each year, and not the EQAD literacy test. The ET has determined that the results included in those surveys are not as accurate a measure of literacy as the national test conducted by EQAD.
82 Results of Grade 6 Student Achievement from the National Assessment in 2013, EQAD, MoEYS, December 2015. 83 The test was conducted in 210 sample schools in 25 provinces in which 6,300 students participated and employed 100 proctors. The test was conducted for Khmer language and mathematics for SY 2012-2013. The Khmer test for Grade 6 at the end of primary education was based on curriculum minimum standards and focused on just reading and writing competencies. 84 https://drive.google.com/file/d/0B1ekqZE5ZIUJNzFGSTlRcm9qY1E/view 85 Four performance standards (below basic, basic, proficient and advanced) were developed by ranking the level of item difficulty and classified using the IRT analysis. 86 t-student tests were applied to two independent samples (THR+SMP and THR only), assuming equal variances, to test the hypothesis that SMP+THR school students had better results at the national standard reading comprehension test (6th grade). The hypothesis had to be rejected, also when the same test was applied for girls and boys test results separately. General: Difference=-0.1288, t (Observed value) =-2.4656, p-value (one-tailed) = 0.0080<0.05=α; Boys: Difference=-0.0965, t (Observed value) = -1.7914, p-value (one-tailed) = 0.0387<0.05=α; Girls: Difference=-0.1501, t (Observed value) = -2.5527, p-value (one-tailed) =0.0064<0.05=α. Therefore, we can conclude that THR students have better chances to pass reading comprehension test. One can guess that this difference is important for girls, their p-value being much smaller than that of boys.
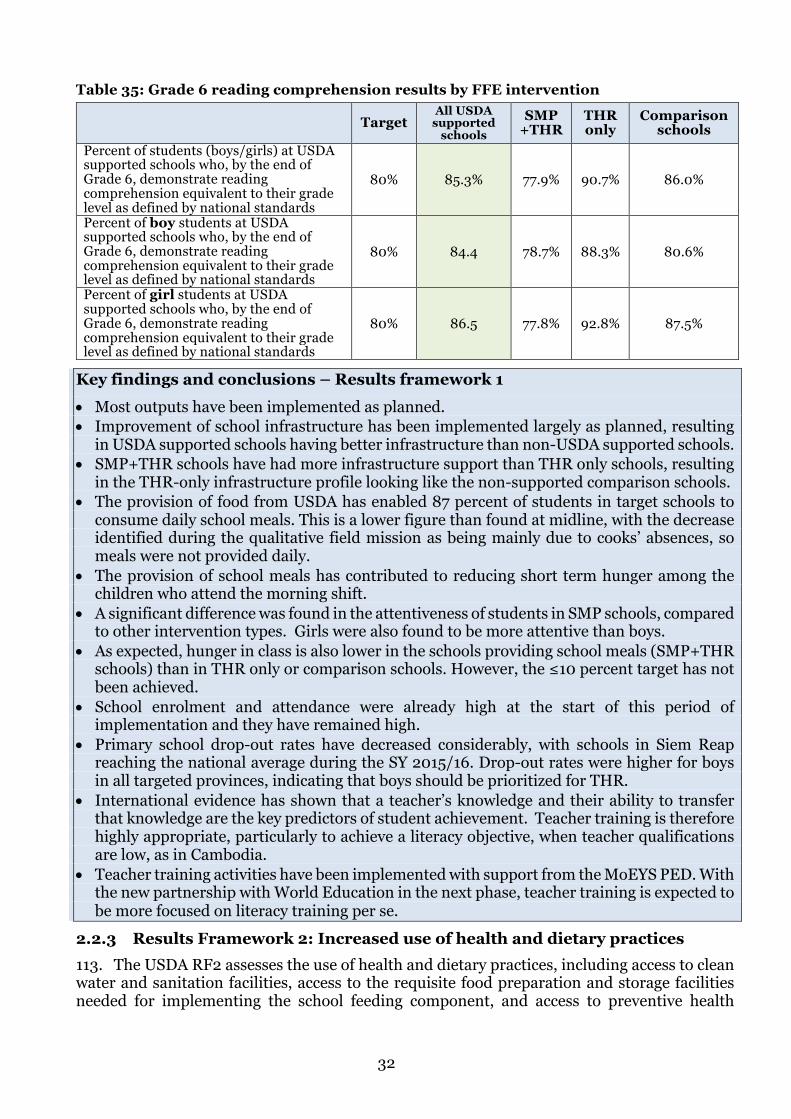
32
Table 35: Grade 6 reading comprehension results by FFE intervention
Target All USDA
supported schools
SMP +THR
THR only
Comparison schools
Percent of students (boys/girls) at USDA supported schools who, by the end of Grade 6, demonstrate reading comprehension equivalent to their grade level as defined by national standards
80% 85.3% 77.9% 90.7% 86.0%
Percent of boy students at USDA supported schools who, by the end of Grade 6, demonstrate reading comprehension equivalent to their grade level as defined by national standards
80% 84.4 78.7% 88.3% 80.6%
Percent of girl students at USDA supported schools who, by the end of Grade 6, demonstrate reading comprehension equivalent to their grade level as defined by national standards
80% 86.5 77.8% 92.8% 87.5%
Key findings and conclusions – Results framework 1 • Most outputs have been implemented as planned. • Improvement of school infrastructure has been implemented largely as planned, resulting
in USDA supported schools having better infrastructure than non-USDA supported schools. • SMP+THR schools have had more infrastructure support than THR only schools, resulting
in the THR-only infrastructure profile looking like the non-supported comparison schools. • The provision of food from USDA has enabled 87 percent of students in target schools to
consume daily school meals. This is a lower figure than found at midline, with the decrease identified during the qualitative field mission as being mainly due to cooks’ absences, so meals were not provided daily.
• The provision of school meals has contributed to reducing short term hunger among the children who attend the morning shift.
• A significant difference was found in the attentiveness of students in SMP schools, compared to other intervention types. Girls were also found to be more attentive than boys.
• As expected, hunger in class is also lower in the schools providing school meals (SMP+THR schools) than in THR only or comparison schools. However, the ≤10 percent target has not been achieved.
• School enrolment and attendance were already high at the start of this period of implementation and they have remained high.
• Primary school drop-out rates have decreased considerably, with schools in Siem Reap reaching the national average during the SY 2015/16. Drop-out rates were higher for boys in all targeted provinces, indicating that boys should be prioritized for THR.
• International evidence has shown that a teacher’s knowledge and their ability to transfer that knowledge are the key predictors of student achievement. Teacher training is therefore highly appropriate, particularly to achieve a literacy objective, when teacher qualifications are low, as in Cambodia.
• Teacher training activities have been implemented with support from the MoEYS PED. With the new partnership with World Education in the next phase, teacher training is expected to be more focused on literacy training per se.
2.2.3 Results Framework 2: Increased use of health and dietary practices 113. The USDA RF2 assesses the use of health and dietary practices, including access to clean water and sanitation facilities, access to the requisite food preparation and storage facilities needed for implementing the school feeding component, and access to preventive health
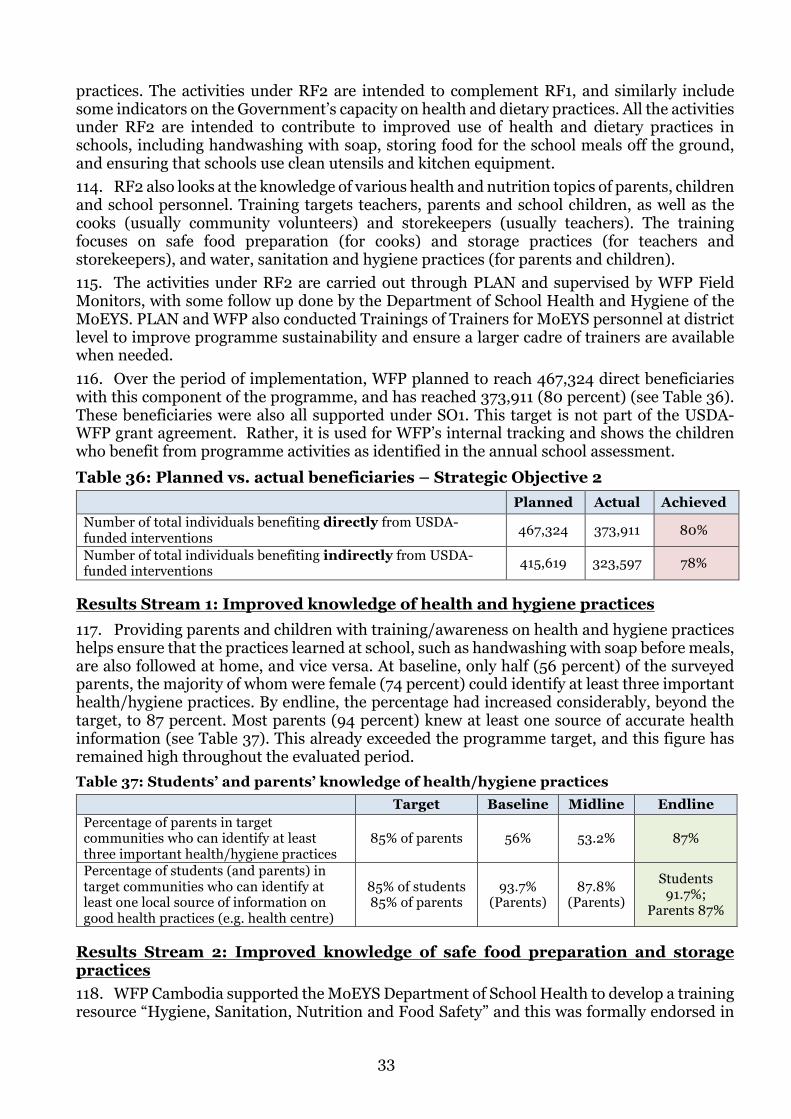
33
practices. The activities under RF2 are intended to complement RF1, and similarly include some indicators on the Government’s capacity on health and dietary practices. All the activities under RF2 are intended to contribute to improved use of health and dietary practices in schools, including handwashing with soap, storing food for the school meals off the ground, and ensuring that schools use clean utensils and kitchen equipment. 114. RF2 also looks at the knowledge of various health and nutrition topics of parents, children and school personnel. Training targets teachers, parents and school children, as well as the cooks (usually community volunteers) and storekeepers (usually teachers). The training focuses on safe food preparation (for cooks) and storage practices (for teachers and storekeepers), and water, sanitation and hygiene practices (for parents and children). 115. The activities under RF2 are carried out through PLAN and supervised by WFP Field Monitors, with some follow up done by the Department of School Health and Hygiene of the MoEYS. PLAN and WFP also conducted Trainings of Trainers for MoEYS personnel at district level to improve programme sustainability and ensure a larger cadre of trainers are available when needed. 116. Over the period of implementation, WFP planned to reach 467,324 direct beneficiaries with this component of the programme, and has reached 373,911 (80 percent) (see Table 36). These beneficiaries were also all supported under SO1. This target is not part of the USDA-WFP grant agreement. Rather, it is used for WFP’s internal tracking and shows the children who benefit from programme activities as identified in the annual school assessment. Table 36: Planned vs. actual beneficiaries – Strategic Objective 2
Planned Actual Achieved Number of total individuals benefiting directly from USDA-funded interventions 467,324 373,911 80%
Number of total individuals benefiting indirectly from USDA-funded interventions 415,619 323,597 78%
Results Stream 1: Improved knowledge of health and hygiene practices 117. Providing parents and children with training/awareness on health and hygiene practices helps ensure that the practices learned at school, such as handwashing with soap before meals, are also followed at home, and vice versa. At baseline, only half (56 percent) of the surveyed parents, the majority of whom were female (74 percent) could identify at least three important health/hygiene practices. By endline, the percentage had increased considerably, beyond the target, to 87 percent. Most parents (94 percent) knew at least one source of accurate health information (see Table 37). This already exceeded the programme target, and this figure has remained high throughout the evaluated period. Table 37: Students’ and parents’ knowledge of health/hygiene practices
Target Baseline Midline Endline Percentage of parents in target communities who can identify at least three important health/hygiene practices
85% of parents 56% 53.2% 87%
Percentage of students (and parents) in target communities who can identify at least one local source of information on good health practices (e.g. health centre)
85% of students 85% of parents
93.7% (Parents)
87.8% (Parents)
Students 91.7%;
Parents 87%
Results Stream 2: Improved knowledge of safe food preparation and storage practices 118. WFP Cambodia supported the MoEYS Department of School Health to develop a training resource “Hygiene, Sanitation, Nutrition and Food Safety” and this was formally endorsed in
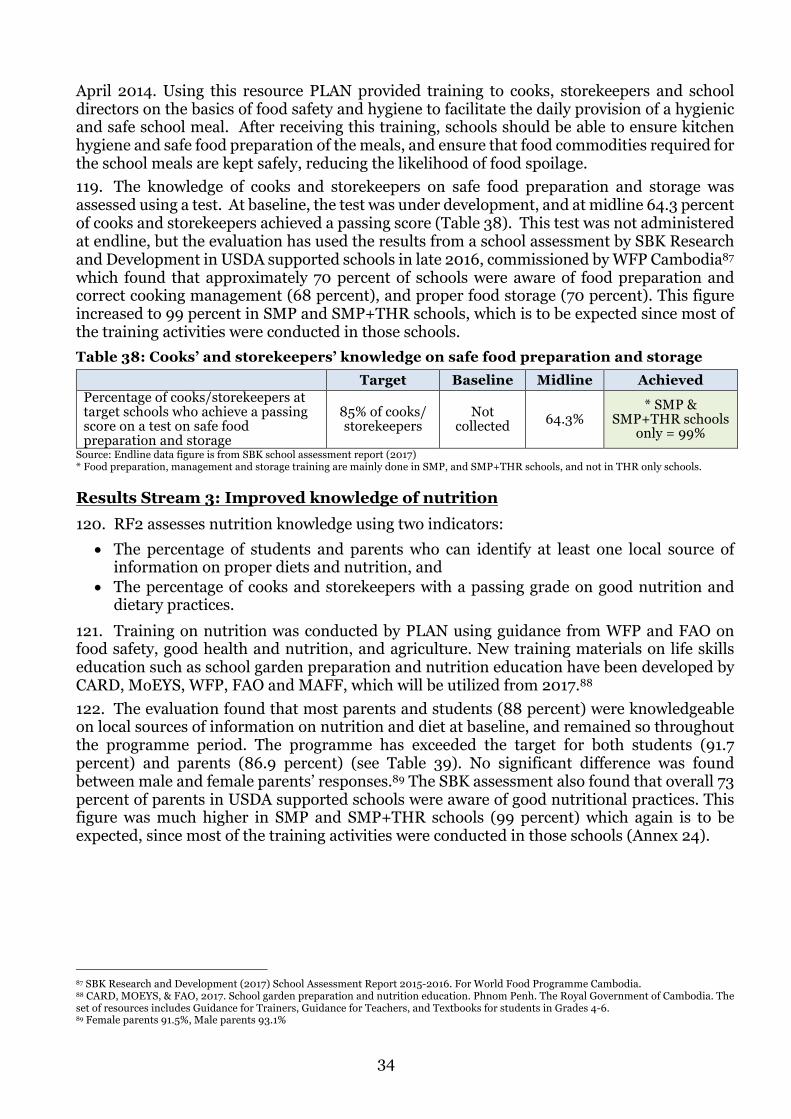
34
April 2014. Using this resource PLAN provided training to cooks, storekeepers and school directors on the basics of food safety and hygiene to facilitate the daily provision of a hygienic and safe school meal. After receiving this training, schools should be able to ensure kitchen hygiene and safe food preparation of the meals, and ensure that food commodities required for the school meals are kept safely, reducing the likelihood of food spoilage. 119. The knowledge of cooks and storekeepers on safe food preparation and storage was assessed using a test. At baseline, the test was under development, and at midline 64.3 percent of cooks and storekeepers achieved a passing score (Table 38). This test was not administered at endline, but the evaluation has used the results from a school assessment by SBK Research and Development in USDA supported schools in late 2016, commissioned by WFP Cambodia87 which found that approximately 70 percent of schools were aware of food preparation and correct cooking management (68 percent), and proper food storage (70 percent). This figure increased to 99 percent in SMP and SMP+THR schools, which is to be expected since most of the training activities were conducted in those schools. Table 38: Cooks’ and storekeepers’ knowledge on safe food preparation and storage
Target Baseline Midline Achieved Percentage of cooks/storekeepers at target schools who achieve a passing score on a test on safe food preparation and storage
85% of cooks/ storekeepers
Not collected 64.3%
* SMP & SMP+THR schools
only = 99% Source: Endline data figure is from SBK school assessment report (2017) * Food preparation, management and storage training are mainly done in SMP, and SMP+THR schools, and not in THR only schools.
Results Stream 3: Improved knowledge of nutrition 120. RF2 assesses nutrition knowledge using two indicators: • The percentage of students and parents who can identify at least one local source of
information on proper diets and nutrition, and • The percentage of cooks and storekeepers with a passing grade on good nutrition and
dietary practices. 121. Training on nutrition was conducted by PLAN using guidance from WFP and FAO on food safety, good health and nutrition, and agriculture. New training materials on life skills education such as school garden preparation and nutrition education have been developed by CARD, MoEYS, WFP, FAO and MAFF, which will be utilized from 2017.88 122. The evaluation found that most parents and students (88 percent) were knowledgeable on local sources of information on nutrition and diet at baseline, and remained so throughout the programme period. The programme has exceeded the target for both students (91.7 percent) and parents (86.9 percent) (see Table 39). No significant difference was found between male and female parents’ responses.89 The SBK assessment also found that overall 73 percent of parents in USDA supported schools were aware of good nutritional practices. This figure was much higher in SMP and SMP+THR schools (99 percent) which again is to be expected, since most of the training activities were conducted in those schools (Annex 24).
87 SBK Research and Development (2017) School Assessment Report 2015-2016. For World Food Programme Cambodia. 88 CARD, MOEYS, & FAO, 2017. School garden preparation and nutrition education. Phnom Penh. The Royal Government of Cambodia. The set of resources includes Guidance for Trainers, Guidance for Teachers, and Textbooks for students in Grades 4-6. 89 Female parents 91.5%, Male parents 93.1%
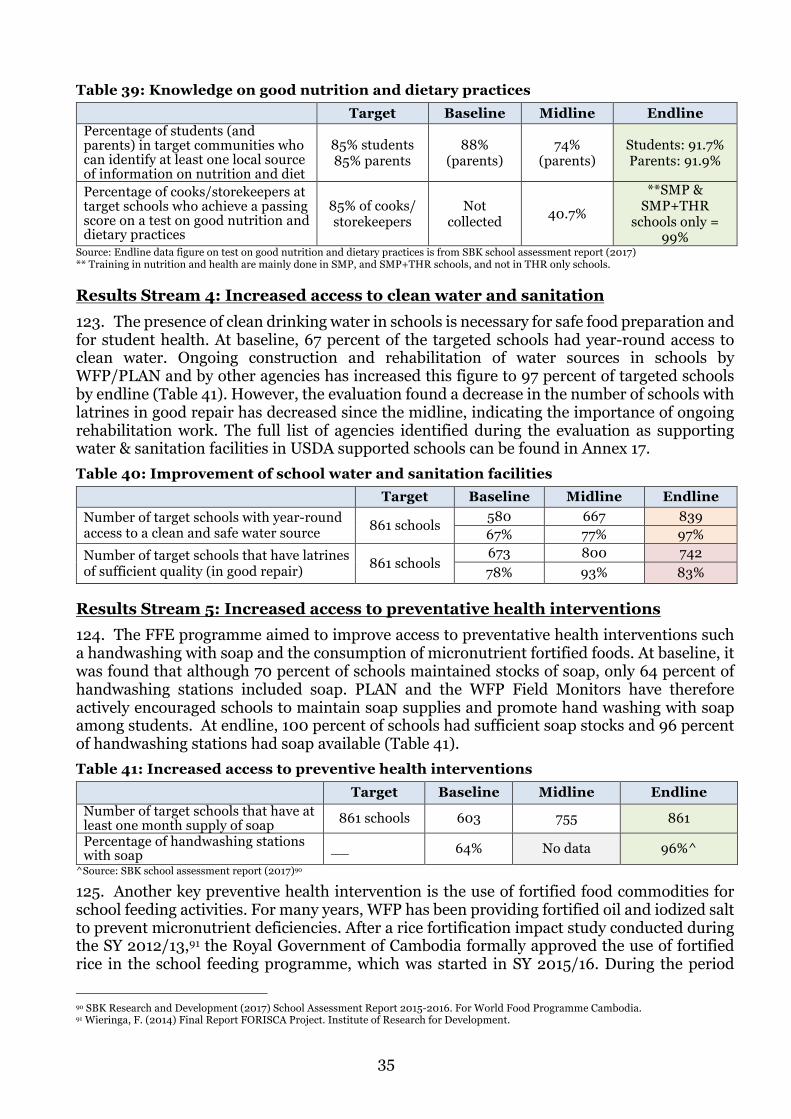
35
Table 39: Knowledge on good nutrition and dietary practices Target Baseline Midline Endline Percentage of students (and parents) in target communities who can identify at least one local source of information on nutrition and diet
85% students 85% parents
88% (parents)
74% (parents)
Students: 91.7% Parents: 91.9%
Percentage of cooks/storekeepers at target schools who achieve a passing score on a test on good nutrition and dietary practices
85% of cooks/ storekeepers
Not collected 40.7%
**SMP & SMP+THR
schools only = 99%
Source: Endline data figure on test on good nutrition and dietary practices is from SBK school assessment report (2017) ** Training in nutrition and health are mainly done in SMP, and SMP+THR schools, and not in THR only schools.
Results Stream 4: Increased access to clean water and sanitation 123. The presence of clean drinking water in schools is necessary for safe food preparation and for student health. At baseline, 67 percent of the targeted schools had year-round access to clean water. Ongoing construction and rehabilitation of water sources in schools by WFP/PLAN and by other agencies has increased this figure to 97 percent of targeted schools by endline (Table 41). However, the evaluation found a decrease in the number of schools with latrines in good repair has decreased since the midline, indicating the importance of ongoing rehabilitation work. The full list of agencies identified during the evaluation as supporting water & sanitation facilities in USDA supported schools can be found in Annex 17. Table 40: Improvement of school water and sanitation facilities
Target Baseline Midline Endline Number of target schools with year-round access to a clean and safe water source 861 schools 580 667 839
67% 77% 97% Number of target schools that have latrines of sufficient quality (in good repair) 861 schools
673 800 742 78% 93% 83%
Results Stream 5: Increased access to preventative health interventions 124. The FFE programme aimed to improve access to preventative health interventions such a handwashing with soap and the consumption of micronutrient fortified foods. At baseline, it was found that although 70 percent of schools maintained stocks of soap, only 64 percent of handwashing stations included soap. PLAN and the WFP Field Monitors have therefore actively encouraged schools to maintain soap supplies and promote hand washing with soap among students. At endline, 100 percent of schools had sufficient soap stocks and 96 percent of handwashing stations had soap available (Table 41). Table 41: Increased access to preventive health interventions Target Baseline Midline Endline Number of target schools that have at least one month supply of soap 861 schools 603 755 861 Percentage of handwashing stations with soap __ 64% No data 96%^
^Source: SBK school assessment report (2017)90
125. Another key preventive health intervention is the use of fortified food commodities for school feeding activities. For many years, WFP has been providing fortified oil and iodized salt to prevent micronutrient deficiencies. After a rice fortification impact study conducted during the SY 2012/13,91 the Royal Government of Cambodia formally approved the use of fortified rice in the school feeding programme, which was started in SY 2015/16. During the period
90 SBK Research and Development (2017) School Assessment Report 2015-2016. For World Food Programme Cambodia. 91 Wieringa, F. (2014) Final Report FORISCA Project. Institute of Research for Development.
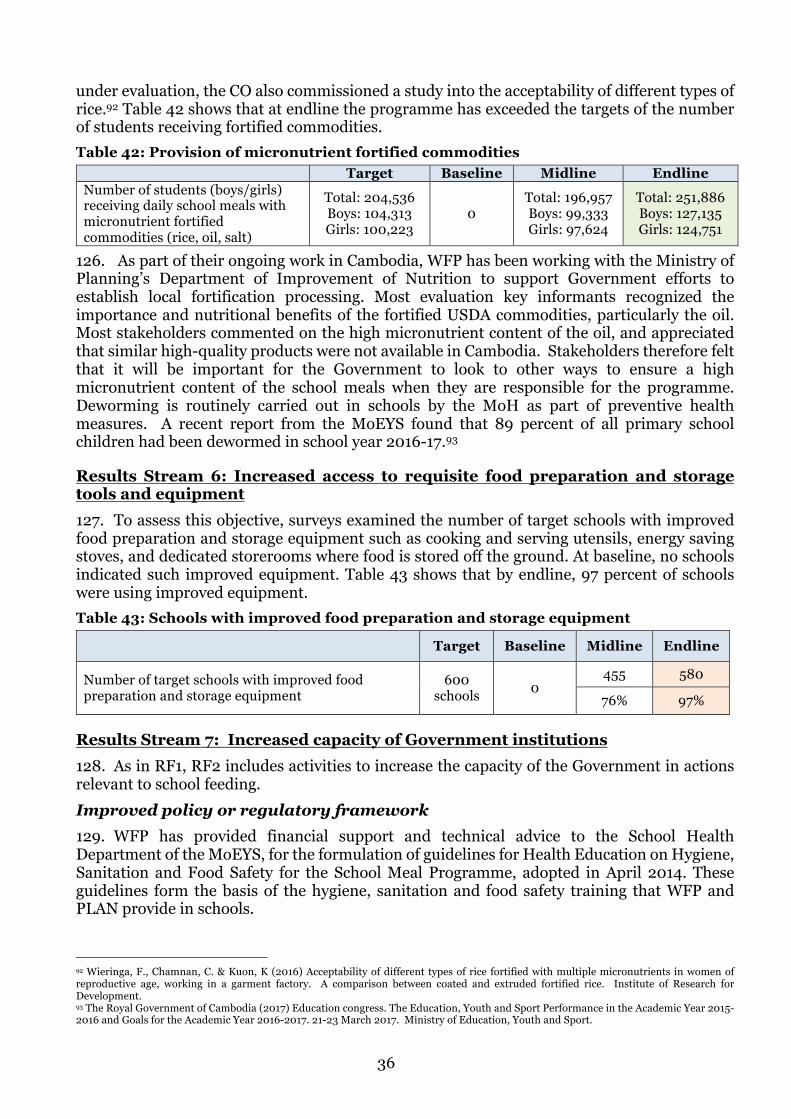
36
under evaluation, the CO also commissioned a study into the acceptability of different types of rice.92 Table 42 shows that at endline the programme has exceeded the targets of the number of students receiving fortified commodities. Table 42: Provision of micronutrient fortified commodities
Target Baseline Midline Endline Number of students (boys/girls) receiving daily school meals with micronutrient fortified commodities (rice, oil, salt)
Total: 204,536 Boys: 104,313 Girls: 100,223
0 Total: 196,957 Boys: 99,333 Girls: 97,624
Total: 251,886 Boys: 127,135 Girls: 124,751
126. As part of their ongoing work in Cambodia, WFP has been working with the Ministry of Planning’s Department of Improvement of Nutrition to support Government efforts to establish local fortification processing. Most evaluation key informants recognized the importance and nutritional benefits of the fortified USDA commodities, particularly the oil. Most stakeholders commented on the high micronutrient content of the oil, and appreciated that similar high-quality products were not available in Cambodia. Stakeholders therefore felt that it will be important for the Government to look to other ways to ensure a high micronutrient content of the school meals when they are responsible for the programme. Deworming is routinely carried out in schools by the MoH as part of preventive health measures. A recent report from the MoEYS found that 89 percent of all primary school children had been dewormed in school year 2016-17.93
Results Stream 6: Increased access to requisite food preparation and storage tools and equipment 127. To assess this objective, surveys examined the number of target schools with improved food preparation and storage equipment such as cooking and serving utensils, energy saving stoves, and dedicated storerooms where food is stored off the ground. At baseline, no schools indicated such improved equipment. Table 43 shows that by endline, 97 percent of schools were using improved equipment. Table 43: Schools with improved food preparation and storage equipment
Target Baseline Midline Endline
Number of target schools with improved food preparation and storage equipment
600 schools 0
455 580
76% 97%
Results Stream 7: Increased capacity of Government institutions 128. As in RF1, RF2 includes activities to increase the capacity of the Government in actions relevant to school feeding. Improved policy or regulatory framework 129. WFP has provided financial support and technical advice to the School Health Department of the MoEYS, for the formulation of guidelines for Health Education on Hygiene, Sanitation and Food Safety for the School Meal Programme, adopted in April 2014. These guidelines form the basis of the hygiene, sanitation and food safety training that WFP and PLAN provide in schools.
92 Wieringa, F., Chamnan, C. & Kuon, K (2016) Acceptability of different types of rice fortified with multiple micronutrients in women of reproductive age, working in a garment factory. A comparison between coated and extruded fortified rice. Institute of Research for Development. 93 The Royal Government of Cambodia (2017) Education congress. The Education, Youth and Sport Performance in the Academic Year 2015-2016 and Goals for the Academic Year 2016-2017. 21-23 March 2017. Ministry of Education, Youth and Sport.
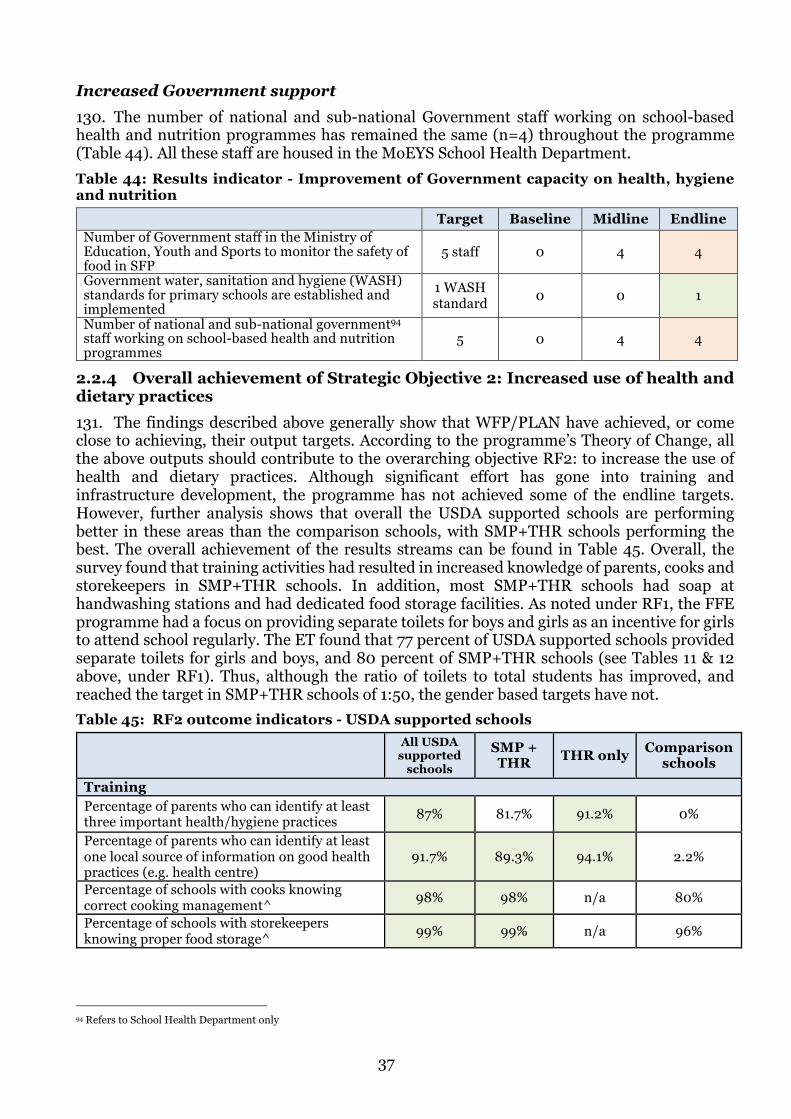
37
Increased Government support 130. The number of national and sub-national Government staff working on school-based health and nutrition programmes has remained the same (n=4) throughout the programme (Table 44). All these staff are housed in the MoEYS School Health Department. Table 44: Results indicator - Improvement of Government capacity on health, hygiene and nutrition
Target Baseline Midline Endline Number of Government staff in the Ministry of Education, Youth and Sports to monitor the safety of food in SFP
5 staff 0 4 4
Government water, sanitation and hygiene (WASH) standards for primary schools are established and implemented
1 WASH standard 0 0 1
Number of national and sub-national government94 staff working on school-based health and nutrition programmes
5 0 4 4
2.2.4 Overall achievement of Strategic Objective 2: Increased use of health and dietary practices 131. The findings described above generally show that WFP/PLAN have achieved, or come close to achieving, their output targets. According to the programme’s Theory of Change, all the above outputs should contribute to the overarching objective RF2: to increase the use of health and dietary practices. Although significant effort has gone into training and infrastructure development, the programme has not achieved some of the endline targets. However, further analysis shows that overall the USDA supported schools are performing better in these areas than the comparison schools, with SMP+THR schools performing the best. The overall achievement of the results streams can be found in Table 45. Overall, the survey found that training activities had resulted in increased knowledge of parents, cooks and storekeepers in SMP+THR schools. In addition, most SMP+THR schools had soap at handwashing stations and had dedicated food storage facilities. As noted under RF1, the FFE programme had a focus on providing separate toilets for boys and girls as an incentive for girls to attend school regularly. The ET found that 77 percent of USDA supported schools provided separate toilets for girls and boys, and 80 percent of SMP+THR schools (see Tables 11 & 12 above, under RF1). Thus, although the ratio of toilets to total students has improved, and reached the target in SMP+THR schools of 1:50, the gender based targets have not. Table 45: RF2 outcome indicators - USDA supported schools
All USDA supported
schools
SMP + THR THR only Comparison
schools
Training Percentage of parents who can identify at least three important health/hygiene practices 87% 81.7% 91.2% 0%
Percentage of parents who can identify at least one local source of information on good health practices (e.g. health centre)
91.7% 89.3% 94.1% 2.2%
Percentage of schools with cooks knowing correct cooking management^ 98% 98% n/a 80%
Percentage of schools with storekeepers knowing proper food storage^ 99% 99% n/a 96%
94 Refers to School Health Department only
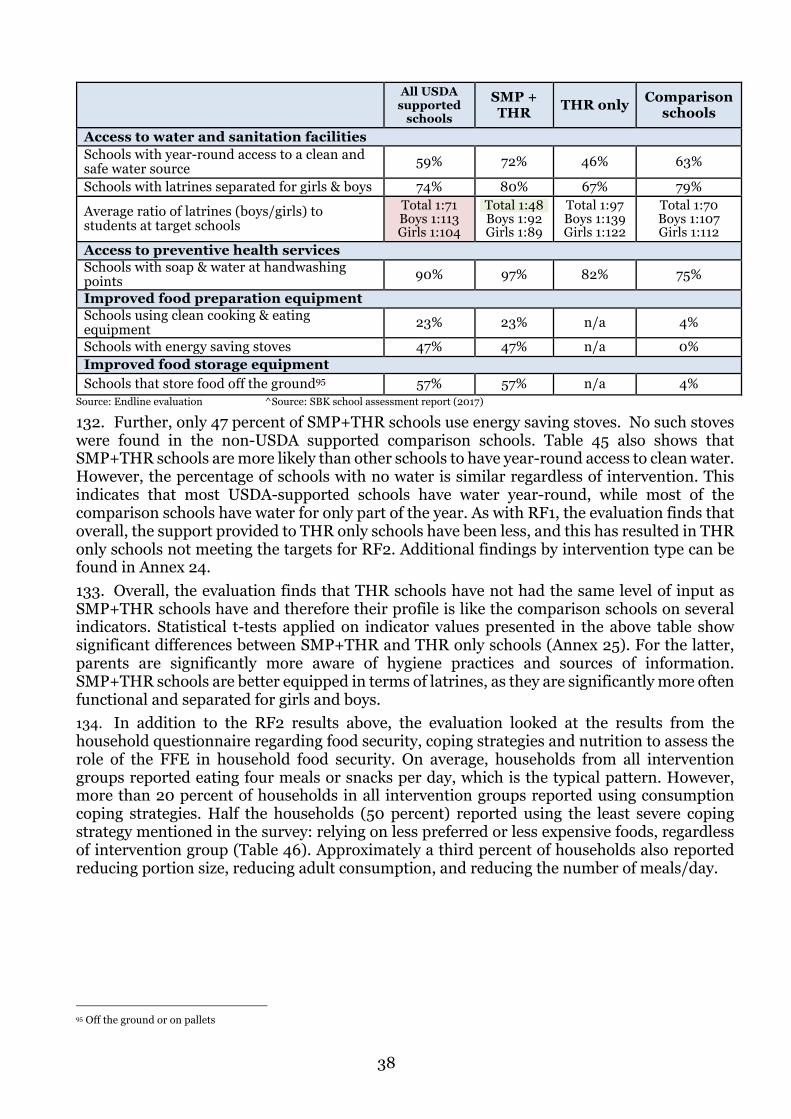
38
All USDA supported
schools
SMP + THR THR only Comparison
schools
Access to water and sanitation facilities Schools with year-round access to a clean and safe water source 59% 72% 46% 63%
Schools with latrines separated for girls & boys 74% 80% 67% 79%
Average ratio of latrines (boys/girls) to students at target schools
Total 1:71 Boys 1:113 Girls 1:104
Total 1:48 Boys 1:92 Girls 1:89
Total 1:97 Boys 1:139 Girls 1:122
Total 1:70 Boys 1:107 Girls 1:112
Access to preventive health services Schools with soap & water at handwashing points 90% 97% 82% 75%
Improved food preparation equipment Schools using clean cooking & eating equipment 23% 23% n/a 4%
Schools with energy saving stoves 47% 47% n/a 0% Improved food storage equipment Schools that store food off the ground95 57% 57% n/a 4%
Source: Endline evaluation ^Source: SBK school assessment report (2017)
132. Further, only 47 percent of SMP+THR schools use energy saving stoves. No such stoves were found in the non-USDA supported comparison schools. Table 45 also shows that SMP+THR schools are more likely than other schools to have year-round access to clean water. However, the percentage of schools with no water is similar regardless of intervention. This indicates that most USDA-supported schools have water year-round, while most of the comparison schools have water for only part of the year. As with RF1, the evaluation finds that overall, the support provided to THR only schools have been less, and this has resulted in THR only schools not meeting the targets for RF2. Additional findings by intervention type can be found in Annex 24. 133. Overall, the evaluation finds that THR schools have not had the same level of input as SMP+THR schools have and therefore their profile is like the comparison schools on several indicators. Statistical t-tests applied on indicator values presented in the above table show significant differences between SMP+THR and THR only schools (Annex 25). For the latter, parents are significantly more aware of hygiene practices and sources of information. SMP+THR schools are better equipped in terms of latrines, as they are significantly more often functional and separated for girls and boys. 134. In addition to the RF2 results above, the evaluation looked at the results from the household questionnaire regarding food security, coping strategies and nutrition to assess the role of the FFE in household food security. On average, households from all intervention groups reported eating four meals or snacks per day, which is the typical pattern. However, more than 20 percent of households in all intervention groups reported using consumption coping strategies. Half the households (50 percent) reported using the least severe coping strategy mentioned in the survey: relying on less preferred or less expensive foods, regardless of intervention group (Table 46). Approximately a third percent of households also reported reducing portion size, reducing adult consumption, and reducing the number of meals/day.
95 Off the ground or on pallets
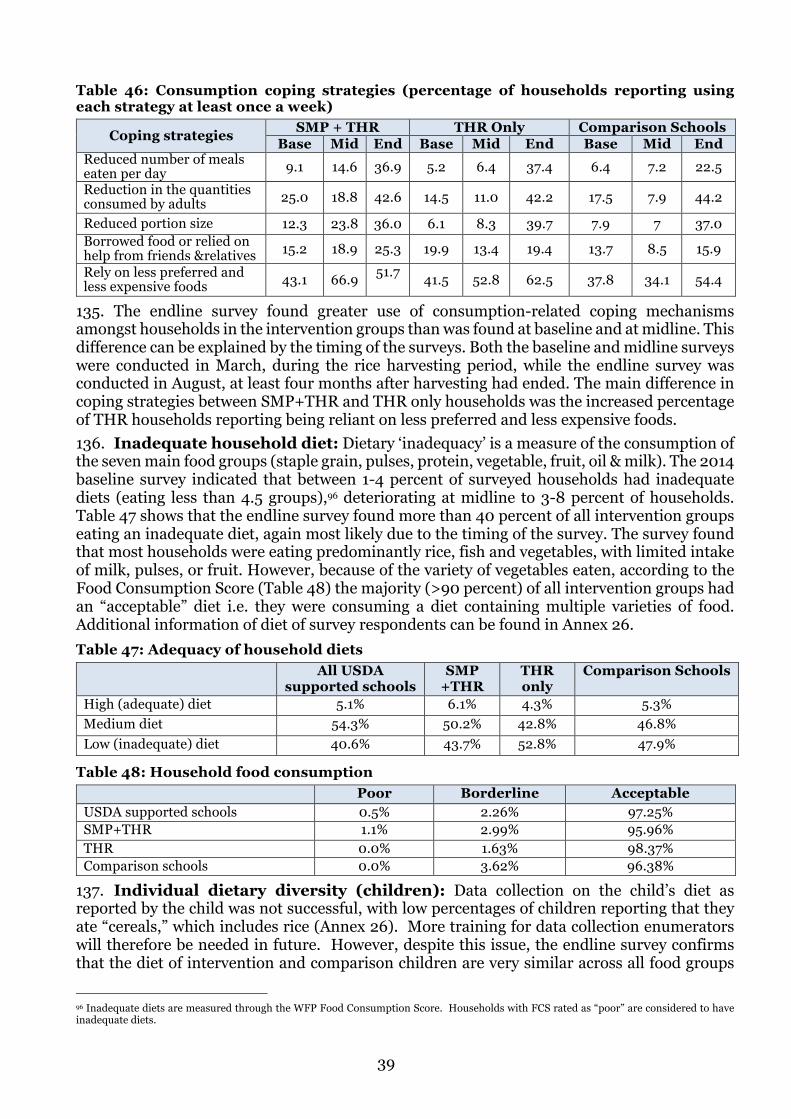
39
Table 46: Consumption coping strategies (percentage of households reporting using each strategy at least once a week)
Coping strategies SMP + THR THR Only Comparison Schools Base Mid End Base Mid End Base Mid End
Reduced number of meals eaten per day 9.1 14.6 36.9 5.2 6.4 37.4 6.4 7.2 22.5 Reduction in the quantities consumed by adults 25.0 18.8 42.6 14.5 11.0 42.2 17.5 7.9 44.2
Reduced portion size 12.3 23.8 36.0 6.1 8.3 39.7 7.9 7 37.0 Borrowed food or relied on help from friends &relatives 15.2 18.9 25.3 19.9 13.4 19.4 13.7 8.5 15.9 Rely on less preferred and less expensive foods 43.1 66.9 51.7
41.5 52.8 62.5 37.8 34.1 54.4
135. The endline survey found greater use of consumption-related coping mechanisms amongst households in the intervention groups than was found at baseline and at midline. This difference can be explained by the timing of the surveys. Both the baseline and midline surveys were conducted in March, during the rice harvesting period, while the endline survey was conducted in August, at least four months after harvesting had ended. The main difference in coping strategies between SMP+THR and THR only households was the increased percentage of THR households reporting being reliant on less preferred and less expensive foods. 136. Inadequate household diet: Dietary ‘inadequacy’ is a measure of the consumption of the seven main food groups (staple grain, pulses, protein, vegetable, fruit, oil & milk). The 2014 baseline survey indicated that between 1-4 percent of surveyed households had inadequate diets (eating less than 4.5 groups),96 deteriorating at midline to 3-8 percent of households. Table 47 shows that the endline survey found more than 40 percent of all intervention groups eating an inadequate diet, again most likely due to the timing of the survey. The survey found that most households were eating predominantly rice, fish and vegetables, with limited intake of milk, pulses, or fruit. However, because of the variety of vegetables eaten, according to the Food Consumption Score (Table 48) the majority (>90 percent) of all intervention groups had an “acceptable” diet i.e. they were consuming a diet containing multiple varieties of food. Additional information of diet of survey respondents can be found in Annex 26. Table 47: Adequacy of household diets
All USDA supported schools
SMP +THR
THR only
Comparison Schools
High (adequate) diet 5.1% 6.1% 4.3% 5.3% Medium diet 54.3% 50.2% 42.8% 46.8% Low (inadequate) diet 40.6% 43.7% 52.8% 47.9%
Table 48: Household food consumption Poor Borderline Acceptable USDA supported schools 0.5% 2.26% 97.25% SMP+THR 1.1% 2.99% 95.96% THR 0.0% 1.63% 98.37% Comparison schools 0.0% 3.62% 96.38%
137. Individual dietary diversity (children): Data collection on the child’s diet as reported by the child was not successful, with low percentages of children reporting that they ate “cereals,” which includes rice (Annex 26). More training for data collection enumerators will therefore be needed in future. However, despite this issue, the endline survey confirms that the diet of intervention and comparison children are very similar across all food groups
96 Inadequate diets are measured through the WFP Food Consumption Score. Households with FCS rated as “poor” are considered to have inadequate diets.
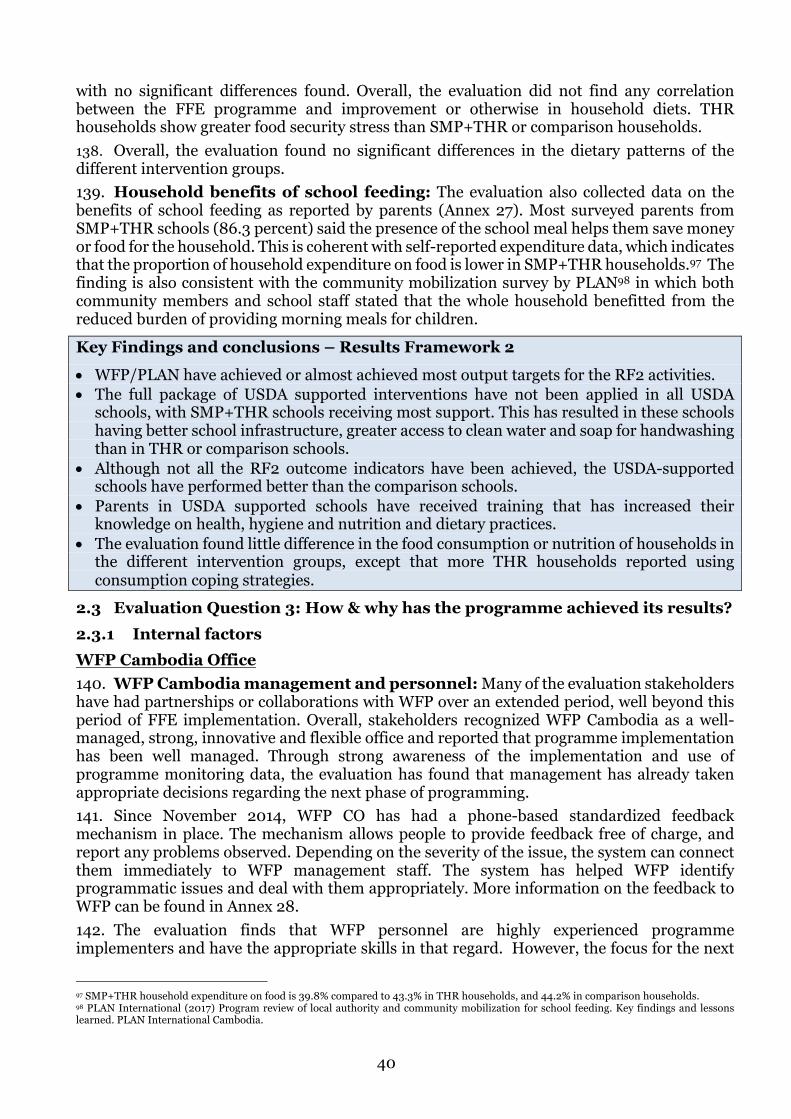
40
with no significant differences found. Overall, the evaluation did not find any correlation between the FFE programme and improvement or otherwise in household diets. THR households show greater food security stress than SMP+THR or comparison households. 138. Overall, the evaluation found no significant differences in the dietary patterns of the different intervention groups. 139. Household benefits of school feeding: The evaluation also collected data on the benefits of school feeding as reported by parents (Annex 27). Most surveyed parents from SMP+THR schools (86.3 percent) said the presence of the school meal helps them save money or food for the household. This is coherent with self-reported expenditure data, which indicates that the proportion of household expenditure on food is lower in SMP+THR households.97 The finding is also consistent with the community mobilization survey by PLAN98 in which both community members and school staff stated that the whole household benefitted from the reduced burden of providing morning meals for children.
Key Findings and conclusions – Results Framework 2
• WFP/PLAN have achieved or almost achieved most output targets for the RF2 activities. • The full package of USDA supported interventions have not been applied in all USDA
schools, with SMP+THR schools receiving most support. This has resulted in these schools having better school infrastructure, greater access to clean water and soap for handwashing than in THR or comparison schools.
• Although not all the RF2 outcome indicators have been achieved, the USDA-supported schools have performed better than the comparison schools.
• Parents in USDA supported schools have received training that has increased their knowledge on health, hygiene and nutrition and dietary practices.
• The evaluation found little difference in the food consumption or nutrition of households in the different intervention groups, except that more THR households reported using consumption coping strategies.
2.3 Evaluation Question 3: How & why has the programme achieved its results? 2.3.1 Internal factors WFP Cambodia Office 140. WFP Cambodia management and personnel: Many of the evaluation stakeholders have had partnerships or collaborations with WFP over an extended period, well beyond this period of FFE implementation. Overall, stakeholders recognized WFP Cambodia as a well-managed, strong, innovative and flexible office and reported that programme implementation has been well managed. Through strong awareness of the implementation and use of programme monitoring data, the evaluation has found that management has already taken appropriate decisions regarding the next phase of programming. 141. Since November 2014, WFP CO has had a phone-based standardized feedback mechanism in place. The mechanism allows people to provide feedback free of charge, and report any problems observed. Depending on the severity of the issue, the system can connect them immediately to WFP management staff. The system has helped WFP identify programmatic issues and deal with them appropriately. More information on the feedback to WFP can be found in Annex 28. 142. The evaluation finds that WFP personnel are highly experienced programme implementers and have the appropriate skills in that regard. However, the focus for the next
97 SMP+THR household expenditure on food is 39.8% compared to 43.3% in THR households, and 44.2% in comparison households. 98 PLAN International (2017) Program review of local authority and community mobilization for school feeding. Key findings and lessons learned. PLAN International Cambodia.
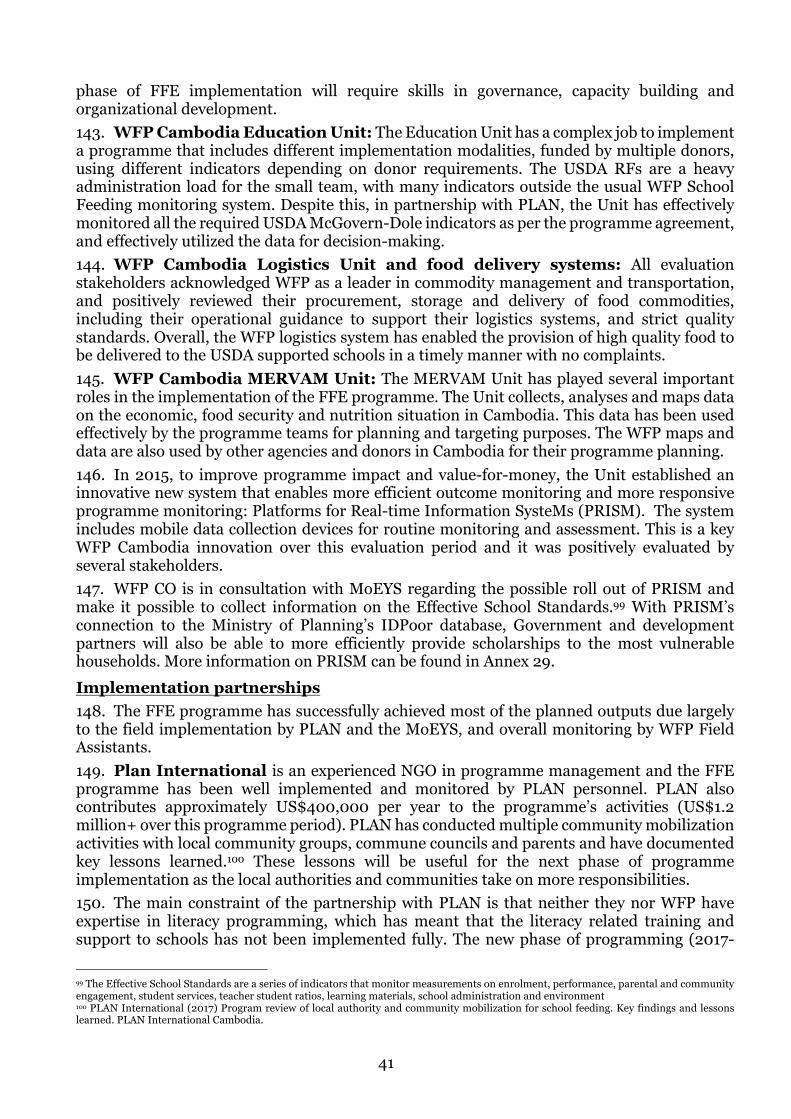
41
phase of FFE implementation will require skills in governance, capacity building and organizational development. 143. WFP Cambodia Education Unit: The Education Unit has a complex job to implement a programme that includes different implementation modalities, funded by multiple donors, using different indicators depending on donor requirements. The USDA RFs are a heavy administration load for the small team, with many indicators outside the usual WFP School Feeding monitoring system. Despite this, in partnership with PLAN, the Unit has effectively monitored all the required USDA McGovern-Dole indicators as per the programme agreement, and effectively utilized the data for decision-making. 144. WFP Cambodia Logistics Unit and food delivery systems: All evaluation stakeholders acknowledged WFP as a leader in commodity management and transportation, and positively reviewed their procurement, storage and delivery of food commodities, including their operational guidance to support their logistics systems, and strict quality standards. Overall, the WFP logistics system has enabled the provision of high quality food to be delivered to the USDA supported schools in a timely manner with no complaints. 145. WFP Cambodia MERVAM Unit: The MERVAM Unit has played several important roles in the implementation of the FFE programme. The Unit collects, analyses and maps data on the economic, food security and nutrition situation in Cambodia. This data has been used effectively by the programme teams for planning and targeting purposes. The WFP maps and data are also used by other agencies and donors in Cambodia for their programme planning. 146. In 2015, to improve programme impact and value-for-money, the Unit established an innovative new system that enables more efficient outcome monitoring and more responsive programme monitoring: Platforms for Real-time Information SysteMs (PRISM). The system includes mobile data collection devices for routine monitoring and assessment. This is a key WFP Cambodia innovation over this evaluation period and it was positively evaluated by several stakeholders. 147. WFP CO is in consultation with MoEYS regarding the possible roll out of PRISM and make it possible to collect information on the Effective School Standards.99 With PRISM’s connection to the Ministry of Planning’s IDPoor database, Government and development partners will also be able to more efficiently provide scholarships to the most vulnerable households. More information on PRISM can be found in Annex 29. Implementation partnerships 148. The FFE programme has successfully achieved most of the planned outputs due largely to the field implementation by PLAN and the MoEYS, and overall monitoring by WFP Field Assistants. 149. Plan International is an experienced NGO in programme management and the FFE programme has been well implemented and monitored by PLAN personnel. PLAN also contributes approximately US$400,000 per year to the programme’s activities (US$1.2 million+ over this programme period). PLAN has conducted multiple community mobilization activities with local community groups, commune councils and parents and have documented key lessons learned.100 These lessons will be useful for the next phase of programme implementation as the local authorities and communities take on more responsibilities. 150. The main constraint of the partnership with PLAN is that neither they nor WFP have expertise in literacy programming, which has meant that the literacy related training and support to schools has not been implemented fully. The new phase of programming (2017-
99 The Effective School Standards are a series of indicators that monitor measurements on enrolment, performance, parental and community engagement, student services, teacher student ratios, learning materials, school administration and environment 100 PLAN International (2017) Program review of local authority and community mobilization for school feeding. Key findings and lessons learned. PLAN International Cambodia.

42
2019) brings a new partnership between WFP and World Education that should effectively address this issue. 151. Collaboration with MoEYS: Support from the MoEYS is critical to the success of the FFE programme as they are responsible for all the infrastructure and personnel connected to the schools. MoEYS personnel at district level are particularly involved in the programme and participate in regular school feeding related meetings. The MoEYS has also provided ongoing support to WFP activities in Cambodia by providing 2,000 mt of rice per year. 152. Programme monitoring: Information on school-based activities is captured by WFP and PLAN field staff through mobile uploading of geo-referenced checklists using smart phones and tablets. Results are captured in real time in an online platform which allows programme managers to monitor progress and respond in a timely manner in case of alerts and concerns. Outcome information is captured though an annual comprehensive survey of targeted schools, as well as during dedicated donor evaluations. 153. The MoEYS personnel at provincial and district level conduct regular site visits for oversight and help school administrators where needed, and results are discussed in quarterly sub-national coordination meetings. Programme performance analysis makes use of information captured in the national EMIS, compiled from individual reports from all schools in the country. 154. The evaluation found that the WFP and MoEYS monitoring systems are not streamlined, resulting in the MoEYS personnel having little knowledge of programme targets, outputs, outcomes or ongoing results in general. The ET finds that the MoEYS is currently not ready to take over the sophisticated monitoring and evaluation system currently shared between WFP and PLAN. The potential roll out of the PRISM within the MoEYS may address this. 2.3.2 External factors 155. The role of other agencies: The evaluation identified several other agencies working in the FFE targeted schools, implementing activities like those within the FFE programme. This means that not all the programme results can be attributed to USDA and WFP/PLAN alone, particularly the case for infrastructure rehabilitation and construction, the provision of school stationery and books, and teacher training. During the qualitative field mission, the ET visited USDA supported schools that were equipped with libraries, created and supplied with reading material by Room to Read, an NGO that has been involved for many years in supporting reading activities in primary schools in Cambodia, in cooperation with MoEYS. From SY2013/14 Room to Read has constructed and set up numerous libraries and provided books for schools in Siem Reap and Kampong Thom. In 2015-2016, multiple agencies, including Room to Read, supported reading activities in USDA supported primary schools. 156. The role of the community: The local school communities have made significant inputs into the programme results. School cooks are community members, who ‘volunteer’ their time in exchange for a small incentive of rice or cash payment. In addition, the LSFC coordinates parents and community members to provide firewood, water and vegetables to the schools so that school meals can be regularly provided. The community is also now responsible for the payment of incentives to the cooks. In some districts, these costs are now included within the Commune Investment Plan, which will ensure ongoing support to the programme. 157. Other partnerships: CARD, MoP, MoI, MAFF, national committees at provincial, district, commune and school levels were all involved in programme decision-making throughout the evaluation period. The Technical Working Group on Food Security and Nutrition coordinated by CARD is an effective structure for open partnership dialogues between WFP and other stakeholders involved in school feeding. WFP use this forum to work collaboratively towards information and experience sharing, informing policy and decision makers, and the transition to national ownership.
43
158. Funding: The FFE programme has been implemented with 100 percent funding as per the commitment document signed in 2013. However, future funding for FFE and for other programmes in Cambodia is uncertain. This is partly due to Cambodia reaching lower-middle-income status in 2016, which will probably mean that development partners will change their support policy from providing grants to soft or full loan commitments. In addition, USDA funding comes to an end in August 2019, which is too early for the planned transition to Government ownership and the Roadmap completion by 2021.
Key findings and conclusions – Question 3 • Most programme stakeholders have had partnerships with WFP over an extended period,
well beyond this period of FFE implementation. Overall, stakeholders recognized WFP Cambodia as a well-managed, strong, innovative and flexible office and reported that programme implementation has been well managed.
• WFP has rolled out a phone-based standardized feedback mechanism during this period. The feedback system has been successful at identifying problems with programme implementation, each of which has been appropriately addressed.
• The FFE programme has been well managed by the Education Unit, and appropriate improvements to programming have already been made for the new phase on the basis of programme monitoring data and input from implementing partners.
• The Education Unit, Logistics Unit and MERVAM Unit have all played important roles in the programme and have been positively reviewed by several programme stakeholders.
• Plan International’s implementation and monitoring of the programme has been strong. • Both WFP and PLAN lack the necessary expertise in literacy programming to implement the
full breadth of activities required to improve literacy. • The local school communities have made significant inputs into the programme including
providing cooks, firewood, water and vegetables to the schools so that school meals can be regularly provided.
2.4 Evaluation Question 4: How sustainable is the programme? 159. The evaluation has found that the FFE model of implementation – reliance on imported food commodities, is not the preferred modality of the MoEYS. Although the MoEYS appreciates the presence of both the FFE programme and WFP’s school feeding programme in general, they lack the capacity to deliver commodities to schools and their budgetary priorities are on teacher training and findings ways to recruit more - and better qualified - teachers rather than on school feeding. The Government therefore prefers cash-based modalities (lower logistic requirements) and prefers to implement a model that benefits the local economy and supports farmers, which is why USDA supports the piloting of a HGSF model. Furthermore, food fortification within Cambodia is not yet possible, despite salt iodization being mandatory by law. Key informants felt that the provision of locally fortified rice, salt and oil is unlikely in the near future. A landscape analysis is planned for late 2017/early 2018 which will bring more clarity on this issue. Overall, the evaluation therefore finds that the FFE model is not sustainable. 160. Although the ET has not evaluated WFP’s overall school feeding portfolio, the focus of the field mission on capacity building activities enables the ET to make some evaluation on the sustainability of school feeding in general and the transition to Government ownership. To evaluate the sustainability of school feeding in general and the likelihood of the activities within the Roadmap being achieved by 2021, the ET considered a number of key results including the results of the National Capacity Index (NCI), whether each of the short-term activities listed in the Roadmap have been completed and/or medium-term activities started, and whether the five quality standards of the Systems Approach for Better Education Results (SABER) initiative are in place (or in progress). These findings were then triangulated with the qualitative field
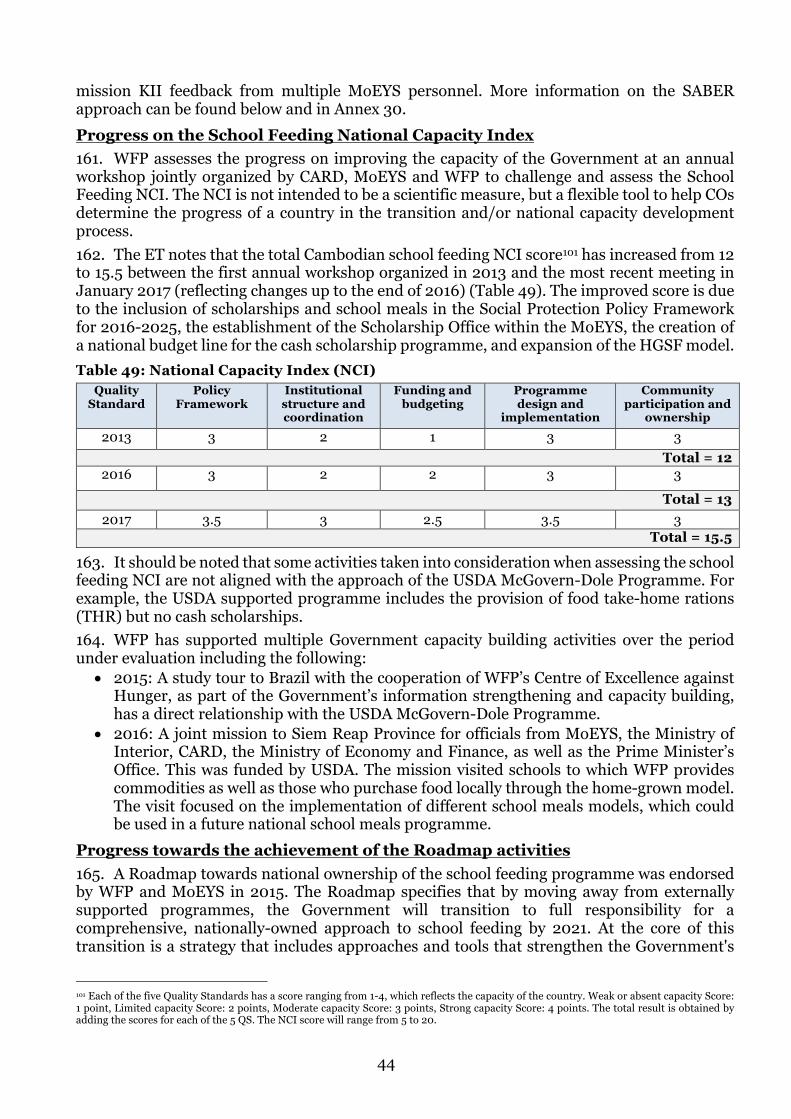
44
mission KII feedback from multiple MoEYS personnel. More information on the SABER approach can be found below and in Annex 30. Progress on the School Feeding National Capacity Index 161. WFP assesses the progress on improving the capacity of the Government at an annual workshop jointly organized by CARD, MoEYS and WFP to challenge and assess the School Feeding NCI. The NCI is not intended to be a scientific measure, but a flexible tool to help COs determine the progress of a country in the transition and/or national capacity development process. 162. The ET notes that the total Cambodian school feeding NCI score101 has increased from 12 to 15.5 between the first annual workshop organized in 2013 and the most recent meeting in January 2017 (reflecting changes up to the end of 2016) (Table 49). The improved score is due to the inclusion of scholarships and school meals in the Social Protection Policy Framework for 2016-2025, the establishment of the Scholarship Office within the MoEYS, the creation of a national budget line for the cash scholarship programme, and expansion of the HGSF model. Table 49: National Capacity Index (NCI)
Quality Standard
Policy Framework
Institutional structure and coordination
Funding and budgeting
Programme design and
implementation
Community participation and
ownership 2013 3 2 1 3 3
Total = 12 2016 3 2 2 3 3
Total = 13 2017 3.5 3 2.5 3.5 3
Total = 15.5
163. It should be noted that some activities taken into consideration when assessing the school feeding NCI are not aligned with the approach of the USDA McGovern-Dole Programme. For example, the USDA supported programme includes the provision of food take-home rations (THR) but no cash scholarships. 164. WFP has supported multiple Government capacity building activities over the period under evaluation including the following: • 2015: A study tour to Brazil with the cooperation of WFP’s Centre of Excellence against
Hunger, as part of the Government’s information strengthening and capacity building, has a direct relationship with the USDA McGovern-Dole Programme.
• 2016: A joint mission to Siem Reap Province for officials from MoEYS, the Ministry of Interior, CARD, the Ministry of Economy and Finance, as well as the Prime Minister’s Office. This was funded by USDA. The mission visited schools to which WFP provides commodities as well as those who purchase food locally through the home-grown model. The visit focused on the implementation of different school meals models, which could be used in a future national school meals programme.
Progress towards the achievement of the Roadmap activities 165. A Roadmap towards national ownership of the school feeding programme was endorsed by WFP and MoEYS in 2015. The Roadmap specifies that by moving away from externally supported programmes, the Government will transition to full responsibility for a comprehensive, nationally-owned approach to school feeding by 2021. At the core of this transition is a strategy that includes approaches and tools that strengthen the Government's
101 Each of the five Quality Standards has a score ranging from 1-4, which reflects the capacity of the country. Weak or absent capacity Score: 1 point, Limited capacity Score: 2 points, Moderate capacity Score: 3 points, Strong capacity Score: 4 points. The total result is obtained by adding the scores for each of the 5 QS. The NCI score will range from 5 to 20.
45
institutional capacity to design, finance and manage the programme over time. The Roadmap is organized according to a set of short (2015-2016), medium (2017-2020) and long-term (2021 onward) periods, and aligns with the quality standards of the SABER approach. 166. The ET note that most of the short-term activities outlined in the Roadmap have been completed within the allocated time frame, except for a School Feeding Budget. Key informant interviews indicate that an operational School Feeding Budget Line (and its precursor, a School Feeding Policy) are critical to the sustainability of school feeding in Cambodia. To date, the Government’s main direct input to the programme is the annual contribution to WFP of 2,000 mt of rice per year, some of which is used for school feeding activities. Progress towards the SABER quality standards 167. The SABER approach (School Feeding) is a Government-led process that helps to build effective school feeding policies and systems. The approach was developed by the World Bank in 2013, and outlines five quality standards that should provide the foundation for strong nationally-led and sustainable school feeding programme: • Strong policy frameworks • Strong institutional structure and coordination • Stable funding and budgeting • Sound programme design and implementation, including evaluation • Strong community participation and ownership.
168. Policy frameworks: There is a misalignment between the FFE indicator and the Roadmap in terms of policy framework. One of the indicators for the FFE was to have a National School Feeding Policy operational by the end of the 2013-2016 phase, while the Roadmap pushes the policy into medium-term targets. Given the current capacity of the MoEYS, the evaluation finds the medium term more reasonable, although this will make a 2021 completion difficult. 169. Institutional structure and coordination: This is perhaps one of the areas of greatest progress, as WFP has supported the establishment of multiple school feeding coordination bodies albeit before the period under evaluation. These include a central level Project Coordination Committee (PCC) and a School Feeding Task Force (SFTF) established in 2011. The PCC is chaired by the Secretary of State, with multiple Directors from MoEYS departments as members.102 The SFTF is chaired by the Director of Primary Education with nine other members from relevant MoEYS technical departments, to support the management and implementation of the programme on the ground and to regularly provide updated information on the programme to the PCC team. 170. These structures have been replicated at sub-national level through the establishment of Provincial School Feeding Committees (PSFCs) and District School Feeding Committees (DSFCs). At school level, the LSFC ensures regular implementation, including daily food management, preparation and serving breakfast to children, and reporting. This scheme is not limited to the three USDA supported provinces, but implemented in all provinces where WFP implements the education component of its country programme. 171. At both national and sub-national level, these implementing bodies have contributed to overall planning, implementation, coordination and monitoring of school feeding activities within the framework of their limited capacity. 172. Funding and budget: Government ownership has improved over recent years, including through the handover of responsibility for the THR programme in nine districts in SYs 2012/13 and 2013/14. In SY2014-15, the Government took on full ownership in budgeting for and implementing the primary school scholarship programme in those districts. However, 102 Departments include General Education, Primary Education, School Health, Early Child Care, Planning and Curriculum Development
46
there is still no school feeding budget line, and the qualitative field mission found that the MoEYS’s spending priorities include improving teachers’ salaries and recruiting and retaining better qualified teachers, rather than on the implementation of school feeding. 173. Programme design and implementation: A critical component of the Roadmap is the identification and development of suitable implementation approaches which reflect the Government’s priorities and institutional capacity. Although the transition to a national school feeding programme is for 2021, there is still uncertainty on the capacity of the MoEYS. Using USDA funds, WFP has supported the MoEYS to undertake research on the effectiveness and capacity of the Government to manage cash scholarships and HGSF modalities for providing school feeding. 174. Community participation and ownership: Strong community participation has been identified as a major element towards national ownership by both WFP school feeding policy and the SABER approach, as well as the USDA Results Framework. 175. Since 2015, food THRs are no longer provided by the programme as incentives for cooks and storekeepers. Local authorities and communities are encouraged to mobilize resources locally to complement the increased engagement from Commune Councils and District Governors. As noted by WFP, “in successful cases, cooks received more than the basic stipends. The experience varies widely across the many schools and communities, leading to uneven compensation and motivation of cooks”.103 Communities are also providing other contributions for the building and rehabilitation of school infrastructures, including wells, latrines and fuel-efficient stoves as described in Section 2.1. 176. The mid-term evaluation (MTE) of the current WFP country programme highlighted a widespread tendency by parents and community representatives to depend on WFP assistance to maintain school feeding activities. On the other hand, due to the high level of poverty in WFP assisted schools, the same MTE indicated that there is a demonstrated limitation to the contribution, be it in-kind or in cash, that parents and communities can afford in support of school feeding activities. This was confirmed by the community mobilization study by PLAN104 which found that stakeholders were not confident that the SMP could be sustained if funding from development partners was significantly reduced. This was due to the limited involvement of local government and the limited ability of the local community to increase the regularity and size of payments if necessary. 177. Overall, the evaluation finds that the level of Government capacity on school feeding is currently consistent with SABER level 1 (out of 5) (see Annex 30). This means that the suggested timeline of the current Roadmap is unlikely to be achieved by 2021.
Key findings and conclusions – Question 4 • Reliance on imported, fortified food commodities is not the preferred school feeding modality of
the Government. Therefore, the evaluation finds that the USDA McGovern-Dole model is not sustainable as such.
• Through USDA funding, WFP has contributed to gradually strengthening institutional capacities at MoEYS central and sub-national levels, as well as local communities. These human resources will be important in identifying and implementing the most appropriate school feeding models.
• A Roadmap was adopted in 2015 to guide the Government and partners to produce a national strategy to ensure a fully Government-owned and operated school feeding programme. The examination of the information collected in the light of the performance drivers commonly used to benchmark school feeding systems, in compliance with the five SABER quality standards, shows that the transition to a national school feeding programme is still at the very early stage. This suggests that the present timeframe set to fully roll-out the Roadmap is over-ambitious.
103 WFP Semi-annual Report Narrative, April 1, 2016 – September 30, 2016. 104 PLAN International (2017) Program review of local authority and community mobilization for school feeding. Key findings and lessons learned. PLAN International Cambodia.
47
3 Conclusions and Recommendations
178. The following section describes the main conclusions of the evaluation. The conclusions are organized as per the international evaluation criteria: relevance, effectiveness, impact, efficiency and sustainability. This is followed by six recommendations of how WFP, MoEYS and other programme partners can act to build on the key findings. 3.1 Overall Assessment/Conclusions Relevance 179. The FFE programme aims to improve literacy among school-aged children, and improve the use of health and dietary practices. These objectives broadly align with Government policies and strategies, although most stakeholders aside from WFP and PLAN were not aware of either of these two objectives. The provision of school feeding aligns well with official policies and strategies, and with WFP’s own corporate guidance, but there is a misalignment between the food security and nutrition objectives of WFP’s other school feeding activities and the USDA’s literacy objective of the FFE programme. Similarly, there is a growing disconnect in the modality of the FFE programme, with in-kind support not being the preferred model of the Government. To resolve this difference, with the support of USDA, WFP is currently piloting other school feeding models that utilize local commodities. 180. The school feeding activities and the complementary activities within the FFE programme also align well with the work of other development actors. Overall, this evaluation found the FFE programme to be appropriate to the education, food security, and gender contexts, and coherent to the policy framework of the Government as well as to WFP corporate guidance. Effectiveness 181. The FFE programme has enabled WFP to implement multiple capacity building activities and provide support to the MoEYS, including funding research into other school feeding modalities. WFP has also effectively contributed to Cambodia’s policy direction, by supporting the development of Government policies, strategies and guidelines particularly related to school feeding and school health, some of which are now operational. However, key Roadmap targets of developing a National School Feeding Policy and establishing a central school feeding coordination unit have not been achieved. 182. The evaluation finds that overall the FFE activities have been well implemented and most of the output targets have been achieved. The school meals and THR are intended to act as incentives for children to enrol, attend and remain in school. The evaluation found that both these indicators have been high since baseline with no difference in enrolment rates or school attendance found between intervention and comparison schools. Primary school drop-out rates have been consistently higher than the national average in all USDA supported provinces, with rates for boys higher than for girls. Although still high, the drop-out rates have reduced considerably over the period, with rates in Siem Reap below the national average by SY2015/16. To continue to effectively reduce dropout rates, schools will need to provide THR to both boys and girls depending on individual circumstances. 183. WFP and PLAN have successfully provided school meals and THR to more than 500,000 beneficiaries and the school meal has been effective at improving children’s attentiveness in morning classes. Children in afternoon sessions are not provided with any food in schools, so parents provide a meal at home before school starts. Household interviews indicate that the presence of the school meal has acted as an important social safety net for poor households who might otherwise be unable to provide breakfast to their children. 184. USDA funding has enabled WFP and PLAN to conduct numerous trainings for teachers, cooks, storekeepers, MoE officials and parents. Most cooks and storekeepers in SMP+THR
48
schools achieved a passing score on a test on good nutrition and dietary practices, and now prepare food and store food in a more appropriate way. Overall, the evaluation finds that the training activities have been effective in enabling school personnel to implement and manage the programme more effectively. The evaluation found that community awareness campaigns have also been effective, with most parents (80 percent) now able to name at least three benefits of education. Trainings for parents on health, hygiene and nutrition have also been effective with almost all (90 percent) surveyed parents recalling the main messages of the training. 185. The FFE programme has been effective at improving school infrastructure, with SMP+THR schools having considerably better infrastructure than THR and comparison schools. Most SMP+THR schools now have dedicated kitchens (93 percent), food storerooms (75 percent), school gardens (87 percent), functioning latrines (100 percent), and soap at handwashing stations (97 percent). Almost half the SMP+THR schools (45 percent) also use energy efficient stoves, while none were found in THR or comparison schools. In addition, 80 percent of SMP+THR schools had separated latrines for boys and girls. This is like the comparison schools, but considerably higher than in THR only schools (67 percent). 186. The evaluation found that both Strategic Objectives of the programme have been met. Activities implemented under SO 1 have resulted in most students in all surveyed schools, regardless of intervention type, performing well in the Grade 6 reading comprehension test, and performing better than the national average in literacy. Activities under SO 2 have helped more SMP+THR schools storing food off the ground, having year-round access to clean water, and providing soap handwashing facilities. 187. The programme has also contributed to gender equality and improving the school environment for both girls and boys. The construction and rehabilitation of separate latrines for girls and boys has contributed to a more conducive school environment, and is likely to result in more regular attendance for girls, although there is no monitoring data available on this. The THR have been provided to both boys or girls based on poverty criteria, with girls being prioritized in locations with gender inequality in schooling. The FFE programme found that 56 percent of the THR beneficiaries were girls, although data indicates higher drop-out rates in boys. 188. Overall, the evaluation found that SMP+THR schools have received more support, and therefore performed better on multiple indicators. It is noteworthy that USDA support has resulted in a parallel system of support to schools in the three targeted provinces. Schools supported by USDA have received multiple interventions over a long period of time, while other schools are behind. It will therefore be of key importance WFP and MoEYS to take note of the activities that have been particularly effective and scale up these activities. This should include literacy related activities, training for parents and community sensitization, infrastructure development and the provision of a school meal. 189. Impact 190. This evaluation was not designed to be an impact evaluation, so it is not possible to determine the impact that can be attributed to USDA support. Further, the evaluation found multiple agencies working in FFE schools, many of which implement school infrastructure development, and/or provide education or literacy resources. This makes attribution of USDA support even more difficult for some indicators. However, for programme indicators related specifically to school meals and to activities not implemented by any other agency, such as education campaigns, community mobilization and training of school personnel, it is clear that USDA support and WFP, MoEYS and PLAN’s implementation have contributed significantly to the achievement of programme outcomes. 191. The ET note that although the qualitative field mission found that the presence of regular school meals acts as a safety net for poor families, the full extent of the impact on the food
49
security of the household is not well captured in the monitoring findings. The food security and nutrition findings are mixed, and show no difference between USDA supported households and the comparison group. Efficiency 192. The evaluation found that the WFP system of delivering food to schools was efficient. In general, WFP provided high quality food commodities with no complaints, and minimal loss of food during transportation. 193. The findings from the comprehensive WFP monitoring system has also contributed to the efficient implementation of the programme, and changes in implementation as required. Sustainability 194. The current FFE modality of providing imported food commodities is not a sustainable model as the Government prefers cash-based assistance and/or models that support local farmers. Through WFP’s support, the Government is currently piloting different modalities to determine which are most effective and which ones the Government has the capacity and resourcing to implement. 195. The evaluation rates the current capacity of the MoEYS at Stage 1 of the transition stages according to the SABER approach. Given that there is still discussion on the modalities of a nationally owned school feeding programme, and the capacity of the government to manage it, the evaluation finds the timeline outlined in the Roadmap for transitioning to national ownership to be too ambitious. 3.2 Recommendations 196. Although the evaluation has taken place soon after the official end of the extended 2013-2016 implementation period (in fact extended to June 2017), the CO management has already taken decisions about the new USDA-supported programme based on their own monitoring results, and stakeholder input from the 2013-2016 phase. This was necessary due to the new grant proposal process in 2015 in preparation for the 2017-2019 period. These decisions have resulted in changes to the 2017-2019 phase of programming including establishing new partnerships (World Education and KAPE) to strengthen the implementation of the literacy component, removing YSP from the school meals, and supporting the MoEYS to undertake research on Government-preferred school feeding models. The ET feels that had the evaluation taken place immediately after SY2015/16, the team would have made similar recommendations. The ET believe that the current implementation approach is appropriately moving forward. 197. The focus of the 2017-2019 phase on the implementation of the Roadmap and capacity building of the government means that the ET has prioritized recommendations related to the transition to a nationally owned school feeding programme. Given the tight timeline identified in the Roadmap and the current capacity of the MoEYS, the evaluation finds that WFP Cambodia’s immediate priority moving forward must be on building Government structures for future school feeding implementation and management. The evaluation finds that the Government’s preference for a national school feeding programme centres on cash scholarships and HGSF. However, it is not possible to determine if the Government can dedicate adequate resources to school feeding given the numerous competing demands and priorities. 198. Based on the findings and conclusions of this evaluation, the recommendations of the evaluation team are outlined below. The recommendations are listed in priority order.
50
Immediate priority – to be initiated or completed within 6 months Recommendation 1: Continue implementation of the USDA McGovern-Dole Program as per the current agreement (2016). Recommendation 2: In recognition that research findings are imminent from the MoEYS on the cost effectiveness of the cash scholarship model, and the capacity of the MoEYS to implement a HGSF model of school feeding, the ET recommend that WFP and the Royal Government of Cambodia review the research findings as priority. This review should result in decisions that will guide the short/medium term development of a national school feeding approach. This decision should be made with input from other ministries such as Ministry of Economics and Finance, Ministry of Planning and the Ministry of Interior as appropriate. • The inclusion of both school meals and scholarships in the 2017 National Social
Protection Framework indicates that future schools feeding activities should involve other ministries, in addition to the MoEYS, particularly those involved in social protection. Considering this, the evaluation recommends that the Government review which ministry/ies are now best placed to move the school feeding agenda forward.
Recommendation 3: Based on the research findings and decisions made above, the Roadmap should be reviewed by the WFP CO, the MoEYS and other ministries and partners as appropriate. The review should focus on identifying the priority actions required to coordinate and oversee implementation of a nationally owned school feeding programme (including budget). • The review should also involve the development of a school meals implementation
transition plan that includes specific responsibilities, timelines and budgets. Recommendation 4: Recognizing that most WFP personnel have skills in programme implementation but not in governance and capacity building per se (including strategic planning, policy development, organizational development etc.), the evaluation recommends steps be taken to strengthen the capacity of the WFP CO in this regard. The ET supports the notion of a workforce planning exercise aligned with the Country Strategy development process, to ensure CO staff skills are appropriate for the transition from implementation to enabling. • Depending on the result of the workforce review, WFP CO may need to look for
opportunities for training from WFP RBB or HQ or other agencies as needed, including on strengthening Government institutions.
Medium priority – to be implemented by the end of the 2017-2019 phase Recommendation 5: The ET understands that Government planning and budgeting processes for 2018 have already been finalized, and that no additional Government contributions to school feeding are likely to be made before 2019. The ET therefore recommends that for the next phase of planning the WFP CO works closely with Government counterparts at central and local levels to ensure that school feeding is appropriately reflected the next government budget cycle. • This may include the development of formal school meal contribution plans with annual
contribution targets. Recommendation 6: The WFP CO and the implementing partners (World Vision and PLAN International) should aim to have a minimum package of infrastructure facilities including kitchens, energy efficient stoves, store rooms, handwashing facilities and separate latrines for girls and boys in all USDA supported schools with the school meals programme. This should help ensure that schools would be able to function efficiently under a national school feeding programme.
51
Recommendation 7: The ET recommends that the WFP CO considers opportunities to undertake additional pieces of research: • Effectiveness of THR/scholarships: Given that there are currently several USDA
McGovern-Dole Programme evaluations underway or planned in the Asia region, the ET recommends the RBB, with support from COs and HQ as appropriate, undertakes a meta-analysis of the successes and weaknesses of the USDA McGovern-Dole Programme approach to school feeding.
• Increasing micronutrient content of the school meal: The ET recognizes that iron-deficiency anaemia is endemic in Cambodia, and that it will be important for a nationally owned school feeding programme to provide a nutritionally balanced meal. Given the lack of fortification capability in Cambodia at present, the ET recommends WFP CO conducts research on alternative, cost-effective strategies to provide a nutrient rich school meal. These strategies can then be considered by the Government in addition to the ongoing work to promote local fortification in Cambodia.
52
4 Bibliography
ActionAid (2014) Flood Impacts on Women: Exploring the Possibility of Gender Sensitive DRR Planning. Asian Development Bank (2014) Cambodia Country Poverty Analysis. Bundy, D (2009) Rethinking School Feeding: Social Safety Nets, Child Development, and the Education Sector. WFP/The World Bank, 2009. Cambodia Inter-Censal Population Survey (2013) CSO report on Cambodian gender issues (2009) GIZ Website (2017) Decentralisation and Administrative Reform Programme. https://www.giz.de/en/worldwide/17335.html. Accessed 23 August. Hanushek and Rivkin (2012) The Distribution of Teacher Quality and Implications for Policy. Annual Review of Economics. http://www.fao.org/cambodia/news/detail-events/en/c/854063/ http://www.who.int/nutgrowthdb/about/introduction/en/index5.html MoEYS/WFP (2016) Updated School Meal Programme Guidelines MoEYS/WFP School Feeding Roadmap. Signed 28 April 2015. Molinas, L. & Regnault de la Mothe, M. (2009) The multiple impacts of school feeding: a new approach for reaching sustainability. In: WFP (2010) Revolution: From food aid to food assistance: Thematic Areas, Chapter 14, p217-230. Nielsen, N et al (2010) WFP Cambodia School Feeding 2000-2010e: A mixed method impact evaluation. DARA. For WFP Office of Evaluation, Rome. OE/2011/008. Ouma, E. (2016); Promotion of school gardens for better nutrition. PowerPoint presentation given at Food and Nutrition Forum. 31 May 2016. Reed S. et al (2014) Operational Evaluation - WFP Cambodia Country Programme 200202. A mid-term evaluation of WFP’s Country Programme 2011-2016. The KonTerra Group. SBK Research and Development (2017) School Assessment Report 2015-2016. For World Food Programme Cambodia. Sokrathna, P. (2016) Gender review of food security and nutrition policies. Sustainable Development Goals 2,5 and 17. Cambodia. Sopha, A. et al (2015) Teaching Hours in Primary Schools in Cambodia. NGO Education Partnership (NEP), www.nepcambodia.org The Royal Government of Cambodia (2013) Rectangular Strategy for Growth, Employment, Equity and Efficiency. Phase III. Page 37. The Royal Government of Cambodia (2014) Cambodia Demographic and Health Survey. National Institute of Statistics and Director General of Health. Phnom Penh The Royal Government of Cambodia (2014) Cambodia Demographic and Health Survey. National Institute of Statistics and Director General of Health. Phnom Penh The Royal Government of Cambodia (2014) Cambodia Socioeconomic Survey. National Institute of Statistics, Ministry of Planning; Available at: https://www.unicef.org/cambodia/6.Maternal.pdf
53
The Royal Government of Cambodia (2014) Education Strategic Plan 2014-2018. Ministry of Education, Youth and Sport The Royal Government of Cambodia (2014) National Strategic Development Plan 2014-2018. Pages 86, 180-198. The Royal Government of Cambodia (2017) School garden preparation and nutrition education. Phnom Penh. The Royal Government of Cambodia. The set of resources includes Guidance for Trainers, Guidance for Teachers, and Textbooks for students in Grades 4-6. CARD, MOEYS, & FAO The Royal Government of Cambodia (2017) Education congress. The Education, Youth and Sport Performance in the Academic Year 2015-2016 and Goals for the Academic Year 2016-2017. 21-23 March 2017. Ministry of Education, Youth and Sport. The World Bank (2013) Policy Note on Poverty Monitoring and Analysis, October 2013 The World Bank Open Data: http://data.worldbank.org/ UNDP (2015) Adaptive Social Protection in Cambodia. Strategy Paper. UNDP (2016) Human Development Report 2015. UNEG (2014) Integrating Human Rights and Gender Equality in Evaluations. Guidance document. August 2014. USDA (2016) Food Aid Proposal Guidance. Annex III: Manual for the Use of Results Frameworks and Indicators. Food Assistance Division, Office of Capacity Building and Development, Foreign Agricultural Service, USDA. USDA/WFP Commitment Letter for Agreement # FFE-442-2013/035-00. Signed 9 September 2013. WFP (2009) Gender policy: promoting gender equality and the empowerment of women in addressing food and nutrition challenges. WFP/EB.1/2009/5-A/Rev.1 WFP (2014) WFP Strategic Plan (2014-2017) https://www.wfp.org/about/strategic-plan WFP (2016) Cambodia County Progress Report. Innovations from the field: Gender mainstreaming from the ground up. Institute of Development Studies. WFP Cambodia (2016) Household Resilience in Cambodia: A review of livelihoods, food security and health, May 2016. WFP (2016) Gendered nature of intra-household decision-making in Cambodia. WFP Cambodia. Phnom Penh. WFP Country Programme Cambodia 200202 (2011-2018). WFP/EB.A/2011/9/1 WFP Semi-annual Report Narrative, April 1, 2016 – September 30, 2016. WFP, ActionAid, ADB, Danish Red Cross, Save the Children and UNICEF (2012) Cambodia Post-Flood Relief and Recovery Survey. Wieringa, F. (2014) Final Report FORISCA Project. Institute of Research for Development. Wieringa, F., Chamnan, C. & Kuon, K (2016) Acceptability of different types of rice fortified with multiple micronutrients in women of reproductive age, working in a garment factory. A comparison between coated and extruded fortified rice. Institute of Research for Development.
54
WFP Cambodia http://www1.wfp.org/countries/cambodia
Ph
nom
Pen
h, D
ecemb
er 20
17
, Rep
ort Nu
mb
er