Embed Size (px)
Citation preview

2015 NWA Technology Conference
Kobra Eghtedary, PhD
Director of Data, Research & Technology
Michigan WIC Program
Michigan Department of Health & Human Services
MI-PNSS & PedNSS

Project Team
Michigan WIC - Project Planning, Design & Implementation
Kobra Eghtedary, PhD
Bagya Kodur, MS
Three Sigma Software - Design & Development Vendor
Kamalesh Bandanadham
Ramesh Balyam
Bicoastal Hills Consulting - Project Consultant
Craig Hill
Pilot States
MWR: Minnesota, Ohio, Wisconsin, Indiana, Illinois
Hawaii
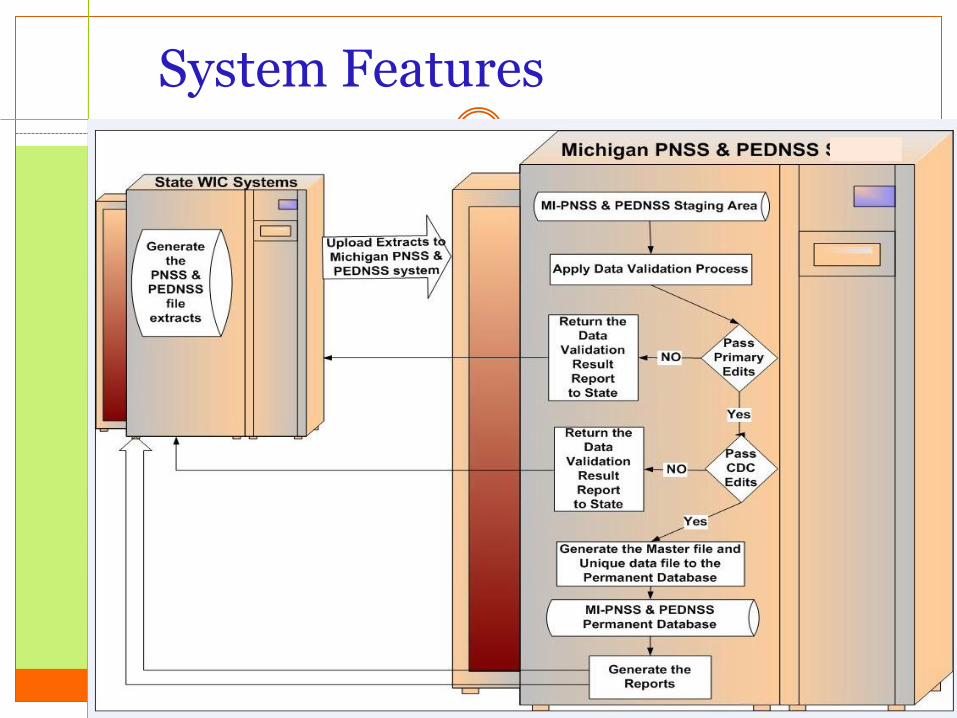
System Features


MI-PNSS & PedNSS
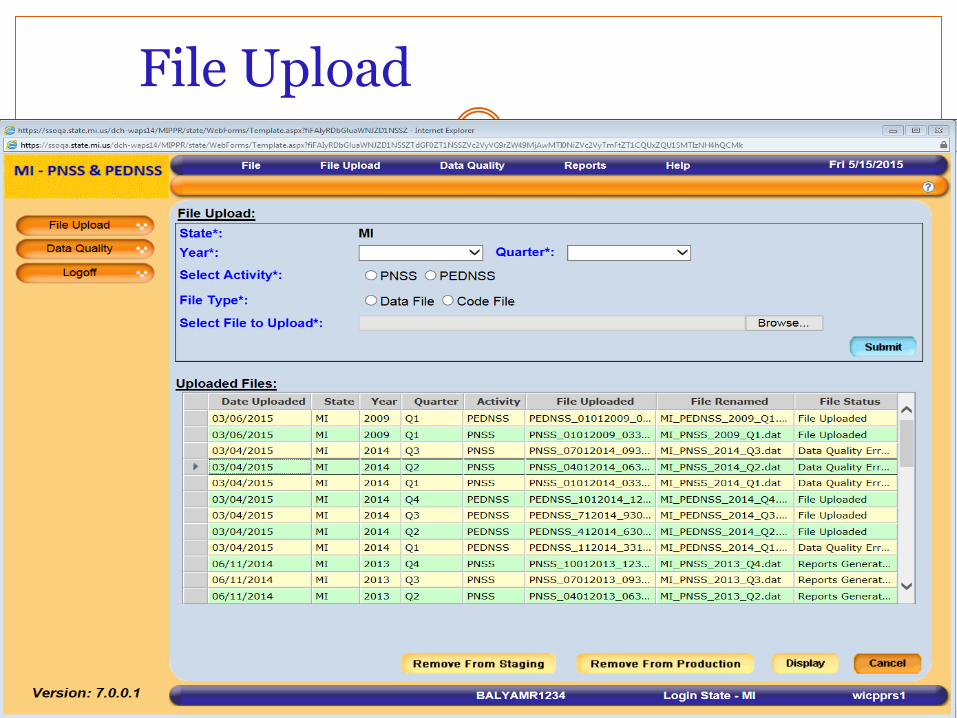
File Upload

Data Quality Summary

Data Quality Details
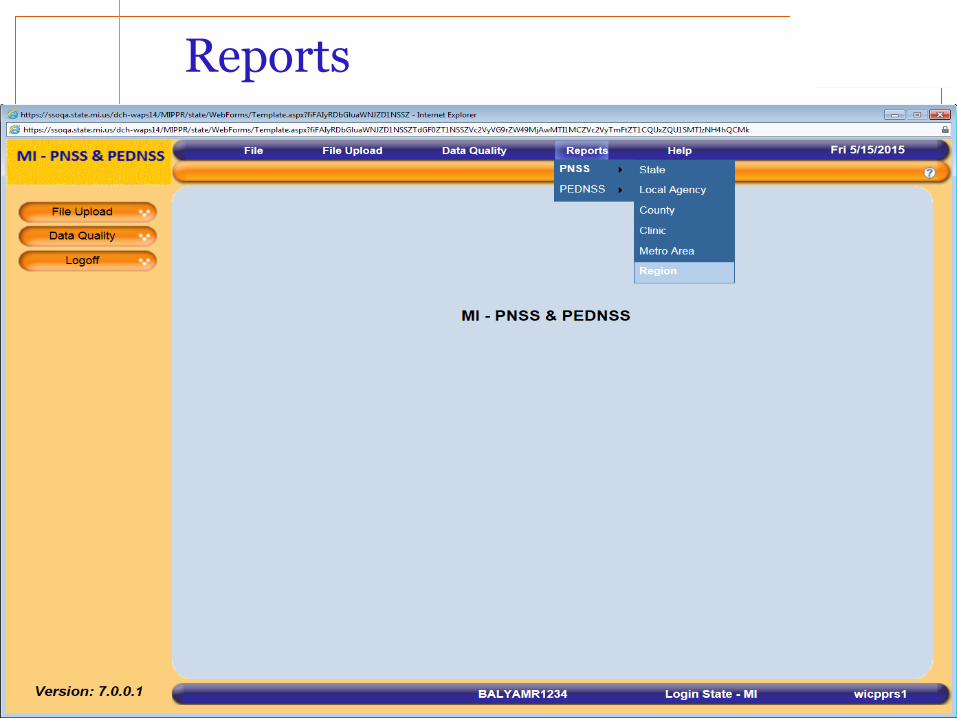
Reports

Reports – PNSS 2014

2014 PNSS Trends Report

PedNSS 2014- Michigan
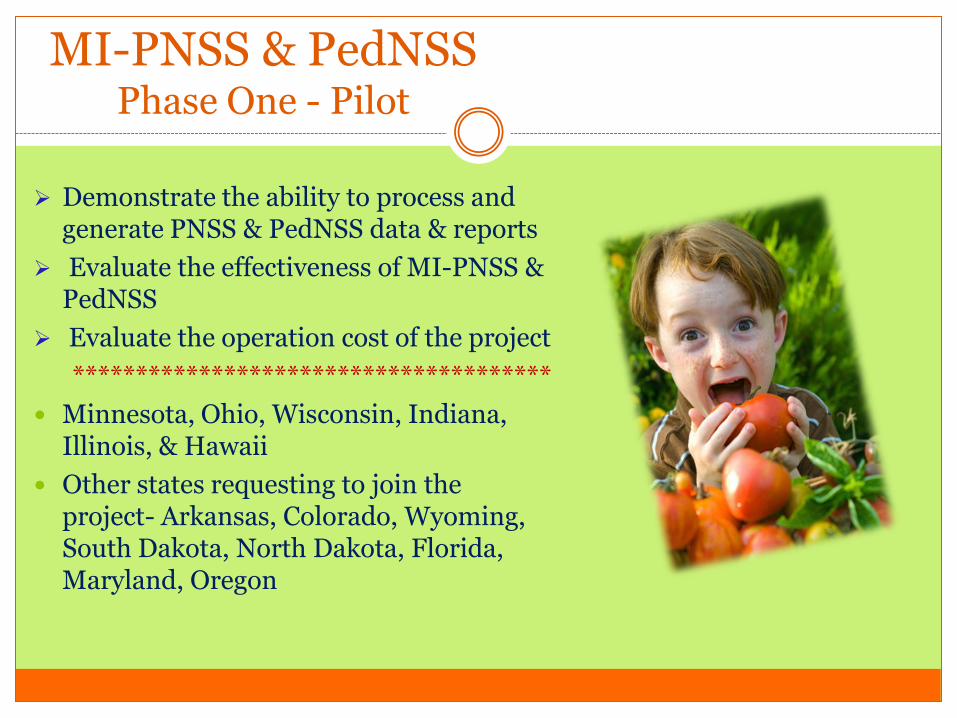
MI-PNSS & PedNSS Phase One - Pilot
Demonstrate the ability to process and generate PNSS & PedNSS data & reports
Evaluate the effectiveness of MI-PNSS & PedNSS
Evaluate the operation cost of the project
**************************************
Minnesota, Ohio, Wisconsin, Indiana, Illinois, & Hawaii
Other states requesting to join the project- Arkansas, Colorado, Wyoming, South Dakota, North Dakota, Florida, Maryland, Oregon
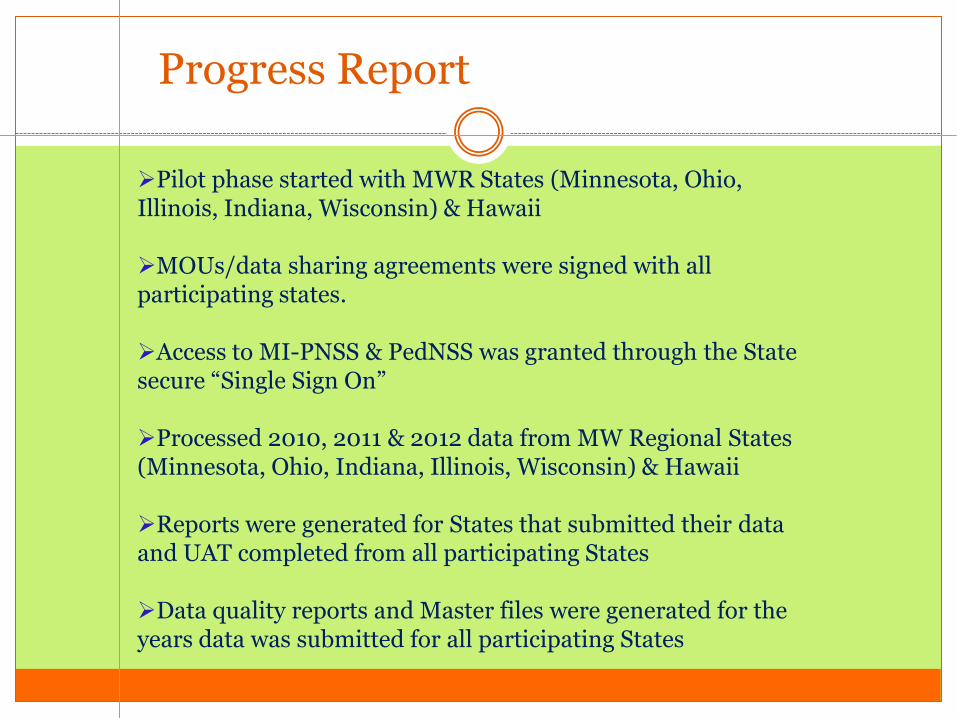
Progress Report
Pilot phase started with MWR States (Minnesota, Ohio, Illinois, Indiana, Wisconsin) & Hawaii MOUs/data sharing agreements were signed with all participating states. Access to MI-PNSS & PedNSS was granted through the State secure “Single Sign On” Processed 2010, 2011 & 2012 data from MW Regional States (Minnesota, Ohio, Indiana, Illinois, Wisconsin) & Hawaii Reports were generated for States that submitted their data and UAT completed from all participating States Data quality reports and Master files were generated for the years data was submitted for all participating States

Progress Report
• Michigan, Minnesota, Wisconsin & Ohio:
• 2010, 2011, 2012, 2013 & 2014
PNSS & PedNSS
• Indiana: • 2010, 2011, 2012 & 2013
PNSS & PedNSS
• Hawaii: • 2010, 2011, 2012, 2013 & 2014
PedNSS • 2010, 2011 PNSS

Data Sharing Agreement/MOU

Michigan De-duplicated Enrollment by Race, FY 2014
Race
Category
Total % Enrolled I/C W
White 178,799 77,777 256,576 62.1
Black or African American 81,766 33,267 115,033 27.9
Multi-Racial 26,971 4,613 31,584 7.6
Asian 5,080 2,444 7,524 1.8
American Indian/Alaskan Native 1,307 634 1,941 0.5
Native Hawaiian/Other Pacific
Islander 169 106 275 0.1
Total 294,092 118,841 412,933 100.0
12.5% of total
de-duplicated enrollees are
Hispanic:
I/C 39,483
W 11,834
Total 51,317
91.4 % of PG women enrolled
return to WIC postpartum

Indicators 2004 2014
Progress
Direction
First Trimester Entry into WIC 31.3 35.8
Birth weight: • LBW <2500 g
• Full Term LBW
• HBW >4000 g
• % Preterm Infants
7.7
--
8.3
--
9.1
3.8
7.0
11.8
Breastfeeding: • Initiation
• 6 Months Duration
50.5
14.6
63.6
17.7
Prenatal Weight Gain: • <Ideal
• >Ideal
26.0
48.9
17.3
52.3
Body weight: • 85th-<95th%, ≥2yrs
• ≥95th%, ≥2yrs
16.1
13.2
16.7
14.2
Anemia, Low Hg, 3rd Trimester 30.4 39.5
Anemia, Low Hg, 6 months - 5 yrs. 13.1 19.0
Prenatal Smoking, Last Trimester 23.0 16.4
First Trimester Prenatal Care 74.1 79.6
Prepregnancy: • Overweight/Obese
• Underweight
51.7
4.8
56.2
4.3
Michigan WIC Top Ten List

Michigan WIC Five-year-plan The Health Outcome Indicators
January 2014 To December 2018
• Increase first trimester entry into the WIC program from 35.8% to 40.0%.
• Increase ideal prenatal weight gain from 30.4% to 33.5% among Michigan WIC mothers.
• Reduce the percent of low birth weight infants born to women enrolled in Michigan WIC from 9.1% to 8.5%.
• Increase breastfeeding initiation rate from 63.6% to 67.0% and the six-month duration rate from 17.7% to 20.5%.
• Decrease the prevalence of early childhood obesity, in children 2 to 5 years of age, from 14.2% to 13.5%.
• Decrease the prevalence of low hemoglobin level from 19.0% to 17.0% among children less than five years of age.
The projections are based on the 2004-2014 trend data from MI-PNSS & PedNSS. 2014 data is
used as the baseline for a five-year-plan from Jan. 2014 to Dec. 2018.
Update: March 2014, KE

Health Progress Review 2009 -2013 Five Year Plan
17.5
14.1
17.7
63.1
8.7
30.7
36.9
13
12
24
65
8
31.5
35
15
13.7
18.5
57.2
8.4
28.8
32.5
0 10 20 30 40 50 60 70
Low HGB in <5yrs
Obesity (>=95)
6 mth. Duration
BF initiation
Low Bt Wt of infants
Ideal PG Wt Gain
First Trimester Entry
Actual 2009
Proj. 2013
Actual 2013
MI-PNSS & PedNSS

Health Progress Review 2009 -2013 Five Year Plan
-16.7%
-2.9%
-4.3%
-3.6%
10.3%
6.6%
13.5%
-20.0% -15.0% -10.0% -5.0% 0.0% 5.0% 10.0% 15.0% 20.0%
Low HGB in <5yrs
Obesity (>=95)
6 mth. Duration
BF initiation
Low Bt Wt of infants
Ideal PG Wt Gain
First Trimester Entry
Better
Worse
Percent Change 2009 – 2013
MI-PNSS & PedNSS


Trends in 1st Trimester Entry into WIC Program by Race/Ethnicity
2004 2005 2006 2007 2008 2009 2010 2011 2012 2013 2014
Total 31.3 32.6 33.7 32.3 32 32.5 37.5 36.7 38 36.9 35.8
White 35.6 37.7 37.6 36.5 36 36.8 42.2 41.2 41.7 40.7 39.5
Black 20.9 22.4 22.9 21.1 21.3 21.6 26 25 27.9 26.9 26.3
Hispanic 35.5 37.1 40.4 39.4 40 39.8 44.2 44.8 47.3 45.4 42.4
0
5
10
15
20
25
30
35
40
45
50
Per
cen
t
PNSS 2014
Native American 2014 Rate, 46.3%

First Trimester Entry into WIC by Local WIC Agencies
0
10
20
30
40
50
60
LM
AS
Ch
ipp
ewa
Mu
skeg
on
Sta
te, M
I
Gen
esse
e
Urb
an
L
MW
R
Oak
lan
d
59.1 57.8
49.8
35.7
26.9 26.4 25.7 25.2
Per
cen
t
PNSS 2014

Trends in High Birth Weight by Race/Ethnicity
2004 2005 2006 2007 2008 2009 2010 2011 2012 2013 2014
Total 8.3 8 7.6 7.6 7.5 7.1 7.2 7.1 7.3 7.2 7
White 9.7 9.3 9.1 9.1 9 8.5 8.7 8.6 8.9 8.9 8.5
Black 5.2 5 4.5 4.4 4.2 4 4 4.1 3.8 3.8 3.9
Hispanic 9.6 9.2 8.8 8.1 8.4 7.8 7.5 7.6 8.5 8.3 8
0
2
4
6
8
10
12
Per
cen
t
PNSS 2014
Native American 2014 Rate, 12.6%
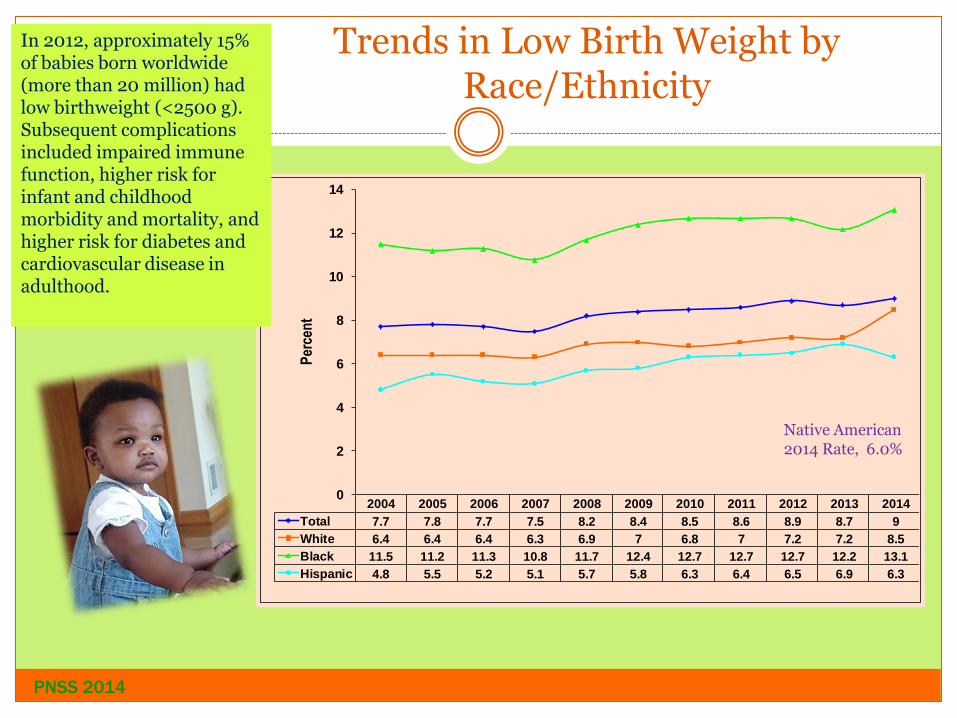
Trends in Low Birth Weight by Race/Ethnicity
2004 2005 2006 2007 2008 2009 2010 2011 2012 2013 2014
Total 7.7 7.8 7.7 7.5 8.2 8.4 8.5 8.6 8.9 8.7 9
White 6.4 6.4 6.4 6.3 6.9 7 6.8 7 7.2 7.2 8.5
Black 11.5 11.2 11.3 10.8 11.7 12.4 12.7 12.7 12.7 12.2 13.1
Hispanic 4.8 5.5 5.2 5.1 5.7 5.8 6.3 6.4 6.5 6.9 6.3
0
2
4
6
8
10
12
14
Per
cen
t
PNSS 2014
Native American 2014 Rate, 6.0%
In 2012, approximately 15% of babies born worldwide (more than 20 million) had low birthweight (<2500 g). Subsequent complications included impaired immune function, higher risk for infant and childhood morbidity and mortality, and higher risk for diabetes and cardiovascular disease in adulthood.

Trends in Low Birth Weight by Trimester Entry
PNSS 2014
2009 2010 2011 2012 2013 2014
Total 8.4 8.5 8.7 8.8 8.7 9.1
1st trimester 7.7 7.7 7.9 8.4 7.9 8.4
2nd trimester 8.3 9.0 8.9 8.9 8.5 9.0
3rd trimester 6.7 6.4 6.6 6.2 6.5 6.9
Postpartum 11.2 11.1 11.6 11.8 12.5 12.2
0.0
2.0
4.0
6.0
8.0
10.0
12.0
14.0
Pe
rce
nt

Trends in Full Term Low Birth Weight by Race/Ethnicity
2009 2010 2011 2012 2013 2014
Total 3.5 3.6 3.6 3.7 3.7 3.8
White 2.8 2.8 2.8 3 3 3
Black 5.5 5.8 5.5 5.3 5.4 5.7
Hispanic 2.5 2.3 2.7 2.6 2.8 2.6
0
1
2
3
4
5
6
7
Pe
rce
nt
PNSS 2014
Native American 2014 Rate, 3.8%

Trends in Full Term Low Birth Weight by Trimester Entry
PNSS 2014
2009 2010 2011 2012 2013 2014
Total 3.5 3.6 3.6 3.7 3.7 3.8
1st trimester 2.9 3.2 3.3 3.4 3.2 3.5
2nd trimester 3.5 3.8 3.7 3.7 3.7 3.8
3rd trimester 3.6 3.5 3.3 3.4 3.6 3.7
Postpartum 4.7 4.1 4.2 4.3 4.6 4.5
0.0
0.5
1.0
1.5
2.0
2.5
3.0
3.5
4.0
4.5
5.0
Pe
rce
nt

Trends in Premature Birth by Race/Ethnicity
2009 2010 2011 2012 2013 2014
Total 11.5 12 11.7 12.1 11.5 11.8
White 10.3 10.4 10.1 10.5 9.9 10.4
Black 15.3 15.3 15.1 15.7 14.6 14.7
Hispanic 10.4 12.2 11.8 11.2 11.8 11.4
0
2
4
6
8
10
12
14
16
18
Pe
rce
nt
PNSS 2014
Native American 2014 Rate, 14.1%

Trends in Preterm Birth by Trimester Entry
2009 2010 2011 2012 2013 2014
Total 11.5 12.0 11.7 12.1 11.6 11.8
1st trimester 13.1 12.7 12.5 13.4 12.7 12.9
2nd trimester 12.2 12.4 12.0 12.0 11.7 11.7
3rd trimester 7.5 8.1 7.9 7.5 7.1 7.6
Postpartum 11.2 13.4 13.0 13.9 13.1 13.6
0
2
4
6
8
10
12
14
16
Pe
rc
en
t
PNSS 2014

Prevalence of LBW by Local WIC Agencies
0
2
4
6
8
10
12 C
hip
pew
a
Lee
lan
au
DIr
on
Sta
te,M
I
Urb
an
L
Gen
esse
e
MW
R
3.1
4.2 4.7
9
11.2 11.7 11.8
Per
cen
t L
BW
PNSS 2014
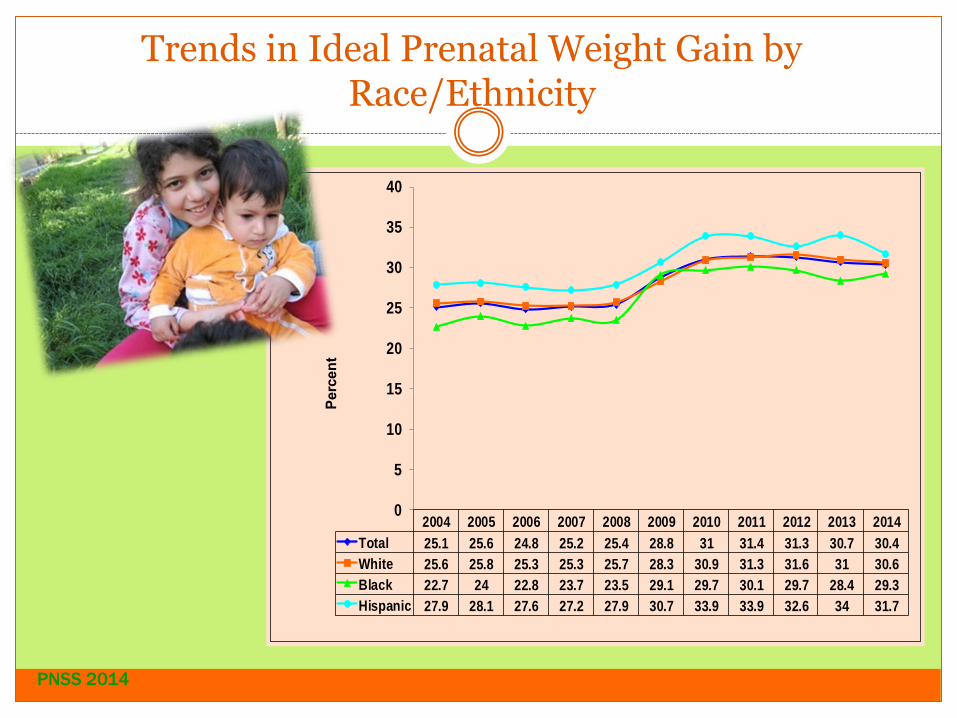
Trends in Ideal Prenatal Weight Gain by Race/Ethnicity
2004 2005 2006 2007 2008 2009 2010 2011 2012 2013 2014
Total 25.1 25.6 24.8 25.2 25.4 28.8 31 31.4 31.3 30.7 30.4
White 25.6 25.8 25.3 25.3 25.7 28.3 30.9 31.3 31.6 31 30.6
Black 22.7 24 22.8 23.7 23.5 29.1 29.7 30.1 29.7 28.4 29.3
Hispanic 27.9 28.1 27.6 27.2 27.9 30.7 33.9 33.9 32.6 34 31.7
0
5
10
15
20
25
30
35
40
Perc
en
t
PNSS 2014

Prepregnancy Obesity by Trimester Entry
2007 2008 2009 2010 2011 2012 2013 2014
Total 28.3 28.4 29.3 29.7 29.4 30.2 31.2 31.5
1st trimester 31.9 31.7 33.3 33.1 33.6 34.4 34.8 36.1
2nd trimester 27.6 27.4 28.4 28.3 27.9 29.3 30.3 30.8
3rd trimester 24.7 25.6 25.4 25.5 25.2 26.0 28.3 28.0
Postpartum 26.7 27.1 27.3 28.1 26.8 26.0 27.3 27.0
0
5
10
15
20
25
30
35
40
Pe
rc
en
t
PNSS 2014

Trends in Breastfeeding Initiation
by Race/Ethnicity
2005 2006 2007 2008 2009 2010 2011 2012 2013 2014
Total 52.6 52 54 54.7 57.2 59.8 60.5 61.2 63.1 63.6
White 56.2 56.2 58.8 59.9 62.5 64.7 65.9 66.8 68.9 68.8
Black 37.6 37.4 38.6 39.7 42.8 46.4 47.5 47.6 49.5 50.5
Hispanic 66.5 65.5 65.9 63.9 63.8 65.8 62.9 64.6 67.2 69.1
0
10
20
30
40
50
60
70
80
Per
cen
t
PNSS 2014
Native American 2014 Rate, 67.6%

Trends in Breastfeeding Initiation by Trimester Entry
2007 2008 2009 2010 2011 2012 2013 2014
Total 54.0 54.7 57.2 59.8 60.6 61.2 63.1 63.5
1st trimester 58.6 58.6 60.1 62.3 64.4 65.1 66.7 66.6
2nd trimester 53.6 53.3 56.3 58.9 59.1 59.7 62.1 62.6
3rd trimester 48.8 50.4 53.0 55.3 56.3 56.4 58.7 59
Postpartum 52.6 54.5 57.7 59.7 59.7 60.5 61.6 63.5
0
10
20
30
40
50
60
70
80
Pe
rc
en
t
PNSS 2014

Breastfeeding Initiation by Local WIC Agencies
0
10
20
30
40
50
60
70
80
90
Lee
lan
au
Gr T
rav
Mid
MI
Sta
te, M
I
MW
R
Wa
yn
e
Det
roit
Urb
an
L
86 85.6 82
63.6
55.4 53.1
46.1 43.9
Per
cen
t
PNSS 2014

Infants Breastfed for at Least 6 Months by Race/Ethnicity
2004 2005 2006 2007 2008 2009 2010 2011 2012 2013 2014
Total 14.6 15.5 15.8 15.3 15.8 18.5 17.8 18.4 19.1 17.7 18.5
White 15.1 15.9 16.3 15.7 16.7 20.5 20.6 21 21.9 21.1 22.2
Black 10.2 10.5 11.4 11.3 10.7 12.2 11.2 11.9 12.6 11 11.6
Hispanic 22.2 22.4 22.6 21.8 22.9 24.4 20.8 22.2 20.6 17.6 18.6
0
5
10
15
20
25
30
Perc
en
t
PedNSS 2014
Native American 2014 Rate, 23.6%

Six Months Breastfeeding Duration by Local WIC Agencies
0
5
10
15
20
25
30
35
Lee
lan
au
Wes
tUP
Wa
shte
na
w
MW
R
Sta
te, M
I
Det
roit
HD
I
Urb
an
L
30.6 30.1 29.9
26.5
18.5
12.3 10.9 10 P
erce
nt
PedNSS 2014

2004 2005 2006 2007 2008 2009 2010 2011 2012 2013 2014
Total 16.1 15.6 16.2 16.4 16.6 16.6 16.3 16.6 16.4 16.8 16.7
White 16.6 15.9 16.3 16.6 16.8 16.8 16.6 16.8 16.8 17.3 17.1
Black 14.2 13.4 14 14.2 14.6 14.5 13.9 14.2 14.2 14.7 14.8
Hispanic 17.8 18.5 19.3 19.4 19.1 18.7 18.8 19.3 18.5 19.2 18.8
0
5
10
15
20
25
Perc
en
t
Trends in Overweight (85th-<95th) by Race/Ethnicity among Michigan WIC Children Two to Five Years Old
PedNSS 2014
Native American 2014 Rate, 21.1%
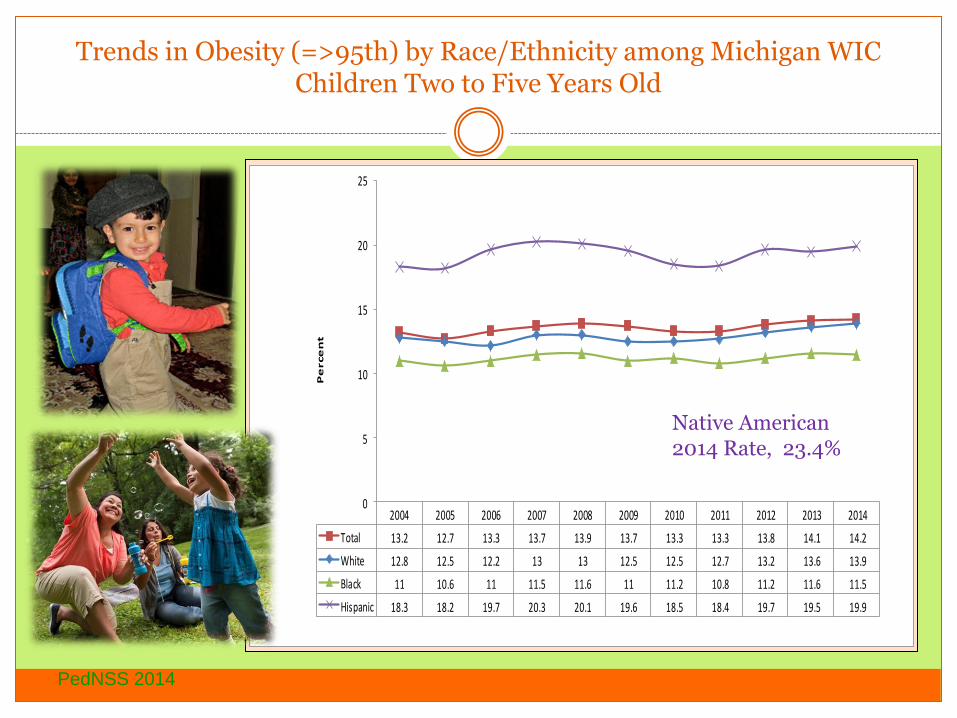
Trends in Obesity (=>95th) by Race/Ethnicity among Michigan WIC Children Two to Five Years Old
2004 2005 2006 2007 2008 2009 2010 2011 2012 2013 2014
Total 13.2 12.7 13.3 13.7 13.9 13.7 13.3 13.3 13.8 14.1 14.2
White 12.8 12.5 12.2 13 13 12.5 12.5 12.7 13.2 13.6 13.9
Black 11 10.6 11 11.5 11.6 11 11.2 10.8 11.2 11.6 11.5
Hispanic 18.3 18.2 19.7 20.3 20.1 19.6 18.5 18.4 19.7 19.5 19.9
0
5
10
15
20
25
Pe
rce
nt
PedNSS 2014
Native American 2014 Rate, 23.4%

Early Childhood Obesity by Local WIC Agencies
0
5
10
15
20
25
30
Wes
t U
P
LM
AS
Liv
ingst
on
MW
R
Sta
te
CA
A
Hu
ron
Kee
wen
aw
10.6 10.2 12
13.2 14.2
18.2
21.5
27.7
Per
cen
t
PedNSS 2014

BMI Percentile & Breastfeeding Rates among Michigan WIC Children Two to Five Years Old
BMI Percentile
Initiation Duration
1 Week 6 Weeks 3 Months 6 Months 11+ Months
<85% 63.1 35.0 24.9 19.5 11.7 5.3
>=85 % - <95%) 61.3 33.6 23.5 18.3 10.7 4.7
>=95% 58.4 33.4 21.9 16.2 9.0 3.7
PedNSS 2014

Health Indicator State White Black Hispanic American Indian/ Alaskan
Native
% % % % % N
First Trimester Entry Into WIC 35.8 39.5 26.3 42.4 46.3 227
Ideal Prenatal Weight Gain 30.4 30.6 29.3 31.7 22.1 140
> Ideal Prenatal Weight Gain 52.3 53.8 52.3 46.3 54.3 140 Low Birth Weight 9 7.4 13.1 6.3 6 182 High Birth Weight 7 8.5 3.9 8 12.6 182
Full Term Low Birth Weight 3.8 3 5.7 2.6 3 170 Premature Birth 11.8 10.4 14.7 11.4 14.1 192
Breastfeeding Initiation 63.1 68.9 49.5 67.2 67.6 193
Breastfed at least 6 months 17.1 21.1 11 17.6 23.6 123
Overweight (85th - <95th %) ≥2yrs 16.7 17.1 14.8 18.8 21.1 350
Obesity (≥95th%) ≥2yrs 14.2 13.9 11.5 19.9 23.4 350
Low Hemoglobin(< 5 Yrs) 19 14 30.1 16.4 20.6 466
PNSS and PedNSS 2014
Native American Health Indicators

Checking data validity and identifying questionable data items:
Completeness: No missing data
Accuracy:
Correctly reflects what it is describing
Consistency:
Agreement between data items
Below & Above Acceptable Range
Biologically Implausible Values (BIVs)
Unknown values, Missing data
Cross-Check Errors, Data inconsistencies
Data Quality
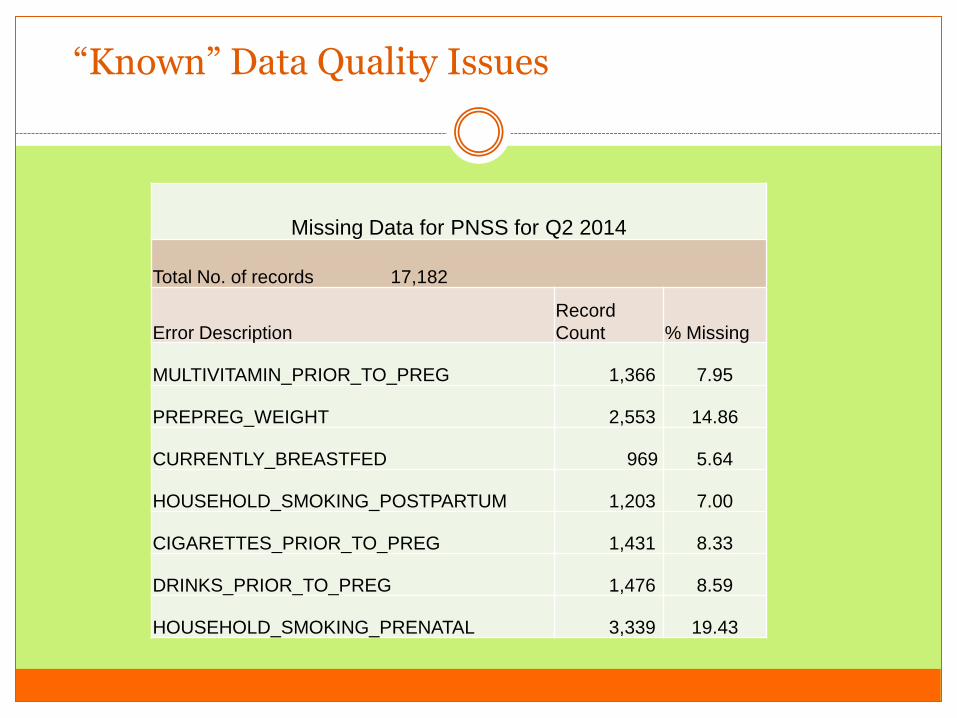
“Known” Data Quality Issues
Missing Data for PNSS for Q2 2014
Total No. of records 17,182
Error Description
Record
Count % Missing
MULTIVITAMIN_PRIOR_TO_PREG 1,366 7.95
PREPREG_WEIGHT 2,553 14.86
CURRENTLY_BREASTFED 969 5.64
HOUSEHOLD_SMOKING_POSTPARTUM 1,203 7.00
CIGARETTES_PRIOR_TO_PREG 1,431 8.33
DRINKS_PRIOR_TO_PREG 1,476 8.59
HOUSEHOLD_SMOKING_PRENATAL 3,339 19.43

Discussion
Expanding the Pilot to other States
Transition to USDA
How the data is used in program management
Improvements to current system


![Histological and Biochemical Assessment of the Protective ... · PDF filesaline solution [PNSS]); GEN control; ... the incidence of drug- ... This pilot study was conducted to explore](https://img.pdfslide.net/doc/110x75/5aa80f327f8b9aa2258b5d60/histological-and-biochemical-assessment-of-the-protective-solution-pnss.jpg)