Embed Size (px)
Citation preview

Miami Dade Water and Sewer DepartmentLeading the Way in Water and Wastewater Modelling
Mark Wilton
August 21, 2012

Presentation Outline
- MDWASD’s Water and Wastewater System Models
- Data Management and Model Development
- Calibration of Water System Model • Field Testing
• Calibration
• Lesson Learned
8/21/2012Miami Dade Water and Sewer Department – Leading the Way in Water and Wastewater Modelling
Page 2

Water Systems Model
- Existing Distribution System
- Low Pressure Zone
- Trunk Main System
- Raw Water System
Pipes +236,000
Nodes +218,000
Bores 77
Wholesale meters 79
8/21/2012Miami Dade Water and Sewer Department – Leading the Way in Water and Wastewater Modelling
Page 3

Wastewater Systems Model
- Full Pipe Model• Rising Mains
• Gravity Interceptors
• Gravity Sewers
- +91,000 pipes
- +90,000 nodes
- +1,000 pumping stations
- +1,500 pumping station catchments
8/21/2012Miami Dade Water and Sewer Department – Leading the Way in Water and Wastewater Modelling
Page 4

Data Management - Overall Approach
8/21/2012Miami Dade Water and Sewer Department – Leading the Way in Water and Wastewater Modelling
Page 5

Data Tracking & Reporting - Managing Data Requests
8/21/2012Miami Dade Water and Sewer Department – Leading the Way in Water and Wastewater Modelling
Page 6

Data Management - Lessons Learned
- Understanding and communication
- Engagement
- Data dictionaries
- Metadata database
- Audit trail
- Iterative process
8/21/2012Miami Dade Water and Sewer Department – Leading the Way in Water and Wastewater Modelling
Page 7
Define Data Required
Issue Data Request
Data ReviewClarification Needed
Additional Data Required
Consolidate Data and Close Record
Use Data in Model
Data Approved

Calibration of Water Distribution Model
- Appropriate Designed Field Test Program
- Selective Field Testing
- Collection of Boundary Conditions
- Systematic Approach to Calibration (Macro & Micro Calibration)
- “Global Calibration” – Not “Local Calibration”
8/21/2012Miami Dade Water and Sewer Department – Leading the Way in Water and Wastewater Modelling
Page 8
T202487 Along S. Dixie Hwy, between SW 264th St and SW Moody Dr T202488 Along S. Dixie Hwy, between SW 135th Rd and SW 135th Ave
T203143 SW 280th St, just West of Colonial Dr T203145 SW 278th St, just East of SW 177th Ave
0
10
20
30
40
50
60
70
80
10/2/08 0:00 10/2/08 12:00 10/3/08 0:00 10/3/08 12:00 10/4/08 0:00 10/4/08 12:00 10/5/08 0:00
Time
Pre
ssure
(psi)
Observed Pressure
0
10
20
30
40
50
60
70
80
10/2/08 0:00 10/2/08 12:00 10/3/08 0:00 10/3/08 12:00 10/4/08 0:00 10/4/08 12:00 10/5/08 0:00
Time
Pre
ssure
(psi)
Observed Pressure
0
10
20
30
40
50
60
70
80
10/2/08 0:00 10/2/08 12:00 10/3/08 0:00 10/3/08 12:00 10/4/08 0:00 10/4/08 12:00 10/5/08 0:00
Time
Pre
ssure
(psi)
Observed Pressure
0
10
20
30
40
50
60
70
80
10/2/08 0:00 10/2/08 12:00 10/3/08 0:00 10/3/08 12:00 10/4/08 0:00 10/4/08 12:00 10/5/08 0:00
Time
Pre
ssure
(psi)
Observed Pressure

- Continuous Flow and Pressure Monitoring – key locations
- Hydrant Flow and Pressure Tests
- Hazen Williams C-Value Tests
- Large Transmission Main Flow Monitoring
Field Testing
8/21/2012Miami Dade Water and Sewer Department – Leading the Way in Water and Wastewater Modelling
Page 9
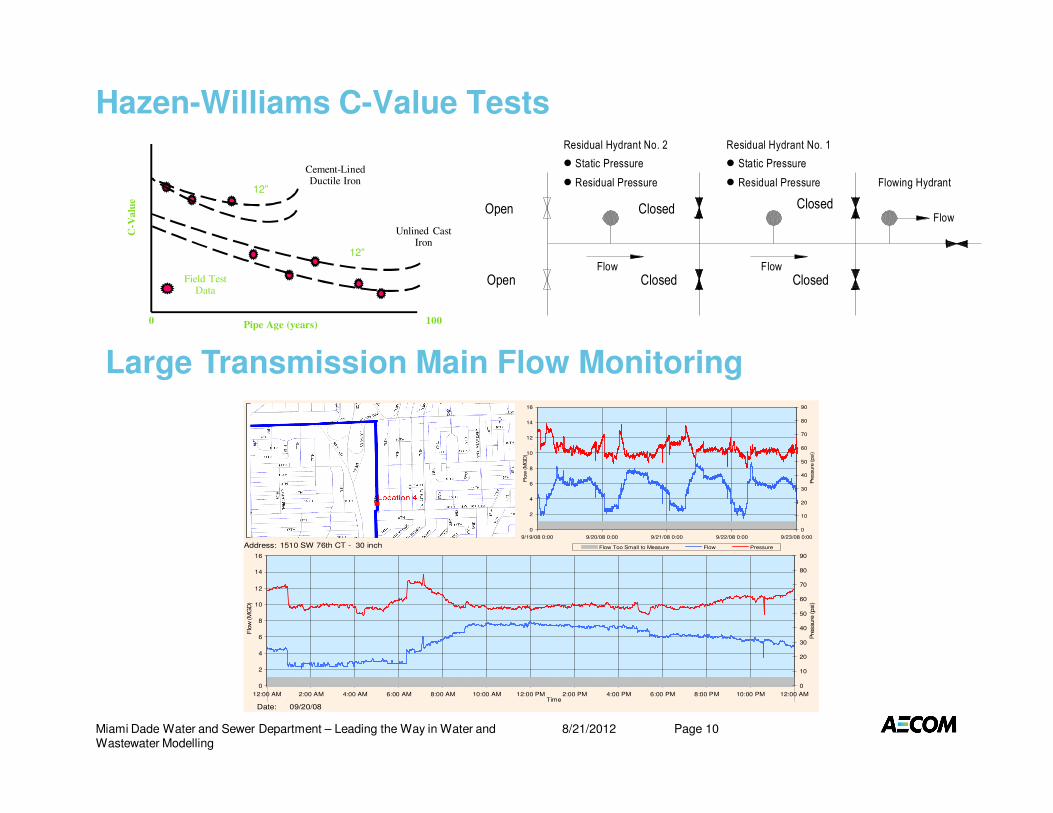
Hazen-Williams C-Value Tests
� Static Pressure
� Residual Pressure
Residual Hydrant No. 2
Flow
Residual Hydrant No. 1
Flow
� Residual Pressure
� Static Pressure
Flowing Hydrant
FlowOpen
Open
Closed
Closed
Closed
Closed
Large Transmission Main Flow Monitoring
Address: 1510 SW 76th CT - 30 inch
Date: 09/20/08
0
2
4
6
8
10
12
14
16
9/19/08 0:00 9/20/08 0:00 9/21/08 0:00 9/22/08 0:00 9/23/08 0:00
Flo
w (M
GD
)0
10
20
30
40
50
60
70
80
90
Pre
ssure
(psi)
Flow Too Small to Measure Flow Pressure
I
0
2
4
6
8
10
12
14
16
12:00 AM 2:00 AM 4:00 AM 6:00 AM 8:00 AM 10:00 AM 12:00 PM 2:00 PM 4:00 PM 6:00 PM 8:00 PM 10:00 PM 12:00 AMTime
Flo
w (M
GD
)
0
10
20
30
40
50
60
70
80
90
Pre
ssure
(psi)
0 100Pipe Age (years)
Field Test
Data
C-V
alu
e
Unlined Cast
Iron
Cement-Lined
Ductile Iron
12”
12”
8/21/2012Miami Dade Water and Sewer Department – Leading the Way in Water and Wastewater Modelling
Page 10

Macro Calibrations
8/21/2012Miami Dade Water and Sewer Department – Leading the Way in Water and Wastewater Modelling
Page 11

Challenges with Macro Calibration Criteria
Timing of Model and SCADA Data
100% out of Criteria
Variation on SCADA Data (Min & Max Values)
Max
Average
Min
8/21/2012Miami Dade Water and Sewer Department – Leading the Way in Water and Wastewater Modelling
Page 12

Micro Calibration
8/21/2012Miami Dade Water and Sewer Department – Leading the Way in Water and Wastewater Modelling
Page 13
Accuracy
Calibration Criteria Required Acheieved
80% 80%
Pressure differential (pressure drop
greater than 10 psi)
Pressure differential (pressure drop
less than or equal to 10 psi)
3 psi
2 psi
Micro Calibration Accuracy Criteria

- Accurate geometry and facility model
- Structured field test program critical
- Validate SCADA data
- Smallest time step possible
- Closed systems harder to calibrate
- Define calibration accuracy goals (targets) prior to calibration
- Be realistic in calibration accuracy
- It will take longer than you think
- Additional field work may be required
Calibration - Lessons Learnt
8/21/2012Miami Dade Water and Sewer Department – Leading the Way in Water and Wastewater Modelling
Page 14