Embed Size (px)
Citation preview
i
Goal scoring patterns over the course of a match and season: An analysis of the 2009-
2010 English Premier League (no winter break) and German Bundesliga (winter
break) seasons.
Michael Haines
S0508385
Presented as part of the requirement for an award within the Undergraduate Modular Scheme
at the University of Gloucestershire.
April 2011
ii
Declaration
DECLARATION: This dissertation is the product of my own work and does not infringe the
ethical principles set out in the University’s Handbook for Research Ethics. I agree that it
may be made available for reference via any and all media by any and all means now known
or developed in the future at the discretion of the University.
Signed:
Name: Michael Haines
Date:
iii
PROPOSED STUDY AGREEMENT FORM
The precise details of the method / research question(s) have been discussed and agreed by
both myself and my dissertation advisor.
Name: Michael Haines
Student’s signature: _________________________ Date: ___/___/20___
On the basis of the proposed study, I am happy for the above named student to continue with
this dissertation.
Name: Debbie Cox
Advisor’s signature: _________________________ Date: ___/___/20___
iv
Abstract
Previous research suggests that a relationship between time and goal scoring frequency
(GSF) exists, with GSF highest in the second half (46-90+ min) of matches and peaking in
the last 15 minutes (76-90+ min). However, to our knowledge no research appears to have
investigated whether such a pattern is present in the English Premier League (EPL) and the
German Bundesliga (DBL), or whether GSF is consistent throughout a season. The purpose
of this study was to investigate whether the same pattern of GSF was observed in the EPL
and DBL and whether the inclusion of a winter break has an effect on GSF. Following
institutional ethical approval, the time of all 1919 goals from the 686 matches of the 2009-
2010 season of the EPL and DBL were recorded according to the time indicated by the
British Broadcasting Corporation’s Sport (BBC) website and the official website of the DBL.
The data was entered into a Microsoft Excel spreadsheet to create frequency counts for each
minute of play from 1 to 90+ min. Chi-square analysis was used to determine any
statistically significant differences in GSF per 45 minute period, per 15 minute period and
between the last 15 minutes of play per half season for each league. Chi-square analysis was
also used to look for statistically significant differences in GSF during the last 15 minutes of
matches in the second half of the season between the two leagues, for an effect of league,
time of season and a league x time interaction. The level of significance in all cases was set
at p < 0.05. Chi-square analysis revealed GSF was significantly greater in the second half of
matches (EPL: 56.1% v 43.9%, p < 0.001; DBL: 56.1% v 43.9%, p < 0.001) and greatest in
the last 15 minute period (76-90+ min) of matches compared to all other 15 minute periods
in both the EPL and DBL (EPL: 23.5%, all at p < 0.05; DBL 22.1%, all at p < 0.05).
Although non-significant, GSF during the last 15 minutes of matches in the EPL was greater
in the second half of the season compared to the first (26.5% v 20.7%, p = 0.227).
Conversely GSF during the last 15 minutes of matches in the DBL was lower in the second
half of the season compared to the first, although again this difference was not significant
(20.6% v 23.6%, p = 0.613). No significant difference in GSF in the last 15 minutes of play
in the second half of the season was observed between the EPL and DBL (26.5% v 20.6%, p
= 0.384). The league x time interaction was not significant (p = 0.240) although a main
effect for league on GSF during the last 15 minutes of play was found (p = 0.010). By
showing its existence in two previously unstudied leagues the results provide further support
for a relationship between time and GSF, which may be explained by deterioration in
physical conditioning, tactical play and lapses in concentration. The study further adds to
existing knowledge with the observation that GSF in the last 15 minute period of play in the
second half of the season increased by 5.8% in the EPL and decreased by 3.0% in the DBL
when compared to the first half of the season. This 8.8% swing between EPL and DBL
suggests a rest factor may be involved in GSF when considered over the course of a season.
The results suggest that most goals are scored during the second half of matches and
specifically during the last 15 minute period of play in both the EPL and DBL. They also
suggest that a winter break may reduce GSF in the last 15 minutes of play in the second half
of the season compared to the first, and that the lack of a winter break may increase GSF in
the last 15 minutes of play in the second half of the season compared to the first, although
further investigations are required and should compare leagues with the same number of
matches in order to increase statistical power.
v
Acknowledgements
I would like to thank my academic supervisor Debbie Cox for her knowledge and guidance
throughout this investigation. The commitment and time spent in consultations, particularly
throughout the process of analysing the results is greatly appreciated.
My family and friends were always there to support me throughout my study. I would like to
express my thanks to my parents for their support throughout my course of study and in my
decision to leave my job to return to education. Also thanks to my housemates who did more
than their fair share of the housework – thanks guys!
Finally I would like to dedicate this piece of work to my late Nan and Grampy who passed
away last year. Hopefully I will achieve the degree classification I promised you I would.
vi
Contents
Preliminaries
Title page i
Declaration ii
Study Agreement Form iii
Abstract iv
Acknowledgements v
Contents vi
List of Figures viii
Chapter 1: Introduction 1
1.1 Background 1
1.2 Research questions 5
1.3 Hypotheses 5
Chapter 2: Literature Review 7
2.1 Performance analysis in football 7
2.2 The influence of original research 7
2.3 Goal scoring patterns 10
2.4 Physiological demands 12
2.4.1 The impact of resultant fatigue 13
2.4.1.1 Physiological performance 13
2.4.1.2 Technical performance 14
2.4.1.3 Cognitive performance 14
2.5 Tactics 15
2.5.1 Substitutions 15
2.6 Residual fatigue 16
2.7 The impact of a winter break? 17
vii
2.8 Summary 18
Chapter 3: Methods 20
3.1 Matches 20
3.2 Research design 20
3.3 Reliability evaluation 21
3.4 Data analysis 22
Chapter 4: Results 23
Chapter 5: Discussion 26
5.1 Main findings 26
5.1.1 Goal scoring over the course of a match 26
5.1.1.1 Physiological factors 27
5.1.1.2 Tactical factors 28
5.1.2 Goal scoring over the season 29
5.1.2.1 Residual fatigue 30
5.1.2.2 Tactics 32
5.2 Practical implications 32
5.2.1 Training 33
5.2.2 Nutrition 33
5.2.3 Squad rotation 34
5.3 Study limitations 34
5.4 Conclusion 35
5.5 Future research recommendations 35
Chapter 6: References 37
Chapter 7: Appendices 44
Appendix 1: Dissertation tutorial record sheets 44
viii
List of Figures
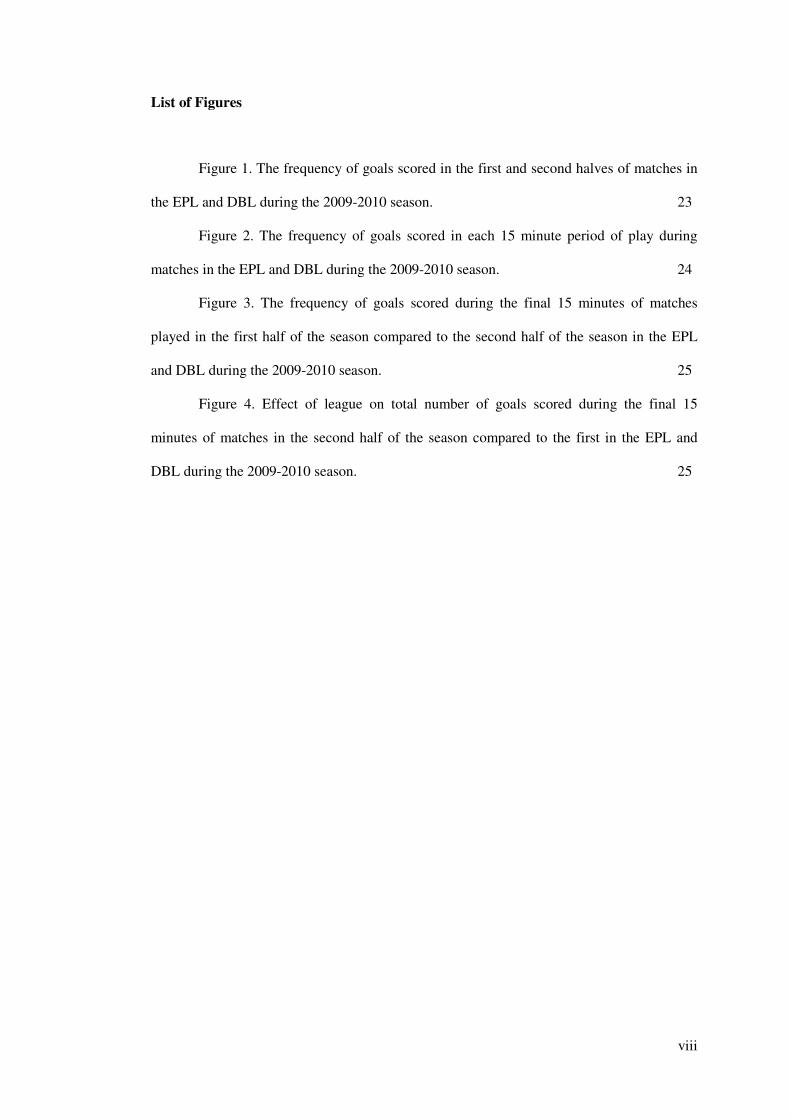
Figure 1. The frequency of goals scored in the first and second halves of matches in
the EPL and DBL during the 2009-2010 season. 23
Figure 2. The frequency of goals scored in each 15 minute period of play during
matches in the EPL and DBL during the 2009-2010 season. 24
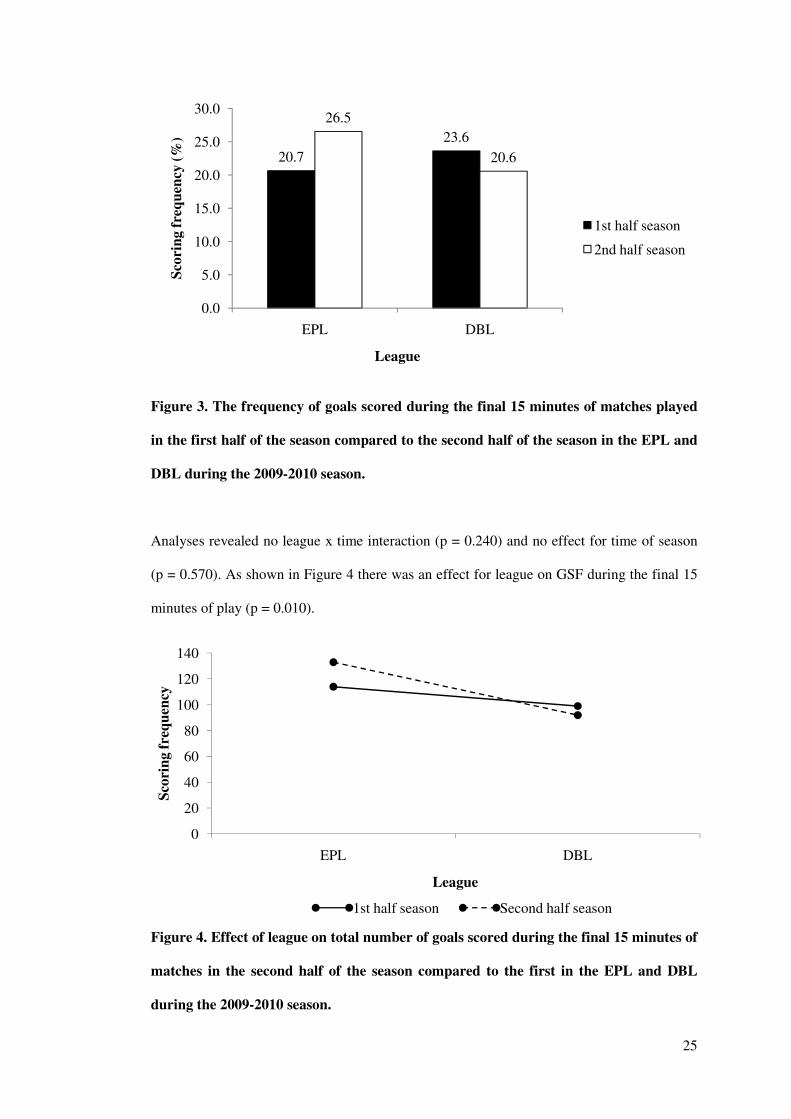
Figure 3. The frequency of goals scored during the final 15 minutes of matches
played in the first half of the season compared to the second half of the season in the EPL
and DBL during the 2009-2010 season. 25
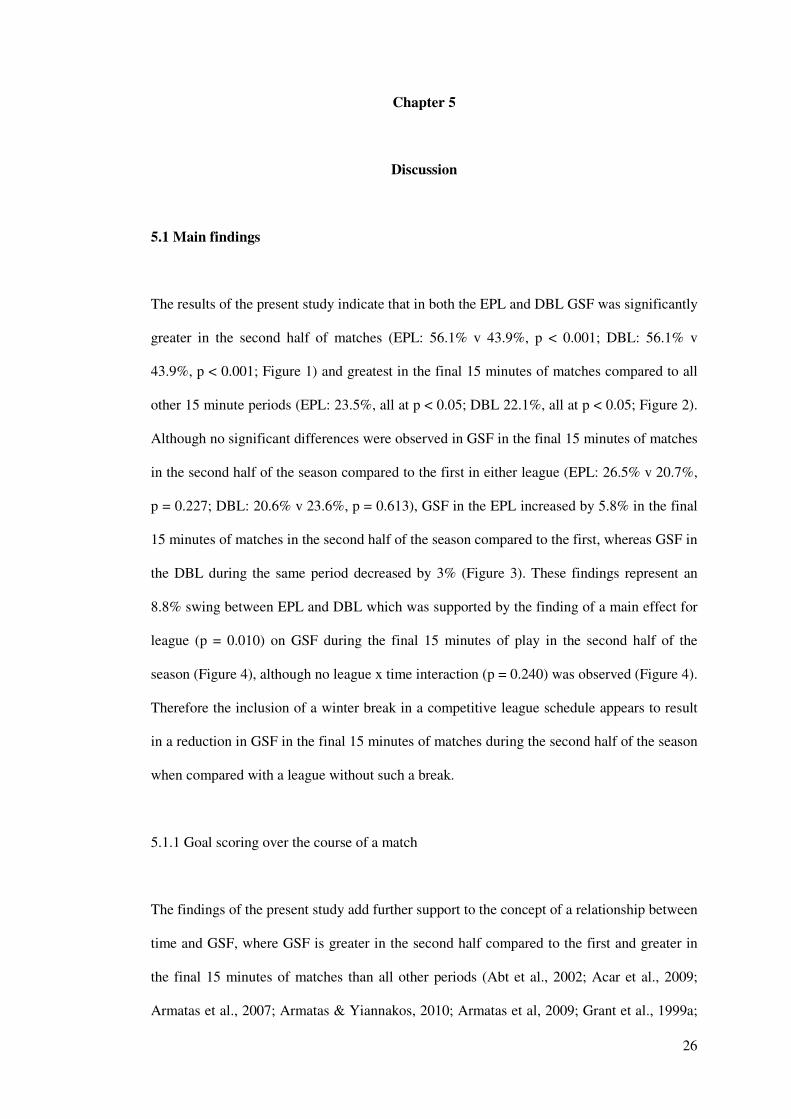
Figure 4. Effect of league on total number of goals scored during the final 15
minutes of matches in the second half of the season compared to the first in the EPL and
DBL during the 2009-2010 season. 25
1
Chapter 1
Introduction
1.1 Background
Association football is the world’s most popular sport, played at many levels in every nation
(Bangsbo, 1994; Sporis, Jukic, Ostojic & Milanovic, 2009; Stolen, Chamari, Castagna &
Wisløff, 2005). Matches are often characterised by a low frequency of goal scoring (Abt,
Dickson & Mummery, 2002; Yiannakos & Armatas, 2006), making the ability to score goals
perhaps the most important requirement for success (Jinshan, Xiaoke, Yamanaka &
Matsumoto, 1993) and suggesting that investigations into the characteristics of goal scoring
are of importance (Yiannakos & Armatas, 2006). Previous research has reported a
relationship between time and goal scoring frequency (GSF), whereby more goals are scored
in the second half of matches than the first and the final 15 minutes of play (76-90+) sees the
greatest GSF (Abt et al., 2002; Acar et al., 2009; Armatas & Yiannakos, 2010; Armatas,
Yiannakos, Papadopoulou & Skoufas, 2009; Armatas, Yiannakos & Sileloglou, 2007; Grant,
Williams & Reilly, 1999a; Jinshan et al., 1993; Reilly, 2003; Ridder, Cramer & Hopstaken,
1994; Yiannakos & Armatas, 2006). Aspects of play which change over the course of a
match including tactics, physical condition and mental condition have been cited as the
primary causes of this relationship, with implications for team and player preparation (Abt et
al., 2002). This relationship has been reported in club and international competitions
worldwide, however studies have yet to investigate the English Premier League (EPL) or the
German Bundesliga (DBL) - two of the highest profile leagues in Europe (UEFA, 2011).
Furthermore, little attention has been paid to the questions of whether goal scoring patterns
are the same at the beginning of a season as at the end and whether a winter break has any
effect on the relationship. This is perhaps surprising given that deteriorations in physical and
mental condition are linked to the relationship between time and GSF over the course of a
2
single match and are known to be exacerbated by the demands of consecutive matches in the
EPL, resulting in regular calls for a winter break to be introduced (Odetoyinbo, Wooster &
Lane, 2009). The present introduction will therefore argue the importance of carrying out
further analyses of goal scoring patterns, the importance of understanding whether they are
the same at the beginning of a season as at the end and the potential impact of a winter break
on the relationship.
Morris (1981) was the first to report a relationship between time and GSF. Morris (1981)
investigated English league and cup matches and reported that GSF increased with time and
was greatest in the final 15 minutes of play. Building upon this work, subsequent studies
identified the same relationship at club and international level across the world (Abt et al.,
2002; Acar et al., 2009; Armatas & Yiannakos, 2010; Armatas, Yiannakos, Papadopoulou &
Skoufas, 2009; Armatas, Yiannakos & Sileloglou, 2007; Grant et al, 1999a; Jinshan et al.,
1993; Reilly, 2003; Ridder, et al., 1994; Yiannakos & Armatas, 2006). To the author’s
knowledge only one study has reported no immediate correlation between time and GSF.
This study of goals scored at the 1986 World Cup reported that GSF was greatest between
60-75 minutes (Jinshan, 1986, as cited in Jinshan et al., 1993, p.205), as opposed to 76-90+
minutes as reported in other studies. Despite this finding, the range of studies reporting a
relationship between time and GSF indicates that this pattern is evident worldwide at many
levels of the game. However, none have investigated the EPL or DBL which is perhaps
surprising given their standing in world football as the first and fourth ranked leagues in
Europe by UEFA coefficient (UEFA, 2011).
Whilst much attention has been paid to the relationship between time and GSF during a
season or competition as a whole, no research has considered whether the relationship is the
same at the beginning of a season as at the end. The only study to have considered GSF over
a longer period (Abt et al., 2002) investigated four seasons of the Australian National Soccer
League (ANSL) from 1994-1998, reporting that GSF was greater in the second half of
3
matches compared to the first and greatest during the final 15 minutes of play. The reasons
asserted for these findings were multi-factorial and related to aspects of play which change
over the course of a match, particularly physical and mental condition and team tactics (Abt
et al., 2002). Further research has provided a strong evidence base for this assertion with the
physiological demands of different playing positions shown to cause defenders to suffer
greater deteriorations in physical condition than other positions, affecting their ability to
carry out high-intensity actions (Krustrup et al., 2006; Mohr, Krustrup & Bangsbo, 2003;
2005; Mohr, Krustrup, Nybo, Nielsen & Bangsbo, 2004; Reilly, 2007) and causing lapses in
concentration (Reilly, 2007). This coupled with no effect on shooting ability (Abt, Zhou &
Weatherby, 1998; Zeederberg, et al., 1996) places attackers at a potential advantage in the
latter stages of matches with implications for GSF. An increased urgency in attacking play
during the closing stages of matches has also been suggested to occur as teams seek to score
and gain a positive result, which increases the likelihood of a goal being scored (Abt et al.,
2002; Carling, Williams & Reilly, 2005; Reilly, 1997).
Previous investigations have assumed the pattern of GSF is consistent over the course of a
competition or season and to date none have considered whether the pattern is the same at
the start of a season as at the end. Since the effects of physical and mental fatigue developed
over the course of a match have been reported to be exacerbated over the course of a season
(Odetoyinbo et al., 2009; Prozone, 2009), it is possible that these factors may be of greater
significance at the end of a season compared to the beginning and may contribute to an
increase in GSF in the final 15 minutes of matches. Odetoyinbo et al. (2009) and Prozone
(2009) for example, reported that when required to perform in consecutive matches with
little recovery as demanded by the league schedule, players in the EPL suffered reductions in
physical capacity with reduced total distance covered, distance covered at high-intensity,
number of sprints, distance covered by sprinting, amount of total work performed both with
and without the ball and increased recovery time required between activities. These studies
suggest that deteriorations in physical condition over the course of a match may be
4
exacerbated over consecutive matches causing residual fatigue, which given the links
between physical condition and GSF may increase the potential for increased GSF during the
final 15 minutes of matches as the season progresses.
Another issue not yet considered in goal scoring research is that of a winter break. In injury
research one study comparing leagues with and without a winter break reported that injury
incidence was significantly higher in leagues without a break due to the accumulation of
residual fatigue over a season (Ekstrand, Lewin, Hägglund & Walden, 2004). This suggests
that residual fatigue may be reduced to some extent by the inclusion of a winter break
allowing a period of recovery, which may have an effect on GSF later in a season.
A wide range of existing research has reported a relationship between time and GSF, where
GSF is greater in the second half of matches compared to the first and greatest in the final 15
minutes. Aspects of play which change over the course of a match are cited as the main
causes of this pattern, which has implications for team and player preparation (Abt et al.,
2002). It has been suggested that these aspects of play may be exacerbated over the course of
a season, with an accumulation of fatigue increasing the potential for greater GSF at the end
of a season compared to the beginning. However no studies have investigated whether the
relationship between time and GSF is the same at the beginning of a season as at the end, or
the effect of a winter break. Further examination of goal scoring patterns is warranted since
the findings have implications for coaches and players due to the constantly evolving nature
of professional football (Yiannakos & Armatas, 2006) and the implications of the links made
between physical condition and GSF (Abt et al., 2002). Furthermore this study will
contribute to the area of research by increasing understanding of goal scoring patterns over
the course of a season and specifically whether patterns are the same at different stages of a
season - a research direction of importance suggested by Abt et al. (2002) - as well as
informing future research into the suitability of introducing a winter break to the EPL
schedule.
5
The aim of this study was to investigate whether the same relationship between time and
GSF observed by previous studies was present in the EPL and DBL and whether the
inclusion of a winter break in the DBL affected GSF.
1.2 Research questions
1. Are goal scoring patterns different in the first half compared to the second half of a
match?
2. Is goal scoring frequency greatest during the final 15 minutes of matches?
3. Are goal scoring patterns in the final 15 minutes of matches different in the first half
of the season compared to the second in each league?
4. Are goal scoring patterns in the final 15 minutes of matches during the second half
of the season different between the EPL and DBL?
1.3 Hypotheses
Null hypothesis (H0): There is no significant difference in goal scoring frequency in the
first half compared to the second half of matches.
Null hypothesis (H0): There is no significant difference in goal scoring frequency between
the six 15 minute periods of matches.
Null hypothesis (H0): There is no significant difference in goal scoring frequency in the
final 15 minutes of matches in the EPL or DBL.
6
Null hypothesis (H0): There is no significant difference in goal scoring frequency in the
final 15 minutes of matches in the second half of the EPL season
compared to the DBL.
7
Chapter 2
Literature Review
2.1 Performance analysis in football
Hughes and Franks (2004) describe notational analysis as “the analysis of movement,
technical and tactical evaluation and statistical compilation” (p.67). Initially notation
analysis systems were hand based and vulnerable to errors, but the introduction of computer
based analysis systems allowed more detailed and accurate data to be recorded (James,
2006). Today the use of analysis systems in professional football is widespread, with all
English league matches recorded (James, 2006) and 14 EPL, 19 npower Championship and 9
npower League 1 clubs currently using Prozone analysis solutions alone (Prozone, 2011).
Before the development of analysis systems coaches relied upon subjective observations to
inform their decisions; however it has been shown that coaches cannot accurately recall all
of the critical events occurring in a match (Franks & Miller, 1986; Laird & Waters, 2008).
Laird and Waters (2008) reported that even experienced coaches - despite being more able to
accurately recall critical events than their novice counterparts - were still only able to
accurately recall 59.2% of critical events during 45 minutes of play. Such findings highlight
the need for the objective and reliable mechanism of analysing performance which
performance analysis systems provide (James, 2006).
2.2 The influence of original research
Reep and Benjamin’s (1968) research is widely regarded as pioneering in the analysis of
football. This particular study encompassed data from 3,213 World Cup and English League
matches played from 1953-1968; measuring shots, passing sequences and goals scored. It
was reported that 50% of goals were scored from possessions of one pass or less; that 80% of
8
goals were scored from possessions of three passes or less and that it took on average 10
shots to score one goal. From these findings a style of play emphasising movement of the
ball into shooting positions in and around the penalty area quickly, using the fewest passes
possible was recommended, with the idea being that the more times the ball entered these
areas the more chance there was of scoring (James, 2006). Such a style was termed “long
ball” or “direct” and became popular amongst British clubs, particularly in the lower
divisions. Watford and Wimbledon are considered to have achieved a measure of success
using such tactics, as are Eire and Norway on the international stage; however it has been
noted that other than Greece’s Euro 2004 victory using a modification of a direct style of
play against technically superior teams (Carling et al., 2005) few teams have achieved
success at the highest level playing in this manner (Hughes & Franks, 2005).
Bate’s (1988) review supported and developed Reep and Benjamin’s (1968) findings using
data from England Senior and Youth international matches, the 1982 World Cup and the
1985-1986 English Third Division season. Bate (1988) concluded that a low number of
consecutive, long, forward passes into the attacking third of the pitch or the space behind the
defence was the most effective method of creating goal scoring opportunities. Bate (1988)
concluded that the “possession football” style used by many European and South American
teams at the time was not supported by empirical data. However the data from which this
conclusion was drawn was gathered predominantly from matches involving English teams
who did not play possession football, therefore it is perhaps unsurprising that the findings of
this review supported the use of a direct style.
Studies investigating playing styles at major competitions since the 1990 World Cup (Grant,
Williams & Reilly, 1999b; Hook & Hughes, 2001; Hughes & Franks, 2005) appear to
indicate a shift away from the use of direct tactics at the top level. Hughes and Franks (2005)
analysed all 104 matches from the 1990 and 1994 World Cups and despite initially finding
similar to Reep and Benjamin (1968) that approximately 80% of goals were scored after
9
three or less passes, found limitations to the methods used which had influenced the results.
It was argued that the reason for Reep and Benjamin’s (1968) finding that 50% of goals were
scored from possessions of one pass or less was because most possessions were of one pass
or less. Hughes and Franks (2005) attempted to remove this issue by calculating the number
of goals scored for each length of possession per 1000 possessions, subsequently finding
possessions of between three and seven passes were most likely to result in goals. Hughes
and Franks (2005) also reported that successful teams utilised longer passing sequences and
produced more goals per possession as a result. Similarly it was reported that successful
teams at the 1998 World Cup had more attempts on goal arising from possessions of four or
more passes and completed more passes on average per game (362.7 v 308.9) than
unsuccessful teams (Grant et al., 1999b). A possession style of play was also favoured by
successful teams at Euro 2000 (Hook & Hughes, 2001) and most recently at the 2010 World
Cup (Prozone, 2010). Analysis of the 2010 World Cup revealed that Spain won the
tournament by dominating passing and possession, averaging 527 passes per game compared
to the tournament average of 343, achieving the greatest passing success rate (89%), number
of penalty box entries and number of shots per game (15.7), all of which have been cited as
major reasons for their success (Prozone, 2010).
That possession based styles could be so successful differs markedly from the original
findings of Reep and Benjamin (1968) and led Hughes and Franks (2005) to the conclusion
that this original work had not resulted in a full understanding of the influence of possession
length on goal scoring. As asserted by James (2006) it is reasonable to suggest that when it is
possible to play good quality passes into goal threatening positions a possession approach
should be adopted, however when it is not possible a more direct and speculative approach
should be adopted due to the element of chance that goal scoring opportunities will be
produced, as suggested by the findings of Reep and Benjamin (1968) and Bate (1988).
10
2.3 Goal scoring patterns
Whilst many studies have investigated goal scoring to identify the characteristics of
successful teams, there has also been much interest in goal scoring patterns and in particular
whether a relationship between time and GSF exists. Most research has concluded that such
a relationship does exist, with GSF being greater in the second half of matches than the first
and greatest in the final 15 minutes of play. This relationship has been reported in the 1990
World Cup (Jinshan et al., 1993), the 1991-1992 Dutch professional league (Ridder et al.,
1994), the 1991-1992 Scottish League season (Reilly, 2003), the ANSL 1994-1998 (Abt et
al., 2002), the 1998 World Cup (Grant et al., 1999a), the 1998, 2002 and 2006 World Cups
(Armatas et al., 2007), Euro 2004 (Yiannakos & Armatas, 2006), the 2006 World Cup (Acar
et al., 2009; Armatas & Yiannakos, 2010) and the 2006-2007 Greek “SuperLeague”
(Armatas et al., 2009). The range of competitions in which this relationship has been
reported indicates its prevalence across the world. The only study to report no immediate
relationship reported that during the 1986 World Cup GSF was greatest between 60-75
minutes, with all other periods displaying a similar number of goals scored (Jinshan, 1986, as
cited in Jinshan et al., 1993). This finding may be explained by the balance between attack
and defence throughout matches during this tournament, unlike during the 1990 World Cup
which saw teams perform cautiously during the first half leading to just 29.6% of goals being
scored during the first half compared to 66.9% in the second half of matches (Jinshan et
al.,1993). Such findings indicate the influence evolving tactical approaches to the game can
have on GSF.
Morris (1981) was the first to report a relationship between time and GSF, using data on
9,000 goals scored in English league and cup matches between April 1978 and November
1980, increases in GSF with each 15 minute period of play were reported. Although Morris’s
(1981) findings match many subsequent studies, the methods of data collection and analysis
were not reported, making it impossible to assess the validity of the findings.
11
In a study of the 115 goals scored during the 1990 World Cup, Jinshan et al. (1993) reported
GSF to be greater during the second half of matches compared to the first (66.9% v 29.6%, p
< 0.05) and greatest between 76-90+ minutes. For each goal the time, attacking method and
shooting technique were reported; however the methods used were not which is indicative of
a general lack of consistency and standardisation in the collection and reporting of goal
scoring data in previous literature. For example, no information was provided by Morris
(1981), Jinshan et al. (1993) or Abt et al. (2002) regarding how the time of each goal was
determined, simply indicating that it was recorded. Other studies (Armatas et al., 2007,
Yiannakos & Armatas, 2006) indicated in more detail how data was collected making it
possible for researchers to replicate those studies should they wish. Regarding the
presentation of data, some studies (Armatas & Yiannakos, 2010; Armatas et al., 2007;
Armatas et al., 2009; Yiannakos & Armatas, 2006) presented GSF per half or per 15 minute
period as a percentage with data analyses conducted using absolute figures, some (Acar et
al., 2009) presented data as both a percentage and an absolute figure, whilst others presented
data as absolute figures only (Abt et al., 2002). Presenting frequencies as percentages for
example can conceal differences in absolute size which complicates the interpretation of
individual studies (Argyrous, 2005). Furthermore, none of the studies mentioned discussed
the methods used for presenting data and the fact that different methods were used
complicates the comparison of results further.
Only two studies (Abt et al., 2002; Armatas et al., 2007) have focused solely on the
relationship between time and GSF. Armatas et al. (2007) studied the 192 matches played
during the World Cups of 1998, 2002 and 2006 using video recordings of each match and
determined the time of each goal according to the researcher’s personal observation using the
Sportscout video-analysis program. At each tournament GSF was greatest during the second
half of matches and greatest during the final 15 minutes, although during the 2006 World
Cup the difference in GSF in the second half compared to the first was not significant
(52.5% v 47.5%, p > 0.05).
12
Abt et al. (2002) studied the 2,065 goals scored during four seasons (1994-1995 to 1997-
1998) of the ANSL and reported a significant (p < 0.001) increase in GSF during the second
half of matches compared to the first and a significant (p < 0.01) upward trend across
consecutive 15 minute periods of play, with the greatest GSF occurring in the final 15
minutes. However this study was limited by the inability to determine whether goals scored
in the 47th minute for example, were scored in the 2
nd minute of added time in the first half,
or the 2nd
minute of the second half, which may have reduced GSF recorded prior to half
time. Despite this, the large sample size enabled Abt et al. (2002) to conclude that the
findings provided strong support for a relationship between time and GSF and that changes
in physical and mental condition and team tactics over the course of a match were strongly
linked.
2.4 Physiological demands
Time-motion analysis applied to football reports outfield players typically cover between 8-
13km per match (Di Salvo et al., 2007; Rampinini, Impellizzeri, Castagna, Coutts & Wisløff,
2009; Reilly, 2003; Stolen et al., 2005) in an intermittent fashion, with typical work-to-rest
ratios of between 1:6 and 1:10 (Little & Williams, 2007; O’Donoghue, Boyd, Lawlor &
Bleakley, 2001) and around 1000 to 1400 changes in activity (Mohr, Krustrup & Bangsbo,
2003). The total distance is covered by a combination of walking (24%), jogging (36%),
cruising (20%), sprinting (11%) and moving backwards (7%) (Strudwick & Reilly, 2001).
As these movement patterns suggest approximately 90% of energy demands are met via
aerobic metabolism (Bangsbo, 1994), with players typically operating at 70-75% VO2max
(Bangsbo & Krustrup, 2009). Although a small percentage of energy (10%) is provided by
the anaerobic system (Bangsbo, 1994), its importance is significant since high-intensity
efforts such as sprinting occur every 30 s (Reilly, 2007) and are critical to the outcome of
matches (Sporis et al., 2009; Stolen et al., 2005; Stone & Kilding, 2009). The ability to
13
perform repeated high-intensity actions is vital and highlighted by the consistent finding that
elite players perform significantly more high-intensity running than sub-elite players
(Bangsbo, Nøregaard &Thorsøe, 1991; Ekblom, 1986; Mohr et al., 2003).
Playing position affects the demands placed on individual players due to the activities
required to fulfil their role. Goalkeepers aside; central defenders perform the least high-
intensity running (Mohr et al., 2003) and cover the least distance since their role is
traditionally purely defensive (Reilly, 2003). Midfielders have consistently been reported to
cover the greatest distance (Bangsbo, 1994; Clark, 2010; Ekblom, 1986; Mohr et al., 2003),
although recent research suggests full-backs and attackers cover similar distances with
attackers sprinting the most and full-backs performing the most high-intensity activity,
indicating an evolution in tactics and positional roles as the intensity of modern football has
increased (Clark, 2010; Mohr et al., 2003). Individual differences amongst players of the
same position also exist, making it difficult to generalise by position. A holding midfielder,
whose primary role is to protect the defence, may not cover as much ground as a box-to-box
midfielder (Reilly, 2007). This was illustrated by the study of Mohr et al. (2003) which
reported one midfielder covered 10.8km with 2.0km covered at high-intensity and another
covered 12.3km with 3.5km at high-intensity.
2.4.1 The impact of resultant fatigue
2.4.1.1 Physiological performance
The physiological demands of the game cause fatigue which can be defined as a decline in
physical, mental and technical performance as a result of the requirement to sustain
performance (Carling et al., 2005). A large evidence base suggests fatigue developed over
the course of a match causes physical performance to deteriorate (Krustrup et al., 2006;
Mohr et al., 2003; 2004; 2005), with distance covered, bouts of sprinting and high-intensity
14
running reduced in the second half of matches, particularly in the final 15 minutes (Mohr et
al., 2003). Players with high levels of aerobic fitness suffer less decrement in work-rate as
matches progress and whilst training can improve this, other factors including muscle
glycogen levels (Saltin, 1973), muscular strength (Rahnama, Reilly, Lees & Graham-Smith,
2003; Rahnama, Lees & Reilly, 2006) , team tactics and climatic conditions (Reilly, 2007)
must also be considered. Fatigue is not only experienced in the latter stages of matches but
also after periods of high-intensity activity, resulting in reduced performance in the minutes
immediately afterwards (Reilly, 2007) as shown by Mohr et al. (2003), who reported that
after 5 minutes of high-intensity running, performance was reduced by 12% for the
following 5 minutes.
2.4.1.2 Technical performance
Most studies have focused on the influence of fatigue on physical performance; however a
recent study by Rampinini et al. (2009) investigated the influence on technical skills during a
match. Decreases in the number of passes, successful passes and involvements with the ball
during the second half compared to the first were reported and it was concluded that fatigue
reduced technical skills, although fatigue was more likely reducing the ability to get involved
with the ball rather than the actual performance of technical skills (Rampinini et al., 2009).
The study was also unable to determine whether the decreases were a result of cognitive
function, muscular fatigue, strength or endurance capacity. Zeederberg et al. (1996) and Abt
et al. (1998) have shown that shooting ability may be unaffected by fatigue indicating an
advantage for attackers over defenders as a match progresses.
2.4.1.3 Cognitive performance
Dehydration as a match progresses can impair cognitive performance (Maughan & Leiper,
1994) and as Burke (1997) asserts, the nature of competitive matches places additional
15
importance on ensuring adequate hydration since the rules do not allow for regular stoppages
for rehydration, increasing the possibility of reduced cognitive performance in the latter
stages of matches. Moderate dehydration and sweat losses of 2% body weight are known to
impair concentration and vigilance (Baker, Conroy & Kenney, 2007) which would
negatively affect performance with lapses in concentration and decision-making errors
opening up goal scoring opportunities (Reilly, 2007).
2.5 Tactics
Play often becomes more urgent in the closing stages of matches as the team that is losing
commits players forward in an attempt to score, leaving themselves more open to conceding
goals themselves (Reilly, 1997) and possibly contributing to increased GSF in the final 15
minutes of matches.
A team’s playing style also affects the physiological demands on players. A slow tempo
style, emphasising possession and waiting for opportunities to exploit the defensive line
requires players with great speed to exploit openings, whereas a more direct style requires a
high tempo with frequent high-intensity actions increasing the overall workload (Carling et
al., 2005; Reilly, 2003). Different styles are known more prevalent in different regions of the
world, such as in South America where players typically cover around 1.5km less distance
per game than their EPL counterparts (Rienzi, Drust, Reilly, Carter & Martin, 2000).
2.5.1 Substitutions
Teams are permitted to make three substitutions during a match which are mainly used to
replace tired or injured players, or to make tactical adjustments (Pearce & Hughes, 2001). A
study of the 174 substitutions made during Euro 2000 (Pearce & Hughes, 2001) reported that
the most common time to make a substitution was between 75-80 minutes. Substitutes
16
entering a game at this time have an advantage over players who started a match and have
been reported to exhibit higher work-rates and cover 25% more distance during the final 15
minutes of play as a result of having maximal strength and full energy stores (Mohr et al.,
2003). Similarly Saltin (1973) reported glycogen depleted Swedish club players covered
25% less overall distance than other players. Therefore a fresh attacking substitute may give
team an advantage and increase the chances of a goal being scored. However it is also
possible that the opposition may introduce a fresh defender to protect a lead, although this
can disrupt a cohesive defence (Pearce & Hughes, 2001).
2.6 Residual fatigue
A typical week for a player involves training, tapering, a competitive match and a short
period of recovery (Reilly, 2007). If one game is scheduled for the week players will likely
train six times in five days with the day after the match free (Bangsbo, Mohr & Krustrup,
2006). However elite players have additional domestic and European cup competitions, as
well as international matches which create an irregular and busy schedule. Therefore the
demands of matches are exacerbated by a schedule requiring players to perform in
consecutive matches with little recovery. In the case of the EPL 50% of the matches played
between August and December are played in November and December (not including
domestic cup, European and international matches), with the Christmas period being
particularly intense when up to four matches may be scheduled over 7-8 days (Odetoyinbo et
al., 2009). Playing with insufficient recovery in this manner affects physical performance in
subsequent matches (Odetoyinbo et al., 2009), increasing the potential for goal scoring
opportunities to arise out of defensive errors. In a study of EPL players performing in three
matches over a five day period, Odetoyinbo et al. (2009) observed decreased player work-
rates both with and without the ball by the third match. This was considered indicative of a
tendency to “cruise” through matches during intense fixture periods perhaps in the
knowledge that another game in quick succession was imminent (Odetoyinbo et al., 2009).
17
Distances covered in each game were similar although the distance covered at high-intensity
had decreased by the third game, whilst the distance covered by jogging increased indicating
the impact of residual fatigue and implications for performance due to the importance of
high-intensity activity for success. A follow-up study by Prozone (2009) using data from the
2008-2009 EPL season reported trends from October to December of decreased total
distance covered, fewer high-intensity activities, less distance covered by high-intensity
running, less distance covered by sprinting, fewer sprints and increased recovery time taken
between bouts of activity. A decrease in first time passing success was also reported
(Prozone, 2009) indicating that perhaps fatigue had a residual effect on this skill, but as with
the other trends observed it is possible that players were “cruising” through matches in the
knowledge that they had others to play in quick succession.
2.7 The impact of a winter break?
Whilst the EPL season runs continuously from August to May, the DBL includes a winter
break marking the mid-point of the season (Deutsche Welle, 2008). The main arguments in
support of a winter break are that it coincides with poor weather conditions and enables
players to recover somewhat from the first half of the season (Reilly, 2007). An eight week
winter break was first introduced to the DBL in 1986 to improve the attractiveness and
quality of play over the course of the season by avoiding matches being played on poor
quality surfaces (Stolz, 2009). For the 2009-2010 season the break was reduced from six
weeks to three and a half weeks so that the season could end sooner and allow the German
national team to have a longer break before the 2010 World Cup (Deutsche Welle, 2008).
The break ran from December 21st to January 14th, coinciding with the busy Christmas and
New Year period in the EPL during which time 24 matches (BBC Sport, 2010) were
scheduled. Players in Germany usually spend the first week of the break resting at home
before returning to a winter training camp, friendly matches and indoor tournaments (Knight,
2011; DFL – German Football League, 2009). During the 2009-2010 winter break, 16 of the
18
18 teams held training camps commencing December 27th at the earliest and January 3
rd at
the latest. Of these, 14 held training camps outside Germany in locations including Spain,
Turkey, Austria, South Africa and Dubai. Training camps are generally held in warmer
climates than Germany to ensure maximum training time, but increasingly training camps
have become more sponsorship and promotion oriented reducing the time players are able to
spend resting (Knight, 2011). For example Bayern Munich’s 2011 tour was scheduled to
involve two 90 minute training sessions per day, a friendly match and numerous promotional
activities (Knight, 2011).
Few studies have compared leagues with a winter break with those without. Although a
UEFA study (Ekstrand et al., 2004) reported injury incidence was significantly higher during
the second half of the season in leagues without a winter break compared to those with one
(14.8 v 7.8 injuries per 100 hours of exposure, p < 0.05). The difference in injury incidence
was even greater when the final two months of the season were compared (25.8 v 6.5 injuries
per 1000 hours of exposure, p < 0.01) and may be indicative of the impact of residual fatigue
over a season. To date no studies have investigated goal scoring patterns over the course of a
season, or the influence of a winter break on goal scoring patterns.
2.8 Summary
Performance analysis is widespread in professional football and studies have influenced the
tactics adopted by teams (James, 2006), signifying the level of importance it is given.
Although a general lack of standardisation in the reporting of the methods used to investigate
goal scoring patterns exists, a large body of research provides strong support for a
relationship between time and GSF, with more goals scored in the second half of matches
compared to the first half and more goals scored in the final 15 minutes than any other period
(Abt et al., 2002; Acar et al., 2009; Armatas & Yiannakos, 2010; Armatas et al., 2009;
Armatas et al., 2007; Grant et al., 1999a; Jinshan et al., 1993; Reilly, 2003; Ridder et al.,
19
1994; Yiannakos & Armatas, 2006). The explanations asserted for this relationship are
multi-factorial, centring on factors which change over the course of a match such as physical
and mental condition and tactics (Abt et al., 2002). Whilst a pattern over the course of a
match is clearly evident, it is not known whether goal scoring patterns are the same at the
beginning of a season as at the end of a season since previous studies have only investigated
a season or competition as a whole. Residual fatigue has been shown to be carried over from
one match to the next (Odetoyinbo et al., 2009) which may increase GSF in the latter stages
of matches at the end of a season. Also yet to be considered is the potential impact of a
winter break, which may allow players to return for the second half of the season in a less
fatigued state with implications for GSF.
20
Chapter 3
Methods
3.1 Matches
All 380 matches played in the EPL and all 306 matches played in the DBL during the 2009-
2010 season were studied, making a total of 686 matches. The EPL season ran from August
15th 2009 to May 9
th 2010 for a total of 268 days. The DBL season ran from August 7
th 2009
to May 8th 2010, with a 25 day winter break between December 21
st and January 14
th. The
first half of the season ran for 136 days and the second for 114 days making a total of 250
days.
3.2 Research design
The time of each goal in the EPL was recorded according to the time indicated by the EPL
results page (BBC Sport, 2010) of the British Broadcasting Corporation’s Sport website. The
time of each goal in the DBL was recorded according to the time indicated on the official
website of the DBL (DFL – German Football League, 2010). This goal scoring data was then
entered into a Microsoft Excel 2007 (Excel) (Microsoft Corporation, Redmond, Washington)
spreadsheet to create frequency counts for each minute of play from 1 to 90+ for each half of
the season and totalled for each league. Goals scored during first half stoppage time were
recorded as having been scored in the 45th minute (45+) and goals scored during second half
stoppage time were recorded as scored in the 90th minute (90+), in line with previous studies
(Abt et al., 2002; Armatas & Yiannakos, 2010; Armatas et al., 2009; Armatas et al., 2007,
Yiannakos & Armatas, 2006). For the purpose of the analysis both league seasons were
divided into a first and second half. In the DBL the halfway point of the season was denoted
by the winter break, by which point each team had played half of their matches resulting in
21
two equal halves containing 153 matches each. A halfway point was created for the EPL and
defined as having occurred once half of the total 380 matches had been played; resulting in
two equal halves containing 190 matches each.
Once frequency counts had been created for each minute of play Excel was used to calculate
the following for each league per half and full season:
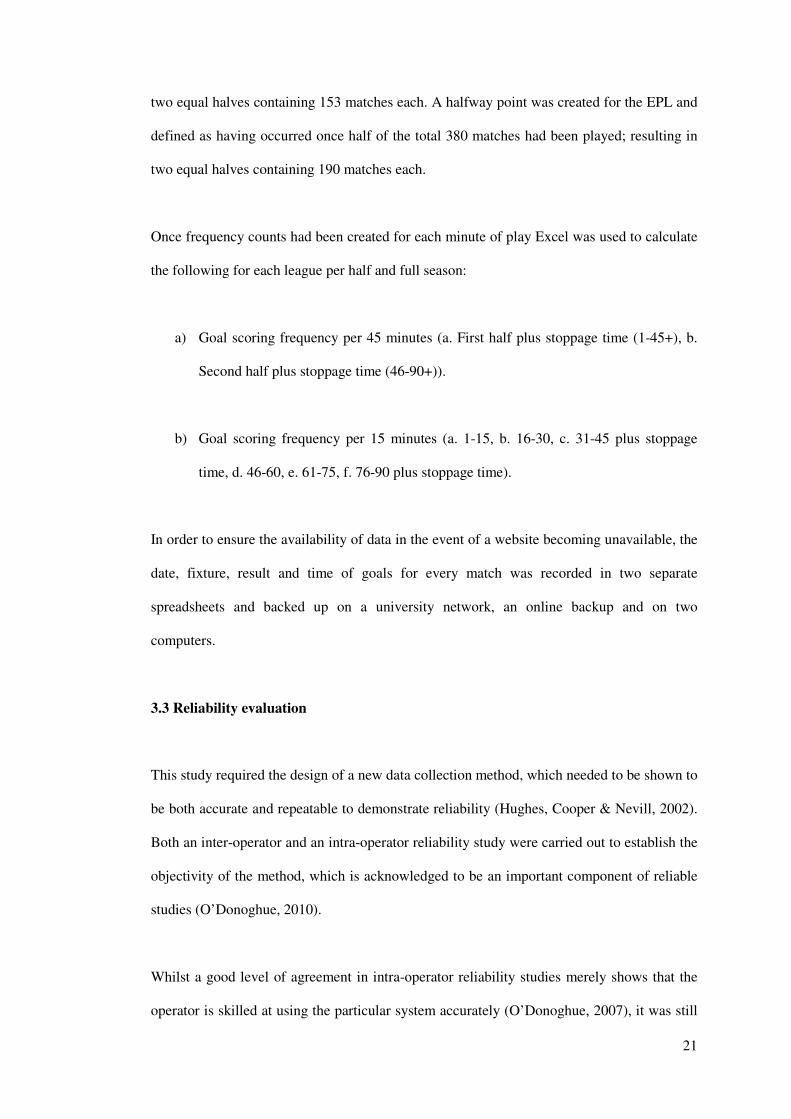
a) Goal scoring frequency per 45 minutes (a. First half plus stoppage time (1-45+), b.
Second half plus stoppage time (46-90+)).
b) Goal scoring frequency per 15 minutes (a. 1-15, b. 16-30, c. 31-45 plus stoppage
time, d. 46-60, e. 61-75, f. 76-90 plus stoppage time).
In order to ensure the availability of data in the event of a website becoming unavailable, the
date, fixture, result and time of goals for every match was recorded in two separate
spreadsheets and backed up on a university network, an online backup and on two
computers.
3.3 Reliability evaluation
This study required the design of a new data collection method, which needed to be shown to
be both accurate and repeatable to demonstrate reliability (Hughes, Cooper & Nevill, 2002).
Both an inter-operator and an intra-operator reliability study were carried out to establish the
objectivity of the method, which is acknowledged to be an important component of reliable
studies (O’Donoghue, 2010).
Whilst a good level of agreement in intra-operator reliability studies merely shows that the
operator is skilled at using the particular system accurately (O’Donoghue, 2007), it was still
22
important to carry out an intra-operator reliability study to identify whether changes needed
to be made to the data collection procedures before undertaking an inter-operator reliability
study (O’Donoghue, 2007). The intra-operator reliability study involved the collection of
goal scoring data for all 686 matches to be used in the study on two separate occasions by
the same operator. Chi-square analysis of this data resulted in perfect agreement (p = 1.000)
between both data collections. The inter-operator reliability study involved goal scoring data
for all 686 matches to be used in the study being collected by two different operators using
the data collection procedures designed for this study. Chi-square analysis of both sets of
data produced by these operators also resulted in perfect agreement (p = 1.000). The results
of both the intra and inter-operator reliability studies indicated that the research design
developed for this study was repeatable, objective and appropriate.
3.4 Data analysis
Data was analysed using SPSS 16.0 (SPSS Inc., Chicago, Illinois). Chi-square analysis was
used to determine any statistically significant differences in GSF per 45 minute period, per
15 minute period, and between the final 15 minutes of play per half season for each league.
Chi-square analysis was also used to identify any statistically significant differences in GSF
during the final 15 minutes of matches in the second half of the season between the two
leagues, for an effect of league, time of season and a league x time interaction. The level of
significance in all cases was set at p < 0.05.
23
Chapter 4
Results
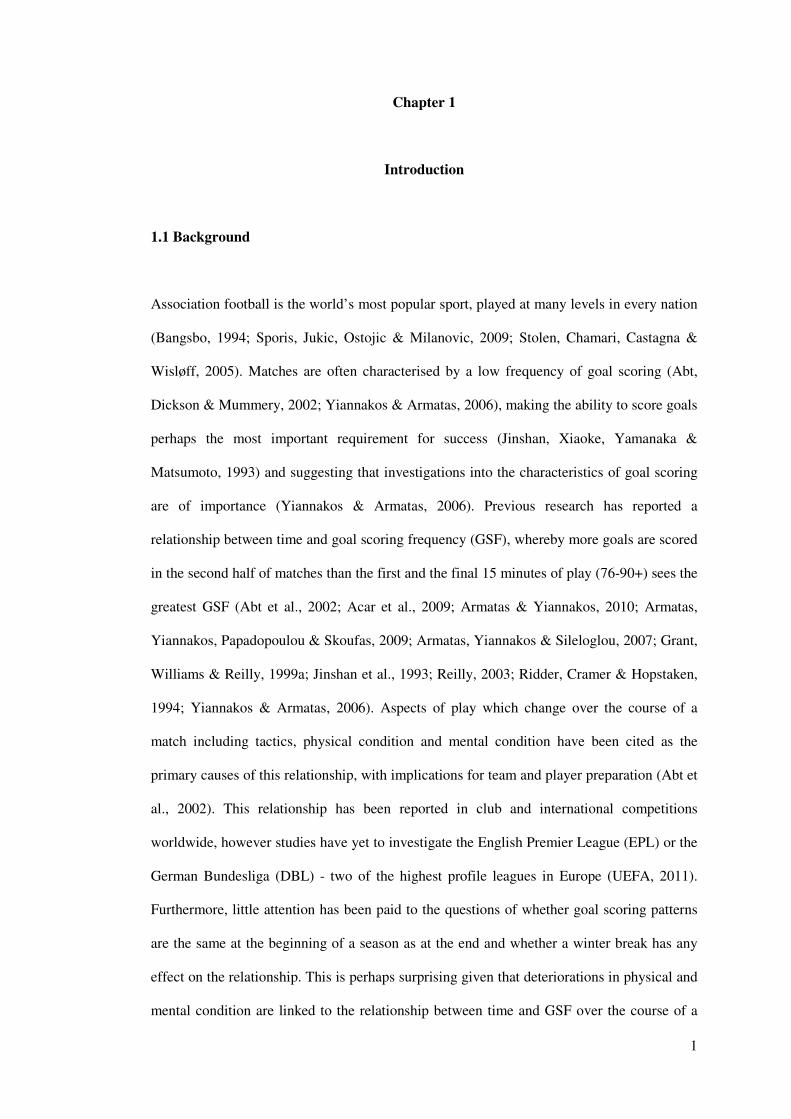
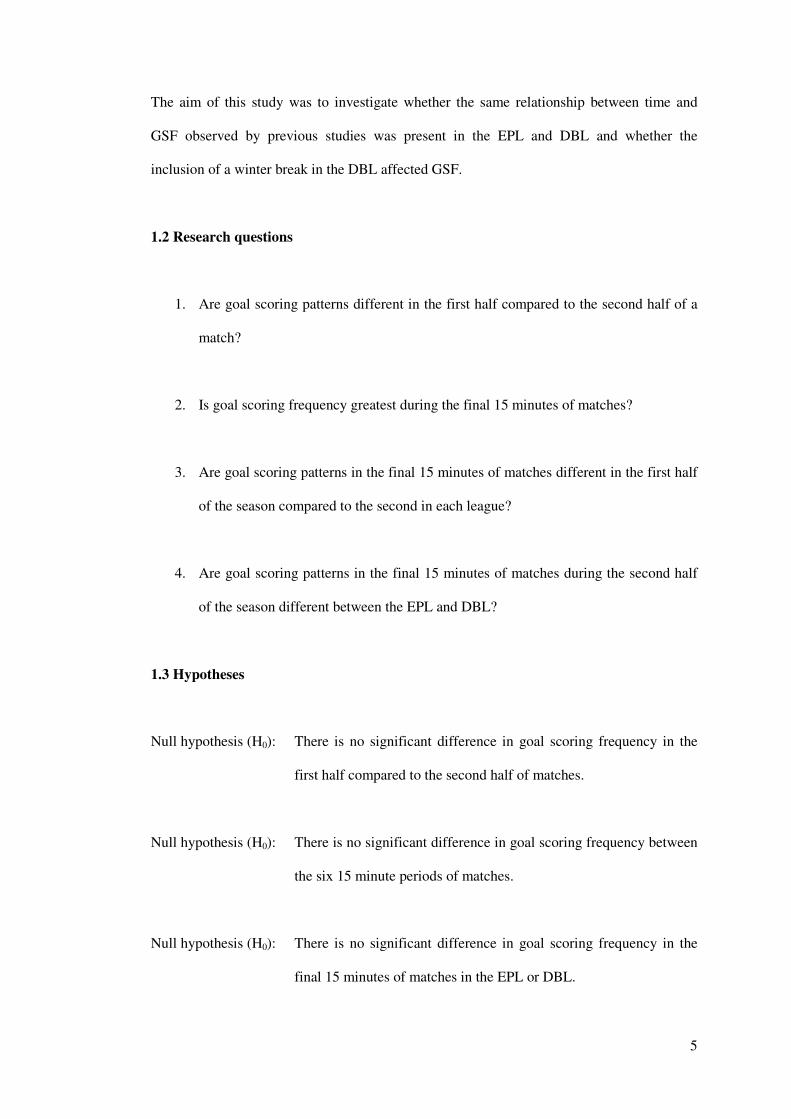
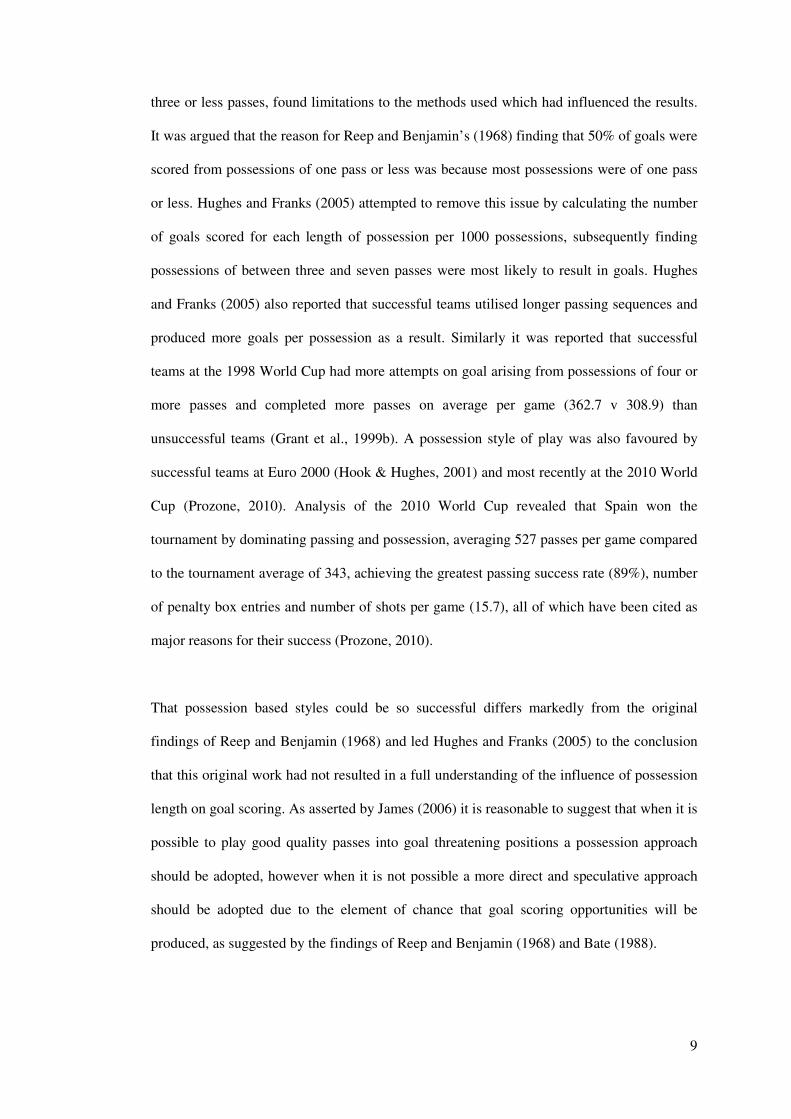
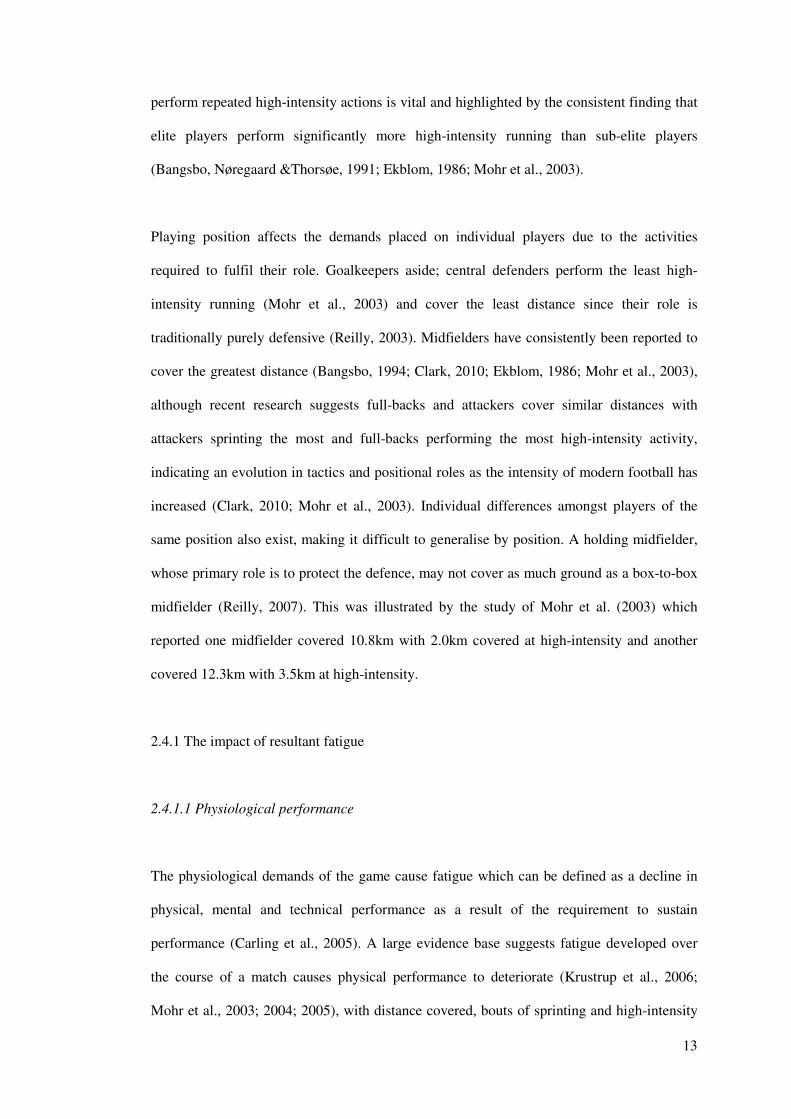
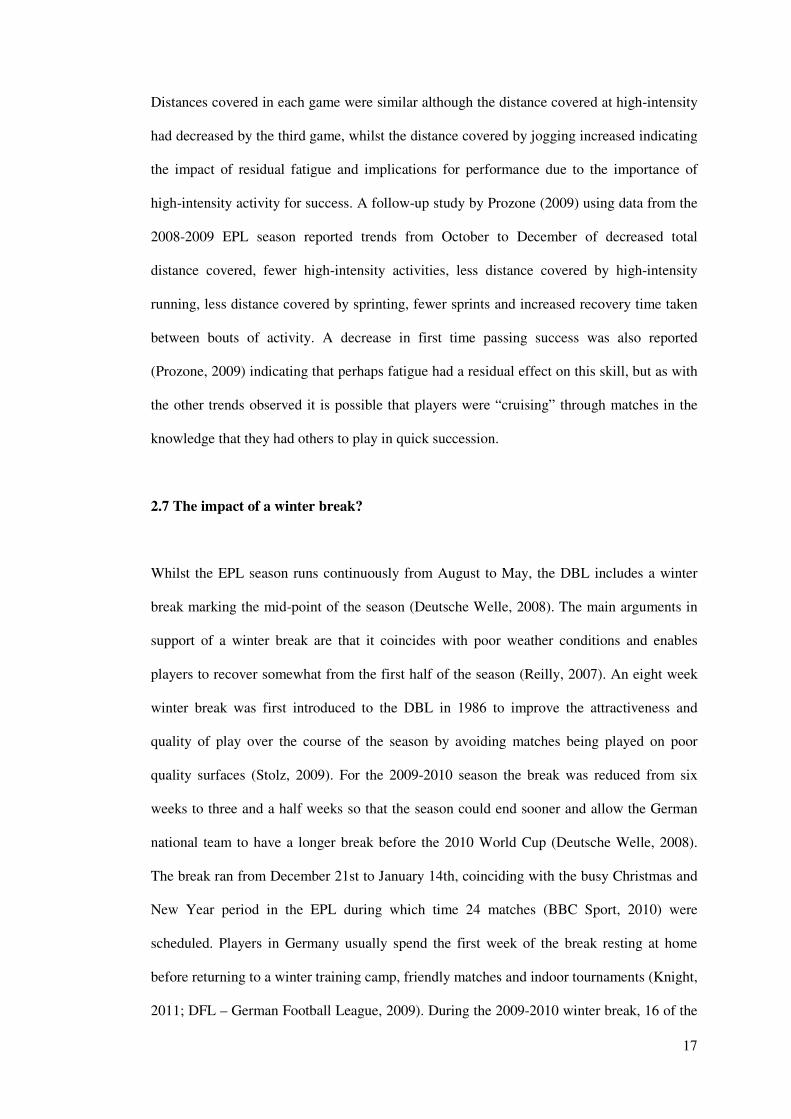
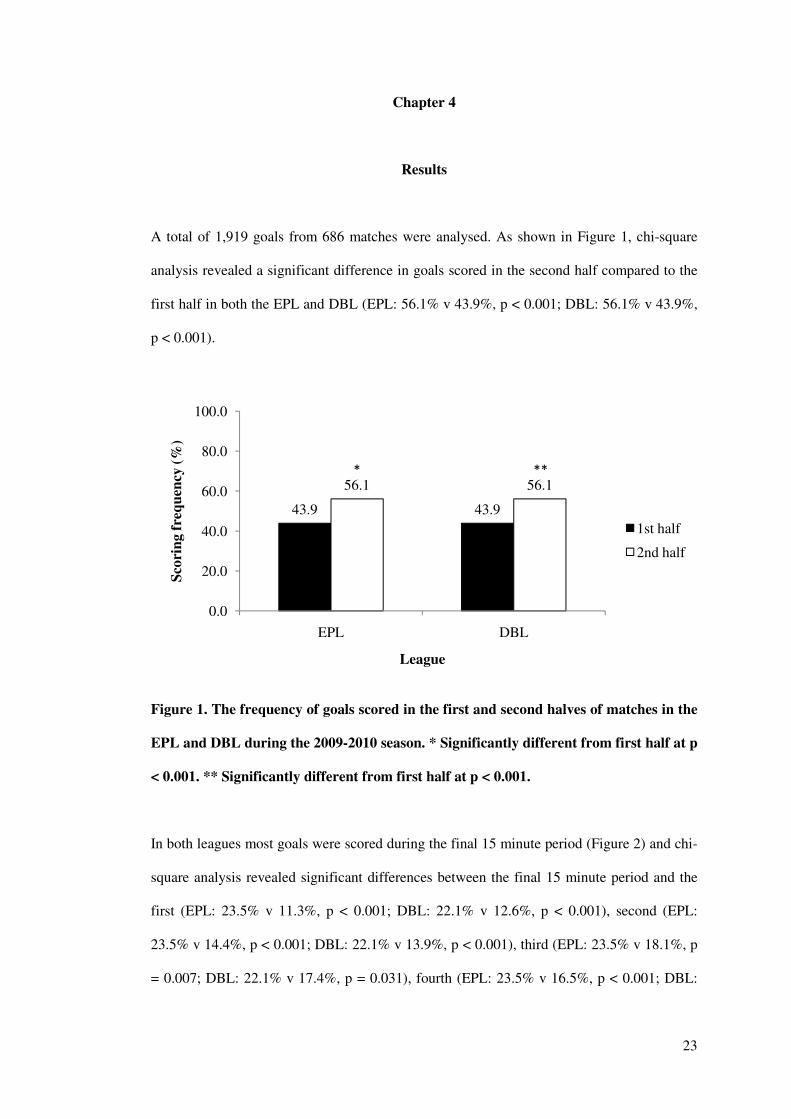
A total of 1,919 goals from 686 matches were analysed. As shown in Figure 1, chi-square
analysis revealed a significant difference in goals scored in the second half compared to the
first half in both the EPL and DBL (EPL: 56.1% v 43.9%, p < 0.001; DBL: 56.1% v 43.9%,
p < 0.001).
Figure 1. The frequency of goals scored in the first and second halves of matches in the
EPL and DBL during the 2009-2010 season. * Significantly different from first half at p
< 0.001. ** Significantly different from first half at p < 0.001.
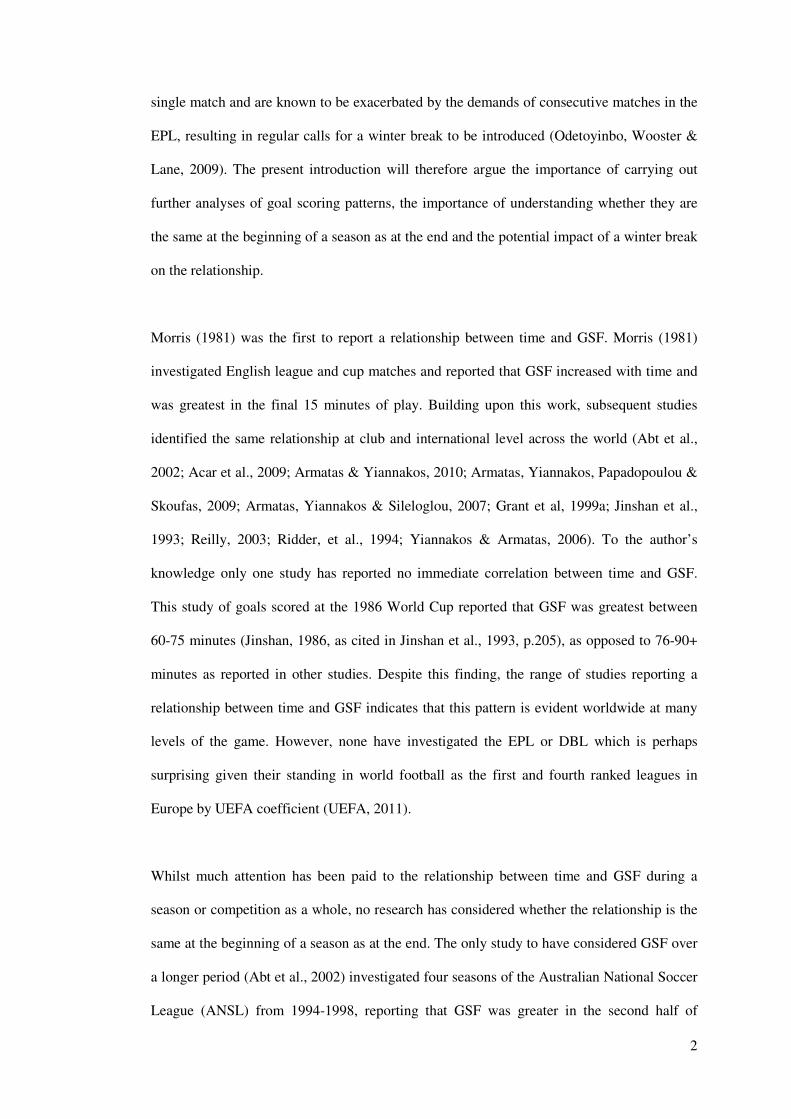
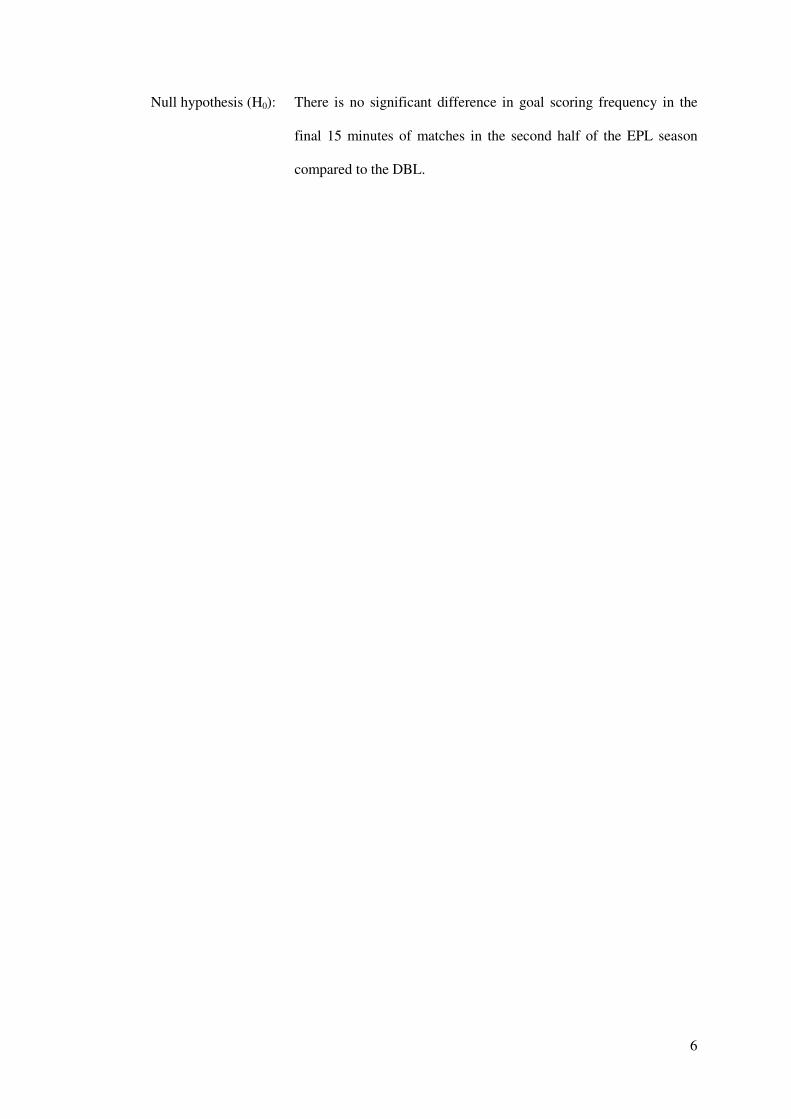
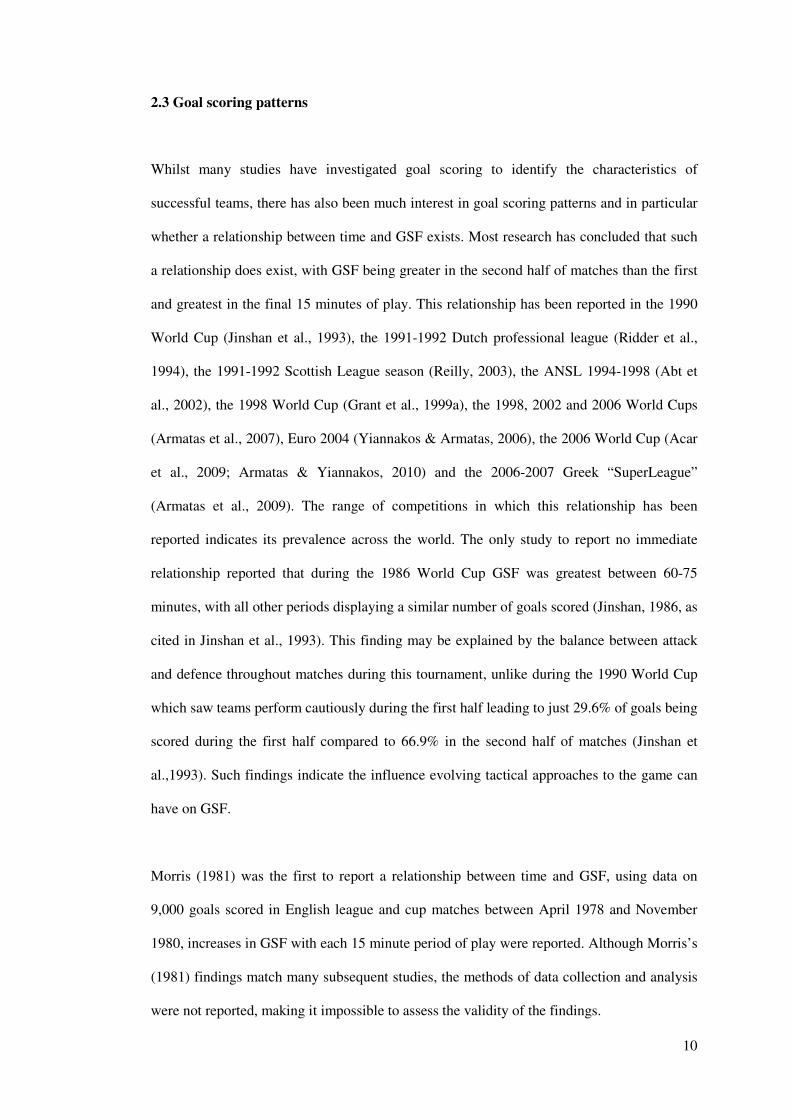
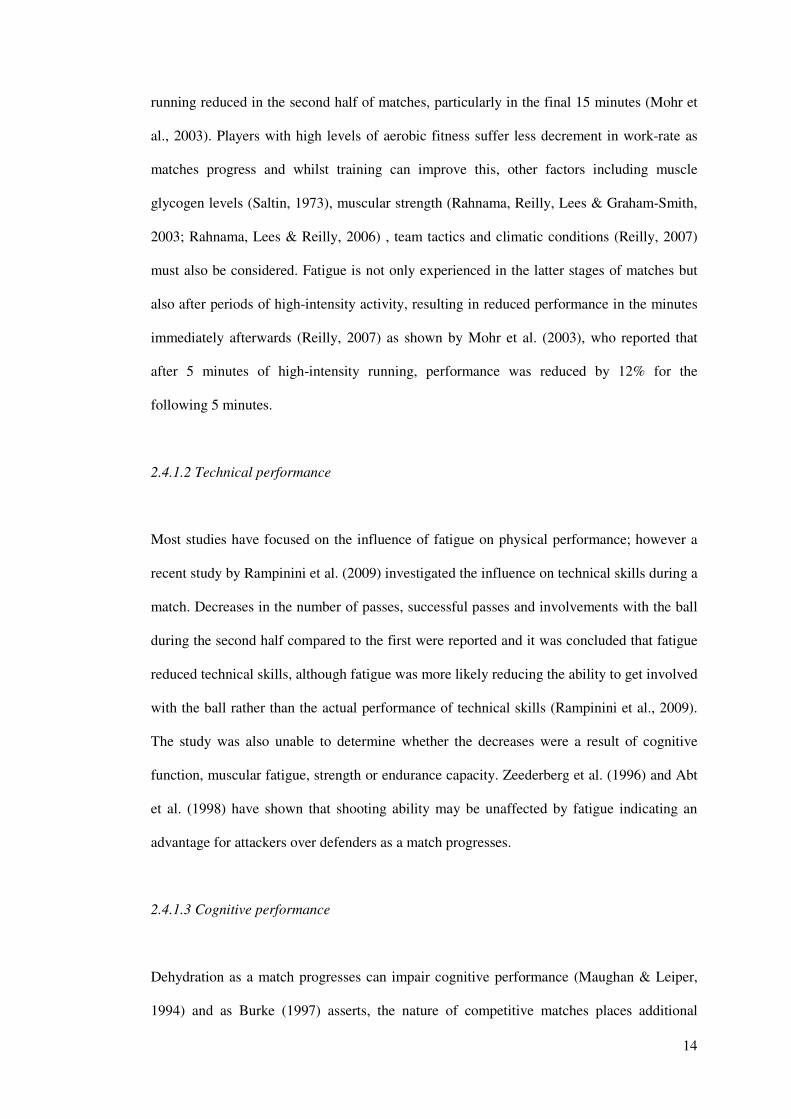
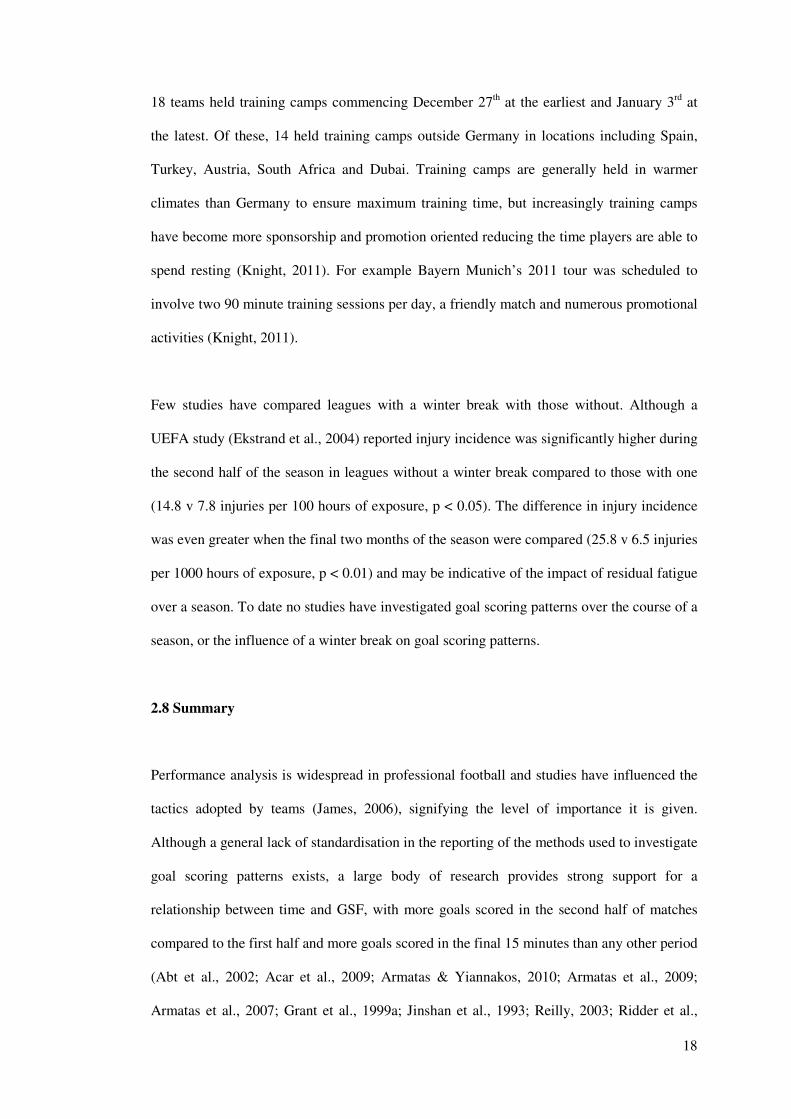
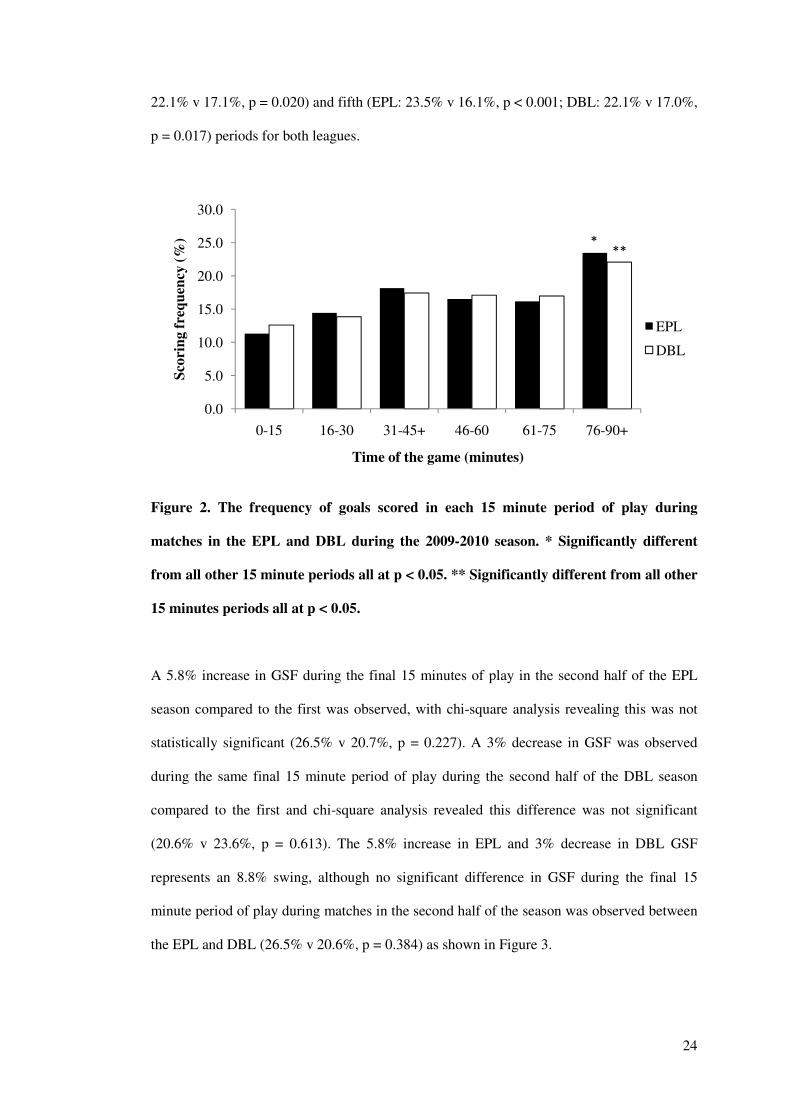
In both leagues most goals were scored during the final 15 minute period (Figure 2) and chi-
square analysis revealed significant differences between the final 15 minute period and the
first (EPL: 23.5% v 11.3%, p < 0.001; DBL: 22.1% v 12.6%, p < 0.001), second (EPL:
23.5% v 14.4%, p < 0.001; DBL: 22.1% v 13.9%, p < 0.001), third (EPL: 23.5% v 18.1%, p
= 0.007; DBL: 22.1% v 17.4%, p = 0.031), fourth (EPL: 23.5% v 16.5%, p < 0.001; DBL:
43.9 43.9
56.1 56.1
0.0
20.0
40.0
60.0
80.0
100.0
EPL DBL
Sco
rin
g f
req
uen
cy (
%)
League
1st half
2nd half
* **
24
22.1% v 17.1%, p = 0.020) and fifth (EPL: 23.5% v 16.1%, p < 0.001; DBL: 22.1% v 17.0%,
p = 0.017) periods for both leagues.
Figure 2. The frequency of goals scored in each 15 minute period of play during
matches in the EPL and DBL during the 2009-2010 season. * Significantly different
from all other 15 minute periods all at p < 0.05. ** Significantly different from all other
15 minutes periods all at p < 0.05.
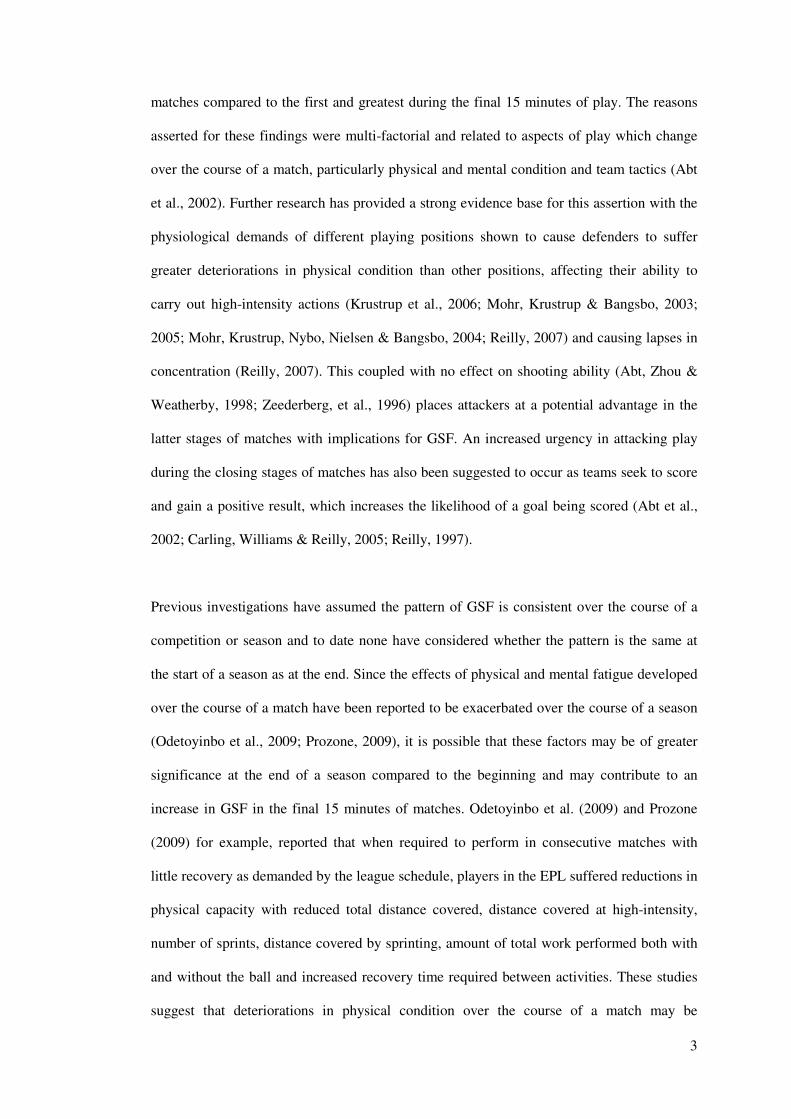
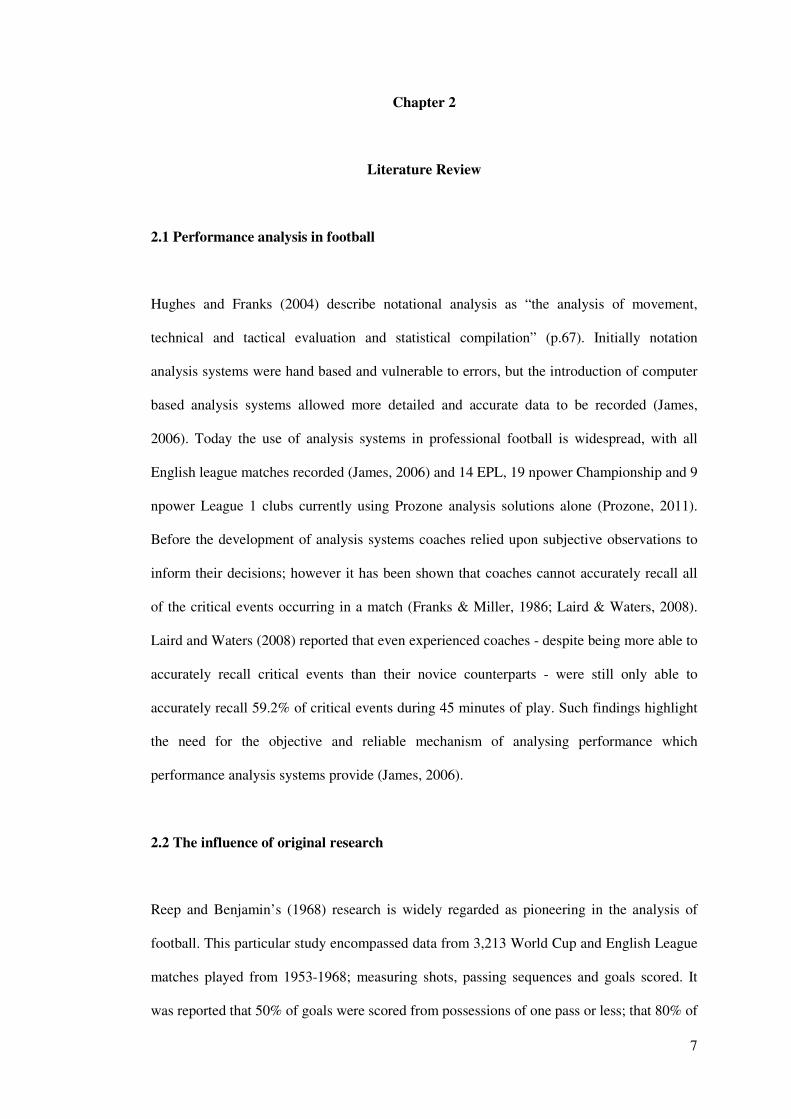
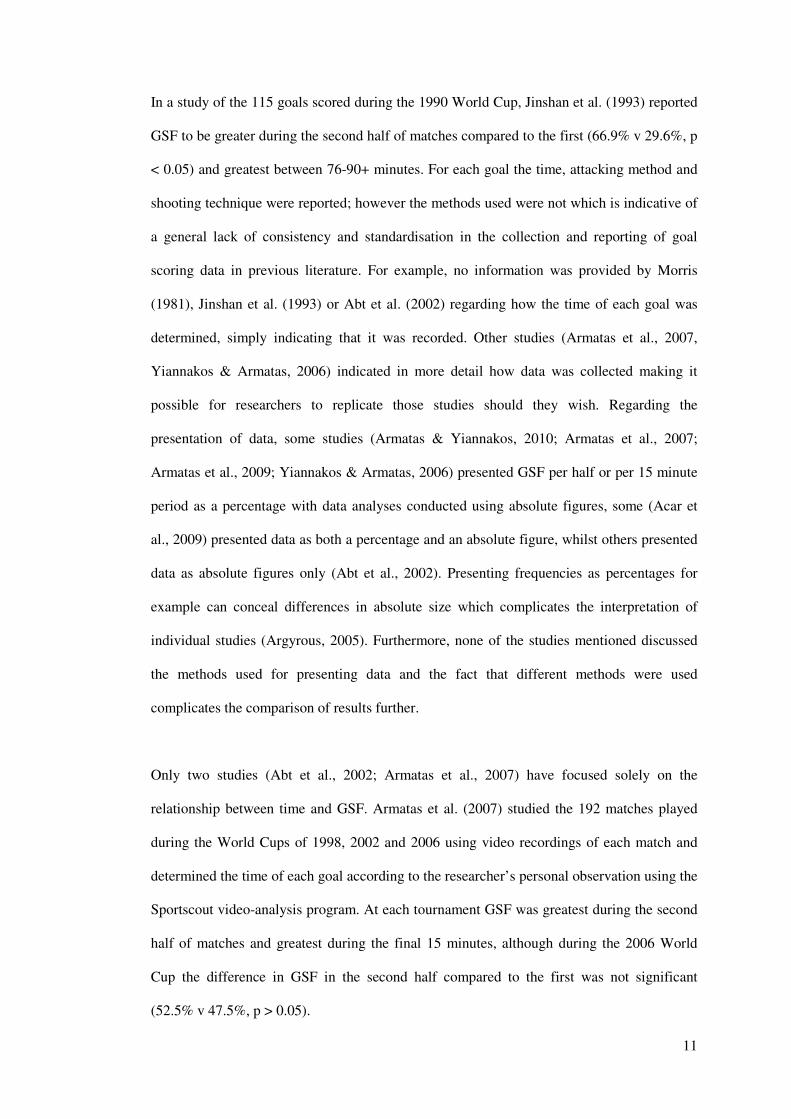
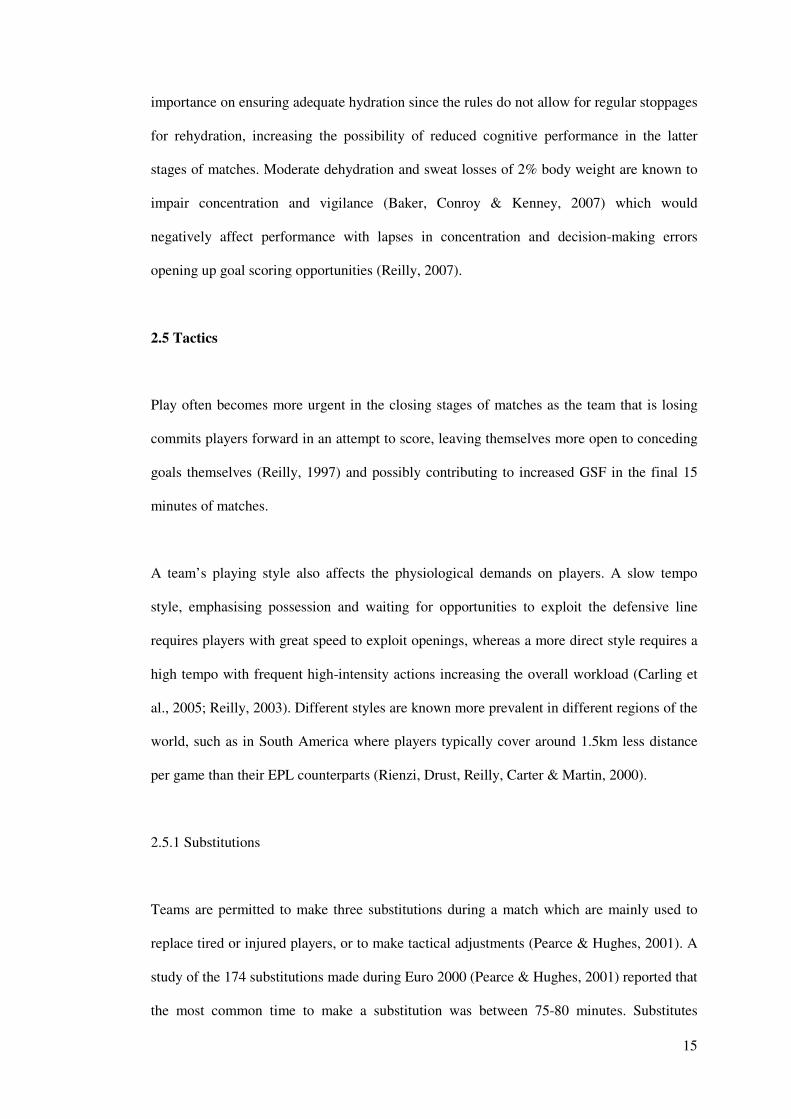
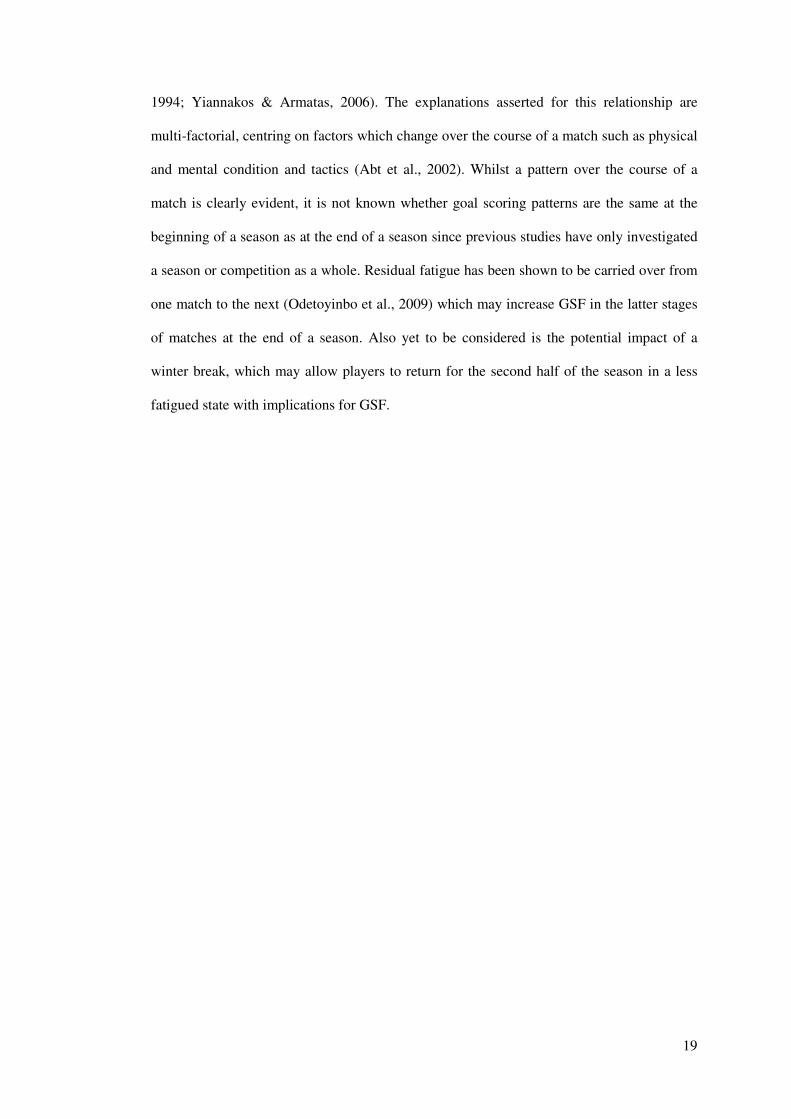
A 5.8% increase in GSF during the final 15 minutes of play in the second half of the EPL
season compared to the first was observed, with chi-square analysis revealing this was not
statistically significant (26.5% v 20.7%, p = 0.227). A 3% decrease in GSF was observed
during the same final 15 minute period of play during the second half of the DBL season
compared to the first and chi-square analysis revealed this difference was not significant
(20.6% v 23.6%, p = 0.613). The 5.8% increase in EPL and 3% decrease in DBL GSF
represents an 8.8% swing, although no significant difference in GSF during the final 15
minute period of play during matches in the second half of the season was observed between
the EPL and DBL (26.5% v 20.6%, p = 0.384) as shown in Figure 3.
0.0
5.0
10.0
15.0
20.0
25.0
30.0
0-15 16-30 31-45+ 46-60 61-75 76-90+
Sco
rin
g f
req
uen
cy (
%)
Time of the game (minutes)
EPL
DBL
***
25
Figure 3. The frequency of goals scored during the final 15 minutes of matches played
in the first half of the season compared to the second half of the season in the EPL and
DBL during the 2009-2010 season.
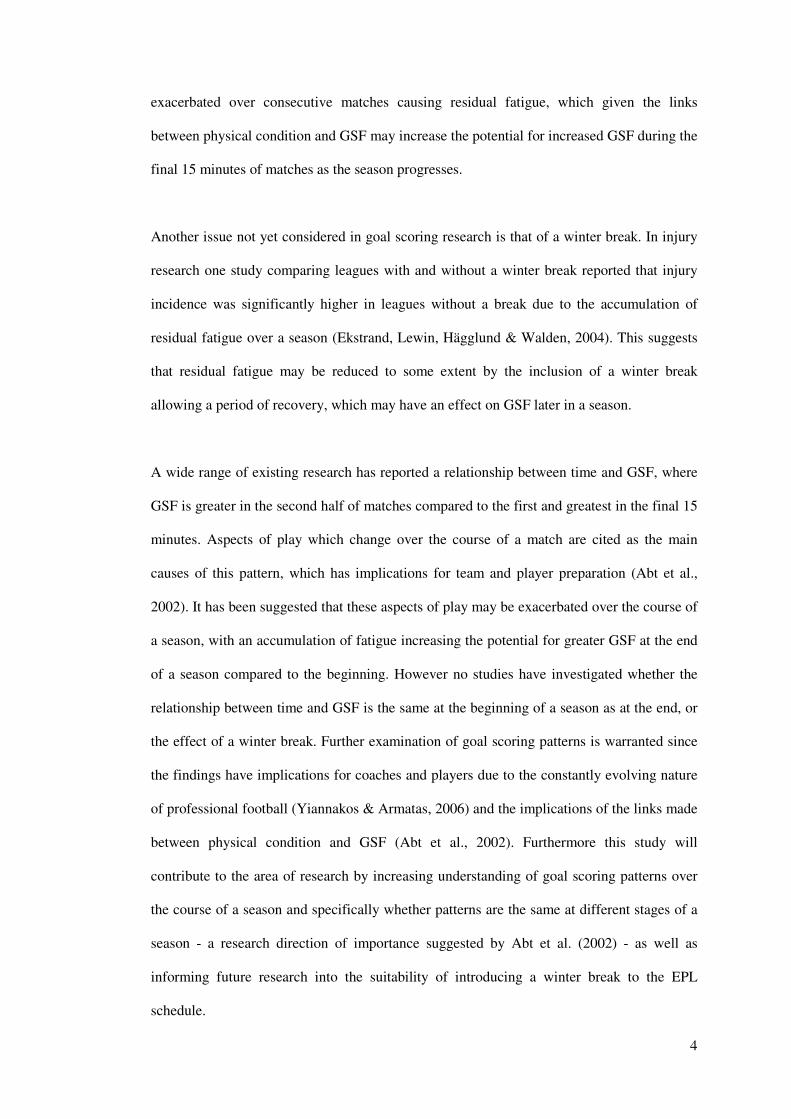
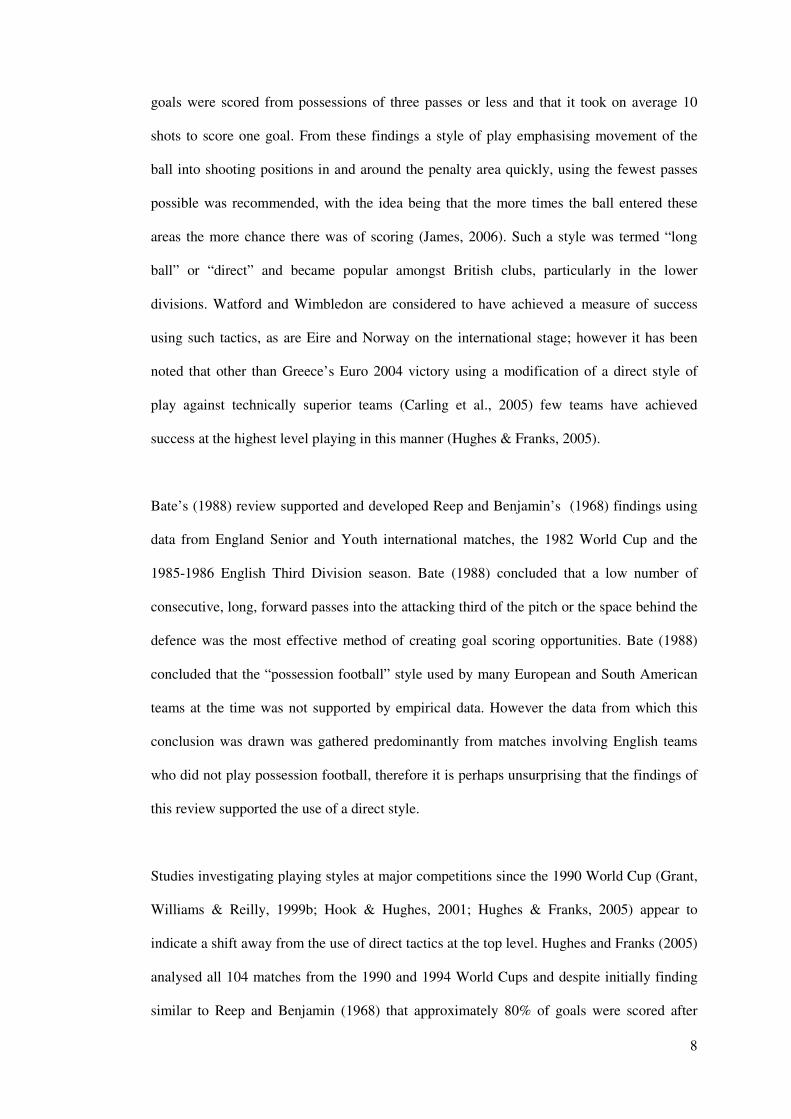
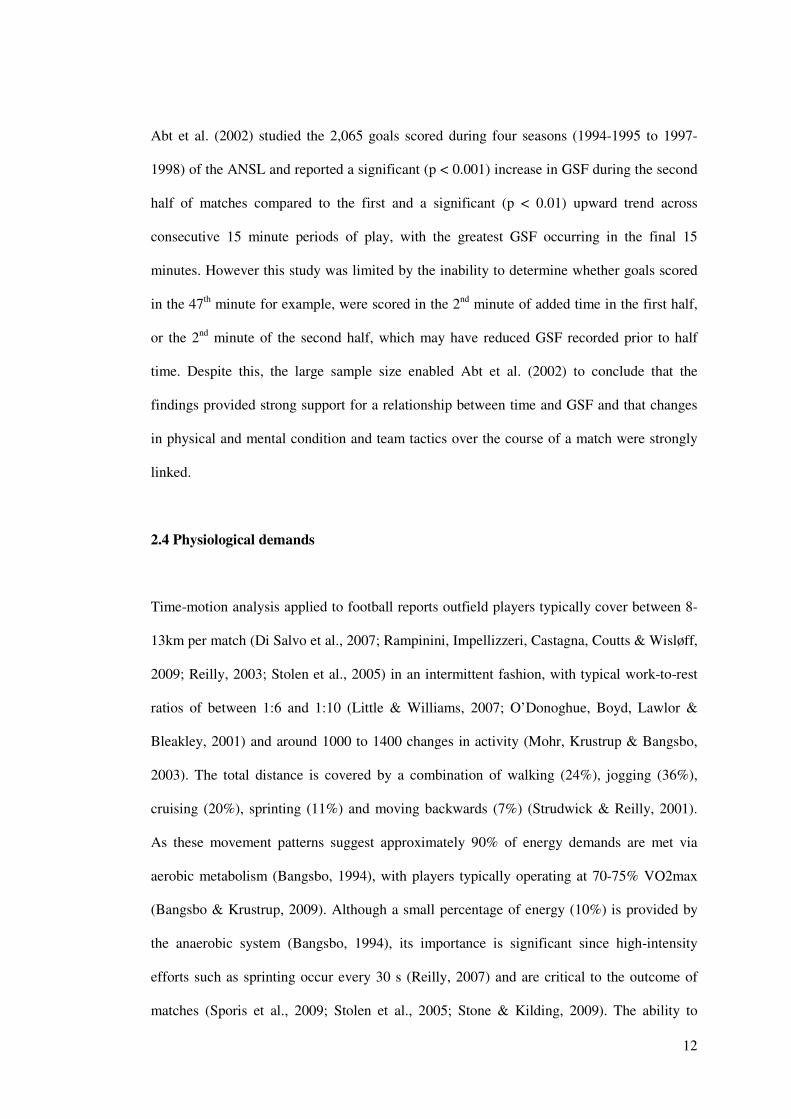
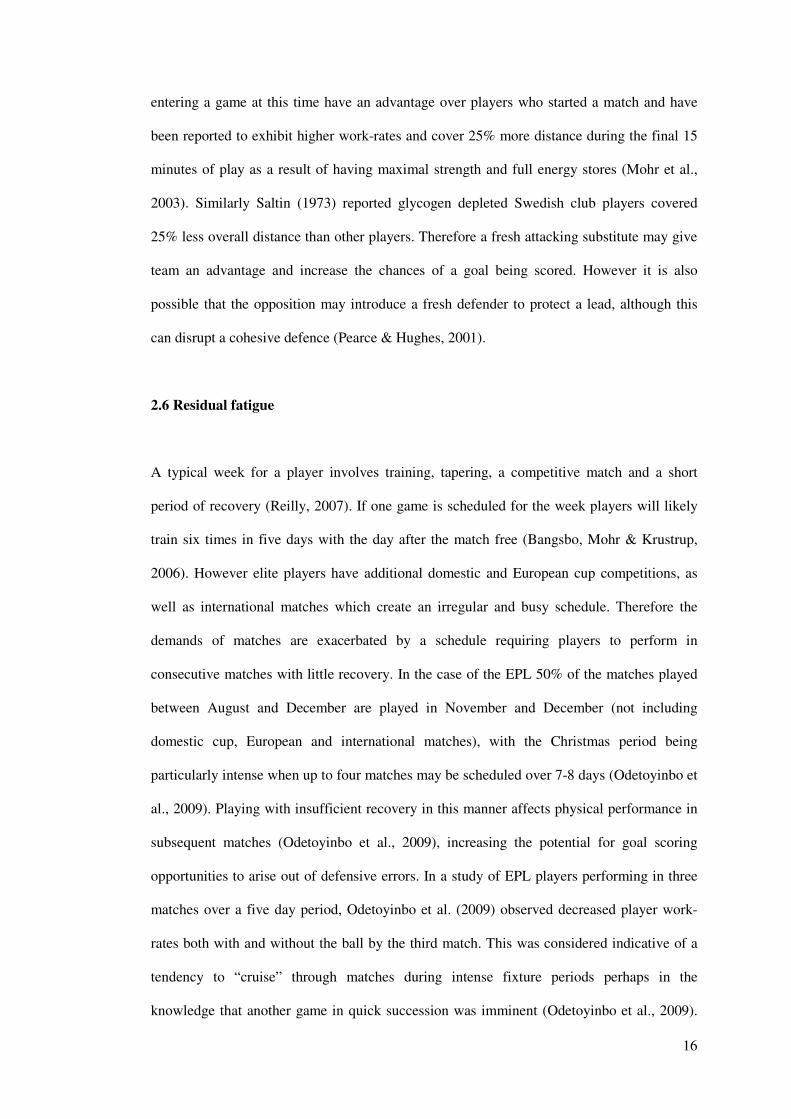
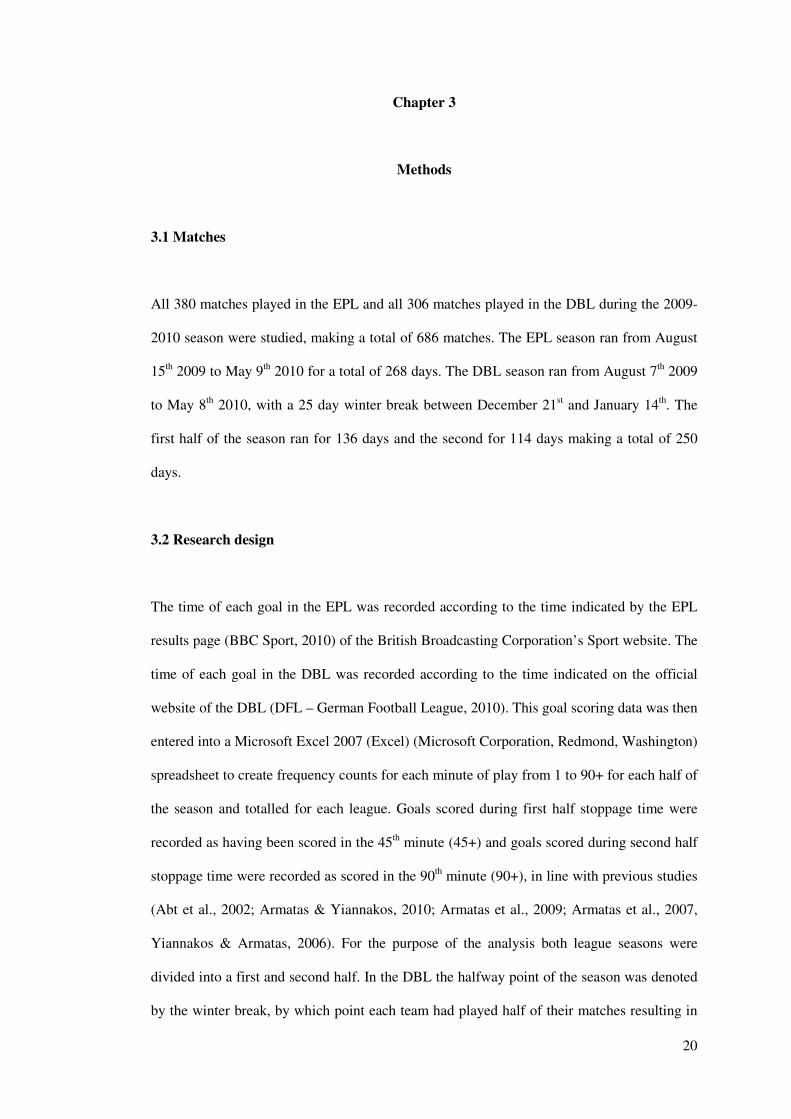
Analyses revealed no league x time interaction (p = 0.240) and no effect for time of season
(p = 0.570). As shown in Figure 4 there was an effect for league on GSF during the final 15
minutes of play (p = 0.010).
Figure 4. Effect of league on total number of goals scored during the final 15 minutes of
matches in the second half of the season compared to the first in the EPL and DBL
during the 2009-2010 season.
20.7
23.6
26.5
20.6
0.0
5.0
10.0
15.0
20.0
25.0
30.0
EPL DBL
Sco
rin
g f
req
uen
cy (
%)
League
1st half season
2nd half season
0
20
40
60
80
100
120
140
EPL DBL
Sco
rin
g f
req
uen
cy
League
1st half season Second half season
26
Chapter 5
Discussion
5.1 Main findings
The results of the present study indicate that in both the EPL and DBL GSF was significantly
greater in the second half of matches (EPL: 56.1% v 43.9%, p < 0.001; DBL: 56.1% v
43.9%, p < 0.001; Figure 1) and greatest in the final 15 minutes of matches compared to all
other 15 minute periods (EPL: 23.5%, all at p < 0.05; DBL 22.1%, all at p < 0.05; Figure 2).
Although no significant differences were observed in GSF in the final 15 minutes of matches
in the second half of the season compared to the first in either league (EPL: 26.5% v 20.7%,
p = 0.227; DBL: 20.6% v 23.6%, p = 0.613), GSF in the EPL increased by 5.8% in the final
15 minutes of matches in the second half of the season compared to the first, whereas GSF in
the DBL during the same period decreased by 3% (Figure 3). These findings represent an
8.8% swing between EPL and DBL which was supported by the finding of a main effect for
league (p = 0.010) on GSF during the final 15 minutes of play in the second half of the
season (Figure 4), although no league x time interaction (p = 0.240) was observed (Figure 4).
Therefore the inclusion of a winter break in a competitive league schedule appears to result
in a reduction in GSF in the final 15 minutes of matches during the second half of the season
when compared with a league without such a break.
5.1.1 Goal scoring over the course of a match
The findings of the present study add further support to the concept of a relationship between
time and GSF, where GSF is greater in the second half compared to the first and greater in
the final 15 minutes of matches than all other periods (Abt et al., 2002; Acar et al., 2009;
Armatas et al., 2007; Armatas & Yiannakos, 2010; Armatas et al, 2009; Grant et al., 1999a;
27
Jinshan et al., 1993; Reilly, 2003; Ridder et al., 1994; Yiannakos & Armatas, 2006).
Previous research has reported the same pattern in the 1990 World Cup (Jinshan et al.,
1993), the 1991-1992 Dutch professional league (Ridder et al., 1994), the 1991-1992
Scottish League season (Reilly, 2003), the Australian National Soccer League (ANSL) 1994-
1998 (Abt et al., 2002), the 1998 World Cup (Armatas et al., 2007; Grant et al., 1999a), the
2002 and 2006 World Cups (Armatas et al., 2007), the 2004 European Championship (Euro
2004) (Yiannakos & Armatas, 2006), the 2006 World Cup (Acar et al., 2009; Armatas &
Yiannakos, 2010) and the 2006-2007 Greek “SuperLeague” (Armatas et al., 2009),
indicating it’s prevalence worldwide at top international, major club and semi-professional
levels of the game. The present study adds to this evidence base by identifying its presence
in the EPL and DBL, neither of which had previously been investigated. A number of factors
relating to aspects of play which change over the course of a match such as physical and
mental condition and team tactics have been strongly linked as causative factors of this
relationship (Abt et al., 2002).
5.1.1.1 Physiological factors
From a physiological perspective, the development of fatigue over the course of a match and
the subsequent deterioration in physical performance in the latter stages has received much
support (Krustrup et al., 2006; Mohr et al., 2003; 2004; 2005). Time-motion analyses have
reported reductions in distance covered, bouts of sprinting and high-intensity running in the
second half of matches (Bangsbo et al., 1991; Bangsbo, 1994; Mohr et al., 2003) which are
particularly evident during the final 15 minutes (Mohr et al., 2003). Such reductions in
physical performance could affect GSF during matches, although the precise magnitude of
such an impact on GSF is unknown (Abt et al., 2002). The degree to which fatigue affects
individual players also differs depending on their playing position and role in the team. For
example, the demanding nature of modern football requires attackers and defenders to
perform more anaerobic activities than midfielders (Carling et al., 2005), whilst defenders
28
typically perform less high-intensity running and sprinting (Mohr et al., 2003). Despite
similarities in the activity profiles of defenders and attackers, Reilly (2003) reported that
defenders experience a greater deterioration in physical condition than other positions, which
coupled with the suggestion that shooting ability is unaffected by fatigue (Abt et al., 1998;
Zeederberg et al., 1996) affords attackers an advantage over defenders in the latter stages of
matches, increasing the likelihood of goals being scored. Although shooting ability may be
unaffected by fatigue (Abt et al., 1998; Zeederberg et al., 1996) it has been asserted that
other aspects of technical performance such as the number and success rate of short passes
are affected due to reduced cognitive function, muscular strength or endurance capacity
(Rampinini et al., 2009), which may cause an increasing number of defensive errors or
turnovers of possession presenting goal scoring opportunities.
Dehydration due to physical exertion can impair cognitive performance (Maughan & Leiper,
1994) and result in lapses in concentration and decision making, thus increasing the
likelihood of defensive errors increased GSF (Reilly, 2007). A study of the ANSL (Abt et al.,
2002) attributed increased GSF prior to half time and in the final 5 minutes of matches to
such lapses in concentration. The present study similarly reports that GSF during the period
prior to half time (31-45+ min) exhibited the second highest GSF of the six periods,
suggesting that perhaps the conclusion drawn by Abt et al. (2002) that players’ attention is
disrupted by the prospect of half-time may be applicable. However it is perhaps more likely
that these findings can be explained by the manner in which both studies were conducted,
with goals scored during time added on at the end of the half recorded as occurring in the
45th minute (45+) making it unsurprising that this minute should see a high GSF.
5.1.1.2 Tactical factors
From a tactical perspective, the style of play adopted by a team can affect the physiological
demands placed on its players and their subsequent work-rate. A slow tempo, possession
29
style, involving probing for opportunities to penetrate the defence requires players to be able
to perform high speed movements when such an attacking opportunity presents itself,
whereas a more direct style requires players to perform at a high tempo at all times both with
and without possession increasing the overall work-rate required (Carling et al., 2005; Reilly,
2003). A high tempo and increased urgency in the latter stages of matches has been
suggested to contribute to the trend for increased GSF in the final 15 minutes of matches
since it is during this period that losing teams become increasingly likely to commit players
forward in an attempt to score, making them more vulnerable to conceding themselves (Abt
et al., 2002; Carling et al., 2005; Reilly, 1997). It has also been reported that the greatest
amount of critical incidents requiring players to contest possession occur during the final 15
minutes (Carling et al., 2005) which may contribute to greater fatigue and increases in goal
scoring opportunities during this period.
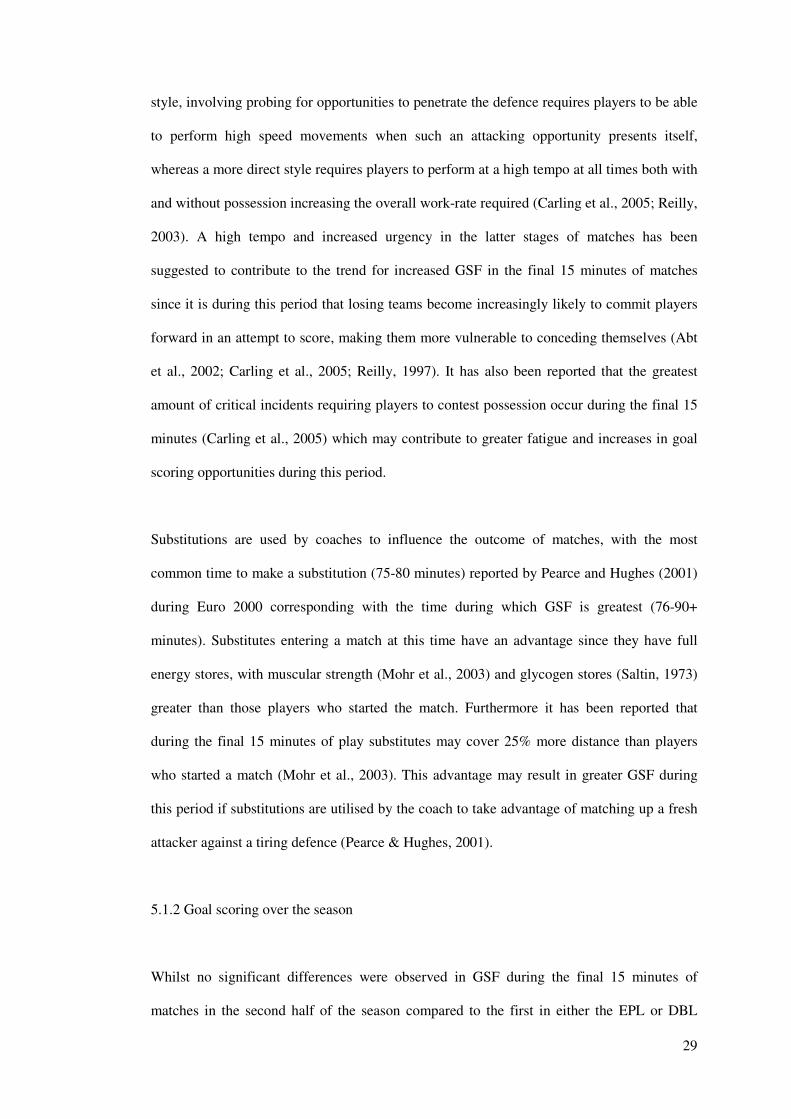
Substitutions are used by coaches to influence the outcome of matches, with the most
common time to make a substitution (75-80 minutes) reported by Pearce and Hughes (2001)
during Euro 2000 corresponding with the time during which GSF is greatest (76-90+
minutes). Substitutes entering a match at this time have an advantage since they have full
energy stores, with muscular strength (Mohr et al., 2003) and glycogen stores (Saltin, 1973)
greater than those players who started the match. Furthermore it has been reported that
during the final 15 minutes of play substitutes may cover 25% more distance than players
who started a match (Mohr et al., 2003). This advantage may result in greater GSF during
this period if substitutions are utilised by the coach to take advantage of matching up a fresh
attacker against a tiring defence (Pearce & Hughes, 2001).
5.1.2 Goal scoring over the season
Whilst no significant differences were observed in GSF during the final 15 minutes of
matches in the second half of the season compared to the first in either the EPL or DBL
30
(EPL: 26.5% v 20.7%, p = 0.227; DBL: 20.6% v 23.6%, p = 0.613), the present study adds
to existing knowledge since it is the first to investigate whether GSF differs at the start of a
season to the end of a season. Previous research has investigated goal scoring patterns
predominantly by reporting the results based on a season or competition as a whole (Abt et
al., 2002; Acar et al., 2009; Armatas et al., 2007; Armatas & Yiannakos, 2010; Armatas et al,
2009; Grant et al., 1999a; Jinshan et al., 1993; Reilly, 2003; Ridder et al., 1994; Yiannakos
& Armatas, 2006). Although no significant differences were found, a 5.8% increase in final
15 minute GSF in the EPL and a 3% decrease in the DBL were found when comparing the
second half of the season to the first, representing an 8.8% swing. A main effect for league
(p = 0.010) on GSF during the final 15 minutes of play during the second half of the season
was also reported (Figure 4) indicating this 8.8% swing should be of interest. These results
indicate that a rest factor as a result of a winter break may be at play in the DBL. Similar to
the goal scoring patterns present over the course of a single match, the reasons for the
difference in GSF between the two leagues over the course of the season may also be multi-
factorial.
5.1.2.1 Residual fatigue
From a physiological perspective, the demands of matches are exacerbated by league
schedules which require players to play consecutive matches with little recovery. If only one
match is scheduled for a week, players are typically required to train six times in five days
(Bangsbo et al., 2006); however when domestic and European cup and international matches
are considered, clearly additional demands are placed on players providing little opportunity
for recovery. In the case of the EPL, 50% of the matches scheduled between August and
December are played in November and December, including the Christmas period when up
to four matches may be scheduled over 7-8 days (Odetoyinbo et al., 2009). Such an intense
schedule has been shown to affect the performance of players, with total distance covered,
distance covered at high-intensity, number of sprints, distance covered by sprinting, the
31
amount of work performed both with and without the ball and an increase in recovery time
between activities reported (Prozone, 2009; Odetoyinbo et al., 2009). Furthermore, this
apparent residual fatigue has been linked to a reduction in first time passing success rate
(Prozone, 2009) indicating an impact on technical performance. Given the links between
fatigue and defensive errors and resultant increases in goal scoring opportunities it is
reasonable to suggest that the residual fatigue caused by playing consecutive matches with
insufficient recovery may lead to an increase in GSF in the final 15 minutes as the season
progresses. Whilst the demanding EPL schedule places demands on players which may
cause a residual fatigue negatively impacting subsequent performances, the potential for
players to pace their effort or “cruise” through matches during particularly intense fixture
periods must also be considered. Pacing of effort could for example explain the increased
amount of time spent jogging and decreased time performing high-intensity activity reported
by Prozone (2009) during such periods.
As the 2009-2010 DBL schedule incorporated a three and a half week winter break between
December 21st and January 14
th (Deutsche Welle, 2008); no fixtures were played at a time
when the EPL schedule included 24 matches (BBC Sport, 2010). The fact that players in the
DBL were able to rest whilst EPL players were continuing to play through a congested
fixture period, may have contributed to the 8.8% swing and main effect for league on GSF
observed in the current study and further suggests a rest factor which may have allowed DBL
players to recover somewhat from the first half of the season (Reilly, 2007). Although in the
case of the DBL players don’t necessarily rest for the duration of the winter break. Players
traditionally get the first week of the break off to rest, before returning to a mix of a winter
training camp, friendly matches and indoor tournaments (Knight, 2011; DFL – German
Football League, 2009). An increasing number of training camps undertaken by DBL teams
are in warm climates to allow the maximum amount of training time and in some cases are
specifically chosen to provide lucrative sponsorship and promotional opportunities (Knight,
2011). The inclusion of players in promotional activities, added to their requirements to train
32
and participate in scheduled friendly matches means that although they are not playing in
competitive matches players get less time to rest and prepare for the second half of the
season than they could (Knight, 2011).
Further evidence for the existence of residual fatigue and the effect of a winter break can be
found in injury incidence literature. A UEFA study (Ekstrand et al., 2004) reported injury
incidence was significantly higher during the second half of the season in leagues without a
winter break than those with one, especially in the final two months of the season (25.8 v 6.5
injuries per 1000 hours of exposure, p < 0.01), further suggesting the rest period afforded by
a break lessens the impact of residual fatigue.
5.1.2.2 Tactics
From a tactical perspective it is possible that the increased urgency suggested to occur at the
end of matches (Abt et al., 2002; Carling et al., 2005; Reilly, 1997) is even greater during the
closing stages of a season, when teams attempting to win a championship, qualify for
European competition or avoid relegation become more likely to adjust their tactics to enable
them to score and win matches. Similarly teams may approach particular matches towards
the end of a season simply seeking not to be beaten, and set themselves up to be defensively
strong, such as was observed during the first round of matches at the 2010 World Cup
resulting in few goals being scored (Gibson, 2010). The author is not aware of any studies
which have investigated such issues, which should be considered for future research.
5.2 Practical implications
A number of practical implications arise from the results of the present study. It has been
shown that an advantage can be gained if a team’s players are better able to perform for the
duration of a match with less fatigue than their opponents, particularly during the final 15
33
minutes of matches. Coaches can implement a number of strategies to achieve this including
training, nutritional, and tactical interventions.
5.2.1 Training
It is known that players with high levels of aerobic fitness are better able to sustain work-
rates, recover more quickly from high-intensity efforts (Reilly, 2007) and express their
technical skills to their fullest (Reilly & Doran, 2003), therefore appropriate, periodized
fitness training throughout a season should be implemented (Mohr et al., 2003) incorporating
elements of endurance, strength, speed, power, agility and flexibility (Barnes, 2007; Reilly,
2007). Whilst the physical preparation of players aims to maintain an optimal level of fitness
throughout a season there is evidence to suggest significant reductions in fitness occur
towards the end of a season due to the lack of opportunities for specific fitness training due
to the tactical preparations required for matches (Casajus, 2001; Clark, Edwards, Morton &
Butterly, 2008; Mohr, Krustrup & Bangsbo, 2002). Therefore time must be managed
effectively by ensuring tactical practices are conducted at intensities appropriate to stress the
appropriate energy systems to allow fitness levels to be maintained whilst also allowing
sufficient recovery between matches (Gamble, 2007).
5.2.2 Nutrition
Since the primary cause of fatigue and a reduction in work-rate is energy availability, and
pre-match glycogen stores have a protective effect against fatigue (Saltin, 1973), nutritional
preparation and a reduction in training volume and intensity in the days immediately
preceding a match to maintain glycogen stores, the consumption of sports drinks containing
glucose and a post-match nutritional strategy to promote recovery which are known to
improve players’ ability to last 90 minutes (Burke, 1997; Carling et al., 2005) are advisable.
There is a significant body of research suggesting a high carbohydrate meal eaten 3-4 hours
34
before a match will elevate carbohydrate stores and enable improved performance
(MacLaren, 2003), whilst post-match the immediate considerations should be to replenish
fluid and carbohydrate losses in the first two hours post-exercise since glycogen-synthesizing
enzymes are most active at this time (Ivy, 2004; MacLaren, 2003).
5.2.3 Squad rotation
Substitutions can be utilised by a coach in order to replace fatigued players, with the
advantage being that the player being introduced will have full muscle glycogen stores and
be better able to sustain a work-rate than both the player being withdrawn and the players
who have been on the pitch from the kick-off (Carling et al., 2005). Therefore if a fresh
attacking player is brought on this player will have an advantage over the defence and
increase the possibility of a goal being scored, although it is also possible that the opposition
may bring on a fresh defender to preserve a lead, although this has been shown to potentially
disrupt a cohesive defence (Pearce & Hughes, 2001). Coaches may also consider a policy of
squad rotation to minimise the impact residual fatigue may have on player performance
throughout a season (Abt et al., 2002) and to ensure players are in peak condition for the
most important games.
5.3 Study limitations
The present study was limited by a lack of statistical power when testing for significant
differences in GSF between the leagues, since percentage values had to be used rather than
actual GSF. Converting actual GSF to percentages required standardising actual GSF to a
base value of 100 which may have concealed differences in absolute numbers therefore
limiting statistical power (Argyrous, 2005). However, using percentages was necessary when
comparing GSF between the two leagues to eliminate the effect of the difference in the
number of matches played in each league. Actual GSF was used for all other data analyses
35
within the leagues. Also since the present study used secondary sources for goal scoring
times it was not possible to ascertain exactly who collected the data, how it was collected or
how it was determined whether a goal was scored in one minute or another. This is a
limitation shared with many studies of goal scoring patterns.
5.4 Conclusion
In conclusion, the same pattern of goal scoring was reported in both the EPL and DBL with
most goals scored in the second half of matches and specifically during the final 15 minutes
of matches. Furthermore the inclusion of a winter break in the DBL resulted in a reduction in
GSF in the final 15 minutes of matches in the second half of the season which was part of an
8.8% swing between the EPL and DBL, suggesting the winter break affected GSF by
introducing a rest factor. These findings add to the body of knowledge reporting a
relationship between time and GSF, as well as suggesting that goal scoring patterns are
different at the beginning of a season compared to the end and that the inclusion of a winter
break affects GSF by introducing a rest factor.
The practical implications of this study centre primarily on the ability of players to perform
at their best for a full match throughout the season. Players who can minimise the effects of
fatigue during a match and residual fatigue throughout a season will gain an advantage over
their opponents. A number of strategies including training, nutritional and tactical
interventions can help minimise the effects of fatigue.
5.5 Future research recommendations
Research into goal scoring patterns is of continued importance due to the constantly evolving
nature of professional football and the implications for coaches and players. Future studies
should consider comparing leagues with an equal number of games as this will increase
36
statistical power. Similar studies could be carried out investigating additional performance
indicators such as player work-rate to see if changes in GSF are correlated with changes in
work-rate. Adding injury data to work-rate data would enable the development of a more
accurate measure of how a league schedule affects these variables which would have
implications for national team preparation and performance at summer tournaments.
37
Chapter 6
References
Abt, G.A., Dickson, G., & Mummery, W.K. (2002). Goal scoring patterns over the course of
a match: An analysis of the Australian National Soccer League. In W. Spinks, T.
Reilly & A. Murphy (Eds.), Science and Football IV (pp. 106-111). London, UK:
Routledge.
Abt, G.A., Zhou, S., & Weatherby, R. (1998). The effect of high carbohydrate diet on the
skill performance of midfield soccer players after intermittent treadmill exercise.
Journal of Science and Medicine in Sport, 1, 203-212.
Acar, M.F., Yapicioglu, B., Arikan, N., Yalcin, S., Ates, N., & Ergun, M. (2009). Analysis
of goals scored in the 2006 World Cup. In T. Reilly & F. Korkusuz (Eds.), Science
and Football VI (pp. 235-242). London, UK: Routledge.
Argyrous, G. (2005). Statistics for research: with a guide to SPSS (2nd
ed.). London, UK:
Sage Publications.
Armatas, V., & Yiannakos, A. (2010). Analysis and evaluation of goals scored in 2006
World Cup. Journal of Sport and Health Research, 2, 119-128.
Armatas, V., Yiannakos, A., Papadopoulou, S., & Skoufas, D. (2009). Evaluation of goals
scored in top ranking soccer matches: Greek “SuperLeague” 2006-07. Serbian
Journal of Sports Sciences, 3, 39-43.
Armatas, V., Yiannakos, A., & Sileloglou, P. (2007). Relationship between time and goal
scoring in soccer games: analysis of three World Cups. International Journal of
Performance Analysis in Sport, 7, 48-58.
Baker, L.B., Conroy, D.E., & Kenney, W.L. (2007). Dehydration impairs vigilance-related
attention in male basketball players. Medicine and Science in Sports and Exercise,
39, 976-983.
38
Bangsbo, J. (1994). The physiology of soccer – with special reference to intense intermittent
exercise. Acta Physiologica Scandinavica, 151, S1-155.
Bangsbo, J. & Krustrup, P. (2009). Physical demands and training of top-class soccer
players. In T. Reilly & F. Korkusuz (Eds.), Science and Football VI (pp. 318-330).
London, UK: Routledge.
Bangsbo, J., Mohr, M., & Krustrup, P. (2006). Physical and metabolic demands of training
and match-play in the elite football player. Journal of Sports Sciences, 24, 665-674.
Bangsbo, J., Norregaard, L., & Thorsoe, F. (1991). Activity profile of competition soccer.
Canadian Journal of Sports Sciences, 16, 110-116.
Barnes, C. (2007). Soccer. In E.M. Winter, A.M. Jones, R.C.R. Davison, P.D. Bromley &
T.H. Mercer (Eds.), Sport and Exercise Physiology Testing Guidelines (pp. 241-
248). London, UK: Routledge.
Bate, R. (1988). Football chance: tactics and strategy. In T. Reilly, A. Lees, K. Davids &
W.J. Murphy (Eds.) Science and Football (pp. 293-301). London, UK: E. & F.N.
Spon.
BBC Sport. (2010). Football: Premier league results. BBC Sport. Retrieved June 6, 2010,
from
http://news.bbc.co.uk/sport1/hi/football/eng_prem/results/default.stm
Burke, L.M. (1997). Fluid balance during team sports. Journal of Sports Sciences, 15, 287-
295.
Carling, C., Williams, A.M., & Reilly, T. (2005). Handbook of soccer match analysis: A
systematic approach to improving performance. London, UK: Routledge.
Casajus, J.A. (2001). Seasonal variations in fitness variables in professional soccer players.
Journal of Sports Medicine and Physical Fitness, 41, 463-469.
Clark, N.A., Edwards, A.M., Morton, R.H., & Butterly, R.J. (2008). Season-to-season
variations of physiological fitness within a squad of professional male soccer
players. Journal of Sports Science and Medicine, 7, 157-165.
39
Clark, P. (2010). Intermittent high intensity activity in English Premier League soccer.
International Journal of Performance Analysis of Sport, 10, 139-151.
Deutsche Welle. (2008). Germany to reduce Bundesliga winter break next season. Deutsche
Welle. Retrieved January 27, 2011, from
http://www.dw-world.de/dw/article/0,,3851880,00.html
DFL – German Football League. (2009). Bundesliga winter schedule. Bundesliga – The
official website. Retrieved January 6, 2011, from
http://www.bundesliga.de/en/liga/news/2009/index.php?f=143544.php
Di Salvo, V., Baron, R., Tschan, H., Calderon Montero, F.J., Bachl, N., Pigozzi, F. (2007).
Performance characteristics according to playing position in elite soccer.
International Journal of Sports Medicine, 28, 222-227.
Ekblom, B. (1986). Applied physiology of soccer. Sports Medicine, 3, 50-60.
Ekstrand, J., Lewin, G., Hägglund, M, & Walden, M. (2004). Injury risk increases without a
winter break. Medicine Matters, 6-7.
Franks, I.M., & Miller, G. (1986). Eyewitness testimony in sport. Journal of Sport Behavior,
9, 39-45.
Gamble, P.A. (2007). Challenges and game-related solutions to metabolic conditioning for
team sports athletes. Strength and Conditioning Journal, 29, 60-65.
Gibson, O. (2010). World Cup 2010: Negative tactics and caution are causing a goal
drought. Guardian.co.uk. Retrieved March 11, 2011, from
http://www.guardian.co.uk/football/2010/jun/16/negative-tactics-goals-world-cup
Grant, A.G., Williams, A.M., & Reilly, T. (1999a). Analysis of goals scored in the 1998
World Cup. Journal of Sport Sciences, 17, 826-827.
Grant, A.G., Williams, A.M., & Reilly, T. (1999b). An analysis of the successful and
unsuccessful teams in the 1998 World Cup. Journal of Sport Sciences, 17, 827.
Hook.C, & Hughes, M.D. (2001). Patterns of play leading to shots in ‘Euro 2000’. In M.D.
Hughes & I.M. Franks (Eds.), PASS.COM (pp. 295-301). Cardiff, UK: UWIC.
40
Hughes, M., Cooper, S.M., & Nevill, A. (2002). Analysis procedures for non-parametric data
from performance analysis. International Journal of Performance Analysis in Sport,
2, 6-20.
Hughes, M., & Franks, I.M. (2004). Notational analysis – a review of the literature. In M.
Hughes & I.M. Franks (Eds.), Notational Analysis of Sport: Systems for better
coaching and performance in sport (pp. 59-106). London, UK: Routledge.
Hughes, M., & Franks, I.M. (2005). Analysis of passing sequences, shots and goals in
soccer. Journal of Sports Sciences, 23, 509-514.
Ivy, J.L. (2004). Regulation of muscle glycogen repletion, muscle protein synthesis and
repair following exercise. Journal of Sports Science and Medicine, 3, 131-138.
James, N. (2006). Notational analysis in soccer: past, present and future. International
Journal of Performance Analysis in Sport, 6, 67-81.
Jinshan, X., Xiaoke, C., Yamanaka, K., & Matsumoto, M. (1993). Analysis of the goals in
the 14th World Cup. In T. Reilly, J. Clarys & A. Stibbe (Eds.), Science and Football
II (pp. 203-205). London, UK: E. & F.N. Spon.
Knight, B. (2011). Bundesliga teams train in the sunny Middle East. Deutsche Welle.
Retrieved January 27, 2011, from
http://www.dw-world.de/dw/article/0,,14742700,00.html
Krustrup, P., Mohr, M., Steensburg, A., Bencke, J., Kjaer, M., & Bangsbo, J. (2006). Muscle
and blood metabolites during a soccer games: implications for sprint performance.
Medicine and Science in Sports and Exercise, 38, 1165-1174.
Laird, P., & Waters, L. (2008). Eyewitness recollection of sport coaches. International
Journal of Performance Analysis in Sport, 8, 76-84.
Little, T., & Williams, A.G. (2007). Effects of sprint duration and exercise: rest ratio on
repeated sprint performance and physiological responses in professional soccer
players. Journal of Strength and Conditioning Research, 21, 646-648.
MacLaren, D. (2003). Nutrition. In T. Reilly & A.M. Williams (Eds.), Science and Soccer
(2nd
ed.) (pp. 73-95). London, UK: E. & F.N. Spon.
41
Maughan, R.J., & Leiper, J.B. (1994). Fluid replacement requirements in soccer. Journal of
Sports Sciences, 12, S29-S34.
Mohr, M., Krustrup, P., & Bangsbo, J. (2005). Fatigue in soccer: a brief review. Journal of
Sports Sciences, 23, 593-599.
Mohr, M., Krustrup, P., & Bangsbo, J. (2003). Match performance of high-standard soccer
players with special reference to development of fatigue. Journal of Sports Sciences,
21, 439-449.
Mohr, M., Krustrup, P., & Bangsbo, J. (2002). Physiological characteristics and exhaustive
exercise performance of elite soccer players during a season. Medicine and Science
in Sports and Exercise, 34, S24.
Mohr, M., Krustrup, P., Nybo, L., Nielsen, J.J., & Bangsbo, J. (2004). Muscle temperature
and sprint performance during soccer matches – beneficial effects of re-warm-up at
half time. Scandinavian Journal of Medicine and Science in Sports, 14, 156-162.
Morris, D. (1981). The soccer tribe. London, UK: Cape.
Odetoyinbo, K., Wooster, B., & Lane, A. (2009). The effect of a succession of matches on
the activity profiles of professional soccer players. In T. Reilly & F. Korkusuz
(Eds.), Science and Football VI (pp. 105-110). London, UK: Routledge.
O’Donoghue, P. (2010). Research methods for sports performance analysis. Abingdon, UK:
Routledge.
O’Donoghue, P. (2007). Reliability issues in performance analysis. International Journal of
Performance Analysis of Sport, 7, 35-48.
O’Donoghue, P., Boyd, M., Lawlor, J., & Bleakley, E.W. (2001). Time-motion analysis of
elite, semi-professional and amateur soccer competition. Journal of Human
Movement Studies, 11, 49-52.
Pearce, M., & Hughes, M. (2001). Substitutions in Euro 2000. In M.D. Hughes & I.M.
Franks (Eds.), PASS.COM (pp. 303-315). Cardiff, UK: UWIC.
42
Prozone. (2011). Brighton and Hove Albion choose Prozone Performance Analysis.
Prozone. Retrieved January 29, 2011, from http://www.prozonesports.com/news-
article-brighton-hove-albion-choose-prozone-performance-analysis.html
Prozone. (2010). World Cup 2010 analysis. Prozone. Retrieved December 27, 2010, from
http://www.prozonesports.com/news-article-world-cup-2010-analysis.html
Prozone. (2009). An objective insight into whether English football should introduce a
winter break... Delivering Performance Insights, Prozone Sports Ltd.
Rahnama, N., Lees, A., & Reilly, T. (2006). Electromyography of selected lower-limb
muscles fatigued by exercise at the intensity of soccer match-play. Journal of
Electromyography and Kinesiology, 16, 257-263.
Rahnama, N., Reilly, T., Lees, A., & Graham-Smith, P. (2003). Muscle fatigue induced by
exercise simulating the work-rate of competitive soccer. Journal of Sports Sciences,
21, 933-942.
Rampinini, E., Impellizzeri, F.M., Castagna, C., Coutts, A.J., & Wisløff, U. (2009).
Technical performance during soccer matches of the Italian Serie A league: Effect of
fatigue and competition level. Journal of Science and Medicine in Sport, 12, 227-
233.
Reep, C., & Benjamin, B. (1968). Skill and chance in association football. Journal of the
Royal Statistical Society, 134, 581-585.
Reilly, T. (2007). The science of training – soccer: a scientific approach to developing
strength, speed and endurance. London, UK: Routledge.
Reilly, T. (2003). Motion analysis and physiological demands. In T. Reilly & A.M. Williams
(Eds.), Science and Soccer (2nd
ed.) (pp. 59-72). London, UK: E. & F.N. Spon.
Reilly, T. (1997). Energetics of high intensity exercise (soccer) with particular reference to
fatigue. Journal of Sports Sciences, 15, 257-263.
Reilly, T., & Doran, D. (2003). Fitness assessment. In T. Reilly & A.M. Williams (Eds.),
Science and Soccer (pp. 21-46). London, UK: Routledge.
43
Ridder, G., Cramer, J.S., & Hopstaken, P. (1994). Down to ten: estimating the effect of a red
card in soccer. Journal of the American Statistical Association, 89, 1124-1127.
Rienzi, E., Drust, B., Reilly, T., Carter, J.E.L., & Martin, A. (2000). Investigation of
anthropometric and work-rate profiles of elite South American international players.
Journal of Sports Medicine and Physical Fitness, 40, 162-169.
Saltin, B. (1973). Metabolic fundamentals in exercise. Medicine and Science in Sports and
Exercise, 5, 137-146.
Sporis, G., Jukic, I., Ostojic, S.M., & Milanovic, D. (2009). Fitness profiling in soccer:
Physical and physiologic characteristics of elite players. Journal of Strength and
Conditioning Research, 23, 1947-1953.
Stolen, T., Chamari, K., Castagna, C., & Wisløff, U. (2005). Physiology of soccer: an
update. Sports Medicine, 35, 501-536.
Stolz, S. (2009). The 1980s: Record transfers and new record champions. Bundesliga – The
official website. Retrieved January 28, 2011, from
http://www.bundesliga.de/en/liga/news/2008/index.php?f=127773.php
Stone, N.M., & Kilding, A.E. (2009). Aerobic conditioning for team sport athletes. Sports
Medicine, 39, 615-642.
Strudwick, T., & Reilly, T. (2001). Work rate profiles of elite Premier league football
players. Insight: the FA Coaches Association Journal, 4, 28-29.
UEFA. (2011). 2010/11 access list. UEFA.com. Retrieved March 10, 2011, from
http://www.uefa.com/uefachampionsleague/accesslist/index.html
Yiannakos, A, & Armatas, V. (2006). Evaluation of the goal scoring patterns in European
Championship in Portugal 2004. International Journal of Performance Analysis in
Sport, 6, 178-188.
Zeederberg, C., Leach, L., Lambert, V., Noakes, D., Dennis, C., & Hawley, A. (1996). The
effect of carbohydrate ingestion on the motor skill proficiency of soccer players.
International Journal of Sport Nutrition, 6, 348-355.
44
Chapter 7
Appendices
Appendix 1: Dissertation tutorial record sheets