Embed Size (px)
Citation preview
F E A T U R E
By P. Michael Kosro, John A. Barth and P. Ted Strub
T H E OCEAN CIRcuLATIoN over the Oregon shelf during spring and summer is dominated by the ef- fects of coastal upwelling. Equatorward winds drive an offshore Ekman transport in the surface layer, which produces divergent flow at the coast and the upwelling of deeper, colder, nutrient-en- hanced waters (Huyer, 1990). At the surface, the boundary between the upwelled and oceanic wa- ters is often a front, and the upwelling-induced horizontal density gradients support an equator- ward coastal jet (Mooers et al., 1976). The annual onset of persistent upwelling conditions often oc- curs abruptly in an event called the spring transi- tion (Huyer, et al., 1979; Strub, et al., 1987), which is characterized by a persistent drop in coastal sea level and a tendency to persistence of equatorward wind forcing (punctuated by occa- sional wind reversals). Although fluctuations in the alongshore current have been shown to be coher- ent over large alongshore scales (Huyer et al. , 1975), the local spatial variations in the currents are not well known, mainly due to our past inabil- ity to map the current field at high resolution in both space and time.
Radar and Conventional Measurements The Ocean Surface Current Radar (OSCR),
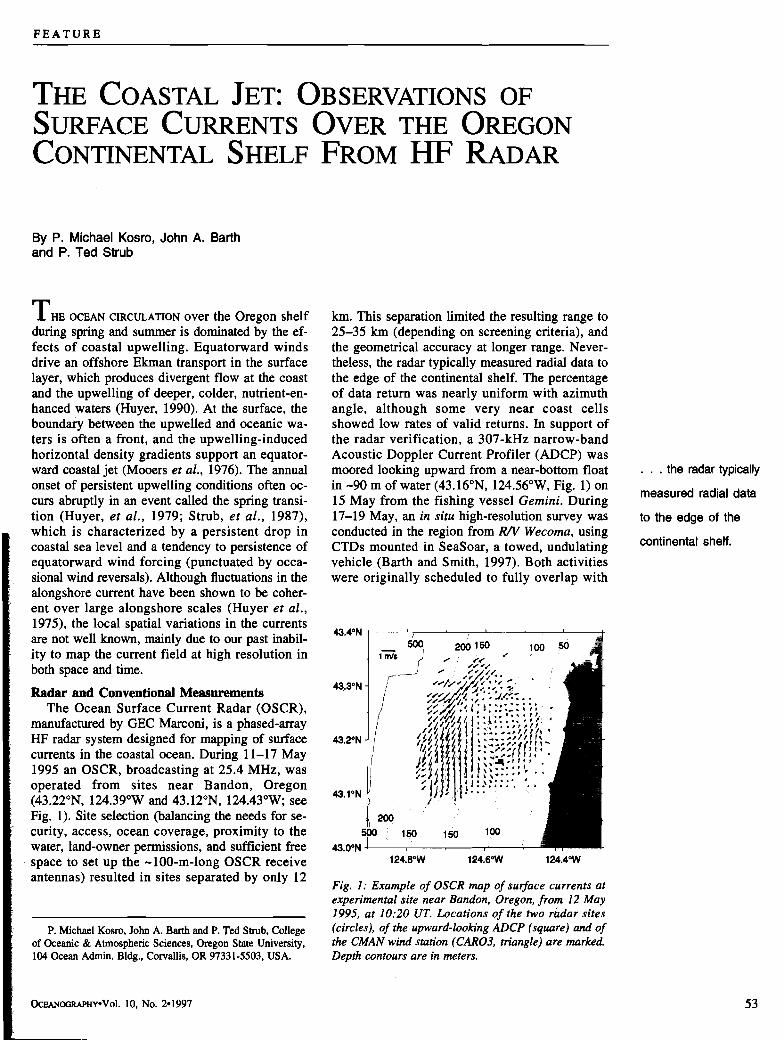
manufactured by GEC Marconi, is a phased-array HF radar system designed for mapping of surface currents in the coastal ocean. During 11-17 May 1995 an OSCR, broadcasting at 25.4 MHz, was operated from sites near Bandon, Oregon (43.22"N, 124.3g0W and 43.12"N, 124.43OW; see Fig. 1). Site selection (balancing the needs for se- curity, access, ocean coverage, proximity to the water, land-owner permissions, and sufficient free
km. This separation limited the resulting range to 25-35 km (depending on screening criteria), and the geometrical accuracy at longer range. Never- theless, the radar typically measured radial data to the edge of the continental shelf. The percentage of data return was nearly uniform with azimuth angle, although some very near coast cells showed low rates of valid returns. In support of the radar verification, a 307-kHz narrow-band Acoustic Doppler Current Profiler (ADCP) was moored looking upward from a near-bottom float . . . the radar typically in -90 m of wGer(43.160~, 124.56OW. Fig. 1) on measured radial 15 May from the fishing vessel Gemini. During 17-19 May, an in situ high-resolution survey was to the edge of the conducted in the region from WV Wecoma, using CTDs mounted in SeaSoar, a towed, undulating she'f.
vehicle (Barth and Smith, 1997). Both activities were originally scheduled to fully overlap with
space to set up the -100-m-long OSCR receive 1 2 4 . 8 0 ~ 1 2 4 . 6 ~ ~ 124 .40~
antennas) resulted in sites separated by only 12 Fig. 1: Example of OSCR map of surface currents at experimental site near Bandon, Oregon, from 12 May 1995, at 10:20 UT. Locations of the two rhdar sites
P. Michael Kosro, John A. Barth and P. Ted Strub, College (circles), of the upward-looking ADCP (square) and of of Oceanic & Atmospheric Sciences, Oregon State University, the CMAN wind station (CARO3, triangle) are marked. 104 Ocean Adrnin. Bldg., Cowallis, OR 97331-5503, USA. Depth contours are in meters.
radar surface
currents near the
mooring position
were dominated by
oscillations of the
semidiurnal tide . . .
16 of O(0.4 mls) in each component and with the ve- g 10
P " locity vector rotating clockwise with time.
On 13 May, the winds turned upwelling favor- !: i-10
able. The ocean response was like a spring transi-
-16 tion-within half a day, the alongshore radar cur- rents at the mooring site, initially weak in the
0.5
J mean, began to accelerate linearly with time to the - % O
south, eventually achieving speeds of O(0.7 m s-I), consistent with the spin-up of the equatorward
3 coastal jet.
Fig. 2: (A) Hourly winds at Cape Arago C-MAN sta- tion (CAR03, Fig. 1 ) during 11-18 May 1995. ( B ) Eastward current measured by the ADCP at 7-m sub- surface depth (darkest black line), I1 m, 14 m, and 18 m (lighter black lines), and by radar at the surface in cells nearest to the ADCP (red line) and at four adja- cent cells (blue lines). (C) Same for northward current.
the radar deployment, but last-minute delays in the ship's schedule shortened overlap consider- ably.
Observations Near the Mooring Winds were variable but generally downwelling
favorable at the start of the radar deployment, dur- ing 11 and 12 May (Fig. 2). During this period, the time series of radar surface currents near the mooring position (Fig. 2) were dominated by os- cillations of the semidiurnal tide, with amplitude
During their brief overlap (Fig. 2), the highest correlations between the OSCR and the ADCP were found for ADCP velocities at 7 m (the shal- lowest uncontaminated measurements) and radar velocities at cells close to, but not exactly at, the one expected to lie over the mooring, probably due to uncertainties in the radar geometry caused by variations in the antennas and in propagation characteristics. Radial ADCP and radar currents showed correlations of 0.84 and 0.78, and root- mean-square (rms) differences of 12.6 and 16.2 cm s-I, respectively, for radial currents directed to- ward sites 1 and 2. Some of the differences can be explained by extending the vertical shear in the shallowest ADCP measurements to the surface (e.g., period around 0000 UT on 17 May); how- ever, at other times, the ADCP does not observe a shear below 7-m depth, which is sufficient to ex- plain the difference in the two measurements (e.g., 0600 UT on 16 May).
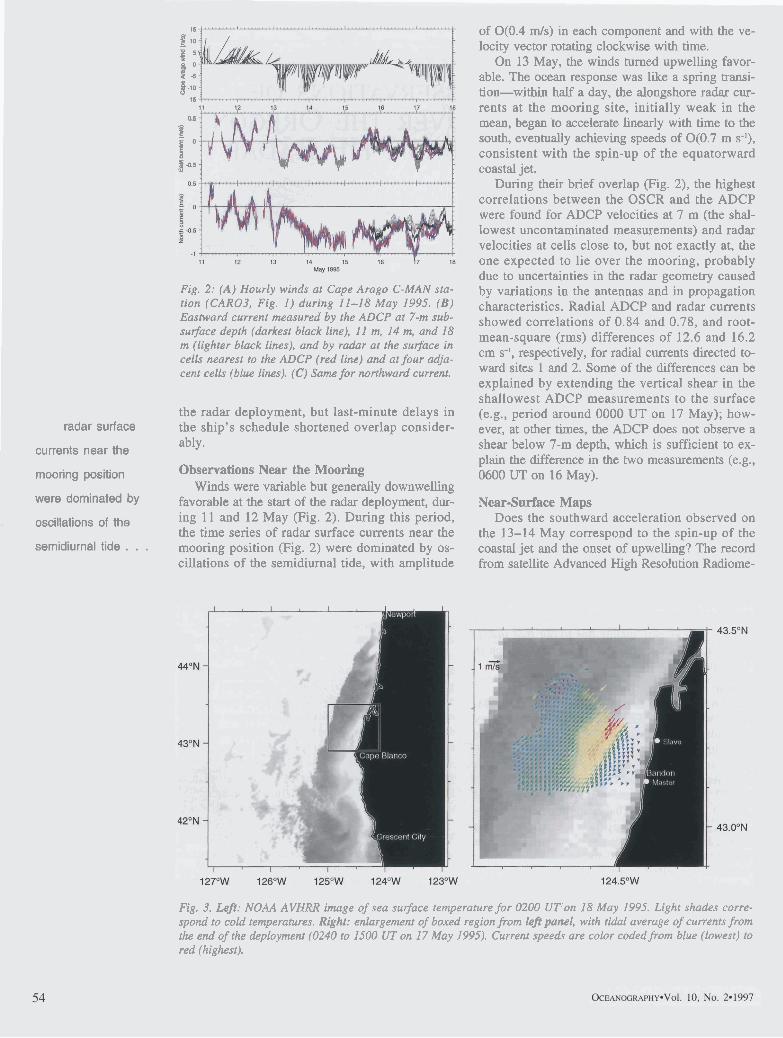
Near-Surface Maps Does the southward acceleration observed on
the 13-14 May correspond to the spin-up of the coastal jet and the onset of upwelling? The record from satellite Advanced High Resolution Radiome-
Fig. 3. LtB: NOAA AVHRR image of sea surface temperature for 0200 UT'on 18 May 1995. Light shades corre- spond to cold temperatures. Right: enlargement of boxed region from lejl panel, with tidal average of currents from the end of the deployment (0240 to 1500 UT on 17 May 1995). Current speeds are color codedfrom blue (lowest) to red (highest).
ter (AVHRR) images of sea surface temperature is very intermittent due to clouds, but the first clear image following the southward acceleration (Fig. 3) is also the first image of spring 1995 to clearly show a band of cold water along the coast. More- over, when the surface current field from the radar is overlaid on the satellite AVHRR image of sea surface temperature (Fig. 3), the identification of the strong radar currents with the coastal jet is clear. At this time, the core of the jet is directed along 210°T, paralleling the front of cold, coastally upwelled water seen in the satellite image and the local isobaths north of 43.2"N. The core speed of the jet decreases markedly over the sampling re- gion, entering at 0.9 m s-I in the northeast, centered just inshore of the 100-m isobath, and slowing to 0.6 m s-' as it exits the region 20 krn to the south- west and offshore of the 100-m isobath. The cross- shore width of the jet, if defined by the region moving at least 0.5 m s-I, is -12 km, narrowing slightly along the course of the jet.
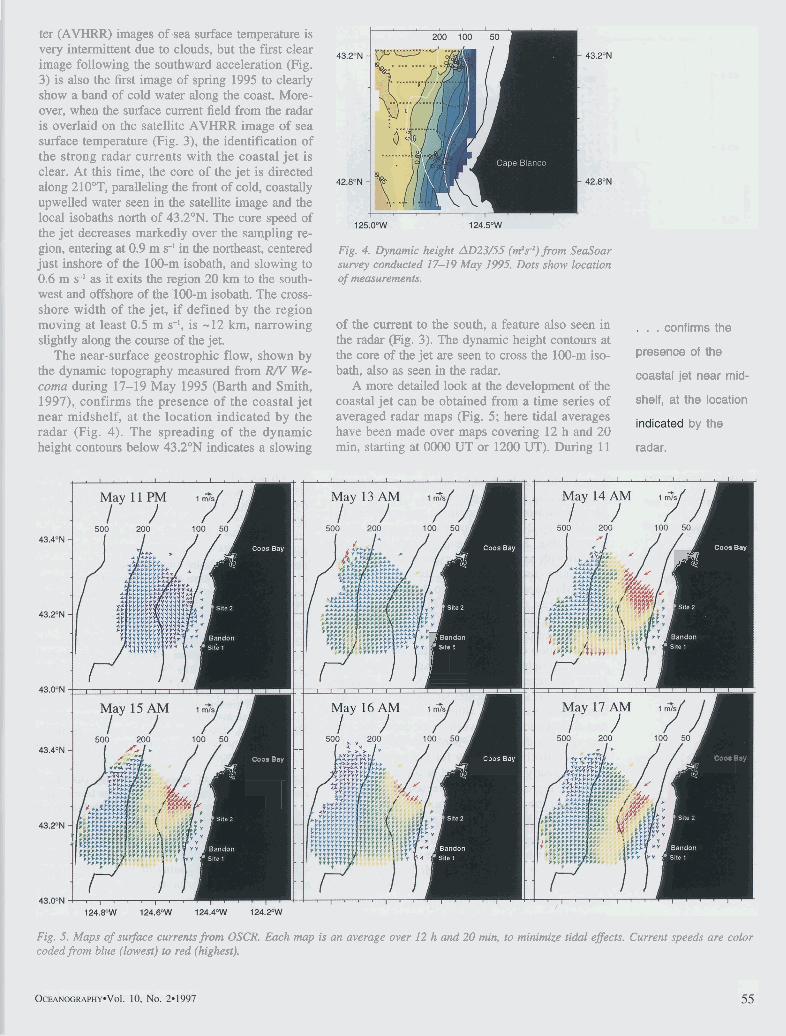
The near-surface geostrophic flow, shown by the dynamic topography measured from WV We- coma during 17-19 May 1995 (Barth and Smith, 1997), confirms the presence of the coastal jet near midshelf, at the location indicated by the radar (Fig. 4). The spreading of the dynamic height contours below 43.2"N indicates a slowing
coos Bay
UT
Fig. 4. Dynamic height AD23/55 (mZs2) from SeaSoar survey conducted 17-19 May 1995. Dots show location of measurements.
of the current to the south, a feature also seen in . . confirms the the radar (Fig. 3). The dynamic height contours at the core of the jet are seen to cross the 100-m iso- Presence of the
bath, also as seen in the radar. coastal jet near mid- A more detailed look at the development of the
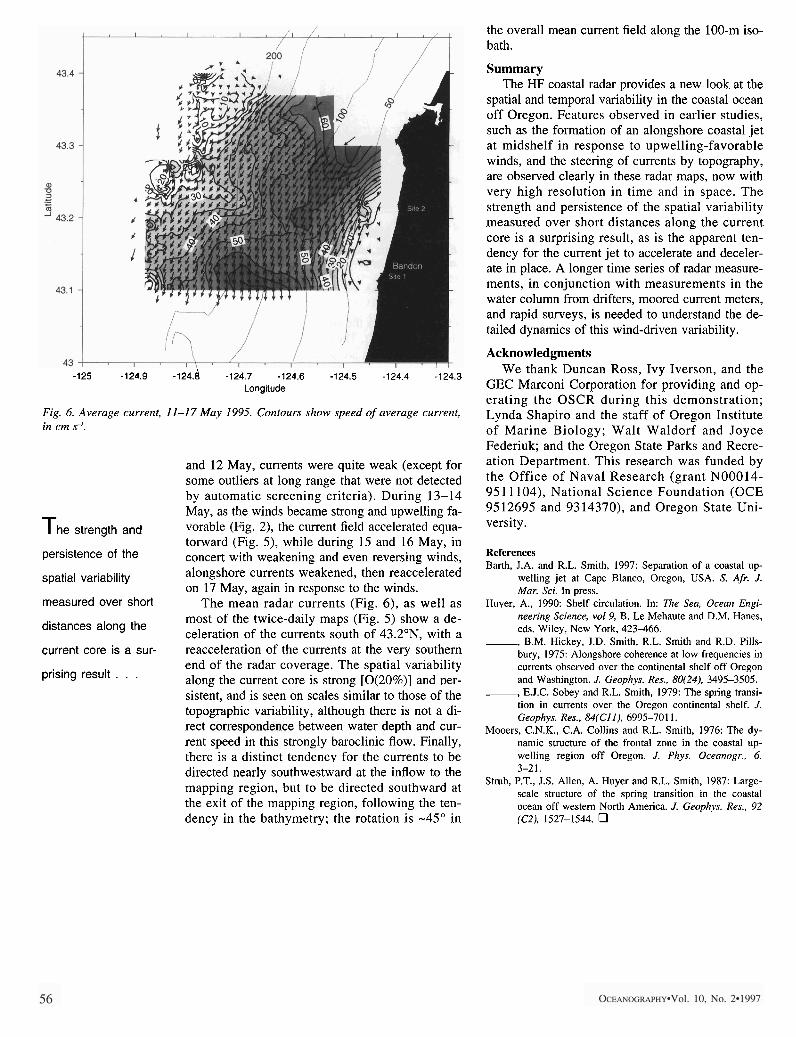
coastal jet can be obtained from a time series of shelf, at the location averaged radar maps (Fig. 5; here tidal averages by the have been made over maps covering 12 h and 20 min, starting at 0000 UT or 1200 UT). During 11 radar.
/Bandon
F site 1
Coos Bay
coos Bay pm
r Coos Bay
k'
Fig. 5. Maps of surface currents from OSCR. Each map is an average over 12 h and 20 min, to minimize tidal effects. Current speeds are color coded from blue (lowest) to red (highest).
-125 -124.9 -124.6 -124.7 -124.6 -124.5 -124.4 -124.3 Longitude
Fig. 6. Average current, 11-17 May 199.5. Contours show speed of average current, in cm s'.
and 12 May, currents were quite weak (except for some outliers at long range that were not detected by automatic screening criteria). During 13-14 May, as the winds became strong and upwelling fa-
T h e strength and vorable (Fig. 2), the current field accelerated equa- torward (Fig. 5), while during 15 and 16 May, in
persistence of the concert with weakening and even reversing winds,
spatial variability alongshore currents weakened, then reaccelerated on 17 May, again in response to the winds.
measured over short The mean radar currents (Fig. 6). as well as
the overall mean current field along the 100-m iso- bath.
Summary The HF coastal radar provides a new look at the
spatial and temporal variability in the coastal ocean off Oregon. Features observed in earlier studies, such as the formation of an alongshore coastal jet at midshelf in response to upwelling-favorable winds, and the steering of currents by topography, are observed clearly in these radar maps, now with very high resolution in time and in space. The strength and persistence of the spatial variability measured over short distances along the current core is a surprising result, as is the apparent ten- dency for the current jet to accelerate and deceler- ate in place. A longer time series of radar measure- ments, in conjunction with measurements in the water column from drifters, moored current meters, and rapid surveys, is needed to understand the de- tailed dynamics of this wind-driven variability.
Acknowledgments We thank Duncan Ross, Ivy Iverson, and the
GEC Marconi Corporation for providing and op- erating the OSCR during this demonstration; Lynda Shapiro and the staff of Oregon Institute of Marine Biology; Walt Waldorf and Joyce Federiuk; and the Oregon State Parks and Recre- ation Department. This research was funded by the Office of Naval Research (grant N00014- 951 1104), National Science Foundation (OCE 9512695 and 9314370), and Oregon State Uni- versity.
References Barth, J.A. and R.L. Smith, 1997: Separation of a coastal up-
welling jet at Cape Blanco, Oregon, USA. S. Afr. J. Mar. Sci. In press.
Huyer, A,, 1990: Shelf circulation. In: The Sea, Ocean Engi- . - ,. most of the twice-daily maps (Fig. 5 ) show a de- neering Science, "019, B. Le Mehaute and D.M. ~ a n e s ,
distances along the celeration of the currents south of 43.2"N, with a eds. Wiley, New York, 423466.
, B.M. Hickey, J.D. Smith, R.L. Smith and R.D. Pills- current core is a sur- reacceleration of the currents at the very southern bury, 1975: Alongshore coherence at low frequencies in
end of the radar coverage. The spatial variability currents observed over the continental shelf off Oregon prising result . . . along the current core is strong [0(20%)1 and ver- and Washington. J. Geophys. Res., 80(24). 3495-3505. - - - . , -
sistent, and is seen on scales similar to those of the - E.J.C. Sobey and R.L. Smith, 1979: The spring transi-
topographic variability, although there is not a di- tion in currents over the Oregon continental shelf. J. Geophys. Res., 84(CII), 6995-701 1.
rect between water and cur- Mooers, C.N.K., C.A. Collins and R.L. Smith, 1976: The dy- rent speed in this strongly baroclinic flow. Finally, namic structure of the frontal zone in the coastal up- there is a distinct tendency for the currents to be welling region off Oregon. J. Phys. Oceanogr., 6, directed nearly southwestward at the inflow to the 3-21.
Strub, P.T., J.S. Allen, A. Huyer and R.L. Smith, 1987: Large- mapping region, but to be directed southward at scale structure of the spring transition in the coastal the exit of the mapping region, following the ten- ocean off western North America. J. Geouhvs. Res., 92 . . dency in the bathymetry; the rotation is -45" in (C2), 1527-1544. 0


![Barth 1998 [1969]](https://img.pdfslide.net/doc/110x75/54781c575806b51a198b47ac/barth-1998-1969.jpg)