Embed Size (px)
Citation preview
Univers
ity of
Cap
e Tow
nThe partitioning and mobility of metals in the Blesbokspruit
Michael Starke
B.Sc (Hons) (Geology)
Submitted in partial fulfilment of the requirements of the degree of
MASTER OF SCIENCE
Department of Geological Sciences
Faculty of Science
University of Cape Town
January 2004
The copyright of this thesis vests in the author. No quotation from it or information derived from it is to be published without full acknowledgement of the source. The thesis is to be used for private study or non-commercial research purposes only.
Published by the University of Cape Town (UCT) in terms of the non-exclusive license granted to UCT by the author.
Univers
ity of
Cap
e Tow
n

ACKNOWLEDGEMENTS
This study would not have been possible without the invaluable contributions
of a number of people and organisations. I would like to extend my sincere
thanks to:
Dr. Alakendra Roychoudhury for supervising this study and for being there to
provide guidance and support at every opportunity.
Dr. John Compton for providing input during weekly project meetings.
Meris Smith for answering a never-ending barrage of questions
The National Research Foundation and the Postgraduate Funding Office for
funding.
Henk Coetzee, Mari Rademeyer and Gabriel Ntsume from the Council of
Geoscience for their advice, access to laboratory facilities and help in the field.
Geoff Bailey and Heather Sessions from the Department of Environmental
Affairs and Tourism's Marine and Coastal Management for their help with
organic carbon analysis.
R6isin De Burca for her willing assistance in the field, even when it rained!
Rochelle Wigely for her help with printing.
Staff in the Department of Geological Sciences for their support during the
year, especially:
Dr. Andreas Spath and Farooza Rawoort for their assistance with ICP-MS;
Patrick Sieas for his assistance with IC;
Ernest Stout for his help with sample preparation and

Ivan Wilson for his willingness to help with anything.
Also, to my classmates for ensuring a good time no matter how tough it got!
And finally, I would like to thank my friends and family for their support and
encouragement throughout the year.

ABSTRACT
The Blesbokspruit is situated south-east of Johannesburg on South Africa's
East Rand, famous for its prolific gold and uranium deposits. With the onset
of mining in the region around 1930, the Blesbokspruit was altered from a
non-perennial to a perennial stream and a wetland due to the construction of
roads and embankments as well as the discharge of mine effluent. Various
studies have highlighted the detrimental impact South African gold mines and
their slimes dams have on the environment especially the release of metals
into aquatic ecosystems. Unable to degrade naturally, metal pollution
accumulates within aquatic ecosystems with the potential to move up the
biologic chain.
Water and sediment samples were taken from throughout the Blesbokspruit in
an attempt to characterise the aqueous and sediment geochemistry of the
stream. Filtered and acidified water samples were analysed for major cations
and anions using Atomic Absorption Spectrophotometry and Ion
Chromatography respectively. The waters were found to have elevated levels
of Cl-, S042-, Na+ and Ca2+. These elevated salt concentrations are derived from
the discharge of saline effluent into the Blesbokspruit by the Grootvlei
Proprietary Mines Ltd and are responsible for the increase in electrical
conductivity downstream of the mine. The generally mildly alkaline nature of
the Blesbokspruit is the result of the underlying dolomites of the
Chuniespoort Group.
ICP-MS was used to quantify aqueous and sediment metal emichment relative
to natural concentrations reported in the literature. The results of the ICP-MS
indicate aqueous and sediment emichment in chalcophile metals derived from
the oxidation of sulphide minerals. U is also emiched within the water and is
derived from the ore minerals mined from the underlying Witwatersrand
Supergroup. However, total metal concentrations are not indicative of
bioavailable metal concentrations. For this reason it is important to determine
how metals are partitioned within the sediment.
A sequen tial extraction was performed on sediment samples from the
Blesbokspruit as a method of determining metal partitioning and mobility
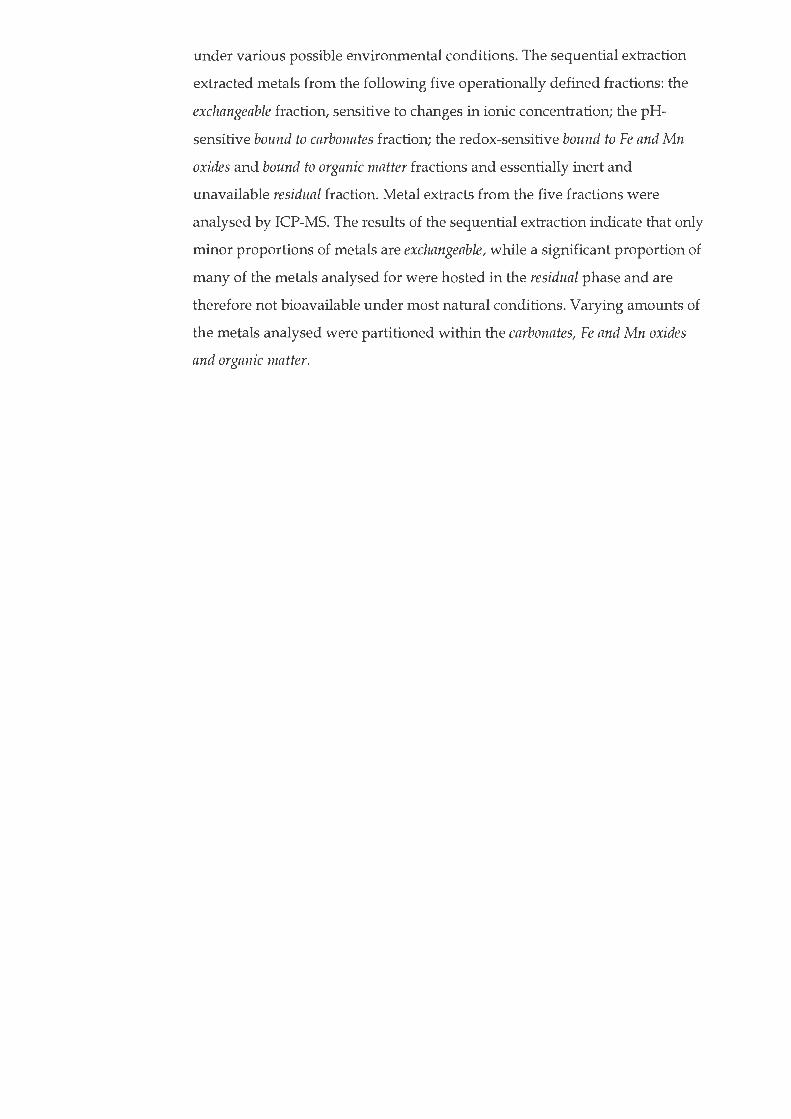
under various possible environmental conditions. The sequential extraction
extracted metals from the following five operationally defined fractions: the
exchangeable fraction, sensitive to changes in ionic concentration; the pH
sensitive bound to carbonates fraction; the redox-sensitive bound to Fe and Mn
oxides and bound to organic matter fractions and essentially inert and
unavailable residual fraction. Metal extracts from the five fractions were
analysed by ICP-MS. The results of the sequential extraction indicate that only
minor proportions of metals are exchangeable, while a significant proportion of
many of the metals analysed for were hosted in the residual phase and are
therefore not bioavailable under most natural conditions. Varying amounts of
the metals analysed were partitioned within the carbonates, Fe and Mn oxides
and organic matter.
CONTENTS
1 INTRODUCTION 1
1.1 MOTIVATION 1 1.2 OBJECTIVES 2 1.3 STUDY AREA 2 1.3.1 Site Description 2 1.3.2 Climate 5 1.3.3 Geology and Geohydrology 6
1.4 SOURCES OF METAL POLLUTION IN THE BLESBOKSPRUIT 6
1.5 METAL CYCLING IN AQUATIC ENVIRONMENTS 7 1.5.1 Precipitation 7 1.5.2 Cation Exchange and Adsorption 9 1.5.3 Clay Minerals 9
1.5.4 Carbonates 10 1.5.5 Fe and Mn Oxyhydroxides and Fe-Sulphides 10 1.5.6 Organic Matter 11 1.5.7 Detrital Minerals 12
2 METHODS 13
2.1 WATER SAMPLING AND ANALYSIS 13 2.1.1 Field Measurements 13 2.1.2 Alkalinity 13 2.1.3 Ions 14 2.1.4 Metals 14 2.2 SEDIMENT SAMPLING AND ANALYSIS 15 2.2.1 Metals 15 2.2.2 Sequential Extraction 15 2.2.3 Particle Size Distribution 17 2.2.4 Organic Carbon 17
3 RESULTS 19
3.1 AQUEOUS GEOCHEMISTRY 19 3.1.1 Field Measurements 19 3.1.2 Ions 20 3.1.3 Analytical appraisal 22 3.1.4 Metals 23 3.2 SEDIMENT GEOCHEMISTRY 25 3.2.1 Metals 25 3.2.2 Sequential Extraction 27 3.2.3 Particle Size Distribution 31 3.2.4 Organic Carbon 31
4 DISCUSSION 33
4.1 AQUEOUS GEOCHEMISTRY 33
4.1.1 Field Measurements 33
4.1.2 Alkalinity 34
4.1.3 Ions 35
4.1.4 Metals 38
4.2 SEDIMENT GEOCHEMISTRY 42
4.2.1 Metals 42
4.2.2 Metal Partitioning and Mobility 45
5 CONCLUSIONS so
6 REFERENCES 52
7 APPENDIX 60
1
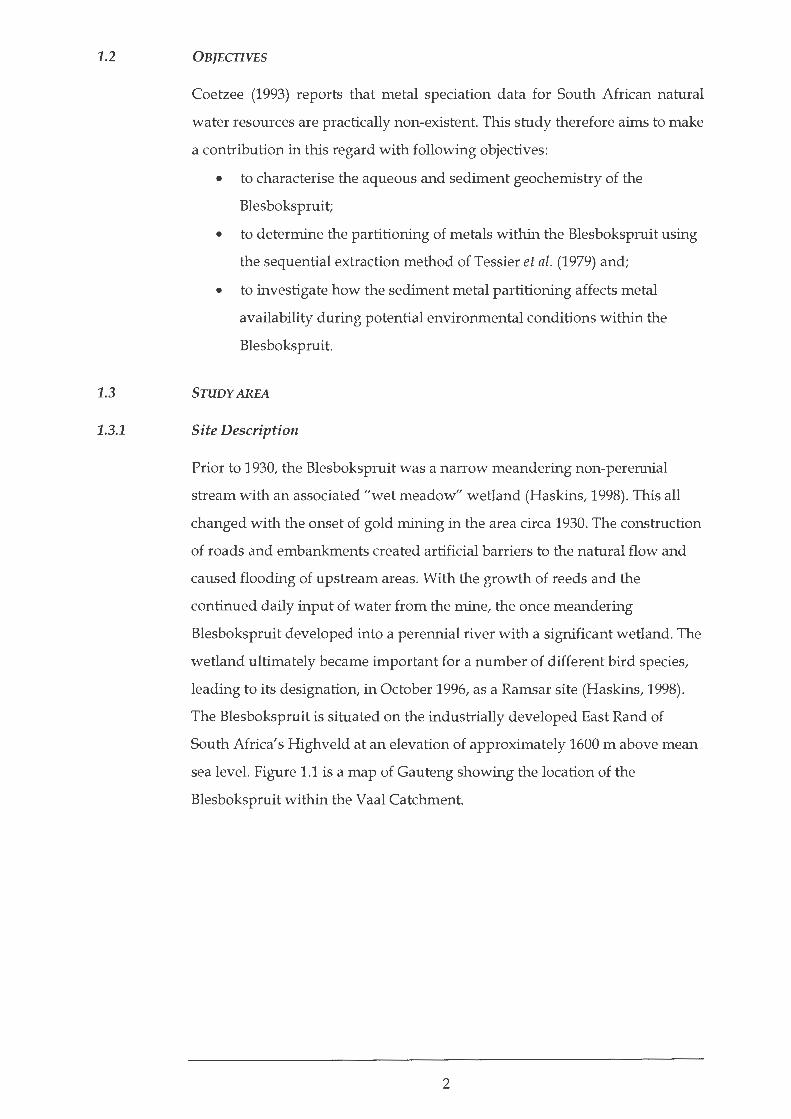
1.1
INTRODUCTION
MOTIVATION
Metal pollution of aquatic systems is important for two main reasons. Firstly,
metals are not usually eliminated from aquatic ecosystems by natural
processes, in contrast to most organic pollutants. Secondly, most metal
pollutants are emiched in mineral and organic substances resulting in their
accumulation in bottom sediments (Forstner and Wittman, 1981). Various
processes of remobilisation may release metals from the sediment allowing
them to move up the biologic chain to ultimately reach humans, producing
both chronic and acute ailments (Forstner and Wittman, 1981).
Forstner and Wittman (1976) found metal emichment in sediment effluent
from a number of Witwatersrand gold mines which they ascribed to the
presence of ore minerals, containing Cr, Zn, Pb, Co or processing additives
containing Hg, Zn, Pb. Wade et al. (2000) reported accumulations of U in the
Mooi River on the West Rand also as a result of mining in the area. Waste
produced, both currently and historically, by gold mines surrounding the
Blesbokspruit includes solid processed residues disposed on tailings dumps as
well as water pumped from flooded underground workings and discharged
into the Blesbokspruit. Both of these waste types are potential sources of
metals, suggesting accumulation of metals within the Blesbokspruit.
The total concentration of metals in sediments does, however, not accurately
determine the potential effects of sediment contamination, as not all forms of a
given metal have equal impacts on the environment (Tessier et al ., 1979). For
this reason, a sequential extraction was performed on the sediment of the
Blesbokspruit. Sequential extractions provide details on the origin, mode of
occurrence, biological and physiochemical availability, mobilisation and
transport of metals (Tessier et al., 1979). However, sequential extractions do
have limitations (Kheboian and Bauer, 1987). These include the inability of the
extraction to simulate natural processes, the effects of sample pre-treatment
and preservation as well as the selectivity and specificity of the reagents used
(Martinet al., 1987; Rapin et al., 1986).
1
1.2
1.3
1.3.1
O BJECTIVES
Coetzee (1993) reports that metal speciation data for South African natural
water resources are practically non-existent. This study therefore aims to make
a contribution in this regard with following objectives:
• to characterise the aqueous and sediment geochemistry of the
Blesbokspruit;
• to determine the partitioning of metals within the Blesbokspruit using
the sequential extraction method of Tessier et al. (1979) and;
• to investigate how the sediment metal partitioning affects metal
availability during potential environmental conditions within the
Blesbokspruit.
STUDY AREA
Site Description
Prior to 1930, the Blesbokspruit was a narrow meandering non-perennial
stream with an associated "wet meadow" wetland (Haskins, 1998). This all
changed with the onset of gold mining in the area circa 1930. The construction
of roads and embankments created artificial barriers to the natural flow and
caused flooding of upstream areas. With the growth of reeds and the
continued daily input of water from the mine, the once meandering
Blesbokspruit developed into a perennial river with a significant wetland. The
wetland ultimately became important for a number of different bird species,
leading to its designation, in October 1996, as a Ramsar site (Haskins, 1998).
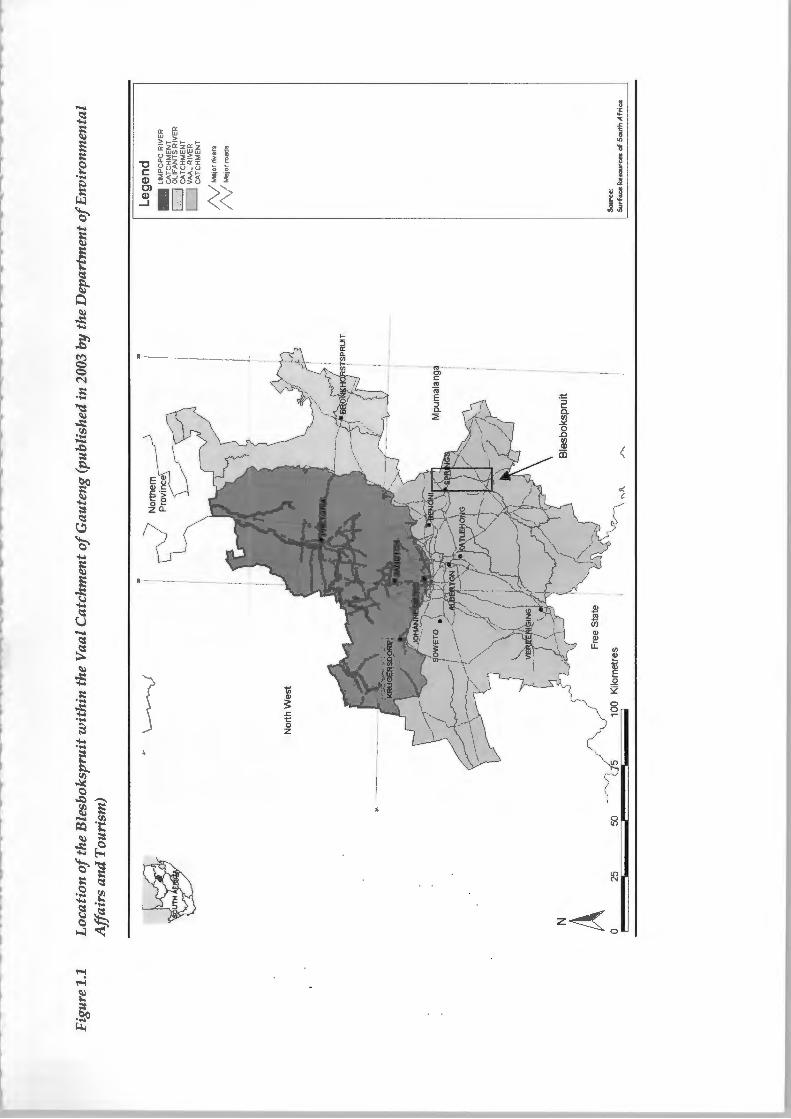
The Blesbokspruit is situated on the industrially developed East Rand of
South Africa's High veld at an elevation of approximately 1600 m above mean
sea level. Figure 1.1 is a map of Gauteng showing the location of the
Blesbokspruit within the Vaal Catchment.
2
~-__
_..
-~
"""'
-~ ~
-'---
--~ ---~
-...
..--
--..
...
....._
..
_.
--..
,...
__
__
----
----
.....,
-_
-...
....
----
--
-.·-
....
. ~--~--------------
----
----
----
--
--
"'?"
....
-----..
..
·-"'!""'~~
.... ~~ ---
__
_,_
.
--------..
....
--..
..-----
--.
....
-
Fig
ure
1.1
Lo
cati
on
of t
he B
lesb
oks
pru
it w
ith
in t
he
Vaa
l C
atc
hm
ent o
f Gau
teng
(pu
blis
hed
in 2
003
by
the
Dep
art
men
t of E
nvi
ron
men
tal
Aff
air
s a
nd
Tou
rism
)
~
~
No
rth
We
st
N A
Fre
e S
tate
0 25
50
1
00
K
ilom
etr
es
"~
/'-.
Lege
nd
LIM
PO
PO
RIV
ER
C
AT
CH
ME
NT
r--1
OL
IFA
NT
S R
IVE
R
L_
_j
CA
TC
HM
EN
T
r--1
VA
AL
RIV
ER
L
__
j C
AT
CH
ME
NT
NM
ajor
rive
rs
/\/ M
aJor
roa
ds
Sourc~
:
Su
rfac
e R~
sour
ces
af
Sou
th A
fric
a.

The Blesbokspruit has its headwaters in Koppiesfontein to the north and flows
for approximately 40 km in a southerly direction through the Vaal catchment.
The Blesbokspruit has a number of tributaries including a partly canalised
furrow flowing westwards through the Alexander and Cowles Dams. The
Blesbokspruit is shallow due to the region's flat topography resulting in the
development of a wetland covering an area of approximately 1858 hectares. A
dense Typha and Phragmites reed habitat predominates the wetland (Haskins,
1998). Grootvlei Proprietary Mines Ltd pumps between 80 000 and 100 000 m3
of underground mine water daily into the Blesbokspruit (Schoeman and
Steyn, 2001). Water flow is therefore maintained throughout the year with any
variation expressed as a lateral shift in the water body rather than a change in
depth because of the area's flat topography (Haskins, 1998). Figure 1.2 shows
a schematic map of the Blesbokspruit and surrounding area.
The surrounding land usage includes suburban settlements, informal
settlements, agriculture, industry as well as gold mining and associated rock
dumps an d slimes dams. Approximately 45 % of the 60 km2 Blesbokspruit
catchment is urbanised with mining, industry and agriculture making up the
rest (Haskins, 1998).
4

Figure 1.2
1.3.2
Schematic layout of the Blesbokspruit and surrounding areas after the 1:250 000 4th Edition map of the East Rand (2628) published in 1996.
~ 01\VEYTON
BRAKPAN
-, ......._ K\1\ATI-EMA
' /
N
-$- 1:125 000
LEGEND • Openwater
[!5] Mine dump
• Marsh and Vlei
- - Non-perennial river
- Perennial river
® Liming point
Climate
u ElVIAlVIA ~ Sewage v.or1<s ~
M03
/ /
/
/
/ /
/
EA ST DAGGAFONTEIN GOLD MINES u••[)
' '
Air temperature varies from a minimum of -1o·c in winter to a maximum of
3s·c in summer (Haskins, 1998). The average annual rainfall, recorded over 31
years, is 670 mm (Haskins, 1998). More than 80% of this annual rainfall occurs
between October and March (Tyson, 1988). The winter months of April to
September are dominated by anticyclonic atmospheric circulation causing a
subsidence of air. The effect of this subsidence is, amongst others, to suppress
precipitation (Tyson, 1988).
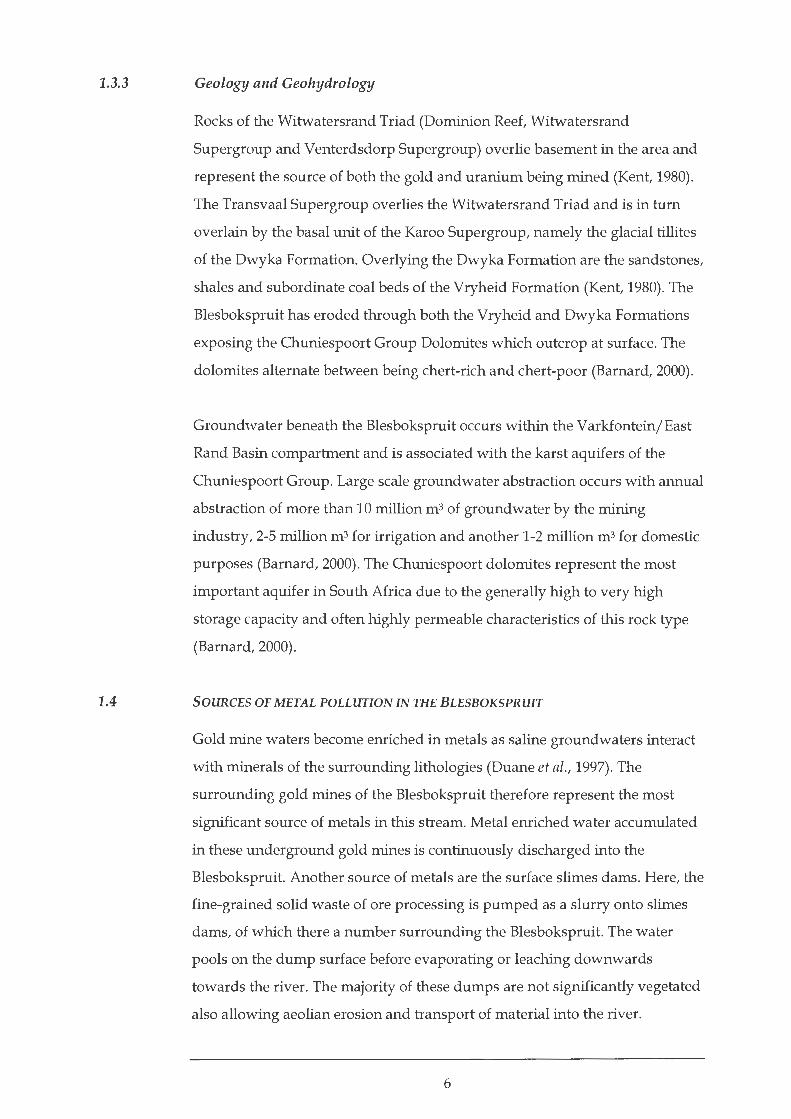
1.3.3
1.4
Geology and Geohydrology
Rocks of the Witwatersrand Triad (Dominion Reef, Witwatersrand
Supergroup and Venterdsdorp Supergroup) overlie basement in the area and
represent the source of both the gold and uranium being mined (Kent, 1980).
The Transvaal Supergroup overlies the Witwatersrand Triad and is in turn
overlain by the basal unit of the Karoo Supergroup, namely the glacial tillites
of the Dwyka Formation. Overlying the Dwyka Formation are the sandstones,
shales and subordinate coal beds of the Vryheid Formation (Kent, 1980). The
Blesbokspruit has eroded through both the Vryheid and Dwyka Formations
exposing the Chuniespoort Group Dolomites which outcrop at surface. The
dolomites alternate between being chert-rich and chert-poor (Barnard, 2000).
Groundwater beneath the Blesbokspruit occurs within the Varkfontein/East
Rand Basin compartment and is associated with the karst aquifers of the
Chuniespoort Group. Large scale groundwater abstraction occurs with annual
abstraction of more than 10 million m3 of groundwater by the mining
industry, 2-5 million m3 for irrigation and another 1-2 million m3 for domestic
purposes (Barnard, 2000). The Chuniespoort dolomites represent the most
important aquifer in South Africa due to the generally high to very high
storage capacity and often highly permeable characteristics of this rock type
(Barnard, 2000) .
SOURCES OF METAL POLLUTION IN THE BLESBOKSPRlUT
Gold mine waters become enriched in metals as saline groundwaters interact
with minerals of the surrounding lithologies (Duane et al., 1997). The
surrounding gold mines of the Blesbokspruit therefore represent the most
significant source of metals in this stream. Metal enriched water accumulated
in these underground gold mines is continuously discharged into the
Blesbokspruit. Another source of metals are the surface slimes dams. Here, the
fine-grained solid waste of ore processing is pumped as a slurry onto slimes
dams, of which there a number surrounding the Blesbokspruit. The water
pools on the dump surface before evaporating or leaching downwards
towards the river. The majority of these dumps are not significantly vegetated
also allowing aeolian erosion and transport of material into the river.
6

1.5
1.5.1
METAL CYCLING IN AQUATIC ENVIRONMENTS
Metal concentrations in natural waters are often much lower than expected on
the basis of equilibrium solubility calculations or supply from various sources
(Drever, 1997). The reason for this is that the majority of dissolved metals
transported by natural water systems are, under normal physiochemical
conditions, rapidly adsorbed onto, or co-precipitated with, particulate
material (Forstner, 1981b). Adsorption occurs when a dissolved ion or
molecule becomes attached to the surface of a pre-existing solid substrate. Co
precipitation occurs when a dissolved species is incorporated as a minor
component in a solid phase as that phase itself is precipitated (Drever, 1997).
Metals immobilised in bottom sediments do not necessarily remain there, but
may be released following chemical changes in the aquatic environment
(Forstner, 1981b). Gibbs' (1973) proposed mechanisms of metal transport in
rivers are:
• in solution or adsorbed on solids, where they are readily available;
• with metallic hydroxides where chemical changes are required before
they are released;
• with organic materials where chemical changes are required before
they are released and;
• in detrital crystalline material where they are nearly unavailable.
Precipitation
If the solubility product of a particular substance is exceeded it will precipitate
until the numeric product of its aqueous ion concentrations no longer exceeds
the solubility product. The concentration of a metal ion in the initial stages of
precipitation is a function of the type and activity of the anionic species in
solution and the pH. The chlorides and sulphates of most metals are readily
soluble, while the hydroxides, sulphides and carbonates dissolve with
difficulty and are therefore of greater interest in terms of immobilisation
(Forstner, 1981b).
The precipitation of metal hydroxides results in various forms which behave
differently in terms of the effects of coprecipitation and/ or dissolution.
Strongly oversaturated solutions produce amorphous or very fine crystalline
7
precipitates with disordered lattices. Such precipitates may persist in
metastable equilibrium with the solution, while slowly converting into more
stable forms. Slightly oversaturated solutions produce stable solid phases with
ordered crystals (Stumm and Morgan, 1996). The minimum solubility for
metal hydroxides lies within the pH range of 9 to 12, with an increase in
solubility as pH is lowered. In neutral solutions the solubilities are increased
by several orders of magnitude, while at pH 4, complete dissolution is largely
achieved (Forstner, 1981b).
Within the Me2+-H20-C02 system, in contact with the earth's atmosphere,
carbonates are frequently more stable as solid phases than oxides or
hydroxides. In natural water systems, the concentration of some metal ions is
therefore controlled by the solubility of their carbonates (Stumm and Morgan,
1996). Carbonate solubility in aqueous solutions is highly dependent on the
partial pressure of C02. With increasing aqueous C02 concentrations,
carbonate solubility increases releasing metal ions into solution according to
the reaction, where M is the metal cation (Forstner, 1981b):
M(II)C03(sJ + H20 + C02 ~ M2+(aq) + 2HC03-(aq)
The aqueous HC03- concentration is therefore important in determining the
stability of metal carbonates. Any increase in HC03- shifts the above reaction
to the left favouring metal carbonates, while a decrease in HC03-
concentration favours the release of metal ions into solution. More metal
carbonates will therefore dissolve under open system conditions in which C02
is replenished from the atmosphere (Drever, 1997).
To determine the cycling and fate of metals in the environment it is important
to have an understanding of their association with sedimentary sulphides.
However, there are fundamental questions concerning the extent of
interaction between sulphides and metals. According to Huerta-Diaz (1998),
little is known about how metals are associated with sulphides, are they
coprecipitated/ adsorbed on Fe sulphides or precipitated as discrete metal
sulphides? Furthermore, the generally low concentrations of Fe sulphides in
sediments, their susceptibility to rapid oxidation and the difficulties involved
with their separation from bulk sediment inhibit understanding (Huerta-Diaz,
1998).
8
1.5.2
1.5.3
The type of precipitation product, hydroxide, carbonate or sulphide, can be
determined from stability associations in an Eh-pH diagram. In the presence
of free oxygen, M2+ is stable at pH values of less than approximately 7 to 8.
With increasing pH, first the carbonate and then the hydroxide becomes the
stable phase. For negative redox potentials, the sulphide remains the stable
phase over a wide pH range (Forstner, 1981b). Figure 4.6 depicts the stability
fields of the main minerals controlling metal solubility in relation to pH and
Eh.
Cation Exchange and Adsorption
All fine-grained materials with large surface areas are capable of adsorbing
metal ions at the solid-liquid interface as a result of intermolecular forces .
Exchange processes at the particle surface involve the release of H+ ions or
other cations and the adsorption or surface complexation of metal ions
(Forstner, 1981b). The surface complexation model accounts for all the metal
adsorption competing processes; including the effect of pH on adsorption and
surface charge (Bourg, 1995):
M + Surf-H+ ~ Surf-M + H+
As pH decreases metals become more mobile, except for Mo which is more
mobile under alkaline conditions. A state of equilibrium exists between the
number of cations accumulated by an adsorptive substance and their
concentration. If the metal content of the solution is increased, the quantity of
adsorbed cations increases. Desorption occurs if the solution concentration is
lowered, since a new equilibrium must be attained. The rate at which cation
exchange takes place depends on the exchange capacity of the material as well
as the cation species and their concentrations (Forstner, 1981b). Metal
mobilisation can also occur if there is an increase in the occurrence of natural
or synthetic complexing agents that can form soluble metal complexes.
Increased dissolved salt concentrations result in more competition for sorption
sites on solid surfaces, also promoting the release of metals (Forstner, 1981b).
Clay Minerals
The concentration of H+ ions may dominate metal adsorption onto clay
minerals. H+ ions compete with metal cations for exchange sites in the system,
releasing metal cations with complete release under extreme acidic conditions.
The exchange capacity of clay minerals increases markedly in the order
9
1.5.4
kaolinite<chlorite<illite<montmorillonite. This increase corresponds as a
result of the reduction of particle size and related increase in surface area. The
selective affinity of clay minerals for certain metals is not fully understood,
however, the following sequence has been established (Forstner, 1981b):
Pb> Ni>Cu> Zn
Carbonates
The surface energy of carbonates is sufficient to effect metal adsorption with at
least the same intensity as kaolinite. Co-precipitation with carbonate minerals
at higher pHs is a potentially important mechanism of metal immobilisation
(Forstner, 1981b). The mixing of different water bodies can initiate CaC03
precipitation. If an alkaline water body comes into contact with and mixes in
neutral river water with normal concentrations of Ca2+ and HC03 , pH will
increase. The solubility product of CaC03 is reduced, causing it to precipitate
in the mixing zone and thus removing metals from solution (Forstner, 1981b).
1.5.5 Fe and Mn Oxyhydroxides and Fe-Sulphides
Fe and Mn oxyhydroxides commonly occur as mineral coatings and finely
dispersed particles and with high specific surface areas and are significant
metal sinks in aquatic systems (Forstner, 1981b). In oxidising environments
with neutral to alkaline pH, amorphous and crystalline Fe and Mn solids are
strong adsorbents or co-precipitating matrices (Bourg, 1995). As a result,
minor concentrations of Fe(OH)3 and Mn02 are able to control metal
distribution in aquatic systems (Forstner, 1981b). When the environment is
only slightly reducing or slightly oxidising with neutral to acidic pH, the
surface reactive Fe and Mn oxyhydroxides are solubilised as Fe3+ and Mn4+ are
reduced releasing any co-precipitated metals into solution (Bourg, 1995).
Accumulations of Fe and Mn oxyhydroxides can therefore also act as major
sources of dissolved metals in natural waters especially in the presence of high
levels of dissolved organic matter (Forstner, 1981b).
The adsorptive sites of Fe and Mn oxyhydroxides are valence-unsatisfied OH
or H20 ligands bound to Fe3+, Mn3+ or Mn4+. A metal, M, may bind to iron
oxides according to the following reaction which tends towards irreversibility
(McBride, 1994):
10
1.5.6
Metal sorption onto Fe and Mn oxyhydroxides is characterised by a high
degree of specificity shown by particular minerals for particular metals
(McBride, 1994).
There are only limited data on the significance of metal co-precipitation with
iron sulphides. Since most metals generally occur in substantially lower
concentrations compared to ferrous iron in interstitial and other anoxic waters,
these metals may be expected to co-precipitate with iron sulphides rather than
as discrete sulphide crystals (Forstner, 1981b). Forstner (1981b) concluded that
co-precipitation of metals with iron sulphides is less effective in concentrating
metals than their incorporation into hydrous iron oxides.
Organic Matter
The presence of organic matter and its decomposition products influences the
behaviour of metals in aquatic systems (Forstner, 1981b). Organic matter and
metals probably form chelate-type complexes (Drever, 1997). The attractive
forces between metal ions and soluble, colloidal or particulate organic
material range from weak, leaving the ions easily replaceable, to strong
making them undistinguishable from chemical bonds (Forstner, 1981b).
Organic matter with which natural waters come into contact ranges from
relatively small soluble molecules to insoluble polymeric material like coal
and wood (Drever, 1997). Singer (1977, in Forstner, 1981b) reported that
dissolved organic substances are capable of influencing metals by:
• complexing metals thereby increasing their solubility;
• changing the distribution between oxidised and reduced metal species;
• reducing metal availability to aquatic life;
• influencing the extent of metal adsorption onto suspended matter and;
• influencing the stability of metal-containing colloids.
Metals can also be removed from the system by adsorption onto solid organic
matter. However, very little is known about the details of this adsorption,
making quantitative predictions difficult (Drever, 1997). Saxby (1973)
11
suggested three possible processes leading to the incorporation of a particular
metal-organic species in sediment:
1. Reaction between a metal ion and an organic ligand in solution
leading to a species which can either precipitate directly or be
adsorbed on sedimentary material.
2. Incorporation into sediments of all or part of an organism
containing biological coordination compounds.
3. Adsorption on sediment of molecules resulting from the
solubilisation of minerals (sulphides, carbonates, etc.) by
natural waters containing organic ligands.
1.5.7 Detrital Minerals
Metals can occur as major, minor or trace components within the mineral
substances of natural rock debris. They frequently occur in inert lattice
positions and as a result are virtually unavailable to the environment
(Forstner, 1981b).
12
2
2.1
METHODS
WATER SAMPLING AND ANALYSIS
A total of twenty sites chosen for their geographic spread, were sampled from
the Blesbokspruit between the 5th and 13th of August 2003. Figure 1.2 presents
the locations of these sample sites (labelled MOl to M20). At each site, two
water samples were taken. Both were filtered through 45mm, 0.45p.m nylon
membrane filters using a hand-held vacuum pump. One of the samples was
acidified with 3M HN03 to a pH of approximately 2 to prevent metal
precipitation. The water samples were stored in plastic bottles pre-rinsed with
HN03 and de-ionised water. The bottles were sealed and stored at 4°C before
analysis.
2.1.1 Field Measurements
The pH, electrical conductivity (EC), dissolved oxygen (DO), redox potential
(Eh) and temperature were measured at each site. The pH was measured
using a Wiessenschaftlic-Technishe Werstatten (WTW) Sentix 41 pH-electrode.
The EC was measured using a WTW TetraCon® 325 sensor while dissolved
DO measurements were made with a WTW galvanic CellOx 325 sensor. The
respective probes were connected to a WTW Multi 340i Universal Pocket
Meter. The Eh of the water was measured using a SENTEK combination
platinum electrode.
2.1.2 Alkalinity
The spectrophotometric method of Sarazin et al. (1999) was used to determine
the total alkalinity of all the filtered but unacidified water samples. The
advantages of this method are its accuracy, rapidity and the small sample
volume required (Sarazin et al., 1999). This method uses a weak acid (10 mM
HCHOz) and a pH sensitive dye (50 mg/L Bromophenol-Blue) to neutralise all
basic species taken into account in the alkalinity expression. The product of
the neutralisation reaction is a coloured complex with an absorbance at 590
nm as a function of the original alkalinity of the sample. Using a Sequia
Turner Model340 Spectrophotometer, the alkalinity of all twenty samples was
determined by comparison with 1.0- 7.0 mM NaHC03 standard solutions.
13
The alkalinity of the water at 10 of the sites was also determined by the
potentiometric titration of Clesceri et al. (1998) to ascertain any error
associated with the method of Sarazin et al. (1999). Clesceri et al. (1998) define
the alkalinity of water as its acid-neutralising capacity equal to the sum of all
the titratable bases. In this procedure, the alkalinity was determined from the
volume of standard acid (0.02M HCl) required to titrate 100 mL of unfiltered
water sample to an end-point of pH 4.5.
2.1.3 Ions
The aqueous concentrations of the anions Cl-, SQ42-, N02-, N03-, PQ43-, and Br
in filtered, unacidified water were determined using a Dionex Ion
Chromatograph (IC). Prior to analysis samples were diluted to an EC of ~100
pS/ em and filtered through Dionex OnGuard® liP lee cartridges to remove
any remaining organic and particulate matter. A 4 mm High Performance Ion
Chromatography (HPIC)-AG14 guard column was used in conjunction with a
4 mm HPIC-AS14 separator column. The eluent flow rate was 1.2 mL/min
and suppression was achieved using an ASRS-I-4 mm suppressor. A mixed
eluent of 2.4 mM Na2C03 and 1 mM NaHC03 was used.
Aqueous cationic concentrations were determined by Atomic Absorption
Spectrophotometry (AAS) on filtered, unacidified water. Ca2+ and Mg2+
concentrations were analysed using a Varian AAlO while Na+, K+ and Fe
concentrations were measured with a Varian AA 110 Automatic.
2.1.4 Metals
The metal concentrations of filtered and acidified water samples were
determined by Inductively Coupled Plasma Mass Spectrometry (ICP-MS)
using a Perkin Elmer/Sciex Elan 6000 Inductively Coupled Plasma Mass
Spectrometer equipped with an acid resistant cross flow nebuliser. Samples
were diluted 10 times with an internal standard of 10 ppb In, Re, Rh and Bi in
5% HN03, to correct for instrumental drift. The U.S. National Institute of
Standards and Technology's (NIST) Standard Reference Material® (SRM) 1640
for trace elements in natural water was analysed to quantify analytical error
14
2.2
and the results included in Table 3.4. The calibration standards used in this
study w ere the:
1. Claritas pptrM Multi-element Solution 2A which contains 10 mg/L of
Ag, Al, As, Ba, Be, Ca, Cd, Co, Cr, Cs, Cu, Fe, Ga, K, Li, Mg, Mn, Na,
Ni, Pb, Rb, Se, Sr, Tl, U, V, Zn in 5% HN03.
2. PE Pure Plus Atomic Spectroscopy Multi-element Calibration
Standard 2 which contains 10 Jlg/mL Ce, Dy, Er, Eu, Gd, Ho, La, Lu,
Nd, Pr, Sm, Sc, Tb, Th, Tm, Y, Yb in 5% HN03.
3. PE Pure Plus Atomic Spectroscopy Multi-element ICP-MS Calibration
Standard 5 which contains 10 Jlg/ml of B, Ge, Mo, Nb, P, Re, S, Si, Ta,
Ti, W, Zr in H20/trace HF.
4. Specpure® Precious Metals Plasma Standard Solution which contains
100 Jlg/ ml Au, Ir, Os, Pt, Pd, Re, Rh, Ru in a matrix of 20% HCI.
SEDIMENT SAMPLING AND ANALYSIS
At each of the 20 sample sites, sediment was sampled from the sediment
water interface using a 50 ml plastic vial. Care was taken to prevent sample
exposure to the atmosphere. Sediment samples were stored at 4 oc before
being transported back to the University of Cape Town under anoxic
conditions for further analyses. Anoxic conditions were maintained using an
anaerobic jar and a BBL gas pack.
2.2.1 Metals
The metal concentrations of the sediment were determined by ICP-MS.
Samples w ere prepared and analysed in the same way as the residual fraction
of the sequential extraction discussed below.
2.2.2 Sequential Extraction
A sequential extraction was performed on wet sediment according to the
method of Tessier et al. (1979). This method sequentially extracts metals from
five fractions chosen for their likelihood of being affected by various
environmental conditions (Tessier et al., 1979). The five fractions and their
methods of extraction are reported below.
15
1. Exchangeable: Approximately 1g of sediment was extracted with
continuous agitation at room temperature for 1 h with 8 mL of 1M
MgCh.6H20 stabilised to pH 7 with 1M NaOH and 0.1M HCI.
2. Bound to carbonates: The residue from step 1 was leached at room
temperature with SmL of 1M CH3COONa adjusted to pH 5 with
CH3COOH. Continuous agitation was maintained for the 5 h
extraction.
3. Bound to iron and manganese oxides: The residue from step 2 was
extracted with 20 mL of 0.04M NH20H.HCl in 25 % (v /v) CH3COOH
at 96 ± 3·c with occasional agitation for 6 hours.
The first 3 fractions were extracted under anaerobic conditions to prevent any
oxidation of metals within the sediment.
4. Bound to organic matter: To the residue from step 3 were added 3 mL of
0.02M HN03 and 5 mL of 30% H20 2 adjusted to pH 2 with HN03. The
mixture was kept at 85 ± 2"C for 2 h with occasional agitation. A
second 3 mL aliquot of 30% H20 2, adjusted to pH 2 with HN03, was
added and the sample heated again to 85 ± 2·c for 3 h with
intermittent agitation. After cooling, SmL of 3.2M CH300N~ was
added before diluting the sample to 20 mL with de-ionised water and
agitating continuously for 30 min. C~OON~ is added to prevent
adsorption of extracted metals onto the oxidised sediment (Tessier et
al. , 1979).
5. Residual: To approximately 50 mg of dry residue from step 4, 4 ml of a
4:1 mixture of 28M HF and 14M HN03 were added. Samples were
digested for 48 hours at 50-6o·c with occasional agitation before
evaporation to complete dryness. A further 2 ml of 14M HN03 were
added and samples digested at 50-6o·c until complete dissolution
followed by evaporation to dryness at approximately 75 ·c. This latter
procedure was repeated. After cooling, samples were diluted 1000
times with the internal standard. A syenite geostandard, STM-1, from
the United States Geological Survey (USGS) was analysed with the
residual fraction to determine the percentage analytical error. Values
16
for this geostandard were published by Gladney and Roelandts (1988)
and are included in Table 3.5.
The metal concentrations of the five extracts were measured by ICP-MS. The
presence of the extractive reagent within the extract of the first four fractions
may have significant matrix effects during ICP-MS (pers comm., Coetzee,
2003). In order to minimise these matrix effects, the calibration standards for
each of the first four fractions were matrix matched to the samples. This was
achieved by including the respective extractive reagent during the preparation
of the calibration standards.
2.2.3 Particle Size Distribution
The analysis of the particle size distribution performed in this study was
adapted from the Non-Affliated Soil Analysis Work Committee (1990) and
Moore and Reynolds (1997). A 50 mL wet sediment sample was air-dried and
sieved through a 2 mm sieve. Approximately 10 g was weighed out from the <
2mm fraction and wet sieved through a 63 Jlffi sieve. (NaP03)6 was added to
the < 63 Jlffi fraction and the solution dispersed using a Vitris Virsonic 475
ultrasonic cell disrupter. Using Stoke's Law:
where 11 = viscosity (1.002 x 10⁻² g/ em/sat 2o·q, h =height of water (em), g =
gravity (emf s2), dp-dt = difference in density between particle (2.65 g/ cm3)
and liquid (1.0 g/ cm3) and D =particle diameter in em; the amount of time
required for the silt sized fraction (63 ,um<2,um) to settle out can be calculated,
leaving the clay fraction ( <2 ,urn) in suspension. The silt was then decanted,
dried and weighed while the clay content was calculated by subtracting the
silt content from the initial weight.
2.2.4 Organic Carbon
The organic carbon content of the sediment was determined using a CHN
analyser. Approximately 0.5 g of wet sediment was treated with 2 mL of 50%
(v jv) 12M HCl to dissolve any carbonate. The carbonate free sediment was
17

washed with 5 mL of 1M HCOON~ and dried at 40°C. A known weight of
dried and ground sediment was encapsulated in aluminium foil and placed in
the auto sampler. The auto sampler dispensed the sample into a furnace at the
same time as a dose of oxygen arrived, causing the sample to combust. The
C02 produced by the combustion of the organic carbon was transported
through the system by He to the non-dispersive infrared adsorption detection
system, where it is measured. Adjustments for blanks, calibration and weight
were made.
18
3 RESULTS
3.1 AQUEOUS GEOCHEMISTRY
3.1.1 Field Measurements
The values obtained from the field measurements are reported in Table 3.1.
The Blesbokspruit is an alkaline stream with the pH values recorded ranging
between 5.6 and 9.2 with a mean of 7.9. The average pH of samples MOl to
M03 is 7.3. For M04 to M09 the average of the pH is 7.8 while for samples MlO
to M20 the pH average is 8.1. Samples MlO to M20 show a more consistent pH
of around 8 with less variation compared to the other samples.
The EC increases remarkably from the uppermost portion of the Blesbokspruit
to the lower stretches. Samples MOl to M03 have an average EC of 579 JiS/ em,
while samples M04 to M09 (excluding MOS) have an average EC of 744JiS/cm.
MOS has an extremely high EC of 9,700~-tS/cm. The EC of samples MlO to M20
increases downstream from 1393 flS/ em at MlO to 2300 flS/ em at M20.
The Blesbokspruit waters were found to be oxic with between 2.5 mg/L and
15.1 mg/L DO. The DO value at M12 of 2.5 mg/L is lower than all the other
measurements and may reflect localised stagnant conditions with sluggish
flow. The average DO for samples MOl to M03 is 6.8 mg/L, for M04 to M09 it
is 9.1 mg/L while for MlO to M20 it is 8.2 mg/L.
The Eh values obtained from the Blesbokspruit are positive and range from 54
m V to 538 m V with an average of 248 m V. The average Eh of MOl to M03 is
351 m V, while for M04 to M09 it equal to 205 m V. Downstream of the point
where these two tributaries join, the average Eh is equal to 241 m V.
Using the method of Sarazin et al. (1999) the alkalinity was found to range
between 0.0 meq/L and 6.5 meq/L and is generally lower in the upper
portions (Samples MOl to M09), increasing within the main portion of the
Blesbokspruit. At alkalinities greater than 5 meq/L the error between the
method of Sarazin et al. (1999) and the potentiometric titration performed in
the field are within the acceptable limit of 10%. The error between the two
19
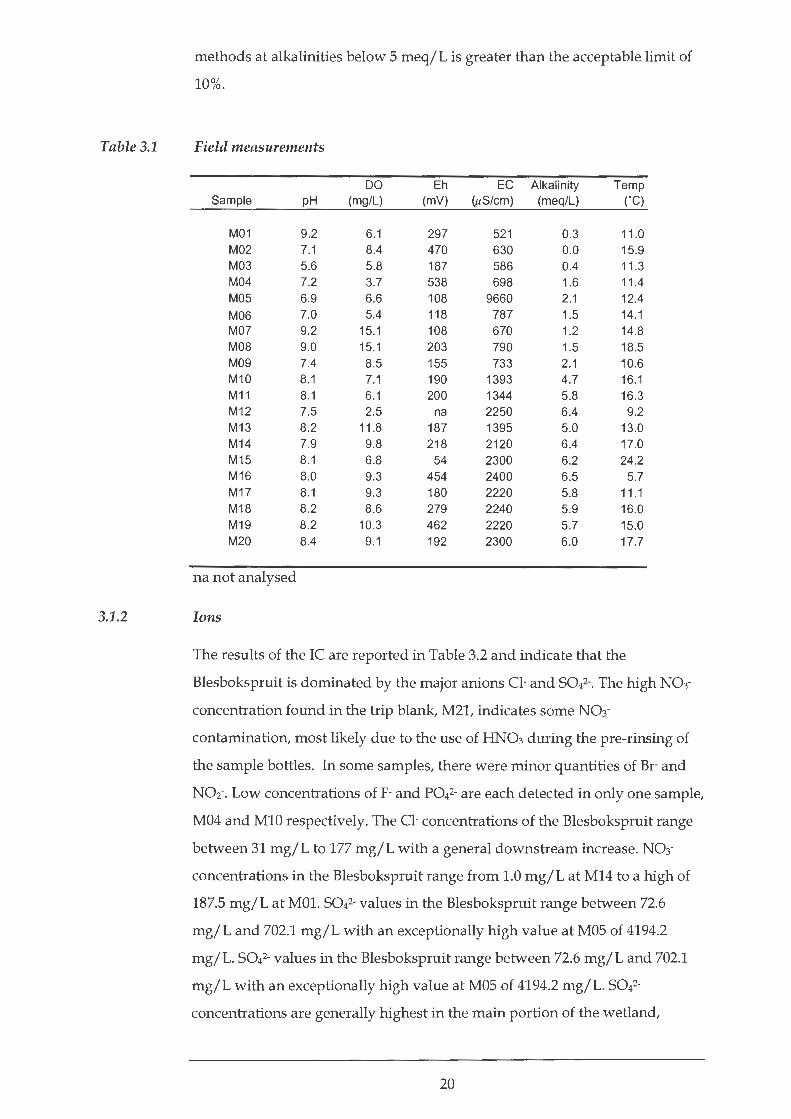
Table 3.1
3.1.2
methods at alkalinities below 5 meq/L is greater than the acceptable limit of
10%.
Field measurements
DO Eh EC Alkalinity Temp Sample pH (mg/L) (mV) (uS/em) (meq/L) ('C)
M01 9.2 6.1 297 521 0.3 11 .0 M02 7.1 8.4 470 630 0.0 15.9 M03 5.6 5.8 187 586 0.4 11 .3 M04 7.2 3.7 538 698 1.6 11.4 M05 6.9 6.6 108 9660 2.1 12.4 M06 7.0 5.4 118 787 1.5 14.1 M07 9.2 15.1 108 670 1.2 14.8 MOB 9.0 15.1 203 790 1.5 18.5 M09 7.4 8.5 155 733 2.1 10.6 M10 8.1 7.1 190 1393 4.7 16.1 M11 8.1 6.1 200 1344 5.8 16.3 M1 2 7.5 2.5 na 2250 6.4 9.2 M1 3 8.2 11.8 187 1395 5.0 13.0 M1 4 7.9 9.8 218 2120 6.4 17.0 M1 5 8.1 6.8 54 2300 6.2 24.2 M1 6 8.0 9.3 454 2400 6.5 5.7 M1 7 8.1 9.3 180 2220 5.8 11 .1 M1 8 8.2 8.6 279 2240 5.9 16.0 M1 9 8.2 10.3 462 2220 5.7 15.0 M20 8.4 9.1 192 2300 6.0 17.7
na not analysed
Ions
The results of the IC are reported in Table 3.2 and indicate that the
Blesbokspruit is dominated by the major anions Cl- and 5042-. The high N03-
concentration found in the trip blank, M21, indicates some N03-
contamination, most likely due to the use of HN03 during the pre-rinsing of
the sample bottles. In some samples, there were minor quantities of Br- and
N02-. Low concentrations ofF- and P042- are each detected in only one sample,
M04 and M10 respectively. The Cl- concentrations of the Blesbokspruit range
between 31 mg/L to 177 mg/L with a general downstream increase. N03-
concentrations in the Blesbokspruit range from 1.0 mg/L at M14 to a high of
187.5 mg/L at MOl. 5042- values in the Blesbokspruit range between 72.6
mg/L and 702.1 mg/L with an exceptionally high value at M05 of 4194.2
mg/L. 5042- values in the Blesbokspruit range between 72.6 mg/L and 702.1
mg/L with an exceptionally high value at M05 of 4194.2 mg/L. 5042-
concentrations are generally highest in the main portion of the wetland,
20
I
Table 3.2
alongside the current mining operations. The majority of the samples do not
show any detectable N02- although the highest concentrations were found at
MOS, the most polluted site.
The results of the AAS are presented in Table 3.2. The dominant cations in the
Blesbokspruit areNa+ and Ca2+ with lesser amounts of K+ and Mg2+. The Na+
content of the Blesbokspruit ranges from 69.1 mg/L to 28S.O mg/L with an
exceptional value of 8SS.O mg/L at MOS. There is a trend of increasing Na+
downstream with the highest concentrations in the main portion of the
system. Concentrations of K+ range from 9.4 mg/L to 20.S mg/L with a high
value of 32.0 mg/L at MOS. The Ca2+ content of the Blesbokspruit ranges
between 20.7 mg/L and 19S.3 mg/L with a trend of increasing concentrations
downstream. Mg2+ concentrations in the Blesbokspruit range between 8.7
mg/L and S6.0 mg/L. The samples with lower Mg2+ concentration are
upstream of the mines' impact while those with higher concentrations are
within the main portion of the Blesbokspruit alongside the mining operations.
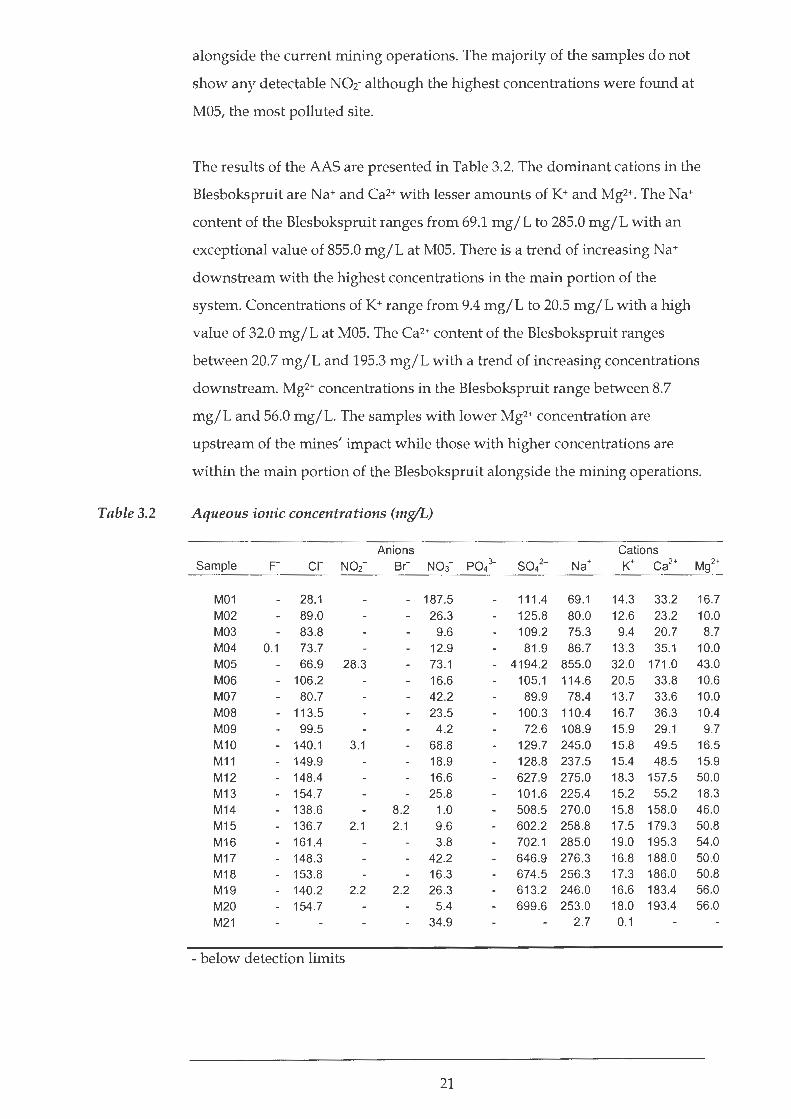
Aqueous ionic concentrations (mg/L)
Anions Cations Sample F Cl- N02- Br- No3- P043- sol - Na+ K+ Ca2+ Mg2+
M01 28.1 - 187.5 111.4 69.1 14.3 33 .2 16.7
M02 89.0 26 .3 125.8 80.0 12.6 23.2 10.0 M03 83.8 9.6 109.2 75.3 9.4 20.7 8.7 M04 0.1 73.7 12.9 81.9 86.7 13.3 35.1 10.0 M05 66.9 28 .3 73.1 - 4194.2 855.0 32.0 171 .0 43.0 M06 - 106.2 16.6 105.1 114.6 20.5 33.8 10.6 M07 80.7 42.2 89.9 78.4 13.7 33.6 10.0 MOB - 113.5 23.5 100.3 110.4 16.7 36.3 10.4 M09 99 .5 4.2 72.6 108.9 15.9 29.1 9.7 M10 - 140.1 3.1 68 .8 129.7 245.0 15.8 49.5 16.5 M11 - 149.9 18.9 128.8 237.5 15.4 48.5 15.9
M12 - 148.4 16.6 627.9 275.0 18.3 157.5 50.0
M13 - 154.7 25.8 101.6 225.4 15.2 55.2 18.3
M14 - 138.6 8.2 1.0 508 .5 270.0 15.8 158.0 46.0
M15 - 136.7 2.1 2.1 9.6 602.2 258.8 17.5 179.3 50.8
M16 - 161.4 3.8 702 .1 285.0 19.0 195.3 54.0
M17 - 148.3 42.2 646 .9 276.3 16.8 188.0 50.0
M18 - 153.8 16.3 674 .5 256.3 17.3 186.0 50.8
M19 - 140.2 2.2 2.2 26.3 613.2 246.0 16.6 183.4 56.0
M20 - 154.7 5.4 699.6 253.0 18.0 193.4 56.0
M21 34.9 2.7 0.1
- below detection limits
21
r
r I
3.1.3 Analytical appraisal
Table 3.3
A fundamental principle of solution chemistry is that solutions are electrically
neutral. The total number of positive charges carried by cations must therefore
equal the total number of negative charges carried by anions (Drever, 1997).
The percentage difference between the total number of positive charges and
negative charges can be calculated using the formula defined by Clesceri et al.
(1998):
0 1 difJr+-100
I cations - I anions 1 0 z '1 erence = I cations + I anions
Table 3.3 presents the results of this appraisal. There are two possible sources
of error in this appraisal. Either there is inaccuracy in the analytical procedure
or certain ions have been omitted from the calculation. Where the anion sum
is between 3.0 and 10.0 meq/L then the acceptable difference is± 2% while at
higher anion sums of between 10.0 and 800.0 meq/L the acceptable difference
increases to 5% (Clesceri et al., 1998). The two most inaccurate charge balances
are calculated to be samples M05 and M21. Due to M05' s very high EC (9660
JJ.S/ em) it was diluted 100 times for IC analysis. This significant dilution may
be responsible for inaccurate S042-concentrations. M21 was a trip blank of de
ionised water from the Council for Geoscience's laboratory in Pretoria. Results
of IC analyses show N03- contamination, probably by the 3M HN03 used to
acid wash the water sample vessels prior to a triple rinse with de-ionised
water. The percentage difference between the total number of positive and
negative charges slightly exceeds Clesceri et al.' s (1998) acceptable criteria in
the case of samples M04, M06, M08, M09, M10 and M13. This probably reflects
dilution inaccuracies or possible minor analytical error rather than the
omission of specific ions from the calculation. In general, the samples with a
higher anion sums have a lower percentage difference between the total
number of positive and negative charges, with the exception of MOS.
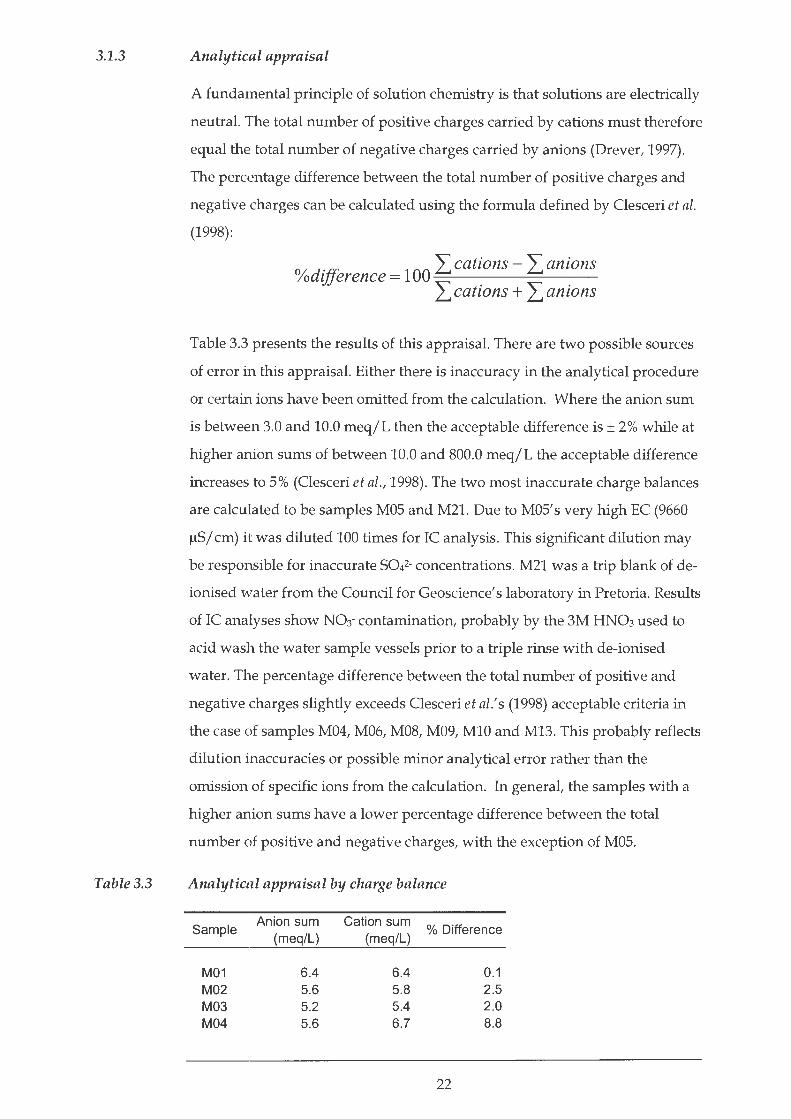
Analytical appraisal by charge balance
Sample Anion sum Cation sum
% Difference (meq/L) (meq/L)
M01 6.4 6.4 0.1 M02 5.6 5.8 2.5 M03 5.2 5.4 2.0 M04 5.6 6.7 8.8
22
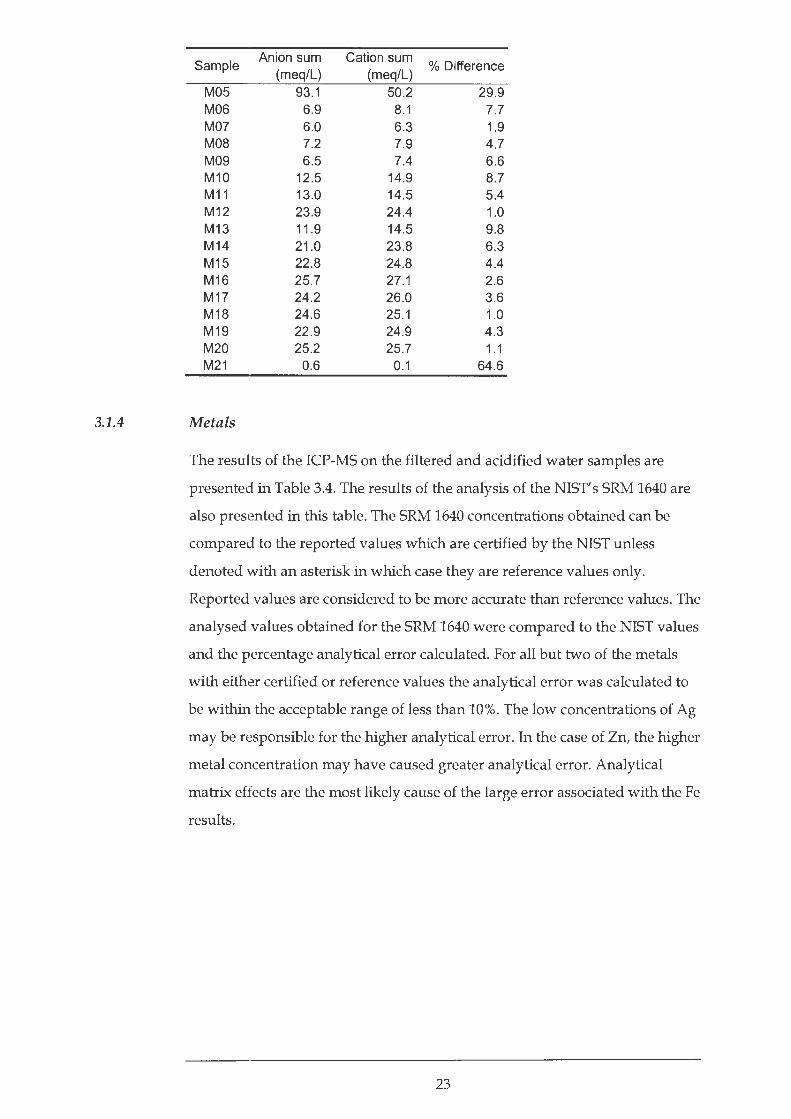
Sample Anion sum Cation sum
% Difference (meq/L} (meq/L)
M05 93.1 50.2 29.9 M06 6.9 8.1 7.7 M07 6.0 6.3 1.9 M08 7.2 7.9 4.7 M09 6.5 7.4 6.6 M10 12.5 14.9 8.7 M11 13.0 14.5 5.4 M12 23.9 24.4 1.0 M13 11 .9 14.5 9.8 M14 21.0 23.8 6.3 M15 22 .8 24.8 4.4 M16 25.7 27.1 2.6 M17 24.2 26.0 3.6 M18 24.6 25.1 1.0 M19 22.9 24.9 4.3 M20 25.2 25.7 1.1 M21 0.6 0.1 64.6
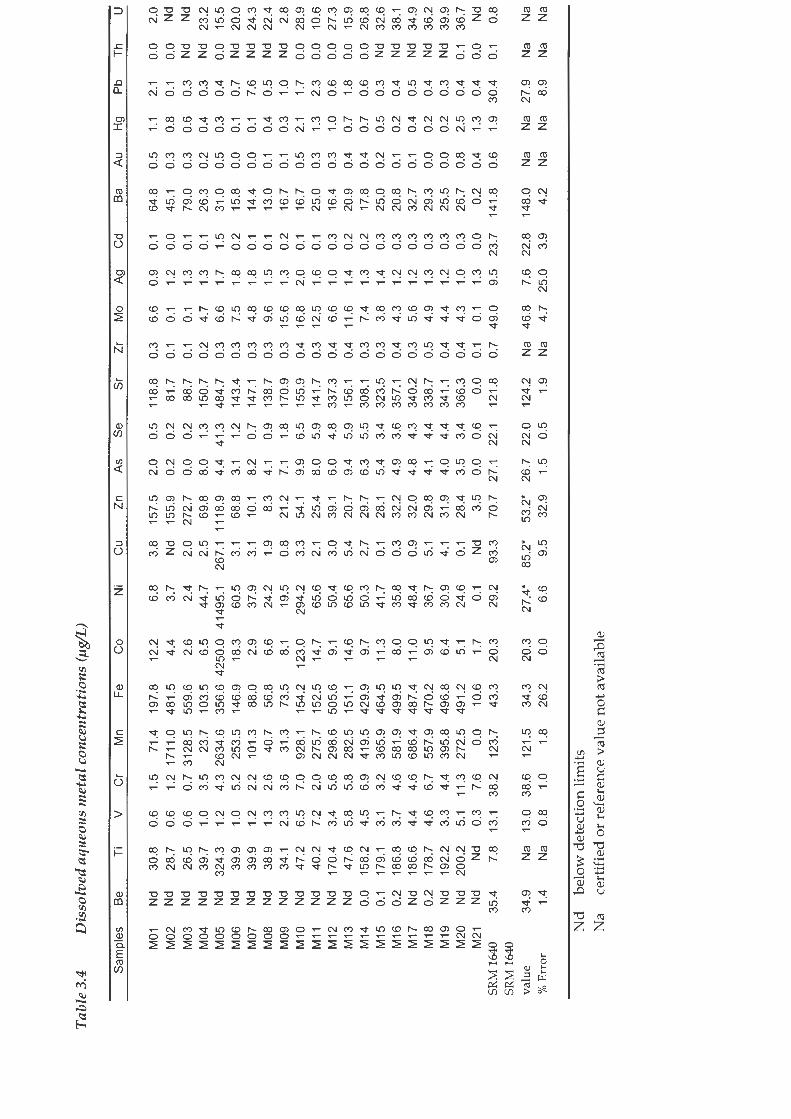
3.1.4 Metals
The results of the ICP-MS on the filtered and acidified water samples are
presented in Table 3.4. The results of the analysis of the NISI's SRM 1640 are
also presented in this table. The SRM 1640 concentrations obtained can be
compared to the reported values which are certified by the NIST unless
denoted with an asterisk in which case they are reference values only.
Reported values are considered to be more accurate than reference values. The
analysed values obtained for the SRM 1640 were compared to the NIST values
and the percentage analytical error calculated. For all but two of the metals
with either certified or reference values the analytical error was calculated to
be within the acceptable range of less than 10%. The low concentrations of Ag
may be responsible for the higher analytical error. In the case of Zn, the higher
metal concentration may have caused greater analytical error. Analytical
matrix effects are the most likely cause of the large error associated with the Fe
results.
23
------
....
..
--
....
.. --
----
--
----
------
-----.
.. ----
------
---~ ....
. ~-----.....-
-..-----.
_.. -
._. -..
..... -.
_.-
..._
Tab
le 3
.4
Dis
solv
ed a
queo
us m
eta
l con
cent
rati
ons
(f.J
g/L)
Sam
ples
B
e T
i V
C
r M
n Fe
C
o N
i C
u Z
n A
s S
e S
r Z
r M
o A
g C
d B
a A
u H
g P
b T
h u
M01
M02
M03
M
04
M05
M
06
M07
M
OB
M09
M
10
M11
M
12
M13
M
14
M15
M
16
M17
M
18
M19
M
20
M21
S
RM
164
0 S
RM
164
0 va
lue
%E
rror
Nd
Nd
Nd
Nd
30.8
0
.6
1.5
71.4
19
7.8
28
.7
0.6
1
.2
1711
.0
481.
5
26.5
0.
6 0.
7 31
28.5
55
9.6
39.7
1.
0 3
.5
23.7
10
3.5
12.2
4.4
2.6
6.5
6.8
3.7
2.4
44.7
3.8
157
.5
2.0
0
.5
118
.8
Nd
155.
9 0
.2
0.2
81.7
2.0
27
2.7
0.
0 0.
2 88
.7
2.5
69.8
8
.0
1.3
150
.7
Nd
324
.3
Nd
39.9
N
d 39
.9
Nd
38.9
N
d 34
.1
1.2
1.0
1.2
1.3
2.3
6
.5
7.2
3.
4 5
.8
4.5
4.3
2634
.6
356.
6 42
50.0
41
495
.1
267.
1 11
18.9
4.
4 41
.3
484
.7
5.2
25
3.5
146.
9 18
.3
60.5
3
.1
68.8
3
.1
1.2
14
3.4
2.2
101.
3 88
.0
2.9
37.9
3.
1 10
.1
8.2
0.7
147
.1
2.6
40.7
56
.8
6.6
24
.2
1.9
8.3
4.
1 0
.9
138.
7 3
.6
31.3
73
.5
8.1
19
.5
0.8
21
.2
7.1
1.8
170
.9
Nd
47.2
7
.0
928
.1
154
.2
123
.0
294.
2 3.
3 54
.1
9.9
6
.5
155.
9 N
d 40
.2
Nd
170.
4 N
d 47
.6
0.0
15
8.2
2.0
27
5.7
152
.5
14.7
65
.6
2.1
25.4
8.
0 5.
9 14
1.7
5.6
298.
6 50
5.6
9.1
50
.4
3.0
39.1
6.
0 4.
8 33
7.3
5.
8 28
2.5
151.
1 14
.6
65.6
5.
4 20
.7
9.4
5.9
15
6.1
6.
9 41
9.5
429
.9
9. 7
50
.3
2.7
29
.7
6.3
5.
5 30
8.1
0
.1
179.
1 3.
1 3
.2
365
.9
46
4.5
11
.3
0.2
18
6.8
3.7
4.6
58
1.9
499
.5
8.0
Nd
186
.6
4.4
4.6
68
6.4
487.
4 11
.0
0.2
178
.7
4.6
6
.7
557
.9
470.
2 9
.5
Nd
192
.2
3.3
4.4
395.
8 49
6.8
6.4
Nd
200
.2
5.1
11
.3
272.
5 49
1.2
5.1
N
d N
d 0
.3
7.6
0.0
10.6
1.
7 35
.4
7.8
13
.1
38.2
12
3.7
4
3.3
20
.3
34.9
1.
4 N
a 13
.0
38.6
12
1.5
N
a 0.
8 1.
0 1.
8 34
.3
26
.2
20.3
0.
0
41.7
0.
1 28
.1
5.4
3.4
323
.5
35.8
0
.3
32.2
4
.9
3.6
357.
1 48
.4
0.9
32
.0
4.8
4.
3 34
0.2
36
.7
5.1
29
.8
4.1
4.
4 33
8.7
30
.9
4.1
31
.9
4.0
4.
4 34
1.1
24.6
0
.1
28.4
3.
5 3.
4 36
6.3
0
.1
Nd
3.5
0.0
0
.6
0.0
29.2
93
.3
70.7
27
.1
22.1
12
1.8
27.4
* 85
.2*
53.2
* 26
.7
22.0
12
4.2
6.6
9.5
32.9
1.
5 0
.5
1.9
Nd
be
low
det
ecti
on li
mit
s N
a ce
rtif
ied
or r
efer
ence
val
ue n
ot a
vail
able
0.3
6.
6
0.1
0
.1
0.1
0.1
0.
2 4
.7
0.3
6.6
0.
3 7.
5 0.
3 4.
8 0
.3
9.6
0.3
15.6
0.
4 16
.8
0.3
12
.5
0.4
6.6
0.
4 11
.6
0.3
7.4
0.3
3
.8
0.4
4.3
0.3
5.6
0.5
4.9
0.4
4.4
0.4
4.3
0.1
0.1
0.7
4
9.0
0.9
0.1
64
.8
1.2
0
.0
45.1
1.3
0.1
79
.0
1.3
0.
1 26
.3
1.7
1
.5
31.0
1
.8
0.2
15
.8
1.8
0.1
14.4
1
.5
0.1
13
.0
1.3
0.2
16.7
2
.0
0.1
16.7
1.
6 0.
1 25
.0
1.0
0.3
16
.4
1.4
0.2
20.9
1
.3
0.2
17.8
1.
4 0.
3 25
.0
1.2
0.3
20
.8
1.2
0.3
32
.7
1.3
0.3
29
.3
1.2
0
.3
25.5
1.
0 0
.3
26.7
1.
3 0
.0
0.2
9.5
2
3.7
14
1.8
Na
46.8
7.
6 22
.8
148
.0
Na
4.7
25
.0
3.9
4.2
0.5
0.3
0.3
0.
2 0.
5 0
.0
0.0
0.1
0.
1 0.
5 0
.3
0.3
0.4
0.4
0.2
0
.1
0.1
0
.0
0.0
0
.8
0.4
0.6
Na
Na
1.1
2.1
0.8
0
.1
0.6
0.3
0.
4 0.
3 0
.3
0.4
0.1
0
.7
0.1
7.6
0.4
0.5
0.3
1.
0 2
.1
1.7
1.3
2.3
1.0
0.6
0
.7
1.8
0.7
0.
6 0.
5 0.
3 0
.2
0.4
0.4
0.5
0.
2 0.
4 0.
2 0
.3
2.5
0.
4 1.
3 0.
4 1.
9 30
.4
Na
27.9
N
a 8.
9
0.0
2.0
0.0
N
d N
d N
d
Nd
23.2
0
.0
15.5
N
d 20
.0
Nd
24.3
N
d 2
2.4
N
d 2
.8
0.0
28.9
0
.0
10.6
0.
0 27
.3
0.0
15.9
0
.0
26.8
N
d 32
.6
Nd
38.1
N
d 34
.9
Nd
36.2
N
d 39
.9
0.1
36.7
0.
0 N
d 0.
1 0
.8
Na
Na
Na
Na
3.2 SEDIMENT GEOCHEMISTRY
3.2.1 Metals
The metal concentrations of the bulk sediment as determined by ICP-MS are
reported in Table 3.5. Also reported are the concentrations obtained for the
USGS's STM-1 geostandard. STM-1 concentrations obtained can be compared
to the certified values of STM-1 which are underlined for recommended
values while other values are proposed except those preceded by a "(" which
are only information values (Govindaraju, 1994). These published comparative
values can be ranked in order of decreasing accuracy from the recommended
values, followed by the proposed values and finally the information values.
The percentage analytical error is calculated for each metal where comparative
values are available and ranges from below the acceptable limit of 10% up to
100%. Analytical error, analytical matrix effects and the accuracy of the
comparative values are possible reasons for the high percentage errors.
25

Tab
le 3
.5
Dry
sed
imen
t met
al c
once
ntra
tion
s (m
glkg
)
Sam
ple
Ti
v C
r M
n Fe
C
o N
i C
u Z
n A
s S
e S
r Z
r M
o A
g C
d Ba
A
u H
g P
b T
h u
M01
39
24.4
11
8.9
19
1.5
2551
.3
4017
4.0
54
.3
86.9
62
.6
202
.2
8.2
M
02
3427
.1
89.6
15
5.0
14
69.9
58
346
.7
22.4
52
.2
38.4
18
1.7
8
.3
M04
13
14.1
32
.8
79.4
M
05
1905
.8
53.2
21
9.1
M
06
2928
.6
93.5
16
4.2
M
07
5358
.6
237
.6
339
.1
M08
25
67.6
68
.3
110
.6
M11
36
36.7
82
.2
217.
7
67.8
10
462.
2 33
.8
134
.9
48.1
91
.9
32.5
11
1.4
1800
5.9
11
.6
79.6
54
.2
35.8
77
.8
159
.9
3392
9.8
28
.4
117
.6
71.4
18
2.4
20.0
90
2.3
5693
6.4
40.0
16
3.2
91
.7
155
.9
6.0
89.3
15
943
.9
7.6
67
.3
21.9
10
0.2
24.3
53
0.1
28
562.
4 19
.7
65.3
39
.6
102.
9 8
.0
0.9
96
.7
109.
7 0
.9
67.7
83
.4
0.9
9.
1 26
.5
1.3
41.5
51
.2
0.1
14
.7
74.2
0.
4 17
.6
97.1
1.
8 13
.0
58.6
1.
0 47
.3
106
.5
M12
51
07.7
10
2.8
130.
0 12
07.1
41
925
.7
14.4
71
.9
47.8
15
0.6
7
.3
1.4
49.4
12
5.9
M
13
4016
.7
152
.5
304
.2
908
.0
4608
4.2
81
.5
233
.1
361.
6 22
5.6
13
0.7
1.
3 52
.5
103.
1 M
16
4435
.9
104
.6
178.
0 12
45.8
38
417.
6 22
.0
54.3
39
.5
107
.7
3.9
2.
9 45
.1
120
.2
M18
42
52.2
84
.9
124
.3
409.
3 26
400.
2 12
.6
32.2
30
.2
81.9
3
.7
1.2
25.8
12
4.0
M19
48
68.2
10
8.5
21
0.0
998.
3 48
472.
9 10
1.8
343.
4 61
.6
330
.0
10.3
2
.0
43.1
13
5.5
M20
23
36.9
47
.9
62.3
14
6.3
1173
2.6
3.
6 16
.2
14.4
43
.2
2.5
1.1
16.4
66
.0
STM
1 67
5.7
0
.3
2.3
13
74.9
25
150
.9
0.8
1.
8 3
.1
229.
4 1.
4 nd
61
6.8
1184
.4
Cer
tifie
d N
a (8
.7
(4.3
N
a N
a 0
.9
(3
(4.6
23
5 4
.6
0.00
77
700
1210
%
Err
or
Na
96.6
46
.5
Na
Na
11.1
40
.0
32.6
2.
4 69
.6
100
.0
11.9
2
.1
N d
be
low
det
ecti
on li
mit
s N
a ce
rtif
ied
, rec
om
men
ded
or
info
rmat
ion
val
ue n
ot a
vai
lab
le
1.3
0.7
0.2
11
60.5
1.
6 0
.6
0.1
48
3.8
0
.8
0.3
0.2
59
.8
1.2
0.3
0
.0
139
.3
1.3
0.3
0.4
117.
3 1.
9 0
.5
0.2
138
.1
0.7
0.3
0
.1
113.
6 1.
0 0
.5
0.1
162.
8 1.
4 0
.6
0.1
249
.0
1.4
1.2
0.1
64
4.5
0.5
0
.6
0.1
245
.8
0.7
0
.5
0.1
1.
4 0.
7 0
.2
149
.1
221
.2
0.1
0
.3
0.4
0.1
0
.2
0.2
0.2
0
.2
0.1
0.3
0.
1 0
.1
0.6
0.2
38
.7
11.1
2.
4 0.
9 36
.1
9.5
2.
1 0
.8
11.6
2
.3
14.5
N
d 25
.4
4.3
7.
7 N
d 19
.3
5.9
35.5
0
.5
12.3
6
.8
2.8
0.3
8.
2 4.
9 2.
4 0
.2
22.3
10
.1
4.4
0.2
20.6
11
.5
3.3
0.
1 24
.4
12.2
62
.4
0.0
16
.0
9.1
1.
9 0
.1
15.2
9
.7
1.7
0
.2
17.5
11
.5
44.9
0.
5 0
.3
0.1
110.
7 0.
1 N
d 7.
4 5
.0
1.4
5.2
5.0
0.
3 5.
2 0.
079
0.2
7 0
.0
100
.0
11.1
566.
7 0.
7 0
.2
15.7
29
.7
8.6
56
0 (0
.000
4 (0
.015
17
.7
31
9.06
1.
2 10
0.0
100
.0
11.3
4.
19
11.7
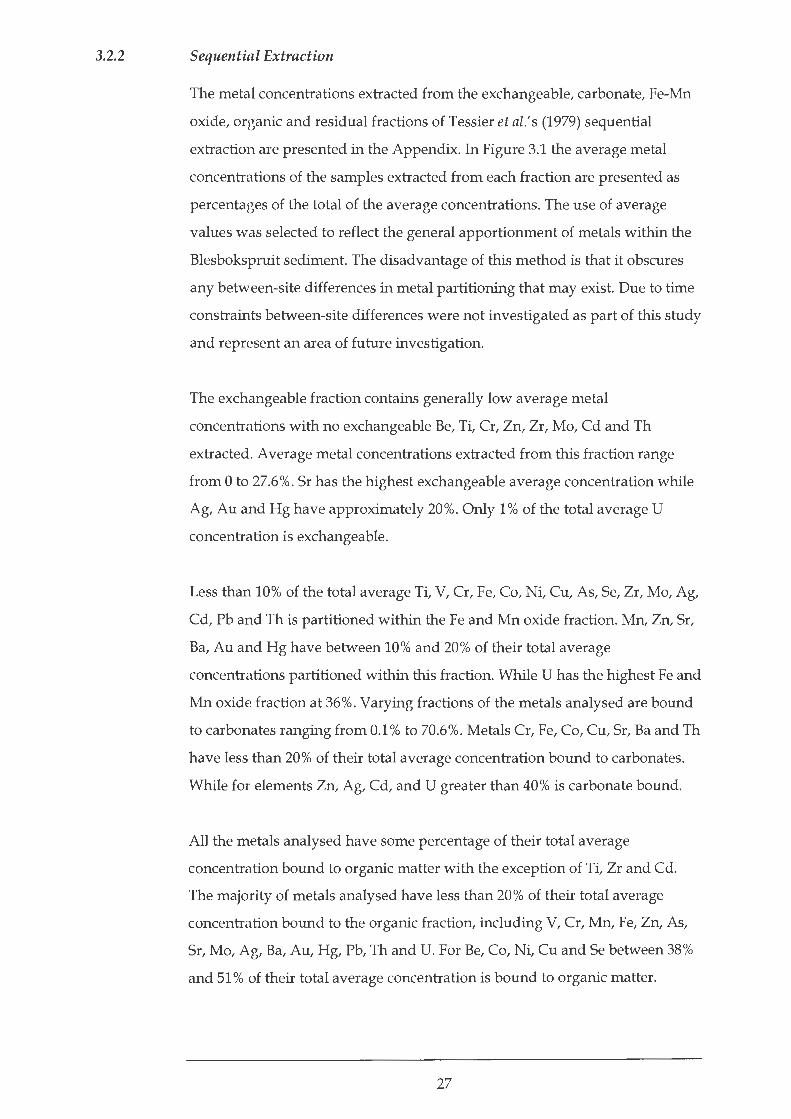
3.2.2 Sequential Extraction
The metal concentrations extracted from the exchangeable, carbonate, Fe-Mn
oxide, organic and residual fractions of Tessier et al.'s (1979) sequential
extraction are presented in the Appendix. In Figure 3.1 the average metal
concentrations of the samples extracted from each fraction are presented as
percentages of the total of the average concentrations. The use of average
values was selected to reflect the general apportionment of metals within the
Blesbokspruit sediment. The disadvantage of this method is that it obscures
any between-site differences in metal partitioning that may exist. Due to time
constraints between-site differences were not investigated as part of this study
and represent an area of future investigation.
The exchangeable fraction contains generally low average metal
concentrations with no exchangeable Be, Ti, Cr, Zn, Zr, Mo, Cd and Th
extracted. Average metal concentrations extracted from this fraction range
from 0 to 27.6 %. Sr has the highest exchangeable average concentration while
Ag, Au and Hg have approximately 20%. Only 1% of the total average U
concentration is exchangeable.
Less than 10% of the total average Ti, V, Cr, Fe, Co, Ni, Cu, As, Se, Zr, Mo, Ag,
Cd, Pb and This partitioned within the Fe and Mn oxide fraction. Mn, Zn, Sr,
Ba, Au and Hg have between 10% and 20 % of their total average
concentrations partitioned within this fraction. While U has the highest Fe and
Mn oxide fraction at 36%. Varying fractions of the metals analysed are bound
to carbonates ranging from 0.1 % to 70.6%. Metals Cr, Fe, Co, Cu, Sr, Ba and Th
have less than 20 % of their total average concentration bound to carbonates.
While for elements Zn, Ag, Cd, and U greater than 40 % is carbonate bound.
All the metals analysed have some percentage of their total average
concentration bound to organic matter with the exception of Ti, Zr and Cd.
The majority of metals analysed have less than 20% of their total average
concentration bound to the organic fraction, including V, Cr, Mn, Fe, Zn, As,
Sr, Mo, Ag, Ba, Au, Hg, Pb, Th and U. For Be, Co, Ni, Cu and Se between 38%
and 51 % of their total average concentration is bound to organic matter.
27
Almost all of the average Ti and Zr concentration is partitioned within the
residual phase. All the metals analysed, except Se, Ag, Au and U, have greater
than 20 % of their total average concentration within the residual fraction,
while V, Cr, Fe and Th have greater than 60 % partitioned within the residual
fraction. Coetzee's (1993) study on metal speciation in sediments from the
Hartebeesport Dam, approximately 100 km north-west of the Blesbokspruit,
found that 76% of the Cr occurred in the inert fraction, which compares well
to the 78 % Cr in the residual fraction of this study. Be, Mn, Co, Ni, Zn, Cd,
Hg and Pb have between 20 % and 40% of their total average concentrations
bound to the residual fraction. Of all the metals analysed, U is the least
partitioned within the residual phase.
Co and Ni partition almost identically between the five fractions. Au and Hg
also partition in roughly the same way, although there is slightly more Hg in
the residual fraction and slightly more Au in the carbonate fraction. Ti and Zr
also have very similar partitioning.
28

..-----~~---~------~----..--
... -~ .. .-~-
~~--
--~-
----
..-~
.... .--.
-~ .....
..--. .--.
.. --
---
.--~ -
..--
...... . -
Fig
ure
3.1
Met
al p
arti
tion
ing
wit
hin
the
sedi
men
t
100%
- •
I I
--
80%
60%
40%
20%
0%
Be
Ti
V
Cr
Mn
Fe
Co
Ni
Cu
Zn
As
Se
Sr
Zr
Mo
Ag
Cd
Ba
Au
Hg
Pb
Th
U
• R
esid
ual
• B
ound
to
orga
nic
mat
ter
• B
ound
to
Fe-
Mn
Oxi
des
Bou
nd t
o C
arbo
nate
s •
Exc
hang
eabl
e

r Figure 3.2
80
70
60
E C>
"iii 50 3: (:-"0
c 40 Q)
E '0 Q) 1/)
C> 30 ~ E
20
10
0
Figure 3.2 plots U concentrations at selected sample sites and their
operationally defined partitioning. The carbonate and Fe-Mn oxide fraction
together account for the majority of U within the Blesbokspruit sediments.
Samples MOl and M03 represent relatively unpolluted sites taken upstream of
any significant mining influence. They have low U concentrations with over
30% of the U in the inert residual phase. Samples Ml4, MlS, M17 and M20,
taken from the lower stretches of the main portion of the wetland, also have
low relatively lower U concentrations with approximately 20% of the U in the
residual phase. Samples M06, M09, MlO and M13 have higher concentrations
of U with the majority of U bound to carbonates and Fe-Mn oxides and
generally less than 10% in the residual fraction. This suggests that U has
accumulated in the tributary flowing through the Alexander and Cowles
Dams. Within the main portion of the wetland, the highest U accumulations
occur just downstream of the point at which this tributary enters the main
stream. However, the U appears to be relatively immobile within the sediment
as downstream sample sites do not show the same levels of accumulation.
Uranium partitioning
M01 M03 M06 M09 M10 M13 M14 M15 M17 M20
Sample sites
• Residual • Bound to organic matter • Bound to Fe-Mn oxides Bound to carbonates • Exchangeable
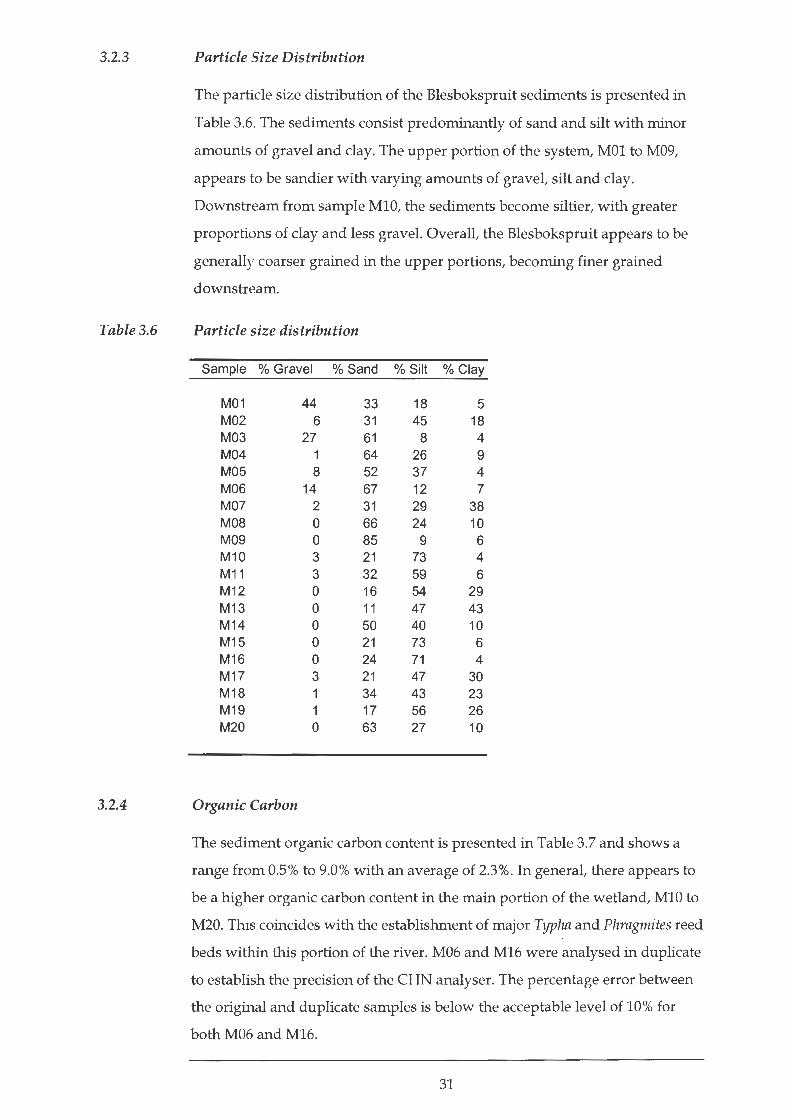
3.2.3 Particle Size Distribution
Table 3.6
The particle size distribution of the Blesbokspruit sediments is presented in
Table 3.6. The sediments consist predominantly of sand and silt with minor
amounts of gravel and clay. The upper portion of the system, MOl to M09,
appears to be sandier with varying amounts of gravel, silt and clay.
Downstream from sample M10, the sediments become siltier, with greater
proportions of clay and less gravel. Overall, the Blesbokspruit appears to be
generally coarser grained in the upper portions, becoming finer grained
downstream.
Particle size distribution
Sample % Gravel % Sand % Silt % Clay
M01 44 33 18 5 M02 6 31 45 18 M03 27 61 8 4 M04 64 26 9 M05 8 52 37 4 M06 14 67 12 7 M07 2 31 29 38 M08 0 66 24 10 M09 0 85 9 6 M10 3 21 73 4 M11 3 32 59 6 M12 0 16 54 29 M13 0 11 47 43 M14 0 50 40 10 M15 0 21 73 6 M16 0 24 71 4 M17 3 21 47 30 M18 34 43 23 M19 17 56 26 M20 0 63 27 10
3.2.4 Organic Carbon
The sediment organic carbon content is presented in Table 3.7 and shows a
range from 0.5% to 9.0% with an average of 2.3%. In general, there appears to
be a higher organic carbon content in the main portion of the wetland, M10 to
M20. This coincides with the establishment of major Typha and Phragmites reed
beds within this portion of the river. M06 and M16 were analysed in duplicate
to establish the precision of the CHN analyser. The percentage error between
the original and duplicate samples is below the acceptable level of 10% for
both M06 and M16.
31

Table 3.7 Organic carbon content of sediment
Sample % Organic Carbon
M01 1.75 M02 9.00 M03 0.93 M04 0.87 M05 0.59 M06 1.21
M06 duplicate 1.27 M07 1.30 MOB 0.91 M09 0.47 M1 0 2.94 M1 1 5.79 M1 2 2.38 M1 3 2.14 M1 4 1.28 M1 5 2.18 M1 6 1.71
M16 duplicate 1.54 M1 7 3.19 M1 8 1.38 M1 9 4.44 M20 0.88
32
4 DISCUSSION
4.1 AQUEOUS GEOCHEMISTRY
4.1.1 Field Measurements
pH is often termed the "master variable" that controls ion exchange,
dissolution/ precipitation, reduction/ oxidation, adsorption and complexation
reactions (McBride, 1994). It is defined as:
pH = -log[H+]
The underlying dolomites of the Chuniespoort Group are the probable cause
of the relatively high pH values of the Blesbokspruit. Typical groundwater
within the Chuniespoort Group has a pH of between 5.8 and 9.5 with a mean
of 7.6 (Barnard, 2000). The downstream increase in average pH could be the
result of discharge from flooded underground mine workings in contact with
the Chuniepoort Group aquifer. The moderately reducing conditions of the
downstream wetland also have the potential to contribute to higher pHs
(Reddy et al., 2000).
The Blesbokspruit waters were generally oxic. Oxygen is involved in or
influences most chemical and biological process occurring within water bodies
and is a function of temperature, salinity, turbulence, photosynthesis and
atmospheric pressure (Chapman and Kimstach, 1992). Variations in these
parameters may be responsible for the variable DO values measured in the
Blesbokspruit, especially temperature and salinity which changed throughout
the stream.
In relatively oxic waters, such as those encountered in the Blesbokspruit, Eh
values measured are not necessarily related to a unique redox pair and are
therefore not of much value in quantitative interpretations of natural water
chemistry (Drever, 1997). Instead, the measured Eh values in this study
represen t a mixed potential resulting from a combination of two or more
different redox processes (Stumm and Morgan, 1996). Stumm and Morgan
(1996) suggest that these mixed potentials are of little worth in determining
equilibrium Eh values. Given these limitations, the Eh measurements made
are useful qualitative indicators of the overall oxidising nature of the stream
water.
33
The downstream increase in EC is most likely caused by input from the
surrounding gold mine's flooded underground workings. Grootvlei
Proprietary Mines Ltd discharges between 80 and 100 ML of underground
water into the Blesbokspruit every day (Schoeman and Steyn, 2001) . This
water con tains high concentrations of dissolved salts with a TDS of 2700-3800
mg/L (Schoeman and Steyn, 2001) . Using the approximate relationship
reported by McBride (1994):
TDS (mg/L) <=::j EC (mS/ em) x 640
the EC of the water from the underground workings is calculated to be
between 4200 fl.S/ em and 5900 fl.S/ em. This input of high TDS is likely to have
an effect on the salinity of the Vaal River, of which the Blesbokspruit is a
tributary. Davies and Day (1998) report that the concentration of total
dissolved solids in the Vaal Dam is rising at a rate of 2.5 mg/L every year.
4.1.2 Alkalinity
The various processes affecting alkalinity according to Stumm and Morgan
(1996) are summarised in Table 4.1. The alkalinity of the Blesbokspruit is
lowest in the less polluted portions and increases downstream. This is
probably the result of the discharge of groundwater from flooded
underground workings in contact with dolomitic karst aquifers. In addition
CaC03 dissolution during liming, SQ42- reduction as well as denitrification
may also contribute to increased alkalinity in the wetland portion, according
to processes 6, 5 and 3 in Table 4.1. Both denitrification and sulphate reduction
consum organic matter. The higher organic carbon content of the main
wetland portion of the Blesbokspruit may therefore promote these two
processes.
In comparison, the method of Sarazin et al. (1999) is less time consuming than
the potentiometric titration. The greater error between these two methods at
alkalinities below 5 meq/L is probably the result of experimental error during
the poten tiometric titration.
34
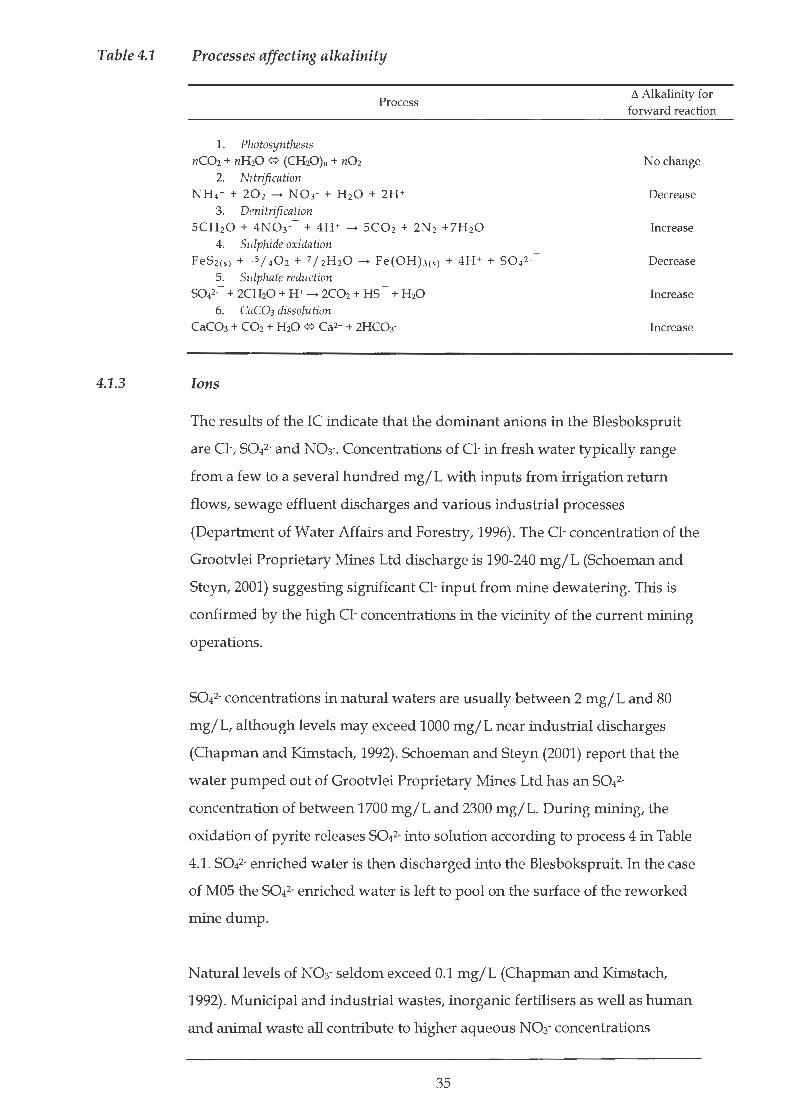
r· r
Table 4.1 Processes affecting alkalinity
1. Photosynthesis nC02 + nH20 ~ (CH20)" + n02
2. Nitrification
Process
NH4+ + 202 --+ N03· + H 20 + 2H+
3. Denitrification SCH20 + 4N03-- + 4H + --+ SC02 + 2N2 + 7H 20
4. Sulphide oxidation Fe52(sJ + 1 5 j 402 + 7 /2H20--+ Fe(OH)3<sl + 4H + + 504 2-
5. Sulphate reduction 5042-- + 2CH20 + H+ --+ 2C02 + H5-- + H20
6. CaC03 dissolution CaC03 + C02 + H20 ~ Ca2+ + 2HC03--
tJ. Alkalinity for forward reaction
No change
Decrease
Increase
Decrease
Increase
Increase
4.1.3 Ions
The results of the IC indicate that the dominant anions in the Blesbokspruit
are Cl-, 5042- and N03·. Concentrations of Cl- in fresh water typically range
from a few to a several hundred mg/L with inputs from irrigation return
flows, sew age effluent discharges and various industrial processes
(Department of Water Affairs and Forestry, 1996). The Cl- concentration of the
Grootvlei Proprietary Mines Ltd discharge is 190-240 mg/L (5choeman and
5teyn, 2001) suggesting significant Cl- input from mine dewatering. This is
confirmed by the high Cl- concentrations in the vicinity of the current mining
operations.
5042-concentrations in natural waters are usually between 2 mg/L and 80
mg/L, although levels may exceed 1000 mg/L near industrial discharges
(Chapman and Kimstach, 1992). 5choeman and 5teyn (2001) report that the
water pumped out of Grootvlei Proprietary Mines Ltd has an 5042-
concentration of between 1700 mg/L and 2300 mg/L. During mining, the
oxidation of pyrite releases 5042- into solution according to process 4 in Table
4.1. 5042- enriched water is then discharged into the Blesbokspruit. In the case
of MOS the 5042- enriched water is left to pool on the surface of the reworked
mine dump.
Natural levels of N03· seldom exceed 0.1 mg/L (Chapman and Kimstach,
1992). Municipal and industrial wastes, inorganic fertilisers as well as human
and animal waste all contribute to higher aqueous N03· concentrations
35
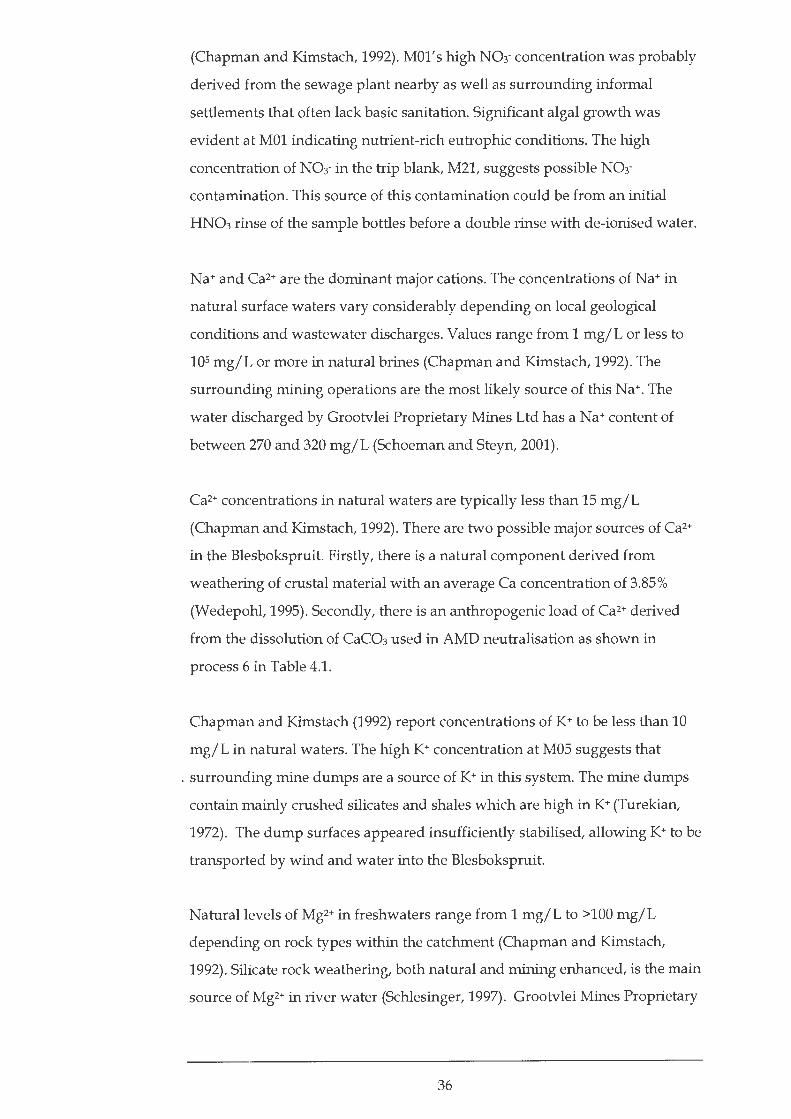
(Chapman and Kimstach, 1992). MOl's high N03-concentration was probably
derived from the sewage plant nearby as well as surrounding informal
settlements that often lack basic sanitation. Significant algal growth was
evident at MOl indicating nutrient-rich eutrophic conditions. The high
concentration of N03- in the trip blank, M21, suggests possible N03-
contamination. This source of this contamination could be from an initial
HN03 rinse of the sample bottles before a double rinse with de-ionised water.
Na+ and Ca2+ are the dominant major cations. The concentrations of Na+ in
natural surface waters vary considerably depending on local geological
conditions and wastewater discharges. Values range from 1 mg/L or less to
lOS mg/L or more in natural brines (Chapman and Kimstach, 1992). The
surrounding mining operations are the most likely source of this Na+. The
water discharged by Grootvlei Proprietary Mines Ltd has aNa+ content of
between 270 and 320 mg/L (Schoeman and Steyn, 2001).
Ca2+ concentrations in natural waters are typically less than 15 mg/L
(Chapman and Kimstach, 1992). There are two possible major sources of Ca2+
in the Blesbokspruit. Firstly, there is a natural component derived from
weathering of crustal material with an average Ca concentration of 3.85%
(Wedepohl, 1995). Secondly, there is an anthropogenic load of Ca2+ derived
from the dissolution of CaC03 used in AMD neutralisation as shown in
process 6 in Table 4.1.
Chapman and Kimstach (1992) report concentrations of K+ to be less than 10
mg/L in natural waters. The high K+ concentration at M05 suggests that
. surrounding mine dumps are a source of K+ in this system. The mine dumps
contain mainly crushed silicates and shales which are high inK+ (Turekian,
1972). The dump surfaces appeared insufficiently stabilised, allowing K+ to be
transported by wind and water into the Blesbokspruit.
Natural levels of Mg2+ in freshwaters range from 1 mg/L to >100 mg/L
depending on rock types within the catchment (Chapman and Kimstach,
1992). Silicate rock weathering, both natural and mining enhanced, is the main
source of Mg2+ in river water (Schlesinger, 1997). Grootvlei Mines Proprietary
36
Figure 4.1
Mines Ltd discharges water with 150-200 mg/L Mg2+ (Schoeman and Steyn,
2001).
Variation of Na/(Na+Ca) as a function of the total dissolved solids in the Blesbokspruit after Gibbs (1970) and Day and King (1995)
100000
10000
.......... __. --0> E .......... (/) 1000 :Q 0 (/)
u Q)
> 0 ~ 100 u 2 ~
10
Evaporation of rainfall dominatec
waters
0.0 0.1 0.2 0.3 0.4 0.5 0.6 0.7 0.8 0.9 1.0
Na/(Na+Ca)
• 11.{)1
• 11.{)2
• 11.{)3 . 1\.{)4 . 11.{)5 • 11.{)6
- 11.{)9
+ M10
• M11
• M12
lfi M13
M14
• M15
• M16
• M17
• M18
• M19
• M20
Figure 4.1. highlights the major mechanisms controlling water chemistry and
their effect on the water quality of the Blesbokspruit, which can be divided
into two distinct aquatic environments based on water chemistry. The first
environment represents the upper, less mining-influenced portion of the
stream and is made up of samples MOl, M02, M03, M04, M06, M07, MOB, M09,
MlO and Mll. The chemical composition of these waters is controlled by the
evaporation of precipitation-dominated waters (Gibbs, 1970, Day and King,
1995). This environment represents the almost natural"background"
signature of the Blesbokspruit.
The second environment is downstream of the first and is polluted by
industrial discharge, mainly from dewatering of underground mine workings.
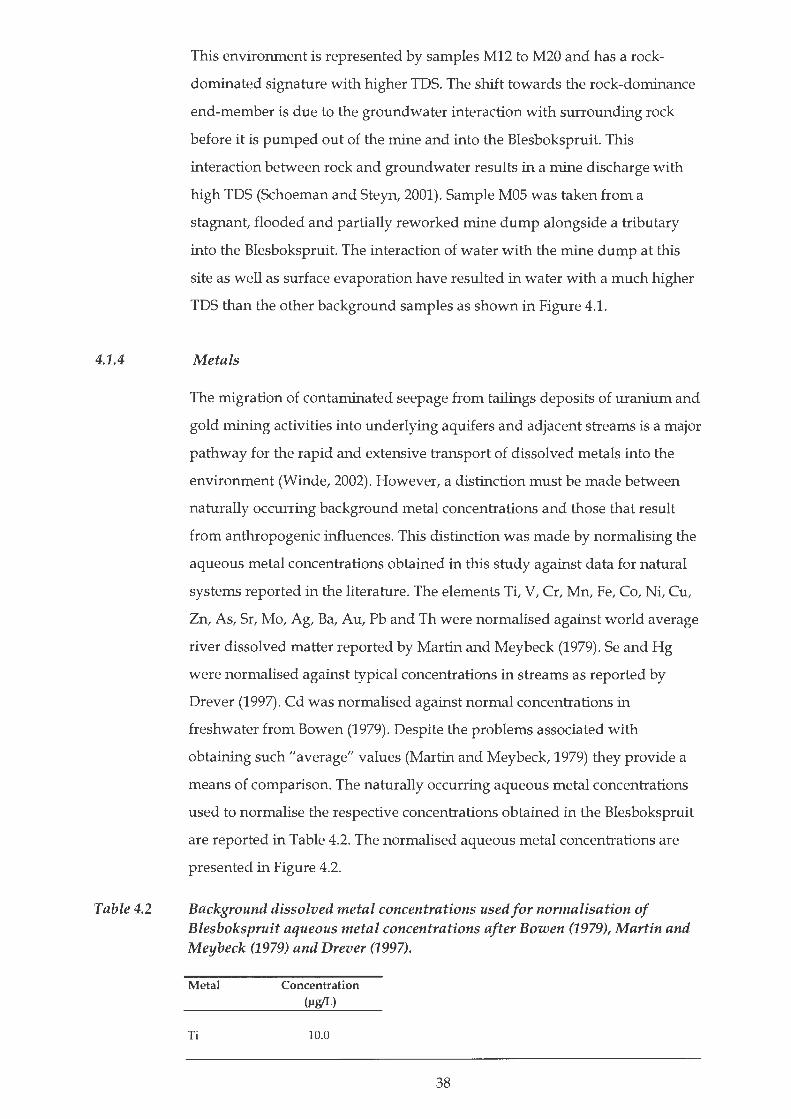
4.1.4
Table 4.2
This environment is represented by samples M12 to M20 and has a rock
dominated signature with higher TDS. The shift towards the rock-dominance
end-member is due to the groundwater interaction with surrounding rock
before it is pumped out of the mine and into the Blesbokspruit. This
interaction between rock and groundwater results in a mine discharge with
high TDS (Schoeman and Steyn, 2001). Sample MOS was taken from a
stagnant, flooded and partially reworked mine dump alongside a tributary
into the Blesbokspruit. The interaction of water with the mine dump at this
site as well as surface evaporation have resulted in water with a much higher
TDS than the other background samples as shown in Figure 4.1.
Metals
The migration of contaminated seepage from tailings deposits of uranium and
gold mining activities into underlying aquifers and adjacent streams is a major
pathway for the rapid and extensive transport of dissolved metals into the
environment (Winde, 2002). However, a distinction must be made between
naturally occurring background metal concentrations and those that result
from anthropogenic influences. This distinction was made by normalising the
aqueous metal concentrations obtained in this study against data for natural
systems reported in the literature. The elements Ti, V, Cr, Mn, Fe, Co, Ni, Cu,
Zn, As, Sr, Mo, Ag, Ba, Au, Pb and Th were normalised against world average
river dissolved matter reported by Martin and Meybeck (1979) . Se and Hg
were normalised against typical concentrations in streams as reported by
Drever (1997). Cd was normalised against normal concentrations in
freshwater from Bowen (1979). Despite the problems associated with
obtaining such "average" values (Martin and Meybeck, 1979) they provide a
means of comparison. The naturally occurring aqueous metal concentrations
used to normalise the respective concentrations obtained in the Blesbokspruit
are reported in Table 4.2. The normalised aqueous metal concentrations are
presented in Figure 4.2.
Background dissolved metal concentrations used for normalisation of Blesbokspruit aqueous metal concentrations after Bowen (1979), Martin and Meybeck (1979) and Drever (1997).
Metal Concentration (JJg/L)
Ti 10.0
38

, ~ r ~ ~ I ,
Metal Concentration (~!ifl)
v 1.0
Cr 1.0 Mn 8.2 Fe 40.0 Co 0.2 Ni 2.2 Cu 10.0 Zn 30.0 As 1.7 Se 0.2 Sr 60.0 Mo 0.5 Ag 0.3 Cd 0.1 Ba 60.0 Au 0.002
Hg 0.07 Pb 1.0
Th 0.1 u 0.04
The dissolved metal concentrations of the Blesbokspruit are significantly
influenced by the oxidation of sulphide minerals derived from the
Witwatersrand Supergroup. These minerals include allogenic pyrite (FeS2)
and sphalerite (ZnS) as well as authigenic chalcopyrite (CuFe~) and
pyrrhotite (Fe7Ss) (Robb and Meyer, 1995). Hawley (1972, in Forstner, 1981b)
reports some important metals in sulphides, namely: Co, Ni, Cu, Zn, As, Se,
Ag, Cd, Te, and Pb. With the exception of Cu, all these metals show some
degree of enrichment compared to natural or background values reported in
the literature, aside from Te which was not analysed in this study. Cu is
typically strongly associated with organic matter (Salomons and Forstner,
1980) which may be the cause of its lower aqueous concentrations. There is
thus strong evidence that the oxidation of the sulphide minerals, pyrite,
sphalerite, chalcopyrite and pyrrhotite mined from the Witwatersrand
Supergroup has enriched the Blesbokspruit in chalcophile metals. This
observation is supported by the work of Forstner and Wittmann (1976).
39
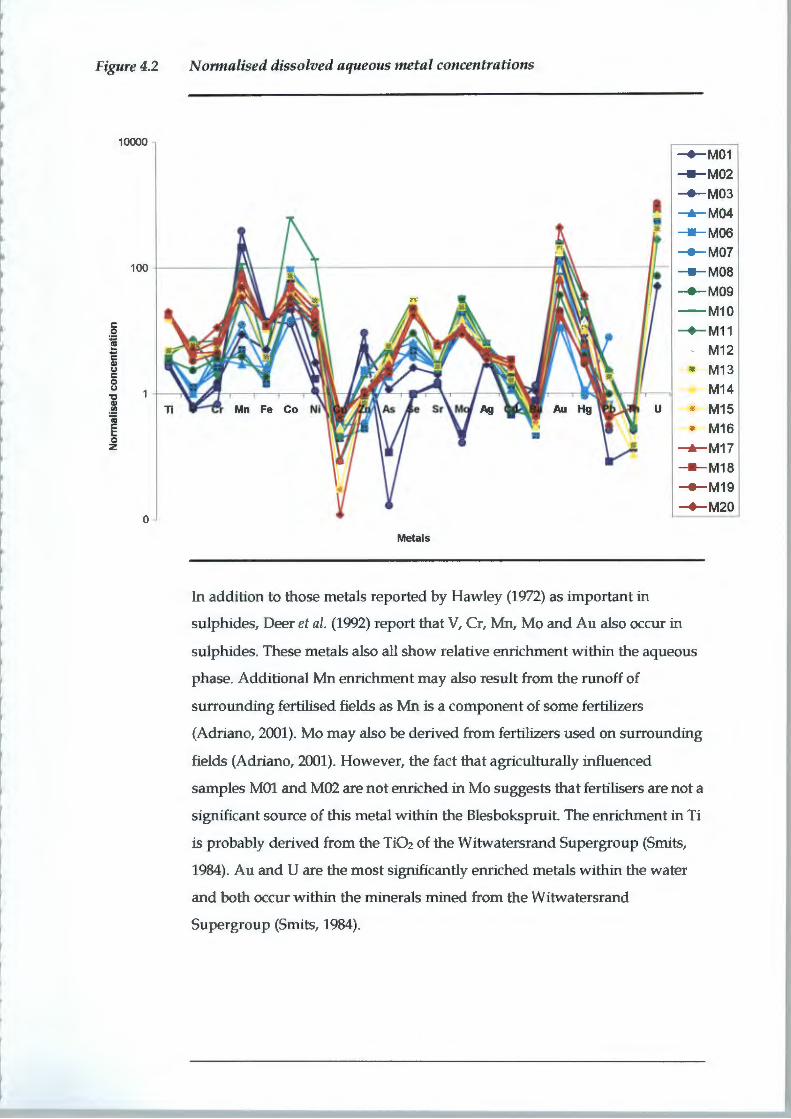
r
I I
Figure4.2
c 0
~ i: Gl u c 0 u
~ ii E 0 z
10000
Normalised dissolved aqueous metal concentrations
Metals
-.-M01
- M02 _._ M03
-*-M04
- M06 ---+- MO?
- M08 ........_. M09
- M10
_._ M11
M12 ~= M13
M14
== M15
- * M16
-*-M17
- M18 ........_. M19
_._ M20
In addition to those metals reported by Hawley (1972) as important in
sulphides, Deer et al. (1992) report that V, Cr, Mn, Mo and Au also occur in
sulphides. These metals also all show relative emichment within the aqueous
phase. Additional Mn enrichment may also result from the runoff of
surrounding fertilised fields as Mn is a component of some fertilizers
(Adriano, 2001). Mo may also be derived from fertilizers used on surrounding
fields (Adriano, 2001). However, the fact that agriculturally influenced
samples MOl and M02 are not enriched in Mo suggests that fertilisers are not a
significant source of this metal within the Blesbokspruit. The emichment inTi
is probably derived from the Ti02 of the Witwatersrand Supergroup (Smits,
1984). Au and U are the most significantly emiched metals within the water
and both occur within the minerals mined from the Witwatersrand
Supergroup (Smits, 1984).
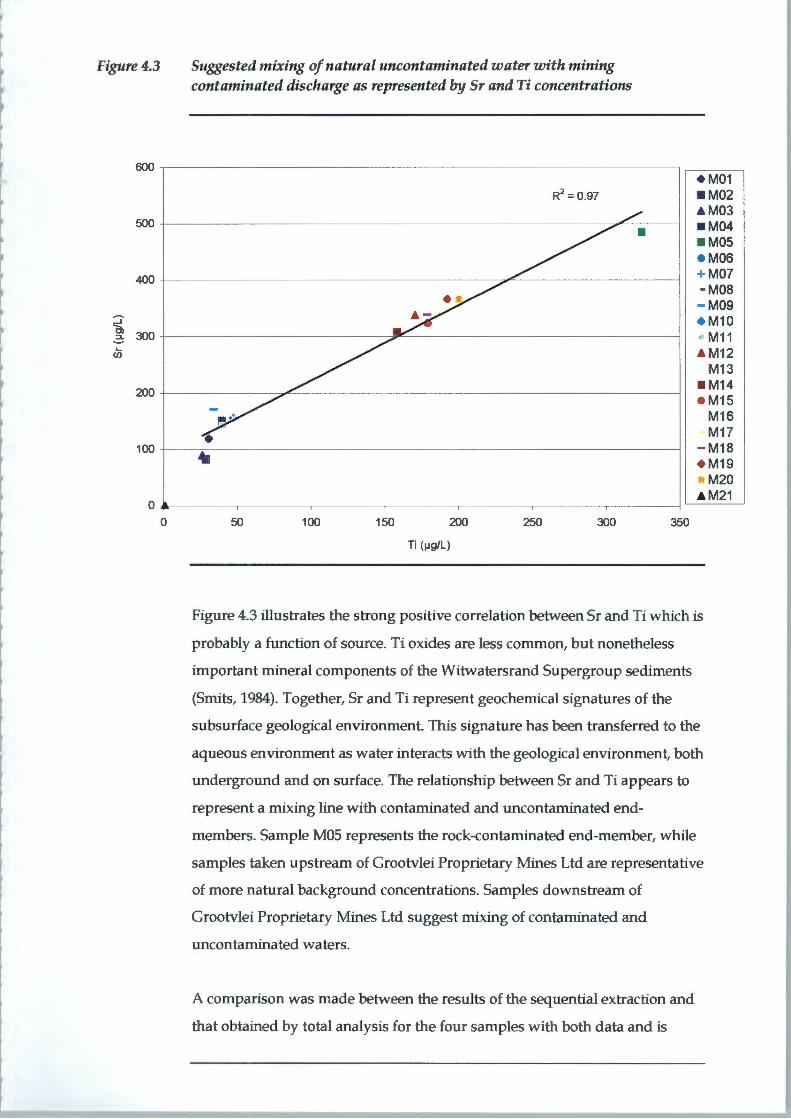
Figure4.3
600
500
400
::::;-c:n 300 :::1.
.... (j)
200
100
0 0
Suggested mixing of natural uncontaminated water with mining contaminated discharge as represented by Sr and Ti concentrations
R2 = 0.97
.. 50 100 150 200 250 300
Ti (IJg/L)
• M01 • M02 _. M03 • M04 • M05 e M06 + M07 - M08 - M09 • M10 ,,,, M11 _. M12
M13 • M14 e M15
M16 M17
- M18 • M19
M20 _.M21
350
Figure 4.3 illustrates the strong positive correlation between Sr and Ti which is
probably a function of source. Ti oxides are less common, but nonetheless
important mineral components of the Witwatersrand Supergroup sediments
(Smits, 1984). Together, Sr and Ti represent geochemical signatures of the
subsurface geological environment. This signature has been transferred to the
aqueous environment as water interacts with the geological environment, both
underground and on surface. The relationship between Sr and Ti appears to
represent a mixing line with contaminated and uncontaminated end
members. Sample MOS represents the rock-contaminated end-member, while
samples taken upstream of Grootvlei Proprietary Mines Ltd are representative
of more natural background concentrations. Samples downstream of
Grootvlei Proprietary Mines Ltd suggest mixing of contaminated and
uncontaminated waters.
A comparison was made between the results of the sequential extraction and
that obtained by total analysis for the four samples with both data and is

r r
r
4.2
4.2.1
Table 4.3
presented in Table 7.6 in the Appendix. This comparison suggests that in
general the metal concentrations sequentially extracted were less than the total
concentrations analysed. Experimental error during the extraction is the most
probable cause of this discrepancy.
SEDIMENT GEOCHEMISTRY
Metals
In order to determine potential anthropogenic enrichment in metal
concentrations of the Blesbokspruit sediment, measured concentrations were
normalised to average metal concentrations for the Vryheid Formation
determined by Azzie (2002). Over time, the Blesbokspruit has eroded through
the Vryheid Formation (Haskins, 1998). The metal concentrations of this
formation were therefore considered a useful representation of naturally
occurring background metal levels. Azzie (2002) did not, however, report data
for all the metals analysed in this study. Concentrations of Ti, Fe, As, Se, Ag,
Cd, Au and Hg were therefore normalised to metal concentrations of average
crustal shale reported by Turekian (1972). The values of Turekian (1972) are
not necessarily representative of the Vryheid Formation, but in the absence of
other data, serve as a proxy. The normalised data are plotted in Figure 4.4.
Metal concentrations of average Vryheid Formation (Azzie, 2002) and average crustal shale (Turekian, 1972) used for normalisation of Blesbokspruit sediment metal concentrations
Metal Concentration (mglkg)
Ti 4600.0 v 29.9 Cr 104.6 Mn 271.6 Fe 47200.0
Co 9.8 Ni 36.1 Cu 16.9 Zn 97.7 As 13.0 Se 0.6 Sr 123.6 Zr 256.6 Mo 1.9 Ag 0.07
Cd 0.3 Ba 547.6
Au 0.005
42
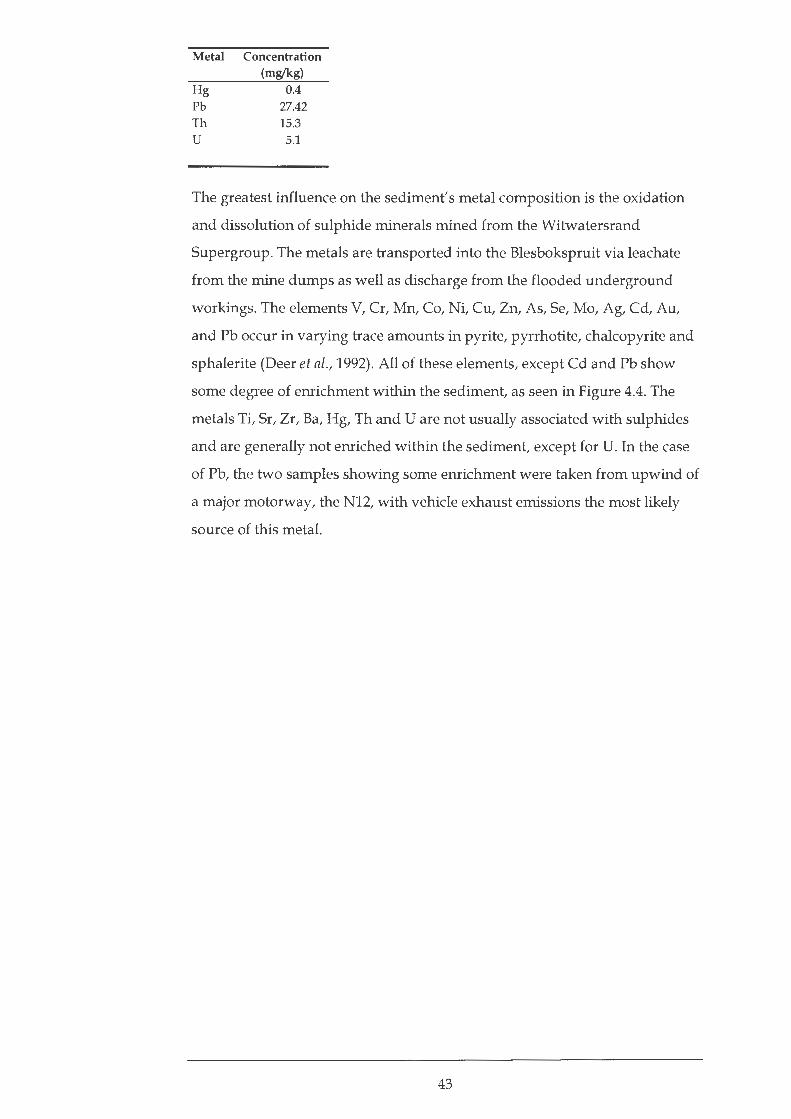
Metal Concentration (m&'kg)
Hg 0.4
Pb 27.42
Th 15.3 u 5.1
The greatest influence on the sediment's metal composition is the oxidation
and dissolution of sulphide minerals mined from the Witwatersrand
Supergroup. The metals are transported into the Blesbokspruit via leachate
from the mine dumps as well as discharge from the flooded underground
workings. The elements V, Cr, Mn, Co, Ni, Cu, Zn, As, Se, Mo, Ag, Cd, Au,
and Pb occur in varying trace amounts in pyrite, pyrrhotite, chalcopyrite and
sphalerite (Deer et al., 1992). All of these elements, except Cd and Pb show
some degree of enrichment within the sediment, as seen in Figure 4.4. The
metals Ti, Sr, Zr, Ba, Hg, Th and U are not usually associated with sulphides
and are generally not enriched within the sediment, except for U. In the case
of Pb, the two samples showing some enrichment were taken from upwind of
a major motorway, the N12, with vehicle exhaust emissions the most likely
source of this metal.
43
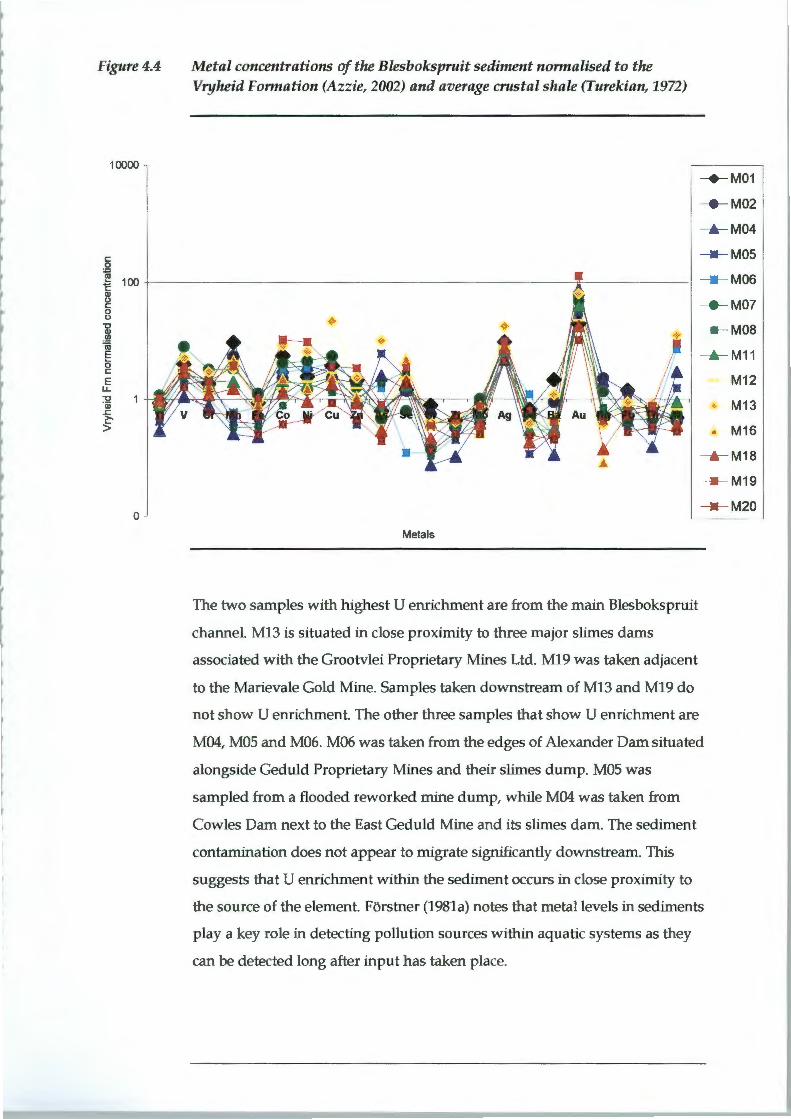
Figure 4.4
10000
c: 0
~ 100 c Q) 0 c: 0 0 -o Q)
-~ Iii E 0 c: E
LL -o ·a; .r: ~ >
0
Metal concentrations of the Blesbokspruit sediment normalised to the Vryheid Formation (Azzie, 2002) and average cnlstal shale (Turekian, 1972)
-+-M01
--- M02
---.- M04
-JI- MOS
--- M06
M07
M12
M13
.. M16
____.._ M18
-JI- M19
---M20
Metals
The two samples with highest U enrichment are from the main Blesbokspruit
channel. M13 is situated in close proximity to three major slimes dams
associated with the Grootvlei Proprietary Mines Ltd. M19 was taken adjacent
to the Marievale Gold Mine. Samples taken downstream of M13 and M19 do
not show U enrichment. The other three samples that show U enrichment are
M04, MOS and M06. M06 was taken from the edges of Alexander Dam situated
alongside Geduld Proprietary Mines and their slimes dump. MOS was
sampled from a flooded reworked mine dump, while M04 was taken from
Cowles Dam next to the East Geduld Mine and its slimes dam. The sediment
contamination does not appear to migrate significantly downstream. This
suggests that U enrichment within the sediment occurs in close proximity to
the source of the element. Forstner (1981a) notes that metal levels in sediments
play a key role in detecting pollution sources within aquatic systems as they
can be detected long after input has taken place.
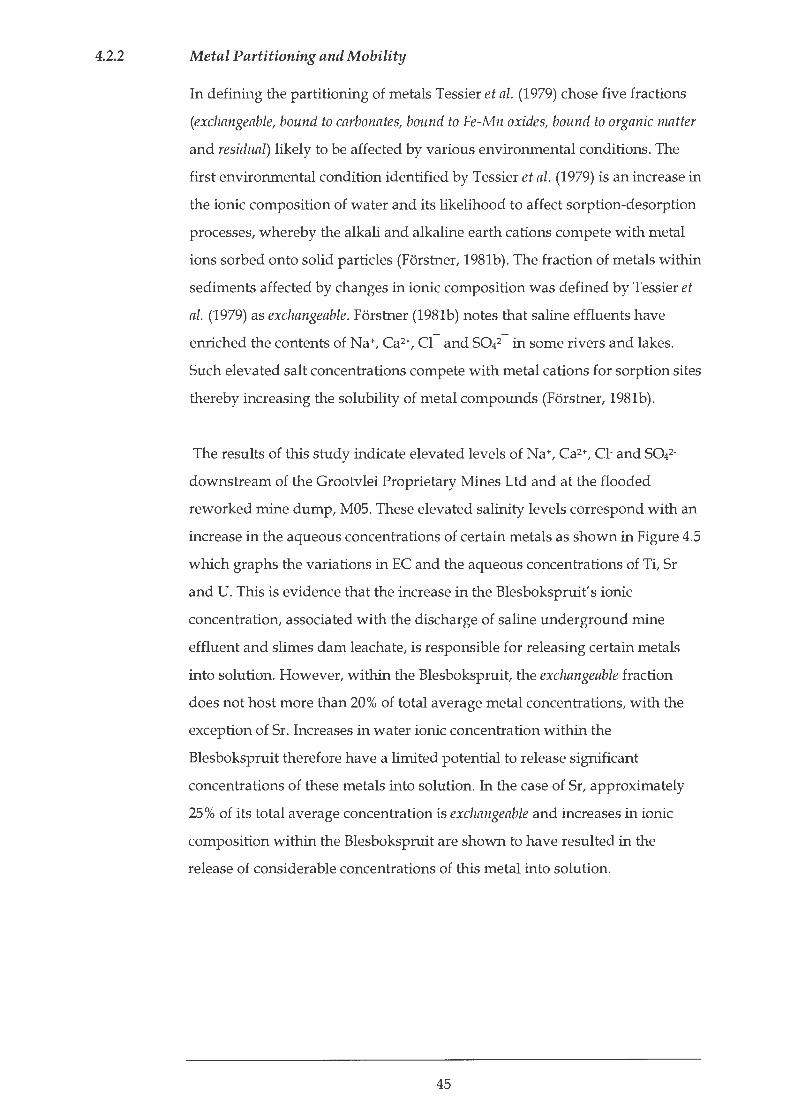
4.2.2
r
I r
f
Metal Partitioning and Mobility
In defining the partitioning of metals Tessier et al. (1979) chose five fractions
(exchangeable, bound to carbonates, bound to Fe-Mn oxides, bound to organic matter
and residual) likely to be affected by various environmental conditions. The
first environmental condition identified by Tessier et al. (1979) is an increase in
the ionic composition of water and its likelihood to affect sorption-desorption
processes, whereby the alkali and alkaline earth cations compete with metal
ions sorbed onto solid particles (Forstner, 1981b). The fraction of metals within
sediments affected by changes in ionic composition was defined by Tessier et
al. (1979) as exchangeable. Forstner (1981b) notes that saline effluents have - -
emiched the contents of Na+, Ca2+, Cl and SQ42 in some rivers and lakes.
Such elevated salt concentrations compete with metal cations for sorption sites
thereby increasing the solubility of metal compounds (Forstner, 1981b).
The results of this study indicate elevated levels of Na+, Ca2+, Cl- and SQ42-
downstream of the Grootvlei Proprietary Mines Ltd and at the flooded
reworked mine dump, MOS. These elevated salinity levels correspond with an
increase in the aqueous concentrations of certain metals as shown in Figure 4.5
which graphs the variations in EC and the aqueous concentrations of Ti, Sr
and U. This is evidence that the increase in the Blesbokspruit' s ionic
concentration, associated with the discharge of saline underground mine
effluent and slimes dam leachate, is responsible for releasing certain metals
into solution. However, within the Blesbokspruit, the exchangeable fraction
does not host more than 20% of total average metal concentrations, with the
exception of Sr. Increases in water ionic concentration within the
Blesbokspruit therefore have a limited potential to release significant
concentrations of these metals into solution. In the case of Sr, approximately
25% of its total average concentration is exchangeable and increases in ionic
composition within the Blesbokspruit are shown to have resulted in the
release of considerable concentrations of this metal into solution.
45
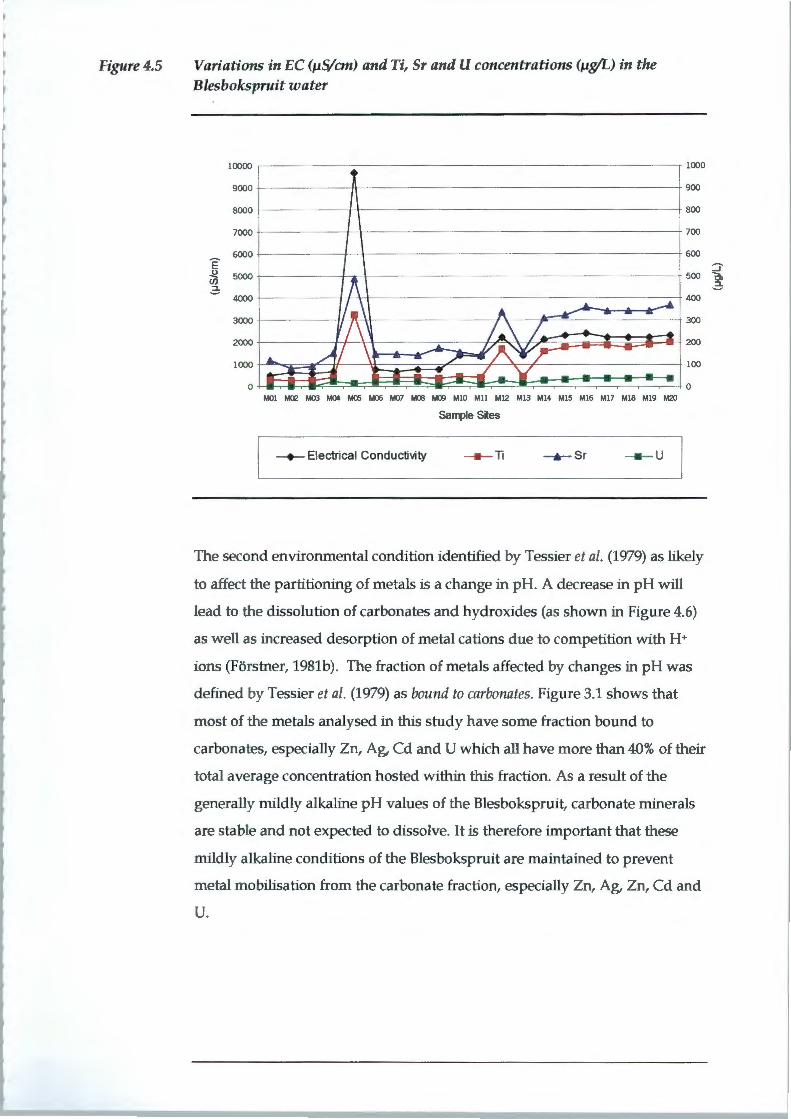
Figure4.5 Variations in EC (IJS/cm) and Ti, Sr and U concentrations (IJ}V'L) in the Blesbokspruit water
10000 ,---------~--------------------------------------~ 1000
9000 ~--------~~------------------------------------, 900
8000 ~---------+~------------------------------------, 800
7000 ~--------~+-------------------------------------~ 700
6000 ~--------4-4-------------------------------------, 600 ~E ~
-::! ~ 5000 ~--------+~ft~----------------------------------_, 500 rn
~ 1\ ~ 4000 ~--------~~,~,+----------------------------------~ ~, 400
I • \ A ~-..._----..-....~--3ooo ~------~~~--------------~~--~~------------~ 3oo
2000 ~----~·;~·\~----~--~~~-~\~~.-~-~~~~~~~~ 200 10000 G ... ~~/~tf:::J\~f~-~j-~-..... , -~~~~A:;:~~:r-;;~~~---~~~ 100 ........,. ..-. _J ..... _¥ -
- 0 MOl M02 M03 M04 M05 M06 M07 MOO M09 Ml O Mll Ml2 M13 Ml 4 Ml 5 Ml6 Ml7 Ml8 Ml9 M20
Salll>le Sites
-+-Electrical Conductivity ------ Ti
---....- Sr ---- u
The second environmental condition identified by Tessier et al. (1979) as likely
to affect the partitioning of metals is a change in pH. A decrease in pH will
lead to the dissolution of carbonates and hydroxides (as shown in Figure 4.6)
as well as increased desorption of metal cations due to competition with H+
ions (Forstner, 1981b). The fraction of metals affected by changes in pH was
defined by Tessier et al. (1979) as bound to carbonates. Figure 3.1 shows that
most of the metals analysed in this study have some fraction bound to
carbonates, especially Zn, Ag, Cd and U which all have more than 40% of their
total average concentration hosted within this fraction . As a result of the
generally mildly alkaline pH values of the Blesbokspruit, carbonate minerals
are stable and not expected to dissolve. It is therefore important that these
mildly alkaline conditions of the Blesbokspruit are maintained to prevent
metal mobilisation from the carbonate fraction, especially Zn, Ag, Zn, Cd and
U.
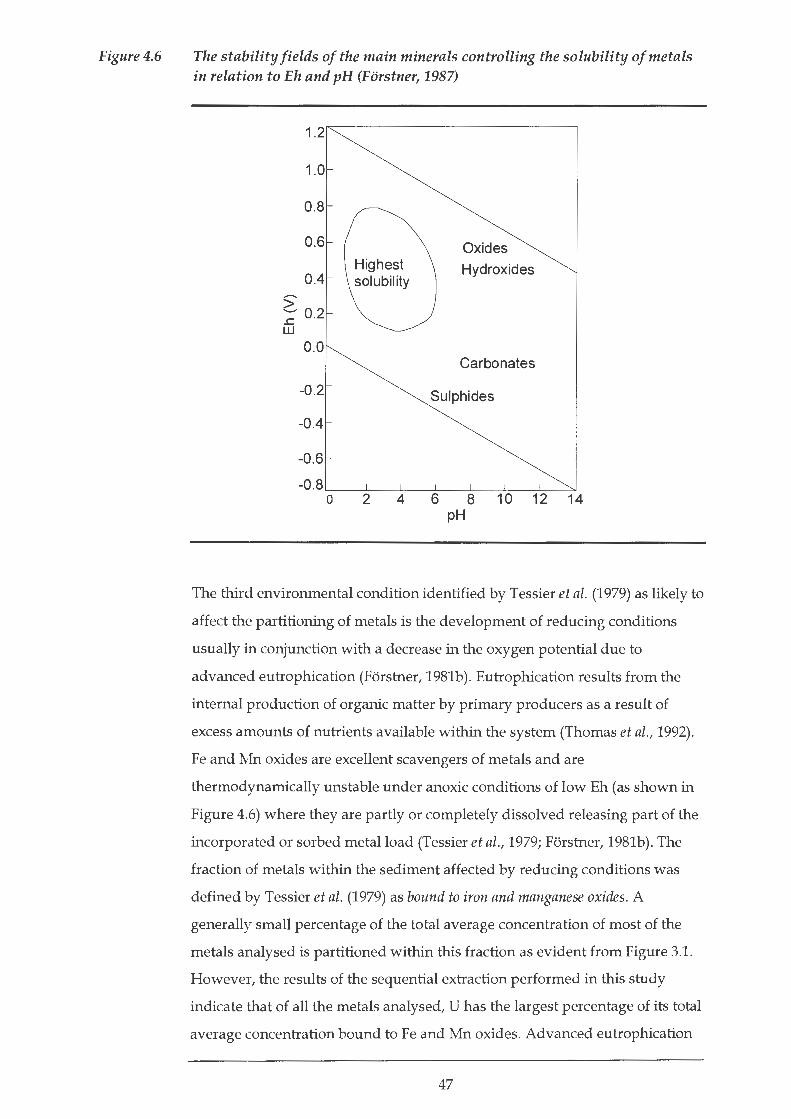
Figure4.6 The stability fields of the main minerals controlling the solubility of metals in relation to Eh and pH (Forstner, 1987)
Oxides
Hydroxides
Carbonates
Sulphides
The third environmental condition identified by Tessier et al. (1979) as likely to
affect the partitioning of metals is the development of reducing conditions
usually in conjunction with a decrease in the oxygen potential due to
advanced eutrophication (Forstner, 1981b). Eutrophication results from the
internal production of organic matter by primary producers as a result of
excess amounts of nutrients available within the system (Thomas et al., 1992).
Fe and Mn oxides are excellent scavengers of metals and are
thermodynamically unstable under anoxic conditions of low Eh (as shown in
Figure 4.6) where they are partly or completely dissolved releasing part of the
incorporated or sorbed metal load (Tessier et al., 1979; Forstner, 1981b). The
fraction of metals within the sediment affected by reducing conditions was
defined by Tessier et al. (1979) as bound to iron and manganese oxides. A
generally small percentage of the total average concentration of most of the
metals analysed is partitioned within this fraction as evident from Figure 3.1.
However, the results of the sequential extraction performed in this study
indicate that of all the metals analysed, U has the largest percentage of its total
average concentration bound to Fe and Mn oxides. Advanced eutrophication
47
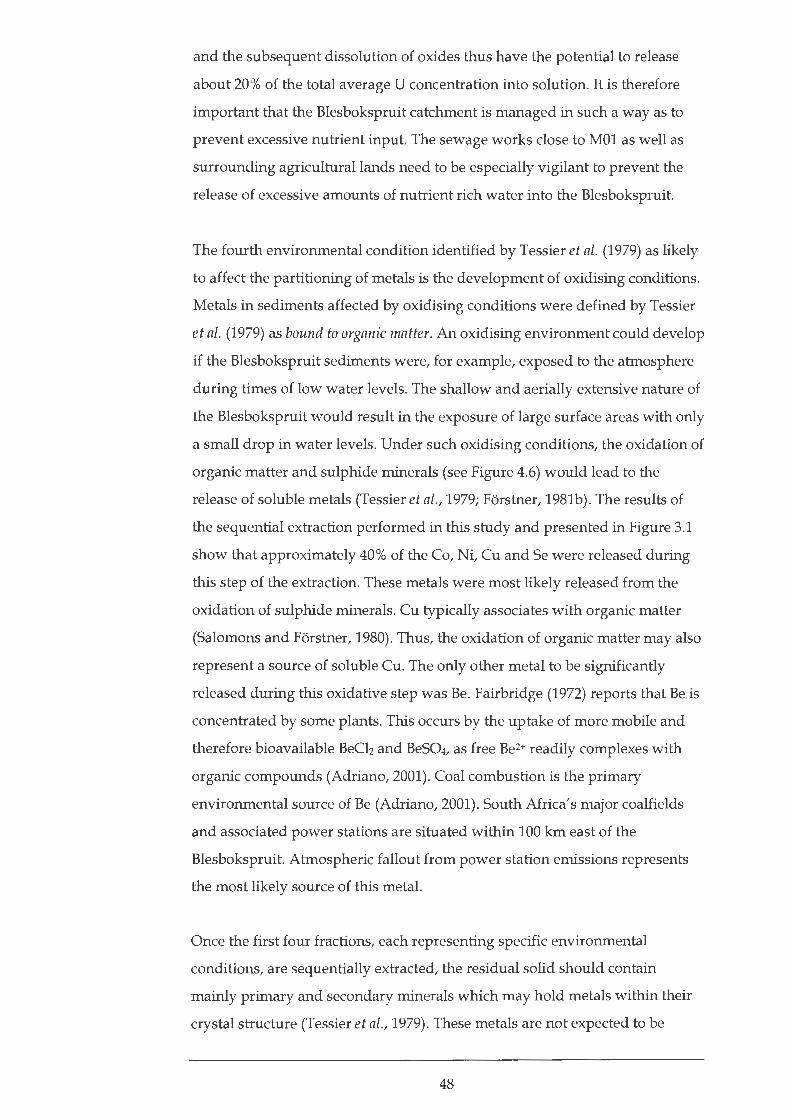
and the subsequent dissolution of oxides thus have the potential to release
about 20% of the total average U concentration into solution. It is therefore
important that the Blesbokspruit catchment is managed in such a way as to
prevent excessive nutrient input. The sewage works close to MOl as well as
surrounding agricultural lands need to be especially vigilant to prevent the
release of excessive amounts of nutrient rich water into the Blesbokspruit.
The fourth environmental condition identified by Tessier et al. (1979) as likely
to affect the partitioning of metals is the development of oxidising conditions.
Metals in sediments affected by oxidising conditions were defined by Tessier
et al. (1979) as bound to organic matter. An oxidising environment could develop
if the Blesbokspruit sediments were, for example, exposed to the atmosphere
during times of low water levels. The shallow and aerially extensive nature of
the Blesbokspruit would result in the exposure of large surface areas with only
a small drop in water levels. Under such oxidising conditions, the oxidation of
organic matter and sulphide minerals (see Figure 4.6) would lead to the
release of soluble metals (Tessier et al., 1979; Forstner, 1981b). The results of
the sequential extraction performed in this study and presented in Figure 3.1
show that approximately 40% of the Co, Ni, Cu and Se were released during
this step of the extraction. These metals were most likely released from the
oxidation of sulphide minerals. Cu typically associates with organic matter
(Salomons and Forstner, 1980). Thus, the oxidation of organic matter may also
represent a source of soluble Cu. The only other metal to be significantly
released during this oxidative step was Be. Fairbridge (1972) reports that Be is
concentrated by some plants. This occurs by the uptake of more mobile and
therefore bioavailable BeCh and BeS04, as free Be2+ readily complexes with
organic compounds (Adriano, 2001). Coal combustion is the primary
environmental source of Be (Adriano, 2001). South Africa' s major coalfields
and associated power stations are situated within 100 km east of the
Blesbokspruit. Atmospheric fallout from power station emissions represents
the most likely source of this metal.
Once the first four fractions, each representing specific environmental
conditions, are sequentially extracted, the residual solid should contain
mainly primary and secondary minerals which may hold metals within their
crystal structure (Tessier et al. , 1979). These metals are not expected to be
48
released into solution over a reasonable time span under the conditions
normally encountered in nature (Tessier et al., 1979). The results of the
sequential extraction (Figure 3.1) indicate that a number of metals have a
significant portion of their total average concentration partitioned within this
residual fraction. Ti and Zr are almost entirely partitioned within this fraction.
Zircon (ZrSi04) is a common accessory mineral in many types of sediment,
often surviving more than one cycle of weathering and sedimentation (Deer et
al., 1992). This suggests that zircon is not easily weathered, preventing Zr from
being released. Similarly, Ti oxide minerals are mostly resistant to weathering
(Force, 1991) confirming the evidence of the sequential extraction. In general,
the residual fraction contains the greatest percentage of the analysed metal's
total average concentration.
49
5 CONCLUSIONS
As a result of the surrounding mining and industrial activities, the
Blesbokspruit has been altered from a once meandering stream circa 1930 into
an essentially artificial wetland with a high pollution load. The polluted status
of the Blesbokspruit has potential negative consequences for its users which
include a variety of important bird species as well as humans.
The water quality of the Blesbokspruit has been significantly influenced by the
surrounding mining activities. The downstream increase in electrical
conductivity is the result of massive daily discharge of saline effluent from the
flooded underground workings of surrounding gold and uranium mines. This
saline effluent has enriched the lower stretches of the Blesbokspruit in the
anions Cl- and 5042- as well as the major cations, Na+, K+, Ca2+ and Mg2+,
imparting an artificial mining-induced rock dominated signature on the
natural evaporation of rainfall-dominated waters signature. The naturally
alkaline nature of the Blesbokspruit is the result of the underlying dolomites
of the Chuniespoort Group but may be enhanced by the addition of lime to
neutralise acid mine drainage.
The oxidation of sulphide minerals mined from the Witwatersrand
Supergroup has enriched the sediments and waters of the Blesbokspruit in
chalcophile metals as well as U. This enrichment was quantified relative to
metal concentrations for natural water and the surrounding geology reported
in the literature. The bioavailability of metals in the environment is dependent
on their partitioning and mobility. For this reason the sequential extraction of
Tessier et al. (1979) was performed on the sediments of the Blesbokspruit.
The results of the sequential extraction indicate that a relatively minor
proportion of the metals analysed are exchangeable and subject to changes in
the water's ionic composition. However, high salinity effluent discharged
from the Grootvlei Proprietary Mines Ltd is responsible for displacing Sr, Ti
and to a lesser extent U cations from their sorption sites resulting in their
higher aqueous concentrations downstream of the mine's discharge.
50
The sequential extraction results show that most of the metals analysed in this
study have some fraction of their total average concentration hosted by the
pH-sensitive bound to carbonate fraction, especially Zn, Ag, Cd and U. Any
decrease in pH from the mildly alkaline conditions measured at the time of
sampling will release varying amounts of these and other metals into solution.
A generally small percentage of the total average concentration of most of the
metals analysed is partitioned within the redox-sensitive bound to iron and
manganese oxides. However, the results indicate that approximately 20% of the
total average U concentration is partitioned within this fraction and would
therefore be susceptible to changes in the redox conditions. The onset of
reducing conditions and a decrease in oxygen potential can be caused by
advanced eutrophication due to excessive nutrient input.
The development of oxidising conditions was the fourth environmental
condition identified by Tessier et al. (1979) to affect the partitioning and
mobility of metals. Approximately 40 % of the total average concentrations of
Co, Ni and Cu were released during this step of the sequential extraction. The
development of oxidising conditions during times of low water levels would
result in the release of Co, Ni and Cu as well as other metals into solution.
Some metals, especially Ti, V, Cr, Fe, Zr and Th, have a significant proportion
of their concentration partitioned within the residual phase and are essentially
unavailable to the environment over a reasonable time span and under
conditions normally encountered in nature.
51
6 REFERENCES
Adriano, D.C. (2001) Trace Elements in Terrestrial Environments. Springer
Verlag, New York. 867 pp.
Azzie, B.A. (2002) Coal mine waters in South Africa: their geochemistnj, qualihj and
classification. PhD thesis. University of Cape Town.
Barnard, H . C. (2000) An Explanation of the 1:500 000 General Hydrogeological
Map Johannesburg 2526. Department of Water Affairs and Forestry, Pretoria.
84pp.
Bourg, A.C.M. (1995) Speciation of heavy metals in soils and groundwater and
implications for their natural and provoked mobility. In: Salomans, W.,
Forstner, U. and Mader, P. (Eds) Heavy Metals. Springer, Berlin. pp. 19-32.
Bowen, H.J.M. (1979) Environmental Chemistnj of the Elements. Academic Press,
New York. 333 pp.
Chapman, D. and Kimstach, V. (1992) The selection of water quality variables.
In: Chapman, D. (Ed) Water QualihJ Assessments. Chapman & Hall, London.
pp. 51-119.
Clesceri, L.S., Greenberg, A.E and Eaton, A.D. (1998) Standard Methods for the
Examination of Water and Wastewater. American Public Health Association,
Washington.
Clevenger, T.E. (1990) Use of sequential extraction to evaluate the heavy
metals in mining wastes. Water, Air and Soil Pollution, 59, 241-254.
Coetzee, P.P. (1993) Determination and speciation of heavy metals in
sediments of the Hartebeesport Dam by sequential chemical extraction. Water
SA, 19, 291-300.
52

Davidson, C.M., Thomas, R.P., McVey, S.E., Perala, R., Littlejohn, D. and Ure,
A.M. (1994) Evaluation of a sequential extraction procedure for the speciation
of heavy metals in sediments. Analytica Chimica Acta, 291, 277-286.
Davies, B. and Day, J. (1998) Vanishing Waters. University of Cape Town Press,
Cape Town. 487 pp.
Day, J.A. and King, J.M. (1995) Geographical patterns, and their origins, in the
dominance of major ions in South African rivers. South African Journal of
Science, 91(6), 299-306.
Deer, W.A., Howie, R.A. and Zussman, J. (1992) The Rock Forming Minerals.
Second Edition. Longman Group Limited, Harlow. 696 pp.
Department of Water Affairs and Forestry (1996) Volume 7: Aquatic
ecosystems. In: Holmes, S. (Ed) South African Water QualitJj Guidelines, First
Edition. 145 pp.
Dhoum, R.T., Evans, G.J. (1998) Evaluation of uranium and arsenic retention
by soil from a low level radioactive waste management site using sequential
extraction. Applied Geochemistn;, 13, 415 - 420.
Drever, J.I. (1997) The Geochemistn; of Natural Waters. 3rct Edition. Prentice-Hall,
New Jersey. 436pp.
Duane, M.J., Pigozzi, G. and Harris, C. (1997) Geochemistry of some deep gold
mine waters from the western portion of the Witwatersrand Basin, South
Africa. Journal of African Earth Science, 24, 105-123.
Fairbridge, R.W. (1972) The Encyclopaedia ofGeochemistn; and Environmental
Sciences. Van Nostrand Reinhold Company, New York. 1321 pp.
Force, E.R. (1991) Geology ofTitanium-Mineral Deposits. Special Paper 259. The
Geological Society of America, Inc., Colorado. 112 pp.
Forstner, U. and Kersten, M. (1988) Assessment of metal mobility in
53
dredged material and mine waste by pore water chemistry and
solid speciation. In: Salomons, W. and Forstner, U. (Eds) Chemistnj
and biology of solid waste. Springer, Berlin.
Forstner, U and Wittmann, G.T.W. (1976) Metal accumulations in acidic
waters from gold mines in South Africa. Geoforum, 7, 41-49.
Forstner, U and Wittmann, G.T.W. (1981) Metal Pollution in the Aquatic
Environment. 2nd Revised Edition. Spriner-Verlag, Berlin. 485 pp.
Forstner, U. (1981a) Metal pollution assessment from sediment analysis. In:
Forstner, U and Wittmann, G.T.W. (Eds) Metal Pollution in the Aquatic
Environment. 2nd Revised Edition. Spinger-Verlag, Berlin. pp. 110-196.
Forstner, U. (1981b) Metal transfer between solid and aqueous phases. In:
Forstner, U and Wittmann, G.T.W. (Eds) Metal Pollution in the Aquatic
Environment. 2nd Revised Edition. Spinger-Verlag, Berlin. pp. 197-270.
Forstner, U. (1987) Changes in metal mobilities in aquatic and terrestrial
cycles. In: Patterson, J.W. and Passino, R. (Eds) Metals Speciation, Separation,
and RecovenJ.
Gibbs, R.J. (1970) Mechanisms controlling world water chemistry. Science, 170,
1088-1090.
Gibbs, R.J. (1973) Mechanisms of trace metal transport in rivers. Science, 180,
71-73.
Gladney, E.S. and Roelandts, I. (1988) 1987 compilation of elemental
concentration data for USGS BHV0-1, MAG-1, QL0-1, RGM-1, SCo-1, SGR-1,
and STM-1, Geostandards Newsletter, 12, 253-362.
Govindaraju, K. (1994) 1994 compilation of working values and sample
description for 383 geostandards. Geostandards Newsletter, 18, Special Issue, 1-
158.
54
Greef, M. (1996) Blesbokspruit and Grootvlei- a disastrous relationship.
Conserua, 11, 9-10 & 24.
Haskins, C. (1998) BlesbokspruitSouth Africa. Information sheet for the site
designated to the list of wetlands of international importance in terms of the
convention on wetlands of international importance especially as waterfowl
habitat. Gauteng Nature Conservation.
Hawley, J.R. (1972) The problem of acid mine drainage in the province of
Ontario. Ontario Water Resources Commission, Toronto.
Huerta-Diaz, M.A., Tessier, A. and Carignan, R. (1998) Geochemistry of trace
metals associated with reduced sulfur in freshwater sediments. Applied
Geochemistnj, 12, 213-233.
Kent, L.E. (1980). Note on "Witwatersrand Triad". In: A. de Grys (Ed)
Stratigraphy of South Africa. Handbook 8. Part 1: Lithostratigraphy of the
Republic of South Africa, South West Africa/ Namibia and the Republics of
Bophuthatswana, Transkei and Venda. The South African Committee for
Stratigraphy. Geological Survey. Department of Mineral and Energy Affairs.
Pretoria.
Kheboian, C and Bauer, C.F. (1987) Accuracy of selective extraction
procedures for metal speciation in model aquatic sediments. Analytical
Chemistnj , 59, 1417-1423.
Lake, D.L., Kirk, P.W.W. and Lester, J.N. (1984) Fractionation, characterisation,
and speciation of heavy metals in sewage sludge and sludge-amended soils: a
review. Journal of Environmental Qualihj, 13, 175-183.
Langmuir, D. (1978) Uranium solution-mineral equilibria at low temperatures.
Geochimica et Cosmochimica Acta, 42, 547-569.
Martin, J. and Meybeck, M. (1979) Elemental mass-balance of material carried
by major world rivers. Marine Chemistnj, 7, 173-206.
55
Martin, J.M., Nirel, P. and Thomas, A.J. (1987) Sequential extraction
techniques: promises and problems. Marine Chemistn;, 22,313-341.
McBride, M.B. (1994) Environmental Chemistn; of Soils. Oxford University Press,
Oxford. 406 pp.
Moore, D.M. and Reynolds, Jr., R.C. (1997) X-ray Diffraction and the
Identification and Analysis of Clay Minerals. 2nd Edition. Oxford University Press,
Oxford. 378 pp.
Morillo, J., Usero, J. and Gracia, I. (2002) Partitioning of metals from the Odiel
River (Spain). Environment International, 28, 263-271.
Noller, B.N., Watters, R.A., Woods, P.H. (1997) The role of biogeochemical
processes in minimising uranium dispersion form a mine site. Journal of
Geochemical Exploration, 58, 37- 50.
Non-Affliated Soil Analysis Working Committee (1990) Handbook of Standard
Soil Testing Methods for Advison; Purposes. Soil Science Society of South Africa,
Pretoria.
Owen, D.E., Otton, J.K. (1995) Mountain wetlands: efficient uranium filters
potential impacts. Ecological Engineering, 5, 77- 93.
Prohic, E and Kniewald, G. (1987) Heavy metal distribution in recent
sediments of the Krka rive estuary- an example of sequential extraction
analysis. Marine Chemistn;, 22, 279-297.
Rapin, F., Tessier, A. Campbell, P.G.C., Carignan, R. (1986) Potential artefacts
in the determination of metal partitioning in sediments by a sequential
extraction procedure. Environmental Science and Technology, 20, 836-840
Reddy, K.R., D'Angelo, E.M. and Harris, W.G. (2000) Biogeochemistry of
Wetlands. In: Sumner, M.E. (Ed) Handbook of Soil Science. CRC Press, Boca
Raton. pp. G-89- G-119.
56
Robb, L.J. and Meyer, F.M. (1995) The Witwatersrand Basin, South Africa:
Geological framework and mineralisation processes. Ore Geology Reviews, 10,
67-94.
Salomons, W. and Forstner, U. (1980) Trace metal analysis of polluted
sediments. Environmental and Technology Letters, 1, 506-517.
Sarazin, G., Michard, G. and Prevot, F. (1999) A rapid and accurate
spectroscopic method for alkalinity measurements in sea water samples. Water
Research, 33, 290-294.
Saxby, J.D. (1973) Diagenesis of metal-organic complexes in sediments:
formation of metal sulphides from cystine complexes. Chemical Geologtj, 12,
241-248.
Schlesinger, W.H. (1997) Biogeochemistnj- An Analysis of global change. 2nct
Edition, Academic Press, San Diego. 588 pp.
Schoeman, J.J. and Steyn, A. (2001) Investigation into alternative water
treatment technologies for the treatment of underground mine water
discharged by Grootvlei Proprietary Mines Ltd into the Blesbokspruit in South
Africa. Desalination, 133, 13-30.
Seiler, K-P., Graf, W., Lang, H. and Zapata, R. (2002) Groundwater flow
systems and the export of uranium from nuclear waste repositories to the
biosphere. In: Merkel, B.J., Planer-Friedrich, B. and Wolkersdorfer, C. (Eds)
Uranium Mining and Hydrogeology III, 15 September - 21 September 2002,
Freiberg, Germany. pp. 221-230.
Singer, P.C. (1977) Influence of dissolved organics on the distribution,
transport, and fate of heavy metals in aquatic systems. In: Suffet, I.H (Ed) Fate
of Pollutants in the air and Water Environment. Part 1.Wiley, New York. pp.
155-182.
Smits, G. (1984) Some aspects of the uranium minerals in Witwatersrand
sediments of the early Proterozoic. Precambrian Research, 25, 37-59.
57
Stumm, W. and Morgan, J.J. (1996) Aquatic Chemistn;- Chemical Equilibria and
Rates in Natural Waters. 3rct Edition. John Wiley & Sons, Inc, New York. 1022
pp.
Tessier, A., Campbell, P.G.C. and Bisson, M. (1979) Sequential extraction
procedure for the speciation of particulate trace metals. Analytical Chemistn;,
51, 844-851.
Thomas, R., Meybeck, M. and Beim, A. (1992) Lakes and reservoirs. In:
Chapman, D. (Ed) Water Qualihj Assessments. Chapman & Hall, London. pp.
317-369.
Tokalioglu, $, Kartal and Elc;i, L. (2000) Determination of heavy metals and
their speciation in lake sediments by flame atomic absorption spectrometry
after a four-stage sequential extraction procedure. Analytica Chimica Acta, 413,
33-40.
Turekian, K.K. (1972) Chemistn; of the Earth. Holt, Rinehart and Winston, Inc.,
New York, 131 pp.
Tyson, P.D. (1988) The dispersion climatology of the Eastern Transvaal
Highveld. In: Tyson, P.D., Kruger, F.J. and Louw, C.W. (Eds) Atmospheric
pollution and its implications in the Eastern Transvaal Highveld. South African
National Scientific Programmes, Report 150, CSIR, 4-38.
Wade, P.W., Woodborne, S., Morris, W.M., Vos, P., Jarvis, N .V. (2000) Tier 1
risk assessment of selected radionuclides in sediments of the Mooi River
catchment. Water Research Commission, Pretoria. 82 pp.
Wedepohl, K.H. (1995) The composition of the continental crust. Geochimica et
Cosmochimica Acta, 59, 1217-1232.
Winde, F (2002) Stream pollution by adjacent tailings deposits and fluvial
transport of dissolved uranium- dynamics and mechanisms investigated in
mining areas of Germany, Southern Africa and Australia. In: Merkel, B.J.,
58
Planer-Friedrich, B. and Wolkersdorfer, C. (Eds) Uranium Mining and
Hydrogeology III, 15 September- 21 September 2002, Freiberg, Germany, 221-
230
59

7 APPENDIX
This appendix contains the results of the ICP-MS analyses on the extracts of
the five fractions of Tessier et al.'s (1979) sequential extraction. Table 7.1
reports the exchangeable trace metal concentrations in mg/kg dry sediment.
Table 7.2 reports the trace metal concentrations bound to carbonates in mg/kg
dry sediment. Table 7.3 reports the trace metal concentrations bound to Fe-Mn
oxides in mg/kg dry sediment. Table 7.4 reports the trace metal
concentrations bound to organic matter in mg/kg dry sediment. Table 7.5
reports the trace metals concentrations in the residual fraction in mg/kg dry
sediment. Table 7.6 presents a comparison between sequentially extracted and
total metal concentrations (ppm).
60
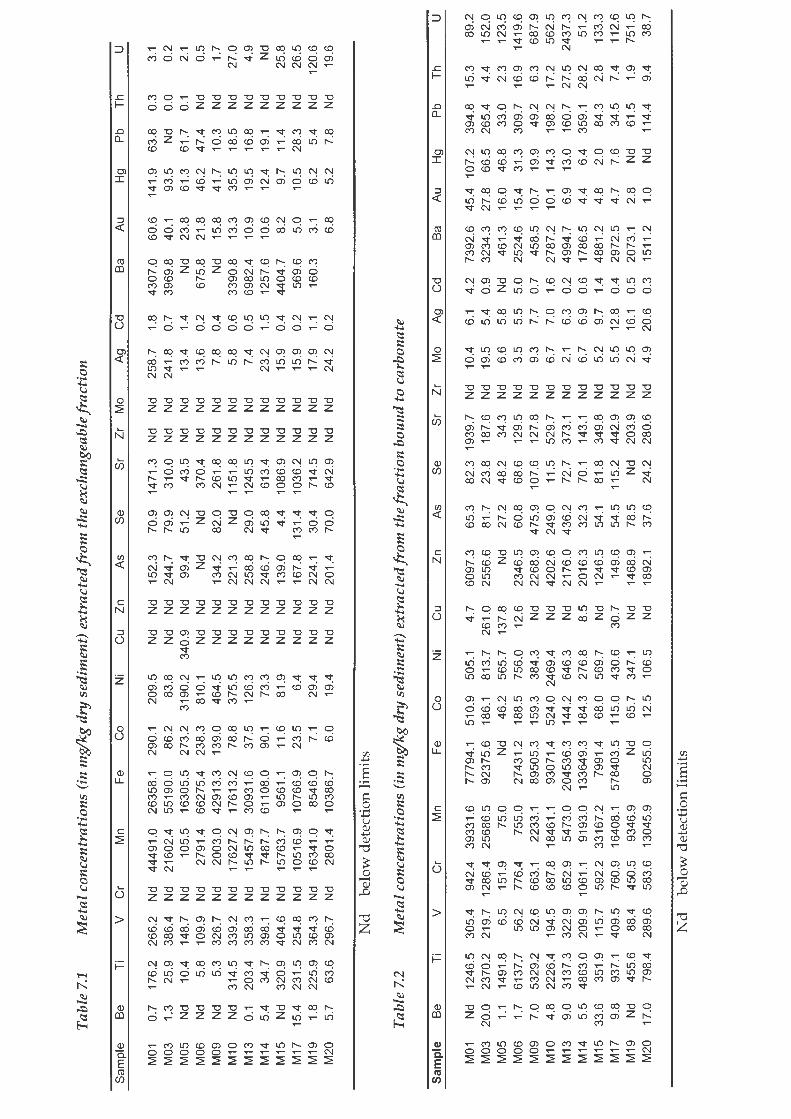
Tab
le 7
.1
Met
al
conc
entr
atio
ns (
in m
glk
g d
ry s
edim
ent)
ext
ract
ed fr
om
the
exc
hang
eabl
e fr
acti
on
Sam
ple
Be
Ti
V
Cr
Mn
Fe
Co
Ni
Cu
Zn
As
Se
Sr
Zr
Mo
Ag
Cd
Ba
Au
M01
0.
7 17
6.2
26
6.2
Nd
4449
1.0
2635
8.1
290.
1 20
9.5
N
d N
d 15
2.3
70.9
14
71.3
N
d N
d 25
8.7
1.
8 4
30
7.0
60
.6
M03
1.
3 25
.9
386.
4 N
d 21
602.
4 55
190
.0
86.2
83
.8
Nd
Nd
244
.7
79.9
31
0.0
N
d N
d 24
1.8
0.7
3969
.8
40
.1
M05
N
d 10
.4
148.
7 N
d 10
5.5
1630
5.5
27
3.2
31
90.2
34
0.9
Nd
99.4
51
.2
43.5
N
d N
d 13
.4
1.4
Nd
23.8
M
06
Nd
5.8
10
9.9
Nd
2791
.4
6627
5.4
238.
3 81
0.1
Nd
Nd
Nd
Nd
370.
4 N
d N
d 13
.6
0.2
675
.8
21.8
M
09
Nd
5.3
326
.7
Nd
2003
.0
4291
3.3
13
9.0
464.
5 N
d N
d 13
4.2
82.0
26
1.8
Nd
Nd
7.8
0.4
Nd
15.8
M
10
Nd
314.
5 33
9.2
N
d 17
627
.2
1761
3.2
78.8
37
5.5
Nd
Nd
221
.3
Nd
1151
.8
Nd
Nd
5.8
0.6
33
90.8
13
.3
M13
0.
1 20
3.4
358.
3 N
d 15
457.
9 30
931.
6 37
.5
126.
3 N
d N
d 25
8.8
29
.0
1245
.5
Nd
Nd
7.4
0
.5
6982
.4
1 0.9
M
14
5.4
34.7
39
8.1
Nd
7487
.7
6110
8.0
90
.1
73.3
N
d N
d 24
6.7
45.8
61
3.4
Nd
Nd
23.2
1.
5 12
57.6
10
.6
M15
N
d 32
0.9
404
.6
Nd
1576
3.7
9561
.1
11.6
81
.9
Nd
Nd
139
.0
4.4
1086
.9
Nd
Nd
15.9
0.
4 44
04.7
8
.2
M17
15
.4
231.
5 25
4.8
Nd
1051
6.9
1076
6.9
23
.5
6.4
Nd
Nd
167.
8 13
1.4
1036
.2
Nd
Nd
15.9
0.
2 56
9.6
5.0
M19
1.
8 22
5.9
364.
3 N
d 16
341.
0 85
46.0
7
.1
29.4
N
d N
d 22
4.1
30
.4
714.
5 N
d N
d 17
.9
1.1
160
.3
3.1
M20
5.
7 63
.6
296
.7
Nd
2801
.4
1038
6.7
6.0
19
.4
Nd
Nd
201.
4 70
.0
642.
9 N
d N
d 24
.2
0.2
6.
8
Nd
b
elo
w d
etec
tion
lim
its
Tab
le 7
.2
Met
al
conc
entr
atio
ns (
in m
glk
g d
ry s
edim
ent)
ext
ract
ed fr
om
the
frac
tion
bou
nd to
car
bona
te
Hg
Pb
Th
141
.9
63.8
0
.3
93.5
N
d 0
.0
61.3
61
.7
0.1
4
6.2
47
.4
Nd
41.7
10
.3
Nd
35.5
18
.5
Nd
19.5
16
.8
Nd
12.4
19
.1
Nd
9.7
11.4
N
d 10
.5
28.3
N
d 6.
2 5.
4 N
d 5.
2 7.
8 N
d
u
3.1
0
.2
2.1
0.5
1.
7 27
.0
4.9
Nd
25.8
26
.5
120.
6 19
.6
Sam
ple
B
e T
i v
Cr
Mn
Fe
Co
Ni
Cu
Zn
As
Se
Sr
Zr
Mo
Ag
Cd
Ba
Au
Hg
Pb
Th
u
M01
N
d 12
46.5
30
5.4
942.
4 39
331
.6
7779
4.1
510.
9 50
5.1
4
.7
6097
.3
65.3
82
.3
1939
.7
Nd
10.4
6
.1
4.2
73
92.6
45
.4
107.
2 39
4.8
15
.3
89.2
M
03
20.0
23
70.2
21
9.7
12
86.4
25
686.
5 92
375.
6 18
6.1
813.
7 26
1.0
2556
.6
81.7
23
.8
187.
6 N
d 19
.5
5.4
0.9
32
34.3
27
.8
66.5
26
5.4
4.4
15
2.0
M
05
1.1
1491
.8
6.5
15
1.9
75
.0
Nd
46.2
56
5.7
137
.8
Nd
27.2
48
.2
34.3
N
d 6.
6 5
.8
Nd
461
.3
16.0
46
.8
33.0
2
.3
123
.5
M06
1.
7 61
37.7
56
.2
776.
4 75
5.0
27
431.
2 18
8.5
75
6.0
12
.6
2346
.5
60.8
68
.6
129.
5 N
d 3
.5
5.5
5.0
25
24.6
15
.4
31.3
30
9.7
16
.9
1419
.6
M09
7.
0 53
29.2
52
.6
663
.1
2233
.1
8950
5.3
159.
3 38
4.3
N
d 22
68.9
47
5.9
10
7.6
127
.8
Nd
9.3
7.7
0.
7 45
8.5
10
.7
19.9
49
.2
6.3
68
7.9
M
10
4.8
22
26.4
19
4.5
687.
8 18
461.
1 93
071.
4 52
4.0
24
69.4
N
d 42
02.6
24
9.0
11
.5
529
.7
Nd
6.7
7.0
1.6
2787
.2
10.1
14
.3
198.
2 17
.2
562.
5 M
13
9.0
3137
.3
322
.9
652.
9 54
73.0
20
4536
.3
144.
2 64
6.3
Nd
2176
.0
436
.2
72.7
37
3.1
N
d 2
.1
6.3
0.
2 49
94.7
6
.9
13.0
16
0.7
27
.5
2437
.3
M14
5.
5 48
63.0
20
9.9
10
61.1
91
93.0
13
3649
.3
184.
3 27
6.8
8.5
2016
.3
32.3
70
.1
143.
1 N
d 6.
7 6
.9
0.6
17
86.5
4.
4 6.
4 35
9.1
2
8.2
51
.2
M15
33
.6
351
.9
115.
7 59
2.2
3316
7.2
79
91.4
68
.0
569.
7 N
d 12
46.5
54
.1
81.8
34
9.8
Nd
5.2
9
.7
1.4
4881
.2
4.8
2.
0 84
.3
2.8
13
3.3
M
17
9.8
937
.1
409.
5 76
0.9
16
408
.1
5784
03.5
11
5.0
43
0.6
30.7
14
9.6
54
.5
115
.2
442.
9 N
d 5
.5
12.8
0.
4 29
72.5
4.
7 7
.6
34.5
7.
4 11
2.6
M19
N
d 45
5.6
88
.4
450
.5
9346
.9
Nd
65.7
34
7.1
N
d 14
68.9
78
.5
Nd
203.
9 N
d 2.
5 16
.1
0.5
2073
.1
2.8
N
d 61
.5
1.9
75
1.5
M20
17
.0
798.
4 28
9.6
58
3.6
13
045.
9 90
255
.0
12.5
10
6.5
N
d 18
92.1
37
.6
24.2
28
0.6
Nd
4.9
20.6
0.
3 15
11.2
1.
0 N
d 11
4.4
9.4
38.7
Nd
b
elo
w d
etec
tion
lim
its

Tab
le 7
.3
Met
al
conc
entr
ati
on
s (i
n m
glk
g d
ry s
edim
ent)
ext
ract
ed fr
om
th
e fr
acti
on b
ound
to
Fe-
Mn
oxi
des
Sam
ple
B
e T
i v
Cr
Mn
Fe
Co
Ni
Cu
Zn
As
Se
Sr
Zr
Mo
Ag
Cd
M01
23
.5
543
.0
672
.0
672
.0
2757
4.7
10
8416
.8
416.
4 39
0.9
N
d 68
03.6
30
.9
177.
8 64
7.5
4
.7
17.8
8
.2
7.4
M03
58
.2
74.4
30
5.2
30
5.2
2503
6.3
93
302.
4 36
9.3
86
2.4
Nd
952.
4 11
.8
53.3
87
.0
Nd
15.8
38
1.3
0
.6
M05
42
.8
93.0
12
3.0
123
.0
3304
.7
1647
64.0
19
4.9
1532
.3
546
.7
558.
9 48
2.6
10
0.4
226
.3
9.3
36
.4
15.3
0.
9 M
06
26.9
52
.5
466.
1 46
6.1
45
1.7
1
45
13
5.9
38
0.0
1612
.4
6.0
31
88.2
93
.8
106
.7
38.3
2
5.7
10
.5
8.3
8.
0 M
09
37.0
11
.4
100.
4 10
0.4
498.
7 14
8763
.5
185
.5
574.
5 84
.0
3109
.0
1199
.8
114.
1 20
4.4
Nd
20.5
10
.2
3.5
M
10
26.4
45
.6
719.
0 71
9.0
23
30.5
12
6502
.7
790
.6
5398
.9
Nd
8849
.3
394
.6
83.2
71
.0
1.7
24.6
6.
7 9.
4 M
13
23.4
7
.9
1281
.9
1281
.9
1770
.8
1850
41.9
32
1.5
11
72.6
18
7.7
45
32.0
11
50.6
65
.6
179
.1
24.3
19
.7
7.9
2.
0 M
14
51.6
25
.8
538.
5 53
8.5
1256
3.8
1670
97.1
11
0.1
213.
8 N
d 97
9.9
14.5
11
3.9
26.2
19
.5
14.4
11
.0
0.7
M15
34
.1
10.3
46
4.4
464.
4 54
03.7
36
43.2
12
0.1
1052
.5
Nd
2055
.9
22.5
76
.3
36.1
28
.6
6.3
9
.0
4.7
M17
35
.9
58.4
11
70.7
11
70.7
25
78.4
27
6102
.6
22
2.2
43
7.8
Nd
5274
.2
93.9
66
.6
54.3
13
.2
10.9
10
.8
14.5
M
19
32.8
8.
6 33
0.3
330
.3
2723
.7
3109
.9
159.
3 73
2.9
N
d 41
41.9
4
0.3
14
4.1
28
.5
Nd
5.2
12.1
3
.1
M20
70
.8
Nd
600.
0 60
0.0
1231
.3
5168
1.2
25.8
10
2.8
Nd
1666
.0
25.0
65
.8
38.1
9.
9 9.
0 57
.4
1.3
N d
be
low
det
ecti
on li
mit
s
Tab
le 7
.4
Met
al
conc
entr
ati
on
s (i
n m
glk
g d
ry s
edim
ent)
ext
ract
ed fr
om
the
frac
tion
bou
nd t
o or
gani
c m
att
er
Sam
ple
B
e T
i v
Cr
Mn
Fe
Co
Ni
Cu
Zn
As
Se
S
r Z
r M
o A
g C
d
Ba
Au
Hg
Pb
Th
u
3367
.6
46.6
16
7.9
427
.9
2592
.4
20.3
65
.4
439
.9
405.
7 19
.1
34.1
54
1.5
50
7.8
15
.4
11.0
31
1.8
57
7.2
6.5
3.
4 12
.3
609
.6
15.7
11
.4
234
.7
1663
.9
16.2
4
.1
364
.1
391.
5 7.
0 N
d 23
3.5
879
.1
4.9
N
d 16
0.9
65
7.6
6.
4 N
d 33
7.2
50
0.8
14
.0
Nd
105
.2
456
.9
3.1
N
d 13
2.3
5.0
42
.0
1.0
4.
3 8
.7
190
.8
6.0
51
0.1
1.
4 53
7.6
1
.6
30
9.5
5.
8 11
26.7
2
.6
14.6
1.
3 96
.7
5.2
10
4.9
0.9
484.
6 1.
7 17
.7
Ba
Au
Hg
Pb
Th
u
M01
51
.9
98.2
11
7.1
24
3.3
31
51.4
14
51.7
11
2.4
115.
5 30
5.2
14
8.8
3
.6
134
.0
142.
6 N
d 7.
6 12
.0
Nd
1286
.9
11.2
71
.8
93.3
12
.7
6.4
M03
37
.0
193
.2
179
.1
173
.9
6687
.1
Nd
68.2
17
0.2
90.0
N
d 4.
3 13
2.7
81
.0
Nd
18.8
12
.4
Nd
1373
.3
13.2
60
.4
96.2
1
.3
0.9
M
06
29.9
22
1.5
438.
4 73
9.1
73
.4
818
.9
276
.5
587
.5
1175
.8
Nd
2.4
173.
0 32
.6
Nd
40
.1
10.8
N
d 13
8.0
7.7
30.3
57
.6
10.2
10
3.4
M09
45
.8
71.1
43
.2
65.0
49
.2
2264
.1
102
.6
184
.2
291
.7
Nd
127
.3
71.9
77
.8
Nd
25.5
11
.4
Nd
92.7
9
.8
13.0
N
d 2
.1
92.2
M
10
13.7
49
.2
73.0
64
1.9
884
.8
2415
0.9
37
11.7
10
382
.0
3893
.2
1924
.2
18.7
10
9.5
54
.0
Nd
8.5
9.7
N
d 53
7.9
5
.2
12.1
99
.5
55.6
10
3.6
M13
51
.8
47
.9
13.7
53
6.1
56
3.1
17
894.
2 64
8.4
1488
.4
11
33
2.1
61
8.8
10.5
19
7.7
94.0
N
d 1
.1
19.0
N
d 91
4.4
4.3
7
.2
131
.5
64.7
20
9.8
M
14
93.9
22
3.8
310.
8 42
1.7
10
06.6
35
78.1
39
.6
63.1
N
d N
d 4.
0 10
1.2
9.9
N
d 33
.8
11.0
N
d 12
1.3
1.
1 N
d 31
.7
13.9
4
.1
M15
42
.5
84.2
93
.0
530
.9
4327
.9
1446
2.5
17
34.9
79
07.9
N
d 27
5.8
1.
7 13
0.2
37
.0
Nd
2.0
11
.3
Nd
467
.7
Nd
Nd
195
.1
73.1
34
.3
M17
52
.8
67.4
15
4.3
308.
2 49
1.2
42
413
.2
78.8
16
4.9
866
.9
Nd
1.0
97.9
13
.8
Nd
4.2
14
.4
Nd
122
.9
1.1
N
d 11
3.4
51.0
17
.9
M20
87
.4
71.5
11
8.8
39
2.3
34
4.3
14
978
.2
46.0
62
.6
Nd
Nd
Nd
153
.3
14.3
N
d 8.
7 21
.7
Nd
134
.3
0.1
Nd
19.5
30
.7
7.2
Nd
b
elow
det
ecti
on li
mit
s

Tab
le 7
.5
Met
al
conc
entr
atio
ns (
in m
glk
g d
ry s
edim
ent)
ext
ract
ed fr
om
the
res
idua
l fra
ctio
n.
Sam
ple
Be
M01
1.
6 M
03
0.9
M
06
0.9
M
09
0.7
M
10
0.7
M13
0.
7 M
14
0.6
M
15
0.9
M
17
0.9
M20
0.
1 S
TM
-1
9.1
ST
M-1
Ti
v
3762
.1
97.9
12
83.3
95
.2
3051
.5
67.6
13
93.9
32
.6
3871
.4
68.7
38
38.0
86
.4
3054
.7
48.2
42
62.0
62
.6
5256
.7
74.7
19
45.9
21
.6
670.
0 0
.5
Cr
Mn
Fe
Co
Ni
Cu
Zn
As
Se
Sr
Zr
Mo
217
.3
170.
8 58
121.
4 9.
4 45
.2
71.8
18
3.2
11.4
1.
1 16
.2
110.
7 1.
9 50
4.1
24
75.6
49
899
.7
16.3
42
.5
30.6
50
.0
11.6
3
.7
17.9
42
.1
1.2
127.
4 81
.1
23
28
3.5
5.
6 33
.5
27.1
56
.4
10.1
0.
9 10
.1
97.1
0.
9 11
5.7
32.7
10
275.
3 2.
4 11
.4
8.1
25
.5
95.4
0.
7 21
.4
64.4
0.
9 18
4.4
156.
4 32
378
.2
28.7
99
.8
121.
6 17
4.4
26.2
0.
8 15
.0
118.
1 2.
0 18
1.2
119.
5 31
504.
4 10
.2
44.3
11
5.3
91.1
49
.2
0.4
13.8
10
3.4
1.7
73.9
68
.4
1946
3.4
3.3
20.6
12
.9
45.5
3.
8 0
.5
11.0
10
3.4
1.0
144
.6
220.
3 33
376
.8
37.9
49
.4
34.7
14
0.5
5.9
0.7
8.6
11
7.1
0.9
150
.7
133.
6 29
404
.0
7.3
41.4
32
.9
115.
7 4.
2 2.
5 19
.6
175.
5 1.
1 40
.6
37.6
62
92.1
1.
6 8
.9
7.6
27.1
1.
6 1.
5 10
.3
72.5
0.
3 3
.8
1385
.1
2531
3.2
0.
8 2.
0 3.
1 23
5.4
1.7
Nd
603.
7 11
94.4
5.
5
Ag
Cd
Ba
0.5
N
d 13
9.6
0.3
0.
1 59
5.9
0.4
0.0
49
.9
0.3
Nd
106
.2
0.7
0.0
95
.1
0.8
N
d 10
3.4
0.4
0.0
85
.5
0.5
0
.1
63.9
0
.8
Nd
139.
0 0.
3 0
.0
59.5
4
.5
0.3
580.
9
Au
0.1
0.5
0.1
0.
3 0.
4 0.
5 0.
1 0
.2
0.4
0.1
0.7
Hg
Pb
Th
0.9
11.3
8.
5 2
.0
22.7
3.
7 0.
2 4.
0 4
.5
1.3
12.4
4.
9 1.
1 12
.6
9.7
0.8
8.9
7.7
0.7
5.2
6.
4 0.
7 6
.7
6.1
0.6
10.0
9
.1
0.4
2.
9 3.
2 0.
6 18
.5
30.3
u
1.4
1.1
1.4
4.2
1.9
1.
9 0
.9
1.0
1.9
0.
6 8.
9
Val
ue
9.6
Na
(8.7
N
a 94
.3
(4.3
11
.6
Na
Na
Na
0.9
(3
(4.6
2
35
.0
4.6
0
.0
700
.0
1210
.0
5.2
0.1
0.3
56
0.0
(0
.000
4 (0
.015
17
.7
31.0
9.
1 %
Err
or
5.2
Na
11.1
33
.3
32.6
0.
2 63
.0
Nd
13.8
1.
3 5
.8
100.
0 0.
0 3.
7 10
0.0
100
.0
4.5
2.
3 2.
2
Nd
be
low
det
ecti
on li
mit
s N
a ce
rtif
ied,
rec
om
men
ded
or
info
rmat
ion
val
ue
no
t av
aila
ble
Tab
le 7
.6
Com
pari
son
betw
een
sequ
enti
ally
ext
ract
ed a
nd
to
tal
met
al c
once
ntra
tion
s (p
pm)
Sam
ple
T
i v
Cr
Mn
Fe
Co
Ni
Cu
Zn
As
Se
Sr
Zr
Mo
Ag
Cd
Ba
Au
Hg
Pb
Th
u
Seq
uent
ially
ext
ract
ed
M01
37
64.3
99
.2
219
.1
M06
30
51.8
68
.6
130
.1
M13
38
38.4
88
.4
183.
3 M
20
1946
.2
22.9
42
.1
Tot
al
M01
M
06
M13
M
20
3924
.4
2928
.6
4016
.7
2336
.9
118
.9
191.
5 93
.5
164
.2
152
.5
304.
2 47
.9
62.3
285.
4 58
335.
4 10
.8
46.4
72
.1
196.
2 11
.6
1.6
20
.4
110.
8 1.
9 0
.7
0.0
15
6.0
0.
2 85
.2
2352
3.2
6.7
37.3
28
.3
62.0
10
.2
1.3
10.6
97
.2
0.9
0.
4 0.
0 53
.7
0.2
142
.8
3194
2.8
11
.4
47.7
12
6.8
98
.5
51.1
0.
8 15
.7
103.
4 1.
8 0.
9 0.
0 11
8.0
0.
6 55
.0
6459
.4
1.7
9.2
7
.6
30.6
1.
9 1.
9 11
.3
72.5
0
.3
0.4
0.0
61
.6
0.1
2551
.3
159
.9
908
.0
146
.3
4017
4.0
54.3
86
.9
62.6
20
2.2
8.2
3392
9.8
28
.4
117.
6 71
.4
182.
4 20
.0
4608
4.2
81.5
23
3.1
361
.6
225
.6
130
.7
1173
2.6
3.6
16.2
14
.4
43.2
2
.5
0.9
96.7
10
9.7
1.3
0.
1 14
.7
74.2
1
.3
1.3
52.5
10
3.1
1.4
1.1
16.4
66
.0
0.5
0.7
0.3
1
.2
0.3
0.2
11
60.5
0.
4 11
7.3
0.1
644
.5
0.1
11
0.7
0.1
0.2
0.3
0.
1
1.4
12.2
8
.5
0.4
4.7
4.5
0
.9
9.6
7.8
0
.4
3.2
3.
2
1.6
3.5
5.7
0.
7
0.2
38.7
11
.1
2.4
0.0
19
.3
5.9
35
.5
0.1
24.4
12
.2
62.4
0.
0 7.
4 5
.0
1.4
Ti
1.4
0.4
0.9
0.
4
0.1
0.2
0.3
0.
1