Embed Size (px)
Citation preview

Michigan Dept. of Natural Resources 2018-245
Status of the Fishery Resource Report Page 1
Burt Lake
Cheboygan County, T35N R03W
Chebgoyan River watershed, surveyed 2015
Neal Godby, Senior Fisheries Biologist
Environment
Burt Lake is a 17,395-acre natural lake in western Cheboygan County, in Michigan's northern Lower
Peninsula (Figure 1). It is the fourth-largest inland lake in the state, and has 32 miles of shoreline.
Maximum depth is 73 feet, although most of the lake is 30 feet deep or less. Major tributaries to Burt
Lake include the Sturgeon River, Maple River, Crooked River, and the Little Carp River (Figure 2).
The Sturgeon River flows into Burt Lake in the southeast corner of the lake, while the Crooked River
flows into Burt Lake at the west shoreline and drains moderate-sized lakes such as Crooked, Pickerel,
and Round Lakes, as well as some smaller tributaries. The Maple River also flows into Burt Lake
along the west shore, and drains Douglas Lake and some smaller tributaries as well. The Indian River
is the outlet for Burt Lake, and flows out of the southeast corner of Burt Lake. The Indian River flows
into Mullett Lake, which empties into the Cheboygan River. These lakes and rivers are all parts of the
Inland Waterway, which ultimately drains to Lake Huron.
Half of the Burt Lake watershed is forested, while another 17.5% is wetland and 12.8% is grassland or
shrubs. Smaller portions of the watershed are agricultural (8.3%) and urban (7.4%). The dominant
surficial geology landform in the watershed is moraine (36.4%), followed by ice contact/outwash
(29.6%) and lacustrine/dune (25%). The prevalence of coarse-textured surficial geology in the
watershed leads to higher levels of groundwater input. This is a main reason why the Burt Lake
watershed is home to high quality trout streams such as the Maple River and the Sturgeon River.
There are a number of public access sites on Burt Lake, making it fairly easy to get on the water. Burt
Lake State Park is on the south shoreline of the lake, while the Maple Bay Public Access Site is in the
northwest. Both of these access sites are operated by the Michigan Department of Natural Resources.
Additionally, there are a number of road endings and township launches, such as those near Hoppie's
Landing (northeast corner) and Eagle's Nest (east shore).
History
Burt Lake has a long history of fisheries management, with stocking playing a prominent role in much
of that history. Records show that Lake Whitefish were stocked in the lake as early as 1876, with Lake
Trout also being stocked prior to 1900. Walleye and Lake Trout were stocked on several occasions in
the early 1900s and 1910s. Lake Trout, Yellow Perch, Rainbow Trout, and Whitefish were stocked in
the 1920s, while stocking in the 1930s focused on Rainbow Trout, Walleye, Yellow Perch, Lake
Whitefish, Bluegill, and Rock Bass. The 1940s saw continued stocking of Rainbow Trout, Walleye,
Yellow Perch, Bluegill, and Rock Bass, along with Smallmouth and Largemouth Bass. More recent
stocking events (since 1980) have included Atlantic Salmon, Rainbow Trout, and Walleye, as well as a
focused effort on restoration of Lake Sturgeon (Table 1). Walleye have not been stocked in Burt Lake
since 1993.

Michigan Dept. of Natural Resources 2018-245
Status of the Fishery Resource Report Page 2
A netting survey of Burt Lake was done in 1887, reporting a mix of cold- and cool-water fish species.
Species captured in that initial survey included Lake Trout, Lake Herring (Cisco), and Lake Whitefish,
as well as Northern Pike, Walleye, Yellow Perch, and Rock Bass. Burt Lake has been surveyed
periodically through the decades, with many of these surveys documenting the lake's abundant, stable
fish community. One study done in 1941 was done to determine how to maximize the return to creel
of legal-sized stocked fish. The study results recommended stocking legal-size Rainbow Trout in Burt
Lake in the fall, as excellent growth of the Rainbow Trout was noted from the time of stocking to the
next trout season. Rainbow Trout are no longer stocked in Burt Lake or its tributaries because natural
reproduction is strong, but at the time the survey was done it was an important finding.
Netting surveys over the years have found the fish community to be remarkably stable, with species
such as Northern Pike, Walleye, Yellow Perch, Smallmouth Bass and Rock Bass frequently
encountered. Coldwater species such as Rainbow Trout and Brown Trout are also commonly found.
Surveys in 1925 and 1955 also documented a number of non-game fish species including 12 species of
minnows, darters, Logperch, and sculpins, as well as Bowfin, Longnose Gar, and Yellow and Brown
Bullhead. Sea Lamprey appeared for the first time in a 1952 survey of the lake. Although no Sea
Lamprey were observed or captured during a 1955 survey, the author of that survey's finding noted that
an angler had preserved 2 large Sea Lamprey from Burt Lake. Sea Lamprey continue to persist at a
low level in Burt Lake, and a recent study found that there is a population that lives its entire life cycle
in the Inland Waterway (Johnson et al. 2016). USFWS-Sea Lamprey Control and USGS have begun
efforts to eradicate Sea Lamprey from the Upper Cheboygan River Watershed, including Burt Lake
and its tributaries. These efforts include back-to-back lampricide (TFM) treatments of tributaries and
the release of sterile male Sea Lamprey to reduce the level of natural reproduction in the system.
In addition to assessing the fish community, some fish surveys have been conducted for other reasons.
For example, some netting surveys were conducted intermittently from 1939-1945, including a number
of Common White Sucker removals. Another survey done in Burt Lake in the 1940s was a
demonstration netting project, which also included removal of Common White Suckers. A previous
study on Big Bear Lake (Otsego County) had shown that Common White Sucker removal did not harm
game fish populations, and may provide some benefit. Commercial fishermen were allowed to remove
the suckers, and the public was allowed to watch. Removals of Common White Suckers were again
done in 1947, 1948, and 1949. Over 48.4 tons of suckers were removed from Burt Lake over the
three-year period. From these efforts, it was determined that removal efforts had little overall effect on
the sucker population.
An interesting demonstration netting project also occurred in 1947 on Burt Lake. The Conservation
Commission had recently adopted a policy to discontinue stocking warm water fish due to their ability
to reproduce sufficiently to replace those removed by anglers. The netting effort was done to show
anglers and local residents that adequate numbers of young-of-the-year fish were present and could be
maintained without additional stocking.
Survey efforts in the 1950s included hook and line surveys, vegetation surveys, and a netting survey in
1955. An interesting note was made in the report of the 1955 survey. The author noted that crayfish
were abundant throughout much of the lake; in fact, the sampling crew would frequently collect a 10-
quart pail full of crayfish from 500 feet of gill net. The author also indicated that crayfish were a
common prey item in fish stomach contents.

Michigan Dept. of Natural Resources 2018-245
Status of the Fishery Resource Report Page 3
Efforts in the early 1960s were generally hook and line surveys through the ice. Whitefish were
caught, as were Cisco. Cisco fishing was reportedly very good in February of 1961. A trap net survey
was done in the spring of 1969 to check on the walleye population. The species typical of surveys in
this lake were encountered, along with Muskellunge, Cisco, Brook Trout, and Carp. The Brook Trout
catch included two 14-inch fish.
Although Burt Lake had always been known as a Walleye lake, management and survey emphasis
focused more on that species starting in the late 1960s. Vocal anglers complained about the increased
fishing pressure (more Walleye anglers) and that fishing wasn't perceived to be as good as it was in the
"good old days." From 1970-1995, Burt Lake was surveyed every 5 years to check on the status of the
Burt Lake walleye population. Survey catch rates ranged from a low of just under 5 Walleye per trap
net lift in 1970, to a high of about 35 Walleye per trap net lift in 1980. These surveys were done in
early spring. Additionally, walleye eggs were taken in the spring of 1970 and 1971. In 1970, 10.3
quarts of eggs were collected from a total catch of 219 Walleye. A total of 82.75 quarts of Walleye
eggs were taken from Burt Lake in 1971, from a total of 1,472 fish that were captured in trap nets.
Eggs were taken to Oden Fish Hatchery for rearing and to be stocked in other waters. In 1975, a trap
net survey was done to check the spawning Walleye population and 945 walleye were captured and
tagged in 50 net nights of effort. A gill net survey was also done in 1975 to establish index stations. It
was reported that the Brown Trout appeared to be in excellent condition.
The 1980s began with a trap net survey in April of 1980. In 42 net nights of effort, a total of 1,494
Walleye were captured and tagged. A June trap net survey was done to look for tag recaptures. The
tag return rate was 17.6%, similar to the return rate from a similar survey in 1975 (17.9% return).
Tagged Walleyes were caught almost exclusively in Burt Lake, with the exception of one tagged
Walleye caught in Mullett Lake. The increase in catch per net lift and the number of ages III and IV
Walleye were attributed to the increased minimum size limit in 1976 from 13 inches to 15 inches. The
survey was summarized by indicating Burt Lake has a stable, self-sustaining Walleye population with
fish growth slightly below state average. The importance of preserving spawning habitat in the north
arm was also emphasized. A 1985 trap net survey found slightly improved Walleye growth, at about
the state average growth rate.
Aquatic invasive species have found their way into Burt Lake over the years. As mentioned above,
Sea Lamprey first appeared in Burt Lake in 1952. Zebra mussels invaded the Inland Waterway in the
early 1990s. Round Gobies were first observed in Burt Lake in the mid-2000s. Alewife have also
been found. Eurasian watermilfoil showed up in 2003, and remains isolated to just a few small
locations.
The Northern Michigan Walleye Association (NMWA) requested that Burt Lake be stocked with
Walleye in the late 1980s and early 1990s. Although the DNR believed the lake provided ample
natural reproduction, the agency and group agreed to assess the need for Walleye stocking. According
to the plan, up to 20,000 clipped fall fingerling Walleye were to be stocked each year, and the
stockings would be assessed through creel surveys, trap net surveys, and incentive programs. An
agreement between NMWA and the DNR stated that if by the end of 1995, 7.5% of the fin clipped
Walleyes were caught in the sport fishery, it would be concluded that Walleye stocking enhances the
sport fishery and should be continued. A 1996 report indicated that only an estimated 0.29% of the
Michigan Dept. of Natural Resources 2018-245
Status of the Fishery Resource Report Page 4
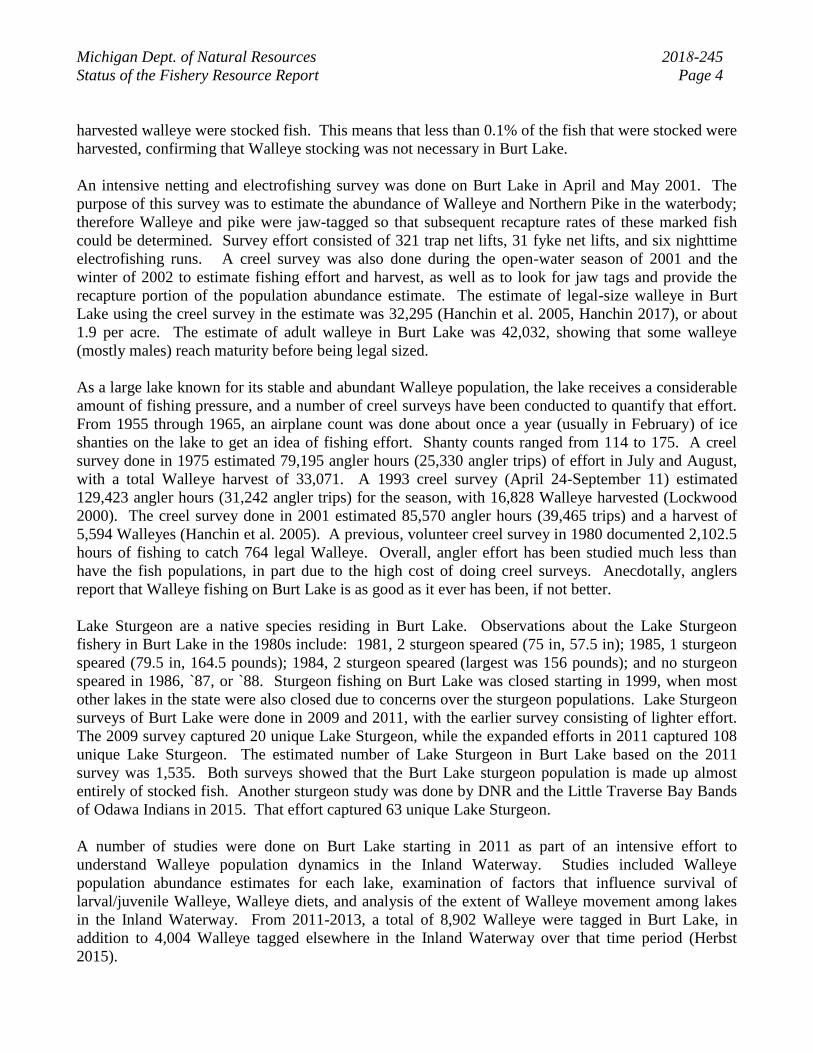
harvested walleye were stocked fish. This means that less than 0.1% of the fish that were stocked were
harvested, confirming that Walleye stocking was not necessary in Burt Lake.
An intensive netting and electrofishing survey was done on Burt Lake in April and May 2001. The
purpose of this survey was to estimate the abundance of Walleye and Northern Pike in the waterbody;
therefore Walleye and pike were jaw-tagged so that subsequent recapture rates of these marked fish
could be determined. Survey effort consisted of 321 trap net lifts, 31 fyke net lifts, and six nighttime
electrofishing runs. A creel survey was also done during the open-water season of 2001 and the
winter of 2002 to estimate fishing effort and harvest, as well as to look for jaw tags and provide the
recapture portion of the population abundance estimate. The estimate of legal-size walleye in Burt
Lake using the creel survey in the estimate was 32,295 (Hanchin et al. 2005, Hanchin 2017), or about
1.9 per acre. The estimate of adult walleye in Burt Lake was 42,032, showing that some walleye
(mostly males) reach maturity before being legal sized.
As a large lake known for its stable and abundant Walleye population, the lake receives a considerable
amount of fishing pressure, and a number of creel surveys have been conducted to quantify that effort.
From 1955 through 1965, an airplane count was done about once a year (usually in February) of ice
shanties on the lake to get an idea of fishing effort. Shanty counts ranged from 114 to 175. A creel
survey done in 1975 estimated 79,195 angler hours (25,330 angler trips) of effort in July and August,
with a total Walleye harvest of 33,071. A 1993 creel survey (April 24-September 11) estimated
129,423 angler hours (31,242 angler trips) for the season, with 16,828 Walleye harvested (Lockwood
2000). The creel survey done in 2001 estimated 85,570 angler hours (39,465 trips) and a harvest of
5,594 Walleyes (Hanchin et al. 2005). A previous, volunteer creel survey in 1980 documented 2,102.5
hours of fishing to catch 764 legal Walleye. Overall, angler effort has been studied much less than
have the fish populations, in part due to the high cost of doing creel surveys. Anecdotally, anglers
report that Walleye fishing on Burt Lake is as good as it ever has been, if not better.
Lake Sturgeon are a native species residing in Burt Lake. Observations about the Lake Sturgeon
fishery in Burt Lake in the 1980s include: 1981, 2 sturgeon speared (75 in, 57.5 in); 1985, 1 sturgeon
speared (79.5 in, 164.5 pounds); 1984, 2 sturgeon speared (largest was 156 pounds); and no sturgeon
speared in 1986, `87, or `88. Sturgeon fishing on Burt Lake was closed starting in 1999, when most
other lakes in the state were also closed due to concerns over the sturgeon populations. Lake Sturgeon
surveys of Burt Lake were done in 2009 and 2011, with the earlier survey consisting of lighter effort.
The 2009 survey captured 20 unique Lake Sturgeon, while the expanded efforts in 2011 captured 108
unique Lake Sturgeon. The estimated number of Lake Sturgeon in Burt Lake based on the 2011
survey was 1,535. Both surveys showed that the Burt Lake sturgeon population is made up almost
entirely of stocked fish. Another sturgeon study was done by DNR and the Little Traverse Bay Bands
of Odawa Indians in 2015. That effort captured 63 unique Lake Sturgeon.
A number of studies were done on Burt Lake starting in 2011 as part of an intensive effort to
understand Walleye population dynamics in the Inland Waterway. Studies included Walleye
population abundance estimates for each lake, examination of factors that influence survival of
larval/juvenile Walleye, Walleye diets, and analysis of the extent of Walleye movement among lakes
in the Inland Waterway. From 2011-2013, a total of 8,902 Walleye were tagged in Burt Lake, in
addition to 4,004 Walleye tagged elsewhere in the Inland Waterway over that time period (Herbst
2015).

Michigan Dept. of Natural Resources 2018-245
Status of the Fishery Resource Report Page 5
Herbst et al. (2017) estimated the spawning population of Walleye in Burt Lake to be 19,464
(~1.1/acre) in 2011. They also studied Walleye movement dynamics throughout the Inland Waterway,
and found that 90% of the fish tagged during the spawning period in Burt Lake stayed in Burt Lake
(i.e., they were recaptured there). Eight percent were later recovered in Mullett Lake and 2% were
recovered in Crooked Lake. It should be noted that different methods were used for the population
estimates in 2001 and 2011, which likely contributed to the difference in abundance estimates. In
2001, a creel survey was used for the recapture phase, whereas in 2011 the recapture phase was done in
one night of electrofishing following an abbreviated marking period.
MacWilliams (2013) found that larval Walleye densities in Burt Lake were 87% higher than all other
lakes studied in the Inland Waterway, which is indicative of the quality spawning habitat found in the
lake. Williams also found that the year-class strength, or relative abundance, of fall fingerling Walleye
was positively related to the spring abundance of large-bodied zooplankton taxa (prey).
Walleye are a native predator that are generalists in their feeding preferences, typically eating both
native and nonnative prey as they are available. Although Walleye preyed heavily upon
macroinvertebrates and native fish species such as yellow perch seasonally, they also took advantage
of nonnative prey (Herbst et al. 2016). In fact, Herbst et al (2016) found that Round Goby comprised
42.9% of Walleye diet in Burt Lake during Fall/Winter.
The Walleye population and Walleye reproduction have been remarkably stable in Burt Lake over the
years, and are supported entirely by natural reproduction in recent decades. The only Walleye stocking
in Burt Lake occurred in 1930s and 1940s , and as part of the study that ended in 1993. A number of
fall Walleye evaluations have been conducted over the years, documenting relative abundance of age-0
Walleye (Table 2, Figure 3). Despite the documented stability, anglers and angling groups have
periodically requested that Walleye be stocked into Burt Lake.
The Northern Inland Lakes Citizen Fishery Advisory Committee (NILCFAC) was established in 2012.
This group reviews survey and research information and provides direction to the DNR Fisheries
Division regarding fishery goals, objectives and management plans for lakes and rivers in the Inland
Waterway chain, including Burt Lake. This committee has been an effective group for disseminating
information about Burt Lake and other waters in the Inland Waterway, and for participating in fisheries
management decisions. Burt Lake Preservation Association has been an active member of the
NILCFAC.
Current Status
A fish community survey was conducted on Burt Lake in June 2015 by MDNR Fisheries Division's
Northern Lake Huron Management Unit. A variety of net types and sizes were deployed using Status
and Trends protocol. Status and Trends is a methodology developed by Fisheries Division in which
gear is standardized throughout the state and survey effort is a function of lake size (Wehrly et al. in
press). The variety of gear types and mesh sizes is intended to sample different sizes of fish, species,
and life stages to give a picture of the overall fish community. Survey effort for this large lake survey
was considerable, with two boats/crews netting over a two-week period in June. Survey effort
consisted of 16 large mesh trap net lifts, 39 large mesh fyke net lifts, 13 small mesh fyke net lifts, 24
experimental gill net lifts, 10 seine hauls, and four 10-minute electrofishing transects. The gill net
Michigan Dept. of Natural Resources 2018-245
Status of the Fishery Resource Report Page 6
effort was deployed to begin to develop an "index" for Yellow Perch. Age and growth of game fish
species were determined by collection of fin rays/spines or scale samples from 10 fish per inch group.
Weights for each species were calculated using length-weight regressions summarized by Schneider
(2000).
Total catch in the survey was 4,845 fish (Table 3, Figure 4). Thirty species representing twelve fish
families were captured. Large predators included Walleye, Northern Pike, Smallmouth Bass, Brown
Trout, Longnose Gar, Bowfin, Largemouth Bass, Muskellunge, and Burbot. Panfish species included
Bluegill, Pumpkinseed Sunfish, Rock Bass, and Yellow Perch. Panfish made up about 23% of the
numerical catch (Table 3).
Walleye and Northern Pike were the dominant predators in this survey of Burt Lake. The Walleye
comprised 5.1% of the numerical catch and were well distributed across inch groups (Table 4). Both
Northern Pike and Walleye were growing below the state average growth rate. Northern Pike had a
mean growth index of -1.4, while Walleye had a mean growth index of -1.1 (Table 5). This
comparison means that, on average, Northern Pike are 1.4 inches smaller than the statewide average
length at age, while Walleye are 1.1 inches smaller than average.
Another predator that was a significant part of the catch was Smallmouth Bass. Smallmouth Bass were
likely under-represented in the catch due to the timing of the survey, and are probably more abundant
than the survey catch would indicate.
Six species of panfish were present in the 2015 survey of Burt Lake. Yellow Perch were the dominant
panfish in the Burt Lake survey, both in terms of numbers and biomass. Perch in the gill net catch
were represented by fish from age groups 2-11, with age-4 most abundant in the catch (Figure 5). It
should be noted that perch do not fully recruit to the gear (i.e., become fully vulnerable) until age 3 or
4. Rock Bass, Bluegill, Pumpkinseed Sunfish, Green Sunfish, and Black Crappie were also part of the Burt Lake panfish community, but were present in much smaller numbers.
Non-game fish species such as White Suckers, Brown Bullhead, Bowfin, and Burbot were present in
the catch. The small-mesh gear deployed as part of the Status and Trends protocol gave us additional
information on forage fish species such as darters, shiners, and other minnows species. Although our
survey did not collect Cisco, we do get reports of them caught occasionally in Burt Lake.
Limnology measurements were also taken on August 25, 2015, as part of the Status and Trends
protocol. Temperature and dissolved oxygen profiles show that the lake stratifies below 48 feet in
depth, and that dissolved oxygen levels fall precipitously at that point to levels that would not support
fish (Table 6). Chlorophyll-a and phosphorus levels are fairly low, indicative of a
mesotrophic/oligotrophic lake (Table 7).
Analysis and Discussion
Burt Lake has a healthy, stable fish community supporting popular fisheries for panfish and predator
species.
Burt Lake's panfish community is diverse, with six species represented in the catch. Of these, Yellow
Perch were by far the most abundant and in fact support a very popular fishery. Perch numbers were

Michigan Dept. of Natural Resources 2018-245
Status of the Fishery Resource Report Page 7
well distributed across the inch groups, with a large percentage (47%) of the catch 7 inches in length or
larger. Yellow Perch up to 14 inches in length were represented in the catch (Table 4). The popularity
of the Yellow Perch fishery in Burt Lake is confirmed by the estimated 33,820 that were harvested
during the open water season of 2001, and the estimated 47,277 that were harvested during the winter
2002 season, based on the most recent creel survey. As mentioned earlier, gill nets were used in 2015
both as part of the Status and Trends survey protocol as well as to provide a netting index for Yellow
Perch catches in our large lakes. Yellow Perch age groups II-XII were present in the catch (Figure 5),
but no single year class seemed to be dominant in the catch. These data will continue to be used as a
comparative tool as we survey additional large lakes with similar gear.
Burt Lake has a healthy and robust predator fish community, comprised of Walleye, Northern Pike,
Muskellunge, Smallmouth Bass, and Rainbow and Brown Trout, as well as several non-game species
such as Bowfin, Burbot, and Longnose Gar. Walleye are by far the most abundant predator species in
Burt Lake, and provide a popular fishery. The Walleye population that spawns in Burt Lake supports
not only the Burt Lake fishery, but 10% of those Walleye also leave Burt Lake and contribute to the
fisheries in other lakes in the Inland Waterway.
The Walleye catch per trap net lift in 2015 was 1.3, below the catch per effort (CPE) values
documented from 1970-1995. It is important to note, however, that the previous surveys were done
earlier in the spring, during the time that Walleye were spawning, making them more vulnerable to the
gear. The 2015 survey was done later (June) according to Status and Trends protocol. Although the
later survey date increases the number of species captured, it makes it difficult to compare CPE from
previous surveys done at different times of the year. The long-term data set of age-0 Walleye catch
rates (Figure 3), shows that there is consistent production of Walleye in Burt Lake. The Walleye
population in Burt Lake continues to be stable, healthy, and self-sustaining.
Northern Pike and Muskellunge are both important predators in Burt Lake and provide popular
fisheries. Northern Pike up to 33 inches in length were captured in this survey. An estimated 246 pike
were harvested and 573 were caught and released during the open water season of 2001 according to
the creel survey.
Muskellunge fishing is increasing in popularity throughout the Inland Waterway. Although abundance
of this species is not high, we do see targeted effort for this species especially in the winter. Since
2000, seven Master Angler awards have been issued for Muskellunge in Burt Lake.
Smallmouth bass provide a popular fishery in Burt Lake. A number of bass-fishing tournaments are
held on Burt Lake each year, either as a stand-alone tournament or as a part of a tournament
throughout the Inland Waterway. Master Angler entries for Smallmouth Bass also indicate this is a
quality fishery, with 40 Master Angler awards for this species since 2000. The 2015 netting survey
caught a reasonable number of Smallmouth Bass, up to 21 inches in total length. Of these, 57% were
14 inches (legal size) or larger.
Overall, Burt Lake provides outstanding fishing opportunities for a number of sportfish species. These
fish populations are remarkably stable, and depend upon the high-quality spawning habitat that Burt
Lake provides.

Michigan Dept. of Natural Resources 2018-245
Status of the Fishery Resource Report Page 8
Management Direction
1. Walleye spawning habitat along the north and east shores should be protected.
2. Maintain statewide fishing regulations, which are adequate for the protection of this fishery.
3. Continue to work with the Northern Inland Lakes Citizen Fisheries Advisory Committee on
issues related to Burt Lake and the Inland Waterway.
4. Better understand Muskellunge population.
5. Develop a Lake Sturgeon management plan to guide management in Burt Lake, and continue
stocking Lake Sturgeon annually in cooperation with Little Traverse Bay Bands of Odawa Indians and
Burt Lake Preservation Association.
References
Godby, N.A., Jr., T.C. Wills, T.A. Cwalinski, and B.J. Bury. 2015. Cheboygan River assessment.
Michigan Department of Natural Resources, Fisheries Report 10, Lansing.
Hanchin, P.A., R.D. Clark, Jr., R.N. Lockwood, and T. Cwalinski. 2005. The fish community and
fishery of Burt Lake, Cheboygan County, Michigan in 2001-02 with emphasis on walleyes and
northern pike. Michigan Department of Natural Resources, Fisheries Special Report 36, Ann Arbor.
Hanchin, P.A. 2017. A summary and analysis of the Large Lakes Survey Prograom in Michigan in
2001-2010, Michigan Department of Natural Resources, Fisheries Report 25, Lansing.
Herbst, S. 2015. Walleye (Sander vitreus) dynamics in the Inland Waterway, Michigan. Dissertation.
Michigan State University, East Lansing.
Herbst, S.J., B.S. Stevens, D.B. Hayes, and P.A. Hanchin. 2016. Estimating walleye (Sander vitreus)
movement and fishing mortality using state-space models: implications for management of spatially
structured populations. Canadian Journal of Fisheries and Aquatic Sciences 73: 330-348.
Herbst, S.J., B.M. Roth, D.B. Hayes, and J.D. Stockwell. 2016. Walleye foraging ecology in an
interconnected chain of lakes influenced by nonnative species. Transactions of the American Fisheries
Society, 145:2, 319-333.
Herbst, S.J., B.S. Stevens, D.B. Hayes, and P.S. Hanchin. 2017. Influence of movement dynamics on
walleye harvest management in intermixed fisheries in a chain of lakes. North American Journal of
Fisheries Management 37:467-479.
Johnson, N.S., M.B. Twohey, S.M. Miehls, T.A. Cwalinski, N.A. Godby, A. Lochet, J.W. Slade, A.K.
Juvbar, and M.J. Siefkes. 2016. Journal of Great Lakes Research 42:90-98.
Lockwood, R. 2000. Sportfishing angler surveys on Michigan inland waters, 1993-99. Michigan
Department of Natural Resources Fisheries Division Technical Report Number 2000-3. Ann Arbor.
MacWilliams, R.D. 2013. Limitations of larval walleye (Sander vitreus) production in Michigan's
Inland Waterway. Masters thesis. Michigan State University, East Lansing.

Michigan Dept. of Natural Resources 2018-245
Status of the Fishery Resource Report Page 9
Schneider, J.C., P.W. Laarman, and H. Gowing. 2000. Length-weight relationships. Chapter 17 in
Schneider, J.C., editor. 2000. Manual of fisheries survey methods II: with periodic updates. Michigan
Department of Natural Resources, Fisheries Special Report 25, Ann Arbor.
Wehrly, K.E., G.S. Carter, and J.E. Breck. In press. Standardized sampling methods for inland lakes
status and trends program. Michigan Department of Natural Resources, Fisheries Special Report, Ann
Arbor.
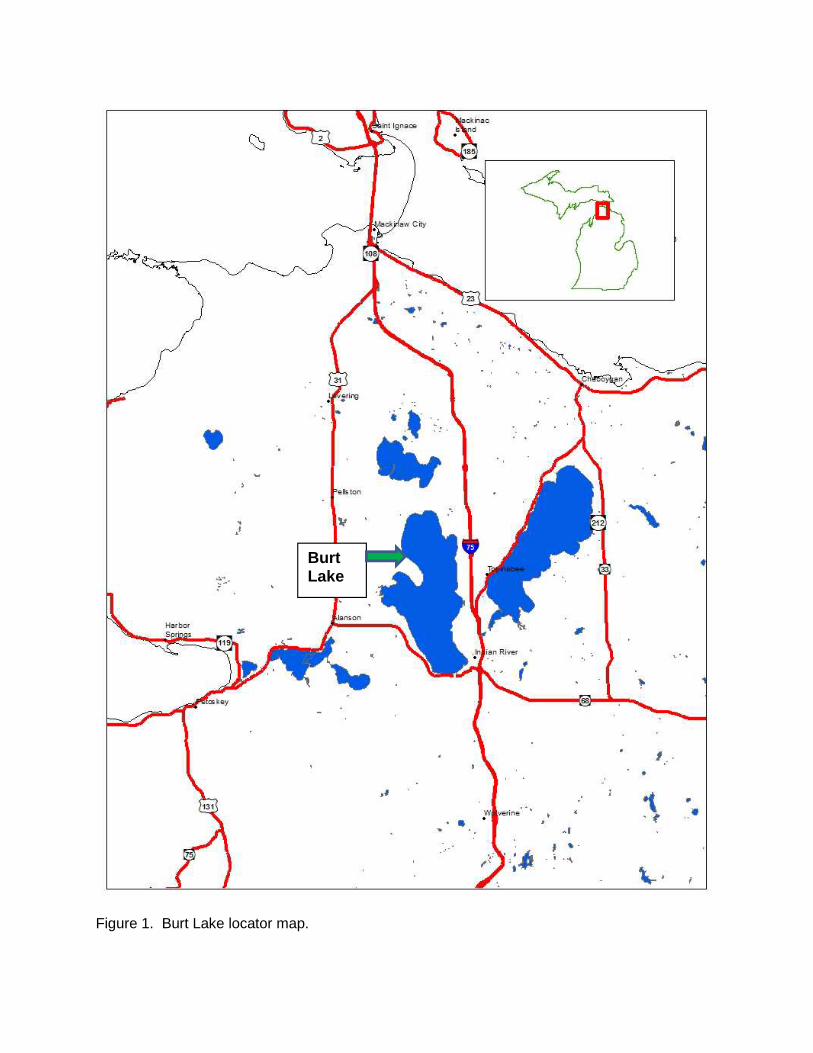
Figure 1. Burt Lake locator map.
Burt Lake

Figure 2. Burt Lake and its major tributaries and outlet.

Figure 3. Number of age-0 Walleye captured per hour of electrofishing, by year, in Burt Lake. The mean catch per hour for sampled years over this time period is shown as the black horizontal line.
0
5
10
15
20
25
30
35
40
1995
1996
1997
1998
1999
2000
2001
2002
2003
2004
2005
2006
2007
2008
2009
2010
2011
2012
2013
2014
2015
2016
Ag
e-0
/ h
r
Year

Figure 4. Number of each species caught during the June 2015 Status and Trends survey of Burt Lake, Cheboygan County.

Figure 5. Number of Yellow Perch caught per gill net per age group.
Figure 6. Photo from Burt Lake survey.
0.00
1.00
2.00
3.00
4.00
5.00
6.00
II III IV V VI VII VIII IX X XI XII
No. of Yellow
Perch caught
per gill net lift
Yellow Perch age group
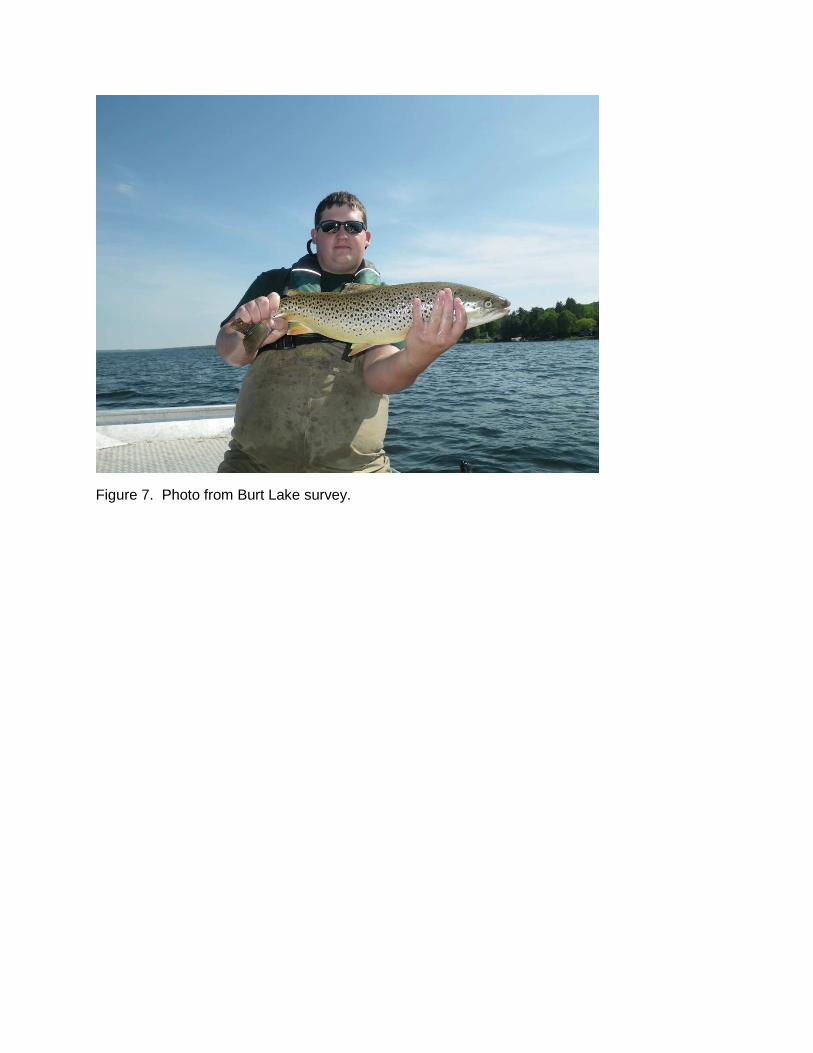
Figure 7. Photo from Burt Lake survey.

Figure 8. Photo from Burt Lake survey.

Table 1. Burt Lake stocking history (1983-2015). Fin clips include: right vental (RV), left ventral (LV), right
pectoral (RP), and left pectoral (LP). Tags include: coded wire tags (CWT) and passive integrated
transponder (PIT).
Year Species Number Length (in) Mark
1983 Sturgeon 1835 0 None
1984 Sturgeon 6698 5.2 None
1986 Atlantic Salmon 38 24.6 None
1987 Rainbow Trout 56434 2.32 None
1987 Rainbow Trout 43529 2.32 None
1987 Rainbow Trout 95000 2.68 None
1989 Walleye 3000 3.05 RV
1989 Walleye 3000 3.05 RV
1989 Walleye 7000 3.05 RV
1989 Walleye 3000 3.05 RV
1989 Walleye 4350 3.05 RV
1990 Sturgeon 5010 3.36 None
1990 Walleye 18346 4.56 LV
1991 Walleye 17000 4.56 RP
1992 Walleye 17000 3.56 LP
1993 Walleye 16280 3.56 RP
2009 Sturgeon 100 6.10 CWT
2010 Sturgeon 584 4.8 CWT
2011 Sturgeon 197 3.88 CWT
2012 Sturgeon 1663 4.48 CWT
2013 Sturgeon 490 4.16 CWT
2015 Sturgeon 344 6.48 CWT
2015 Sturgeon 150 6.48 CWT/PIT
Table 2. Location, agency, date, effort (hours and miles), and catch rates of age-0 Walleye in Burt Lake.
Location Agency Year Month Day
Hours shocked
Miles shocked
No. age-0
No. age-0 per hr
No. age-0 per mile
East side of Greenman Point, west and north past access site for 3 miles MDNR 1995 9 7 3 27 -- 9 Greenman's Point north and east to beyond Little Carp River mouth MDNR 1997 9 10 2.00 3 36 18 12 Burt L State Park North and vicinity of landing near Hoppie's MDNR 2001 8 28 2.35 24 10.21 --
From b/t Indian and Hardwood Rds (NW side of Lake) to Greenman's Point MDNR 2010 10 11 2.00 4.62 24 12 5.19
Greenman's Point south to near Cedar Point MDNR 2010 10 11 2.00 4.37 15 7.5 3.43
From Indian Road North and East for 2 miles MDNR 2011 9 27 1.00 2 22 22.00 11

Table 2. Continued.
Location Agency Year Month Day
Hours shocked
Miles shocked
No. age-0
No. age-0 per hr
No. age-0 per mile
2 Miles NE from Indian Rd (approx. Little Carp R.) to Greenmans Point MDNR 2011 9 27 1.00 2 17 17.00 8.5
Greenman Pt. S for 2 miles (White Goose Bay) MDNR 2011 9 27 1.00 2 4 4.00 2
White Goose Bay South to just North of Cedar Point MDNR 2011 9 27 1.00 2 10 10.00 5 Large House near Dagwell Pt South to just north of Indian River MSU 2011 10 8 1.00 1.2 19 19.00 15.8 Just north of Indian River to State Park MSU 2011 10 8 0.57 1.3 25 43.86 19.2
State Park west to about Fisher Trail Rd MSU 2011 10 8 1.00 2.1 19 19.00 9.0
From Maple Bay Launch to tip of Colonial Pt LTBB 2011 10 12 1.10 2 20 18.18 10.0
From Tip of Colonial Pt. NW to Mundt Rd. LTBB 2011 10 12 1.02 2 16 15.69 8.0 Maple Bay launch south to Bullhead Bay LTBB 2011 10 18 1.37 2 22 16.06 11.0 Bullhead Bay south to Kings Point LTBB 2011 10 18 0.98 2 4 4.08 2.0 Kings Point south to Rotter Rd LTBB 2011 10 18 0.96 2.0 6 6.25 3.0 Rotter Rd south to King Rd SSMT 2011 10 26 0.93 2.1 10 10.75 4.8 Mundt Rd north to Indian Rd. SSMT 2011 10 26 0.98 2.1 15 15.31 7.1 Eagle’s Nest PAS south to Sturgeon River
MDNR-G 2012 10 3 2.50 5.2 9 3.60 1.7
Eagle’s Nest PAS north to Hoppies
MDNR-BC 2012 10 3 2.83 5.6 12 4.24 2.1
State Park west then north to Springwell Hts.
MDNR-G 2012 10 4 1.83 5.7 36 19.67 6.3
Indian Point Rd north and east to Hoppies
MDNR-BC 2012 10 4 2.72 5.6 119 43.75 21.3
Maple Bay PAS south and west thru Bullhead Bay and Poverty Bay, to W. Resort Rd MSU 2012 10 6 3.50 5.5 56 16.00 10.2 Little Carp R mouth south along west shore
MDNR-BC 2013 10 2 4.52 9.16 193 42.7 21.1
State Park north along west shore
MDNR-G 2013 10 2 4.97 10.8 172 34.61 15.9
State Park north along east shore
MDNR-G 2013 10 3 1.88 4.7 10 5.32 2.1
Little Carp R mouth east and south along east shore
MDNR-BC 2013 10 3 1.93 4.33 39 20.21 9.0
Eagles Nest landing north MDNR-
G 2016 9 28 1.03 2.0 43 41.75 21.5

Table 2. Continued.
Location Agency Year Month Day
Hours shocked
Miles shocked
No. age-0
No. age-0 per hr
No. age-0 per mile
NW corner of lake shock east
MDNR-G 2016 9 28 1.05 2.0 46 43.81 22.8
NE corner of lake shock south
MDNR-G 2016 9 28 0.97 2.02 60 61.86 29.7
Kings Point sourth to Rotter Rd.
MDNR-TCU 2016 9 28 0.96 2.0 15 15.63 7.5
Rotter Rd. south to King Rd.
MDNR-TCU 2016 9 28 0.88 2.0 16 18.18 8.0
Table 3. Total number captured, total weight (pounds), and length range (inches) by species for fish
collected during the Burt Lake Status and Trends survey June 2015. *Weights not available. For origin
(native, colonized, introduced) of each species in the watershed, see Table 16 of the Cheboygan River
Assessment (Godby et al. 2015).
Species Number
Weight
(pounds)
Length
Range
(in.)
Common Shiner 1,842 51.1 2-5
Round Goby 1,006 * 1-4
Yellow Perch 898 211.2 0-14
Walleye 248 277.6 5-27
Rock Bass 191 59.2 2-11
White Sucker 122 182.2 3-22
Logperch 69 0.3 1-3
Johnny Darter 67 0.1 1-2
Brown Bullhead 62 64.6 3-17
Spottail Shiner 60 0.3 2-4
Northern Pike 56 200.5 11-33
Smallmouth Bass 49 100.7 6-21
Brown Trout 38 55.3 5-26
Longnose Gar 32 78.4 24-36
Black Bullhead 25 32.1 7-16
Sand Shiner 20 0.1 2-2
Silver Redhorse 18 88.2 17-29
Bluegill 11 1.8 2-8
Pumpkinseed Sunfish 5 1.4 5-7
Blacknose Dace 5 0 1-2
Common Carp 4 47.3 28-31
Green Sunfish 4 0 2-2
Bowfin 3 17.3 22-28
Lake Sturgeon 2 57.3 49-49
Largemouth Bass 2 3.9 15-15
Rainbow Trout 2 0.3 7-7
Muskellunge 1 19 40-40
Burbot 1 3.2 22-22
Black Crappie 1 0 12-12
Bluntnose Minnow 1 0 2-2

Table 4. Number captured per inch group of important sport fishes collected during the 2015 Burt Lake
Status and Trends survey.
Inch
group
Bluegill
Brown
Trout Northern
Pike
Smallmouth
Bass Walleye
Yellow
Perch
0
155
1
2 3
83
3 2
4
4
15
5 1 1
7 52
6 2
1 17 166
7 1 1
1 3 103
8 2
5 7 105
9 1
2 19 55
10 1
44 46
11 8 1 1 6 33
12 5
7 5 62
13 4
4 13 17
14 6
1 23 2
15 4
7 18
16 3
2 24
17 1
4 17
18
6 10
19 2 4 12
20 5 2 12
21 1 5 2 3
22 7
5
23 1 7
2
24 5
25 4
26 1 5
27 6
1
28 3
29
30 1
31 3
32 1
33 1
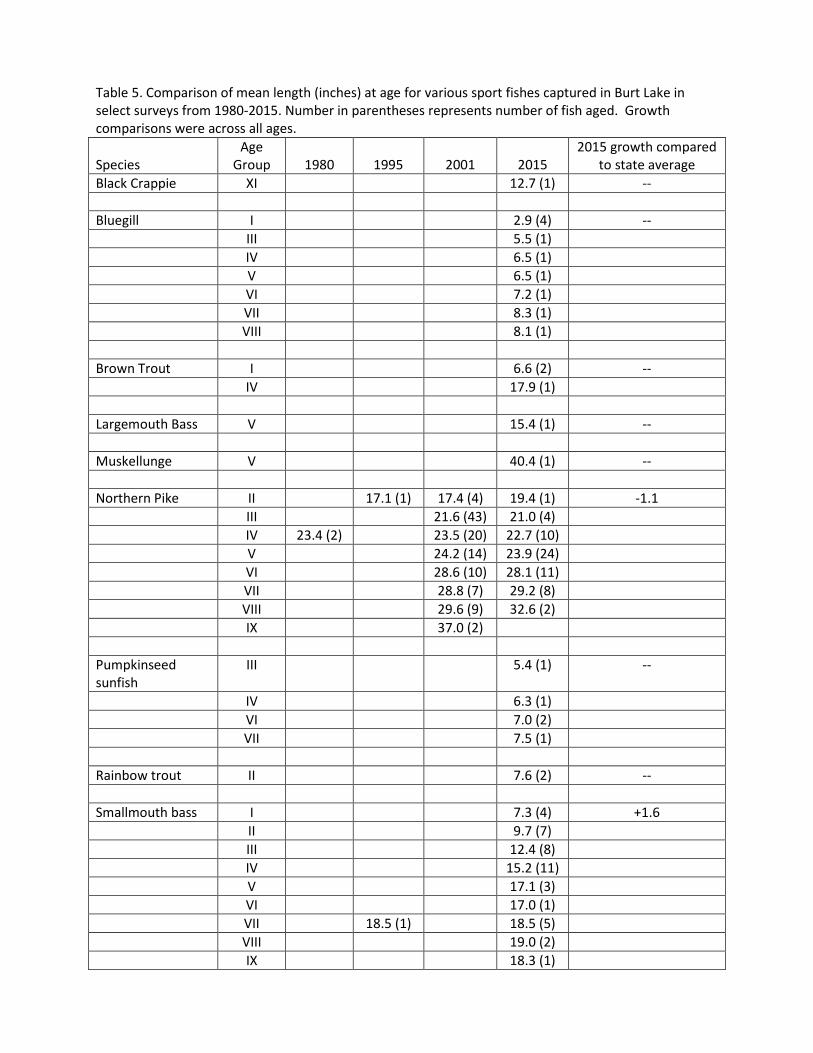
Table 5. Comparison of mean length (inches) at age for various sport fishes captured in Burt Lake in
select surveys from 1980-2015. Number in parentheses represents number of fish aged. Growth
comparisons were across all ages.
Species
Age
Group
1980
1995
2001
2015
2015 growth compared
to state average
Black Crappie XI 12.7 (1) --
Bluegill I 2.9 (4) --
III 5.5 (1)
IV 6.5 (1)
V 6.5 (1)
VI 7.2 (1)
VII 8.3 (1)
VIII 8.1 (1)
Brown Trout I 6.6 (2) --
IV 17.9 (1)
Largemouth Bass V 15.4 (1) --
Muskellunge V 40.4 (1) --
Northern Pike II 17.1 (1) 17.4 (4) 19.4 (1) -1.1
III 21.6 (43) 21.0 (4)
IV 23.4 (2) 23.5 (20) 22.7 (10)
V 24.2 (14) 23.9 (24)
VI 28.6 (10) 28.1 (11)
VII 28.8 (7) 29.2 (8)
VIII 29.6 (9) 32.6 (2)
IX 37.0 (2)
Pumpkinseed
sunfish
III 5.4 (1) --
IV 6.3 (1)
VI 7.0 (2)
VII 7.5 (1)
Rainbow trout II 7.6 (2) --
Smallmouth bass I 7.3 (4) +1.6
II 9.7 (7)
III 12.4 (8)
IV 15.2 (11)
V 17.1 (3)
VI 17.0 (1)
VII 18.5 (1) 18.5 (5)
VIII 19.0 (2)
IX 18.3 (1)

Table 5. Continued.
Species
Age
Group
1980
1995
2001
2015
2015 growth compared
to state average
X 19.0 (1)
XI 19.4 (4)
XII 20.9 (2)
XIV 21.9 (1)
Walleye I 6.8 (3) 6.1 (19) -1
II 11.0 (14) 9.4 (30)
III 14.4 (25) 13.4 (59) 14.1 (64) 13.5 (37)
IV 16.2 (24) 15.7 (76) 16.1 (34) 16.0 (15)
V 18.0 (17) 17 (42) 17.3 (22) 17.4 (14)
VI 18.9 (8) 18.7 (67) 17.8 (65) 18.7 (13)
VII 19.8 (12) 20.4 (69) 19.0 (44) 20.5 (9)
VIII 21.1 (23) 19.7 (39) 19.4 (14) 20.7 (8)
IX 23.0 (13) 20.4 (22) 20.7 (13) 20.9 (3)
X 23.3 (1) 21.4 (28) 21.8 (12) 24.6 (4)
XI
XII
22.2 (17)
24.8 (4)
20.3 (7)
21.5 (7)
22.4 (1)
XIII 21.9 (7)
XIV 22.1 (2)
XV 23.0 (4)
XVI 21.3 (1)
XVII 22.4 (1)
XVIII 22.7 (2)
XIX -
XX 22.2 (1)
Yellow Perch I 2.7 (13) -0.4
II 4.7 (15)
III 6.0 (13)
IV 7.4 (14)
V 8.4 (8)
VI 9.7 (12)
VII 10.0 (9)
VIII 11.3 (11)
IX 12.5 (9)
X 12.9 (7)
XI 13.7 (3)
XII 14.5 (2)

Table 6. Water temperature, dissolved oxygen, and pH profile of Burt Lake, Cheboygan County,
measured on August 25, 2015.
Depth (ft)
Temperature
(°F)
Oxygen
(ppm) pH
0 71.4 11.95 8.17
3 71.4 11.73 8.21
6 71.4 11.62 8.23
9 71.4 11.6 8.23
12 71.4 11.57 8.24
15 71.4 11.56 8.24
18 71.4 11.62 8.25
21 71.4 11.65 8.26
27 71.4 11.65 8.27
30 71.4 11.72 8.33
33 71.4 11.73 8.34
36 71.4 11.7 8.35
39 71.4 11.64 8.36
42 71.2 11.42 8.36
45 70.1 11.11 8.35
48 69.1 9.28 8.24
51 63 1.71 7.9
54 59.7 1.05 7.87
57 58 0.06 7.83
60 56.9 0.2 7.8
63 56.2 0.11 7.79
66 55.1 0.07 7.75
69 54.9 0.06 7.74
Table 7. Water chemistry measurements for Burt Lake, Cheboygan County. Water samples collected
August 25, 2015. * denotes sample was collected as an integrated epilimnetic sample; all other
parameters were measured at the surface.
Parameter Concentration
Alkalinity, total (mg/L) 146
Chlorophyll a (ug/L)* 0.88
Nitrogen, ammonia (mg/L) 0.020
Nitrogen, nitrate + Nitrite (mg/L) 0.016
Nitrogen, Kjeldahl (mg/L) 0.277
Phosphorus, total (mg/L) 0.004