Embed Size (px)
Citation preview

MICHIGAN LEGISLATIVE RETIREMENT SYSTEM • 1
Michigan Legislative Retirement System
Comprehensive Annual Financial Report for the Fiscal Year Ended September 30, 2019
M L R S
A Pension and Other Postemployment Trust Fund of the State of Michigan
Prepared by:
Michigan Legislative Retirement System Anderson House Office Building, Suite S0927
P.O. Box 30014 Lansing, Michigan 48909
(517) 373-0575

2 • MICHIGAN LEGISLATIVE RETIREMENT SYSTEM
This page was intentionally left blank.
MICHIGAN LEGISLATIVE RETIREMENT SYSTEM • 3
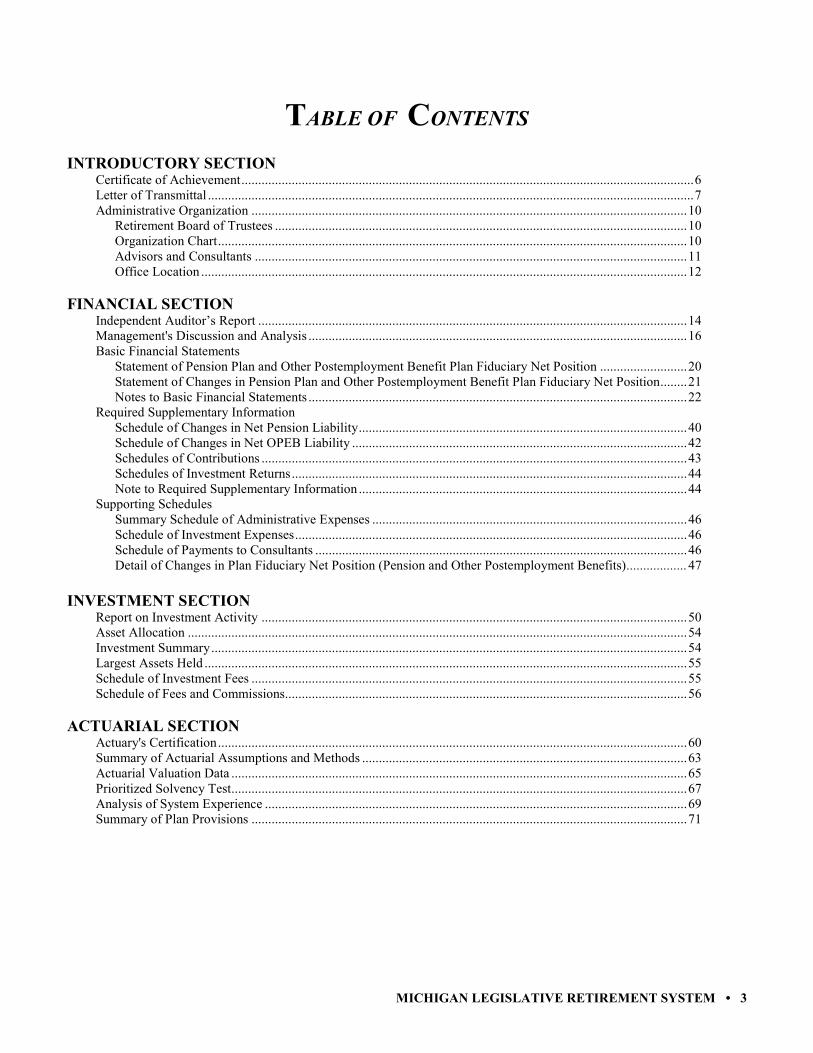
TABLE OF CONTENTS INTRODUCTORY SECTION
Certificate of Achievement ....................................................................................................................................... 6 Letter of Transmittal ................................................................................................................................................. 7 Administrative Organization .................................................................................................................................. 10 Retirement Board of Trustees ........................................................................................................................... 10 Organization Chart ............................................................................................................................................ 10 Advisors and Consultants ................................................................................................................................. 11 Office Location ................................................................................................................................................. 12
FINANCIAL SECTION Independent Auditor’s Report ................................................................................................................................ 14 Management's Discussion and Analysis ................................................................................................................. 16 Basic Financial Statements Statement of Pension Plan and Other Postemployment Benefit Plan Fiduciary Net Position .......................... 20 Statement of Changes in Pension Plan and Other Postemployment Benefit Plan Fiduciary Net Position ........ 21 Notes to Basic Financial Statements ................................................................................................................. 22 Required Supplementary Information Schedule of Changes in Net Pension Liability .................................................................................................. 40 Schedule of Changes in Net OPEB Liability .................................................................................................... 42 Schedules of Contributions ............................................................................................................................... 43 Schedules of Investment Returns ...................................................................................................................... 44 Note to Required Supplementary Information .................................................................................................. 44 Supporting Schedules Summary Schedule of Administrative Expenses .............................................................................................. 46 Schedule of Investment Expenses ..................................................................................................................... 46 Schedule of Payments to Consultants ............................................................................................................... 46 Detail of Changes in Plan Fiduciary Net Position (Pension and Other Postemployment Benefits) .................. 47
INVESTMENT SECTION Report on Investment Activity ............................................................................................................................... 50 Asset Allocation ..................................................................................................................................................... 54 Investment Summary .............................................................................................................................................. 54 Largest Assets Held ................................................................................................................................................ 55 Schedule of Investment Fees .................................................................................................................................. 55 Schedule of Fees and Commissions........................................................................................................................ 56
ACTUARIAL SECTION Actuary's Certification ............................................................................................................................................ 60 Summary of Actuarial Assumptions and Methods ................................................................................................. 63 Actuarial Valuation Data ........................................................................................................................................ 65 Prioritized Solvency Test ........................................................................................................................................ 67 Analysis of System Experience .............................................................................................................................. 69 Summary of Plan Provisions .................................................................................................................................. 71

4 • MICHIGAN LEGISLATIVE RETIREMENT SYSTEM
STATISTICAL SECTION
Schedule of Revenue by Source ............................................................................................................................. 75 Schedule of Expenses by Type ............................................................................................................................... 75 Schedule of Benefit Expenses by Type .................................................................................................................. 76 Schedules of Changes in Fiduciary Net Position .................................................................................................... 77 Schedules of Benefit and Refund Deductions from Net Position by Type ............................................................. 78 Schedules of Retired Members by Type of Benefit ............................................................................................... 79 Schedule of Funding Progress – Pension Plan ........................................................................................................ 81 Actuarial Value of Assets compared to Actuarial Accrued Liability – Pension Plan ............................................. 81 Schedule of Funding Progress – Other Postemployment Benefit Plan ................................................................... 82 Actuarial Value of Assets compared to Actuarial Accrued Liability – OPEB Plan ............................................... 82 Schedule of Average Benefit Payments .................................................................................................................. 83

INTRODUCTORY SECTION
MICHIGAN LEGISLATIVE RETIREMENT SYSTEM • 5
Michigan Legislative Retirement System
Comprehensive Annual Financial Report for the Fiscal Year Ended September 30, 2019
INTRODUCTORY SECTION
Certificate of Achievement Letter of Transmittal
Retirement Board of Trustees Organization Chart
Advisors and Consultants Office Location

INTRODUCTORY SECTION
6 • MICHIGAN LEGISLATIVE RETIREMENT SYSTEM

INTRODUCTORY SECTION
MICHIGAN LEGISLATIVE RETIREMENT SYSTEM • 7
Letter of Transmittal TEL. NO.: (517) 373-0575
CHRISTINE HAMMOND FAX NO.: (517) 373-5639
DIRECTOR TOLL FREE: (877) 577-5628
EMAIL: [email protected]
STATE OF MICHIGAN
LEGISLATIVE RETIREMENT SYSTEM P.O. BOX 30014
LANSING, MICHIGAN 48909-7514
December 27, 2019 The Honorable Gretchen Whitmer Governor, State of Michigan Members of the Legislature State of Michigan Retirement Board Members and Members, Retirees, and Beneficiaries Ladies and Gentlemen: We are pleased to present the comprehensive annual report of the Michigan Legislative Retirement System (MLRS or System) for fiscal year 2019. INTRODUCTION TO REPORT The System was established by legislation under Public Act 261 of 1957. Information regarding the background and description of the System is presented in Note 1 in the financial section of this report. The purpose of the System is to provide benefits for eligible current and former state legislators. The services provided by the staff are performed to facilitate the payment of benefits to members. Responsibility Responsibility for both the accuracy of the data and the completeness and fairness of the presentation, including all disclosures, rests with the management of the System. To the best of our knowledge and belief, the enclosed data is accurate in all material respects and is reported in a manner designed to present fairly the financial position and results of operations of the System. Management's Discussion and Analysis (MD&A) Generally Accepted Accounting Principles (GAAP) requires that management provide an overview and analysis of the System's financial statements, which is called the MD&A. This letter of transmittal should be read in conjunction with the MD&A. The MD&A is found in the beginning of the financial section of this report.

INTRODUCTORY SECTION
8 • MICHIGAN LEGISLATIVE RETIREMENT SYSTEM
Letter of Transmittal (Continued) FINANCIAL INFORMATION Internal Control The management of the System is responsible for maintaining a system of adequate internal accounting control designed to: (1) provide reasonable assurance that transactions are executed in accordance with management's general or specific authorization; (2) record transactions necessary to maintain accountability for assets; and (3) permit preparation of financial statements in accordance with generally accepted accounting principles in the United States of America. The internal control process is designed to provide reasonable assurance regarding the safekeeping of assets and reliability of all financial records. The concept of reasonable assurance recognizes that the cost of a control should not exceed the benefits likely to be derived and that the valuation of costs and benefits requires estimates and judgments by management. This internal control structure includes maintaining written policies and procedures. INVESTMENT The System Board of Trustees is the investment fiduciary for the System, and pursuant to state law, the state treasurer is the custodian of all investments of the System. The System's overall investment objective is to obtain a competitive total rate of return on investments commensurate with Act No. 314 of the Michigan Public Acts of 1965, as amended (MCL §38.1132 et seq., which is the Michigan statute governing the investments of public pension funds), the System's risk-taking ability, and the responsibilities of the System to provide retirement benefits for its members, retirees, and their beneficiaries. In absolute terms, this return objective should approximate the System's actuarial assumed rate of return, which is currently 7%. The investment activity for the year produced a total rate of return on the portfolio of 2.8%. A summary of asset allocation and investment portfolio information can be found in the investment section of this report. FUNDING Funds are derived from the excess of additions, which include contributions and investment earnings, over deductions that are comprised of benefits and administrative expenses. Funds are accumulated to meet future benefit obligations to retirees and beneficiaries. This accumulated balance is referred to as the “net position restricted for pension benefits and OPEB” in the Statement of Pension Plan and Other Postemployment Benefit Plan Fiduciary Net Position in the Financial Section of the report. Pension Plan The total pension liability is not reported in the basic financial statements, but is disclosed in Note 4 to the basic financial statements and in the required supplementary information. The total pension liability is determined by the actuary and is a measure of the present value of actuarial accrued liabilities estimated to be payable in the future to current retirees, beneficiaries, and employees for service earned to date. The net pension liability is measured as the total pension liability less the amount of the pension plan’s fiduciary net position. As of September 30, 2019, total pension liability was $267.9 million, and plan fiduciary net position was $122.3 million. Resulting in a net pension liability of $145.6 million. Other Postemployment Benefits Plan (OPEB) The total OPEB liability is not reported in the basic financial statements, but is disclosed in Note 5 to the basic financial statements and in the required supplementary information. The total OPEB liability is determined by the actuary and is a measure of the present value of actuarial accrued liabilities estimated to be payable in the future to current retirees, beneficiaries, and employees for service earned to date. The net OPEB liability is measured as the total OPEB liability less the amount of the OPEB plan’s fiduciary net position. As of September 30, 2019, total OPEB liability was $169.8 million, and plan fiduciary net position was $29.8 million. Resulting in a net OPEB liability of $140.1 million.

INTRODUCTORY SECTION
MICHIGAN LEGISLATIVE RETIREMENT SYSTEM • 9
Letter of Transmittal (Continued) PROFESSIONAL SERVICES Audit Services The Office of the Auditor General (OAG), independent auditors, conducts audits of the System. The independent auditor’s report on the System’s financial statements is included in the financial section of this report. The financial statements of the System are audited by the Auditor General as part of his constitutional responsibility. Actuarial Services Statute requires an annual actuarial valuation be conducted for the pension benefits. The purpose of the valuation is to evaluate the mortality, service, compensation, and other financial experience of the System and to recommend funding rates. This annual actuarial valuation was completed for the fiscal year ended September 30, 2018. Actuarial certification and supporting statistics are included in the actuarial section of this report. Financial Services The Board of Trustees for the System retains thirteen (13) investment managers and a financial consultant to assist the board in its statutory responsibility to invest the System's funds. These advisors are identified in the introductory section of this report. By statute, the State Treasurer acts as the custodian for the System. Investment information is included in the investment section of this report. HONORS The Government Finance Officers Association of the United States and Canada (GFOA) awarded a Certificate of Achievement for Excellence in Financial Reporting to the Michigan Legislative Retirement System for its comprehensive annual financial report for the fiscal year ended September 30, 2018. This was the 5th consecutive year that the LRS has achieved this prestigious award. In order to be awarded a Certificate of Achievement, a government must publish an easily readable and efficiently organized comprehensive annual financial report. This report must satisfy both generally accepted accounting principles and applicable legal requirements. A Certificate of Achievement is valid for a period of one year only. We believe that our current comprehensive annual financial report continues to meet the Certificate of Achievement Program's requirements and we are submitting it to the GFOA to determine its eligibility for another certificate. ACKNOWLEDGEMENTS The preparation of this report was accomplished with the dedication and cooperation of several people, including Lorie Blundy, the System's Chief Accountant. It is intended to provide complete and reliable information as a basis for making management decisions, as a means of determining compliance with legal provisions, and as a means for determining responsible stewardship of the funds of the System. We would like to express our appreciation for the assistance given by staff, the advisors, and other persons who contributed to the preparation of this report. We believe their combined efforts have produced a report that will enable the System Board of Trustees, plan members, and other interested parties to evaluate and understand the Michigan Legislative Retirement System. Sincerely,
Christine Hammond, Director Michigan Legislative Retirement System

INTRODUCTORY SECTION
10 • MICHIGAN LEGISLATIVE RETIREMENT SYSTEM
Administrative Organization
Retirement Board of Trustees Members As of September 30, 2019
The Honorable R. Robert Geake The Honorable Alma Wheeler Smith The Honorable J. Michael Busch Retiree Member Retiree Member Retiree Member Chairperson of the Board Vice-Chairperson of the Board The Honorable Deborah Cherry The Honorable John Cherry The Honorable Philip Hoffman Retiree Member Retiree Member Retiree Member The Honorable Joseph Palamara The Honorable Gary Randall The Honorable Mark Schauer Retiree Member Retiree Member Retiree Member The Honorable John Schwarz (Vacancy) Tier 2 Defined Contribution Plan Member
Administrative Organization
Anderson House Office Building P.O. Box 30014
Lansing, Michigan 48909 (517) 373-0575
(877) 577-5628 toll-free
Organization Chart
Legislative Retirement
System Board of Trustees
Christine Hammond,
Director
Lorie Blundy,
Chief Accountant
Money Managers
Financial Consultant
Legal and Actuarial Advisors
Fund Custodian Services

INTRODUCTORY SECTION
MICHIGAN LEGISLATIVE RETIREMENT SYSTEM • 11
Administrative Organization (Continued)
Investment Advisors*As of September 30, 2019
The American Fund Group Dodge & Cox Funds Rice Hall James and Associates, LLCCapital Research and Management Kansas City, MO San Diego, CAEuroPacific Growth FundLos Angeles, CA DoubleLine Funds Trust RWC Emerging Markets
Los Angeles, CA Miami, FLBarrow Hanley Mewhinney & Strauss, Inc.Dallas, TX Fidelity Investments Tortoise
Boston, MA Leawood, KSCramer Rosenthal McGlynn, LLCNew York, NY Ironwood Capital Management Wellington Management Co., LLP
San Franciso, CA Boston, MADimensional Fund AdvisorsAustin, TX PIMCO
Newport Beach, CA
*The investments of the System are managed by the Investment Advisors, in accordance with Board directive, and applicable law. The investment category and rate of return for the advisors can be found in the Investment Section, Schedule of Investment Results on page 53. Investments fees of the advisors can be found in the Investment Section, Schedule of Investment Fees on page 55.
Advisors and ConsultantsAs of September 30, 2019
Actuary Independent Auditors CustodianGabriel Roeder Smith & Company Doug A. Ringler, C.P.A., C.I.A Rachael EubanksFrancois Peterse and Mark Buis Auditor General State TreasurerSouthfield, MI State of Michigan State of Michigan
Financial Consultant Legal AdvisorFund Evaluation Group Dana NesselRobert P. Van Den Brink Attorney GeneralCincinnati, OH State of Michigan

INTRODUCTORY SECTION
12 • MICHIGAN LEGISLATIVE RETIREMENT SYSTEM
Administrative Organization (Continued) Office Location: Michigan Legislative Retirement System Cora Anderson House Office Building 124 N. Capitol Avenue, Suite S0927 Lansing, MI 48933

FINANCIAL SECTION
MICHIGAN LEGISLATIVE RETIREMENT SYSTEM • 13
Michigan Legislative Retirement System
Comprehensive Annual Financial Report for the Fiscal Year Ended September 30, 2019
FINANCIAL SECTION
Independent Auditor's Report Management's Discussion and Analysis
Basic Financial Statements Notes to Basic Financial Statements
Required Supplementary Information Note to Required Supplementary Information
Supporting Schedules

14 • MICHIGAN LEGISLATIVE RETIREMENT SYSTEM

MICHIGAN LEGISLATIVE RETIREMENT SYSTEM • 15

FINANCIAL SECTION
16 • MICHIGAN LEGISLATIVE RETIREMENT SYSTEM
Management's Discussion and Analysis
The management's discussion and analysis (MD&A) of the System provides an overview of the financial activities and performance for the fiscal years ended September 30, 2019 and 2018. This should be read in conjunction with the financial statements and required supplemental information (RSI), which provides information for September 30, 2019. THE STATEMENT OF NET POSITION AND THE STATEMENT OF CHANGES IN NET POSITION This Comprehensive Annual Financial Report (CAFR) consists of two financial statements; Statement of Pension Plan and Other Postemployment Benefit Plan Fiduciary Net Position (page 20) and Statements of Changes in Pension Plan and Other Postemployment Benefit Plan Fiduciary Net Position (page 21). These financial statements report information about the System, as a whole, and about its financial condition that should help answer the question: Is the System, as a whole, better off or worse off as a result of this year’s activities? These statements include all assets and liabilities using the economic resources measurement focus and the accrual basis of accounting. Under the accrual basis of accounting, all revenues and expenses are taken into account regardless of when cash is received or paid. The Statement of Pension Plan and Other Postemployment Benefit Plan Fiduciary Net Position, presents all of the System’s assets and liabilities, with the difference between the two reported as net position. Over time, increases and decreases in net position measure whether the System’s financial position is improving or deteriorating. The Statement Changes in Pension Plan and Other Postemployment Benefit Plan Fiduciary Net Position, presents how the System’s net position changed during the most recent fiscal year. These two financial statements should be reviewed along with the Schedule of Net Pension Liability (page 40), Schedule of Net OPEB Liability (page 42) and Schedules of Contributions (page 43) to determine whether the System is becoming financially stronger or weaker and to understand changes over time in the funded status of the System. FINANCIAL ANALYSIS The Statement of Pension Plan and Other Postemployment Benefit Plan Net Position, presents information on the System's assets and liabilities using the accrual basis of accounting. Over time, increases or decreases in net position may serve as a useful indicator of the System's financial strength or weakness. System's net position, for the fiscal year ending September 30, 2019, increased by $1.7 million or 1.1%, due to an increase in the market value of the System's investments.
Plan Fiduciary Net PositionAs of September 30
($ in thousands)Increase
2019 2018 (Decrease)Assets: Equity in common cash 1,345$ 1,932$ (30.4) % Receivables 245 387 (36.7) Investments 150,693 148,512 1.5 Total assets 152,282 150,831 1.0Liabilities: Accounts payable 201 454 (55.7) Total liabilities 201 454 (55.7) Total net position 152,081$ 150,377$ 1.1 %

FINANCIAL SECTION
MICHIGAN LEGISLATIVE RETIREMENT SYSTEM • 17
Management's Discussion and Analysis (Continued) ADDITIONS TO NET POSITION The reserves needed to finance benefits provided by the System are accumulated through the collection of court fees, member and other contributions, State appropriations and through earnings on investments. Contributions and investment income/loss for fiscal year 2019 totaled $22.5 million. Total Additions to Net Position increased in fiscal year 2019 by 42.1% from the prior year, primarily due to additional appropriation from the prior year. DEDUCTIONS FROM NET POSITION The primary deductions of the System include the payment of pension and life insurance benefits to members and beneficiaries, the payments for health, dental, and vision benefits, the refund or transfer of contributions to former members, and the cost of administering the System. Total expenses for fiscal year 2019 were $20.8 million, a decrease of 4.2% over 2018 expenses, primarily due to decreased healthcare costs.
Changes in Plan Fiduciary Net PositionFor Fiscal Year Ended September 30
($ in thousands)Increase
2019 2018 (Decrease)Additions Member contributions 4$ 7$ (43.9)% Employer contributions 17,508 4,928 255.3 Net Investment income/(loss) 3,946 10,203 (61.3) Miscellaneous income 1,026 683 50.1 Total additions 22,484 15,822 42.1
Deductions Pension benefits 14,009 13,855 1.1 Health care benefits 6,164 6,695 (7.9) Death benefits/life ins. 121 633 (80.8) Refunds/qual. rollover - 34 (100.0) Administrative exp. 486 473 2.7 Total deductions 20,780 21,689 (4.2)
Net increase (decrease) 1,704 (5,868) (129.0)
Net position - Beginning of year 150,377 156,244 (3.8)
Net position - End of year 152,081$ 150,377$ 1.1 %

FINANCIAL SECTION
18 • MICHIGAN LEGISLATIVE RETIREMENT SYSTEM
Management's Discussion and Analysis (Continued) Overall Financial Analysis In accordance with its enabling statute, the MLRS Board of Trustees has fiduciary responsibility for the management of the system’s funds, and it oversees its carefully structured and carefully monitored investment program to meet the system’s financial goals, established through its Investment Policy Statement. The Board seeks to achieve an optimal rate of return balanced with prudent levels of risk, to preserve capital and avoid large losses, to meet or exceed the system’s 7% rate of return actuarial assumption over the long-term, to ensure that the portfolio investment managers meet or exceed their benchmarks over the long-term, and to ensure that the portfolio is invested in a cost-effective manner. The fundamental weakness since early 2018 that has plagued many of the U.S.’s primary trading partners bled further into domestic economic data throughout the fiscal year, with some measures pointing to the weakest U.S. manufacturing backdrop in a decade. This was partially counterbalanced by a historically strong labor market, including the lowest unemployment rate in 50 years. Importantly, both the Federal Reserve (Fed) and European Central Bank (ECB) took steps to ease monetary conditions during the fiscal year, including the first Fed rate cut since 2008 and the announcement of a new round of quantitative easing by the ECB. Despite a more accommodative monetary backdrop in the U.S. and euro zone—including forward guidance pointing to a continuation of this recent shift in policy—global equity performance for the fiscal year was tepid, with modestly positive returns generated in U.S. large cap, which outperformed both international developed and emerging market equities. A fragile global trade environment, including continued tensions between the U.S. and China and weak global trade-related economic data, helped weigh on international equity performance during the last quarter and year-to-date (YTD) periods. Stylistically, U.S. mid cap and small cap value relatively outperformed their growth counterparts, while U.S. large cap value slightly underperformed growth. Sharp performance reversals among styles, market capitalizations, and geographies occurred in the first half of September, driven by (temporary) positive U.S.-Chinese developments and a related spike in U.S. Treasury interest rates. These short-term trend reversals proved short-lived, however, and moderated through the end of the fiscal year. As with past practice, the Trustees of LRS continued their ongoing due diligence reviews, meeting on a regular basis to discuss markets, managers and portfolio positioning. Rather than shun risk or even attempt to predict it, the Trustees continue to diversify the portfolio in a way that avoids excess concentration in a single risk. By doing so they recognize long-term tendencies can help raise the probability of investment success by taking a smoother path. The Trustees further recognize that near-term price action can and will occasionally become unexpectedly detached from fair value and that a commitment to diversification can help stabilize returns over both the short and the long-term. Detailed information regarding the MLRS investment program and performance can be found in the Investment Section of this report (beginning on page 49). Financial Questions or Requests This financial report is designed to provide a general overview of the System's financial position. Requests for additional information or questions about this report should be addressed to: Michigan Legislative Retirement System, P.O. Box 30014, Lansing, MI 48909.

FINANCIAL SECTION
MICHIGAN LEGISLATIVE RETIREMENT SYSTEM • 19
This page was intentionally left blank.

FINANCIAL SECTION
20 • MICHIGAN LEGISLATIVE RETIREMENT SYSTEM
Statement of Pension Plan and Other Postemployment Benefit Plan Fiduciary Net Position As of September 30, 2019
Pension OPEB
Plan Plan Total
ASSETS
Equity in common cash 1,244,726$ 99,950$ 1,344,677$
Receivables
Due from federal agencies 214,558 214,558
Interest and dividends 30,320 30,320
Total receivables: 30,320 214,558 244,878
Investments
Equities 34,477,462 8,395,938 42,873,400
Alternative investments 12,202,738 2,971,606 15,174,344
Mutual funds 74,502,172 18,142,740 92,644,911
Total investments: 121,182,372 29,510,284 150,692,655
Total assets: 122,457,418 29,824,792 152,282,210
LIABILITIES
Accounts payable and other liabilities 154,280 17,200 171,480
Amount due to other funds 4,275 4,275
Unearned revenue 25,421 25,421
Total liabilities: 158,556 42,621 201,177
Net position restricted for
pension benefits and OPEB 122,298,862$ 29,782,171$ 152,081,033$
The accompanying notes are an integral part of these financial statements.

FINANCIAL SECTION
MICHIGAN LEGISLATIVE RETIREMENT SYSTEM • 21
Statement of Changes in Pension Plan and Other Postemployment Benefit Plan Fiduciary Net Position For fiscal year ended September 30, 2019
Pension OPEB
Plan Plan Total
ADDITIONS
Member contributions:
Other member contributions 2,445$ 1,737$ 4,182$
Employer contributions 8,063,327 8,337,573 16,400,900
Court fees 753,798 753,798
Other governmental contributions 353,649 353,649
Total contributions: 8,065,772 9,446,757 17,512,529
Investment Income (Loss):
Net increase (decrease) in fair value of investments 132,156 26,261 158,417
Interest, dividends and other 3,562,641 673,908 4,236,549
Total investment income (loss) 3,694,797 700,169 4,394,966
Less investment expenses (374,872) (74,492) (449,364)
Net investment income (loss) 3,319,925 625,677 3,945,602
Miscellaneous income 1,025,684 1,025,684
Total additions: 11,385,697 11,098,118 22,483,815
DEDUCTIONS
Benefits & refunds paid to plan members and beneficiaries:
Retirement benefits 14,008,685 14,008,685
Health benefits 5,791,875 5,791,875
Dental benefits 371,898 371,898
Death benefits 121,280 121,280
Administrative expenses 405,319 80,543 485,861
Total deductions: 14,535,284 6,244,315 20,779,600
Net increase (decrease) in net position (3,149,587) 4,853,802 1,704,216
Net position restricted for
pension benefits and OPEB:
Beginning of year 125,448,449 24,928,368 150,376,817
End of year 122,298,862$ 29,782,171$ 152,081,033$
The accompanying notes are an integral part of these financial statements.
FINANCIAL SECTION
22 • MICHIGAN LEGISLATIVE RETIREMENT SYSTEM
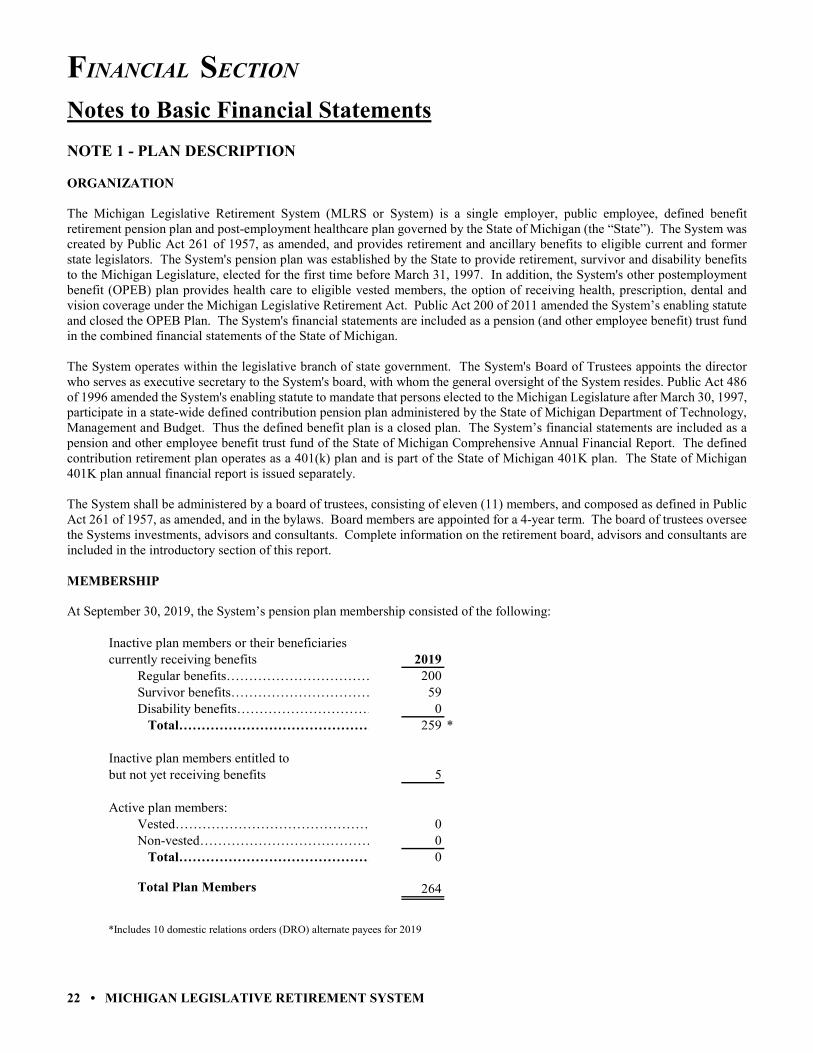
Notes to Basic Financial Statements NOTE 1 - PLAN DESCRIPTION ORGANIZATION The Michigan Legislative Retirement System (MLRS or System) is a single employer, public employee, defined benefit retirement pension plan and post-employment healthcare plan governed by the State of Michigan (the “State”). The System was created by Public Act 261 of 1957, as amended, and provides retirement and ancillary benefits to eligible current and former state legislators. The System's pension plan was established by the State to provide retirement, survivor and disability benefits to the Michigan Legislature, elected for the first time before March 31, 1997. In addition, the System's other postemployment benefit (OPEB) plan provides health care to eligible vested members, the option of receiving health, prescription, dental and vision coverage under the Michigan Legislative Retirement Act. Public Act 200 of 2011 amended the System’s enabling statute and closed the OPEB Plan. The System's financial statements are included as a pension (and other employee benefit) trust fund in the combined financial statements of the State of Michigan. The System operates within the legislative branch of state government. The System's Board of Trustees appoints the director who serves as executive secretary to the System's board, with whom the general oversight of the System resides. Public Act 486 of 1996 amended the System's enabling statute to mandate that persons elected to the Michigan Legislature after March 30, 1997, participate in a state-wide defined contribution pension plan administered by the State of Michigan Department of Technology, Management and Budget. Thus the defined benefit plan is a closed plan. The System’s financial statements are included as a pension and other employee benefit trust fund of the State of Michigan Comprehensive Annual Financial Report. The defined contribution retirement plan operates as a 401(k) plan and is part of the State of Michigan 401K plan. The State of Michigan 401K plan annual financial report is issued separately. The System shall be administered by a board of trustees, consisting of eleven (11) members, and composed as defined in Public Act 261 of 1957, as amended, and in the bylaws. Board members are appointed for a 4-year term. The board of trustees oversee the Systems investments, advisors and consultants. Complete information on the retirement board, advisors and consultants are included in the introductory section of this report. MEMBERSHIP At September 30, 2019, the System’s pension plan membership consisted of the following:
Inactive plan members or their beneficiaries currently receiving benefits 2019
Regular benefits…………………………… 200Survivor benefits…………………………… 59Disability benefits………………………… 0 Total……………………………………… 259 *
Inactive plan members entitled to but not yet receiving benefits 5
Active plan members:Vested……………………………………… 0Non-vested………………………………… 0 Total……………………………………… 0
Total Plan Members 264
*Includes 10 domestic relations orders (DRO) alternate payees for 2019
FINANCIAL SECTION
MICHIGAN LEGISLATIVE RETIREMENT SYSTEM • 23
Notes to Basic Financial Statements (Continued) MEMBERSHIP (continued)
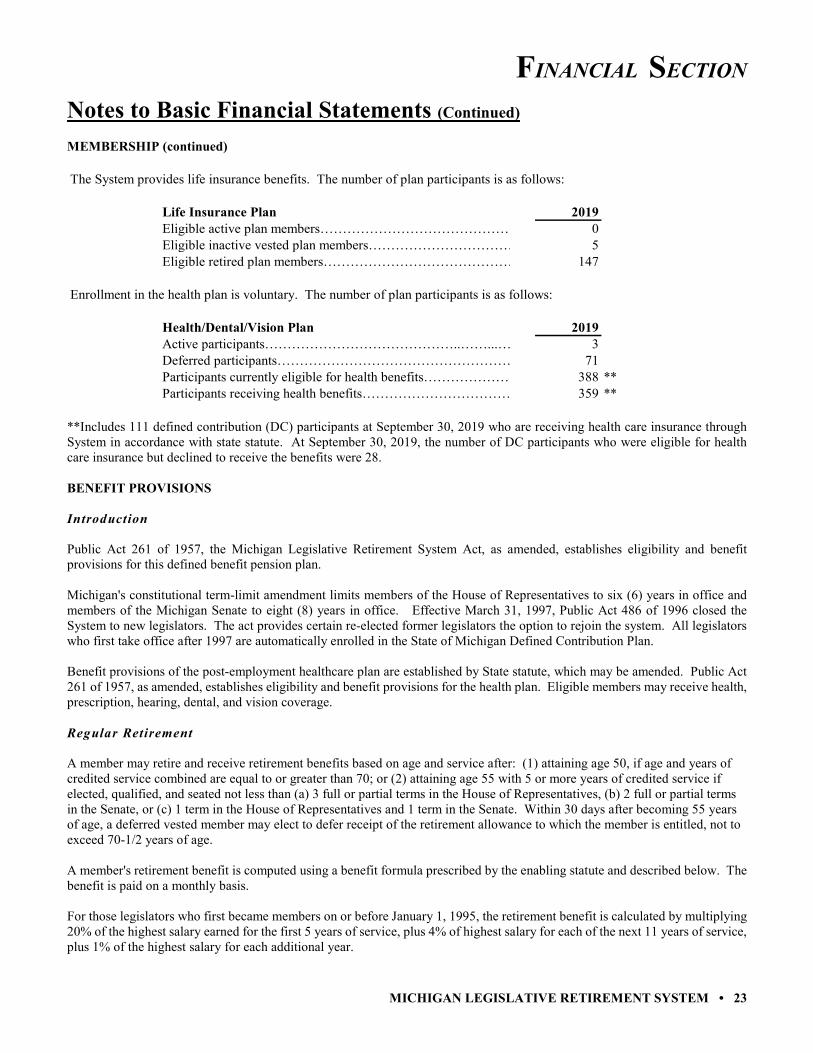
The System provides life insurance benefits. The number of plan participants is as follows: Life Insurance Plan 2019
Eligible active plan members…………………………………… 0Eligible inactive vested plan members…………………………… 5Eligible retired plan members…………………………………… 147
Enrollment in the health plan is voluntary. The number of plan participants is as follows:
Health/Dental/Vision Plan 2019Active participants……………………………………..……...… 3Deferred participants……………………………………………… 71Participants currently eligible for health benefits………………… 388 **Participants receiving health benefits…………………………… 359 **
**Includes 111 defined contribution (DC) participants at September 30, 2019 who are receiving health care insurance through System in accordance with state statute. At September 30, 2019, the number of DC participants who were eligible for health care insurance but declined to receive the benefits were 28. BENEFIT PROVISIONS Introduction Public Act 261 of 1957, the Michigan Legislative Retirement System Act, as amended, establishes eligibility and benefit provisions for this defined benefit pension plan. Michigan's constitutional term-limit amendment limits members of the House of Representatives to six (6) years in office and members of the Michigan Senate to eight (8) years in office. Effective March 31, 1997, Public Act 486 of 1996 closed the System to new legislators. The act provides certain re-elected former legislators the option to rejoin the system. All legislators who first take office after 1997 are automatically enrolled in the State of Michigan Defined Contribution Plan. Benefit provisions of the post-employment healthcare plan are established by State statute, which may be amended. Public Act 261 of 1957, as amended, establishes eligibility and benefit provisions for the health plan. Eligible members may receive health, prescription, hearing, dental, and vision coverage. Regular Retirement A member may retire and receive retirement benefits based on age and service after: (1) attaining age 50, if age and years of credited service combined are equal to or greater than 70; or (2) attaining age 55 with 5 or more years of credited service if elected, qualified, and seated not less than (a) 3 full or partial terms in the House of Representatives, (b) 2 full or partial terms in the Senate, or (c) 1 term in the House of Representatives and 1 term in the Senate. Within 30 days after becoming 55 years of age, a deferred vested member may elect to defer receipt of the retirement allowance to which the member is entitled, not to exceed 70-1/2 years of age. A member's retirement benefit is computed using a benefit formula prescribed by the enabling statute and described below. The benefit is paid on a monthly basis. For those legislators who first became members on or before January 1, 1995, the retirement benefit is calculated by multiplying 20% of the highest salary earned for the first 5 years of service, plus 4% of highest salary for each of the next 11 years of service, plus 1% of the highest salary for each additional year.

FINANCIAL SECTION
24 • MICHIGAN LEGISLATIVE RETIREMENT SYSTEM
Notes to Basic Financial Statements (Continued) BENEFIT PROVISIONS (continued) For those legislators who first became members after January 1, 1995, the retirement benefit is calculated by multiplying 3% of the highest salary for each year of service. Post Retirement Benefit Adjustment For those legislators who first became members on or before January 1, 1995, the annual retirement benefit payable to a retiree and/or his/her survivor is increased by 4% compounded annually. The adjustment is effective each January. For those legislators who first became members after January 1, 1995, the annual retirement benefit payable to a retiree and/or his/her survivor is increased by 4%, but it is not compounded annually. The adjustment is effective each January. Other Postemployment Benefits Under Section 50a and 50b of the Legislative Retirement System Act, all retirees and their dependents and survivors receive health, dental, vision, and hearing insurance coverage. The System also provides health, dental, vision, and hearing insurance coverage for deferred vested members who were members on or before January 1, 1995, and for their survivors and dependents. In addition, in accordance with state law, the System provides health insurance coverage to eligible former legislators (and their dependents) who meet certain vesting requirements established by statute and who belong to the State's Defined Contribution Plan. Member enrollment to the System’s health plan is voluntary. The System pays for health, dental, vision, and hearing benefits on a modified pay-as-you-go basis; however, the State has begun to advance fund for future System health insurance costs. Public Act 200 of 2011 amended the System’s enabling statute and closed the OPEB Plan. All qualified participants must have completed six (6) years of service before January 1, 2013 to qualify for health insurance in the System. Life Insurance Benefits The System provides $150,000 in life insurance coverage to active members. Deferred vested members are covered by varying amounts of life insurance, ranging from $5,000 to $150,000, depending on the member's date of deferral and, in some instances, the payment of an annual premium. Retirees are covered by varying amounts of life insurance, ranging from $2,500 to $75,000, depending on their retirement dates and, in some instances, the payment of an annual premium. The System prefunds life insurance benefits using the entry age actuarial cost method. The life insurance plan and the pension plan use the same actuarial assumptions, which are stated in the actuarial section. Disability Benefit A member or deferred vested member who becomes disabled as determined by at least (2) licensed physicians appointed by the board of trustees is eligible for a disability benefit computed in the same manner described under Regular Retirement. Survivor Benefit Upon the death of a vested member or deferred vested member who meets the service, but not the age requirements, for regular retirement (see Regular Retirement), or upon the death of a retiree, a surviving spouse shall be entitled to a benefit equal to 66 2/3% of the benefit the member would have received or was receiving at the time of death. Special provisions apply to surviving minor children and surviving spouses with minor children. Refunds A member who leaves legislative service may request a refund of his/her contributions from the Members' Saving Fund. A member who receives a refund of contributions forfeits all rights to any future System benefits. Members who return to legislative service and who previously received a refund of their contributions may reinstate their service through repayment of the refund plus interest in accordance with the statute.

FINANCIAL SECTION
MICHIGAN LEGISLATIVE RETIREMENT SYSTEM • 25
Notes to Basic Financial Statements (Continued) NOTE 2 - SUMMARY OF SIGNIFICANT ACCOUNTING POLICIES Basis of Accounting and Presentation The System's financial statements are prepared using the economic resources measurement focus and the accrual basis of accounting, as provided by generally accepted accounting principles for governments. Contributions are recognized as revenue when due, pursuant to formal commitments, as well as statutory requirements. Benefits and refunds are recognized when due and payable in accordance with the terms of the plan. GASB Statement No. 67, which was adopted during the fiscal year ended September 30, 2014, addresses accounting and financial reporting requirements for pension plans. The requirements for GASB Statement No. 67 requires changes in presentation of the financial statements, notes to the financial statements, and required supplementary information. Significant changes include an actuarial calculation of total and net pension liability. It also includes comprehensive footnote disclosure regarding the pension liability, the sensitivity of the net pension liability to the discount rate, and increased investment activity disclosures. The implementation of GASB Statement No. 67 did not significantly impact the accounting for accounts receivables and investment balances. The total pension liability, determined in accordance with GASB Statement No. 67, is presented in Note 4 on page 28 and in the Required Supplementary Information on page 40. GASB Statement No. 74, which was adopted during the fiscal year ended September 30, 2017, addresses accounting and financial reporting requirements for other postemployment benefit (OPEB) plans. The requirements for GASB Statement No. 74, are much like 67 addressed for pension plans, which requires changes in presentation of the financial statements, notes to the financial statements, and required supplementary information. Significant changes include an actuarial calculation of total and net OPEB liability. It also includes comprehensive footnote disclosure regarding the OPEB liability, the sensitivity of the net OPEB liability to the discount rate, and increased investment activity disclosures. The implementation of GASB Statement No. 74 did not significantly impact the accounting for accounts receivables and investment balances. The total OPEB liability, determined in accordance with GASB Statement No. 74, is presented in Note 5 on page 30 and in the Required Supplementary Information on page 42. Contributions and Reserves The Legislative Retirement System Act provides for several "reserves" or "funds." These funds and the contributions and other monies allocated to them are described below. Members' Savings Fund (MSF) — A member who first becomes a member on or before January 1, 1995, with less than 20 years of experience, contributed approximately 7% of salary to MSF. A member who first becomes a member after January 1, 1995, contributed approximately 5% of salary to MSF. Beginning January 1, 1999, there were no member contributions allocated to MSF except for approximately 4% of salary for the period beginning on January 1, 1999 and ending on December 31, 2000, for members who first becomes a member after December 1, 1994 and on or before January 1, 1995, in accordance with legislation. Eligible members may make other contributions to the MSF to purchase special service credit or to repay previously refunded contributions. MSF represents active member contributions (and interest credited from the Income Fund) less amounts transferred to reserves for retirement and amounts refunded to terminated members. At September 30, 2019, the balance in this account was $0.1 million. Members' Retirement Fund (MRF) — The MRF represents the reserves for payment of retirement benefits. At retirement a member's accumulated contributions (with interest) are transferred to the MRF (from the MSF). Interest is credited to the MRF (from the Income Fund), and monthly allowances are debited. At each fiscal year end an actuarial valuation determines the 100% funding requirements for the MRF. Any amounts required to 100% fund the MRF are transferred in the next fiscal year. At September 30, 2019, the balance in this account was $17.8 million.

FINANCIAL SECTION
26 • MICHIGAN LEGISLATIVE RETIREMENT SYSTEM
Notes to Basic Financial Statements (Continued) Contributions and Reserves (continued) Survivors' Retirement Fund (SRF) — On and before January 1, 1999, all members with less than 20 years of service contributed 1/2% of salary to the SRF. After January 1, 1999, there are no member contributions allocated to the SRF. Interest is credited annually to the SRF (from the Income Fund), and member savings are transferred to the SRF from the MSF upon the death of a vested member, and additional state contributions may be made in order to make the SRF 100% funded. Survivors' monthly retirement allowances are paid from this fund upon the death of vested members, deferred vested members, and retirants. At September 30, 2019, the balance in this account was $75.4 million. Insurance Revolving Fund (IRF) — On and before January 1, 1999, all members contributed 1/2% of salary to the Insurance Revolving Fund. After January 1, 1999, there are no member contributions allocated to the IRF. State contributions, if any, member premiums, and interest from the Income Fund are credited to this fund. Life insurance benefits are paid from the IRF to beneficiaries of members, retirants, and deferred vested members. At September 30, 2019, the balance in this account was $29.1 million. Health Insurance Fund (HIF) — On and before January 1, 1999, all members contributed 1% of salary to this fund. After January 1, 1999, member contributions are made as follows: (1) members who first became members on or before January 1, 1995, contribute 9% to the HIF; (2) members who first became members after January 1, 1995, contribute 7% to the HIF. This fund is also credited with employer contributions, court fees, other governmental contributions and interest income. Funds from this reserve are used to pay health care expenses and are accumulated to fully fund the future health insurance liabilities for the System. At September 30, 2019, the balance in this account was $29.8 million. In July, 2011, the Michigan Legislature passed, and Governor Rick Snyder signed, a new law that provides for the use of the health insurance reserve funds to pay for the current costs associated with the retiree health insurance plan. Before the passage of the new law, Public Act 99 of 2011, the system statute prohibited the use of certain prefunding dollars maintained in the health insurance reserve, and their investment income, until the retiree health insurance (OPEB) liabilities in the system became 100% funded. Public Act 99 of 2011 removed the 100%-funding requirement, and thus allows for the immediate use of the funds for health insurance costs of the system. The system added $4.3 million to the reserve after paying health insurance costs for fiscal year ending September 30, 2019. Income Fund (IF) — The IF is credited with all investment earnings and other miscellaneous income. Interest transfers are made annually to the other reserves, based on beginning balance. This fund also accounts for investment and administrative expenses and interest on refunds and transfers. Fair Value of Investments System investments are presented at fair value, consistent with the provisions of GASB Statement No. 72, Fair Value Measurement and Application. Short-term, highly liquid debt instruments, including commercial paper, are reported at amortized cost. Additional disclosures describing investments are provided in Note 8. Reporting Entity The System is a pension and OPEB trust fund of the State of Michigan. As such, the System is considered part of the State and is included in the State’s comprehensive annual financial report as a pension and OPEB trust fund. The System and the System's Board of Trustees are not financially accountable for any other entities. Accordingly, the System is the only entity included in this financial report. Investment Income Dividend income is recognized on the ex-dividend date, and interest income is recognized on the accrual basis as earned. Fair value changes are recorded as investment income or loss. Purchases and sales of investments are recorded as of the trade date.

FINANCIAL SECTION
MICHIGAN LEGISLATIVE RETIREMENT SYSTEM • 27
Notes to Basic Financial Statements (Continued) Cost of Administering the System The retirement system shall pay the expenses for the administration of the retirement system, exclusive of amounts payable as retirement allowances and other benefits provided in this act, from the income fund. Related Party Transactions The cash account includes $1.3 million on September 30, 2019, which represents funds deposited in a common cash investment pool maintained for various State operating funds. The participating funds in the common cash pool earn interest at various rates depending upon prevailing short-term interest rates. Earnings from these activities amounted to $178,125 for the year ended September 30, 2019. Excess Benefits Internal Revenue Service (IRS) Code Section 415 requires that, for individuals who receive retirement benefits in excess of established limits, these benefits should be recorded and reported outside of the pension fund in order to keep the qualified status of the plan. This includes coordination of benefits issued where a retiree participates in more than one qualified plan. The System provided excess benefits to seven (7) retirees, for a total amount of $212,337 as of September 30, 2019. NOTE 3 - CONTRIBUTIONS Member Contributions On or before January 1, 1999, the following contributions were made by members of the System: Members who first became members on or before January 1, 1995, contributed 9% of their salaries to the System. The contributions were placed in the following reserves created by the enabling statute: 7% to the Members' Savings Fund for the first 20 years of service; 0.5% to the Insurance Revolving Fund; 0.5% to the Survivors' Retirement Fund for the first 20 years of service; and 1% to the Health Insurance Fund. Members who first became members on or after January 1, 1995, contributed 7% of their salaries to the System. The contributions were placed in the following reserves created by the enabling statute: 5% to the Members' Savings Fund; 0.5% to the Insurance Revolving Fund; 0.5% to the Survivors' Retirement Fund; and 1% to the Health Insurance Fund. After January 1, 1999, the following contributions are made by the members of the System: Members who first became members after December 1, 1994, contribute 9% of their salaries to the System. The contributions are placed in accordance with enabling statute to Health Insurance Fund. Members who first became members after December 1, 1994 and on or before January 1, 1995, contributed 13% of their salaries to the System. The contributions were placed in the following reserves in accordance with the enabling statute: 9% to the Health Insurance Fund and 4% to the Members' Savings Fund until December 31, 2000. After December 31, 2000, these members contribute 9% of their salaries to the System. The contributions are placed in accordance with enabling statute to Health Insurance Fund. Members who first became members after January 1, 1995, contribute 7% of their salaries to the System. The contributions are placed in the following reserve in accordance with the enabling statute: 7% to the Health Insurance Fund. Member contributions are tax-deferred through the provisions of section 414(h)(2) of the Internal Revenue Code.

FINANCIAL SECTION
28 • MICHIGAN LEGISLATIVE RETIREMENT SYSTEM
Notes to Basic Financial Statements (Continued) State Contributions State contributions are made on the basis of actuarial requirements as determined by the System actuary and approved by the Board of Trustees. Through the annual state budgetary process, the Legislature annually appropriates, and the Governor approves, the State contributions along with certain court fee revenues, which are paid to the System pursuant to state statute. In fiscal year 2019, the MLRS received an additional appropriation of $12.4 million. The appropriation was an effort to begin to reduce and properly fund the system’s increasing fiscal responsibilities for the pension and OPEB benefits. Pension plan State contributions are determined based on an actuarially determined contributions. Actual employer contributions for pension plan benefits were $8.1 million for fiscal year 2019. OPEB plan State contributions are determined based on an actuarially determined contributions. Actual employer contributions for OPEB were $8.3 million for fiscal year 2019. Schedules showing actuarially determined State contributions are presented in the Required Supplementary Information, in the financial section of this report. Also included in the Required Supplementary Information, are the actuarial assumptions used to determine the contribution rates. NOTE 4 – NET PENSION LIABILITY Measurement of the Net Pension Liability The net pension liability is to be measured as the total pension liability, less the amount of the pension plan’s fiduciary net position. In actuarial terms, this will be the accrued liability less the market value of assets (not the smoothed actuarial value of assets that is often encountered in actuarial valuations performed to determine the employer’s contribution requirement)
Net Pension LiabilityTotal Pension Liability 267,871,170$ Plan Fiduciary Net Position 122,298,862 Net Pension Liability 145,572,308$ Plan Fiduciary Net Position as a Percentage
of Total Pension Liability 45.66%Net Pension Liability as a Percentage
of Covered Payroll 203,072.20%Total Covered Payroll (1) 71,685$
(1) Payroll is for prior fiscal year since GASB 67 uses a roll forward and actuarial valuation data from prior fiscal year.

FINANCIAL SECTION
MICHIGAN LEGISLATIVE RETIREMENT SYSTEM • 29
Notes to Basic Financial Statements (Continued) Long-Term Expected Return on Pension Plan Assets The long-term expected rate of return on pension plan investments was determined using a building block method in which best-estimate ranges of expected future real rates of return (expected returns, net of pension plan investment expense and inflation) are developed for each major asset class. These ranges are combined to produce the long-term expected rate of return by weighting the expected future real rates of return by the target asset allocation percentage and by adding expected inflation. Best estimates of arithmetic real rates of return for each major asset class included in the pension plan’s target asset allocation as of September 30, 2019, are summarized in the following table:
Target Long-Term ExpectedAsset Class Allocation Real Rate of Return*
Large Cap Equity 25.0 % 5.0 %Small Cap Equity 10.0 6.0 International Equity 19.0 6.5 Emerging Markets 9.0 9.0 Fixed Income 20.0 3.5 Hedge Fund 10.0 5.3 Public Natural Resources 3.0 8.0 Real Assets 3.0 6.5 Cash 1.0 2.2
Total 100.0 %
*Real rate of return is based on investment manager inflation assumption of 2.20%.
Pension Plan Rate of Return For the year ended September 30, 2019, the annual money-weighted rate of return on pension plan investments, net pension plan investment expense, was 2.30%. The money weighted rate of return expresses investment performances, net of investment expense, adjusted for the changing amounts actually invested. Pension Plan Discount Rate The single discount rate used to measure the total pension liability decreased to 3.69%, compared to the prior year's 4.75%. This single discount rate was based on an expected rate of return on pension plan investments of 7.0% and a municipal bond rate of 2.75% (based on the daily rate closest to but not later than the measurement date of the Fidelity “20-Year Municipal GO AA Index”). The projection of cash flows used to determine this single discount rate assumed that plan member contributions will be made at the current contribution rate and that employer contributions will be made at rates equal to the difference between actuarially determined contributions rates and the member rate. Based on these assumptions, the pension plan’s fiduciary net position and future contributions were sufficient to finance the benefit payments through the year 2031. As a result, the long-term expected rate of return on pension plan investments was applied to projected benefit payments through the year 2031, and the municipal bond rate was applied to all benefit payments after that date.

FINANCIAL SECTION
30 • MICHIGAN LEGISLATIVE RETIREMENT SYSTEM
Notes to Basic Financial Statements (Continued) Sensitivity of the Net Pension Liability to Changes in the Discount Rate As required by GASB Statement No. 67, the following presents the plan’s net pension liability, calculated using a single discount rate of 3.69%, as well as what the plan’s net pension liability would be if it were calculated using a single discount rate that is 1-percentage-point lower or 1-percentage-point higher:
Current Single Discount1% Decrease Rate Assumption 1% Increase
2.69% 3.69% 4.69%Net Pension Liability/(Asset) $181,268,946 $145,572,308 $116,405,019
Timing of the Valuation An actuarial valuation to determine the total pension liability is required to be performed at least every two years. If the actuarial valuation is not calculated as of the plan’s fiscal year end, the total pension liability is required to be rolled forward from the actuarial valuation date to the pension plan’s fiscal year end. The total pension liability as of September 30, 2019, is based on the results of an actuarial valuation performed as of September 30, 2018 and rolled forward using generally accepted actuarial procedures. NOTE 5 – NET OTHER POSTEMPLOYMENT BENEFIT LIABILITY Measurement of the Net OPEB Liability The net OPEB liability is to be measured as the total OPEB liability, less the amount of the OPEB plan’s fiduciary net position. In actuarial terms, this will be the accrued liability less the market value of assets (not the smoothed actuarial value of assets that is often encountered in the actuarial valuations performed to determine the employer’s contribution requirement). The net OPEB liability should be measured as of the OPEB plan’s most recent fiscal year end.
Net OPEB LiabilityTotal OPEB Liability 169,849,643$ Plan Fiduciary Net Position 29,782,171 Net OPEB Liability 140,067,472$ Plan Fiduciary Net Position as a Percentage
of Total OPEB Liability 17.53%

FINANCIAL SECTION
MICHIGAN LEGISLATIVE RETIREMENT SYSTEM • 31
Notes to Basic Financial Statements (Continued) Long-Term Expected Return on OPEB Plan Assets The long-term expected rate of return on OPEB plan investments was determined using a building block method in which best-estimate ranges of expected future real rates of return (expected returns, net of OPEB investment expense and inflation) are developed for each major asset class. These ranges are combined to produce the long-term expected rate of return by weighting the expected future real rates of return by the target asset allocation percentage and by adding expected inflation. Best estimates of arithmetic real rates of return for each major asset class included in the OPEB plan’s target asset allocation as of September 30, 2019, are summarized in the following table:
Target Long-Term ExpectedAsset Class Allocation Real Rate of Return*
Large Cap Equity 25.0 % 5.0 %Small Cap Equity 10.0 6.0 International Equity 19.0 6.5 Emerging Markets 9.0 9.0 Fixed Income 20.0 3.5 Hedge Fund 10.0 5.3 Public Natural Resources 3.0 8.0 Real Assets 3.0 6.5 Cash 1.0 2.2
Total 100.0 %
*The arithmetic rates of return were provided by the System's investment consultant along with a 2.2% price inflation assumption.
OPEB Plan Rate of Return For the year ended September 30, 2019, the annual money-weighted rate of return on OPEB plan investments, net OPEB plan investment expense, was 6.74%. The money weighted rate of return expresses investment performances, net of investment expense, adjusted for the changing amounts actually invested. OPEB Plan Discount Rate The single discount rate of 3.86% was used to measure the total OPEB liability, compared to the prior year’s 4.04%. This single discount rate was based on an expected rate of return on OPEB plan investments of 7.0% and a municipal bond rate of 2.75%. (based on the daily rate closest to but not later than the measurement date of the Fidelity “20-Year Municipal GO AA Index”). The projection of cash flows used to determine this single discount rate assumed that employer contributions will be made at rates equal to actuarially determined contributions rate. Based on these assumptions, the OPEB plan’s fiduciary net position and future contributions were sufficient to finance the benefit payments through the year 2036. As a result, the long-term expected rate of return on pension plan investments was applied to projected benefit payments through the year 2036, and the municipal bond rate was applied to all benefit payments after that date.
FINANCIAL SECTION
32 • MICHIGAN LEGISLATIVE RETIREMENT SYSTEM
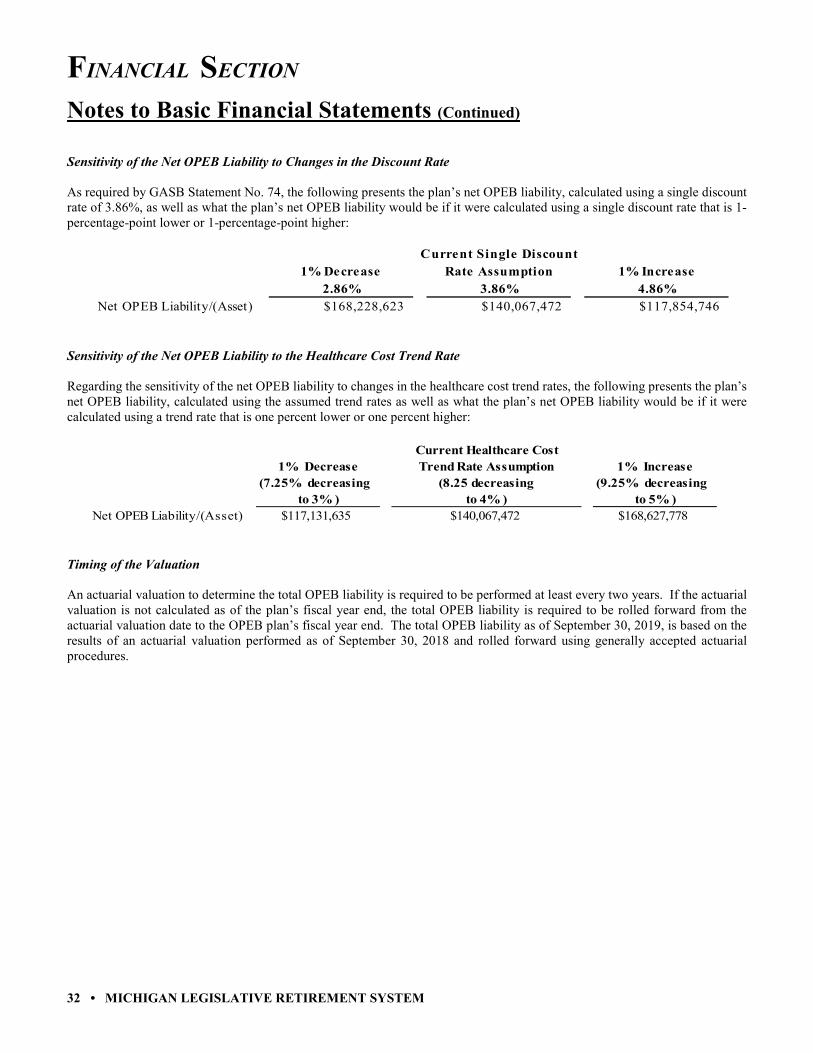
Notes to Basic Financial Statements (Continued) Sensitivity of the Net OPEB Liability to Changes in the Discount Rate As required by GASB Statement No. 74, the following presents the plan’s net OPEB liability, calculated using a single discount rate of 3.86%, as well as what the plan’s net OPEB liability would be if it were calculated using a single discount rate that is 1-percentage-point lower or 1-percentage-point higher:
Current Single Discount1% Decrease Rate Assumption 1% Increase
2.86% 3.86% 4.86%Net OPEB Liability/(Asset) $168,228,623 $140,067,472 $117,854,746
Sensitivity of the Net OPEB Liability to the Healthcare Cost Trend Rate Regarding the sensitivity of the net OPEB liability to changes in the healthcare cost trend rates, the following presents the plan’s net OPEB liability, calculated using the assumed trend rates as well as what the plan’s net OPEB liability would be if it were calculated using a trend rate that is one percent lower or one percent higher:
Current Healthcare Cost1% Decrease Trend Rate Assumption 1% Increase
(7.25% decreasing (8.25 decreasing (9.25% decreasing to 3% ) to 4% ) to 5% )
Net OPEB Liability/(Asset) $117,131,635 $140,067,472 $168,627,778
Timing of the Valuation An actuarial valuation to determine the total OPEB liability is required to be performed at least every two years. If the actuarial valuation is not calculated as of the plan’s fiscal year end, the total OPEB liability is required to be rolled forward from the actuarial valuation date to the OPEB plan’s fiscal year end. The total OPEB liability as of September 30, 2019, is based on the results of an actuarial valuation performed as of September 30, 2018 and rolled forward using generally accepted actuarial procedures.

FINANCIAL SECTION
MICHIGAN LEGISLATIVE RETIREMENT SYSTEM • 33
Notes to Basic Financial Statements (Continued)
NOTE 6 – PENSION PLAN Actuarial Valuations and Assumptions Actuarial valuations for pension plans involve estimates of the value of reported amounts and assumptions about the probability of occurrence of events far into the future. Examples include assumptions about future employment and mortality. Amounts determined regarding the net pension liability of the plan and the rate of return are subject to continual revision as actual results are compared with past expectations and new estimates are made about the future. The Schedule of Contributions in RSI present trend information about the amounts contributed to the plan by employers in comparison to an amount that is actuarially determined. Projections of benefits for financial reporting purposes are based on the substantive plan (the plan as understood by the employer and plan members) and include the types of benefits provided at the time of each valuation and the historical pattern of sharing of benefit costs between the employer and plan members to that point. The actuarial methods and assumptions used include techniques that are designed to reduce the effects of short-term volatility in actuarial accrued liabilities and the actuarial value of assets, consistent with the long-term perspective of the calculations. The information presented in the required supplementary schedules was determined as part of the actuarial valuations at the dates indicated. Additional information as of the latest actuarial valuation follows: Summary of Actuarial Assumptions Methods and assumptions used to determine Net Pension Liability as of September 30, 2019: Valuation Date September 30, 2018
Actuarial Cost Method Entry-Age Normal
Asset Valuation Method Fair Value
Wage Inflation 4.00%
Salary Increases 4.00%
Investment Rate of Return 3.69% Single Discount Rate
Cost-of-living Adjustments 4% Annual Compounded (non-compounded for legislators who first became members after 1/1/95) Retirement Age Age-based table of rates with 100% probability of retirement once a member is subject to term limits
Mortality RP-2014 Mortality Tables scaled by 100% and adjusted for mortality improvements using projection scale MP-2017 from 2006. Note: Actuarial assumptions are periodically reviewed and modified, if needed, upon the recommendation of the actuary, and with approval of the board.
FINANCIAL SECTION
34 • MICHIGAN LEGISLATIVE RETIREMENT SYSTEM
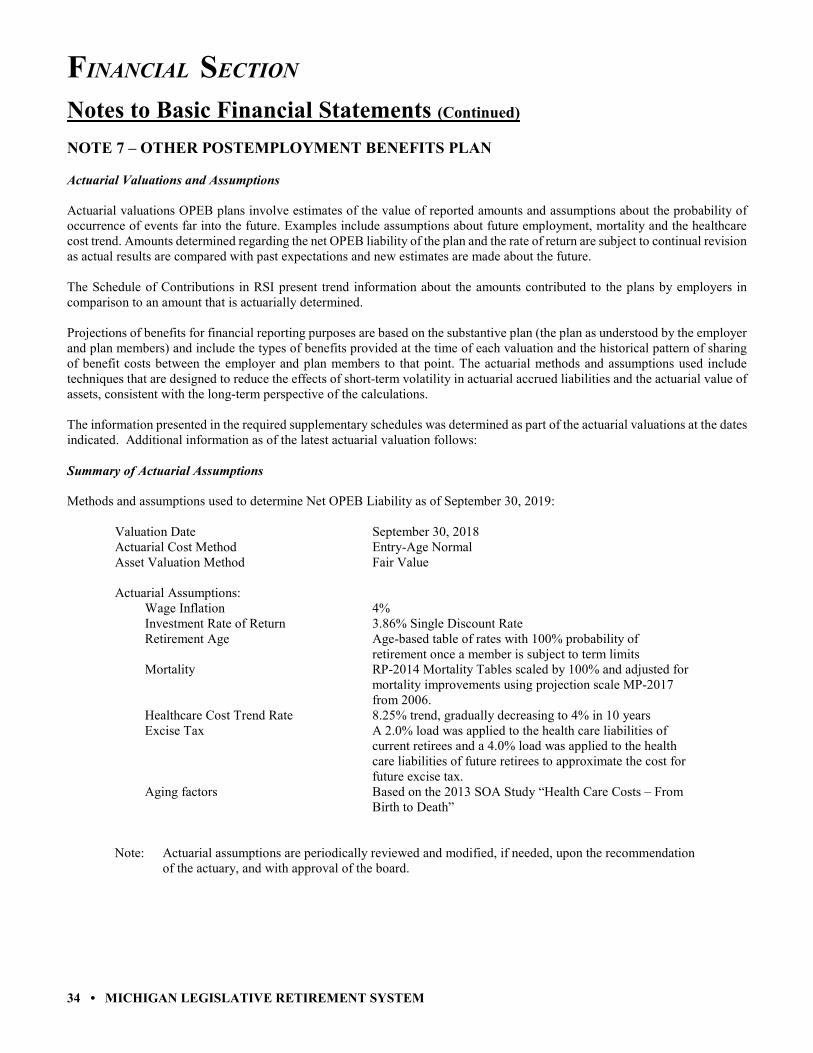
Notes to Basic Financial Statements (Continued) NOTE 7 – OTHER POSTEMPLOYMENT BENEFITS PLAN Actuarial Valuations and Assumptions Actuarial valuations OPEB plans involve estimates of the value of reported amounts and assumptions about the probability of occurrence of events far into the future. Examples include assumptions about future employment, mortality and the healthcare cost trend. Amounts determined regarding the net OPEB liability of the plan and the rate of return are subject to continual revision as actual results are compared with past expectations and new estimates are made about the future. The Schedule of Contributions in RSI present trend information about the amounts contributed to the plans by employers in comparison to an amount that is actuarially determined. Projections of benefits for financial reporting purposes are based on the substantive plan (the plan as understood by the employer and plan members) and include the types of benefits provided at the time of each valuation and the historical pattern of sharing of benefit costs between the employer and plan members to that point. The actuarial methods and assumptions used include techniques that are designed to reduce the effects of short-term volatility in actuarial accrued liabilities and the actuarial value of assets, consistent with the long-term perspective of the calculations. The information presented in the required supplementary schedules was determined as part of the actuarial valuations at the dates indicated. Additional information as of the latest actuarial valuation follows: Summary of Actuarial Assumptions Methods and assumptions used to determine Net OPEB Liability as of September 30, 2019: Valuation Date September 30, 2018 Actuarial Cost Method Entry-Age Normal Asset Valuation Method Fair Value Actuarial Assumptions: Wage Inflation 4% Investment Rate of Return 3.86% Single Discount Rate Retirement Age Age-based table of rates with 100% probability of retirement once a member is subject to term limits Mortality RP-2014 Mortality Tables scaled by 100% and adjusted for mortality improvements using projection scale MP-2017 from 2006. Healthcare Cost Trend Rate 8.25% trend, gradually decreasing to 4% in 10 years Excise Tax A 2.0% load was applied to the health care liabilities of current retirees and a 4.0% load was applied to the health care liabilities of future retirees to approximate the cost for future excise tax. Aging factors Based on the 2013 SOA Study “Health Care Costs – From Birth to Death” Note: Actuarial assumptions are periodically reviewed and modified, if needed, upon the recommendation of the actuary, and with approval of the board.
FINANCIAL SECTION
MICHIGAN LEGISLATIVE RETIREMENT SYSTEM • 35
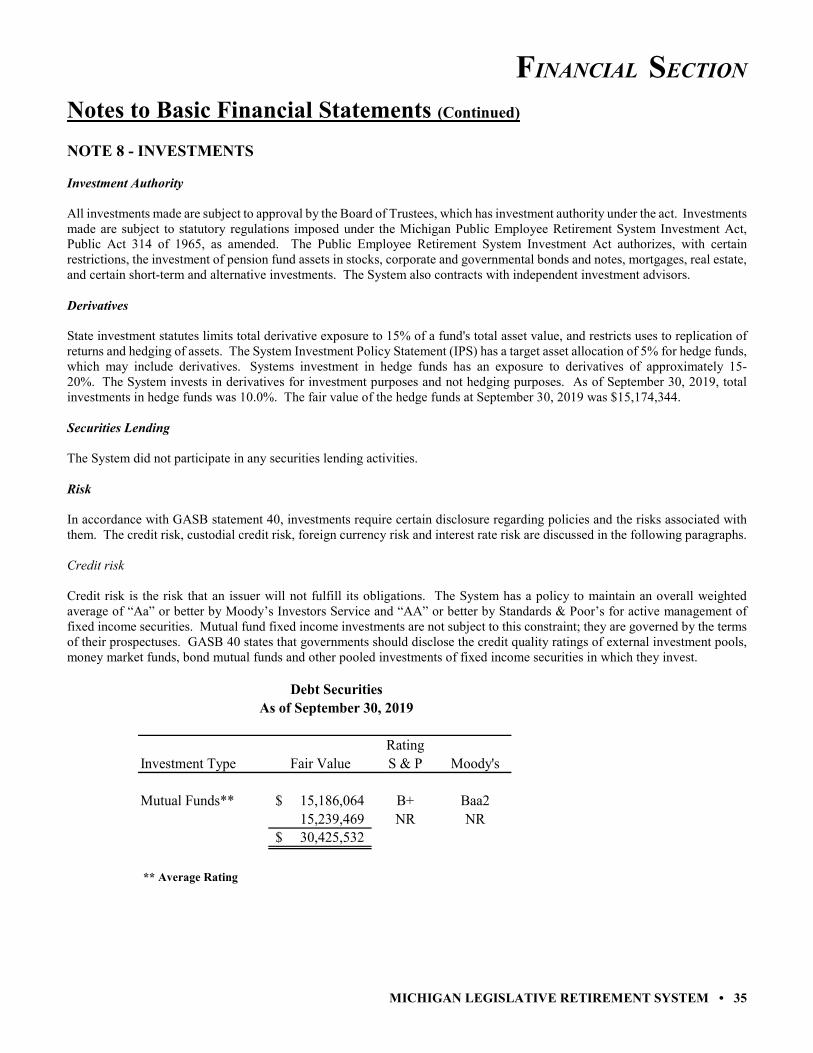
Notes to Basic Financial Statements (Continued) NOTE 8 - INVESTMENTS Investment Authority All investments made are subject to approval by the Board of Trustees, which has investment authority under the act. Investments made are subject to statutory regulations imposed under the Michigan Public Employee Retirement System Investment Act, Public Act 314 of 1965, as amended. The Public Employee Retirement System Investment Act authorizes, with certain restrictions, the investment of pension fund assets in stocks, corporate and governmental bonds and notes, mortgages, real estate, and certain short-term and alternative investments. The System also contracts with independent investment advisors. Derivatives State investment statutes limits total derivative exposure to 15% of a fund's total asset value, and restricts uses to replication of returns and hedging of assets. The System Investment Policy Statement (IPS) has a target asset allocation of 5% for hedge funds, which may include derivatives. Systems investment in hedge funds has an exposure to derivatives of approximately 15-20%. The System invests in derivatives for investment purposes and not hedging purposes. As of September 30, 2019, total investments in hedge funds was 10.0%. The fair value of the hedge funds at September 30, 2019 was $15,174,344. Securities Lending The System did not participate in any securities lending activities. Risk In accordance with GASB statement 40, investments require certain disclosure regarding policies and the risks associated with them. The credit risk, custodial credit risk, foreign currency risk and interest rate risk are discussed in the following paragraphs. Credit risk Credit risk is the risk that an issuer will not fulfill its obligations. The System has a policy to maintain an overall weighted average of “Aa” or better by Moody’s Investors Service and “AA” or better by Standards & Poor’s for active management of fixed income securities. Mutual fund fixed income investments are not subject to this constraint; they are governed by the terms of their prospectuses. GASB 40 states that governments should disclose the credit quality ratings of external investment pools, money market funds, bond mutual funds and other pooled investments of fixed income securities in which they invest.
Debt Securities
As of September 30, 2019
RatingInvestment Type Fair Value S & P Moody's
Mutual Funds** 15,186,064$ B+ Baa215,239,469 NR NR30,425,532$
** Average Rating
FINANCIAL SECTION
36 • MICHIGAN LEGISLATIVE RETIREMENT SYSTEM
Notes to Basic Financial Statements (Continued) Custodial credit risk The custodial credit risk for deposits is the risk that, in the event of the failure of a depository financial institution, the System's deposits may not be recovered. Deposits are exposed to custodial credit risk if they are not covered by depository insurance and the deposits are: a.) Uncollateralized, b.) Collateralized with securities held by the pledging financial institution, or c.) Collateralized with securities held by the pledging financial institution's trust department or agent but not in the depositor-government's name. The common cash pool is managed by the State Treasurer and is authorized to invest surplus funds in depository accounts at financial institutions, bonds, notes, and other U.S. government debt, prime commercial paper, certificates of deposits, and special State investment programs. At September 30, 2019, the common cash pool held the majority of its funds in depository accounts 13.0% and prime commercial paper 82.9%. The State Treasurer's policy for common cash depository accounts requires financial institutions to secure State funds with collateral, to be organized under federal or State law, and to maintain an office in Michigan. The policy also restricts deposits to a maximum of 50% of the financial institution's net worth. At September 30, 2019, the carrying amount of deposits including time and demand deposits, was $879.2 million. The deposits were reflected in the accounts of the banks at $879.2 million. Of the bank balance, $4.8 million was covered by federal depository insurance and $869.3 million was collateralized with securities held by the State's agent in the State's name. There were demand deposits of $5.1 million exposed to custodial credit risk that were uninsured and uncollateralized. The State Treasurer's policy requires prime commercial paper to be rated "A-1" by S&P or "P-1" by Moody's or higher at purchase and places requirements and restrictions on the borrower. Additional details on the common cash pool policies and risk disclosures are described in the State of Michigan Comprehensive Annual Financial Report. Concentration of Credit Risk Concentration of credit risk is the risk of loss attributed to the magnitude of a government's investment in a single issuer. System is prohibited by Public Act 314 of 1965, as amended, from investing in more than 5% of the outstanding stock or obligations of any one issuer or investing more than 5% of its assets in the stock or obligations of any one issuer. At September 30, 2019, there were no investments in any one issuer that accounted for more than 5% of System's assets nor were there any investments totaling more than 5% of the stock or obligations of any one issuer. Foreign currency risk Foreign currency risk is the risk that changes in exchange rates will adversely affect the fair value of deposits. Public Act 35 of 1997 requires State deposits be held in a financial institution which maintains a principal office or branch office located in the State of Michigan. The System had no common cash deposits subject to foreign currency risk at September 30, 2019. Custodial credit risk associated with investments In accordance with GASB statement 40, investments also require certain disclosures regarding policies and procedures with respect to the risks associated with them. The custodial credit risk for investments is the risk that, in the event of a failure of the counterparty, the System will not be able to recover the value of the investment or collateral securities that are in the possession of an outside party. Investment securities are exposed to custodial credit risk if the securities are uninsured, are not registered in the name of the government and are held by either: a.) the counterparty, or b.) the counterparty's trust department or agent but are not in the government's name. The State Treasurer does not have an investment policy for managing custodial credit risk. At September 30, 2019, the System's investments were not exposed to custodial credit risk.

FINANCIAL SECTION
MICHIGAN LEGISLATIVE RETIREMENT SYSTEM • 37
Notes to Basic Financial Statements (Continued) Interest rate risk associated with investments Interest rate risk is the risk that changes in interest rates of debt investments will adversely affect the fair value of an investment. The System has an 18% target allocation of fixed income securities, which are affected by interest rates because they are a debt investment. At September 30, 2019, the fair value was $30,425,532, with the investment activity for the year producing a total rate of return of 8.5%, and a rate of return since inception of 3.6%. The projected duration is 3.89 years. The System does not have a policy for controlling interest rate risk. Foreign currency risk associated with investments Foreign currency risk is the risk that changes in exchange rates will adversely affect the fair value of investments. The System invests in various foreign investments (including, but not limited to, equities, fixed income, and mutual funds), which are subject to various limitations in accordance with the System's Investment Policy Statement (or "IPS") (which incorporates the provisions of the Public Employee Retirement System Investment Act, or Public Act 314 of 1965, as amended). IPS foreign investment restrictions include a 20% limitation of the total assets of the system and, additionally, a 5% limitation in the outstanding foreign securities of a single issuer (allowances are made for the daily market pricing fluctuations of an investment). New investments in countries that have been identified by the United States Department of State as engaging in or sponsoring terrorism are prohibited, and existing investments in any such newly-identified country shall be quickly divested in accordance with the law. At September 30, 2019, the System held the following investments subject to foreign currency risk:
Foreign Currency RiskAs of September 30, 2019
(Value in US dollars)Mutual International
Country Currency Alt. Invest Funds Equities TOTAL
PACIFICChina Renminbi $ $ 121,743$ 121,743$
EUROPEUnited Kingdom Sterling 331,046 331,046
WORLD-WIDEVarious Various 15,174,344 42,149,192 57,323,536
Total 15,174,344$ 42,149,192$ 452,789$ 57,776,325$
Significant Accounting Policies As of September 30, 2016, the Retirement System applies Governmental Accounting Standards Board (“GASB”) Statement No. 72, Fair Value Measurement and Application. GASB Statement No. 72 provides guidance for determining a fair value measurement for reporting purposes and applying fair value to certain investments and disclosures related to all fair value measurements.
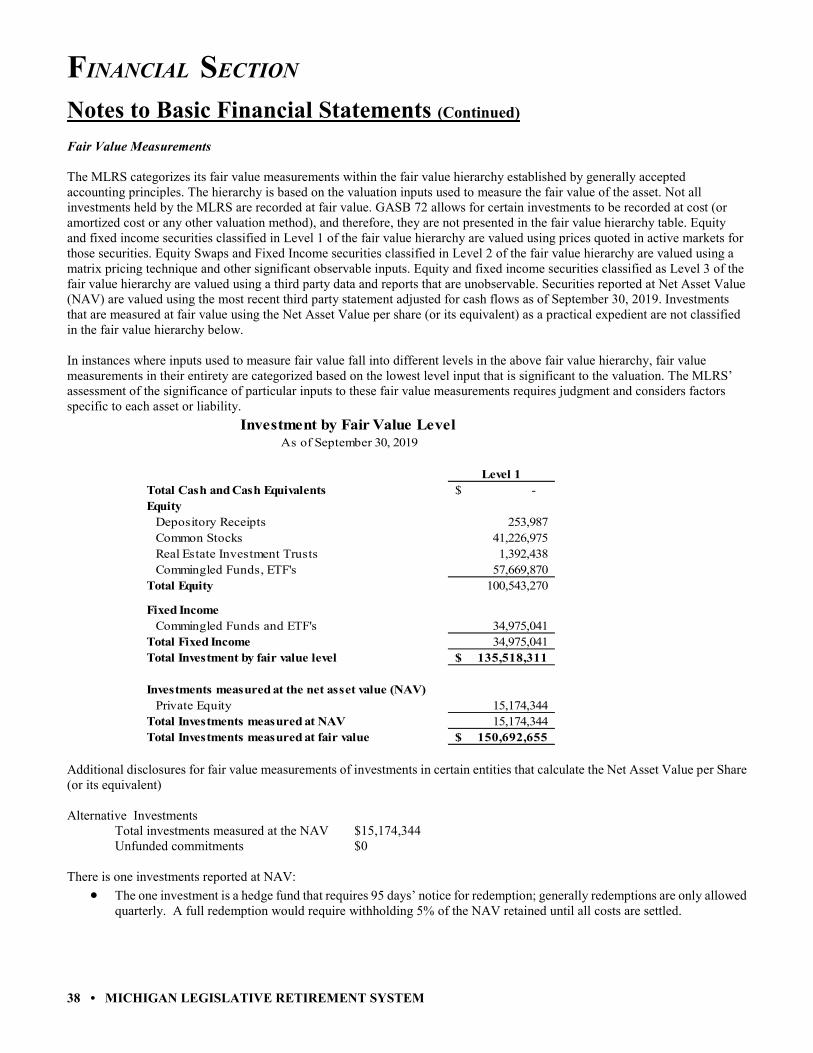
FINANCIAL SECTION
38 • MICHIGAN LEGISLATIVE RETIREMENT SYSTEM
Notes to Basic Financial Statements (Continued) Fair Value Measurements The MLRS categorizes its fair value measurements within the fair value hierarchy established by generally accepted accounting principles. The hierarchy is based on the valuation inputs used to measure the fair value of the asset. Not all investments held by the MLRS are recorded at fair value. GASB 72 allows for certain investments to be recorded at cost (or amortized cost or any other valuation method), and therefore, they are not presented in the fair value hierarchy table. Equity and fixed income securities classified in Level 1 of the fair value hierarchy are valued using prices quoted in active markets for those securities. Equity Swaps and Fixed Income securities classified in Level 2 of the fair value hierarchy are valued using a matrix pricing technique and other significant observable inputs. Equity and fixed income securities classified as Level 3 of the fair value hierarchy are valued using a third party data and reports that are unobservable. Securities reported at Net Asset Value (NAV) are valued using the most recent third party statement adjusted for cash flows as of September 30, 2019. Investments that are measured at fair value using the Net Asset Value per share (or its equivalent) as a practical expedient are not classified in the fair value hierarchy below. In instances where inputs used to measure fair value fall into different levels in the above fair value hierarchy, fair value measurements in their entirety are categorized based on the lowest level input that is significant to the valuation. The MLRS’ assessment of the significance of particular inputs to these fair value measurements requires judgment and considers factors specific to each asset or liability.
Investment by Fair Value Level As of September 30, 2019
Level 1Total Cash and Cash Equivalents -$ Equity
Depository Receipts 253,987 Common Stocks 41,226,975 Real Estate Investment Trusts 1,392,438 Commingled Funds, ETF's 57,669,870
Total Equity 100,543,270
Fixed IncomeCommingled Funds and ETF's 34,975,041
Total Fixed Income 34,975,041 Total Investment by fair value level 135,518,311$
Investments measured at the net asset value (NAV)Private Equity 15,174,344
Total Investments measured at NAV 15,174,344 Total Investments measured at fair value 150,692,655$
Additional disclosures for fair value measurements of investments in certain entities that calculate the Net Asset Value per Share (or its equivalent) Alternative Investments Total investments measured at the NAV $15,174,344 Unfunded commitments $0 There is one investments reported at NAV:
• The one investment is a hedge fund that requires 95 days’ notice for redemption; generally redemptions are only allowed quarterly. A full redemption would require withholding 5% of the NAV retained until all costs are settled.

FINANCIAL SECTION
MICHIGAN LEGISLATIVE RETIREMENT SYSTEM • 39
Notes to Basic Financial Statements (Continued)
This page was intentionally left blank.

FINANCIAL SECTION
40 • MICHIGAN LEGISLATIVE RETIREMENT SYSTEM
Required Supplementary Information
Schedule of Changes in Net Pension Liability
Fiscal years ending September 30, 2019 2018 2017 2016 2015(1)
Total pension liability
Service Cost 38,955$ 77,125$ 85,889$ 73,996$ 61,979$
Interest on the total pension liability 11,050,515 10,555,045 10,213,286 11,025,152 11,839,056
Benefit changes - - - - -
Difference between expected and actual experience
of the total pension liability 479,528 66,388 (1,617,292) 1,899,056 405,924
Assumption changes 30,744,212 (3,054,941) (13,496,599) 18,936,985 20,079,527
Benefit payments and refunds (14,129,965) (14,521,128) (14,282,224) (13,919,312) (14,495,307)
Net changes in total pension liability 28,183,245 (6,877,511) (19,096,940) 18,015,877 17,891,179
Total pension liability - beginning 239,687,925 246,565,436 265,662,376 247,646,499 229,755,320
Total pension liability - ending (a) 267,871,170$ 239,687,925$ 246,565,436$ 265,662,376$ 247,646,499$
Plan fiduciary net position
Employer contributions 8,063,327$ -$ -$ -$ -$
Employee contributions 2,445 998 3,895 3,648 3,226
Pension plan net investment income 3,319,925 8,629,843 15,840,766 11,324,783 (6,545,332)
Benefit payments and refunds (14,129,965) (14,521,128) (14,282,224) (13,919,312) (14,495,307)
Pension plan administrative expense (405,319) (398,871) (391,937) (405,381) (362,431)
Other - - 6,649 - -
Net change in plan fiduciary net position (3,149,587) (6,289,158) 1,177,149 (2,996,262) (21,399,844)
Plan fiduciary net position - beginning 125,448,449 131,737,607 130,560,458 133,556,720 154,956,564
Plan fiduciary net position - ending (b) 122,298,862$ 125,448,449$ 131,737,607$ 130,560,458$ 133,556,720$
Net pension liability - (a) - (b) 145,572,308 114,239,476 114,827,829 135,101,918 114,089,779
Plan fiduciary net position as a percentage
of total pension liability 45.66% 52.34% 53.43% 49.15% 53.93%
Covered payroll (2) 71,685$ 71,685$ 71,685$ 71,685$ 71,685$
Net pension liability as a percentage
of covered payroll 203,072.20% 159,363.15% 160,183.90% 188,466.09% 159,154.33%
(1) Schedule has been restated due to retroactively applying mortality assumption change.(2) Payroll is for prior fiscal year since GASB 67 uses a roll forward and actuarial valuation data from prior fiscal year.

FINANCIAL SECTION
MICHIGAN LEGISLATIVE RETIREMENT SYSTEM • 41
Required Supplementary Information (Continued)
2014(1)
56,715$
11,297,018
-
-
24,547,477
(13,550,106)
22,351,104
207,404,216
229,755,320$
-$
5,662
14,868,119
(13,550,106)
(430,200)
-
893,475
154,063,089
154,956,564$
74,798,756
67.44%
71,685$
104,343.66%

FINANCIAL SECTION
42 • MICHIGAN LEGISLATIVE RETIREMENT SYSTEM
Required Supplementary Information (Continued) Schedule of Changes in Net OPEB Liability
Fiscal years ending September 30, 2019 2018 2017
Total O PEB liability
Service Cost 1,147,517$ 1,482,175$ 797,000$
Interest on the total OPEB liability 7,517,765 7,076,802 8,463,585
Changes in benefit terms - - -
Difference between expected and actual experience (25,628,961) 3,291,754 18,099
Changes of assumptions 4,385,679 (9,407,229) 66,226,054
Benefit payments, including refunds
of employee contributions (6,163,773) (6,695,207) (6,342,947)
Net changes in total O PEB liability (18,741,773) (4,251,705) 69,161,791
Total O PEB liability - beginning 188,591,416 192,843,121 123,681,330
Total O PEB liability - ending (a) 169,849,643$ 188,591,416$ 192,843,121$
Plan fiduciary net position
Employer contributions 9,091,371$ 4,657,040$ 4,571,636$
Employee contributions 1,737 6,452 6,452
OPEB plan net investment income 625,677 1,573,478 2,754,692
Benefit payments, including refunds
of employee contributions (6,163,773) (6,695,207) (6,342,947)
OPEB plan administrative expense (80,542) (74,201) (68,871)
Other 1,379,333 953,927 643,981
Net change in plan fiduciary net position 4,853,803 421,489 1,564,943
Plan fiduciary net position - beginning 24,928,368 24,506,879 22,941,936
Plan fiduciary net position - ending (b) 29,782,171$ 24,928,368$ 24,506,879$
Net O PEB liability - (a) - (b) 140,067,472$ 163,663,048$ 168,336,242$
Plan fiduciary net position as a percentage
of total O PEB liability 17.53% 13.22% 12.71%

FINANCIAL SECTION
MICHIGAN LEGISLATIVE RETIREMENT SYSTEM • 43
Required Supplementary Information (Continued)
Schedules of Contributions
Pension Benefits
Fiscal Year Actuarially Actual Contribution Actual ContributionEnded Determined Employer Deficiency Covered as a % of
Sept. 30 Contribution Contributions (Excess) Payroll Covered Payroll
2010 $774,898 $0 $774,898 $1,173,100 0.0 %2011 1,890,998 0 1,890,998 143,370 0.02011 (1) 2,915,182 0 2,915,182 143,370 0.02012 4,390,831 0 4,390,831 71,685 0.02013 5,993,209 0 5,993,209 71,685 0.02014 6,327,209 0 6,327,209 71,685 0.0
2015 7,843,450 0 7,843,450 71,685 0.02016 8,063,327 0 8,063,327 71,685 0.02017 7,878,170 0 7,878,170 71,685 0.02018 8,236,583 0 8,236,583 71,685 0.02019 9,348,433 8,063,327 1,285,106 17,921 N/A (2)
(1) Under revised mortality assumptions.(2) For the 2019 and later valuations, a contribution percentage is not computed because the Retirement System is closed.
Other Postemployment Benefits(1)
Fiscal Year Actuarially Actual Contribution Actual ContributionEnded Determined Employer Deficiency Covered as a % of
Sept. 30 Contribution Contributions (Excess) Payroll Covered Payroll
2010 $10,842,010 $4,514,665 $6,327,345 $11,598,113 38.9 %2011 11,817,097 4,287,509 7,529,588 3,658,557 117.22012 9,674,141 7,840,322 1,833,819 3,586,872 218.62013 9,630,395 4,240,388 5,390,007 3,312,132 128.02014 9,381,877 4,323,381 5,058,496 2,497,497 173.1
2015 9,362,804 4,473,374 4,889,430 1,733,547 258.02016 10,464,110 4,537,633 5,926,477 1,661,862 273.02017 11,336,578 4,571,636 6,764,942 1,661,862 275.1
2018(2) 11,631,582 4,657,040 6,974,542 N/A N/A2019 10,172,054 9,091,371 1,080,683 N/A N/A
(1) Includes members in both the defined benefit plan and the defined contribution plan(2) Beginning FY2018, covered payroll is not disclosed

FINANCIAL SECTION
44 • MICHIGAN LEGISLATIVE RETIREMENT SYSTEM
Required Supplementary Information (Continued)
Schedules of Investment Returns
Pension Benefits
Fiscal Years Ending AnnualSeptember 30, Return*
2014 9.76 %2015 (4.61) 2016 8.58 2017 12.44 2018 6.58 2019 2.30
* Annual money-weighted rate of return, net of investment expenses
Other Postemployment Benefits
Fiscal Years Ending AnnualSeptember 30, Return*
2017 14.87 %2018 10.34 2019 6.74
* Annual money-weighted rate of return, net of investment expenses NOTE A - DESCRIPTION Ten-year historical trend information designed to provide information about the System's progress in accumulating sufficient assets to pay benefits when due is presented in the preceding schedules. Other ten-year historical trend information related to the System is presented in the Statistical and Actuarial sections of the report. This information is presented to enable the interested parties to assess the progress made by the System in accumulating sufficient assets to pay pension benefits and other postemployment benefits as they become due. In accordance with GASB Statement No. 67, six years of historical trend information is provided. Also, in accordance with GASB 74, three years of historical trend information is provided. The comparability of trend information is affected by changes in actuarial assumptions, benefit provisions, actuarial funding methods, accounting policies, and other changes. Those changes usually affect trends in contribution requirements and in ratios that use the pension benefit and OPEB obligations as a factor. A change in actuarial assumption, beginning with fiscal year ending September 30, 2018, was made to use the RP-2014 Mortality Table scaled by 100% and adjusted for mortality improvements using projection scale MP-2017 from 2006. The Schedule of Contributions is reported as historical trend information. The schedule is presented to show the responsibility of the State in meeting the actuarial requirements to maintain the System on a sound financial basis. The Schedule of Changes in Net Pension Liability, Schedule of Contributions, and Schedule of Investment Returns are schedules that are required in implementing GASB Statement No. 67. The Schedule of Changes in Net OPEB Liability, Schedule of Contributions, and Schedule of Investment Returns are schedules that are required in implementing GASB Statement No. 74. These schedules are required to show information for ten years. Additional years will be displayed as it becomes available. The Schedule of Changes in Net Pension Liability and the Schedule of Changes in Net OPEB Liability represents in actuarial terms, the accrued liability less the market value of assets. The Schedule of Contributions is a comparison of the employer’s contributions to the actuarially determined contributions. The Schedule of Investment Returns represents a money-weighted rate of return that expresses investment performances, net of investment expense, adjusted for the changing amounts actually invested.
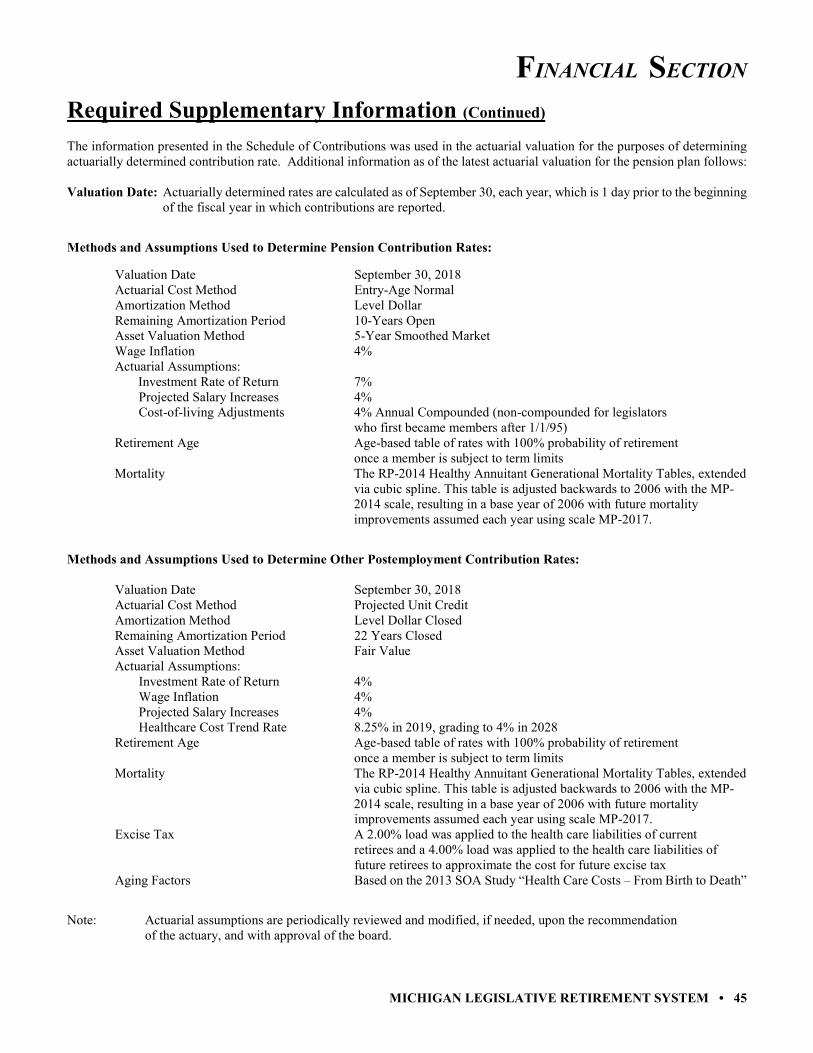
FINANCIAL SECTION
MICHIGAN LEGISLATIVE RETIREMENT SYSTEM • 45
Required Supplementary Information (Continued) The information presented in the Schedule of Contributions was used in the actuarial valuation for the purposes of determining actuarially determined contribution rate. Additional information as of the latest actuarial valuation for the pension plan follows: Valuation Date: Actuarially determined rates are calculated as of September 30, each year, which is 1 day prior to the beginning
of the fiscal year in which contributions are reported. Methods and Assumptions Used to Determine Pension Contribution Rates: Valuation Date September 30, 2018 Actuarial Cost Method Entry-Age Normal Amortization Method Level Dollar Remaining Amortization Period 10-Years Open Asset Valuation Method 5-Year Smoothed Market Wage Inflation 4% Actuarial Assumptions: Investment Rate of Return 7% Projected Salary Increases 4% Cost-of-living Adjustments 4% Annual Compounded (non-compounded for legislators who first became members after 1/1/95) Retirement Age Age-based table of rates with 100% probability of retirement once a member is subject to term limits Mortality The RP-2014 Healthy Annuitant Generational Mortality Tables, extended via cubic spline. This table is adjusted backwards to 2006 with the MP- 2014 scale, resulting in a base year of 2006 with future mortality improvements assumed each year using scale MP-2017. Methods and Assumptions Used to Determine Other Postemployment Contribution Rates: Valuation Date September 30, 2018 Actuarial Cost Method Projected Unit Credit Amortization Method Level Dollar Closed Remaining Amortization Period 22 Years Closed Asset Valuation Method Fair Value Actuarial Assumptions: Investment Rate of Return 4% Wage Inflation 4% Projected Salary Increases 4% Healthcare Cost Trend Rate 8.25% in 2019, grading to 4% in 2028 Retirement Age Age-based table of rates with 100% probability of retirement once a member is subject to term limits Mortality The RP-2014 Healthy Annuitant Generational Mortality Tables, extended via cubic spline. This table is adjusted backwards to 2006 with the MP- 2014 scale, resulting in a base year of 2006 with future mortality improvements assumed each year using scale MP-2017. Excise Tax A 2.00% load was applied to the health care liabilities of current retirees and a 4.00% load was applied to the health care liabilities of future retirees to approximate the cost for future excise tax Aging Factors Based on the 2013 SOA Study “Health Care Costs – From Birth to Death” Note: Actuarial assumptions are periodically reviewed and modified, if needed, upon the recommendation of the actuary, and with approval of the board.

FINANCIAL SECTION
46 • MICHIGAN LEGISLATIVE RETIREMENT SYSTEM
Supporting Schedules
Summary Schedule of Administrative ExpensesFor Year Ended September 30, 2019
Personnel services 343,538$ Actuarial services 64,930 Audit 29,800 Attorney & other professional services 1,585 Postage, telephone and other 46,009
Total Administrative Expenses 485,861$
Schedule of Investment Expenses*For Year Ended September 30, 2019
Management fees 330,646$ State Treasurer and custody fees 22,913 Other investment expenses 95,805
Total Investment Expenses 449,364$
*Mutual fund management fees are netted againt returns earned.
Schedule of Payments to ConsultantsFor Year Ended September 30, 2019
VanOverbeke Michaud & Timmony PC 893$ Dykema Gossett 692 Gabriel Roeder 64,930
Total Payments to Consultants 66,515$

FINANCIAL SECTION
MICHIGAN LEGISLATIVE RETIREMENT SYSTEM • 47
Supporting Schedules (Continued) Detail of Changes in Plan Fiduciary Net Position (Pension and Other Postemployment Benefits) For Year Ended September 30, 2019
Member Member Survivors Insurance Health
Savings Retirement Retirement Revolving Insurance Income
Fund Fund Fund Fund Fund Fund Total
ADDITIONS
Member contributions:
Other member contributions $ $ $ 2,445$ 1,737$ $ 4,182$
Employer contributions 8,063,327 8,337,573 16,400,900
Court fees 753,798 753,798
Other governmental contributions 353,649 353,649
Total contributions: 8,063,327 2,445 9,446,757 17,512,529
Investment income (loss)
Net increase (decrease) in fair
value of investments 26,261 132,156 158,417
Interest, dividends and other 673,908 3,562,641 4,236,549
Total investment income (loss) 700,169 3,694,797 4,394,966
Less investment expenses (74,492) (374,872) (449,364)
Net investment income (loss) 625,677 3,319,925 3,945,602
Miscellaneous income 1,025,684 1,025,684
Total additions: 8,063,327 2,445 11,098,118 3,319,925 22,483,815
DEDUCTIONS
Benefits & refunds paid to plan members & beneficiaries:
Retirement benefits 11,579,049 2,429,636 14,008,685
Health benefits 5,791,875 5,791,875
Dental benefits 371,898 371,898
Death benefits 121,280 121,280
Administrative expenses 80,543 405,319 485,861
Total deductions: 11,579,049 2,429,636 121,280 6,244,315 405,319 20,779,600
Net increase (decrease) in net position (3,515,722) (2,429,636) (118,835) 4,853,802 2,914,606 1,704,216
Other changes in net position:
Interest/loss allocations 4,063 483,049 1,765,203 662,290 (2,914,606)
Transfer upon retirements (18,354) 18,354
Total other changes in net position (14,291) 501,403 1,765,203 662,290 (2,914,606)
Net increase (decrease) after changes (14,291) (3,014,319) (664,433) 543,456 4,853,802 1,704,216
Net position restricted for pension benefits and OPEB:
Beginning of Year: 101,585 20,803,228 76,021,109 28,522,527 24,928,368 150,376,817
End of Year: 87,294$ 17,788,909$ 75,356,676$ 29,065,983$ 29,782,171$ $ 152,081,033$

FINANCIAL SECTION
48 • MICHIGAN LEGISLATIVE RETIREMENT SYSTEM
This page was intentionally left blank.

INVESTMENT SECTION
MICHIGAN LEGISLATIVE RETIREMENT SYSTEM • 49
Michigan Legislative Retirement System
Comprehensive Annual Financial Report for the Fiscal Year Ended September 30, 2019
INVESTMENT SECTION
Report on Investment Activity Asset Allocation
Investment Summary List of Largest Assets Held
Schedule of Investment Fees Schedule of Fees and Commissions

INVESTMENT SECTION
50 • MICHIGAN LEGISLATIVE RETIREMENT SYSTEM
Report on Investment Activity
INTRODUCTION The System's Board of Trustees is the investment fiduciary for the system in accordance with the law. Investment decisions, including investment policies and procedures, are subject to statutory regulations imposed by the Michigan Public Employee Retirement System Investment Act, Public Act 314 of 1965, as amended. As the investment fiduciary for the system, the board’s responsibilities include, but are not limited to: (1) establishing an investment policy and asset allocation for the System pension fund; (2) prudently selecting investment managers and consultants for the system, and (3) conducting periodic reviews to ensure that its policies are followed and that its investment professionals perform satisfactorily in accordance with established standards and goals. The State Treasurer for the State of Michigan acts as the custodian for the System funds pursuant to state law, and the board has also contracted with independent investment advisors to assist with investment decisions and to manage the pension fund assets. Fund Evaluation Group (FEG) is the investment advisor for the System and they monitor all the investments and the performance of the investments for both the pension and OPEB funds. The market review is prepared in its entirety by FEG. While the rest of the report of investment activity is prepared by the System, using information from FEG. INVESTMENT OBJECTIVES The System’s primary investment objective is to provide a real rate of return, net of inflation, administrative and investment expenses, sufficient to support the system’s ability to meet its obligations to plan participants and beneficiaries without undue exposure to risk. In absolute terms, this return objective should approximate the System’s actuarial assumed rate of return, which is currently 7%. The System seeks to attain investment results over a full market cycle. It does not expect that all investment objectives will be attained in each year and recognizes that over various periods of time the System investment results may produce significant “over” or “under” performance relative to broad markets. For this reason, the board of trustees takes a LONG-TERM perspective and will measure quantitative investment returns over a 5-year moving period. Managers and other parties are also expected to meet qualitative performance objectives (adherence to its investment philosophy and System policies, continuity of firm personnel and practices, etc.) as established by the board. MARKET REVIEW Twelve Months Ending September 30, 2019 Over the last year, the U.S. economy has gone from expectations of steady growth to concerns over a potential recession on the horizon. The Federal Reserve switched gears from a multi-year tightening cycle, to a brief “pause,” to today’s environment of policy easing. During the Legislative Retirement System’s (LRS) fiscal year ended September 30, 2019, equity markets experienced heighted volatility. The fiscal year started with double-digit negative returns, only to be followed by double-digit positive returns in the second fiscal quarter. Since the end of March, equity returns have been more muted. At the same time, bond returns have outpaced equity returns as interest rates have declined. Within this environment, the LRS large cap domestic equity managers produced positive returns, but it was the fixed income segment that produced the strongest absolute returns. (See chart on top of page 51)

INVESTMENT SECTION
MICHIGAN LEGISLATIVE RETIREMENT SYSTEM • 51
Report on Investment Activity (Continued) MARKET REVIEW (continued)
International equity performance continued to suffer on a relative basis due to the appreciating U.S. dollar, trade tensions, particularly with China, and slower economic growth. The European Central Bank is grappling with a growth slowdown, the theme of which has been in place for the past handful of quarters but has recently gathered pace. The United Kingdom changed leadership as part of the ongoing Brexit saga. Asia and other emerging market regions struggled during the year due to the impacts to China of the ongoing trade war and secondary effects to Chinese trading partners. Argentina suffered from a geopolitical shock in August, as stocks sold off due to the presidential election surprise. Similar to last fiscal year, the LRS portfolio’s holding in the international markets detracted from the overall returns generated during the twelve months ended September 30, 2019.

INVESTMENT SECTION
52 • MICHIGAN LEGISLATIVE RETIREMENT SYSTEM
Report on Investment Activity (Continued) MARKET REVIEW (continued)
The Treasury yield curve inverted during portions of the last several months. In past economic cycles, an inverted yield curve has often been a leading indicator of a future recession. However, the pressure on the yield curve subsided as the Federal Open Market Committee (FOMC) decreased the federal funds rate in July and September (25 bps each time), bringing the target range to 1.75%-2.00%. The decrease in Treasury interest rates led to price increases across the higher quality fixed income market (e.g., Bloomberg Barclays Aggregate Bond Index, see chart below). While producing strong absolute results, the LRS fixed income managers lagged the broad fixed income market due to their duration posture.
After a difficult start to the fiscal year, the Legislative Retirement System bounced back and produced a positive return of 2.8% net-of-fees for the one-year period ending September 30, 2019. Over longer time periods, the LRS portfolio returned 5.2% (net of fees) over five years and 8.1% (net of fees) over ten years. For comparison, the actuarially assumed rate-of-return is 7%. At the same time, the LRS portfolio has exceeded its market benchmark over most time periods. The LRS portfolio remains well-diversified and positioned to generate results under a wide variety of economic scenarios. The largest allocations within the portfolio continue to be domestic and non-U.S. equity investments combined with investment grade fixed. The portfolio includes allocations to real asset investments to offer inflation protection as well as non-traditional exposures to provide diversification to the total portfolio. The LRS Trustees continued to meet on a regular basis to discuss markets, managers and portfolio positioning. The Trustees met several times toward the end of the previous fiscal year and into the current fiscal year to discuss modifications to the portfolio’s asset allocation and investment manager structure. The changes to asset allocation included modest increases in global equity and diversifying strategies with corresponding decreases in fixed income and real assets. Several changes were made to the investment manager line-up, as well, in part to streamline and reduce fees in certain segments of the portfolio. The resulting decisions were implemented primarily during the first half of the 2019 fiscal year.

INVESTMENT SECTION
MICHIGAN LEGISLATIVE RETIREMENT SYSTEM • 53
Report on Investment Activity (Continued)
Schedule of Investment Resultsfor period ending September 30, 2019
Annualized Rate of Return1
Investment Category Current Year 3 years 5 years 10 years
Total Portfolio 2.8 % 7.4 % 5.2 % 8.1 %
Large Cap Equity ManagersWellington 9.5 20.2 15.8 15.3 Barrow, Hanley, Mewhinney & Strauss 3.3 11.4 8.3 11.3
Russell 1000 Growth Index 3.7 16.9 13.4 14.9 Fidelity 500 Index
S&P 500 Index 4.3 13.4 10.8 13.2
Small Cap Equity ManagersRice Hall James (12.4) 5.4 5.4 10.9 Cramer Rosenthal McGlynn (1.8) 9.3 9.2 10.9
Russell 2000 Index (8.9) 8.2 8.2 11.2
International Equity ManagersEuroPacific Growth 0.8 7.0 4.7 5.7 Fidelity Total International Index
MSCI AC World Index (1.2) 6.3 2.9 4.5 DFA Emerging Markets FundRWC Emerging Markets Equity Fund
MSCI Emerging Markets Index
Fixed Income ManagersDodge & Cox Income Fund 9.1 3.8 DoubleLine Total Return Bond Fund 7.9 3.2 3.5
Bloomberg Barclays US Aggregate Ind 10.3 2.9 3.4
Natural Resources ManagersTortoise MLP & Pipeline Fund (2.4)
Alerian MLP Index (8.1) PIMCO Inflation Response
PIMCO IRMAF Benchmark
Hedge Fund ManagerIronwood International Ltd 2.8 5.4 4.1
HFRI FOF: Conservative Index 1.0 3.1 2.0
1 Calculations used a time-weighted net-of-fees total return based on the market rate of return in accordanace with industry standards

INVESTMENT SECTION
54 • MICHIGAN LEGISLATIVE RETIREMENT SYSTEM
Asset Allocation
As of September 30, 2019
Investment Summary
As of September 30, 2019
Percentages PercentagesFair of Fair of Income/ Fiscal Year
Investment Category Value Value (Loss) Income/(Loss)**
Short Term Investments*& Common Stocks 42,619,413$ 28.3 % (165.5) % (7,273,811)$ International Equity 253,987 0.2 1.2 50,469 S&P 500 Index Fund 10,739,295 7.1 181.5 7,977,110 Energy 4,781,383 3.2 4.3 189,256 Emerging Markets 12,887,156 8.5 2.9 128,775 Alternative Investments 15,174,344 10.1 (35.5) (1,558,272) Fixed Income Mutual Funds 34,975,041 23.2 32.4 1,424,578 International Mutual Funds 29,262,036 19.4 78.7 3,456,862
Total Investments 150,692,655$ 100.0 % 100.0 % 4,394,966$
* Short Term Investments are equity in the State Treasurer's Common Cash Fund. **Includes realized/unrealized gains and losses.
Short Term Investments & Common Stock
28.3%
Emerging Markets
8.5%
InternationalEquity0.2%
S&P 500 IndexFund7.1%
Energy3.2%Alternative
Investments19.4%
Fixed Income Mutual Funds
23.2%
International Mutual Funds
19.4%
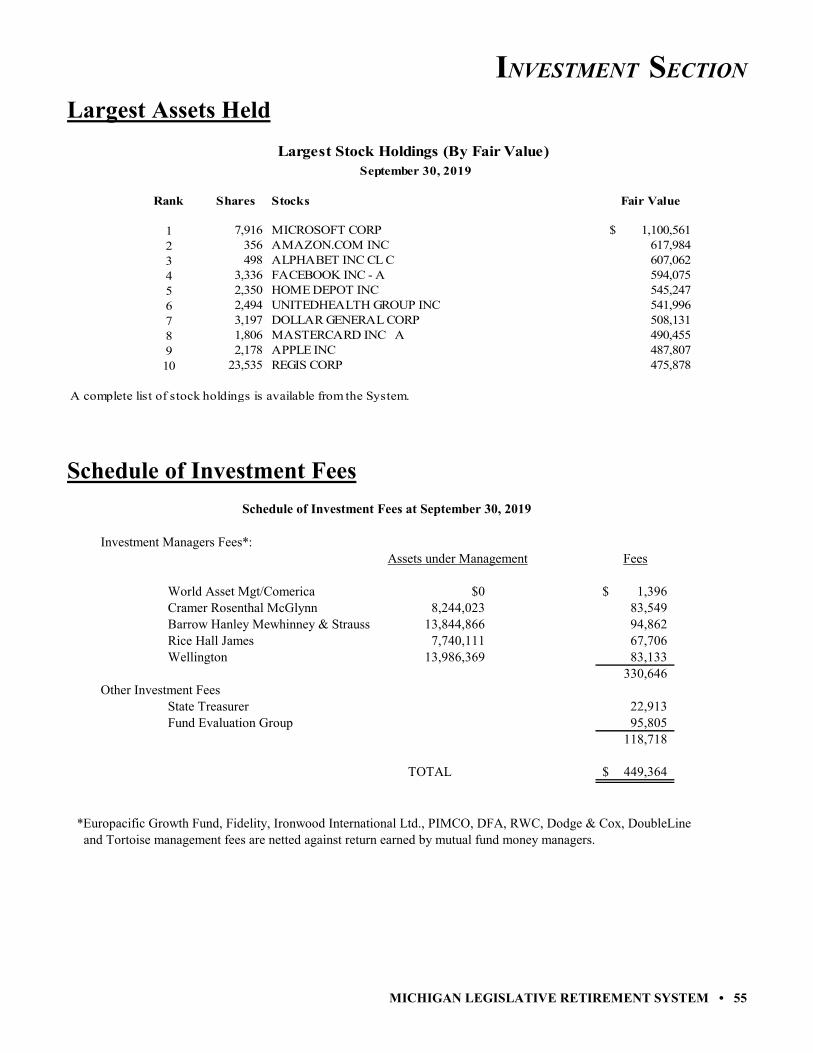
INVESTMENT SECTION
MICHIGAN LEGISLATIVE RETIREMENT SYSTEM • 55
Largest Assets Held
Largest Stock Holdings (By Fair Value) September 30, 2019
Rank Shares Stocks Fair Value
1 7,916 MICROSOFT CORP 1,100,561$ 2 356 AMAZON.COM INC 617,984 3 498 ALPHABET INC CL C 607,062 4 3,336 FACEBOOK INC - A 594,075 5 2,350 HOME DEPOT INC 545,247 6 2,494 UNITEDHEALTH GROUP INC 541,996 7 3,197 DOLLAR GENERAL CORP 508,131 8 1,806 MASTERCARD INC A 490,455 9 2,178 APPLE INC 487,807 10 23,535 REGIS CORP 475,878
A complete list of stock holdings is available from the System.
Schedule of Investment Fees
Schedule of Investment Fees at September 30, 2019
Investment Managers Fees*:Assets under Management Fees
World Asset Mgt/Comerica $0 1,396$ Cramer Rosenthal McGlynn 8,244,023 83,549
Barrow Hanley Mewhinney & Strauss 13,844,866 94,862 Rice Hall James 7,740,111 67,706 Wellington 13,986,369 83,133
330,646 Other Investment Fees
State Treasurer 22,913 Fund Evaluation Group 95,805
118,718
TOTAL 449,364$
*Europacific Growth Fund, Fidelity, Ironwood International Ltd., PIMCO, DFA, RWC, Dodge & Cox, DoubleLine and Tortoise management fees are netted against return earned by mutual fund money managers.

INVESTMENT SECTION
56 • MICHIGAN LEGISLATIVE RETIREMENT SYSTEM
Schedule of Fees and Commissions
Fiscal Year Ended September 30, 2019Shares Total Value Average Commission
Investment Broker Name Traded of Commissions Per ShareABEL NOSER CORP 15,103 604.12 0.04 ALLEN & COMPANY LLC 3,200 64.00 0.02 B.RILEY & CO., LLC 4,299 128.97 0.03 BARCLAYS CAPITAL LE 19,327 245.76 0.01 BMO CAPITAL MARKETS 11,787 414.94 0.04 BOFA SECURITIES, INC. 3,108 108.50 0.03 BTIG, LLC 9,441 254.06 0.03 BUCKINGHAM RESEARCH GROUP INC 1,565 62.60 0.04 CANACCORD GENUITY INC. 5,476 191.58 0.03 CANTOR FITZGERALD + CO. 2,229 57.29 0.03 CAPITAL INSTITUTIONAL SVCS INC EQUITIES 830 29.06 0.04 CITATION GROUP 8,739 69.07 0.01 CITIGROUP GLOBAL MARKETS INC 18,635 598.56 0.03 CJS SECURITIES INC 8,390 251.70 0.03 CORNERSTONE MACRO LLC 6,444 225.55 0.04 COWEN AND COMPANY, LLC 129,059 3,697.84 0.03 CRAIG - HALLUM 26,261 787.83 0.03 CREDIT SUISSE SECURITIES (USA) LLC 72,330 1,710.43 0.02 DAIWA SECURITIES AMERICA INC 1,294 45.29 0.04 DAVIDSON D.A. + COMPANY INC. 8,322 249.66 0.03 DEUTSCHE BANK SECURITIES INC 11,424 217.82 0.02 DOUGHERTY & COMPANY LLC 13,087 392.61 0.03 FIDELITY CAPITAL MARKETS 6,687 50.16 0.01 FIRST ANALYSIS SECURITIES CORP 1,090 32.70 0.03 FRANK RUSSELL SEC/BROADCORT CAP CLEARING 79 2.77 0.04 GOLDMAN SACHS + CO LLC 71,602 1,913.96 0.03 GUGGENHEIM CAPITAL MARKETS LLC 830 21.42 0.03 GUZMAN AND COMPANY 125 5.00 0.04 HILLTOP SECURITIES INC. 36 1.26 0.04 HSBC BROKERAGE (USA) INC. 449 15.71 0.03 INSTINET 42,735 747.07 0.02 INVESTMENT TECHNOLOGY GROUP INC. 20,846 394.45 0.02 ISI GROUP INC 6,213 123.06 0.02 ITG INC. 1,591 63.64 0.04 J.P. MORGAN SECURITIES LLC 53,293 1,618.04 0.03 JANNEY MONTGOMERY, SCOTT INC 117 4.68 0.04 JEFFERIES + COMPANY INC 44,386 1,364.75 0.03 JOHNSON RICE & COMPANY LLC 3,089 108.12 0.04 JONESTRADING INSTITUTIONAL SERVICES LLC 29,232 831.14 0.03 KEEFE BRUYETTE + WOODS INC 3,683 145.80 0.04

INVESTMENT SECTION
MICHIGAN LEGISLATIVE RETIREMENT SYSTEM • 57
Schedule of Fees and Commissions (Continued)
Fiscal Year Ended September 30, 2019Shares Total Value Average Commission
Investment Broker Name Traded of Commissions Per ShareKEYBANC CAPITAL MARKETS INC 31,272 1,031.44 0.03 KING, CL, & ASSOCIATES, INC 3,396 101.88 0.03 LEERINK PARTNERS LLC 700 - - LIQUIDNET INC 75,249 1,705.96 0.02 LOOP CAPITAL MARKETS 11,866 355.98 0.03 LUMINEX TRADING AND ANALYTICS LLC 1,165 5.84 0.01 MACQUARIE SECURITIES (USA) INC 1,641 65.64 0.04 MERRILL LYNCH PROFESSIONAL CLEARING CORP 209 8.36 0.04 MIRAE ASSET SEC USA 1,931 75.41 0.04 MIZUHO SECURITIES USA INC. 765 22.20 0.03 MKM PARTNERS LLC 4,148 145.18 0.04 MORGAN STANLEY CO INCORPORATED 21,869 706.74 0.03 NEEDHAM AND COMPANY LLC 26,202 799.33 0.03 O NEIL, WILLIAM AND CO. INC/BCC CLRG 220 7.71 0.04 OPPENHEIMER + CO. INC. 3,487 109.51 0.03 PIPER JAFFRAY & CO. 12,806 175.16 0.01 RAYMOND JAMES AND ASSOCIATES INC 41,306 1,286.74 0.03 RBC CAPITAL MARKETS, LLC 16,094 232.31 0.01 RENAISSANCE MACRO SECURITIES, LLC 100 2.00 0.02 ROBERT W. BAIRD CO.INCORPORATED 46,197 1,430.41 0.03 SANDLER ONEILL AND PARTNERS L.P. 994 29.82 0.03 SANFORD C BERNSTEIN CO LLC 13,177 269.36 0.02 SEAPORT GROUP SECURITIES, LLC 109 2.18 0.02 SIDOTI + COMPANY LLC 1,393 41.79 0.03 STATE STREET GLOBAL MARKETS, LLC 6,587 104.81 0.02 STEPHENS, INC. 13,194 428.82 0.03 STIFEL NICOLAUS + CO INC 24,825 771.55 0.03 STRATEGAS SECURITIES LLC 615 21.55 0.04 SUNTRUST CAPITAL MARKETS, INC. 19,832 732.28 0.04 UBS SECURITIES LLC 17,464 583.69 0.03 VIRTU AMERICAS LLC 12,230 276.70 0.02 WALL STREET ACCESS 4,992 21.07 0.00 WEDBUSH MORGAN SECURITIES INC 2,257 67.71 0.03 WEEDEN + CO. 23,202 525.60 0.02 WELLS FARGO SECURITIES, LLC 5,821 186.28 0.03 WILLIAM BLAIR & COMPANY L.L.C 24,232 726.96 0.03 WOLFE TRAHAN SECURITIES 11,261 341.35 0.03 ZACKSTRADE 300 6.00 0.02
TOTALS 1,149,541 31,256.29

INVESTMENT SECTION
58 • MICHIGAN LEGISLATIVE RETIREMENT SYSTEM
This page was intentionally left blank.
ACTUARIAL SECTION
MICHIGAN LEGISLATIVE RETIREMENT SYSTEM • 59
Michigan Legislative Retirement System
Comprehensive Annual Financial Report for the Fiscal Year Ended September 30, 2019
ACTUARIAL SECTION
Actuary's Certification Summary of Actuarial Assumptions and Methods
Actuarial Valuation Data Prioritized Solvency Test
Analysis of System Experience Summary of Plan Provisions

ACTUARIAL SECTION
60 • MICHIGAN LEGISLATIVE RETIREMENT SYSTEM
Actuary's Certification

ACTUARIAL SECTION
MICHIGAN LEGISLATIVE RETIREMENT SYSTEM • 61
Actuary's Certification (Continued)

ACTUARIAL SECTION
62 • MICHIGAN LEGISLATIVE RETIREMENT SYSTEM
Actuary's Certification (Continued)

ACTUARIAL SECTION
MICHIGAN LEGISLATIVE RETIREMENT SYSTEM • 63
Summary of Actuarial Assumptions and Methods 1. The investment return rate used in making the valuations was 7% per year, compounded annually. This rate of return is
not the assumed real rate of return. The real rate of return is the rate of investment return in excess of the inflation rate. Considering other financial assumptions, this 7% investment return rate translates to an assumed real rate of return of 3%. Adopted 1987.
2. The mortality table used in evaluating allowances to be paid was the RP-2014 tables, as extended, and includes a margin
for future mortality improvement projected using a fully generational improvement scale. These rates were first used for the September 30, 2018 valuation.
3. Sample probabilities of retirement with an age and service allowance are shown in Schedule 1. Adopted 1987. 4. Sample probabilities of withdrawal from service and disability, together with individual pay increase assumptions, are
shown in Schedule 2. Adopted 1993, 1979, and 1987, respectively. 5. Total active member payroll is assumed to increase 4% per year. This represents the portion of the individual pay increase
assumptions attributable to inflation. 6. An individual entry age actuarial cost method of valuation was used in determining age and service allowance actuarial
liabilities and normal cost. Adopted 1987. Unfunded actuarial accrued liabilities, including actuarial gains and losses, are financed over a period of 10 years.
7. Effective for the September 30, 1993 valuation, valuation assets were equal to valuation assets (prior method) as of
September 30, 1992, with subsequent differences between total investment income and projected investment income (actuarial assumption) being spread over a five (5) year period.
8. Member data and asset information was furnished by the System's administrative staff. Although examined for general
reasonableness, the data was not audited by the actuary. 9. The actuarial valuation computations were made by or under the supervision of a Member of the American Academy of
Actuaries (MAAA). The assumptions used in the actuarial valuations were adopted by the board of trustees after consulting with the actuary.
10. Beginning fiscal year 2011, the System board approved using the prior year actuarial report for the System current year
comprehensive annual financial report.

ACTUARIAL SECTION
64 • MICHIGAN LEGISLATIVE RETIREMENT SYSTEM
Summary of Actuarial Assumptions and Methods (Continued)
SCHEDULE 1 Retirement Percent of Eligible Active Members Ages Retiring Within Next Year 50 10 % 52 10 55 10 58 10 61 10 64 10 67 10 70 100
SCHEDULE 2
Separation From Active Employment Before Age & Service Retirement & Individual Pay Increase Assumptions
Percent of Active Percent of Active Percent Increase Years of Members Withdrawing Sample Members Becoming In Pay During Service# Within Next Year Ages Disabled Within Next Year Next Year
House Senate Men Women 0 6 % 6 % 25 0.08 % 0.10 % 4 % 1 6 6 35 0.08 0.10 4 2 6 6 40 0.20 0.36 4 3 6 6 45 0.27 0.41 4 4 6 6 50 0.49 0.57 4 5 4 4 55 0.89 0.77 4 6 100 4 60 1.41 1.02 4 7 4 65 1.66 1.23 4 8 100
# Years after 1992, for persons who were members on December 31, 1992
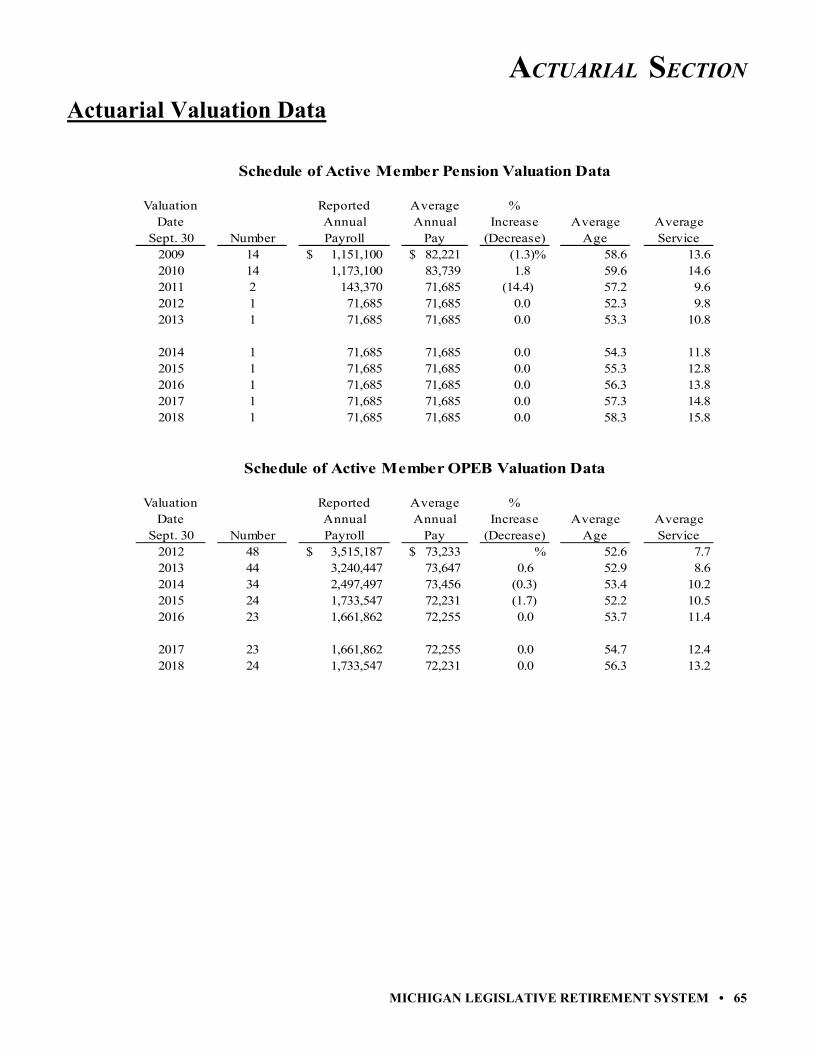
ACTUARIAL SECTION
MICHIGAN LEGISLATIVE RETIREMENT SYSTEM • 65
Actuarial Valuation Data
Schedule of Active Member Pension Valuation Data
Valuation Reported Average %Date Annual Annual Increase Average Average
Sept. 30 Number Payroll Pay (Decrease) Age Service2009 14 1,151,100$ 82,221$ (1.3)% 58.6 13.62010 14 1,173,100 83,739 1.8 59.6 14.62011 2 143,370 71,685 (14.4) 57.2 9.62012 1 71,685 71,685 0.0 52.3 9.82013 1 71,685 71,685 0.0 53.3 10.8
2014 1 71,685 71,685 0.0 54.3 11.82015 1 71,685 71,685 0.0 55.3 12.82016 1 71,685 71,685 0.0 56.3 13.82017 1 71,685 71,685 0.0 57.3 14.82018 1 71,685 71,685 0.0 58.3 15.8
Schedule of Active Member OPEB Valuation Data
Valuation Reported Average %Date Annual Annual Increase Average Average
Sept. 30 Number Payroll Pay (Decrease) Age Service2012 48 3,515,187$ 73,233$ % 52.6 7.72013 44 3,240,447 73,647 0.6 52.9 8.62014 34 2,497,497 73,456 (0.3) 53.4 10.22015 24 1,733,547 72,231 (1.7) 52.2 10.52016 23 1,661,862 72,255 0.0 53.7 11.4
2017 23 1,661,862 72,255 0.0 54.7 12.42018 24 1,733,547 72,231 0.0 56.3 13.2

ACTUARIAL SECTION
66 • MICHIGAN LEGISLATIVE RETIREMENT SYSTEM
Actuarial Valuation Data (Continued)
Schedule of Changes in the Pension Retirement Rolls
Year Added to Rolls Removed from Rolls Rolls–End of Year % Increase Average Ended Annual Annual Annual in Annual Annual Sept. 30 No. Allowances No. Allowances No. Allowances Allowances Allowances 2009 13 $ 783,304 9 $ 352,972 288 $10,853,048 4.1% $ 37,684 2010 8 629,090 8 286,285 288 11,195,853 3.2 38,874 2011 22 1,279,764 10 300,085 300 12,175,532 8.8 40,585 2012 8 752,346 15 428,828 293 12,499,050 2.7 42,659 2013 5 631,881 8 278,216 290 12,852,715 2.8 44,320 2014 4 594,824 10 364,336 284 13,083,203 1.8 46,068 2015 5 723,413 10 391,953 279 13,414,663 2.5 48,081 2016 5 656,260 13 735,829 271 13,335,094 (0.6) 49,207 2017 13 803,468 15 540,339 269 13,598,223 2.0 50,551 2018 10 834,312 17 689,748 262 13,742,787 1.1 52,453
Schedule of Changes in the OPEB Retirement Rolls
Year Added to Rolls Removed from Rolls Rolls–End of Year % Increase Average Ended Annual Annual Annual in Annual Annual Sept. 30 No. Allowances No. Allowances No. Allowances Allowances Allowances 2011 356 $ 5,225,619 2012 18 $ 175,876 12 $ 415,990 362 4,979,441 (4.6) % $ 13,755 2013 16 381,825 9 61,892 369 5,299,374 6.4 14,361 2014 8 71,424 15 149,945 362 5,220,853 (1.5) 14,422 2015 16 514,854 14 163,980 364 5,571,727 6.7 15,307 2016 8 162,321 13 159,096 359 5,574,952 0.1 15,529 2017 16 904,549 17 247,893 358 6,231,608 11.8 17,407 2018 11 481,308 16 129,730 356 6,583,186 5.6 18,492
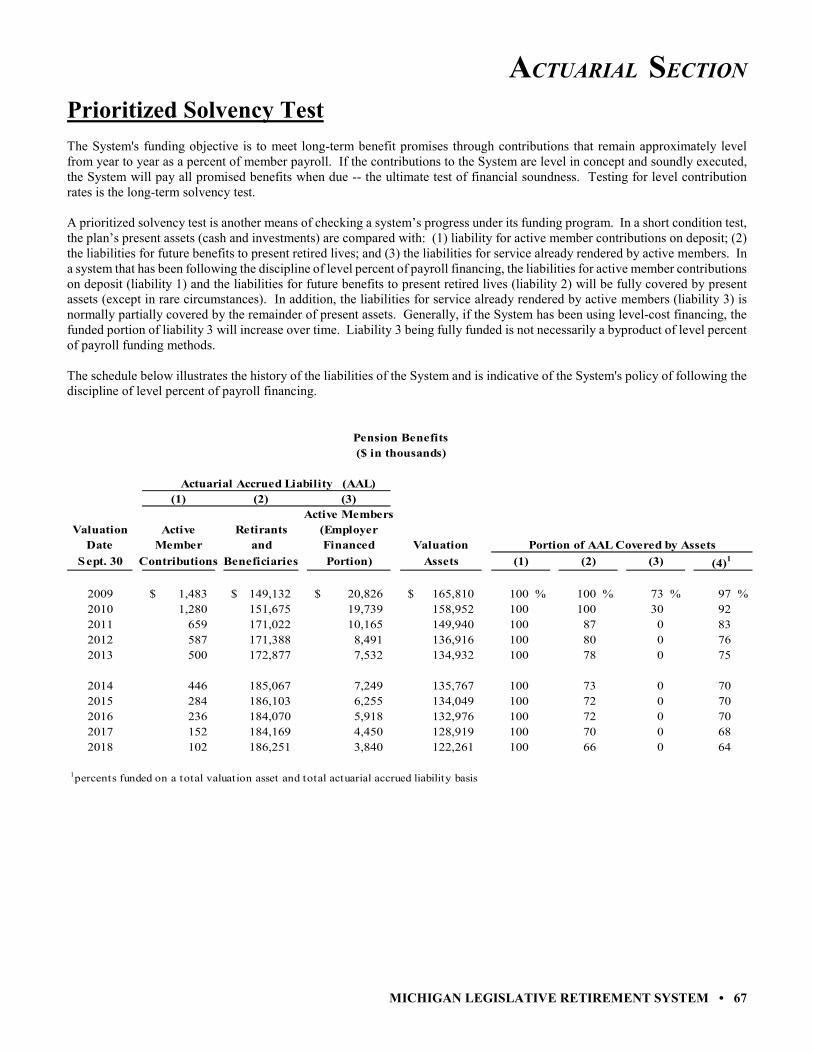
ACTUARIAL SECTION
MICHIGAN LEGISLATIVE RETIREMENT SYSTEM • 67
Prioritized Solvency Test The System's funding objective is to meet long-term benefit promises through contributions that remain approximately level from year to year as a percent of member payroll. If the contributions to the System are level in concept and soundly executed, the System will pay all promised benefits when due -- the ultimate test of financial soundness. Testing for level contribution rates is the long-term solvency test. A prioritized solvency test is another means of checking a system’s progress under its funding program. In a short condition test, the plan’s present assets (cash and investments) are compared with: (1) liability for active member contributions on deposit; (2) the liabilities for future benefits to present retired lives; and (3) the liabilities for service already rendered by active members. In a system that has been following the discipline of level percent of payroll financing, the liabilities for active member contributions on deposit (liability 1) and the liabilities for future benefits to present retired lives (liability 2) will be fully covered by present assets (except in rare circumstances). In addition, the liabilities for service already rendered by active members (liability 3) is normally partially covered by the remainder of present assets. Generally, if the System has been using level-cost financing, the funded portion of liability 3 will increase over time. Liability 3 being fully funded is not necessarily a byproduct of level percent of payroll funding methods. The schedule below illustrates the history of the liabilities of the System and is indicative of the System's policy of following the discipline of level percent of payroll financing.
Pension Benefits($ in thousands)
Actuarial Accrued Liability (AAL)(1) (2) (3)
Active MembersValuation Active Retirants (Employer
Date Member and Financed Valuation Portion of AAL Covered by AssetsSept. 30 Contributions Beneficiaries Portion) Assets (1) (2) (3) (4)1
2009 1,483$ 149,132$ 20,826$ 165,810$ 100 % 100 % 73 % 97 %2010 1,280 151,675 19,739 158,952 100 100 30 922011 659 171,022 10,165 149,940 100 87 0 832012 587 171,388 8,491 136,916 100 80 0 762013 500 172,877 7,532 134,932 100 78 0 75
2014 446 185,067 7,249 135,767 100 73 0 702015 284 186,103 6,255 134,049 100 72 0 702016 236 184,070 5,918 132,976 100 72 0 702017 152 184,169 4,450 128,919 100 70 0 682018 102 186,251 3,840 122,261 100 66 0 64
1percents funded on a total valuation asset and total actuarial accrued liability basis

ACTUARIAL SECTION
68 • MICHIGAN LEGISLATIVE RETIREMENT SYSTEM
Prioritized Solvency Test (Continued)
Other Postemployment Benefits($ in thousands)
Actuarial Accrued Liability (AAL)(1) (2) (3)
Active MembersValuation Active Retirants (Employer
Date Member and Financed Valuation Portion of AAL Covered by AssetsSept. 30 Contributions Beneficiaries Portion) Assets (1) (2) (3) (4)1
2009 -$ 80,198$ 56,672$ 14,588$ 0 % 18 % 0 % 11 %2010 - 86,786 68,473 15,886 0 18 0 102011 - 92,385 48,311 15,179 0 16 0 112012 - 98,511 46,650 20,825 0 21 0 142013 - 103,824 49,842 22,806 0 22 0 15
2014 - 109,400 49,169 23,625 0 22 0 152015 - 123,962 50,602 21,840 0 18 0 132016 - 132,404 51,821 22,942 0 17 0 132017 - 136,308 52,683 24,507 0 18 0 132018 - 119,220 46,311 24,928 0 21 0 15
1percents funded on a total valuation asset and total actuarial accrued liability basis
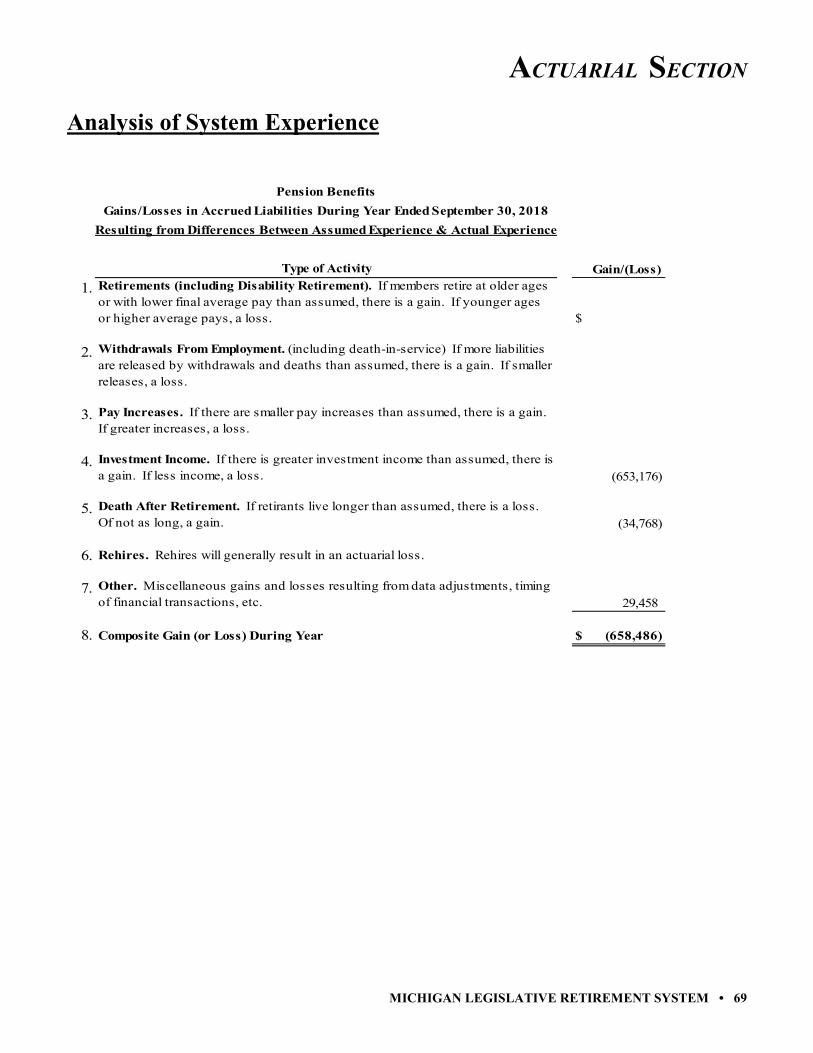
ACTUARIAL SECTION
MICHIGAN LEGISLATIVE RETIREMENT SYSTEM • 69
Analysis of System Experience
Pension BenefitsGains/Losses in Accrued Liabilities During Year Ended September 30, 2018
Resulting from Differences Between Assumed Experience & Actual Experience
Type of Activity Gain/(Loss)1. Retirements (including Disability Retirement). If members retire at older ages
or with lower final average pay than assumed, there is a gain. If younger ages or higher average pays, a loss. $
2. Withdrawals From Employment. (including death-in-service) If more liabilities are released by withdrawals and deaths than assumed, there is a gain. If smaller releases, a loss.
3. Pay Increases. If there are smaller pay increases than assumed, there is a gain. If greater increases, a loss.
4. Investment Income. If there is greater investment income than assumed, there is a gain. If less income, a loss. (653,176)
5. Death After Retirement. If retirants live longer than assumed, there is a loss. Of not as long, a gain. (34,768)
6. Rehires. Rehires will generally result in an actuarial loss.
7. Other. Miscellaneous gains and losses resulting from data adjustments, timing of financial transactions, etc. 29,458
8. Composite Gain (or Loss) During Year $ (658,486)

ACTUARIAL SECTION
70 • MICHIGAN LEGISLATIVE RETIREMENT SYSTEM
Analysis of System Experience (Continued)
OPEB BenefitsGains/Losses in Accrued Liabilities During Year Ended September 30, 2018
Resulting from Differences Between Assumed Experience & Actual Experience
A. Derivation of Actuarial Gain/(Loss):
1. Unfunded Actuarial Accrued Liability (UAAL) - Previous Valuation $ 164,483,779 2. Total Normal Cost (employer plus member) for Year Ending 9/30/2018 776,026 3. Total Contributions (employer plus member) for Year Ending 9/30/2018 4,934,164 4. Interest on:
a. UAAL: .04 x (1) 6,579,351 b. Normal Cost and Contributions: .04 x [(2) - (3)] (83,163) c. Net Total: (a) + (b) 6,496,188
5. Change in UAAL due to Benefit Changes - 6. Change in UAAL due to Assumptions/Methods (i.e., Trend/Discount Rate) 1,206,456 7. Expected UAAL Current Year:
(1) + (2) - (3) + (4c) + (5) + (6) 168,028,285 8. Actual UAAL Current Year 140,603,093 9. Experience Gain/(Loss): (7) - (8) 27,425,192
B. Approximate Portion of Gain/(Loss) due to Investments 807,801
C. Approximate Portion of Gain/(Loss) due to Liabilities: (A.9) - (B) 26,617,391
Type of Activity Gain/(Loss)1. Premiums. Gains and losses resulting from actual premiums in valuation year
versus that assumed from prior valuation $ 25,549,826
2. Investment Income. If there is greater investment income than assumed, there is a gain. If less income, a loss. 807,801
3. Demographic and Other. Gains and losses resulting from demographic experience, data adjustments, timing of financial transactions, etc. 1,067,565
4. Composite Gain/(Loss) During Year. $ 27,425,192

ACTUARIAL SECTION
MICHIGAN LEGISLATIVE RETIREMENT SYSTEM • 71
Summary Of Plan Provisions Membership Legislators who first become legislators after March 30, 1997, will not be members of the Tier 1 defined benefit plan. This summary of benefits applies only to persons who first became legislators on or before March 30, 1997, and who did not elect to transfer to Tier 2, the defined contribution plan. Term Limits For terms of office beginning on or after January 1, 1993, no person shall be elected to the House of Representatives (House) more than three (3) times and no person shall be elected to the Senate more than two (2) times. With the exception of persons who fill vacancies for partial terms and persons who serve in both the House and the Senate, the normal service limits are: House - 6 years (three 2-year terms) Senate - 8 years (two 4-year terms) Regular Retirement Eligibility - At least age 50 with age plus service equal to or exceeding 70; or at least age 55 with 5 or more years service if seated either: a) 3 times in the House or b) 2 times in the Senate or c) 1 time in the House and 1 time in the Senate. Annual Amount - Persons who first became members on or before January 1, 1995: 20% of the highest salary earned for the first 5 years of service, plus 4% of highest salary for each of the next 11 years of service, plus 1% of highest salary for each additional year of service. Persons who first became members after January 1, 1995: 3% of highest salary for each year of service. Deferred Retirement (Vested Benefit) Eligibility - 5 or more years of service if seated either: a) 3 times in the House or b) 2 times in the Senate or c) 1 time in the House and 1 time in the Senate. Benefit begins at age 55 (as early as age 50 if age plus service equals or exceeds 70). Member may delay commencement of benefits to an age not greater than age 70-1/2. Annual Amount - Computed as regular retirement benefit based on service and highest salary at termination. For persons who first became members on or before January 1, 1995, the benefit is increased 4% annually (compounded) between termination of membership and the earlier of a) benefit commencement or b) age 55. Benefits delayed beyond age 55 are actuarially equivalent to the age 55 benefit. Disability Retirement Eligibility - Disability before becoming eligible to retire or during a benefit deferral period. Annual Amount - Computed as a regular retirement benefit based on service and highest salary at time of disability.

ACTUARIAL SECTION
72 • MICHIGAN LEGISLATIVE RETIREMENT SYSTEM
Summary Of Plan Provisions (Continued) Death Benefit Eligibility - 5 or more years of service if seated either: a) 3 times in the House or b) 2 times in the Senate or c) 1 time in the House and 1 time in the Senate. Benefit is paid immediately. Annual Amount - Surviving spouse receives 66 2/3% of the retirement allowance earned as of the date of death of the member. If there are eligible dependent children in his or her care, the surviving spouse receives 75% of the retirement allowance earned as of the date of death until the children are no longer dependent, at which time 66-2/3% then becomes payable. Special conditions apply if there is no surviving spouse, or if the eligible children are not under the care of the surviving spouse. Post-Retirement Cost-of-Living Adjustments The annual retirement allowance payable to a retirant or survivor is increased by 4% per year, compounded annually (non-compounded for persons first becoming members after January 1, 1995), each January 1. Life Insurance Life insurance coverage is provided from the Insurance Revolving Fund for active members, retirants, and deferred vested members. Coverage varies from $2,500 to $150,000 depending on premium payments, board policy, and statutory provisions in place at deferral and/or retirement. Post-Retirement Health Insurance Hospital, medical, and dental insurance shall be provided from the Health Insurance Fund for retirants, deferred vested members who first became members on or before January 1, 1995, and their survivors, and to the spouses and eligible children of retirants and of deferred vested members who first became members on or before January 1, 1995. In addition, the System provides health insurance coverage to eligible former legislators who belong to the State's Defined Contribution Plan (Tier 2). Member Contributions For members who first became a member on or before January 1, 1995: 9% of annual salary to the Health Insurance Fund. For members who first became a member after January 1, 1995: 7% of annual salary to the Health Insurance Fund.

STATISTICAL SECTION
MICHIGAN LEGISLATIVE RETIREMENT SYSTEM • 73
Michigan Legislative Retirement System
Comprehensive Annual Financial Report for the Fiscal Year Ended September 30, 2019
STATISTICAL SECTION
Schedule of Revenue by Source Schedule of Expenses by Type
Schedule of Benefit Expenses by Type Schedules of Changes in Net Position
Schedules of Benefit and Refund Deductions from Net Position by Type Schedule of Retired Members by Type of Benefit
Schedule of Funding Progress Actuarial Value of Assets compared to Actuarial Accrued Liability
Schedule of Average Benefit Payments

STATISTICAL SECTION
74 • MICHIGAN LEGISLATIVE RETIREMENT SYSTEM
Narrative Explanation to Statistical Section The intention of this narrative description is to explain the System’s financial and operating trends of the schedules in the statistical section. It is important that this section be written clearly and accurately to help improve the understandability and usefulness of the statistical information. The statistical section contains the following schedules:
Schedule of Revenue By Source - Pension Plan and Other Postemployment Benefit Plan (OPEB)
Schedule of Expenses By Type - Pension Plan and OPEB
Schedule of Benefit Expenses By Type - Pension Plan and OPEB
Schedule of Changes in Fiduciary Net Position - Pension Plan
Schedule of Changes in Fiduciary Net Position - OPEB
Schedule of Benefit and Refund Deductions from Net Position by Type – Pension Plan
Schedule of Benefit and Refund Deductions from Net Position by Type – OPEB
These schedules are a ten (10) year comparison of the Statement of Changes in Pension Plan and Postemployment Benefits Fiduciary Net Position found in the Financial Section of this report. This is to provide a longer time period for reference and show possible trends.
Schedule of Retired Members by Type of Benefit – Pension Plan
Schedule of Retired Members by Type of Benefit – OPEB
This schedule is to show the average amount of benefits. It is broken out by amount and type to show possible trends.
Schedule of Funding Progress – Pension Plan
Schedule of Funding Progress – OPEB Plan
This schedule is to show the System funding status on a going-concern basis. Analysis of this percentage over time indicates whether the system is becoming financially stronger or weaker. This schedule was in the financial section, but was replaced by the Net Pension Liability for the pension plan and Net OPEB Liability for the OPEB plan.
Actuarial Value of Pension Plan Assets compared to Actuarial Accrued Pension Plan Liability
Actuarial Value of OPEB Plan Assets compared to Actuarial Accrued OPEB Plan Liability
This is to show the trend of the actuarial value of assets compared to the actuarial accrued liability.
Schedule of Average Benefit Payments – Pension Plan Schedule of Average Benefit Payments – OPEB
This schedule is to show the average amount of new benefits by years of service.
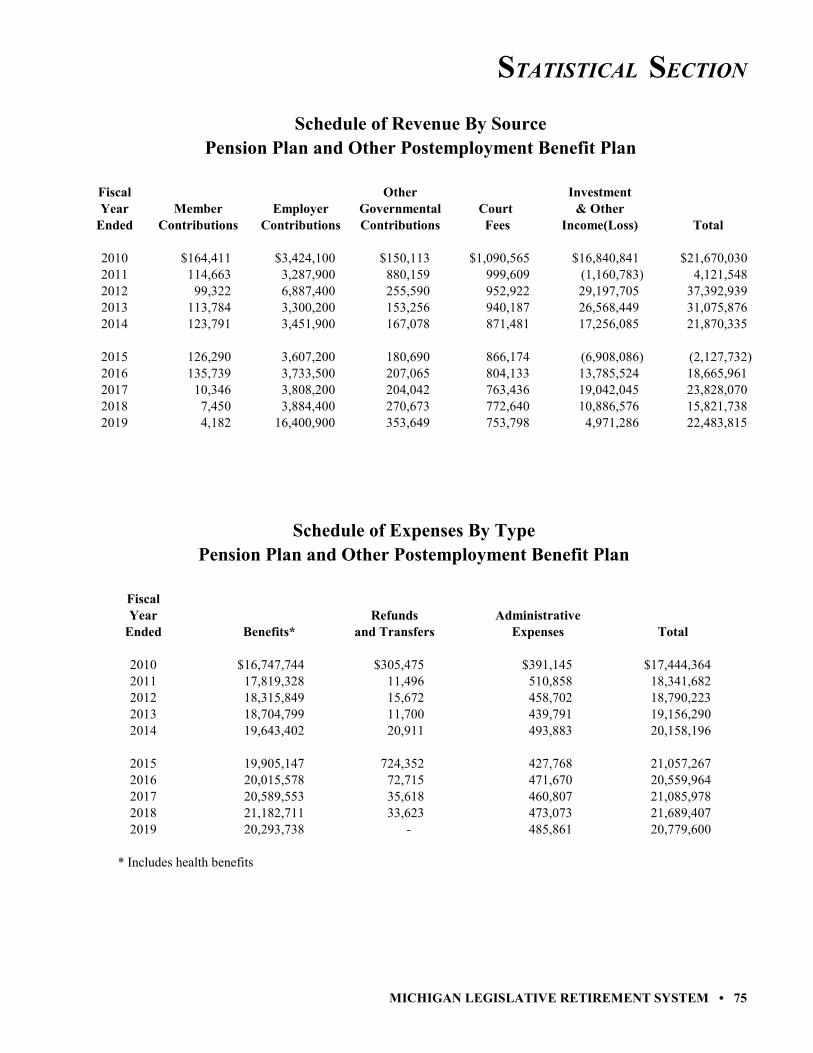
STATISTICAL SECTION
MICHIGAN LEGISLATIVE RETIREMENT SYSTEM • 75
Schedule of Revenue By SourcePension Plan and Other Postemployment Benefit Plan
Fiscal Other InvestmentYear Member Employer Governmental Court & Other
Ended Contributions Contributions Contributions Fees Income(Loss) Total
2010 $164,411 $3,424,100 $150,113 $1,090,565 $16,840,841 $21,670,0302011 114,663 3,287,900 880,159 999,609 (1,160,783) 4,121,548 2012 99,322 6,887,400 255,590 952,922 29,197,705 37,392,939 2013 113,784 3,300,200 153,256 940,187 26,568,449 31,075,876 2014 123,791 3,451,900 167,078 871,481 17,256,085 21,870,335
2015 126,290 3,607,200 180,690 866,174 (6,908,086) (2,127,732) 2016 135,739 3,733,500 207,065 804,133 13,785,524 18,665,961 2017 10,346 3,808,200 204,042 763,436 19,042,045 23,828,070 2018 7,450 3,884,400 270,673 772,640 10,886,576 15,821,738 2019 4,182 16,400,900 353,649 753,798 4,971,286 22,483,815
Schedule of Expenses By TypePension Plan and Other Postemployment Benefit Plan
FiscalYear Refunds Administrative
Ended Benefits* and Transfers Expenses Total
2010 $16,747,744 $305,475 $391,145 $17,444,3642011 17,819,328 11,496 510,858 18,341,682 2012 18,315,849 15,672 458,702 18,790,223 2013 18,704,799 11,700 439,791 19,156,290 2014 19,643,402 20,911 493,883 20,158,196
2015 19,905,147 724,352 427,768 21,057,267 2016 20,015,578 72,715 471,670 20,559,964 2017 20,589,553 35,618 460,807 21,085,978 2018 21,182,711 33,623 473,073 21,689,407 2019 20,293,738 - 485,861 20,779,600
* Includes health benefits

STATISTICAL SECTION
76 • MICHIGAN LEGISLATIVE RETIREMENT SYSTEM
Schedule of Benefit Expenses by TypePension Plan and Other Postemployment Benefit Plan
Fiscal Regular & SurvivorYear Pension Death Dental Health
Ended Benefits Benefits Benefits Benefits Total
2010 $11,121,971 $333,172 $426,560 $4,866,041 $16,747,7442011 11,974,289 140,000 448,263 5,256,776 17,819,328 2012 12,469,893 325,796 417,299 5,102,861 18,315,849 2013 12,757,228 134,000 417,115 5,396,456 18,704,799 2014 13,147,695 381,500 417,313 5,696,894 19,643,402
2015 13,394,276 376,678 409,246 5,724,946 19,905,147 2016 13,451,597 395,000 404,929 5,764,052 20,015,578 2017 13,639,606 607,000 390,630 5,952,317 20,589,553 2018 13,855,004 632,500 380,005 6,315,202 21,182,711 2019 14,008,685 121,280 371,898 5,791,875 20,293,738

STATISTICAL SECTION
MICHIGAN LEGISLATIVE RETIREMENT SYSTEM • 77
Schedule of Changes in Fiduciary Net Position - Pension Plan(Ten Years)
Fiscal Year2010 2011 2012 2013 2014 2015 2016 2017 2018 2019
Additions Member contributions 11,044$ 10,343$ 7,635$ 6,527$ 5,662$ 3,226$ 3,648$ 3,895$ 998$ 2,445$ Employer contributions 8,063,327 Other Gov't contributions Court fees Net Investment income 15,031,593 (1,001,060) 26,171,659 23,207,036 14,868,119 (6,545,332) 11,324,783 15,840,765 8,629,843 3,319,925 Other income 1 6,649
Total additions 15,042,637 (990,716) 26,179,294 23,213,563 14,873,781 (6,542,106) 11,328,431 15,851,309 8,630,841 11,385,697
Deductions Benefit payments 11,455,143 12,114,289 12,795,689 12,891,228 13,529,195 13,770,955 13,846,597 14,246,606 14,487,504 14,129,965 Refunds 17,506 11,496 15,672 11,700 20,911 13,285 72,715 35,618 33,623 Qualified rollovers 287,969 711,067 Administrative expenses 354,649 396,358 411,128 372,703 430,200 362,431 405,381 391,937 398,871 405,319
Total deductions 12,115,267 12,522,143 13,222,489 13,275,631 13,980,306 14,857,738 14,324,693 14,674,160 14,919,999 14,535,284
Changes inNet position 2,927,370$ (13,512,859)$ 12,956,805$ 9,937,932$ 893,475$ (21,399,844)$ (2,996,262)$ 1,177,149$ (6,289,158)$ (3,149,587)$
Schedule of Changes in Fiduciary Net Position - Other Postemployment Benefit Plan(Ten Years)
Fiscal Year2010 2011 2012 2013 2014 2015 2016 2017 2018 2019
Additions Member contributions 153,367$ 104,320$ 91,687$ 107,257$ 118,129$ 123,064$ 132,090$ 6,452$ 6,452$ 1,737$ Employer contributions 3,424,100 3,287,900 6,887,400 3,300,200 3,451,900 3,607,200 3,733,500 3,808,200 3,884,400 8,337,573 Other Gov't contributions 150,113 880,159 255,590 153,256 167,078 180,690 207,065 204,042 270,673 353,649 Court fees 1,090,565 999,609 952,922 940,187 871,481 866,174 804,133 763,436 772,640 753,798 Net Investment income 1,556,845 (159,724) 3,026,046 3,361,413 2,187,276 (996,079) 1,834,640 2,754,692 1,573,479 625,677 Other income 252,403 200,690 633,325 626,101 439,939 683,254 1,025,684
Total additions 6,627,393 5,112,264 11,213,645 7,862,313 6,996,554 4,414,374 7,337,530 7,976,761 7,190,898 11,098,118
Deductions Benefit payments 5,292,601 5,705,039 5,520,160 5,813,571 6,114,207 6,134,192 6,168,981 6,342,947 6,695,207 6,163,773 Refunds Qualified rollovers Administrative expenses 36,496 114,500 47,574 67,088 63,683 65,337 66,289 68,871 74,201 80,543
Total deductions 5,329,097 5,819,539 5,567,734 5,880,659 6,177,890 6,199,529 6,235,271 6,411,818 6,769,408 6,244,315
Changes inNet position 1,298,296$ (707,275)$ 5,645,911$ 1,981,654$ 818,664$ (1,785,155)$ 1,102,259$ 1,564,943$ 421,490$ 4,853,802$

STATISTICAL SECTION
78 • MICHIGAN LEGISLATIVE RETIREMENT SYSTEM
Schedule of Benefit and Refund Deductions from Net Position by TypePension Plan(Ten Years)
Fiscal Year2010 2011 2012 2013 2014 2015 2016 2017 2018 2019
Type of BenefitAge and service benefits: Retirees 9,403,769$ 10,178,018$ 10,669,077$ 10,850,420$ 11,137,006$ 11,398,185$ 11,398,950$ 11,502,955$ 11,457,806$ 11,579,049$ Survivors 1,718,202 1,796,271 1,800,816 1,906,808 2,010,689 1,996,092 2,052,647 2,136,651 2,397,198 2,429,636
Death in service benefits 333,172 140,000 325,796 134,000 381,500 376,678 395,000 607,000 632,500 121,280
Total benefits 11,455,143$ 12,114,289$ 12,795,689$ 12,891,228$ 13,529,195$ 13,770,955$ 13,846,597$ 14,246,606$ 14,487,504$ 14,129,965$
Type of refundDeath 17,506$ 11,098$ 15,672$ 11,700$ 20,911$ 13,284$ 61,780$ 35,618$ 33,623$ $SeparationOther 287,969 398 711,067 10,935
Total Refunds 305,475$ 11,496$ 15,672$ 11,700$ 20,911$ 724,352$ 72,715$ 35,618$ 33,623$ $
Schedule of Benefit and Refund Deductions from Net Position by TypeOther Postemployment Benefit Plan(Ten Years)
Fiscal Year2010 2011 2012 2013 2014 2015 2016 2017 2018 2019
Type of BenefitHeathcare benefits: Health benefits 4,866,041$ 5,256,776$ 5,102,861$ 5,396,456$ 5,696,894$ 5,724,946$ 5,764,052$ 5,952,317$ 6,315,202$ 5,791,875$ Dental benefits 426,560 448,263 417,299 417,115 417,313 409,246 404,929 390,630 380,005 371,898
Total benefits 5,292,601$ 5,705,039$ 5,520,160$ 5,813,571$ 6,114,207$ 6,134,192$ 6,168,981$ 6,342,947$ 6,695,207$ 6,163,773$

STATISTICAL SECTION
MICHIGAN LEGISLATIVE RETIREMENT SYSTEM • 79
Schedule of Retired Members by Type of Benefit - Pension PlanAs of September 30, 2019
Number ofAmount of Retired Type of Retirement*
Monthly Benefit Members 1 2 3 4 5
Deferred 5 2 3 0 0 0$ 1 - $ 500 1 1 0 0 0 0501 - 1,000 4 3 0 1 0 0
1,001 - 1,500 11 4 2 3 2 01,501 - 2,000 21 6 3 12 0 02,001 - 2,500 26 21 4 1 0 02,501 - 3,000 21 16 0 5 0 03,001 - 3,500 24 18 0 6 0 03,501 - 4,000 14 5 2 7 0 04,001 - 4,500 21 16 2 3 0 04,501 - 5,000 14 7 0 7 0 0Over 5,000 102 90 0 12 0 0
Total 264 189 16 57 2 0
Notes:*Type of Retirement 1 - Regular retirement - first became members on or before 1/1/95 2 - Regular retirement - first became members after 1/1/95 3 - Survivor payment - survivor of type 1 regular retiree 4 - Survivor payment - survivor of type 2 regular retiree 5 - Disability Retirement

STATISTICAL SECTION
80 • MICHIGAN LEGISLATIVE RETIREMENT SYSTEM
Schedule of Retired Members by Type of Benefit - Other Postemployment BenefitsAs of September 30, 2019
Amount of Number of Type of Other Postemployment BenefitsMonthly Eligible Receiving Receiving Receiving
Pension Benefit Members Health* Dental Health and/or Dental
Defined Contribution 139 107 110 111Deferred 1 1 1 1$ 1 - $ 500 0 0 0 0501 - 1,000 1 1 1 1
1,001 - 1,500 8 8 8 81,501 - 2,000 19 18 19 192,001 - 2,500 26 26 26 262,501 - 3,000 19 19 19 193,001 - 3,500 24 24 24 243,501 - 4,000 14 14 14 144,001 - 4,500 21 21 21 214,501 - 5,000 14 14 14 14Over 5,000 102 100 101 101
Total 388 353 358 359
*Health includes: health, prescription, hearing and vision insurance

STATISTICAL SECTION
MICHIGAN LEGISLATIVE RETIREMENT SYSTEM • 81
Schedule of Funding Progress – Pension Plan(in thousands)
Valuation Date Sept
30
Actuarial Value of Assets
Actuarial Accrued Liability
(AAL) Entry Age
Unfunded (O verfunded)
Accrued Liability (UAAL)
Funded Ratio AAL
Covered Payroll (1)
UAAL as a % of
Covered Payroll (2)
(a) (b) (b-a) (a/b) (c) ((b-a)/c)
2009 165,810$ $ 171,441 5,631 97 % $ 1,151 N/A2010 158,952 172,694 13,741 92 1,173 N/A2011 149,940 181,847 31,907 83 143 N/A2012 136,916 180,466 43,550 76 72 N/A2013 134,932 180,909 45,978 75 72 N/A
2014 135,767 192,762 56,995 70 72 N/A2015 134,049 192,642 58,593 70 72 N/A2016 132,976 190,224 57,248 70 72 N/A2017 128,919 188,771 59,852 68 72 N/A2018 122,261 190,193 67,932 64 72 N/A
(1) October based payrolls(2) Percentage of covered payroll is not applicable (N/A) as the System is closed.
Actuarial Value of Pension Plan Assets compared to Actuarial Accrued Pension Plan Liability
Fiscal Years Ended September 30 (In Thousands)
-
50,000
100,000
150,000
200,000
250,000
2014 2015 2016 2017 2018
Actuarial Value of Assets
Actuarial Accrued Liability

STATISTICAL SECTION
82 • MICHIGAN LEGISLATIVE RETIREMENT SYSTEM
Schedule of Funding Progress – Other Postemployment Benefit Plan(2)
(in thousands)
Valuation Date Sept
30
Actuarial Value of Assets
Actuarial Accrued Liability
(AAL) Entry Age
Unfunded (O verfunded)
Accrued Liability (UAAL)
Funded Ratio AAL
Covered Payroll (1)
UAAL as a % of
Covered Payroll (2)
(a) (b) (b-a) (a/b) (c) ((b-a)/c)
2009 14,588$ $ 136,870 122,282 11 $ 11,718 1,044 %2010 15,886 155,259 139,373 10 11,598 1,2022011 15,179 140,696 125,517 11 3,659 3,4312012 20,825 145,161 124,337 14 3,587 3,4662013 22,806 153,666 130,860 15 3,312 3,951
2014 23,625 158,568 134,943 15 2,497 5,4042015 21,840 174,564 152,724 13 1,734 8,8102016 22,942 184,225 161,283 12 1,662 9,7052017 24,507 188,991 164,484 13 1,662 9,8982018 24,928 165,531 140,603 15 1,734 8,111
(1) October based payrolls(2) Includes members in both the defined benefit plan and the defined contribution plan
Actuarial Assets compared to Actuarial Accrued OPEB Plan Liability
Fiscal Years Ended September 30 (In Thousands)
-
20,000
40,000
60,000
80,000
100,000
120,000
140,000
160,000
180,000
200,000
2014 2015 2016 2017 2018
Actuarial Value of Assets
Actuarial Accrued Liability
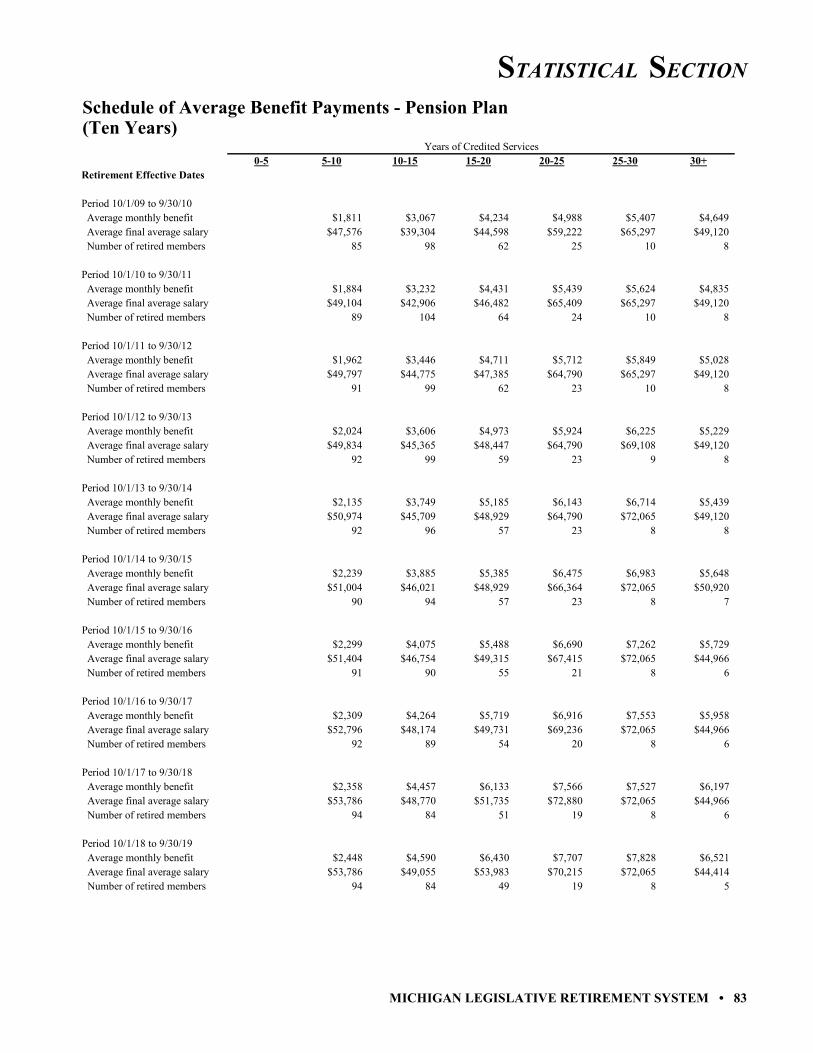
STATISTICAL SECTION
MICHIGAN LEGISLATIVE RETIREMENT SYSTEM • 83
Schedule of Average Benefit Payments - Pension Plan(Ten Years)
Years of Credited Services0-5 5-10 10-15 15-20 20-25 25-30 30+
Retirement Effective Dates
Period 10/1/09 to 9/30/10 Average monthly benefit $1,811 $3,067 $4,234 $4,988 $5,407 $4,649 Average final average salary $47,576 $39,304 $44,598 $59,222 $65,297 $49,120 Number of retired members 85 98 62 25 10 8
Period 10/1/10 to 9/30/11 Average monthly benefit $1,884 $3,232 $4,431 $5,439 $5,624 $4,835 Average final average salary $49,104 $42,906 $46,482 $65,409 $65,297 $49,120 Number of retired members 89 104 64 24 10 8
Period 10/1/11 to 9/30/12 Average monthly benefit $1,962 $3,446 $4,711 $5,712 $5,849 $5,028 Average final average salary $49,797 $44,775 $47,385 $64,790 $65,297 $49,120 Number of retired members 91 99 62 23 10 8
Period 10/1/12 to 9/30/13 Average monthly benefit $2,024 $3,606 $4,973 $5,924 $6,225 $5,229 Average final average salary $49,834 $45,365 $48,447 $64,790 $69,108 $49,120 Number of retired members 92 99 59 23 9 8
Period 10/1/13 to 9/30/14 Average monthly benefit $2,135 $3,749 $5,185 $6,143 $6,714 $5,439 Average final average salary $50,974 $45,709 $48,929 $64,790 $72,065 $49,120 Number of retired members 92 96 57 23 8 8
Period 10/1/14 to 9/30/15 Average monthly benefit $2,239 $3,885 $5,385 $6,475 $6,983 $5,648 Average final average salary $51,004 $46,021 $48,929 $66,364 $72,065 $50,920 Number of retired members 90 94 57 23 8 7
Period 10/1/15 to 9/30/16 Average monthly benefit $2,299 $4,075 $5,488 $6,690 $7,262 $5,729 Average final average salary $51,404 $46,754 $49,315 $67,415 $72,065 $44,966 Number of retired members 91 90 55 21 8 6
Period 10/1/16 to 9/30/17 Average monthly benefit $2,309 $4,264 $5,719 $6,916 $7,553 $5,958 Average final average salary $52,796 $48,174 $49,731 $69,236 $72,065 $44,966 Number of retired members 92 89 54 20 8 6
Period 10/1/17 to 9/30/18 Average monthly benefit $2,358 $4,457 $6,133 $7,566 $7,527 $6,197 Average final average salary $53,786 $48,770 $51,735 $72,880 $72,065 $44,966 Number of retired members 94 84 51 19 8 6
Period 10/1/18 to 9/30/19 Average monthly benefit $2,448 $4,590 $6,430 $7,707 $7,828 $6,521 Average final average salary $53,786 $49,055 $53,983 $70,215 $72,065 $44,414 Number of retired members 94 84 49 19 8 5

STATISTICAL SECTION
84 • MICHIGAN LEGISLATIVE RETIREMENT SYSTEM
Schedule of Average Benefit Payments - Other Postemployment Benefit Plan(Ten Years)
Years of Credited Services0-5 5-10 10-15 15-20 20-25 25-30 30+
Retirement Effective Dates
Period 10/1/09 to 9/30/10 Average monthly benefit $1,337 $1,142 $1,117 $1,242 $1,249 $952 Average final average salary $57,837 $40,308 $45,027 $56,725 $64,197 $50,920 Number of retired members 138 101 61 31 11 7
Period 10/1/10 to 9/30/11 Average monthly benefit $1,152 $1,015 $967 $1,137 $1,106 $836 Average final average salary $60,037 $45,916 $46,447 $61,970 $64,197 $50,920 Number of retired members 150 113 62 29 11 7
Period 10/1/11 to 9/30/12 Average monthly benefit $1,220 $1,093 $1,061 $1,178 $1,249 $933 Average final average salary $61,074 $48,392 $46,721 $61,970 $64,197 $50,920 Number of retired members 155 111 62 29 11 7
Period 10/1/12 to 9/30/13 Average monthly benefit $1,291 $1,142 $1,128 $1,184 $1,270 $993 Average final average salary $62,059 $48,938 $48,101 $62,620 $67,516 $50,920 Number of retired members 163 111 59 27 10 7
Period 10/1/13 to 9/30/14 Average monthly benefit $1,311 $1,152 $1,187 $1,278 $1,366 $1,009 Average final average salary $62,815 $49,343 $48,570 $62,675 $69,968 $50,920 Number of retired members 163 108 57 26 9 7
Period 10/1/14 to 9/30/15 Average monthly benefit $1,306 $1,167 $1,189 $1,255 $1,319 $891 Average final average salary $62,272 $51,442 $49,322 $67,072 $73,193 $50,920 Number of retired members 160 112 58 24 9 7
Period 10/1/15 to 9/30/16 Average monthly benefit $1,321 $1,215 $1,209 $1,301 $1,411 $849 Average final average salary $62,719 $52,238 $48,947 $65,248 $69,968 $44,966 Number of retired members 163 108 55 22 9 6
Period 10/1/16 to 9/30/17 Average monthly benefit $1,444 $1,362 $1,373 $1,545 $1,629 $970 Average final average salary $63,820 $53,951 $49,353 $66,859 $69,968 $44,966 Number of retired members 160 109 54 22 9 6
Period 10/1/17 to 9/30/18 Average monthly benefit $1,529 $1,459 $1,464 $1,659 $1,624 $1,036 Average final average salary $63,911 $54,948 $51,335 $66,859 $69,968 $44,966 Number of retired members 162 105 51 22 9 6
Period 10/1/18 to 9/30/19 Average monthly benefit $1,362 $1,337 $1,342 $1,557 $1,515 $856 Average final average salary $63,614 $57,108 $53,566 $66,613 $69,968 $44,414 Number of retired members 159 114 49 23 9 5