Embed Size (px)
Citation preview
Michigan Department of Environmental Quality Water Resources Division
Michigan's Implementation Plan Western Lake Erie Basin Collaborative
January 14, 2016
Purpose
The purpose of the Michigan Implementation Plan is to define actions toward the collaborative goal, serve as interim approach to domestic action plans to be developed under the Great Lakes Water Quality Agreement Annex 4 process, provide focus for allocation of resources for actions, and identify actions and potential policy and/or program needs. Background Lake Erie has seen many water quality problems over the past 50 years, including problems with nutrient enrichment. In the 1960s, the lake was declared "dead." Major pollution control efforts targeting the municipal and industrial point sources in the 1970s greatly improved lake quality. Lake Erie recovered and was soon recognized as a tremendous walleye fishery and recreational resource. Environmental conditions began to change again in the late 1980s as new aquatic invasive species, like Dreissenid mussels, established in Lake Erie. These invasive species changed the lake ecosystem in many ways that are not well understood. Additionally, farming practices changed over a similar time frame, with the advent of no-till farming and increased use of drain tiles. All these changes resulted in blue green algae blooms occurring in nuisance conditions on a regular basis in the Western Lake Erie Basin (WLEB), particularly off the mouth of the Maumee River. In August 2014, the Toledo, Ohio, drinking water supply was overwhelmed with harmful algal bloom toxins and had to stop supplying drinking water for a few days. As a result, a sense of urgency was given to taking action to correct the problems Lake Erie is facing today. In June 2015 Governor Rick Snyder signed the Western Basin of Lake Erie Collaborative Agreement (Agreement) with Premier Kathleen Wynne of Ontario and Lieutenant Governor Mary Taylor of Ohio (Attachment 1). This Agreement establishes a collaborative initiative that has a defined goal, establishes specific implementation plans, and is measured against expected results. Goal of the Agreement Through an adaptive management process, work to achieve a recommended 40 percent total load reduction in the amount of total and dissolved reactive phosphorus entering the WLEB by the year 2025 with an aspirational interim goal of a 20 percent reduction by 2020. The phosphorus loading data from 2008 was established as the base year from which progress will be measured. Finally, each state and province commits to developing, with stakeholder involvement, a plan outlining their proposed actions and time lines toward achieving the phosphorus reduction goal. Objectives
Regional This Agreement will provide a consistent framework across the WLEB for implementing programs and monitoring success. It will also establish accountability for actions and results.
2
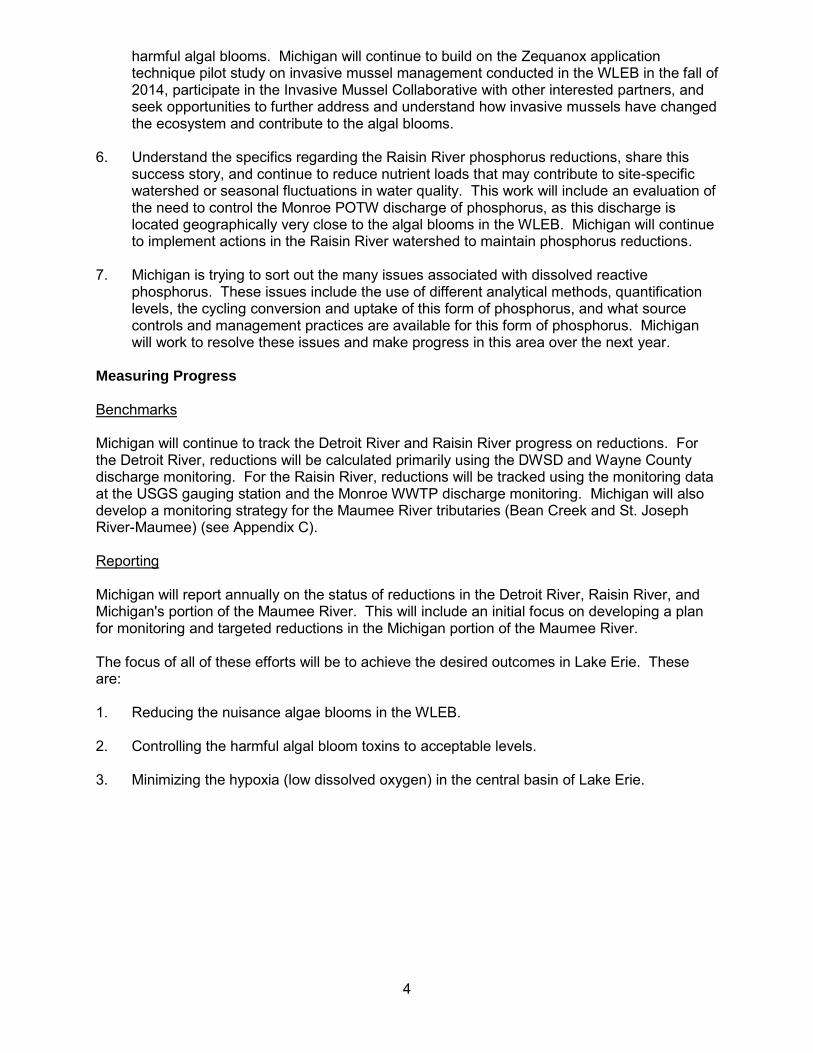
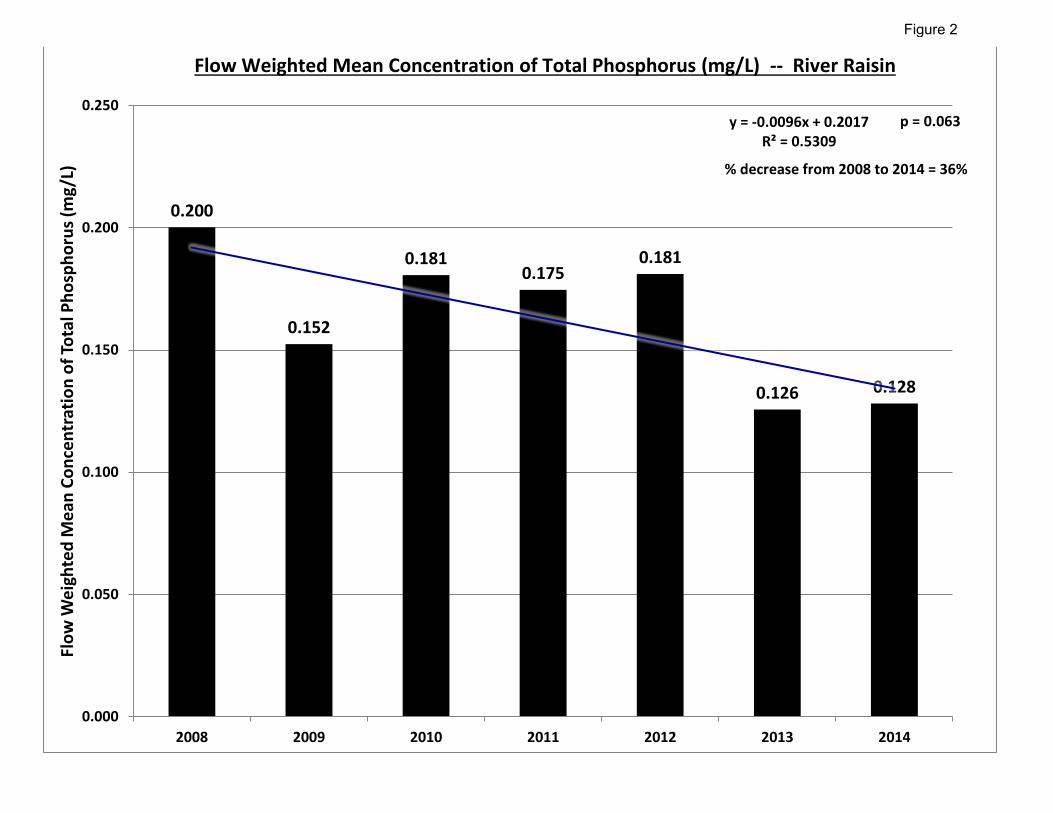
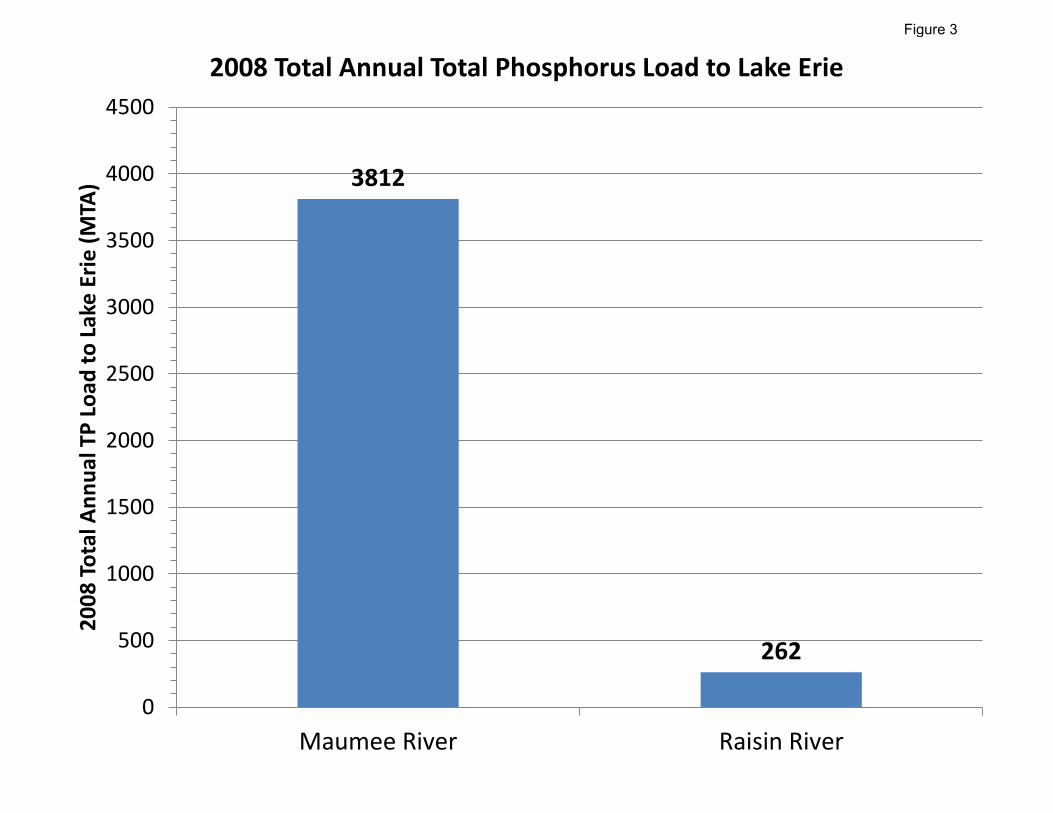
Michigan Michigan has been strategically aggressive in pursuing total phosphorus reductions since Lake Erie was first declared dead in the 1960s, seeing dramatic declines especially in the Detroit Water and Sewerage Department (DWSD) phosphorus loadings. DWSD is by far the largest point source discharge to Lake Erie. The reductions in this discharge were the main reason the Lake Erie ecosystem rebounded the first time, and why Michigan continues to strategically focus on this discharge. Michigan recently concentrated on the DWSD discharge in 2011 due to a confluence of events, including the large Lake Erie algae bloom, reissuance of the DWSD National Pollutant Discharge Elimination System (NPDES) permit, and preparing for the end of federal court oversight after 33 years. These events pushed Michigan and DWSD to focus and implement additional phosphorus controls early in the process – a proactive approach. Michigan also implemented a statewide residential fertilizer phosphorus ban in 2012. A similar ban in 2006 in the city of Ann Arbor has been shown to reduce phosphorus loadings in surface waters in residential areas by about 30 percent. This reduction may be used as a guide to estimate load reductions in residential areas in other watersheds. Michigan has three main areas of focus for phosphorus reductions – the Detroit River, the Raisin River, and the state's portion of the Maumee River basin. Our first step is to determine where phosphorus loads are relative to the reduction goals. Next, we will determine how to focus future efforts. Finally, we recognize that this plan will be adaptive in nature, responding to data and knowledge gained as we move forward in this process to solve the issues in Lake Erie. It should be noted that the phosphorus reductions are specifically designed to reduce the nuisance algae blooms. This is different than the harmful algal blooms, which are associated with the presence of algal toxins at unacceptable levels. No modeling currently exists for the harmful algal blooms. It is hoped that by reducing the nuisance algae blooms that a reduction in harmful algal blooms will also occur. Evaluation of Progress Since 2008 Detroit River reductions to date have been calculated using available monitoring data from the DWSD, as well as expectations extrapolated from phosphorus ban reductions. Thus far, Detroit River reductions have achieved about 95 percent of the total phosphorus goal of 506 metric tons (MT) per year, with reductions totaling 481 MT since 2008. The DWSD phosphorus loads include all discharges, including wet weather, and are explained in Appendix A. This drop is mainly due to additional controls at the DWSD discharge (Figure 1), along with reductions due to implementation of the fertilizer phosphorus ban. We expect to achieve another 15 MT reduction from controls at the Wayne County downriver discharge, taking Michigan to a 496 MT reduction since 2008, 98 percent of the goal. To date, Raisin River reductions near the river mouth have been calculated using the available monitoring data by Heidelberg University, the United States Geological Survey (USGS), and unpublished calculations by Matthew Maccoux. Using the 2008 baseline from the Annex 4 process of 262 MT and normalizing for flows, there is a 36 percent reduction in total phosphorus since 2008 (Figure 2). The details of these calculations are explained in Appendix B. It is important to recognize that this is a substantial reduction for the Raisin River but will likely have little effect on the overall Lake Erie nuisance algae blooms due to the relatively small contribution as compared to the Maumee River (Figure 3).
3
Maumee River basin (Bean Creek and St Joseph River) phosphorus load patterns for Michigan are not clear at this point and further work is underway to understand them. Michigan’s portion of the Maumee River basin is relatively small, about 300,000 acres in size representing about 7 percent of the land area in the basin (Figure 4). Land use in Michigan’s portion is mainly agriculture, including eight concentrated animal feeding operations (CAFO) under NPDES permit. These 8 CAFOs use about 21,000 acres for land application, representing 7 percent of the Michigan portion. Residential land use also represents about 7 percent of the land use in the Michigan portion. There is one larger publicly-owned treatment works (POTW) - the Hudson POTW - that discharges to Bean Creek. There are no approved watershed management plans for either Bean Creek or the St. Joseph River. There is very limited phosphorus monitoring data for either tributary, with the closest USGS gauge on the Tiffin River in Ohio. Proposed Plan Michigan has been proactive in successfully reducing phosphorus loads to Lake Erie and remains committed to addressing current problems. Michigan’s work is not complete and ongoing efforts will focus on the following actions: 1. Maintain the reductions achieved in the DWSD discharge as a result of the tightened
permit limits. This is the largest single point source discharge to Lake Erie. The reductions achieved to date are impressive, but need to be maintained. To assure this reduction is maintained, the Michigan Department of Environmental Quality (MDEQ) will work closely with DWSD to track and maintain this reduction. This will be accomplished by monthly meetings with the DWSD, prompt review of discharge levels, and MDEQ staff located at the actual wastewater treatment plant, which enhances relationships, communication, knowledge, exchange of information, and timeliness of actions.
2. Achieve reductions in the Wayne County Downriver Wastewater Treatment Plant (WWTP) discharge. This NPDES permit will be modified to include phosphorus limits consistent with the limits in the DWSD permit. This modification will be done in 2016 and reductions accomplished by 2020.
3. Achieve the target reductions in the Maumee River basin in Michigan. Michigan will develop a specific plan for these watersheds in 2016 (Appendix C). This plan will include appropriate monitoring, an analysis of target reductions for each watershed, and actions that will be implemented to achieve the target reductions. The process for developing this plan will include working closely with Indiana and Ohio, as they share these watersheds and monitoring information needs. Michigan is also pursuing the process to get an approved watershed management plan for this area.
4. Help with monitoring and understanding harmful algal blooms regarding presence, timing, and cause in Michigan waters, including the Great Lakes. Harmful algal blooms are currently not well understood. There are limited criteria for comparison with monitoring results, a variety of monitoring methods currently employed, limited sampling that is occurring, and toxins that are present in a variety of situations that do not appear logical at this time. Michigan will put a major effort forward in 2016 to address these issues so that we have an improved understanding of the risk Michigan faces from harmful algal blooms. Michigan will develop a strategy to accomplish this and share this strategy with other Great Lakes states and stakeholders.
5. Help with understanding the role of invasive mussels in causing Lake Erie algae blooms and the effect of potential invasive mussel control options. This aspect of the Lake Erie ecosystem is not well understood. There is very little information regarding the current distribution of invasive mussels, population densities, and their influence on nuisance and
4
harmful algal blooms. Michigan will continue to build on the Zequanox application technique pilot study on invasive mussel management conducted in the WLEB in the fall of 2014, participate in the Invasive Mussel Collaborative with other interested partners, and seek opportunities to further address and understand how invasive mussels have changed the ecosystem and contribute to the algal blooms.
6. Understand the specifics regarding the Raisin River phosphorus reductions, share this success story, and continue to reduce nutrient loads that may contribute to site-specific watershed or seasonal fluctuations in water quality. This work will include an evaluation of the need to control the Monroe POTW discharge of phosphorus, as this discharge is located geographically very close to the algal blooms in the WLEB. Michigan will continue to implement actions in the Raisin River watershed to maintain phosphorus reductions.
7. Michigan is trying to sort out the many issues associated with dissolved reactive phosphorus. These issues include the use of different analytical methods, quantification levels, the cycling conversion and uptake of this form of phosphorus, and what source controls and management practices are available for this form of phosphorus. Michigan will work to resolve these issues and make progress in this area over the next year.
Measuring Progress Benchmarks Michigan will continue to track the Detroit River and Raisin River progress on reductions. For the Detroit River, reductions will be calculated primarily using the DWSD and Wayne County discharge monitoring. For the Raisin River, reductions will be tracked using the monitoring data at the USGS gauging station and the Monroe WWTP discharge monitoring. Michigan will also develop a monitoring strategy for the Maumee River tributaries (Bean Creek and St. Joseph River-Maumee) (see Appendix C). Reporting Michigan will report annually on the status of reductions in the Detroit River, Raisin River, and Michigan's portion of the Maumee River. This will include an initial focus on developing a plan for monitoring and targeted reductions in the Michigan portion of the Maumee River. The focus of all of these efforts will be to achieve the desired outcomes in Lake Erie. These are: 1. Reducing the nuisance algae blooms in the WLEB.
2. Controlling the harmful algal bloom toxins to acceptable levels.
3. Minimizing the hypoxia (low dissolved oxygen) in the central basin of Lake Erie.
WESTERN BASIN OF LAKE ERIE COLLABORATIVE AGREEMENT
The Governors for the Western Lake Erie Basin States of Michigan and Ohio and the Premier of the
Province of Ontario (collectively, “the Parties”)
ACKNOWLEDGE the vital importance of the Western Basin of Lake Erie to the social and economic well-
being of the States and Province and the close connection between the water quality of the Western Basin of
Lake Erie and health of the entire lake;
ACKNOWLEDGE that the water quality and environmental conditions of Lake Erie are being impacted by
nutrients and other factors to the point that it poses a barrier to achieving the economic value and
environmental well-being of the entire lake;
ACKNOWLEDGE the need to address point and nonpoint derived nutrients, especially phosphorus, and
other biological and ecological factors in the Western Lake Erie Basin that may result in impairments to the
water quality and ecology of Lake Erie in its entirety;
ACKNOWLEDGE the Parties’ right and obligation to continue to support efforts under national or
binational initiatives and agreements and to individually develop and implement the necessary programs,
actions and polices to carry out their commitment to protect, restore and enhance the water quality of the
Western Lake Erie Basin and recognize the quantifiable early actions that have already been taken by the
Parties to reduce nutrient loadings;
ACKNOWLEDGE that the goals and timelines are set based on the best understanding of current Lake Erie
conditions and processes and will need continual updating and assessment over time through an adaptive
management process;
REAFFIRM that restoration and enhancement of the Western Basin of Lake Erie cannot be achieved solely
by the Parties in isolation, but rather, it is dependent upon the collaboration between the Parties to address
the water quality of the Western Basin of Lake Erie;
CONCLUDE that the best means to improve and protect Lake Erie’s water quality is through a collaborative
initiative between the Parties that has a defined goal, establishes specific implementation plans with time-
tables and is measured against expected results;
THE PARTIES AFFIRM TO
A Goal: Through an adaptive management process, work to achieve a recommended 40 percent total load reduction
in the amount of total and dissolved reactive phosphorus entering Lake Erie’s Western Basin by the year
2025 with an aspirational interim goal of a 20 percent reduction by 2020;
A Base Year: To use phosphorus loading data from 2008 to the Western Lake Erie Basin as the basis from which progress
will be measured;
Attachment 1
An Implementation Plan: Each state and province commits to developing, in collaboration with stakeholder involvement, a plan
outlining their proposed actions and timelines toward achieving the phosphorus reduction goal.
Signed this 13th day of June 2015. Rick Snyder Mary Taylor Kathleen Wynne Governor of Michigan Lieutenant Governor of Ohio Premier of Ontario
Detroit Water and Sewerage Department Total Phosphorus Annual Loading
0
100
200
300
400
500
600
700
800
900
2008 2009 2010 2011 2012 2013
Tota
l Ph
osp
ho
rus
Load
(M
T/ye
ar)
Year
Figure 1
0.200
0.152
0.181 0.175
0.181
0.126 0.128
y = -0.0096x + 0.2017 R² = 0.5309
0.000
0.050
0.100
0.150
0.200
0.250
2008 2009 2010 2011 2012 2013 2014
Flo
w W
eig
hte
d M
ean
Co
nce
ntr
atio
n o
f To
tal P
ho
sph
oru
s (m
g/L)
Flow Weighted Mean Concentration of Total Phosphorus (mg/L) -- River Raisin
% decrease from 2008 to 2014 = 36%
p = 0.063
Figure 2
3812
262
0
500
1000
1500
2000
2500
3000
3500
4000
4500
Maumee River Raisin River
20
08
To
tal A
nn
ual
TP
Lo
ad t
o L
ake
Eri
e (
MTA
) 2008 Total Annual Total Phosphorus Load to Lake Erie
Figure 3
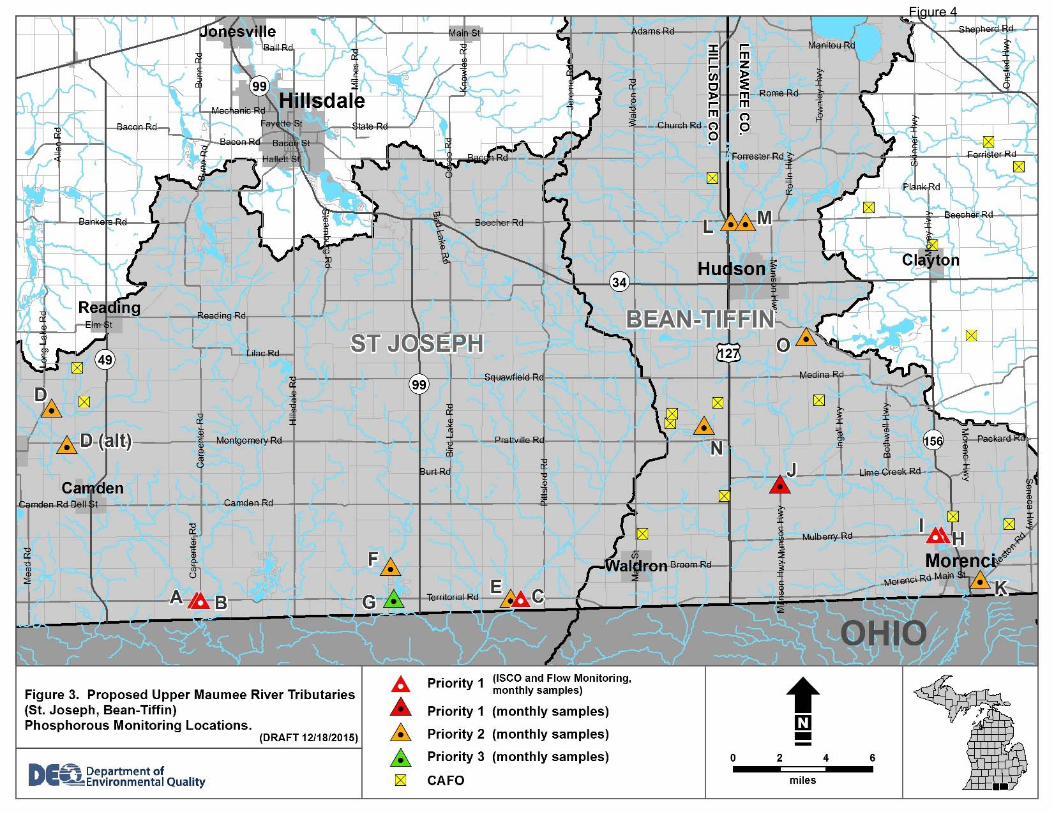
Figure 4
Appendix A
Detroit Water and Sewerage Department Phosphorus Loads
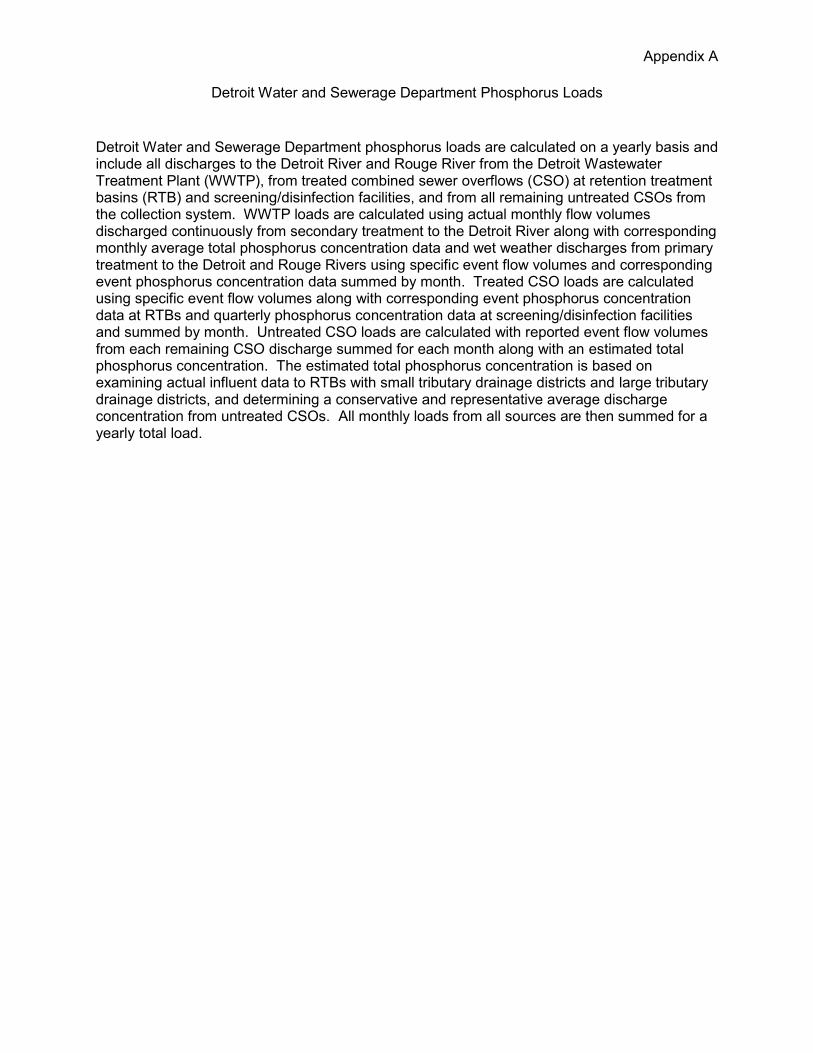
Detroit Water and Sewerage Department phosphorus loads are calculated on a yearly basis and include all discharges to the Detroit River and Rouge River from the Detroit Wastewater Treatment Plant (WWTP), from treated combined sewer overflows (CSO) at retention treatment basins (RTB) and screening/disinfection facilities, and from all remaining untreated CSOs from the collection system. WWTP loads are calculated using actual monthly flow volumes discharged continuously from secondary treatment to the Detroit River along with corresponding monthly average total phosphorus concentration data and wet weather discharges from primary treatment to the Detroit and Rouge Rivers using specific event flow volumes and corresponding event phosphorus concentration data summed by month. Treated CSO loads are calculated using specific event flow volumes along with corresponding event phosphorus concentration data at RTBs and quarterly phosphorus concentration data at screening/disinfection facilities and summed by month. Untreated CSO loads are calculated with reported event flow volumes from each remaining CSO discharge summed for each month along with an estimated total phosphorus concentration. The estimated total phosphorus concentration is based on examining actual influent data to RTBs with small tributary drainage districts and large tributary drainage districts, and determining a conservative and representative average discharge concentration from untreated CSOs. All monthly loads from all sources are then summed for a yearly total load.
Appendix B
River Raisin Total Phosphorus Loading Calculations
Flow weighted mean concentrations (FWMC) were used in these analyses because they provide a useful means to address inter-annual variability by normalizing the phosphorus delivery from a tributary with respect to flow, so that year-to-year performance is not confounded
by inter-annual variability in hydrology1. FWMCs can be calculated by dividing the phosphorus
load during a specified period (e.g., a year) by the cumulative flow during that period1. The
whole-watershed FWMCs in Figure 2 were computed as follows. First, whole-watershed annual total phosphorus load computations were needed. These computations were obtained from a former graduate student of Dr. David Dolan (deceased), Matthew Maccoux (personal
communication, September 16, 2015), who followed the approach of Dolan and Chapra2 and
who also did various calculations for Annex 4’s recommended phosphorus loading targets
document1. Maccoux’s computations were based upon water quality and flow data collected by
Heidelberg University’s Tributary Loading Program (HTLP) and an adjacent United States Geological Survey (USGS) gauging station (No. 04176500). Next, since the HTLP/USGS monitoring station (hereafter referred to as “station”) is located approximately 10.5 miles upstream of the River Raisin’s mouth, Maccoux’s whole-watershed load calculations also included estimates of total phosphorus and flow contributions made by the Monroe Wastewater Treatment Plant (WWTP), as well as runoff from the watershed drainage area downstream of the station (i.e., a unit area load computation estimated by taking loads measured at this river station minus contributions by upstream WWTPs). Maccoux’s load calculations were available for 2008-2013; Michigan Department of Environmental Quality (MDEQ) made the load calculations for 2014 using the same methods. The MDEQ then divided the whole-watershed total phosphorus load by the cumulative flow for the whole watershed (i.e., a sum of annual flows at the station [using USGS data] plus a unit area flow estimated for the drainage area downstream of the station plus flow contributed by the Monroe WWTP) for each respective year to compute annual FWMCs. Historically, HTLP station data is robust; however, some years (2008, 2010, 2012, and 2013) had significant water quality data gaps and, thus, Maccoux computed estimated loads for the missing dates in those years.
1 See: Annex 4 Objectives and Targets Task Team (Annex 4 OTTT). 2015. Recommended
Phosphorus Loading Targets for Lake Erie. Annex 4 Objectives and Targets Task Team Final Report to the Nutrients Annex Subcommittee (of the 2012 Great Lakes Water Quality Agreement), May 11, 2015. Last visited on August 25, 2015 at http://www2.epa.gov/glwqa/report-recommended-phosphorus-loading-targets-lake-erie. 2 Dolan, D.M. and S.C. Chapra. 2012. Great Lakes total phosphorus revisited: 1. Loading
analysis and update (1994-2008). J. Great Lakes Res. 38 (4): 730-740.

Phase 1: 2016 Monitoring Plan for Michigan’s Maumee River Tributaries
(St. Joseph River and Bean Creek/Tiffin River Watersheds) Michigan Department of Environmental Quality
Water Resources Division January 2016
BACKGROUND AND OBJECTIVES The Annex 4 Objectives and Targets Task Team (OTTT) has determined that the Maumee River Watershed is a large contributor of phosphorus to Lake Erie (Annex 4 OTTT, 2015), a lake which frequently experiences large harmful algal blooms and hypoxia in certain areas. While Michigan is located far up in the Maumee River watershed, it still contributes some phosphorus to the watershed via the St. Joseph River and Bean Creek (a major tributary to the Tiffin River in Ohio). Phased Approach The Michigan Department of Environmental Quality's (MDEQ) Water Resources Division (WRD) plans to apply a phased approach towards monitoring phosphorus and other water quality conditions in the St. Joseph River and Bean Creek watersheds in order to make the best use of available resources. Phase I (March-July 2016) In Phase I, the focus of monitoring efforts will be on the parameters total phosphorus and flow (discharge) conditions, though some other parameters (e.g., turbidity, specific conductance, pH, dissolved oxygen, and temperature) will also be measured when monthly total phosphorus grab samples are collected. Numerous sites will be monitored during this phase. Dissolved orthophosphate1 samples will be collected on a limited basis (i.e., on 1 or 2 monthly grab sample events [discussed later]) in order to develop a preliminary estimate of dissolved orthophosphate conditions in the study watersheds. Additional, more intensive monitoring of dissolved orthophosphate may be done in later phases of this study if a consensus on sampling and handling methods can be arrived amongst the various Annex 4 participants. Currently, the time between sample collection and filtering of water samples varies considerably, and often does not conform to recommended methods (e.g., Title 40 of the Code of Federal Regulations, Part 136, Guidelines Establishing Test Procedures for the Analysis of Pollutants2), especially when automated samplers are utilized. The primary objectives of Phase I of this proposed monitoring plan are to: 1. Characterize total phosphorus concentrations throughout the St. Joseph River and Bean
Creek watersheds (especially near where those rivers leave Michigan and flow into Ohio) under a variety of “spring” (March 1 through July 31, as defined by the Annex 4 OTTT [Annex 4 OTTT, 2015]) flow conditions.
1 The MDEQ, similar to the Ohio Environmental Protection Agency (EPA), will treat dissolved
orthophosphate and dissolved reactive phosphorus as essentially the same (see Ohio EPA, 2013; and Ohio EPA, 2015), recognizing that there sometimes may be small discrepancies between the two (see also APHA, 1995 [Method 4500-P-A] for additional details). The present study will use the two terms interchangeably. 2 See http://www.ecfr.gov/cgi-bin/text-idx?tpl=/ecfrbrowse/Title40/40cfr136_main_02.tpl.
Appendix C
2
2. Identify subwatersheds with high total phosphorus conditions (relative to other parts of the
Bean Creek and St. Joseph River watersheds) where more data should be collected (see Phase II below).
3. Begin to use this information to prioritize subwatersheds where future phosphorus
reduction efforts should be focused. Phase II (schedule to be determined; possibly late 2016 or early 2017) and Possible Future Phases After Phase I data have been reviewed by the MDEQ, the subwatersheds with the highest relative phosphorus concentrations will be identified. Then, during Phase II, more intensive, follow-up sampling is expected to occur. Fewer sites may be sampled during Phase II than during Phase I if some Phase I sites have considerably lower phosphorus concentrations than the rest of the study watersheds. Sites to be monitored during Phase II will likely be a subset of sites that were monitored in Phase I; additionally, some new sites may be added. The tentative plan for Phase II will be to monitor additional parameters in subwatersheds identified in Phase I that have the highest relative total phosphorus concentrations. Possible parameters in this phase for targeted subwatersheds could include (to be determined): total phosphorus, dissolved orthophosphate, various forms of nitrogen (e.g., nitrate, nitrite, total kjeldahl N, or ammonia), turbidity, etc. Other investigations and expanded analyses that could be done during Phase II to help identify sources of phosphorus contributions in these targeted subwatersheds include, for example: 1. Geographic Information System-based land use analyses and mapping of features such
as National Pollutant Discharge Elimination System facilities, concentrated animal feeding operations (CAFO), and riparian vegetation buffer and shading conditions.
2. Walking lengths of streams to monitor for and/or look for potential anthropogenic sources
of significant phosphorus contributions. Additional phases, if needed, may be considered in the future after reviewing data collected in Phases I and II. Limitations Regarding Possible Use of Data for Generating Loading Estimates This study will not attempt to accurately compute phosphorus loads leaving Michigan due to the cost of installing and maintaining new United States Geological Survey (USGS) gaging stations and also collecting water quality samples on a daily or near-daily basis. However, some limited, supplemental monitoring of phosphorus and flow will be conducted (e.g., in Phase I) during some runoff (or snowmelt) events to characterize how conditions change and how high concentrations can get at the study’s major, downstream monitoring sites during these types of events. It is possible that this study’s data may be used to calculate rough estimates of phosphorus loads and flow weighted mean concentrations at some major sites; however, it should be recognized that these estimates will be less robust than if much larger data sets had been collected.
3
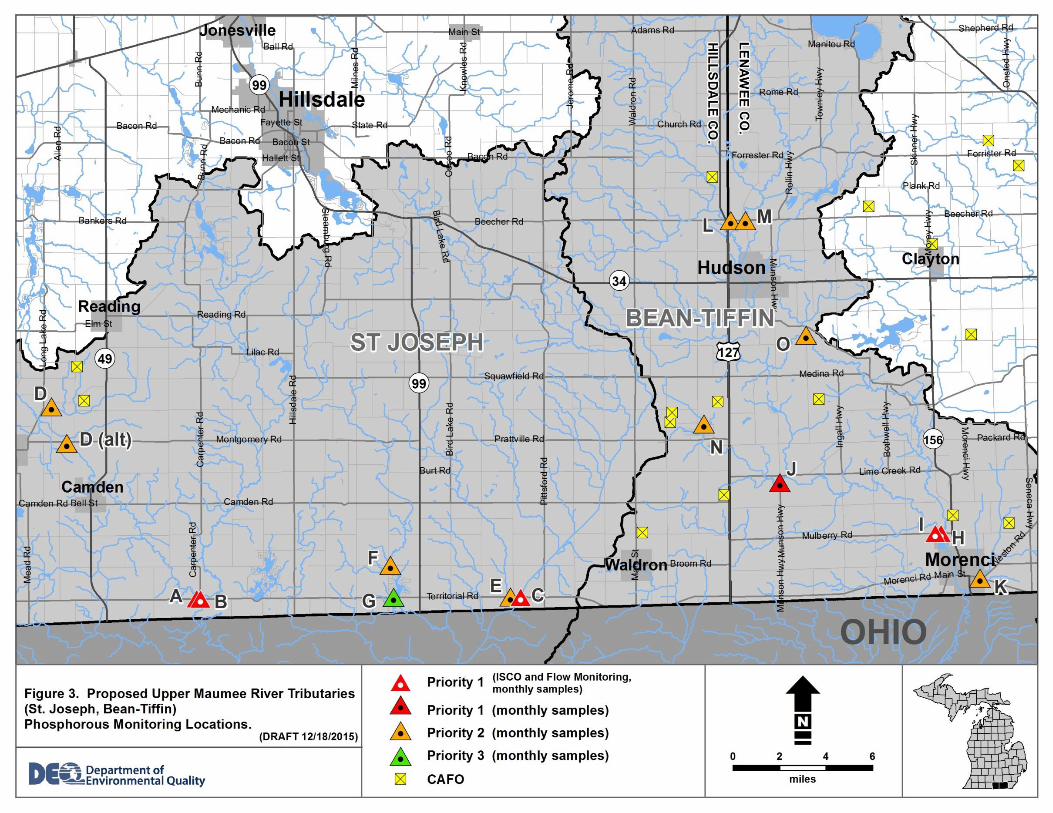
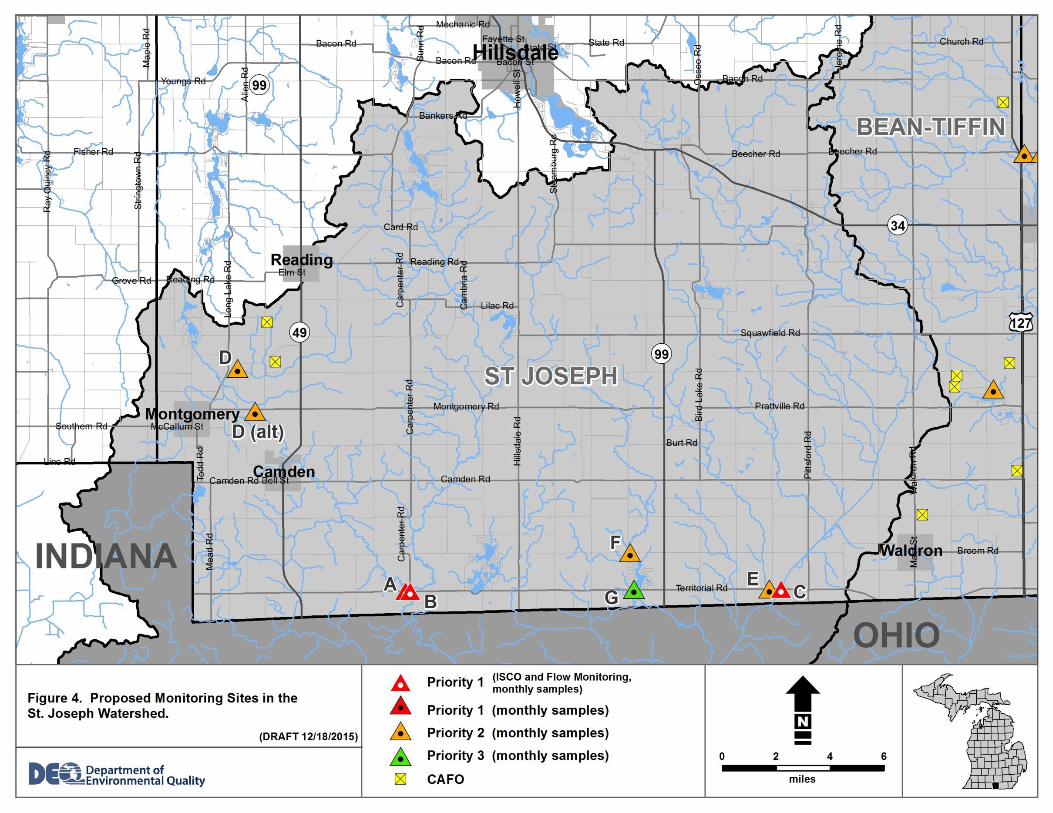
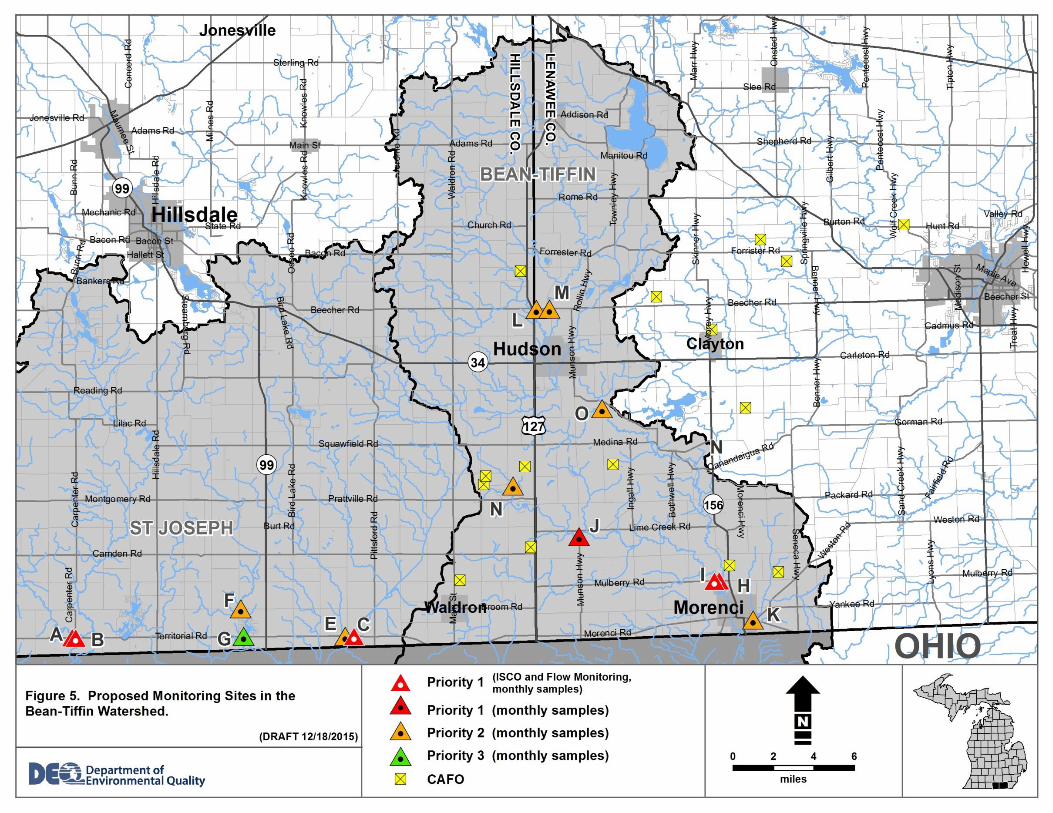
STUDY DESIGN AND METHODS Site Selection A number of factors were taken into account when trying to select where water quality monitoring sites would be located including: estimated phosphorus yields from various subbasins in the watersheds, locations of CAFOs tracked by the WRD, E. coli bacteria problem areas tracked by the WRD’s Total Maximum Daily Load (TMDL) Program, and proximity to the Michigan-Ohio border. Estimated annual total phosphorus and dissolved reactive phosphorus yields from subbasins of the Maumee River in Michigan were considered (see Figures 1 and 2 and Table 1). These draft maps were made available by Rebecca (Logsdon) Muenich and Margaret Kalcic of the Graham Sustainability Institute at the University of Michigan (Rebecca Muenich, personal communication, November 19, 2015), and future publication of their finalized versions is anticipated. The draft maps are based upon an updated version of the Soil and Water Assessment Tool model that was used by Scavia et al., 2014, and referenced by Betanzo et al., 2015. CAFO locations are shown in Figures 3, 4, and 5. E. coli TMDL-related reaches of Bean Creek (as of November 2015) are located downstream of sites L and M and upstream of site O but are not shown on a map in this plan (Figure 5). Currently, 14 high (“1”) and medium-high (“2”) priority sites in the St. Joseph River and Bean Creek watersheds have been selected for monitoring (see Table 2 and Figures 3-5). One medium priority (“3”) site (Site “G” in Table 2) was also identified as a possible site for monitoring, if funding is available. Site G (Silver Creek at East Territorial Road) is located near where the stream drains into Ohio, but it is downstream of a lake (Merry Lake) where much of the phosphorus may settle into the lake sediments and be affected by complex lake dynamics. (Note: Assessments of potential logistical issues are being examined at each of the proposed monitoring sites and may result in adjustments to some site locations.) Sampling Frequency and Techniques Monthly Samples (Grab Samples) One monthly subsurface grab sample of water will be collected for at least 6 months (March 1 thru July 31) in 2016. This approach is similar to Ohio EPA’s Enhanced Western Lake Erie Basin tributary monitoring project, though for less months (Ohio EPA, 2015). This will result in 6 samples per site for these instantaneous snapshots of watershed water quality, with an end result of approximately 114 water samples (i.e., for total phosphorus and turbidity) and sonde parameter (specific conductance, pH, dissolved oxygen, and temperature) measurements (see Table 3 and also the Budget section) plus some quality assurance samples (described later). Dissolved orthophosphate samples will be collected on a limited basis, as mentioned earlier, (i.e., on 1 or 2 monthly grab sample events) during Phase I. This parameter may be sampled more frequently during Phase II. An effort will be made to collect samples under a variety of streamflow conditions. Weather patterns and regional streamflow conditions will be monitored by various means such as viewing online real-time USGS flow data (similar to Ohio EPA, 2015) for gage stations elsewhere in the watershed, tracking local weather patterns and forecasts online, and conferring with MDEQ district staff in advance of sampling.
4
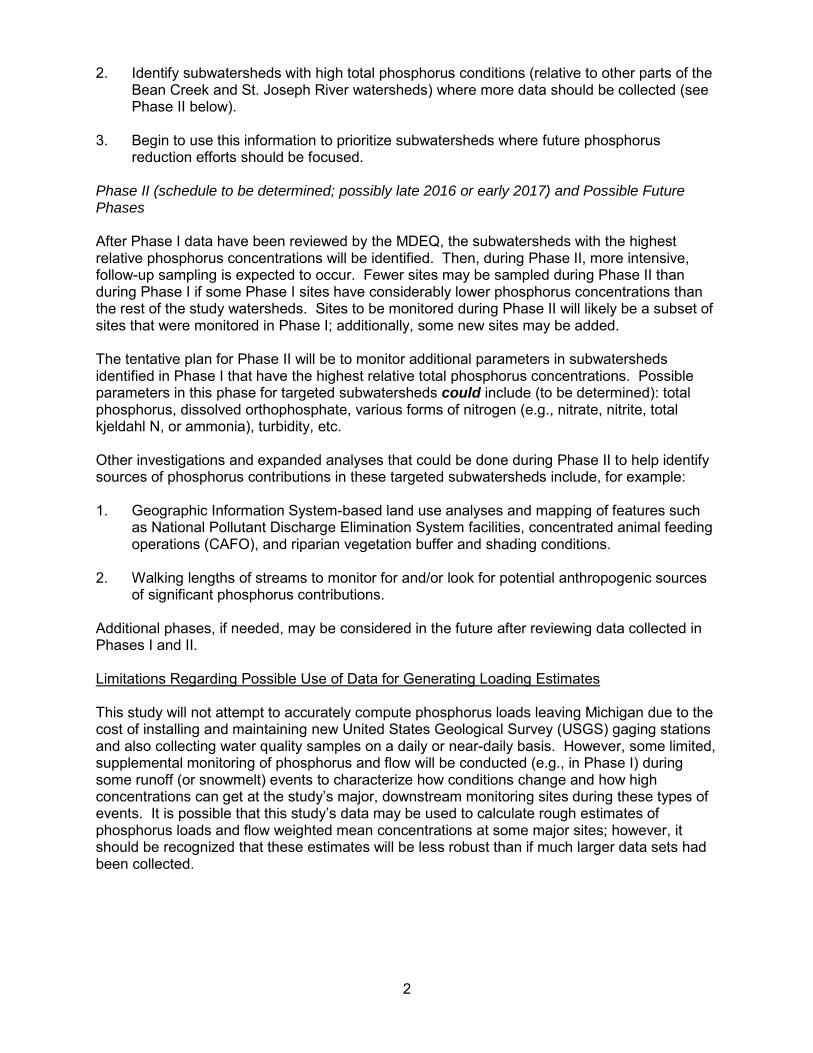
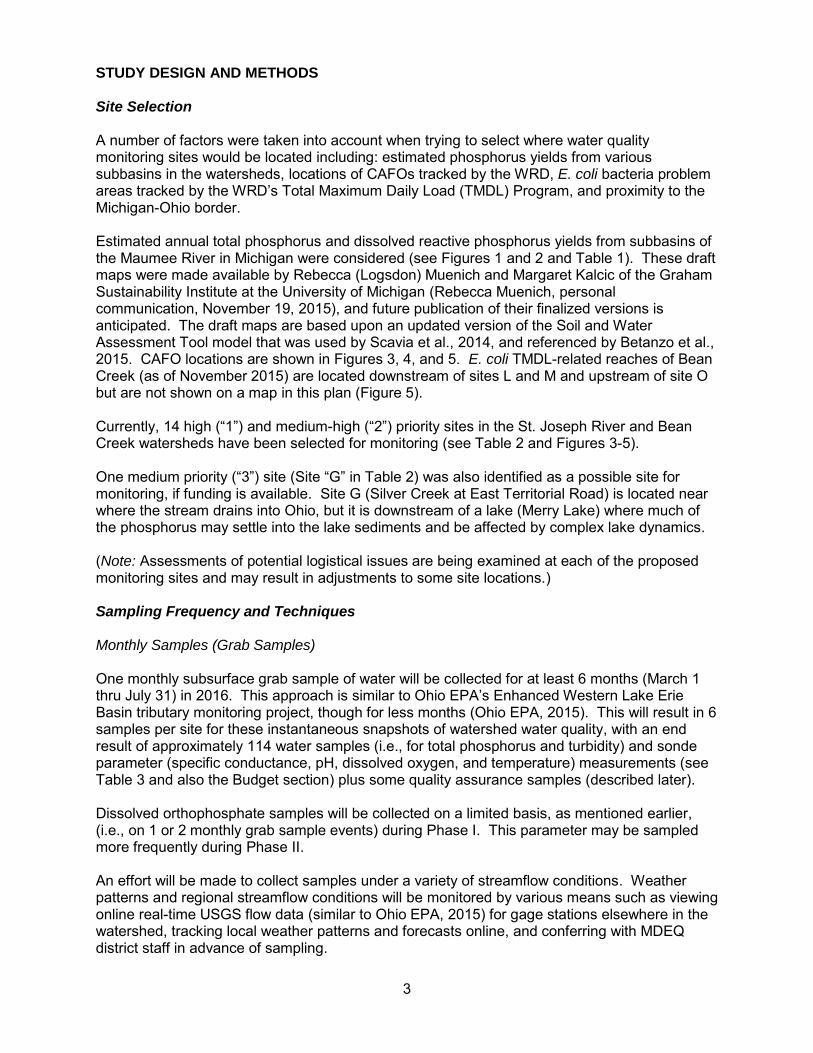
The grab samples, along with sonde parameter measurements and turbidity samples (see Table 1), will be collected either by wading into the river with a new LDPE sample bottle or by sampling off of bridges (similar to Ohio EPA, 2015), though when sampling from bridges, this project will place new LDPE sample bottles in an MDEQ-designed “sampling stick” (i.e., bottle holder, see image below) and be lowered down to the water rather than collecting water from a river with a clean bucket as in Ohio EPA, 2015. The sampler must always stand downstream of the collection vessel, and sample “into the current”; care must be taken to avoid introducing resuspended sediment into the sample (Ohio EPA, 2013). River stage and flow will be measured as described in Table 1.
MDEQ-designed “sampling stick”
Runoff Events (Using Automatic Samplers) Similar to Ohio EPA, 2015, runoff event sampling will occur by using ISCO automatic samplers during at least 2-3 runoff or snowmelt events sometime between March 1 and July 31. ISCO bubbler flow meters will be paired with the automatic samplers in order to collect river stage data alongside the water quality samples. River stage and flow will be measured as described in Table 1. This event monitoring will be done to provide some understanding of the variability of nutrients (e.g., how high and low concentrations get) during runoff events. Details on how the MDEQ plans to adapt Ohio EPA methods (Ohio EPA, 2015) for sampling with automatic samplers during these events are in Appendix 13. This runoff event sampling will take place at 5 sites close to the Michigan-Ohio border (see Figures 3-5). Sampling will occur when a storm or snowmelt event is expected to result in increased stream flow (e.g., a rain event predicted to result in a 0.5-inch of rain or more) based upon checking
3 Ohio EPA recently said they no longer composite their samples (as described in Ohio EPA, 2015)
(Cathy Alexander and Josh Griffin, Ohio EPA, personal communication December 23, 2015). Thus, in this study, discrete, representative samples along the various parts of the storm hydrograph will be collected and analyzed.

5
Web sites such as the National Oceanic and Atmospheric Administration's National Weather Service and conferring with local MDEQ District staff. There are no plans to analyze runoff event samples for dissolved orthophosphate during Phase I, especially when automatic samplers are collecting the samples, for reasons mentioned earlier. Sampling Parameters, Methods, and Quality Assurance (QA) Sampling Parameters and Methods The water quality parameters that will be sampled, along with their associated preservation and laboratory analytical methods, are presented in Table 3. Reporting Limits
The analytical procedures align between both the MDEQ's Environmental Laboratory and Ohio EPA's Laboratory, except that Ohio EPA’s reporting limit for total phosphorus and dissolved orthophosphate is 0.01 milligrams per liter (mg/L) and MDEQ’s is 0.005 mg/L. ISCO Cleaning and Rinsing; Gloves Gloves will be worn when handling sample bottles or syringes during sample collection to prevent contamination and reduce sampling safety concerns (United States Environmental Protection Agency [USEPA], 2009; and Ohio EPA, 2013). Prior to use of an ISCO automatic sampler, all sampler parts that contact the sample (sampler lines, bottles, etc.) should be thoroughly rinsed (per Ohio EPA, 2013 [p. 23]) with: (1) hot tap water, (2) Liquinox (low phosphorus) detergent solution, (3) tap water, (4) 10% hydrochloric acid, and (5) deionized water (instead of distilled water). It appears that the Ohio EPA (Ohio EPA, 2013 [p. 14]) recommends against prerinsing sample containers, so the MDEQ will not prerinse in the field the new LDPE sample containers (i.e., bottles) that it uses to collect sample water. The Ohio EPA does advise that automatic samplers be double rinsed with sample water prior to collecting samples and to discard rinse water downstream of where samples will be collected (Ohio EPA, 2013 [p. 14]). The MDEQ will do this as well. QA Samples Field blanks (using deionized water) and field replicates will each be collected at a frequency of at least 10% following Michigan guidance (5% is considered to be the absolute minimum; 10% may be more appropriate for some special projects) (Michigan Department of Natural Resources [MDNR], 1994). Sample preservatives will be added to QA samples (i.e., blanks and replicates) as appropriate for the parameters (i.e., total phosphorus) being analyzed. The Ohio EPA (Ohio EPA, 2013) recommends at least 5% each for field replicates and field blanks, so the MDEQ’s plan appears to be suitable in this regard. At this time, there is no plan to submit blind field duplicates (field splits) for lab analysis; the MDNR (MDNR, 1994) has no recommended frequency for those types of samples and states that they should only be submitted to address special problems or needs. Equipment blanks (using deionized water) will be collected at a minimum of 1 per cleaned automatic sampler or compositing bucket per event, and they will be taken in place of field blanks for that equipment.
6
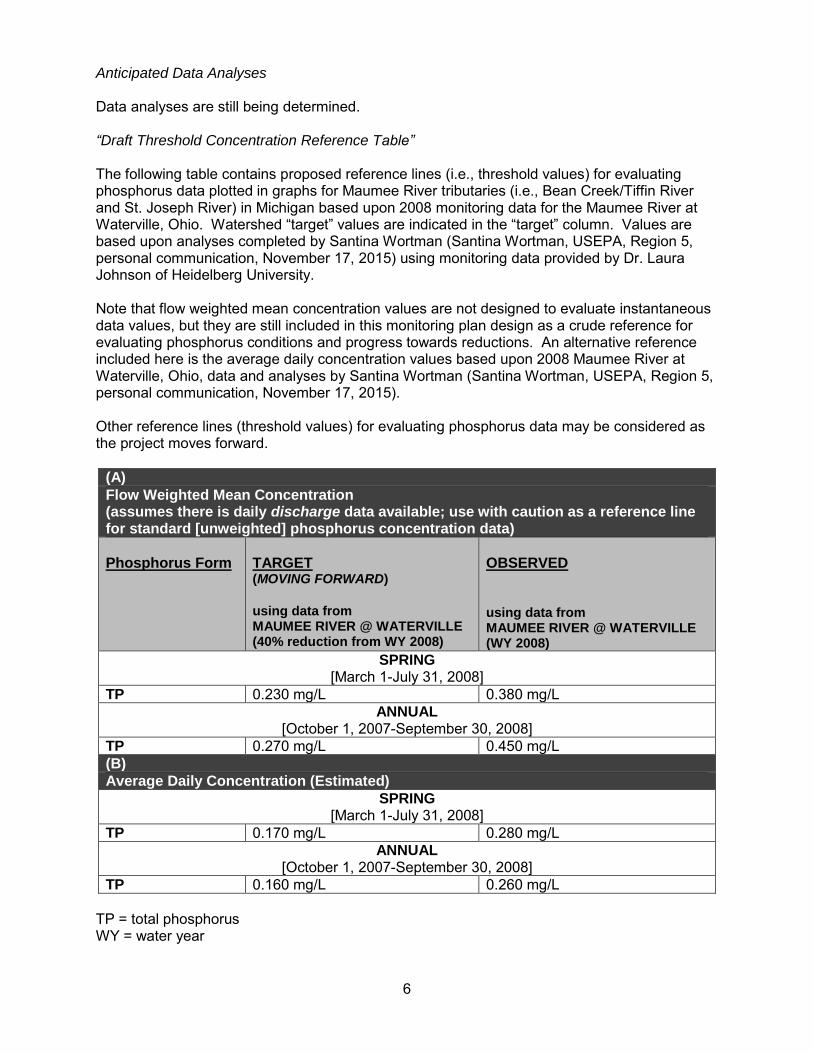
Anticipated Data Analyses Data analyses are still being determined. “Draft Threshold Concentration Reference Table” The following table contains proposed reference lines (i.e., threshold values) for evaluating phosphorus data plotted in graphs for Maumee River tributaries (i.e., Bean Creek/Tiffin River and St. Joseph River) in Michigan based upon 2008 monitoring data for the Maumee River at Waterville, Ohio. Watershed “target” values are indicated in the “target” column. Values are based upon analyses completed by Santina Wortman (Santina Wortman, USEPA, Region 5, personal communication, November 17, 2015) using monitoring data provided by Dr. Laura Johnson of Heidelberg University. Note that flow weighted mean concentration values are not designed to evaluate instantaneous data values, but they are still included in this monitoring plan design as a crude reference for evaluating phosphorus conditions and progress towards reductions. An alternative reference included here is the average daily concentration values based upon 2008 Maumee River at Waterville, Ohio, data and analyses by Santina Wortman (Santina Wortman, USEPA, Region 5, personal communication, November 17, 2015). Other reference lines (threshold values) for evaluating phosphorus data may be considered as the project moves forward.
(A)
Flow Weighted Mean Concentration (assumes there is daily discharge data available; use with caution as a reference line for standard [unweighted] phosphorus concentration data)
Phosphorus Form
TARGET (MOVING FORWARD)
using data from MAUMEE RIVER @ WATERVILLE (40% reduction from WY 2008)
OBSERVED using data from MAUMEE RIVER @ WATERVILLE (WY 2008)
SPRING [March 1-July 31, 2008]
TP 0.230 mg/L 0.380 mg/L
ANNUAL [October 1, 2007-September 30, 2008]
TP 0.270 mg/L 0.450 mg/L
(B)
Average Daily Concentration (Estimated)
SPRING [March 1-July 31, 2008]
TP 0.170 mg/L 0.280 mg/L
ANNUAL [October 1, 2007-September 30, 2008]
TP 0.160 mg/L 0.260 mg/L
TP = total phosphorus WY = water year
7
REFERENCES Annex 4 OTTT). 2015. Recommended Phosphorus Loading Targets for Lake Erie. Annex 4
Objectives and Targets Task Team Final Report to the Nutrients Annex Subcommittee (of the 2012 Great Lakes Water Quality Agreement), May 11, 2015. Last visited on August 25, 2015, at: http://www2.epa.gov/glwqa/report-recommended-phosphorus-loading-targets-lake-erie.
APHA. 1995. Standard Methods for the Examination of Water and Wastewater. 19th Edition.
American Public Health Association. Washington, D.C. Betanzo, E.A., A.F. Choquette, K.H. Reckhow, L. Hayes, E.R. Hagen, D.M. Argue, and
A.A. Cangelosi. 2015. Water data to answer urgent water policy questions: Monitoring design, available data and filling data gaps for determining the effectiveness of agricultural management practices for reducing tributary nutrient loads to Lake Erie, Northeast-Midwest Institute Report, 169 p., http://www.nemw.org/.
MDNR. 1994. Quality Assurance Manual for Water, Sediment, and Biological Sampling. Michigan
Department of Natural Resources, Surface Water Quality Division. Report No. MI/DEQ/SWQ-98/083.
Ohio EPA. 2013. Surface Water Field Sampling Manual, Version 4.0. Ohio EPA, Division of
Surface Water, Columbus, Ohio. Last visited on November 17, 2015, at: http://epa.ohio.gov/Portals/35/documents/SW_SamplingManual.pdf.
Ohio EPA. 2015. Enhanced Tributary Monitoring in the Western Lake Erie Basin (v 1.4). Ohio
EPA, Division of Surface Water, Columbus, Ohio. July 2015. Last visited on November 17, 2015, at: http://epa.ohio.gov/Portals/35/documents/2015_Enhanced_WLEB_Trib_StudyPlan.pdf.
Rantz, S.E., and others. 1982. Measurement and computation of streamflow. United States
Geological Survey Water-Supply Paper 2175. Last visited on November 17, 2015, at: http://pubs.usgs.gov/wsp/wsp2175/.
Scavia, D., J.D. Allan, K.K. Arend, S. Bartell, D. Beletsky, N.S. Bosch, S.B. Brandt, R.D. Briland,
I. Daloğlu, J.V. DePinto, D.M. Dolan, M.A. Evans, T.M. Farmer, D. Goto, H. Han, T.O. Hook, R. Knight, S.A. Ludisn, D. Mason, A.M. Michalak, R.P. Richards, J.J. Roberts, D.K. Rucinski, E. Rutherford, D.J. Schwab, T.M. Sesterhenn, H. Zhang, and Y. Zhou. 2014. Assessing and addressing the re-eutrophication of Lake Erie: Central basin hypoxia: Journal of Great Lakes Research, v. 40, issue 2, p. 226-246, http://dx.doi.org/10.1016/j.jglr.2014.02.004.
USEPA. 1974. Method 365.4: Phosphorous, Total (Colorimetric, Automated, Block Digester AA II).
United States Environmental Protection Agency: http://www2.epa.gov/sites/production/files/2015-08/documents/method_365-4_1974.pdf.
USEPA. 1993. Method 365.1, Revision 2.0: Determination of Phosphorus by Semi-Automated Colorimetry. United States Environmental Protection Agency:
http://www2.epa.gov/sites/production/files/2015-08/documents/method_365-1_1993.pdf USEPA. 2009. National Rivers and Streams Assessment: Field Operations Manual. EPA-841-B-
07-009. United States Environmental Protection Agency, Washington, DC. 354 p. Last visited on November 20, 2015, at: http://www2.epa.gov/sites/production/files/2013-11/documents/nrsa_field_manual_4_21_09.pdf.
APPENDIX 1
Runoff Event Sampling (Methods) Adapted from Ohio Environmental Protection Agency (EPA) (Ohio EPA, 2015) Michigan Department of Environmental Quality (MDEQ) staff will use automatic samplers to collect samples during runoff or snowmelt events primarily during the spring to provide some understanding of the variability of nutrients during these kinds of conditions. When it is determined a storm is likely to result in increased stream flow, a crew will travel to the five sites chosen for runoff sampling. Please see Figure 3 for those locations. Upon arriving at the site, a presample meter reading (temperature, pH, dissolved oxygen concentration, and specific conductance) will be taken with a YSI 6-series sonde (if available). Then, the automatic samplers will be set up and iced, and a determination will be made on the sampler start time and interval (e.g., have the samplers turn on when river stage goes above a certain level, as monitored by an ISCO bubbler on-site). Typically, 24 aliquots will be taken and the sample interval will determine how long the sampler will be deployed; i.e., if intervals are 0.5 hour, the sampler will run for 12 hours (24 aliquots x 0.5 hour = 12-hour deployment); if intervals are 1 hour, the sampler will run for 24 hours. At this time, the deployment length is undetermined for the MDEQ since factors such as: (a) catching as much of the runoff event as possible, and (b) estimated time to reach peak flow at the different individual sites need to be considered. Samples will be collected from the automatic sampler depending on the sampler interval after weather forecasts and climate data online have indicated that a significant storm has passed through the area. As mentioned earlier, the Ohio EPA recently said they no longer composite their samples (as had been described in Ohio EPA, 2015) (Cathy Alexander and Josh Griffin, Ohio EPA, personal communication, December 23, 2015). Thus, in this study, discrete, representative samples along the various parts of the storm hydrograph will be collected and analyzed. Like Ohio EPA (Ohio EPA, 2015), samples will be chosen to represent various important aspects of a given storm, according to the hydrograph breaks; i.e., first, upward, top, and postflush. Samples will be packed in ice, a postsample sonde meter reading will be taken, and the crew will return to headquarters and deliver samples to the lab based on previous communications with the lab.
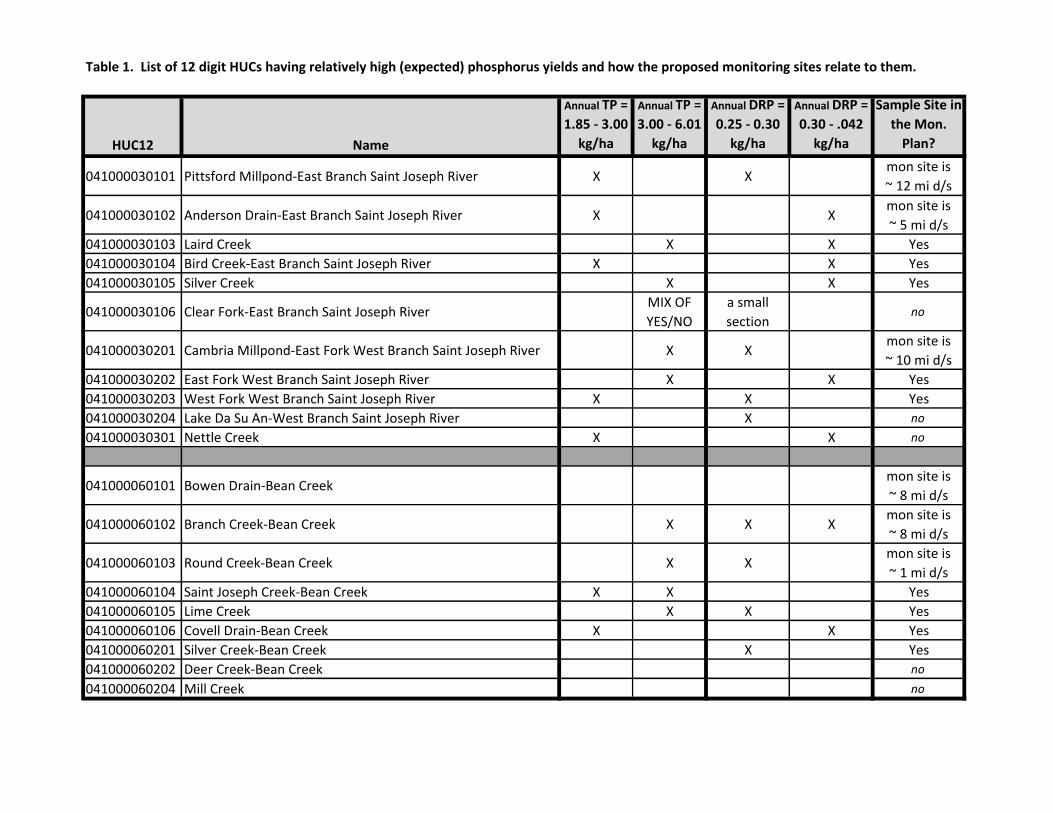
Table 1. List of 12 digit HUCs having relatively high (expected) phosphorus yields and how the proposed monitoring sites relate to them.
HUC12 Name
Annual TP =
1.85 - 3.00
kg/ha
Annual TP =
3.00 - 6.01
kg/ha
Annual DRP =
0.25 - 0.30
kg/ha
Annual DRP =
0.30 - .042
kg/ha
Sample Site in
the Mon.
Plan?
041000030101 Pittsford Millpond-East Branch Saint Joseph River X Xmon site is
~ 12 mi d/s
041000030102 Anderson Drain-East Branch Saint Joseph River X Xmon site is
~ 5 mi d/s
041000030103 Laird Creek X X Yes
041000030104 Bird Creek-East Branch Saint Joseph River X X Yes
041000030105 Silver Creek X X Yes
041000030106 Clear Fork-East Branch Saint Joseph RiverMIX OF
YES/NO
a small
sectionno
041000030201 Cambria Millpond-East Fork West Branch Saint Joseph River X Xmon site is
~ 10 mi d/s
041000030202 East Fork West Branch Saint Joseph River X X Yes
041000030203 West Fork West Branch Saint Joseph River X X Yes
041000030204 Lake Da Su An-West Branch Saint Joseph River X no
041000030301 Nettle Creek X X no
041000060101 Bowen Drain-Bean Creekmon site is
~ 8 mi d/s
041000060102 Branch Creek-Bean Creek X X Xmon site is
~ 8 mi d/s
041000060103 Round Creek-Bean Creek X Xmon site is
~ 1 mi d/s
041000060104 Saint Joseph Creek-Bean Creek X X Yes
041000060105 Lime Creek X X Yes
041000060106 Covell Drain-Bean Creek X X Yes
041000060201 Silver Creek-Bean Creek X Yes
041000060202 Deer Creek-Bean Creek no
041000060204 Mill Creek no
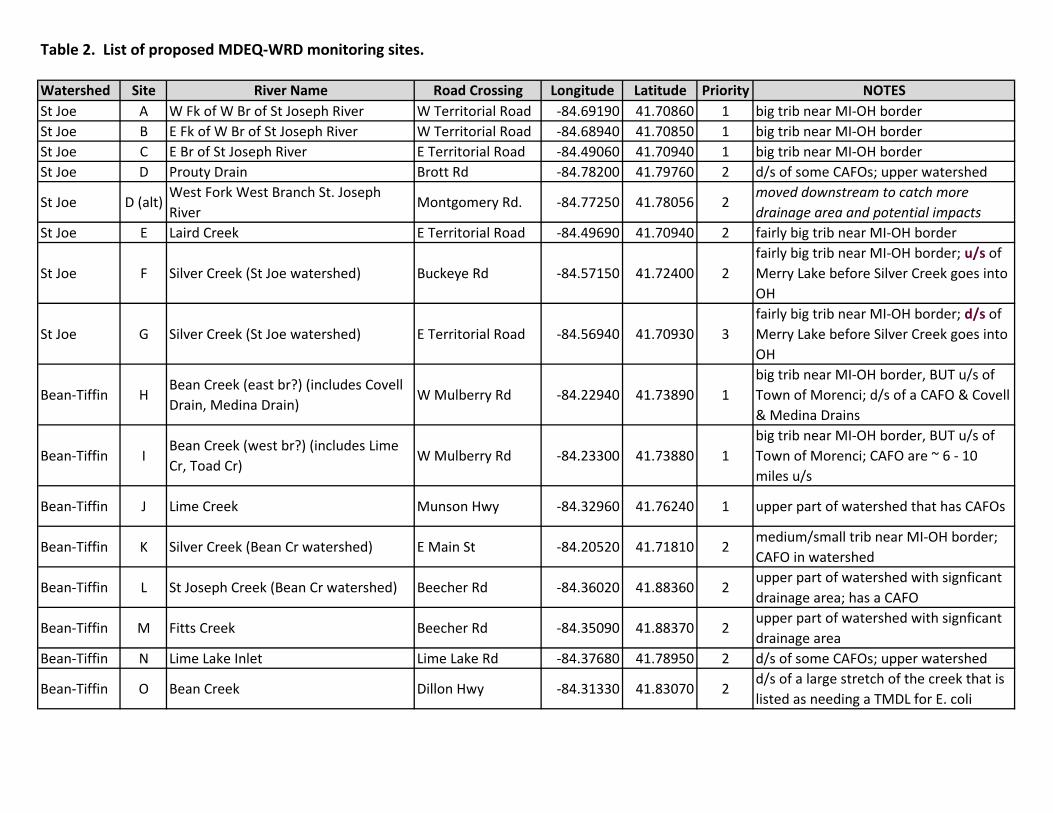
Table 2. List of proposed MDEQ-WRD monitoring sites.
Watershed Site River Name Road Crossing Longitude Latitude Priority NOTES
St Joe A W Fk of W Br of St Joseph River W Territorial Road -84.69190 41.70860 1 big trib near MI-OH border
St Joe B E Fk of W Br of St Joseph River W Territorial Road -84.68940 41.70850 1 big trib near MI-OH border
St Joe C E Br of St Joseph River E Territorial Road -84.49060 41.70940 1 big trib near MI-OH border
St Joe D Prouty Drain Brott Rd -84.78200 41.79760 2 d/s of some CAFOs; upper watershed
St Joe D (alt)West Fork West Branch St. Joseph
RiverMontgomery Rd. -84.77250 41.78056 2
moved downstream to catch more
drainage area and potential impacts
St Joe E Laird Creek E Territorial Road -84.49690 41.70940 2 fairly big trib near MI-OH border
St Joe F Silver Creek (St Joe watershed) Buckeye Rd -84.57150 41.72400 2
fairly big trib near MI-OH border; u/s of
Merry Lake before Silver Creek goes into
OH
St Joe G Silver Creek (St Joe watershed) E Territorial Road -84.56940 41.70930 3
fairly big trib near MI-OH border; d/s of
Merry Lake before Silver Creek goes into
OH
Bean-Tiffin HBean Creek (east br?) (includes Covell
Drain, Medina Drain)W Mulberry Rd -84.22940 41.73890 1
big trib near MI-OH border, BUT u/s of
Town of Morenci; d/s of a CAFO & Covell
& Medina Drains
Bean-Tiffin IBean Creek (west br?) (includes Lime
Cr, Toad Cr)W Mulberry Rd -84.23300 41.73880 1
big trib near MI-OH border, BUT u/s of
Town of Morenci; CAFO are ~ 6 - 10
miles u/s
Bean-Tiffin J Lime Creek Munson Hwy -84.32960 41.76240 1 upper part of watershed that has CAFOs
Bean-Tiffin K Silver Creek (Bean Cr watershed) E Main St -84.20520 41.71810 2medium/small trib near MI-OH border;
CAFO in watershed
Bean-Tiffin L St Joseph Creek (Bean Cr watershed) Beecher Rd -84.36020 41.88360 2upper part of watershed with signficant
drainage area; has a CAFO
Bean-Tiffin M Fitts Creek Beecher Rd -84.35090 41.88370 2upper part of watershed with signficant
drainage area
Bean-Tiffin N Lime Lake Inlet Lime Lake Rd -84.37680 41.78950 2 d/s of some CAFOs; upper watershed
Bean-Tiffin O Bean Creek Dillon Hwy -84.31330 41.83070 2d/s of a large stretch of the creek that is
listed as needing a TMDL for E. coli
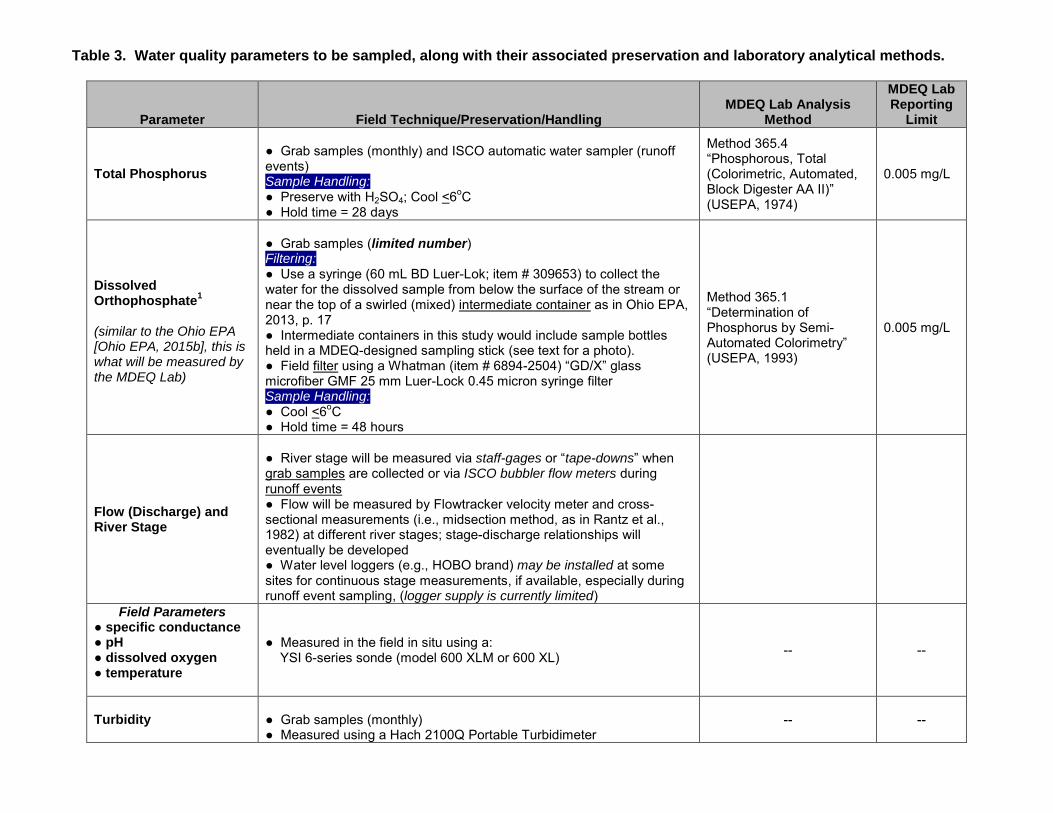
Table 3. Water quality parameters to be sampled, along with their associated preservation and laboratory analytical methods.
Parameter Field Technique/Preservation/Handling MDEQ Lab Analysis
Method
MDEQ Lab Reporting
Limit
Total Phosphorus
● Grab samples (monthly) and ISCO automatic water sampler (runoff events) Sample Handling: ● Preserve with H2SO4; Cool <6
oC
● Hold time = 28 days
Method 365.4 “Phosphorous, Total (Colorimetric, Automated, Block Digester AA II)” (USEPA, 1974)
0.005 mg/L
Dissolved Orthophosphate
1
(similar to the Ohio EPA [Ohio EPA, 2015b], this is what will be measured by the MDEQ Lab)
● Grab samples (limited number) Filtering:
● Use a syringe (60 mL BD Luer-Lok; item # 309653) to collect the water for the dissolved sample from below the surface of the stream or near the top of a swirled (mixed) intermediate container as in Ohio EPA, 2013, p. 17 ● Intermediate containers in this study would include sample bottles held in a MDEQ-designed sampling stick (see text for a photo). ● Field filter using a Whatman (item # 6894-2504) “GD/X” glass microfiber GMF 25 mm Luer-Lock 0.45 micron syringe filter Sample Handling: ● Cool <6
oC
● Hold time = 48 hours
Method 365.1 “Determination of Phosphorus by Semi-Automated Colorimetry” (USEPA, 1993)
0.005 mg/L
Flow (Discharge) and River Stage
● River stage will be measured via staff-gages or “tape-downs” when grab samples are collected or via ISCO bubbler flow meters during runoff events ● Flow will be measured by Flowtracker velocity meter and cross-sectional measurements (i.e., midsection method, as in Rantz et al., 1982) at different river stages; stage-discharge relationships will eventually be developed ● Water level loggers (e.g., HOBO brand) may be installed at some sites for continuous stage measurements, if available, especially during runoff event sampling, (logger supply is currently limited)
Field Parameters ● specific conductance ● pH ● dissolved oxygen ● temperature
● Measured in the field in situ using a: YSI 6-series sonde (model 600 XLM or 600 XL)
-- --
Turbidity ● Grab samples (monthly) ● Measured using a Hach 2100Q Portable Turbidimeter
-- --
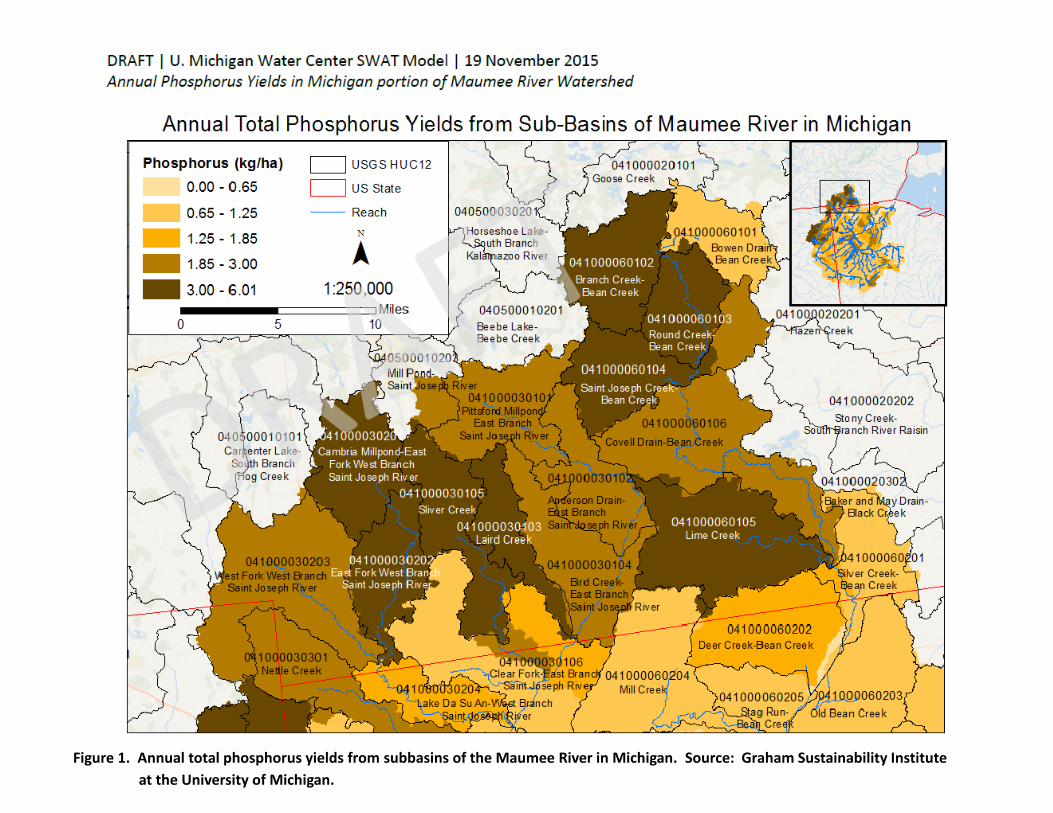
Figure 1. Annual total phosphorus yields from subbasins of the Maumee River in Michigan. Source: Graham Sustainability Institute
at the University of Michigan.
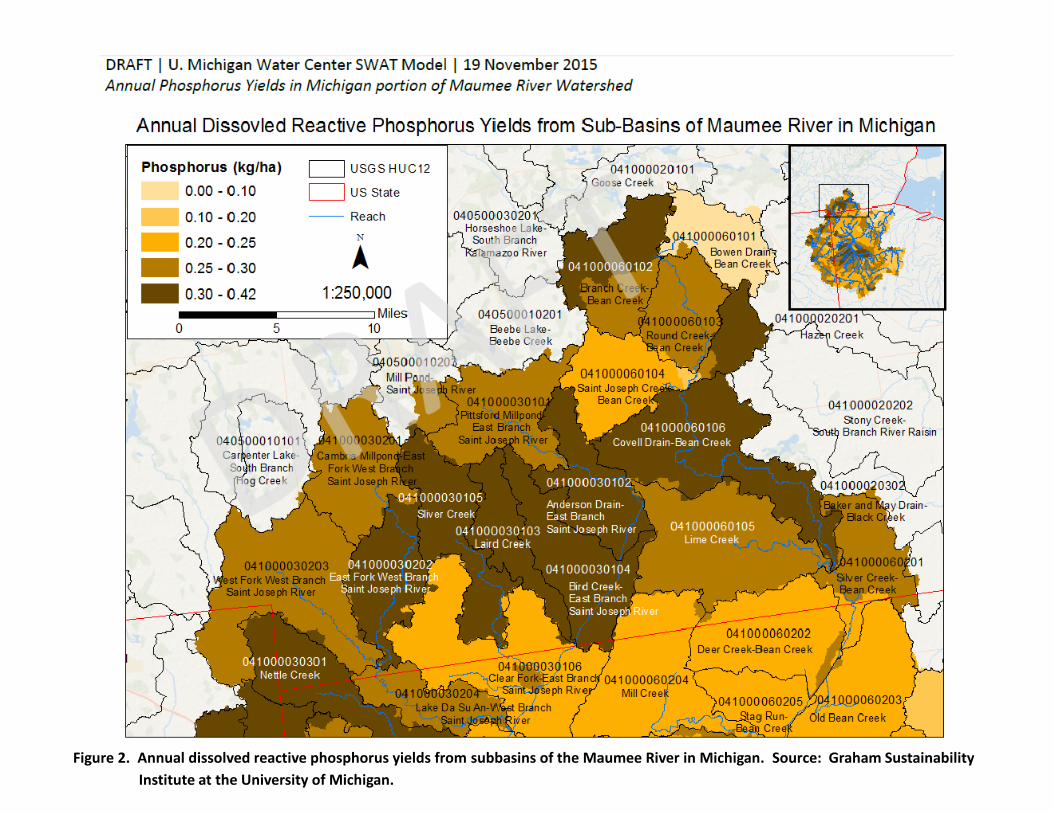
Figure 2. Annual dissolved reactive phosphorus yields from subbasins of the Maumee River in Michigan. Source: Graham Sustainability
Institute at the University of Michigan.


![Great Lakes. The Five Great Lakes Lake Michigan [ touches Michigan] Lake Michigan [ touches Michigan] Lake Erie [touches Michigan] Lake Erie [touches](https://img.pdfslide.net/doc/110x75/56649dca5503460f94ac1371/great-lakes-the-five-great-lakes-lake-michigan-touches-michigan-lake-michigan.jpg)