Embed Size (px)
Citation preview

Marriage and WagesFinal Paper Presentation
Online Micro-econometrics: Fall 2015
Xuefeng Xing ([email protected])Assel Dykanbayeva ([email protected])

The Effect of Marriage on Earnings of men• It is well-known fact in the labor economics that married men on
average earn more than unmarried men. • The difference between wages of men, which can be related to the
marital status, is called the marital (marriage) premium. • Most studies find that the marriage premium is between ten and forty
percent.• Although the existence of the marital premium is almost universally
accepted, there is much less agreement on its’ source.

What is the source of the Marital Premium?• The productivity approach explains that the marital premium exists
because the marriage makes men more productive.• The selection approach states that the marital premium is paid
because married men have some unobservable characteristics, which made them more attractive both for marriage and labor market.• The specialization approach implies that due to the marriage men
have opportunity to concentrate their efforts on career and devote less time to housework. This results in more earnings of married men.

Purpose of the study• The main purpose of our study is to analyze the effect of the marital status
of men on their earnings in government and private sector. • We consider that there can be a significant difference in the effect of marital
status on earnings in the private versus governmental sector.• This hypothesis is based on the assumption that civil service requires special
characteristics of an employee and a higher appreciation of traditional family values. • To some extent the hypothesis supports the selection approach in explaining
marital premium for men (existence of unobservable characteristics of men, which made them more attractive both for employee and for marriage).

Data and Empirical Specifications
• We utilized 2011 data from the Current Population Survey (CPS). • The dataset includes working men in the age range between 17 and 66,
excluding those who are either unemployed or employed in the military.
Married68%
Divorced/Widowed
9%
Not Married
23%
Married Divorced/WidowedNot Married
We also exclude from the dataset men whose information on wage was missing or with wages less than the minimal wage.There are 40,509 men in the sample.

Mean Wages of Men of different age groups, $
18-24 25-34 35-44 45-54 55-65 Total0
1000020000300004000050000600007000080000
1.Married 2.Divorced/Widowed 3.Not Married
We observe significantly higher wages of married men – on average, it is 62% or $25,970 higher than the average wage of single men.

Mean Wages of Men occupied in different industries, $
Agricultu
re & mining
Constructi
on
Manufacturin
gTrade
Transp
ortation
Informati
on
Finance
Professional se
rvices
Servi
ce0
20000
40000
60000
80000
100000
Married Divorced/Widowed Not Married

Mean Wages of Men by Races and Marital Status, $
White Black Hispanic Others0
1000020000300004000050000600007000080000
Married Divorced/Widowed Unmarried

The Model for estimating marital premium
• In the analysis of the relationship between marital status and wages the dependent variable is wages (P_EARN_VAL). Independent variables are an education, an experience and its square (EXSQ), dummies for marital status, dummy on type of occupation (1 – government, 0 – private), dummies for industry (variables AGRICULTURE, CONSTRUCTION, MANUFACTURING, TRANSPORTATION, INFORMATION, FINANCE, PROFESSIONAL SERVICES AND SERVICE), dummies on race. • The base group is white single men, working in a private company in
the trade industry.

Results• The coefficient of interest on the dummy Married is equal 0.206 with
SE 0.008 and p-value 26.56. • It implies that holding other variables constant, the predicted wage of
married men is 20.6% higher than never-married men.• The F-test value are high (1059.8), which means that coefficients in
the model are jointly statistically significant.• R-squared is 0.3079• The estimates of other variables have the expected signs, and all of
the estimates are statistically significant at the 1% level.
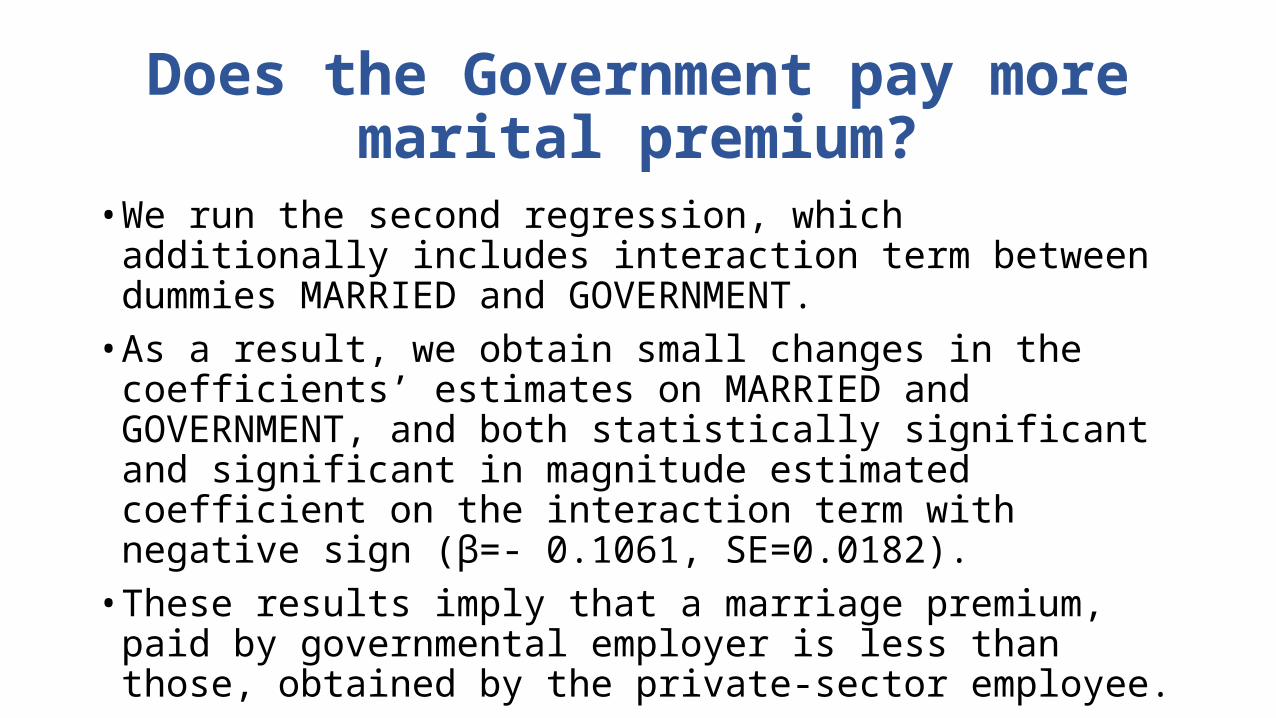
Does the Government pay more marital premium?
• We run the second regression, which additionally includes interaction term between dummies MARRIED and GOVERNMENT. • As a result, we obtain small changes in the coefficients’ estimates on
MARRIED and GOVERNMENT, and both statistically significant and significant in magnitude estimated coefficient on the interaction term with negative sign (β=- 0.1061, SE=0.0182). • These results imply that a marriage premium, paid by governmental
employer is less than those, obtained by the private-sector employee.

Conclusion• In our research, based on the CPS 2011 data, we discovered a marital
premium for men 20.6%. The hypothesis of bigger marital premium for men from governmental employers is rejected at 1% confidence level. • More than likely that the male marital wage premium is a result of
multiple factors. We suppose that a considerable part of the marriage premium stems from ability bias. Men who marry are just more conscientious, ambitious, and cooperative, and the CPS data lacks good measures of these traits.

Variables Model 1 Std. Err. Model 2 Std. Err.education 0.101 0.001 0.101 0.001experience 0.037 0.001 0.037 0.001experience squared -0.001 0.000 -0.001 0.000married 0.206 0.008 0.219 0.008divorced 0.048 0.012 0.045 0.012government 0.021 0.009 0.097 0.016agriculture 0.152 0.017 0.151 0.017construction 0.035 0.011 0.034 0.011manufacturing 0.124 0.011 0.123 0.011transportation 0.102 0.013 0.102 0.013information 0.219 0.019 0.219 0.019finance 0.253 0.014 0.252 0.014professional_services 0.076 0.010 0.076 0.010service -0.022 0.011 -0.021 0.011black -0.200 0.011 -0.201 0.011hispanic -0.131 0.008 -0.131 0.008others -0.095 0.010 -0.096 0.010gov_mar - - -0.106 0.018_cons 8.730 0.021 8.724 0.021
Appendix. Estimated coefficients