Embed Size (px)
Citation preview
Micro Focus Overview
Micro Focus
$1.4bn
Offices Worldwide
20,000+Customers
Annual Revenue
5,000+Partners
80+4,500+Employees2
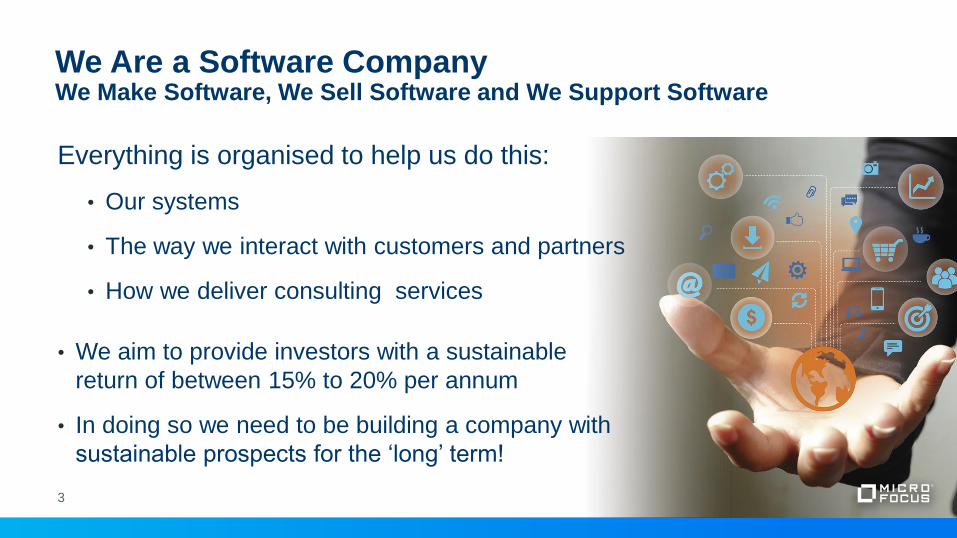
Everything is organised to help us do this:
• Our systems
• The way we interact with customers and partners
• How we deliver consulting services
• We aim to provide investors with a sustainable
return of between 15% to 20% per annum
• In doing so we need to be building a company with
sustainable prospects for the ‘long’ term!
We Are a Software CompanyWe Make Software, We Sell Software and We Support Software
3
Micro Focus helps its customers
to innovate faster with lower risk
We enable them to embrace new
technology while building on what
already works. We call this
bridging the old and the new
4
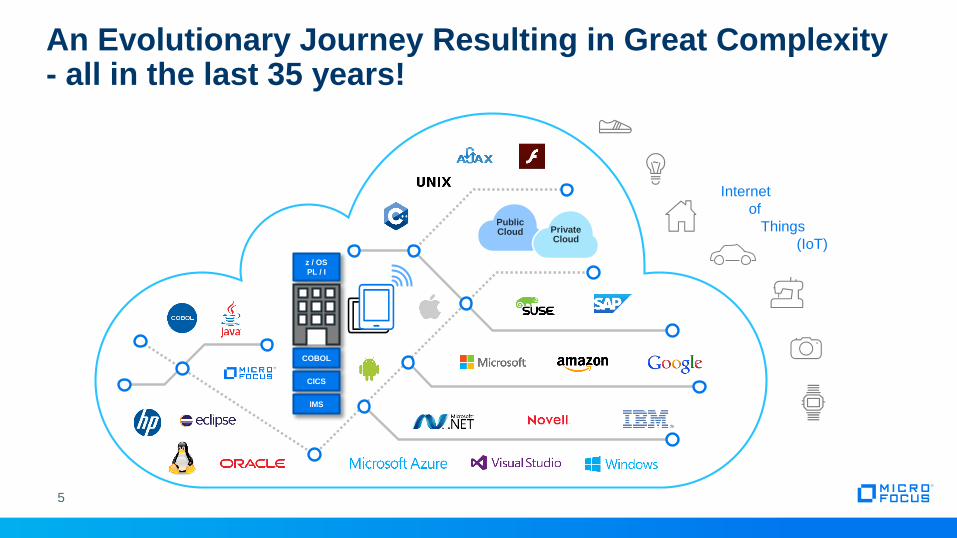
An Evolutionary Journey Resulting in Great Complexity- all in the last 35 years!
Internet
of
Things
(IoT)z / OS
PL / I
COBOL
CICS
IMS
Public Cloud Private
Cloud
5
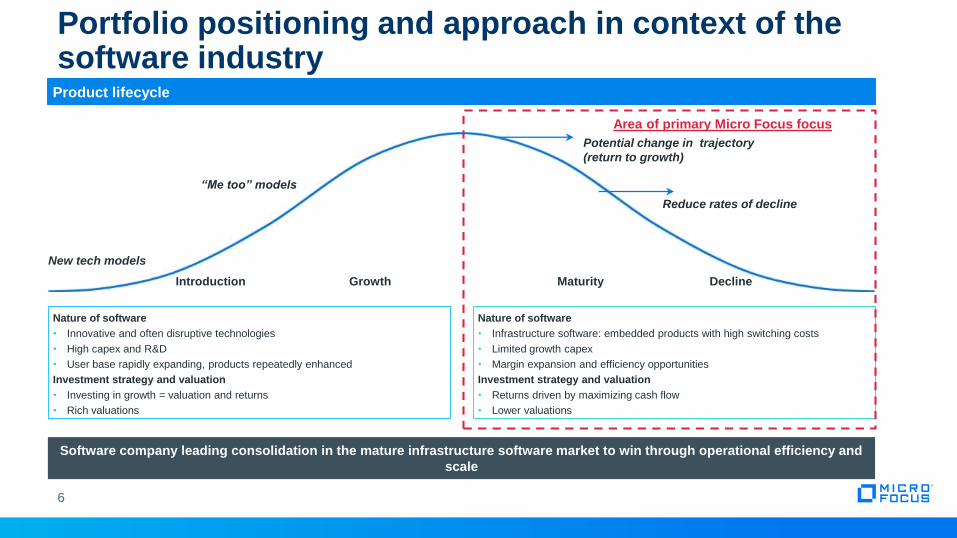
Portfolio positioning and approach in context of the software industry
Software company leading consolidation in the mature infrastructure software market to win through operational efficiency and
scale
Product lifecycle
Introduction Growth Maturity Decline
Area of primary Micro Focus focus
New tech models
“Me too” models
Potential change in trajectory
(return to growth)
Reduce rates of decline
Nature of software
• Innovative and often disruptive technologies
• High capex and R&D
• User base rapidly expanding, products repeatedly enhanced
Investment strategy and valuation
• Investing in growth = valuation and returns
• Rich valuations
Nature of software
• Infrastructure software: embedded products with high switching costs
• Limited growth capex
• Margin expansion and efficiency opportunities
Investment strategy and valuation
• Returns driven by maximizing cash flow
• Lower valuations
6
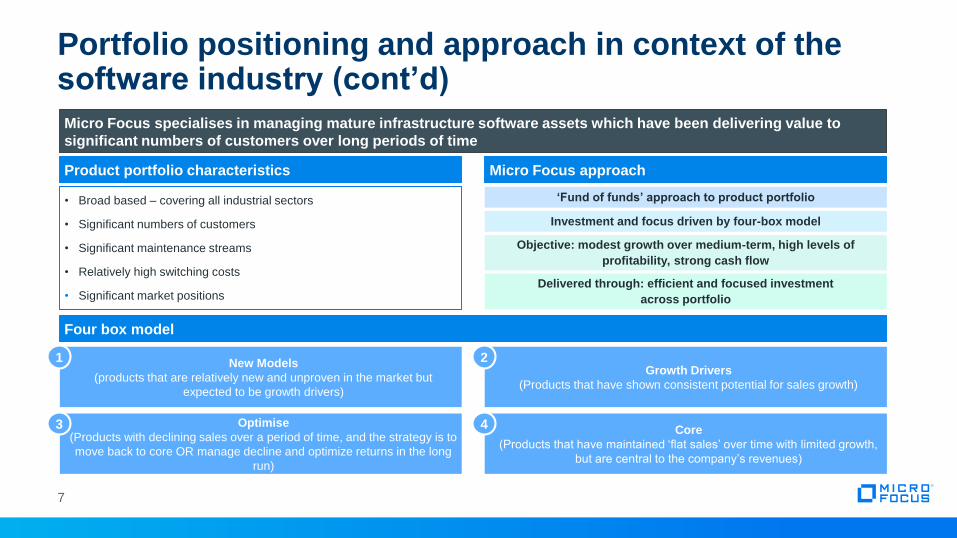
Portfolio positioning and approach in context of the software industry (cont’d)
Micro Focus specialises in managing mature infrastructure software assets which have been delivering value to
significant numbers of customers over long periods of time
Product portfolio characteristics Micro Focus approach
• Broad based – covering all industrial sectors
• Significant numbers of customers
• Significant maintenance streams
• Relatively high switching costs
• Significant market positions
‘Fund of funds’ approach to product portfolio
Investment and focus driven by four-box model
Objective: modest growth over medium-term, high levels of
profitability, strong cash flow
Delivered through: efficient and focused investment
across portfolio
Four box model
New Models
(products that are relatively new and unproven in the market but
expected to be growth drivers)
1
Optimise
(Products with declining sales over a period of time, and the strategy is to
move back to core OR manage decline and optimize returns in the long
run)
3
Growth Drivers
(Products that have shown consistent potential for sales growth)
2
Core
(Products that have maintained ‘flat sales’ over time with limited growth,
but are central to the company’s revenues)
4
7
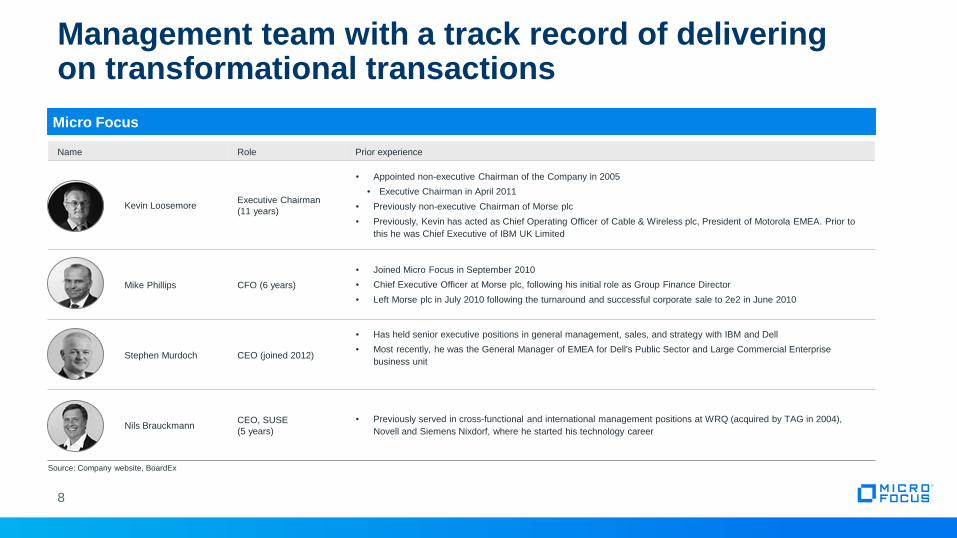
Name Role Prior experience
Kevin LoosemoreExecutive Chairman
(11 years)
Appointed non-executive Chairman of the Company in 2005
Executive Chairman in April 2011
Previously non-executive Chairman of Morse plc
Previously, Kevin has acted as Chief Operating Officer of Cable & Wireless plc, President of Motorola EMEA. Prior to
this he was Chief Executive of IBM UK Limited
Mike Phillips CFO (6 years)
Joined Micro Focus in September 2010
Chief Executive Officer at Morse plc, following his initial role as Group Finance Director
Left Morse plc in July 2010 following the turnaround and successful corporate sale to 2e2 in June 2010
Stephen Murdoch CEO (joined 2012)
Has held senior executive positions in general management, sales, and strategy with IBM and Dell
Most recently, he was the General Manager of EMEA for Dell's Public Sector and Large Commercial Enterprise
business unit
Nils BrauckmannCEO, SUSE
(5 years)
Previously served in cross-functional and international management positions at WRQ (acquired by TAG in 2004),
Novell and Siemens Nixdorf, where he started his technology career
Management team with a track record of delivering on transformational transactions
Micro Focus
Source: Company website, BoardEx
8

Non-executive Directors
Karen Slatford
Senior Non Executive Director
HP 20 years – VP & GM WW Sales
& Mktg, Independent Director on
multiple tech Boards
Tom Virden
Non Executive Director
Marketing in Apple and
Lastminute.com, has led
multiple start ups
Richard Atkins
Non Executive Director
IBM Global Services EMEA,
Operating Partner at Advent
Private equity
Steve Shuckenbrock
Non Executive Director
Joint COO at EDS; CIO at Dell,
Currently CEO of
CROSSMARK
Amanda Brown
Non Executive Director
HR Mars, Marriott and
PepsiCo, Currently HR
Director at Hiscox
9
• Senior Independent Director has formal responsibilities detailed in Annual Report including, among others
• Succession planning
• Annual review of Board effectiveness
• Unlimited access for shareholders to non-executive directors
• Key committees are all composed 100% of Non executive directors:
• Audit / FIC / Risk Committee
• Remuneration Committee
• Nomination Committee
• All directors stand for re-election on annual basis

Product Portfolio
Identity, Access and
Security Solutions
16%
Host Connectivity
Solutions
14%
Linux and Open Source
18%
Development
and IT Operations
Management
Tools
13%
Collaboration
and Networking
Solutions
11%
COBOL Development
and Mainframe
Solutions
18%
Development
and IT Operations
Management
Tools
23%
10
COBOLEnterpriseIdentity
ManagerSentinel
Rumba
MSS
Reflection
Silk
AccuRev
PlateSpinOES GroupWise
CORBA
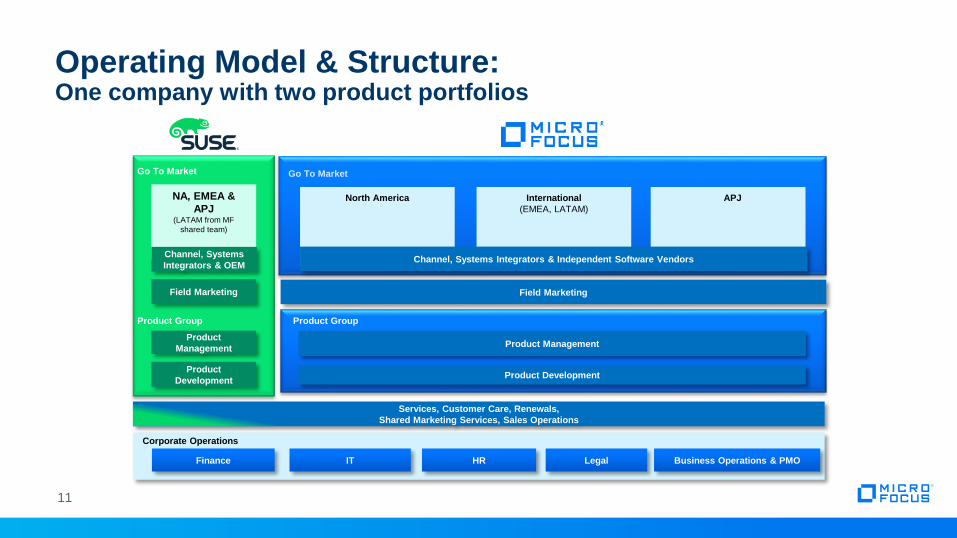
North America International
(EMEA, LATAM)
APJ
Corporate Operations
Finance IT HR
Product Development
Legal Business Operations & PMO
Field Marketing
Product Management
Go To Market
Product
Development
NA, EMEA &
APJ(LATAM from MF
shared team)
Product
Management
Field Marketing
Services, Customer Care, Renewals,
Shared Marketing Services, Sales Operations
Channel, Systems
Integrators & OEM Channel, Systems Integrators & Independent Software Vendors
Product Group
Operating Model & Structure: One company with two product portfolios
Go To Market
Product Group
11
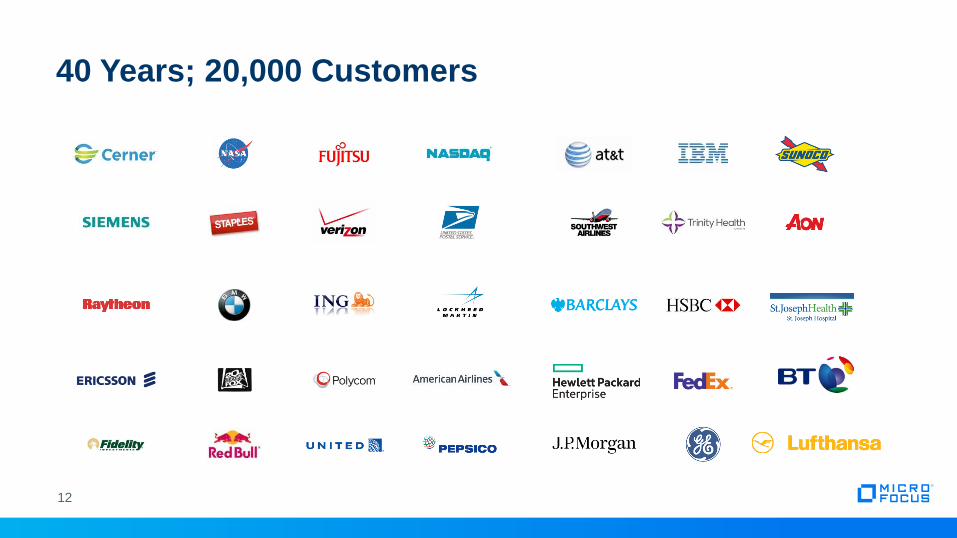
40 Years; 20,000 Customers
12

Value Creation
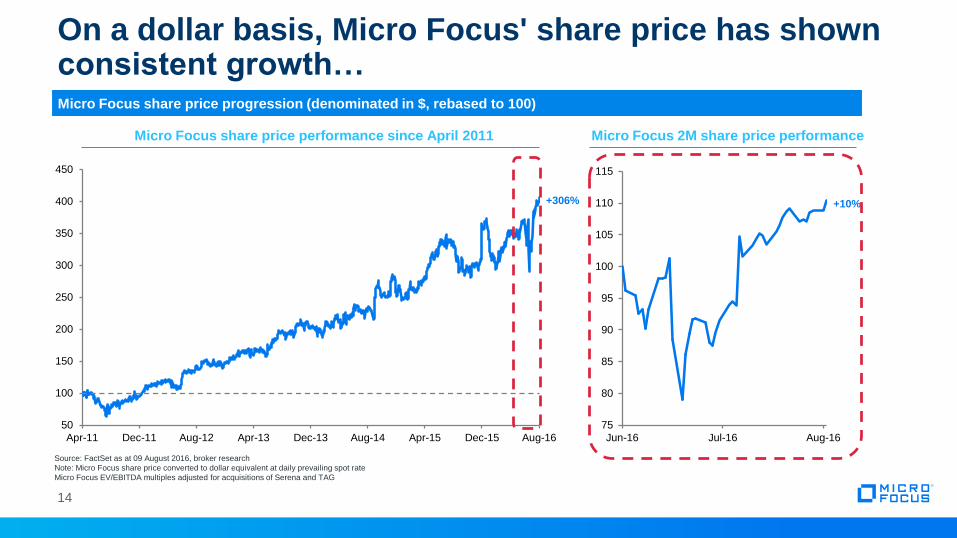
On a dollar basis, Micro Focus' share price has shown consistent growth…
50
100
150
200
250
300
350
400
450
Apr-11 Dec-11 Aug-12 Apr-13 Dec-13 Aug-14 Apr-15 Dec-15 Aug-16
Micro Focus share price progression (denominated in $, rebased to 100)
+306%
Source: FactSet as at 09 August 2016, broker research
Note: Micro Focus share price converted to dollar equivalent at daily prevailing spot rate
Micro Focus EV/EBITDA multiples adjusted for acquisitions of Serena and TAG
75
80
85
90
95
100
105
110
115
Jun-16 Jul-16 Aug-16
+10%
Micro Focus share price performance since April 2011 Micro Focus 2M share price performance
14
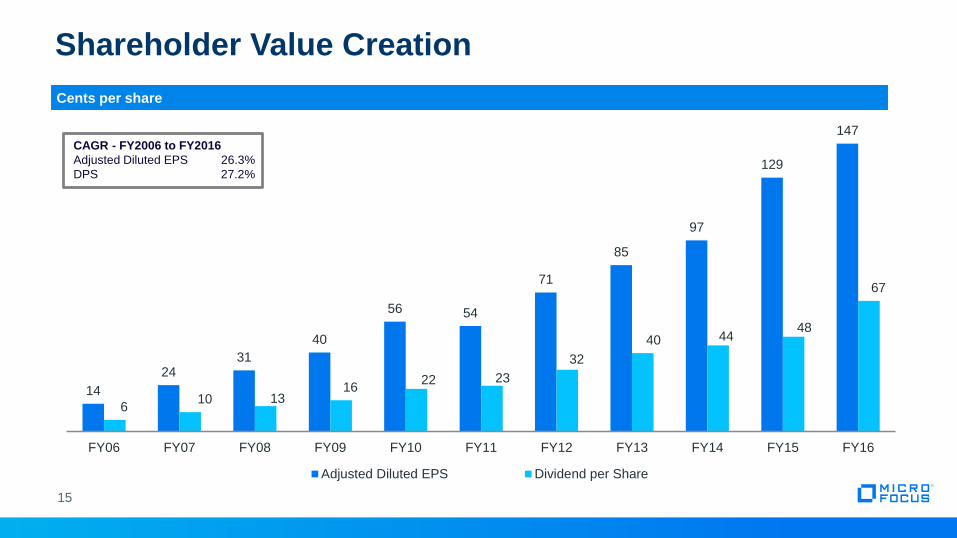
Shareholder Value Creation
14
2431
40
56 54
71
85
97
129
147
610 13
1622 23
32
40 4448
67
FY06 FY07 FY08 FY09 FY10 FY11 FY12 FY13 FY14 FY15 FY16
Adjusted Diluted EPS Dividend per Share
CAGR - FY2006 to FY2016
Adjusted Diluted EPS 26.3%
DPS 27.2%
Cents per share
15
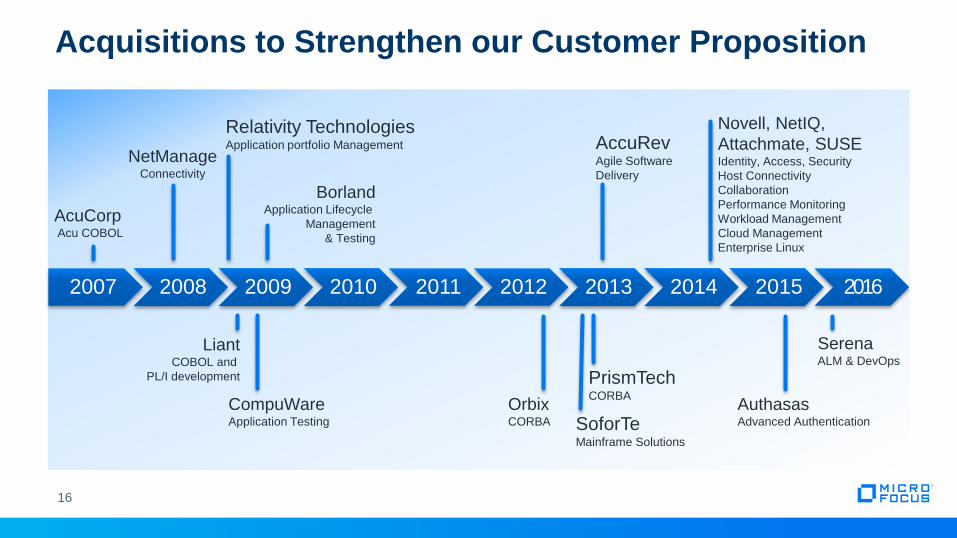
2007 2008 2009 2010 2011 2012 2013 2014 2015 2016
CompuWareApplication Testing
LiantCOBOL and
PL/I development
OrbixCORBA
Novell, NetIQ,
Attachmate, SUSEIdentity, Access, Security
Host Connectivity
Collaboration
Performance Monitoring
Workload Management
Cloud Management
Enterprise Linux
BorlandApplication Lifecycle
Management
& Testing
Acquisitions to Strengthen our Customer Proposition
AuthasasAdvanced Authentication
SerenaALM & DevOps
NetManageConnectivity
AcuCorpAcu COBOL
Relativity TechnologiesApplication portfolio Management AccuRev
Agile Software
Delivery
PrismTechCORBA
SoforTeMainframe Solutions
16

Note: Does not include acquisitions smaller than $10M: Authasas (’15), Openfusion (’13), Soforte (’13), Relativity (’09) and Liant (’08).
*Values for Borland, NetManage, Acucorp and Accurev are operating profit, not EBITDA. **Orbix acquisition value includes other assets acquired from Progress Software.
Source: Micro Focus and other companies annual reports, Internal Micro Focus data; Bain Analysis.
ACQUISITION PORTFOLIO GROUPS / MAIN PRODUCTS YEAR ACQUISITION VALUE ($M) EBITDA ($M)
1
2
4
Micro Focus made eight major acquisitions in last 10 years
17
SerenaDev & ITOM: Mainframe and distributed ALM and
BPM2016 540 80
Attachmate (TAG)Collab. & Networking (Novell), Host Connectivity
(Attachmate), IAS (NetIQ) and SUSE2014 2,350 313
Accurev Dev & ITOM: Accurev 2013 19 (2)*
Orbix assets from
Progress SWCollab. & Networking: CORBA 2012 15** 8
Borland Dev & ITOM: Borland / Silk Suite 2009 87 (11)*
CompuwareDev & ITOM: Application Testing and Automated
Software Quality2009 63 19
NetManage Host Connectivity: RUMBA 2008 46 (2)*
Acucorp CDMS: AcuCobol 2007 40 4*
3
5
6
7
8
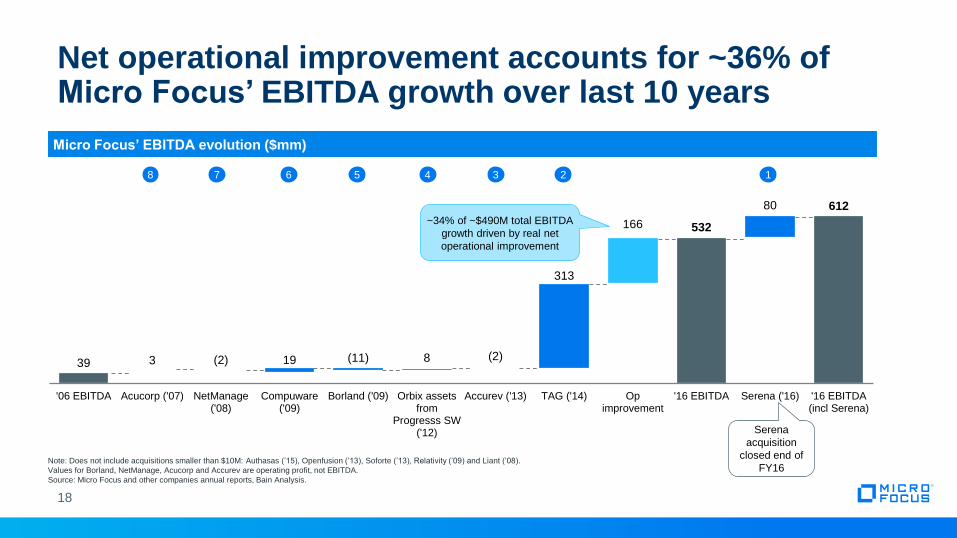
Net operational improvement accounts for ~36% of Micro Focus’ EBITDA growth over last 10 years
18
Micro Focus’ EBITDA evolution ($mm)
Note: Does not include acquisitions smaller than $10M: Authasas (’15), Openfusion (’13), Soforte (’13), Relativity (’09) and Liant (’08).
Values for Borland, NetManage, Acucorp and Accurev are operating profit, not EBITDA.
Source: Micro Focus and other companies annual reports, Bain Analysis.
39 3 (2) 19 (11) 8 (2)
313
166 532
80 612
'06 EBITDA Acucorp ('07) NetManage('08)
Compuware('09)
Borland ('09) Orbix assetsfrom
Progresss SW('12)
Accurev ('13) TAG ('14) Opimprovement
'16 EBITDA Serena ('16) '16 EBITDA(incl Serena)
~34% of ~$490M total EBITDA
growth driven by real net
operational improvement
Serena
acquisition
closed end of
FY16
124 35678
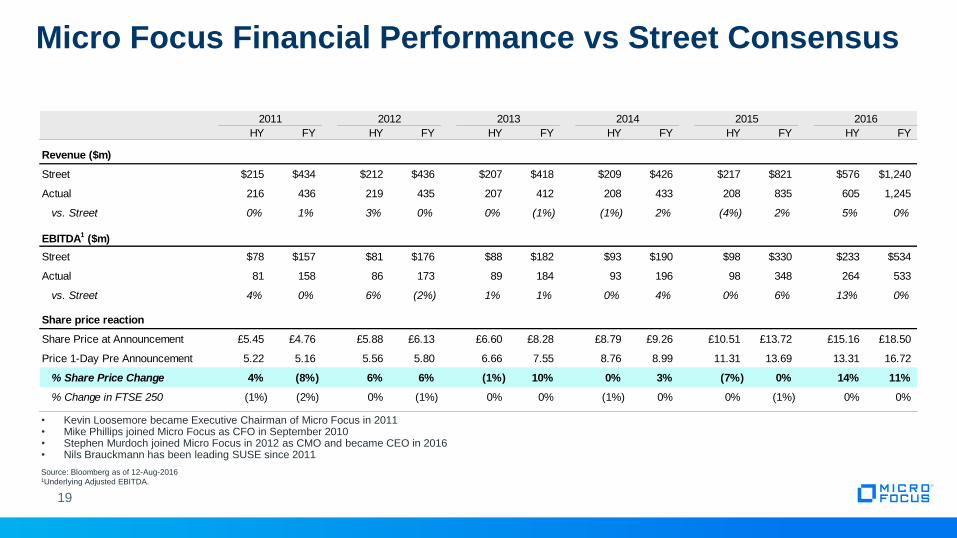
Micro Focus Financial Performance vs Street Consensus
Source: Bloomberg as of 12-Aug-20161Underlying Adjusted EBITDA.
2011 2012 2013 2014 2015 2016
HY FY HY FY HY FY HY FY HY FY HY FY
Revenue ($m)
Street $215 $434 $212 $436 $207 $418 $209 $426 $217 $821 $576 $1,240
Actual 216 436 219 435 207 412 208 433 208 835 605 1,245
vs. Street 0% 1% 3% 0% 0% (1%) (1%) 2% (4%) 2% 5% 0%
EBITDA1 ($m)
Street $78 $157 $81 $176 $88 $182 $93 $190 $98 $330 $233 $534
Actual 81 158 86 173 89 184 93 196 98 348 264 533
vs. Street 4% 0% 6% (2%) 1% 1% 0% 4% 0% 6% 13% 0%
Share price reaction
Share Price at Announcement £5.45 £4.76 £5.88 £6.13 £6.60 £8.28 £8.79 £9.26 £10.51 £13.72 £15.16 £18.50
Price 1-Day Pre Announcement 5.22 5.16 5.56 5.80 6.66 7.55 8.76 8.99 11.31 13.69 13.31 16.72
% Share Price Change 4% (8%) 6% 6% (1%) 10% 0% 3% (7%) 0% 14% 11%
% Change in FTSE 250 (1%) (2%) 0% (1%) 0% 0% (1%) 0% 0% (1%) 0% 0%
• Kevin Loosemore became Executive Chairman of Micro Focus in 2011• Mike Phillips joined Micro Focus as CFO in September 2010• Stephen Murdoch joined Micro Focus in 2012 as CMO and became CEO in 2016• Nils Brauckmann has been leading SUSE since 2011
19
20
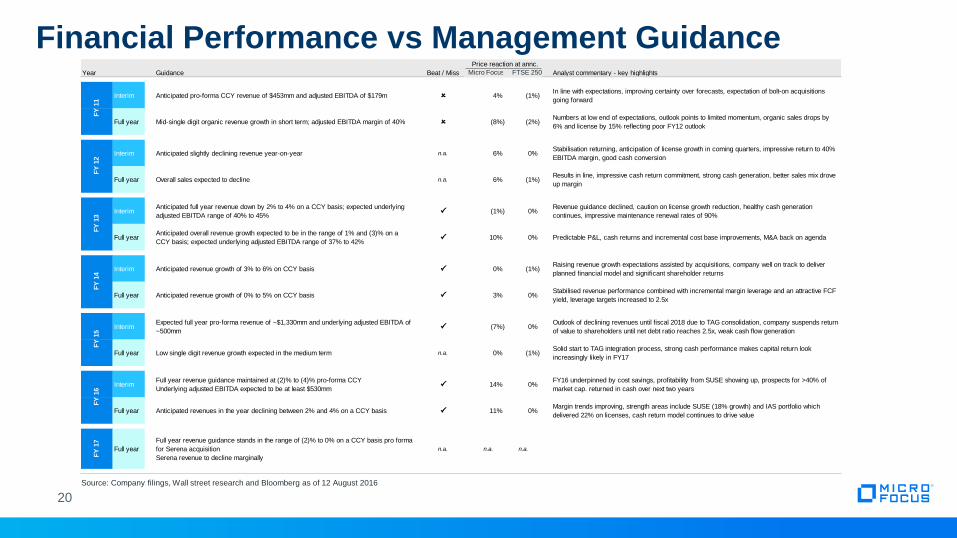
Financial Performance vs Management Guidance
Source: Company filings, Wall street research and Bloomberg as of 12 August 2016
Price reaction at annc.
Year Guidance Beat / Miss Miami FTSE 250 Analyst commentary - key highlights
Interim Anticipated pro-forma CCY revenue of $453mm and adjusted EBITDA of $179m O 4% (1%)In line with expectations, improving certainty over forecasts, expectation of bolt-on acquisitions
going forward
Full year Mid-single digit organic revenue growth in short term; adjusted EBITDA margin of 40% O (8%) (2%)Numbers at low end of expectations, outlook points to limited momentum, organic sales drops by
6% and license by 15% reflecting poor FY12 outlook
Interim Anticipated slightly declining revenue year-on-year n.a. 6% 0%Stabilisation returning, anticipation of license growth in coming quarters, impressive return to 40%
EBITDA margin, good cash conversion
Full year Overall sales expected to decline n.a. 6% (1%)Results in line, impressive cash return commitment, strong cash generation, better sales mix drove
up margin
InterimAnticipated full year revenue down by 2% to 4% on a CCY basis; expected underlying
adjusted EBITDA range of 40% to 45%P (1%) 0%
Revenue guidance declined, caution on license growth reduction, healthy cash generation
continues, impressive maintenance renewal rates of 90%
Full yearAnticipated overall revenue growth expected to be in the range of 1% and (3)% on a
CCY basis; expected underlying adjusted EBITDA range of 37% to 42%P 10% 0% Predictable P&L, cash returns and incremental cost base improvements, M&A back on agenda
Interim Anticipated revenue growth of 3% to 6% on CCY basis P 0% (1%)Raising revenue growth expectations assisted by acquisitions, company well on track to deliver
planned financial model and significant shareholder returns
Full year Anticipated revenue growth of 0% to 5% on CCY basis P 3% 0%Stabilised revenue performance combined with incremental margin leverage and an attractive FCF
yield, leverage targets increased to 2.5x
InterimExpected full year pro-forma revenue of ~$1,330mm and underlying adjusted EBITDA of
~500mmP (7%) 0%
Outlook of declining revenues until fiscal 2018 due to TAG consolidation, company suspends return
of value to shareholders until net debt ratio reaches 2.5x, weak cash flow generation
Full year Low single digit revenue growth expected in the medium term n.a. 0% (1%)Solid start to TAG integration process, strong cash performance makes capital return look
increasingly likely in FY17
InterimFull year revenue guidance maintained at (2)% to (4)% pro-forma CCY
Underlying adjusted EBITDA expected to be at least $530mmP 14% 0%
FY16 underpinned by cost savings, profitability from SUSE showing up, prospects for >40% of
market cap. returned in cash over next two years
Full year Anticipated revenues in the year declining between 2% and 4% on a CCY basis P 11% 0%Margin trends improving, strength areas include SUSE (18% growth) and IAS portfolio which
delivered 22% on licenses, cash return model continues to drive value
FY
17
Full year
Full year revenue guidance stands in the range of (2)% to 0% on a CCY basis pro forma
for Serena acquisition
Serena revenue to decline marginally
n.a. n.a. n.a.
FY
16
FY
11
FY
12
FY
13
FY
14
FY
15
Micro Focus FTSE 250

UK Market Dominated by Global Blue-chip Investor Base, many of which are Long-term Shareholders of Micro Focus
Source: Company register, J.P. Morgan Cazenove shareholder analysis, Junction RDS as at July 2016
Note: Average buy in price calculation based on register data since 2008, converted at USD / GBP spot rate of 1.2992Top 25 Register overlap between largest blue-chip shareholders in the UK and Micro
Focus register
21
Micro Focus shareholder register as at July 2016Top investors in the FTSE index
No. Manager Origin Investment Length of Value ($m) % 01-Jul-16 Av. Buy in % Return
investment price ($) on current price
1 Fidelity M&R US Growth >3 years $582 9.8% 17.00 52.9%
2 Old Mutual Global UK Value >3 years 383 6.4% 16.43 58.1%
3 M&G IM UK Growth >3 years 257 4.3% 6.71 287.0%
4 Legal & General IM UK Index >3 years 212 3.6% 12.53 107.4%
5 BlackRock IM UK Multiple >3 years 211 3.5% 13.63 90.7%
6 J.P. Morgan AM UK Growth >3 years 160 2.7% 11.66 122.8%
7 Schroder IM UK Growth >3 years 133 2.2% 6.76 284.4%
8 Artemis IM UK GARP >3 years 131 2.2% 8.44 207.7%
9 William Blair IM US Growth >3 years 126 2.1% 17.95 44.8%
10 Invesco Perpetual US Value n.a. 119 2.0% n.a. n.a.
11 Vanguard US Index >3 years 116 1.9% 15.75 65.0%
12 Woodford IM UK Income 1-3 years 107 1.8% 18.84 37.9%
13 Elliott Management US Hedge Fund n.a. 104 1.7% n.a. n.a.
14 Capital International US GARP 2 years 103 1.7% 18.89 37.5%
15 Burgundy AM CA Value 2 years 98 1.6% 18.87 37.7%
16 Norges Bank IM NO Index >3 years 95 1.6% 11.21 131.9%
17 AXA Framlington UK Growth >3 years 94 1.6% 18.03 44.1%
18 RBC GAM US Growth n.a. 91 1.5% n.a. n.a.
19 BNP Paribas Inv. Partners FR Growth n.a. 88 1.5% n.a. n.a.
20 BAE Pension Fund IM UK Growth >3 years 86 1.4% 17.51 48.4%
21 Aberdeen AM UK Value >3 years 84 1.4% 9.53 172.5%
22 Santander AM UK Growth >3 years 70 1.2% 17.12 51.8%
23 State Street Global Advisors UK Index >3 years 67 1.1% 13.96 86.1%
24 Rathbone IM UK Growth >3 years 65 1.1% 18.99 36.8%
25 Jupiter AM UK Growth >3 years 64 1.1% 12.75 103.8%
Average $146 2.4% $14.41 100.4%
No. Manager
1 BlackRock IM
2 Legal & General IM
3 Capital Research
4 Vanguard
5 BlackRock Advisors
6 Aberdeen AM
7 Norges Bank IM
8 Invesco AM
9 Standard Life
10 Schroder IM
11 M&G IM
12 State Street Global Advisors (US)
13 State Street Global Advisors (UK)
14 Columbia Threadneedle AM
15 MFS IM
16 Aviva Investors
17 Franklin Templeton
18 SAFE Investment
19 Fidelity International
20 Fidelity M&R
21 Baillie Gifford
22 J.P. Morgan AM
23 Royal London AM
24 UBS AM (UK)
25 Artemis IM
c.25% of Micro Focus register comprised of US blue-chip investors
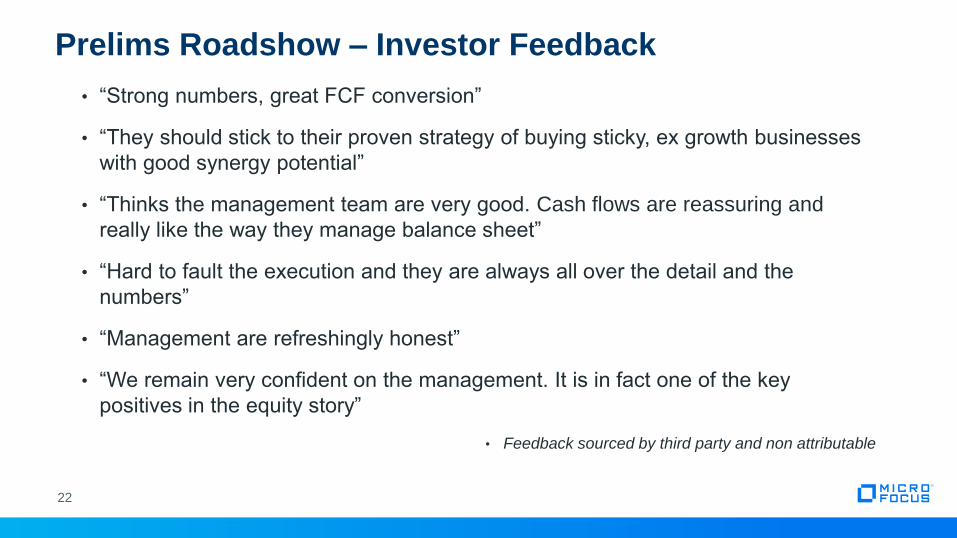
• “Strong numbers, great FCF conversion”
• “They should stick to their proven strategy of buying sticky, ex growth businesses
with good synergy potential”
• “Thinks the management team are very good. Cash flows are reassuring and
really like the way they manage balance sheet”
• “Hard to fault the execution and they are always all over the detail and the
numbers”
• “Management are refreshingly honest”
• “We remain very confident on the management. It is in fact one of the key
positives in the equity story”
• Feedback sourced by third party and non attributable
22
Prelims Roadshow – Investor Feedback
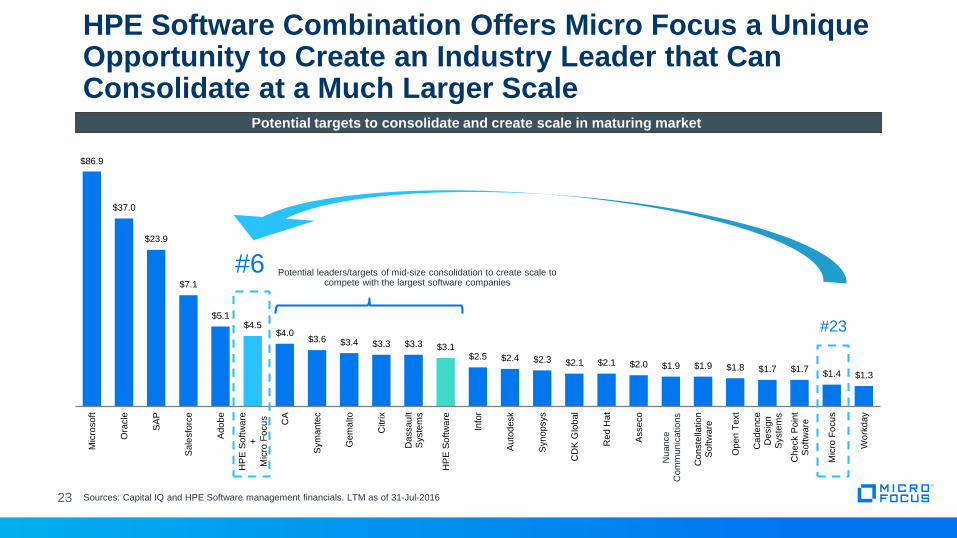
HPE Software Combination Offers Micro Focus a Unique Opportunity to Create an Industry Leader that Can Consolidate at a Much Larger Scale
Sources: Capital IQ and HPE Software management financials. LTM as of 31-Jul-2016
Potential targets to consolidate and create scale in maturing market
23
$86.9
$37.0
$23.9
$7.1
$5.1$4.5
$4.0$3.6 $3.4 $3.3 $3.3 $3.1
$2.5 $2.4 $2.3 $2.1 $2.1 $2.0 $1.9 $1.9 $1.8 $1.7 $1.7$1.4 $1.3
Mic
rosoft
Ora
cle
SA
P
Sale
sfo
rce
Ado
be
HP
E S
oftw
are
+M
icro
Fo
cu
s
CA
Sym
an
tec
Ge
ma
lto
Citri
x
Da
ssau
ltS
yste
ms
HP
E S
oftw
are
Info
r
Auto
desk
Syn
opsys
CD
K G
lob
al
Re
d H
at
Asse
co
Nu
an
ce
Co
mm
un
icatio
ns
Co
nste
llatio
nS
oft
ware
Op
en
Text
Ca
de
nce
De
sig
nS
yste
ms
Ch
eck P
oin
tS
oft
ware
Mic
ro F
ocu
s
Wo
rkd
ay
#6
#23
Potential leaders/targets of mid-size consolidation to create scale to compete with the largest software companies
Nuance
Com
munic
ations
Strategic Rationale for Combination
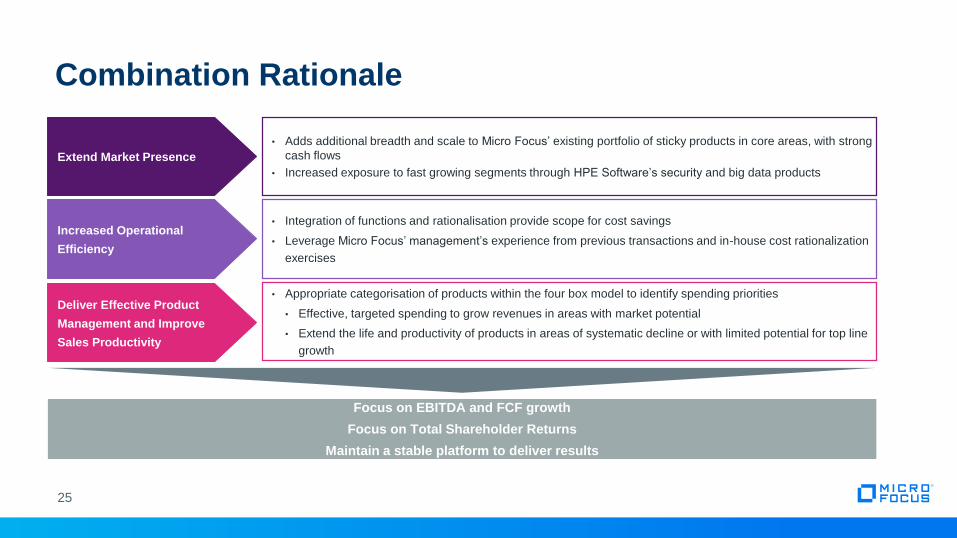
Combination Rationale
Focus on EBITDA and FCF growth
Focus on Total Shareholder Returns
Maintain a stable platform to deliver results
• Adds additional breadth and scale to Micro Focus’ existing portfolio of sticky products in core areas, with strong
cash flows
• Increased exposure to fast growing segments through HPE Software’s security and big data products
• Integration of functions and rationalisation provide scope for cost savings
• Leverage Micro Focus’ management’s experience from previous transactions and in-house cost rationalization
exercises
• Appropriate categorisation of products within the four box model to identify spending priorities
• Effective, targeted spending to grow revenues in areas with market potential
• Extend the life and productivity of products in areas of systematic decline or with limited potential for top line
growth
Extend Market Presence
Increased Operational
Efficiency
Deliver Effective Product
Management and Improve
Sales Productivity
25
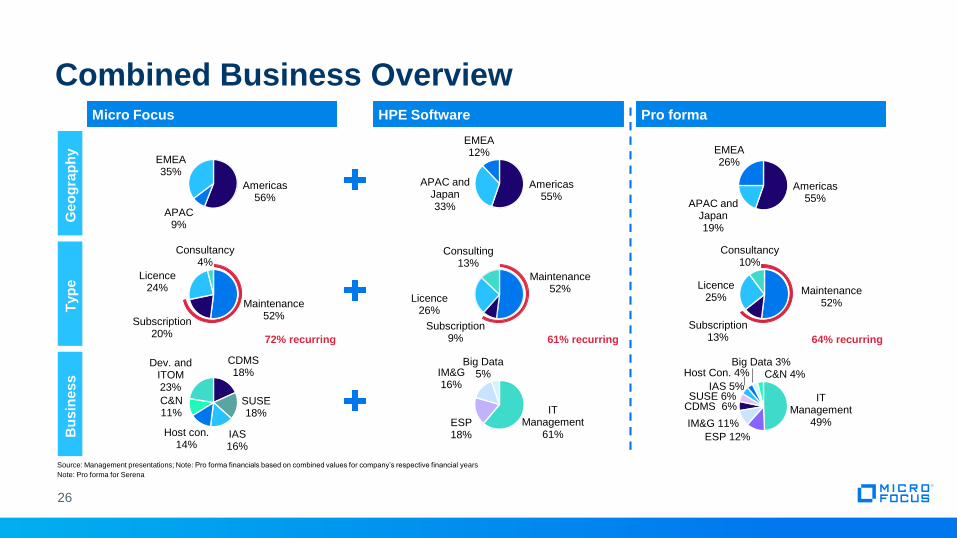
Combined Business OverviewMicro Focus HPE Software Pro forma
Geo
gra
ph
yT
yp
eB
usin
ess
`
72% recurring 61% recurring 64% recurring
Americas55%
APAC and Japan33%
EMEA12%
Maintenance52%
Subscription9%
Licence26%
Consulting13%
IT Management
61%ESP18%
IM&G16%
Big Data5%
Maintenance52%
Subscription20%
Licence24%
Consultancy4%
Americas56%
APAC9%
EMEA35%
IT Management
49%
ESP 12%
IM&G 11%
CDMS 6%SUSE 6%
IAS 5%
Host Con. 4%Big Data 3%
C&N 4%
Maintenance52%
Subscription13%
Licence25%
Consultancy10%
Americas55%
APAC and Japan19%
EMEA26%
CDMS18%
SUSE18%
IAS16%
Host con.14%
C&N11%
Dev. and ITOM23%
Source: Management presentations; Note: Pro forma financials based on combined values for company’s respective financial years
Note: Pro forma for Serena
26
Integration Planning
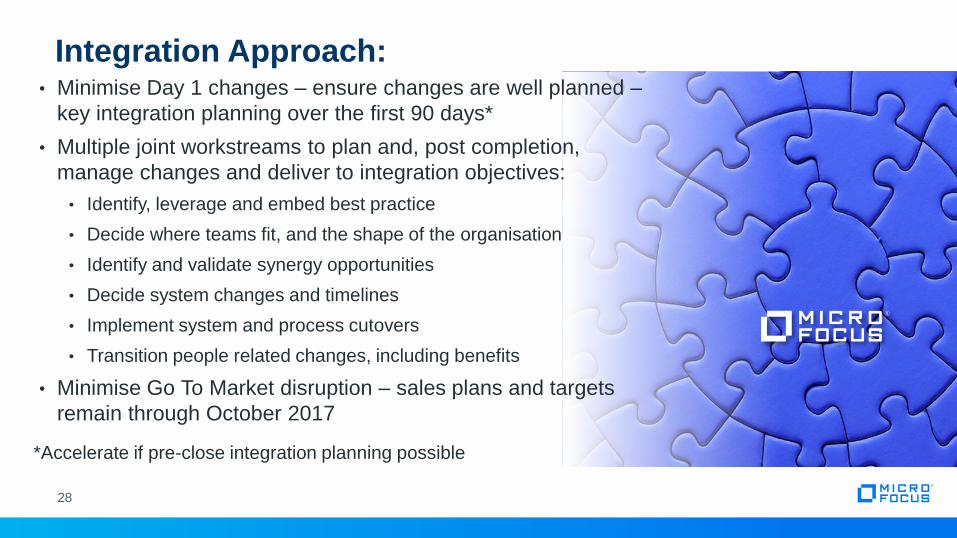
• Minimise Day 1 changes – ensure changes are well planned –
key integration planning over the first 90 days*
• Multiple joint workstreams to plan and, post completion,
manage changes and deliver to integration objectives:
• Identify, leverage and embed best practice
• Decide where teams fit, and the shape of the organisation
• Identify and validate synergy opportunities
• Decide system changes and timelines
• Implement system and process cutovers
• Transition people related changes, including benefits
• Minimise Go To Market disruption – sales plans and targets
remain through October 2017
Integration Approach:
*Accelerate if pre-close integration planning possible
28
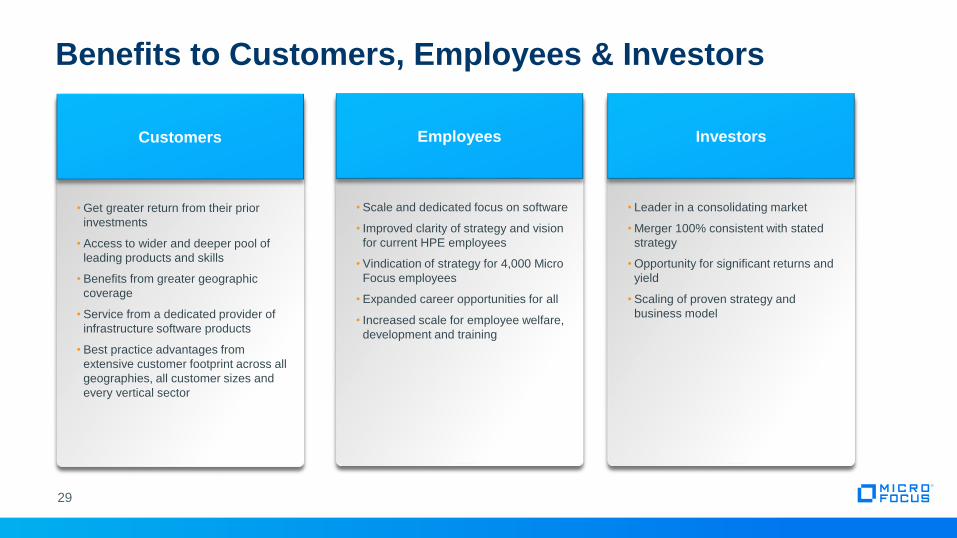
Benefits to Customers, Employees & Investors
Customers
• Get greater return from their prior
investments
• Access to wider and deeper pool of
leading products and skills
• Benefits from greater geographic
coverage
• Service from a dedicated provider of
infrastructure software products
• Best practice advantages from
extensive customer footprint across all
geographies, all customer sizes and
every vertical sector
Employees
• Scale and dedicated focus on software
• Improved clarity of strategy and vision
for current HPE employees
• Vindication of strategy for 4,000 Micro
Focus employees
• Expanded career opportunities for all
• Increased scale for employee welfare,
development and training
Investors
• Leader in a consolidating market
• Merger 100% consistent with stated
strategy
• Opportunity for significant returns and
yield
• Scaling of proven strategy and
business model
29
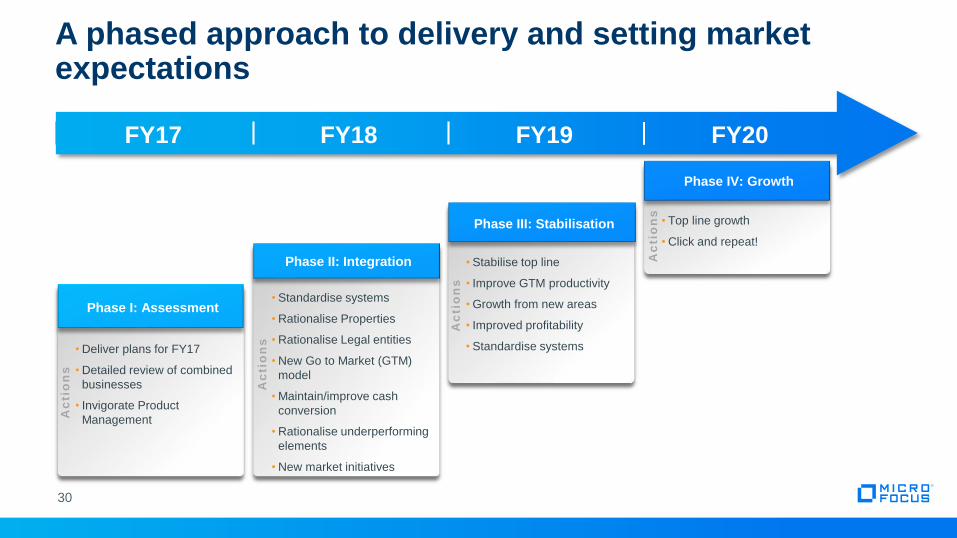
A phased approach to delivery and setting market expectations
Phase I: Assessment
• Deliver plans for FY17
• Detailed review of combined
businesses
• Invigorate Product
ManagementAc
tio
ns
Phase II: IntegrationA
cti
on
s
• Standardise systems
• Rationalise Properties
• Rationalise Legal entities
• New Go to Market (GTM)
model
• Maintain/improve cash
conversion
• Rationalise underperforming
elements
• New market initiatives
Phase III: Stabilisation
• Stabilise top line
• Improve GTM productivity
• Growth from new areas
• Improved profitability
• Standardise systems
Ac
tio
ns
Phase IV: Growth
• Top line growth
• Click and repeat!
Ac
tio
ns
FY17 FY18 FY19 FY20
30
Summary
31
• An opportunity to deliver exceptional value to HPE and Micro Focus
shareholders
• Utilise proven tax efficient structure
• Enable shareholders to participate in significant upside versus all cash
alternative
• Experienced management team and proven model reduces risk
• Create lead position in a consolidating market place with competitive
advantage
• Strategic Relationship with SUSE to capitalise on Open Source

Disclaimer
NOT FOR RELEASE, PUBLICATION OR DISTRIBUTION, IN WHOLE OR IN PART, IN, INTO OR FROM ANY JURISDICTION WHERE TO DO SO WOULD CONSTITUTE A VIOLATION OF THE RELEVANT LAWS OR
REGULATIONS OF SUCH JURISDICTION.
This presentation does not constitute or form part of any offer or invitation to sell or issue, or any solicitation of any offer to purchase or subscribe for, any securities, or any solicitation of any vote or approval. It does not constitute
a prospectus or a prospectus "equivalent" document.
ADDITIONAL INFORMATION AND WHERE TO FIND IT
This presentation has been prepared and issued by and is the sole responsibility of Micro Focus International PLC (the "Company"). This presentation relates to the Company and its conditional agreement to acquire the software
business of Hewlett Packard Enterprise Co. (“HPE") to be held by HPE Software Spinco, Inc. ("HPE Software"), a wholly owned subsidiary of HPE, constituting a reverse takeover for the purposes of the Listing Rules of the UKLA
(the "Acquisition" or the "Transaction"). The Transaction will be submitted to the Company’s shareholders for their consideration and approval. In connection with the Transaction, the Company will file relevant materials with the
SEC, including a registration statement on Form F-4 or S-4 containing a prospectus relating to the Company’s American Depositary Shares to be issued in connection with the Transaction, and HPE Software will file a registration
statement with the SEC. The Company will mail the prospectus contained in the Form F-4 or S-4 to HPE’s stockholders. This presentation is not a substitute for the registration statements or other document(s) that the Company
and/or HPE Software may file with the SEC in connection with the Transaction. INVESTORS ARE URGED TO READ THE REGISTRATION STATEMENTS AND OTHER DOCUMENTS FILED WITH THE SEC WHEN THEY
BECOME AVAILABLE BECAUSE THEY WILL CONTAIN IMPORTANT INFORMATION ABOUT THE PARTIES, AND THE TRANSACTION. Shareholders will be able to obtain copies of these documents (when they are
available) and other documents filed with the SEC with respect to the Company free of charge from the SEC’s website at www.sec.gov. These documents (when they are available) can also be obtained free of charge from the
Company upon written request to the Company’s investor relations or HPE’s investor relations.
For the purposes of this notice, "presentation" means this document, any oral presentation, any question and answer session and any written or oral material discussed or distributed during the presentation meeting or while
access to the presentation has been made available to you.
This presentation has not been approved by the UK Financial Conduct Authority ("FCA") or any other regulator. This presentation is for information purposes only. The material and information herein is not to be shared with any
other parties.
Neither this presentation, nor any part of it nor the fact of its availability or distribution is investment or financial product advice and nor is it intended to be used as the basis for making an investment decision. Neither the
Company nor J.P. Morgan Limited ("J.P. Morgan Cazenove") nor Numis Securities Limited ("Numis") makes any representation to any recipient regarding an investment in the securities referred to in this presentation. This
presentation has been prepared without taking into account the investment objectives, financial situation or particular needs of any particular person. You should seek your own legal, investment and tax advice as you see fit and
you should not act upon any information contained in this presentation without first consulting a financial or other professional adviser.
This presentation must not be recorded, copied, reproduced, published, distributed, disclosed, stored in a retrieval system, transmitted or passed on, directly or indirectly, in whole or in part, or disclosed by any recipient, to any
other person (whether within or outside such person’s organisation or firm) at any time without the written consent of the Company.
The availability and distribution of this presentation in certain jurisdictions may be restricted by law. No action has been taken by the Company, J.P. Morgan Cazenove or Numis that would permit access to or possession or
distribution of this presentation or any other offering or publicity material relating to the Company in any jurisdiction where action for that purpose is required. Persons into whose possession this presentation comes or who have
accessed this presentation are required by the Company, J.P. Morgan Cazenove and Numis to inform themselves about, and to observe, such restrictions.
33
Disclaimer (Cont’d)
Neither this presentation nor the information contained herein constitutes or forms part of an offer to sell or the solicitation of an offer to buy securities in the United States. Securities may not be offered or sold in the United States
absent registration or an exemption from registration. The securities of the Company have not been and will not be registered under the US Securities Act of 1933, as amended (the "Securities Act"), or under any securities laws
of any state or other jurisdiction of the United States and may not be offered, sold or transferred, directly or indirectly, in or into the United States absent registration or pursuant to an applicable exemption from, or in a transaction
not subject to, the registration requirements of the Securities Act and in compliance with the securities laws of any state or other jurisdiction of the United States. There will be no public offer of any securities in the United States or
any other jurisdiction.
J.P. Morgan Cazenove, which is authorised and regulated in the United Kingdom by the FCA, is acting as financial adviser and sponsor to the Company and no-one else in connection with the Acquisition and will not regard any
other person as its client in relation to the Acquisition and is not, and will not be, responsible to anyone other than the Company for providing the protections afforded to its clients or for providing advice in relation to the Acquisition
and/or any other matter referred to in this presentation. Apart from the responsibilities and liabilities, if any, which may be imposed on J.P. Morgan Cazenove by FSMA (as defined below), or the regulatory regime established
thereunder, J.P. Morgan Cazenove accepts no responsibility or liability whatsoever and makes no representation or warranty, express or implied, in relation to the contents of this presentation, including its accuracy,
completeness or for any other statement made or purported to be made by it or on behalf of it, the Company, its directors or any other person in connection with the Company, the Acquisition or any other matter in this
presentation and nothing in this presentation shall be relied upon as a promise or representation in this respect, whether as to the past or the future. J.P. Morgan Cazenove accordingly disclaims all and any liability whatsoever,
whether arising out of tort, contract or otherwise (save as referred to above), which it might otherwise have in respect of this presentation or any such statement.
Numis, which is authorised and regulated in the United Kingdom by the FCA, is acting as corporate broker and financial adviser to the Company and no-one else in connection with the Acquisition and will not regard any other
person as its client in relation to the Acquisition and is not, and will not be, responsible to anyone other than the Company for providing the protections afforded to its clients or for providing advice in relation to the Acquisition
and/or any other matter referred to in this presentation. Apart from the responsibilities and liabilities, if any, which may be imposed on Numis by FSMA (as defined below), or the regulatory regime established thereunder, Numis
accepts no responsibility or liability whatsoever and makes no representation or warranty, express or implied, in relation to the contents of this presentation, including its accuracy, completeness or for any other statement made or
purported to be made by it or on behalf of it, the Company, its directors or any other person in connection with the Company, the Acquisition or any other matter in this presentation and nothing in this presentation shall be relied
upon as a promise or representation in this respect, whether as to the past or the future. Numis accordingly disclaims all and any liability whatsoever, whether arising out of tort, contract or otherwise (save as referred to above),
which it might otherwise have in respect of this presentation or any such statement.
Information set forth in this announcement (including information incorporated by reference in this announcement), oral statements made regarding the Transaction, and other information published by Micro Focus or HPE may
contain certain statements about the Company, HPE and HPE Software that are “forward-looking statements” within the meaning of the U.S. Private Securities Litigation Reform Act of 1995. The forward-looking statements
contained in this presentation may include statements about the expected effects on the Company, HPE and HPE Software of the Transaction, the anticipated timing and benefits of the Transaction, the Company’s and HPE
Software’s anticipated standalone or combined financial results and all other statements in this document other than historical facts. Without limitation, any statements preceded or followed by or that include the words “targets”,
“plans”, “believes”, “expects”, “intends”, “will”, “likely”, “may”, “anticipates”, “estimates”, “projects”, “should”, “would”, “expect”, “positioned”, “strategy”, “future” or words, phrases or terms of similar substance or the negative thereof,
are forward-looking statements. These statements are based on the current expectations of the management of the Company, HPE or HPE Software (as the case may be) and are subject to uncertainty and changes in
circumstances and involve risks and uncertainties that could cause actual results to differ materially from those expressed or implied in such forward-looking statements. As such, forward-looking statements should be construed
in light of such factors. Neither Micro Focus nor HPE, nor any of their respective associates or directors, officers or advisers, provides any representation, assurance or guarantee that the occurrence of the events expressed or
implied in any forward-looking statements in this announcement will actually occur or that if any of the events occur, that the effect on the operations or financial condition of Micro Focus, HPE or HPE Software will be as
expressed or implied in such forward-looking statements. Forward-looking statements contained in this presentation based on past trends or activities should not be taken as a representation that such trends or activities will
necessarily continue in the future. In addition, these statements are based on a number of assumptions that are subject to change. Such risks, uncertainties and assumptions include: the satisfaction of the conditions to the
Transaction and other risks related to the completion of the Transaction and actions related thereto; the Company’s and HPE’s ability to complete the Transaction on anticipated terms and schedule, including the ability to obtain
shareholder or regulatory approvals of the Transaction; risks relating to any unforeseen liabilities of the Company or HPE Software; future capital expenditures, expenses, revenues, earnings, synergies, economic performance,
indebtedness, financial condition, losses and future prospects of the Company, HPE Software and the resulting combined company; business and management strategies and the expansion and growth of the operations of the
Company, HPE Software and the resulting combined company; the ability to successfully combine the business of the Company and HPE Software and to realise expected operational improvement from the Transaction; the
effects of government regulation on the businesses of the Company, HPE Software or the combined company; the risk that disruptions from the Transaction will impact the Company’s or HPE Software’s business; and the
Company’s, HPE Software’s or HPE’s plans, objectives, expectations and intentions generally. Additional factors can be found under “Risk Factors” in HPE’s Annual Report on Form 10-K for the fiscal year ended October 31,
2015 and subsequent Quarterly Reports on Form 10-Q. For a discussion of important factors which could cause actual results to differ from forward looking statements relating to Micro Focus, refer to Micro Focus's Annual
Report and Accounts 2016. Forward-looking statements included herein are made as of the date hereof, and none of the Company, HPE Software or HPE undertakes any obligation to update publicly such statements to reflect
subsequent events or circumstances.
34
Disclaimer (Cont’d)Subject to any requirement under applicable law, Micro Focus undertakes no obligation to update or revise any forward-looking statements, whether as a result of new information, future events or otherwise. Investors should not
place undue reliance on forward-looking statements, which speak only as of the date of this communication.
Except as otherwise explicitly stated, neither the content of the Micro Focus website nor the HPE website, nor any other website accessible via hyperlinks on either such website, is incorporated into, or forms part of, this
communication.
The information contained within this presentation has not been independently verified by J.P. Morgan Cazenove or Numis. No reliance may be placed, for any purpose whatsoever, on the information or opinions contained in this
presentation nor on its completeness, accuracy or fairness and no representation or warranty, express or implied, is given by or on behalf of the Company, J.P. Morgan Cazenove or Numis or any of their respective parent or
subsidiary undertakings, or the subsidiary undertakings of any such parent undertakings, or any of their respective directors, officers, employees, agents, affiliates or advisers as to the accuracy, completeness or fairness of the
information or opinions contained in this presentation and to the extent permitted by law no responsibility or liability is assumed by any such persons for any such information or opinions or for any errors or omissions. The
projections contained herein should not be regarded as a representation or warranty, express or implied, by the Company, J.P. Morgan Cazenove or Numis or any of their respective parent or subsidiary undertakings, or the
subsidiary undertakings of any such parent undertakings or any of their respective directors, officers, employees, agents, affiliates or advisers that the projected or estimated results will be achieved. To the maximum extent
permitted by law, neither the Company, its directors, officers, shareholders, advisers, affiliates, employees or agents, nor any other person accept any liability, including, without limitation, any liability arising out of fault or
negligence for any loss arising from the use of the information contained in this presentation. Statements contained in this presentation regarding past trends or activities should not be taken as a representation that such trends or
activities will continue in the future. This presentation speaks as at the date on which it is made. All information presented or contained in this presentation is subject to verification, correction, completion and change without
notice. Neither the delivery of this presentation nor any further discussions by the Company, J.P. Morgan Cazenove or Numis with any of the recipients thereof shall, under any circumstances, create any implication that there has
been no change in the affairs of the Company and/or HPE Software since that date and neither the Company nor J.P. Morgan Cazenove nor Numis undertakes any duty or assumes any obligation to update, revise publicly or
correct this presentation whether as a result of new information, future events or otherwise, except to the extent required by the FCA, the London Stock Exchange or by the Listing Rules, the Disclosure Guidance and
Transparency Rules or by applicable law. No statement in this presentation is, is intended to be, or should be construed as, a profit forecast or profit estimate for any period or to imply that the earnings of the Company for the
current or future financial years will necessarily match or exceed the historical or published earnings of the Company.
Certain market data information in this presentation is based on management’s estimates. The Company obtained the industry, market and competitive position data used throughout this presentation from internal estimates and
research as well as from industry publications and research, surveys and studies conducted by third parties. However, this information may prove to be inaccurate because of the method by which the Company obtained some of
the data for their estimates or because this information cannot always be verified due to the limits on the availability and reliability of raw data, the voluntary nature of the data gathering process and other limitations and
uncertainties. Where information contained in this presentation has been sourced from a third party (including HPE Software and/or HPE), the Company confirms that such information has been accurately reproduced and, so far
as the Company is aware and has been able to ascertain from that information, no facts have been omitted which would render the reproduced information, or information derived from it, inaccurate or misleading. By attending
this presentation or otherwise accessing this presentation you warrant, represent, acknowledge and agree to and with the Company, J.P. Morgan Cazenove and Numis that (i) you are a Relevant Person as defined above, (ii) you
have read, agree to and will comply with the contents of this disclaimer including, without limitation, the obligation to keep this presentation and its contents confidential and (iii) you will not at any time have any discussion,
correspondence or contact concerning the information in this presentation with any of the directors or employees of the Company or with any of their suppliers in respect of the Company without the prior written consent of the
Company.
35