Embed Size (px)
Citation preview
Page 1 of 468
Micro- Level Skill Gap Study for the State of Maharashtra Prepared for: Maharashtra State Skill Development Society Government of Maharashtra
Final Report
Page 9 of 468
Disclaimer and Notice to the Reader
• The information contained herein is of a general nature and is not intended to address the circumstances of any particular individual or entity. No one should act on such information without appropriate professional advice after a thorough examination of the particular situation.
• This report is confidential and for the use of management only. It is not to be distributed beyond the management nor is to be copied, circulated, referred to or quoted in correspondence, or discussed with any other party, in whole or in part, without our prior written consent, as per terms of business agreed under the Engagement Letter.
• This report sets forth our views based on the completeness and accuracy of the facts stated to KPMG and any assumptions that were included. If any of the facts and assumptions is not complete or accurate, it is imperative that we be informed accordingly, as the inaccuracy or incompleteness thereof could have a material effect on our conclusions.
• While performing the work, we assumed the genuineness of all signatures and the authenticity of all original documents. We have not independently verified the correctness or authenticity of the same.
• We have not performed an audit and do not express an opinion or any other form of assurance. Further, comments in our report are not intended, nor should they be interpreted to be legal advice or opinion.
• While information obtained from the public domain or external sources has not been verified for authenticity, accuracy or completeness, we have obtained information, as far as possible, from sources generally considered to be reliable. We assume no responsibility for such information.
• Performance of our work was based on information and explanations given to us by the staff of the Maharashtra State Skill Development Society and associated entities. Neither KPMG nor any of its partners, directors or employees undertake responsibility in any way whatsoever to any person in respect of errors in this report, arising from incorrect information provided by the staff of Maharashtra State Skill Development Society and associated entities.
• Our report may make reference to ‘KPMG Analysis’; this indicates only that we have (where specified) undertaken certain analytical activities on the underlying data to arrive at the information presented; we do not accept responsibility for the veracity of the underlying data.
• In accordance with its policy, KPMG advises that neither it nor any partner, director or employee undertakes any responsibility arising in any way whatsoever, to any person other than Maharashtra State Skill Development Society and associated entities in respect of the matters dealt with in this report, including any errors or omissions therein, arising through negligence or otherwise, howsoever caused.
• In connection with our report or any part thereof, KPMG does not owe duty of care (whether in contract or in tort or under statute or otherwise) to any person or party to whom the report is circulated to and KPMG shall not be liable to any party who uses or relies on this report. KPMG thus disclaims all responsibility or liability for any costs, damages, losses, liabilities, expenses incurred by such third party arising out of or in connection with the report or any part thereof.
• By reading our report the reader of the report shall be deemed to have accepted the terms mentioned hereinabove.
Page 10 of 468
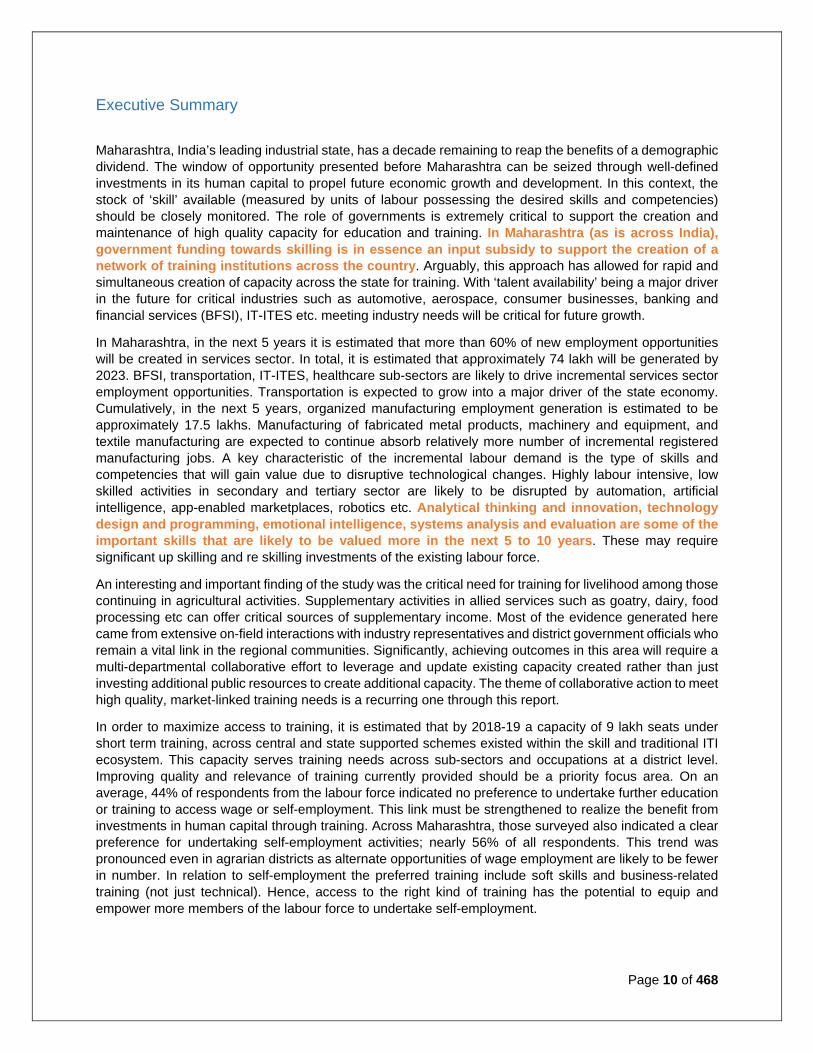
Executive Summary
Maharashtra, India’s leading industrial state, has a decade remaining to reap the benefits of a demographic dividend. The window of opportunity presented before Maharashtra can be seized through well-defined investments in its human capital to propel future economic growth and development. In this context, the stock of ‘skill’ available (measured by units of labour possessing the desired skills and competencies) should be closely monitored. The role of governments is extremely critical to support the creation and maintenance of high quality capacity for education and training. In Maharashtra (as is across India), government funding towards skilling is in essence an input subsidy to support the creation of a network of training institutions across the country. Arguably, this approach has allowed for rapid and simultaneous creation of capacity across the state for training. With ‘talent availability’ being a major driver in the future for critical industries such as automotive, aerospace, consumer businesses, banking and financial services (BFSI), IT-ITES etc. meeting industry needs will be critical for future growth.
In Maharashtra, in the next 5 years it is estimated that more than 60% of new employment opportunities will be created in services sector. In total, it is estimated that approximately 74 lakh will be generated by 2023. BFSI, transportation, IT-ITES, healthcare sub-sectors are likely to drive incremental services sector employment opportunities. Transportation is expected to grow into a major driver of the state economy. Cumulatively, in the next 5 years, organized manufacturing employment generation is estimated to be approximately 17.5 lakhs. Manufacturing of fabricated metal products, machinery and equipment, and textile manufacturing are expected to continue absorb relatively more number of incremental registered manufacturing jobs. A key characteristic of the incremental labour demand is the type of skills and competencies that will gain value due to disruptive technological changes. Highly labour intensive, low skilled activities in secondary and tertiary sector are likely to be disrupted by automation, artificial intelligence, app-enabled marketplaces, robotics etc. Analytical thinking and innovation, technology design and programming, emotional intelligence, systems analysis and evaluation are some of the important skills that are likely to be valued more in the next 5 to 10 years. These may require significant up skilling and re skilling investments of the existing labour force.
An interesting and important finding of the study was the critical need for training for livelihood among those continuing in agricultural activities. Supplementary activities in allied services such as goatry, dairy, food processing etc can offer critical sources of supplementary income. Most of the evidence generated here came from extensive on-field interactions with industry representatives and district government officials who remain a vital link in the regional communities. Significantly, achieving outcomes in this area will require a multi-departmental collaborative effort to leverage and update existing capacity created rather than just investing additional public resources to create additional capacity. The theme of collaborative action to meet high quality, market-linked training needs is a recurring one through this report.
In order to maximize access to training, it is estimated that by 2018-19 a capacity of 9 lakh seats under short term training, across central and state supported schemes existed within the skill and traditional ITI ecosystem. This capacity serves training needs across sub-sectors and occupations at a district level. Improving quality and relevance of training currently provided should be a priority focus area. On an average, 44% of respondents from the labour force indicated no preference to undertake further education or training to access wage or self-employment. This link must be strengthened to realize the benefit from investments in human capital through training. Across Maharashtra, those surveyed also indicated a clear preference for undertaking self-employment activities; nearly 56% of all respondents. This trend was pronounced even in agrarian districts as alternate opportunities of wage employment are likely to be fewer in number. In relation to self-employment the preferred training include soft skills and business-related training (not just technical). Hence, access to the right kind of training has the potential to equip and empower more members of the labour force to undertake self-employment.
Page 11 of 468
Looking ahead, it is essential that a well-defined policy for skill investments and a clear prioritization framework (described in the report) be adopted for district level resource allocations. After taking into considerations feedback from key stakeholders, the sub-sectors were prioritized based on economic growth, employment generation potential and labour aspirations in each district. Additionally, training as a means to localized self-employed and/or livelihood generation has helped identify emerging and niche economic activities such as eco-tourism in Chandrapur or healthcare activities in Aurangabad.
Key to achieving the training goals are quality consciousness, collaborations, industry participation and leveraging existing education/ training capacity outside the private training ecosystem (where relevant) as well. Quality consciousness is of prime importance given strong employability considerations of those consuming training interventions.
Another important ingredient to sustain future investments in training activities is data availability, specifically sub-state level employment data. A natural next step would be to initiate collaborative discussions with other government departments in this regard.
Page 13 of 468
Study Objectives
India is one of the world’s youngest nations with 30% of its population classified as ‘youth’1. With 365 million in the age group 10-24, new entrants to India’s labour force will continue to grow. This presents the opportunity to reap benefits from its demographic dividend. An important feature of this opportunity is the large variations among states. As per the United Nations Fund for Population, Maharashtra is one of 8 states that has entered this window of opportunity but has a decade left to reap the benefits of a demographic dividend. States such as Kerala and Tamil Nadu have exited this window while Chhattisgarh, Jharkhand, Bihar etc, are likely to enter the window two decades from now2. Overall, this expands the window of opportunity for India as a whole.
Benefits of a demographic dividend can be realized when a country’s youth are equipped to lead productive lives and contribute to their family, society and economy. Capacity building of India’s human capital is essential through education and training efforts – be it traditional or vocational. Investments for capacity building through tertiary education and vocational education are led by governments – central and state.
This study is driven by vocational education related efforts undertaken in Maharashtra, specifically by the Maharashtra State Skill Development Society (MSSDS). MSSDS was set up as a nodal agency to coordinate state wide investments in vocational education, specifically the ‘skill’ programmes, and implement flagship vocational education/ training schemes. In order to have an evidence based approach for decision making it was felt that an updated and more detailed assessment of the demand, supply and aspirations of the labour force be studied. Some of the key decisions associated with resource allocation can be strengthened with a detailed understanding of the economy and labour force. The micro level skill gap study conducted by KPMG Advisory Services (KPMG) is performed in this context. KPMG conducted a primary survey to gather inputs on aspirations of the labour force in Maharashtra. In order to estimate future employment potential that will be serviced through ‘skills’ or units of labour possessing certain skills and/or competencies, a comprehensive economic and statistical analysis was conducted. Refer to the ‘approach and methodology’ section for details. The team supplemented the economic and statistical analysis with field visits and cross validation workshops at a district level, across Maharashtra.
It is important to note here that economic activity and labour force analysis is most effective at a ‘cluster’ level. Economic activities (referenced by NIC classified 3 digit level sub-sectors) can be effectively studied and understood at a certain minimum scale rather than studying it at every lowest possible geographical unit. Similarly, given labour mobility to seek and undertake economic activity, it is relevant to analyze trends within a certain geographical context. Combined with data availability, any estimations are best possible with a district view. There is sufficient information to support this level of governance to make evidence based decisions related to resource allocation in the skill ecosystem.
1 Census 2011 2 United Nations Fund for Population India, Ninth Country Highlights - 2017
Page 14 of 468
Study Limitations
• Estimates for unregistered manufacturing district wise are not included due to insufficient data.
• Latest available ‘actuals’ vary across sectors; recent sub-sectoral growth and employment especially
in services not published
• Dependency on NSSO sample data for distribution of employment among service subsectors. Hence
it is highly representative but not exhaustive.
• Primary inputs used in the study are as per the responses gathered from the survey and stakeholder
consultations. Hence, may suffer from inherent bias of the respondents.
• Lack of reliable data for analyzing demand across job roles aligned to the NSQF.
• Availability of statistical data separately for Thane and Palghar.
Page 15 of 468
Approach & Methodology
KPMG has adopted a comprehensive approach based on rigorous research and analysis of various dimensions of skill gap, including assessment of incremental manpower needs, aspirational study and insights from primary interactions and, collate these insights to arrive at recommendations to address skill gap in the districts of Maharashtra.
Approach and methodology to this study comprises of the following key elements: 1. District demography, economy and human resource development scenario :
Detailed analysis on demographic and economic indicators is undertaken for each of the districts. The key demographic indicators include population, population growth, human development indicators, and workforce distribution by primary secondary and tertiary sectors, unemployment rates, nature of employment, working age population, workforce participation rates. Further district economy is studied to understand the key drivers of GDP and main industries in the district contributing to employment. Human development scenario includes assessment of existing skill training capacity across sectors from major central schemes and state scheme, no. of institutes for primary, secondary and vocational education in the district. Relevant comparisons are made to highlight the distinguishing characteristics of the district.
2. Aspiration Study :
The aspiration study has been undertaken with the objective of understanding aspirations of the youth in terms of type of employment, further education and training. The insights from the study are helpful in expectation management and linking people to training of their choice which is critical for higher job engagement and retention. The key aspects captured in the study are aspirations for self v/s wage employment, preference to undertake further education and training, aspirational sectors, perceived benefits from trainings attended and challenges faced post the training.
The survey design and methodology for conducting the aspiration study is described in detail in the Additional Information section.
3. Estimation of incremental manpower demand:
This analysis is undertaken with the objective of estimating incremental manpower requirements sub sector wise for each district. Sector wise future employment generation potential is a key determinant for prioritizing skills trainings.
Future employment is projected on the basis of the following formula:
Estimated workforce = Baseline workforce* [1+ (Employment elasticity *GDP growth rate] n
Where n = number of years for which projected
CAGR approach has been used to estimate sectoral employment elasticity. Employment elasticity between two time periods is estimated as:
Employment elasticity = ΔE / ΔG Where ΔE = growth in employment (% CAGR) ΔG = GDP growth (% CAGR)
Page 16 of 468
The baseline workforce is considered at a district level for each sector. Data from Annual Survey of Industries has been used for manufacturing sub sectors. For agriculture and services, data from Census 2011 and NSSO 68th round, Employment-Unemployment Survey.
GDP growth is estimated using CAGR approach. Future expectation of growth is based on recent trends in each sector. Alternate growth scenarios are considered for sectors that have experienced sharp fluctuations in growth to arrive at more conservative estimates.
Incremental demand is the annual change in projected demand.
A list of secondary sources used for this analysis is also enclosed appendix- Appendix II
4. Estimation of manpower supply : The objective of this step is to estimate the expected labour and workforce supply district wise. The methodology adopted for this is as follows: The population of the district has been projected till 2023 based on annual growth rate of population district wise between 2001 and 2011. The projected population is distributed into different age groups (0-14, 15-59, 60 & above) using estimates published by NHRM. Labour force and workforce supply is derived using estimates for labour force participation rates and worker population ratio published in the district level estimates for state of Maharashtra by Labour bureau. 5. Voice of Stakeholders : • Interactions with the district officials to understand district and sector specific needs priority areas and
emerging sectors. List of district departments consulted is provided in the Appendix No III • Seeking inputs and feedback from industry experts and labour economists on the chosen methodology
and assumptions • Employers from different sectors and training partners were surveyed to understand, emerging sectors,
recruitment trends, and trainings offered at various levels, challenges faced by employers and training institutes, and areas of improvement.
• The interim findings of the study were presented in consultative divisional workshops with representation from members of district skill development committee. Relevant inputs from the workshops have been incorporated in the report.
6. Recommendation framework:
A structured approach has been adopted for making recommendations for each district. The sub-sectors have been ranked using three parameters namely, estimated economic growth, estimated incremental employment potential in the district, and aspirational value. Upon detailed discussions with key decision makers it was determined that a combination of economic and labour aspirations are implicit to decision making in the skill ecosystem. In the absence of a defined policy framework or guidelines, it was found important to reflect these implicit considerations in the chosen parameters. For each parameter attributes of ‘high’, ‘medium’ and ‘low’ were assigned based on the below defined thresholds. For example: If the incremental employment potential was >5% (over the base year) then it was assigned the attribute value ‘high’. Next, each sub-sector was analyzed, for each district against the below defined framework and an attribute value assigned. Once, the attributes were assigned for each parameter, all sub-sectors were evaluated and priority was assigned to those sub-sectors which had higher number of ‘high’ attribute values across parameters. Hence, the framework was able to identify and rank sectors where economic growth, employment generation potential and labour market preferences were relatively higher. Understanding the sub-sector rankings using the recommendation framework: Green: High;
Page 17 of 468
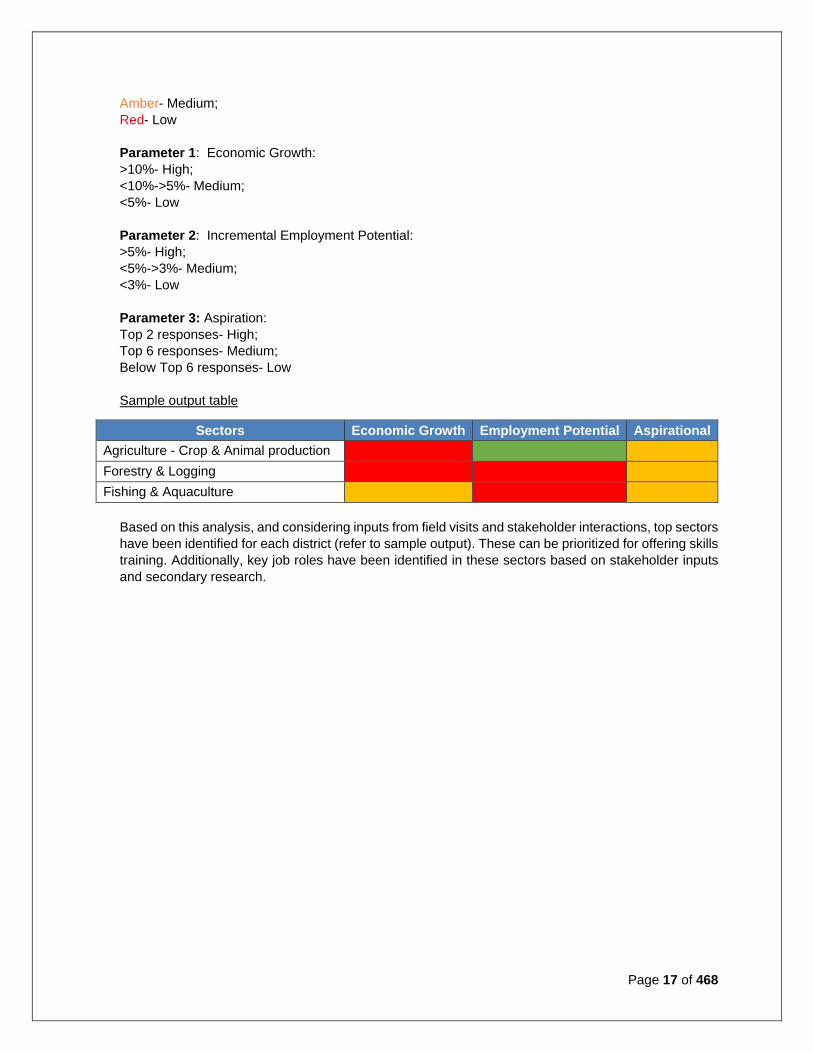
Amber- Medium; Red- Low Parameter 1: Economic Growth: >10%- High; <10%->5%- Medium; <5%- Low Parameter 2: Incremental Employment Potential: >5%- High; <5%->3%- Medium; <3%- Low Parameter 3: Aspiration: Top 2 responses- High; Top 6 responses- Medium; Below Top 6 responses- Low Sample output table
Sectors Economic Growth Employment Potential Aspirational Agriculture - Crop & Animal production Forestry & Logging Fishing & Aquaculture
Based on this analysis, and considering inputs from field visits and stakeholder interactions, top sectors have been identified for each district (refer to sample output). These can be prioritized for offering skills training. Additionally, key job roles have been identified in these sectors based on stakeholder inputs and secondary research.
Page 45 of 468
District Profiles
Ahmednagar About the district Ahmednagar district is located in the western region of the Maharashtra state with the district headquarters in Ahmednagar City. The district is included in Nashik division. Ahmednagar is divided into 15 sub-districts and 1,581 inhabited villages.
Ahmednagar is the largest district of Maharashtra with a land area of 17,048 sq.km. It constitutes 5.6% of the total state area. It is bordered by Nashik and Aurangabad districts to the north, Thane and Pune districts to the west, Solapur, Osmanabad and Beed districts to the South-east. The district has several tourist attractions.
Ralegan Siddhi, a village in Parner taluka of Ahmednagar District, is considered a model of environmental conservation and is an ideal village in India. The district is also known for its high number of sugar factories.
Table 6: Comparison of Ahmednagar district with Maharashtra Indicator Ahmednagar Maharashtra Area in sq.km. 17,048 3,07,713 Percentage share in state geographical area, % 5.6% 100 No. of Sub-districts 15 353 No. of inhabited villages 1,581 40,959 No. of households 9,25,826 24,421,519 Forest area as a % of total geographical area 8.7% 16.94
Source: Census 2011
Demography According to 2011 census data, the district has a population of over 45.4 lakh persons which is ~4% of the state. Ahmednagar is one of the least urbanized districts in the state having about one-fifth of its population in urban areas whereas more than two-fifth of the state population lives in urban areas. With a population density of 266 persons/Sq. Km which is significantly lower than the state average, the district is one of the many medium-intensity regions. Despite being the sixth most populous district of the state, the district manages to be less densely populated because of its larger land size.
Table 7 lists down multiple demographic indicators of the district. Ahmednagar district has higher sex ratio (number of female per 1000 males) compared to the state. About three-fifth of the district’s population falls in the working age group (i.e. 15-59 years) while a little less than half of its population is actually working i.e. % of total workers (main and marginal workers) to the total population. The remaining ~51% of the population are non-workers.
Table 7: Demographic indicators of Ahmednagar district Indicator Ahmednagar Maharashtra Population, No. 45,43,159 11,23,74,333 Decadal growth rate of population, % 12.44% 16 Urban Population as a percentage of total population, % 20% 45.2 SC Population, % 12.6% 10.2 ST Population, % 8.3% 8.8 Sex ratio, No. of females per 1000 males 939 925 Population density, per sq.km. 266 365 Literacy rate, % 79.05% 83 Working age population* as a percentage of total population, %
61% 59
Work participation rate^, % 48.53% 44 HDI Index 0.720 0.75
Page 46 of 468
*working age population is the population in the age group of 15 to 59 years. ^Work participation rate is defined as the percentage of total workers (main and marginal workers) to total population. Source: Census 2011, Census 2001, Maharashtra Human Development Report 2012
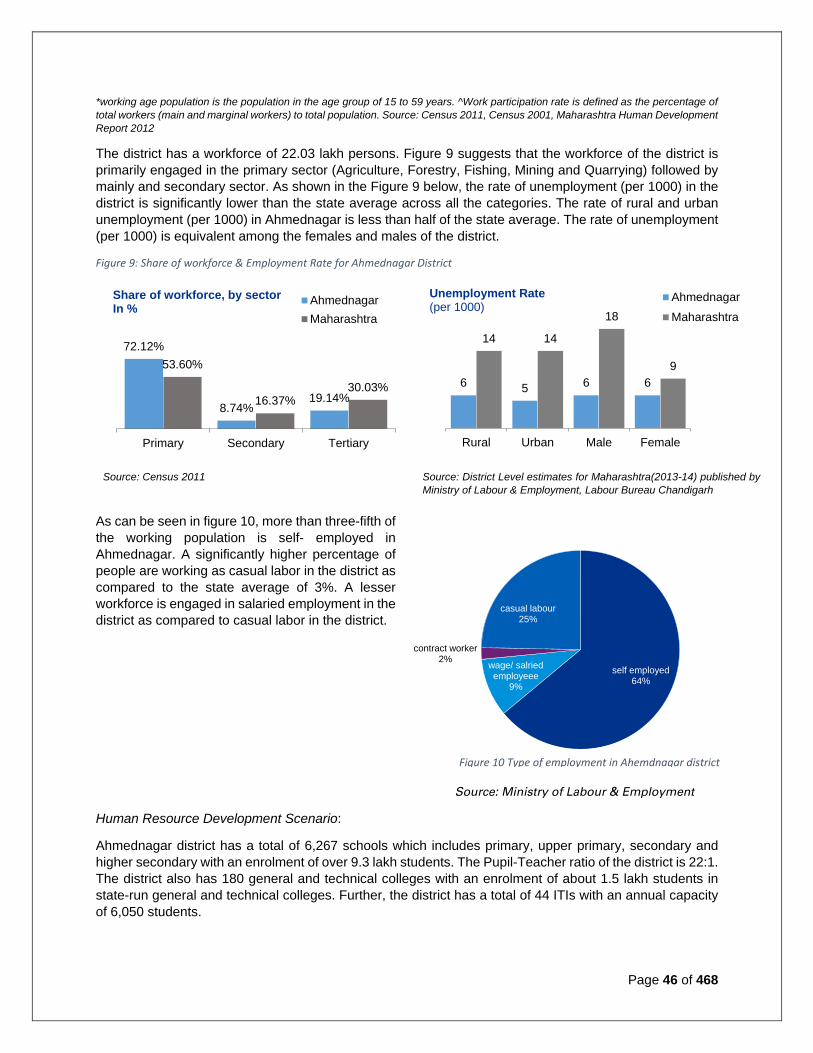
The district has a workforce of 22.03 lakh persons. Figure 9 suggests that the workforce of the district is primarily engaged in the primary sector (Agriculture, Forestry, Fishing, Mining and Quarrying) followed by mainly and secondary sector. As shown in the Figure 9 below, the rate of unemployment (per 1000) in the district is significantly lower than the state average across all the categories. The rate of rural and urban unemployment (per 1000) in Ahmednagar is less than half of the state average. The rate of unemployment (per 1000) is equivalent among the females and males of the district.
Figure 9: Share of workforce & Employment Rate for Ahmednagar District
Source: Census 2011 Source: District Level estimates for Maharashtra(2013-14) published by
Ministry of Labour & Employment, Labour Bureau Chandigarh As can be seen in figure 10, more than three-fifth of the working population is self- employed in Ahmednagar. A significantly higher percentage of people are working as casual labor in the district as compared to the state average of 3%. A lesser workforce is engaged in salaried employment in the district as compared to casual labor in the district.
Source: Ministry of Labour & Employment
Human Resource Development Scenario:
Ahmednagar district has a total of 6,267 schools which includes primary, upper primary, secondary and higher secondary with an enrolment of over 9.3 lakh students. The Pupil-Teacher ratio of the district is 22:1. The district also has 180 general and technical colleges with an enrolment of about 1.5 lakh students in state-run general and technical colleges. Further, the district has a total of 44 ITIs with an annual capacity of 6,050 students.
72.12%
8.74%19.14%
53.60%
16.37%30.03%
Primary Secondary Tertiary
Share of workforce, by sectorIn % Ahmednagar
Maharashtra
6 5 6 6
14 14
18
9
Rural Urban Male Female
Unemployment Rate(per 1000)
AhmednagarMaharashtra
Figure 10 Type of employment in Ahemdnagar district
self employed64%
wage/ salried employeee
9%
contract worker2%
casual labour25%
Page 47 of 468
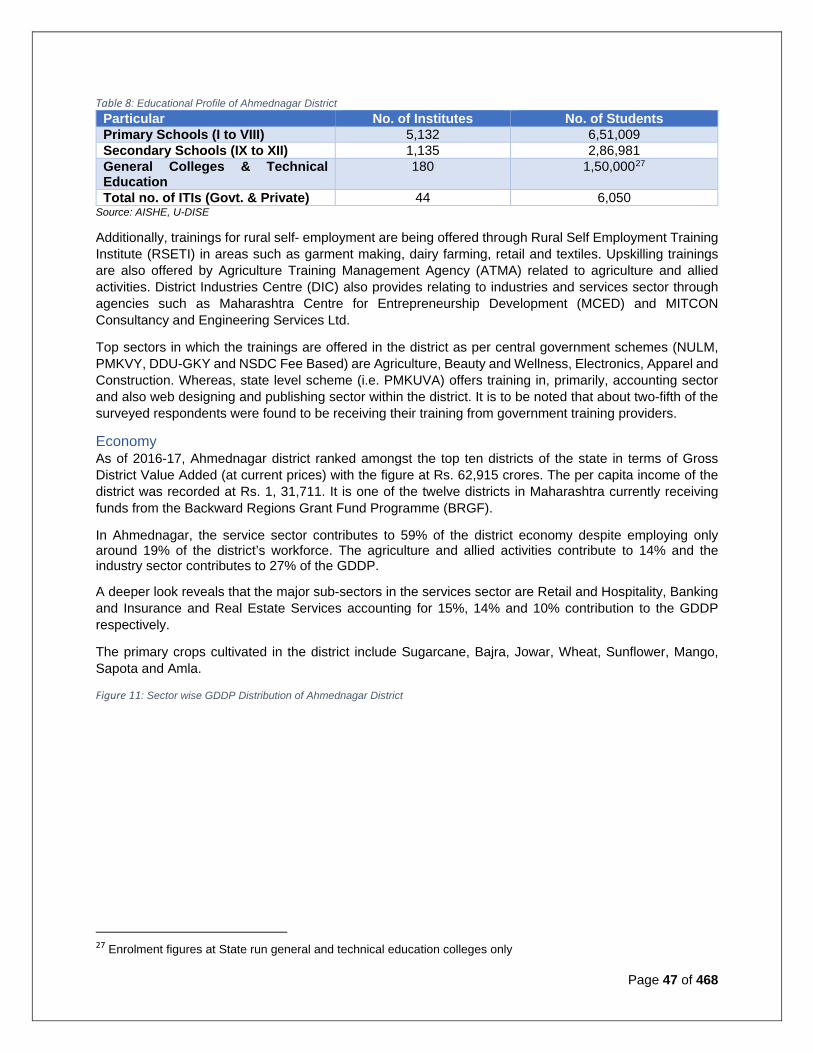
Table 8: Educational Profile of Ahmednagar District Particular No. of Institutes No. of Students Primary Schools (I to VIII) 5,132 6,51,009 Secondary Schools (IX to XII) 1,135 2,86,981 General Colleges & Technical Education
180 1,50,00027
Total no. of ITIs (Govt. & Private) 44 6,050 Source: AISHE, U-DISE
Additionally, trainings for rural self- employment are being offered through Rural Self Employment Training Institute (RSETI) in areas such as garment making, dairy farming, retail and textiles. Upskilling trainings are also offered by Agriculture Training Management Agency (ATMA) related to agriculture and allied activities. District Industries Centre (DIC) also provides relating to industries and services sector through agencies such as Maharashtra Centre for Entrepreneurship Development (MCED) and MITCON Consultancy and Engineering Services Ltd.
Top sectors in which the trainings are offered in the district as per central government schemes (NULM, PMKVY, DDU-GKY and NSDC Fee Based) are Agriculture, Beauty and Wellness, Electronics, Apparel and Construction. Whereas, state level scheme (i.e. PMKUVA) offers training in, primarily, accounting sector and also web designing and publishing sector within the district. It is to be noted that about two-fifth of the surveyed respondents were found to be receiving their training from government training providers.
Economy As of 2016-17, Ahmednagar district ranked amongst the top ten districts of the state in terms of Gross District Value Added (at current prices) with the figure at Rs. 62,915 crores. The per capita income of the district was recorded at Rs. 1, 31,711. It is one of the twelve districts in Maharashtra currently receiving funds from the Backward Regions Grant Fund Programme (BRGF).
In Ahmednagar, the service sector contributes to 59% of the district economy despite employing only around 19% of the district’s workforce. The agriculture and allied activities contribute to 14% and the industry sector contributes to 27% of the GDDP.
A deeper look reveals that the major sub-sectors in the services sector are Retail and Hospitality, Banking and Insurance and Real Estate Services accounting for 15%, 14% and 10% contribution to the GDDP respectively.
The primary crops cultivated in the district include Sugarcane, Bajra, Jowar, Wheat, Sunflower, Mango, Sapota and Amla.
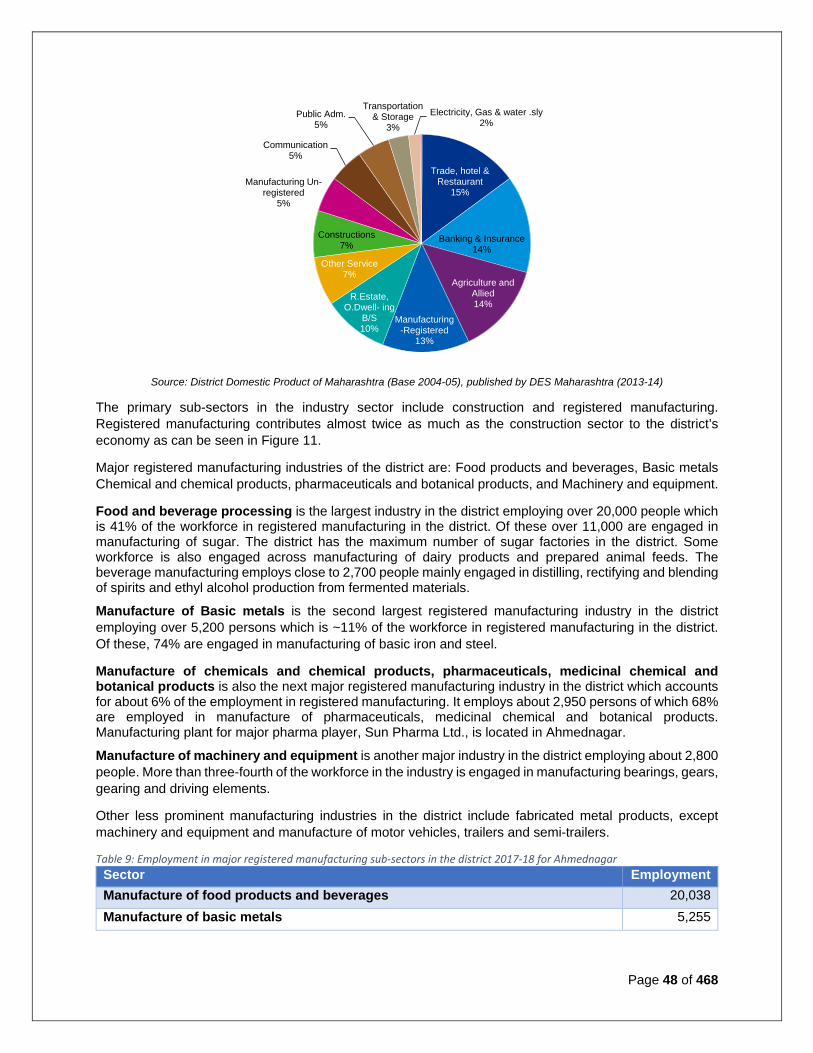
Figure 11: Sector wise GDDP Distribution of Ahmednagar District
27 Enrolment figures at State run general and technical education colleges only
Page 48 of 468
Source: District Domestic Product of Maharashtra (Base 2004-05), published by DES Maharashtra (2013-14)
The primary sub-sectors in the industry sector include construction and registered manufacturing. Registered manufacturing contributes almost twice as much as the construction sector to the district’s economy as can be seen in Figure 11.
Major registered manufacturing industries of the district are: Food products and beverages, Basic metals Chemical and chemical products, pharmaceuticals and botanical products, and Machinery and equipment.
Food and beverage processing is the largest industry in the district employing over 20,000 people which is 41% of the workforce in registered manufacturing in the district. Of these over 11,000 are engaged in manufacturing of sugar. The district has the maximum number of sugar factories in the district. Some workforce is also engaged across manufacturing of dairy products and prepared animal feeds. The beverage manufacturing employs close to 2,700 people mainly engaged in distilling, rectifying and blending of spirits and ethyl alcohol production from fermented materials.
Manufacture of Basic metals is the second largest registered manufacturing industry in the district employing over 5,200 persons which is ~11% of the workforce in registered manufacturing in the district. Of these, 74% are engaged in manufacturing of basic iron and steel.
Manufacture of chemicals and chemical products, pharmaceuticals, medicinal chemical and botanical products is also the next major registered manufacturing industry in the district which accounts for about 6% of the employment in registered manufacturing. It employs about 2,950 persons of which 68% are employed in manufacture of pharmaceuticals, medicinal chemical and botanical products. Manufacturing plant for major pharma player, Sun Pharma Ltd., is located in Ahmednagar.
Manufacture of machinery and equipment is another major industry in the district employing about 2,800 people. More than three-fourth of the workforce in the industry is engaged in manufacturing bearings, gears, gearing and driving elements.
Other less prominent manufacturing industries in the district include fabricated metal products, except machinery and equipment and manufacture of motor vehicles, trailers and semi-trailers.
Table 9: Employment in major registered manufacturing sub-sectors in the district 2017-18 for Ahmednagar Sector Employment Manufacture of food products and beverages 20,038 Manufacture of basic metals 5,255
Trade, hotel & Restaurant
15%
Banking & Insurance14%
Agriculture and Allied14%
Manufacturing -Registered
13%
R.Estate, O.Dwell- ing
B/S10%
Other Service7%
Constructions7%
Manufacturing Un-registered
5%
Communication5%
Public Adm.5%
Transportation & Storage
3%Electricity, Gas & water .sly
2%
Page 49 of 468
Sector Employment Manufacture of chemicals and chemical products, , pharmaceuticals, medicinal chemical and botanical products
2,954
Manufacture of machinery and equipment n.e.c. 2,793
Manufacture of fabricated metal products, except machinery and equipment 2,261 Manufacture of motor vehicles, trailers and semi-trailers 2,061
Manufacture of rubber and plastics products 1,873 Manufacture of tobacco products 1,297 Manufacture of paper and paper products 440 Manufacture of other transport equipment 331 Manufacture of other non-metallic mineral products 285 Manufacture of textiles 154
Source: Annual Survey of Industries, 2017-18
Labour force Aspiration The main findings of the youth aspirations include
Respondent Profile
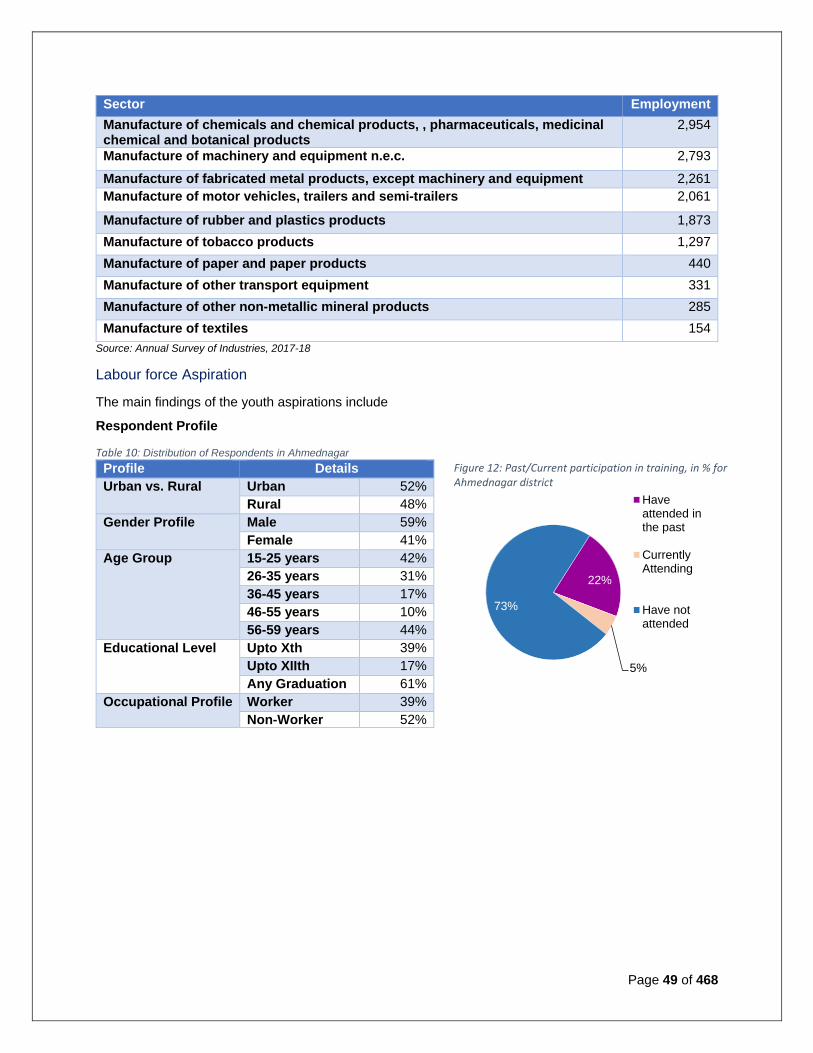
Table 10: Distribution of Respondents in Ahmednagar
Profile Details Urban vs. Rural Urban 52%
Rural 48% Gender Profile Male 59%
Female 41% Age Group 15-25 years 42%
26-35 years 31% 36-45 years 17% 46-55 years 10% 56-59 years 44%
Educational Level Upto Xth 39% Upto XIIth 17% Any Graduation 61%
Occupational Profile Worker 39% Non-Worker 52%
22%
5%
73%
Haveattended inthe past
CurrentlyAttending
Have notattended
Figure 12: Past/Current participation in training, in % for Ahmednagar district
Page 50 of 468
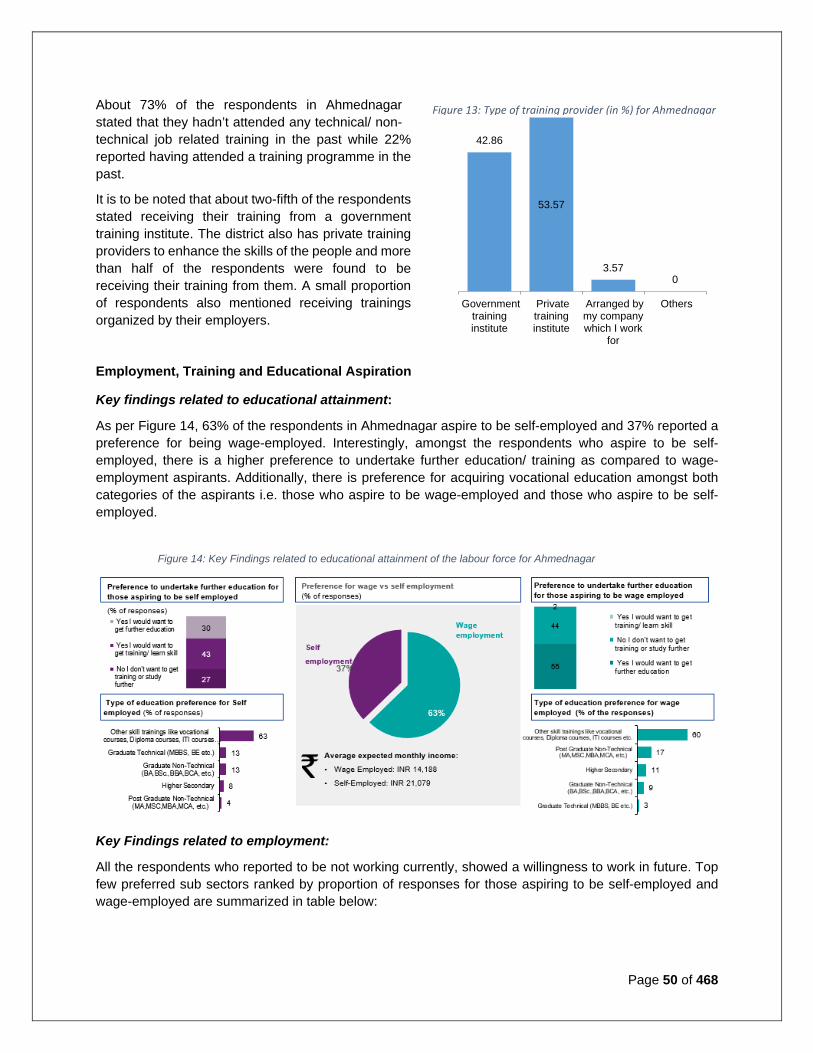
About 73% of the respondents in Ahmednagar stated that they hadn’t attended any technical/ non-technical job related training in the past while 22% reported having attended a training programme in the past.
It is to be noted that about two-fifth of the respondents stated receiving their training from a government training institute. The district also has private training providers to enhance the skills of the people and more than half of the respondents were found to be receiving their training from them. A small proportion of respondents also mentioned receiving trainings organized by their employers.
Employment, Training and Educational Aspiration
Key findings related to educational attainment:
As per Figure 14, 63% of the respondents in Ahmednagar aspire to be self-employed and 37% reported a preference for being wage-employed. Interestingly, amongst the respondents who aspire to be self-employed, there is a higher preference to undertake further education/ training as compared to wage-employment aspirants. Additionally, there is preference for acquiring vocational education amongst both categories of the aspirants i.e. those who aspire to be wage-employed and those who aspire to be self-employed.
Key Findings related to employment:
All the respondents who reported to be not working currently, showed a willingness to work in future. Top few preferred sub sectors ranked by proportion of responses for those aspiring to be self-employed and wage-employed are summarized in table below:
Figure 14: Key Findings related to educational attainment of the labour force for Ahmednagar
42.86
53.57
3.570
Governmenttraininginstitute
Privatetraininginstitute
Arranged bymy companywhich I work
for
Others
Figure 13: Type of training provider (in %) for Ahmednagar
Page 51 of 468
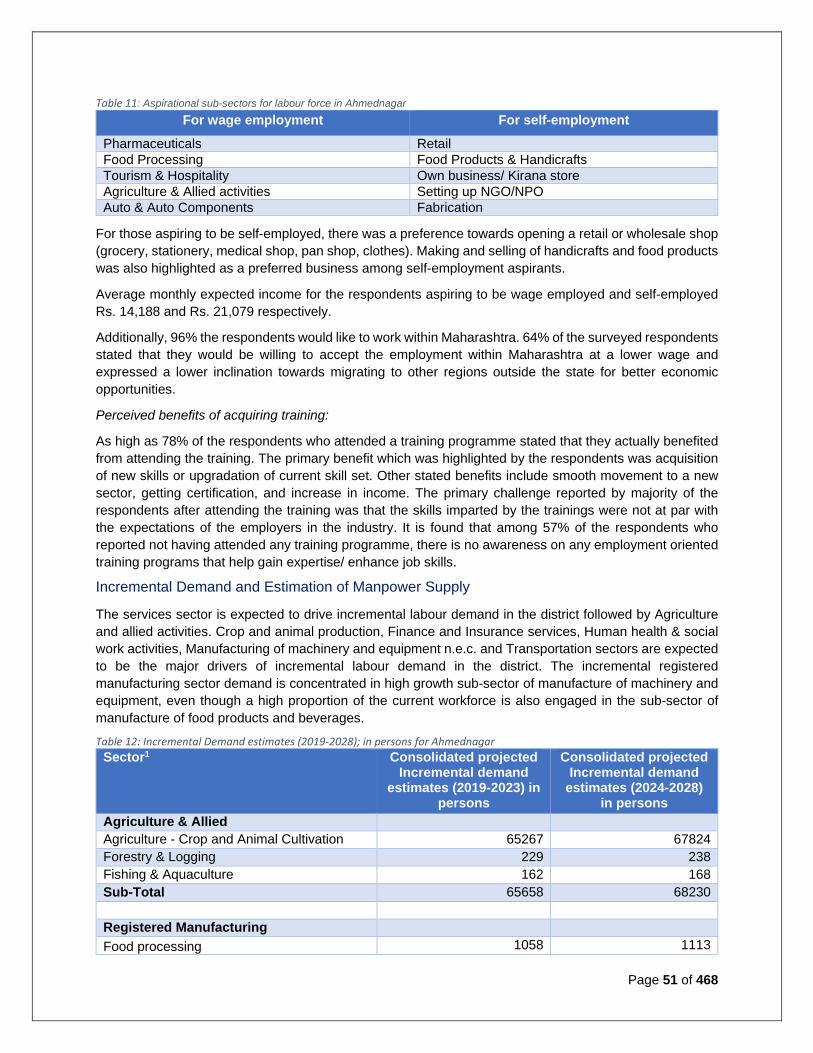
Table 11: Aspirational sub-sectors for labour force in Ahmednagar
For wage employment For self-employment Pharmaceuticals Retail Food Processing Food Products & Handicrafts Tourism & Hospitality Own business/ Kirana store Agriculture & Allied activities Setting up NGO/NPO Auto & Auto Components Fabrication
For those aspiring to be self-employed, there was a preference towards opening a retail or wholesale shop (grocery, stationery, medical shop, pan shop, clothes). Making and selling of handicrafts and food products was also highlighted as a preferred business among self-employment aspirants.
Average monthly expected income for the respondents aspiring to be wage employed and self-employed Rs. 14,188 and Rs. 21,079 respectively.
Additionally, 96% the respondents would like to work within Maharashtra. 64% of the surveyed respondents stated that they would be willing to accept the employment within Maharashtra at a lower wage and expressed a lower inclination towards migrating to other regions outside the state for better economic opportunities.
Perceived benefits of acquiring training:
As high as 78% of the respondents who attended a training programme stated that they actually benefited from attending the training. The primary benefit which was highlighted by the respondents was acquisition of new skills or upgradation of current skill set. Other stated benefits include smooth movement to a new sector, getting certification, and increase in income. The primary challenge reported by majority of the respondents after attending the training was that the skills imparted by the trainings were not at par with the expectations of the employers in the industry. It is found that among 57% of the respondents who reported not having attended any training programme, there is no awareness on any employment oriented training programs that help gain expertise/ enhance job skills.
Incremental Demand and Estimation of Manpower Supply
The services sector is expected to drive incremental labour demand in the district followed by Agriculture and allied activities. Crop and animal production, Finance and Insurance services, Human health & social work activities, Manufacturing of machinery and equipment n.e.c. and Transportation sectors are expected to be the major drivers of incremental labour demand in the district. The incremental registered manufacturing sector demand is concentrated in high growth sub-sector of manufacture of machinery and equipment, even though a high proportion of the current workforce is also engaged in the sub-sector of manufacture of food products and beverages.
Table 12: Incremental Demand estimates (2019-2028); in persons for Ahmednagar Sector1 Consolidated projected
Incremental demand estimates (2019-2023) in
persons
Consolidated projected Incremental demand
estimates (2024-2028) in persons
Agriculture & Allied
Agriculture - Crop and Animal Cultivation 65267 67824 Forestry & Logging 229 238 Fishing & Aquaculture 162 168 Sub-Total 65658 68230
Registered Manufacturing
Food processing 1058 1113
Page 52 of 468
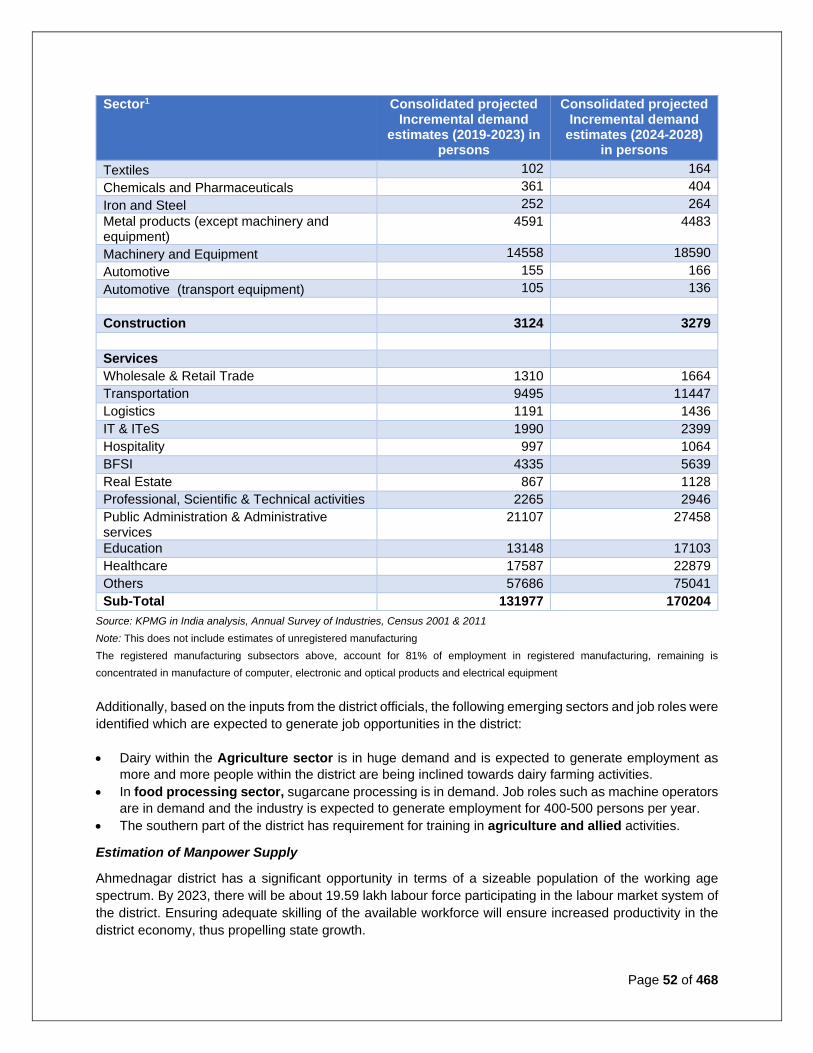
Sector1 Consolidated projected Incremental demand
estimates (2019-2023) in persons
Consolidated projected Incremental demand
estimates (2024-2028) in persons
Textiles 102 164 Chemicals and Pharmaceuticals 361 404 Iron and Steel 252 264 Metal products (except machinery and equipment)
4591 4483
Machinery and Equipment 14558 18590 Automotive 155 166 Automotive (transport equipment) 105 136
Construction 3124 3279
Services
Wholesale & Retail Trade 1310 1664 Transportation 9495 11447 Logistics 1191 1436 IT & ITeS 1990 2399 Hospitality 997 1064 BFSI 4335 5639 Real Estate 867 1128 Professional, Scientific & Technical activities 2265 2946 Public Administration & Administrative services
21107 27458
Education 13148 17103 Healthcare 17587 22879 Others 57686 75041 Sub-Total 131977 170204
Source: KPMG in India analysis, Annual Survey of Industries, Census 2001 & 2011 Note: This does not include estimates of unregistered manufacturing The registered manufacturing subsectors above, account for 81% of employment in registered manufacturing, remaining is concentrated in manufacture of computer, electronic and optical products and electrical equipment Additionally, based on the inputs from the district officials, the following emerging sectors and job roles were identified which are expected to generate job opportunities in the district: • Dairy within the Agriculture sector is in huge demand and is expected to generate employment as
more and more people within the district are being inclined towards dairy farming activities. • In food processing sector, sugarcane processing is in demand. Job roles such as machine operators
are in demand and the industry is expected to generate employment for 400-500 persons per year. • The southern part of the district has requirement for training in agriculture and allied activities.
Estimation of Manpower Supply
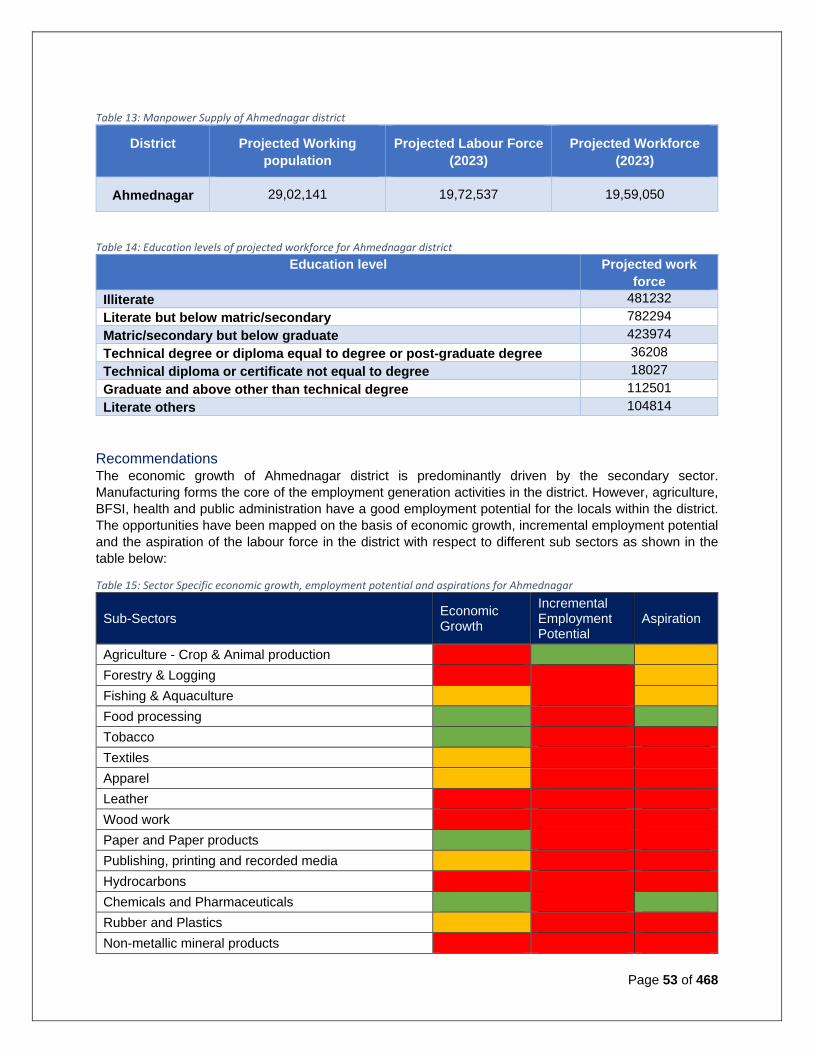
Ahmednagar district has a significant opportunity in terms of a sizeable population of the working age spectrum. By 2023, there will be about 19.59 lakh labour force participating in the labour market system of the district. Ensuring adequate skilling of the available workforce will ensure increased productivity in the district economy, thus propelling state growth.
Page 53 of 468
Table 13: Manpower Supply of Ahmednagar district
District Projected Working population
Projected Labour Force (2023)
Projected Workforce (2023)
Ahmednagar 29,02,141 19,72,537 19,59,050
Table 14: Education levels of projected workforce for Ahmednagar district Education level Projected work
force Illiterate 481232 Literate but below matric/secondary 782294 Matric/secondary but below graduate 423974 Technical degree or diploma equal to degree or post-graduate degree 36208 Technical diploma or certificate not equal to degree 18027 Graduate and above other than technical degree 112501 Literate others 104814
Recommendations The economic growth of Ahmednagar district is predominantly driven by the secondary sector. Manufacturing forms the core of the employment generation activities in the district. However, agriculture, BFSI, health and public administration have a good employment potential for the locals within the district. The opportunities have been mapped on the basis of economic growth, incremental employment potential and the aspiration of the labour force in the district with respect to different sub sectors as shown in the table below:
Table 15: Sector Specific economic growth, employment potential and aspirations for Ahmednagar
Sub-Sectors Economic Growth
Incremental Employment Potential
Aspiration
Agriculture - Crop & Animal production Forestry & Logging Fishing & Aquaculture Food processing Tobacco Textiles Apparel Leather Wood work Paper and Paper products Publishing, printing and recorded media Hydrocarbons Chemicals and Pharmaceuticals Rubber and Plastics Non-metallic mineral products
Page 54 of 468
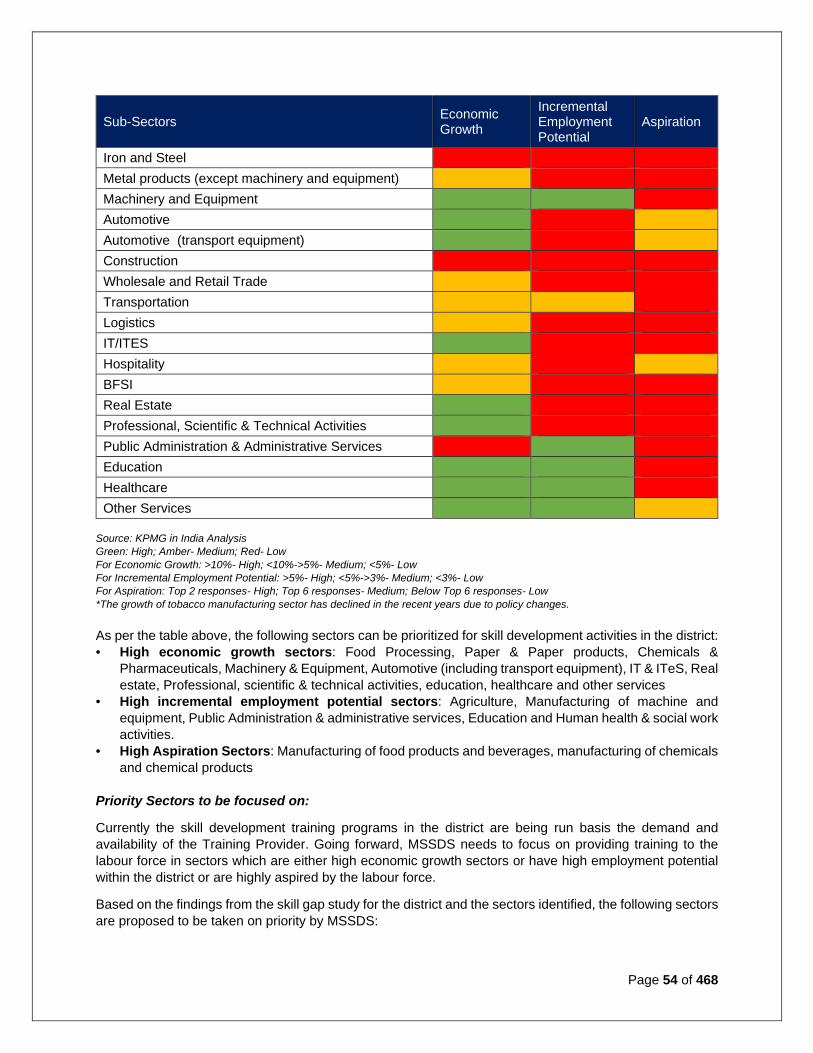
Sub-Sectors Economic Growth
Incremental Employment Potential
Aspiration
Iron and Steel Metal products (except machinery and equipment) Machinery and Equipment Automotive Automotive (transport equipment) Construction Wholesale and Retail Trade Transportation Logistics IT/ITES Hospitality BFSI Real Estate Professional, Scientific & Technical Activities Public Administration & Administrative Services Education Healthcare Other Services
Source: KPMG in India Analysis Green: High; Amber- Medium; Red- Low For Economic Growth: >10%- High; <10%->5%- Medium; <5%- Low For Incremental Employment Potential: >5%- High; <5%->3%- Medium; <3%- Low For Aspiration: Top 2 responses- High; Top 6 responses- Medium; Below Top 6 responses- Low *The growth of tobacco manufacturing sector has declined in the recent years due to policy changes. As per the table above, the following sectors can be prioritized for skill development activities in the district: • High economic growth sectors: Food Processing, Paper & Paper products, Chemicals &
Pharmaceuticals, Machinery & Equipment, Automotive (including transport equipment), IT & ITeS, Real estate, Professional, scientific & technical activities, education, healthcare and other services
• High incremental employment potential sectors: Agriculture, Manufacturing of machine and equipment, Public Administration & administrative services, Education and Human health & social work activities.
• High Aspiration Sectors: Manufacturing of food products and beverages, manufacturing of chemicals and chemical products
Priority Sectors to be focused on:
Currently the skill development training programs in the district are being run basis the demand and availability of the Training Provider. Going forward, MSSDS needs to focus on providing training to the labour force in sectors which are either high economic growth sectors or have high employment potential within the district or are highly aspired by the labour force.
Based on the findings from the skill gap study for the district and the sectors identified, the following sectors are proposed to be taken on priority by MSSDS:
Page 55 of 468
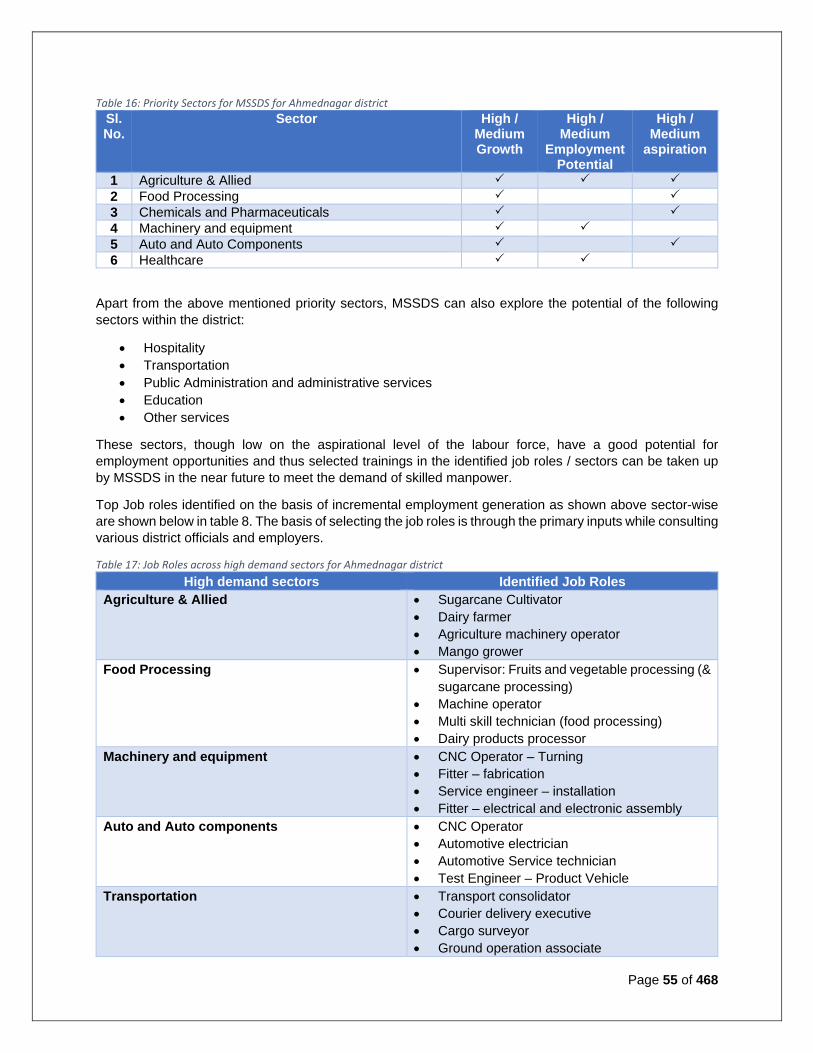
Table 16: Priority Sectors for MSSDS for Ahmednagar district Sl. No.
Sector High / Medium Growth
High / Medium
Employment Potential
High / Medium
aspiration
1 Agriculture & Allied 2 Food Processing 3 Chemicals and Pharmaceuticals 4 Machinery and equipment 5 Auto and Auto Components 6 Healthcare
Apart from the above mentioned priority sectors, MSSDS can also explore the potential of the following sectors within the district:
• Hospitality • Transportation • Public Administration and administrative services • Education • Other services
These sectors, though low on the aspirational level of the labour force, have a good potential for employment opportunities and thus selected trainings in the identified job roles / sectors can be taken up by MSSDS in the near future to meet the demand of skilled manpower.
Top Job roles identified on the basis of incremental employment generation as shown above sector-wise are shown below in table 8. The basis of selecting the job roles is through the primary inputs while consulting various district officials and employers.
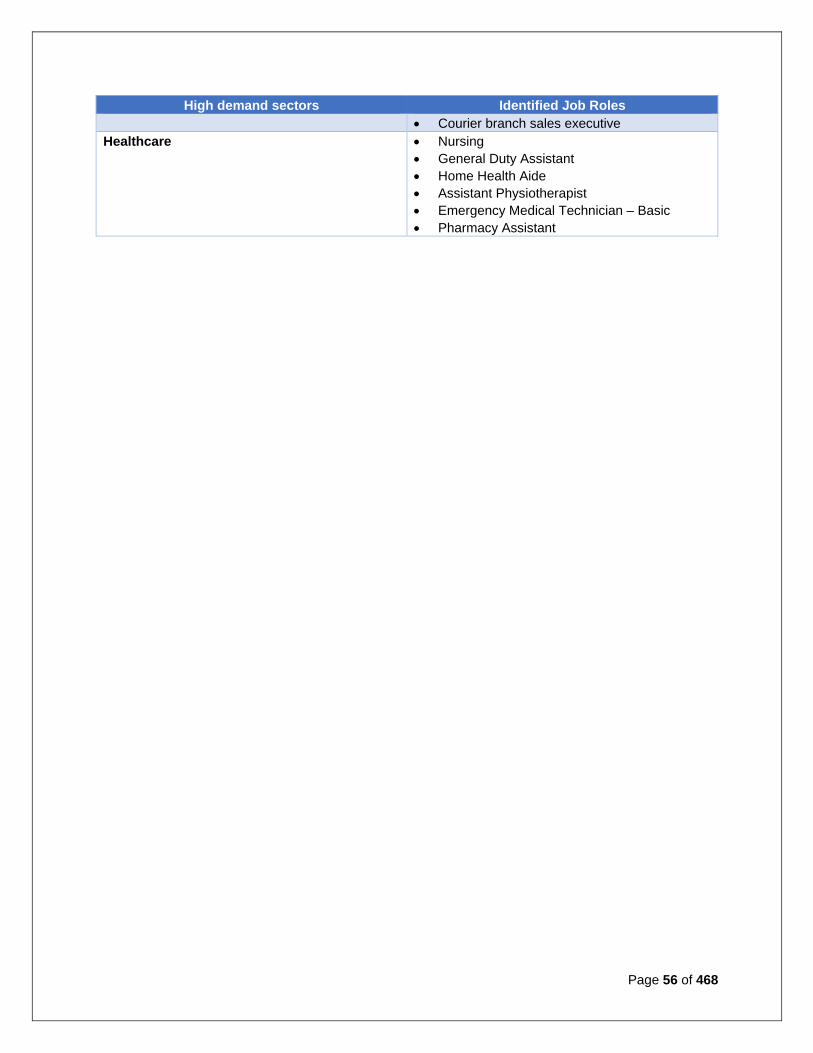
Table 17: Job Roles across high demand sectors for Ahmednagar district High demand sectors Identified Job Roles
Agriculture & Allied • Sugarcane Cultivator • Dairy farmer • Agriculture machinery operator • Mango grower
Food Processing • Supervisor: Fruits and vegetable processing (& sugarcane processing)
• Machine operator • Multi skill technician (food processing) • Dairy products processor
Machinery and equipment • CNC Operator – Turning • Fitter – fabrication • Service engineer – installation • Fitter – electrical and electronic assembly
Auto and Auto components • CNC Operator • Automotive electrician • Automotive Service technician • Test Engineer – Product Vehicle
Transportation • Transport consolidator • Courier delivery executive • Cargo surveyor • Ground operation associate
Page 56 of 468
High demand sectors Identified Job Roles • Courier branch sales executive
Healthcare • Nursing • General Duty Assistant • Home Health Aide • Assistant Physiotherapist • Emergency Medical Technician – Basic • Pharmacy Assistant