Embed Size (px)
Citation preview

BNL-67588
MICROANALYSIS OF MATERIALS USING
SYNCHROTRON RADIATION
Keith W. Jones and Huan Feng
Brookhaven National Laboratory
Upton, New York 11973
To be Published in
Chemical AoDlications of Synchrotron Radiation
Edited by
T. K. Sham
World Scientific Publishing Company, New Jersey
2000
By acceptance of this article, the publisher and/or recipient acknowledges the US Government’s right to retain a nonexclusive, royalty-free license in and to any copyright covering this paper.
1

COVER SHEET
CHEMICAL APPLICATION OF SYNCHROTRON RADIATION
(Complete form and attach to front of the original manuscript)
Title of Paper: Microanalysis of Materials Using Synchrotron Radiation
Name of Authors (in same sequence as listed on title page):
Keith W. Jones and Huan Feng
Corresponding Author
Full Name: Keith W. Jones
Full Address: Building 90 1 A Brookhaven National Laboratory Post Office Box 5000 Upton, NY 11973-5000 USA
Telephone Number: 63 l-344-4588
Fax Number: 63 1-344-5271
e-Mail: [email protected]
Keyword for Paper (maximum of six): Synchrotron radiation, x-ray fluorescence, diffraction, tomography

Microanalysis of Materials Using Synchrotron Radiation
Keith W. Jones and Huan Feng
Building 90 1 A
Brookhaven National Laboratory
Post Office Box 5000
Upton, New York 11973-5000
3

. .
Introduction
Basic Approaches
Table of Contents
Synchrotron x-ray production
X-ray cross sections
Synchrotron-radiation-induced x-ray emission (SRIXE)
Extended x-ray absorption fine structure (EXAFS) and extended x-ray absorption near-
edge structure (XANES)
Computed microtomography (CMT)
Sample radiation damage effects
Applications
Biological applications
Reversible effect of low lead levels on neuronal growth
Analysis of zinc binding capabilities of a protein domain
Stroke and calcium concentrations in the brain
Studies of bone and cartilage
Geological and extraterrestrial materials
Microstructure of shocked-recovered Berea sandstone
Internal structure of two type-1 deep-sea spheres by x-ray computed microtomography
1
2
2.1
2.2
2.3
2.4
2.5
2.6
3
3.1
3.1.1
3.1.2
3.1.3
3.1.4
3.2
3.2.1
3.2.2
3.2.3 Hydrothermal vents
3.2.4 Investigation of New York/New Jersey Harbor dredged material

. L
3.3
3.3.1
3.4
3.4.1
3.4.2
3.4.3
4
5
6
7
8
9
Environmental chemistry
Secondary ion mass spectroscopy and synchrotron x-ray fluorescence in the study of the
qualitative variation in metal content with time in tree rings
Materials analysis
Thermal spray
Study of supported catalysts
Investigation of integrated circuit structures using CMT and microdiffi-action
Summary
Acknowledgements
References
Table
Figure captions
Figures
5

1. Introduction
High intensity synchrotron radiation produces photons with wavelengths that extend from
the infrared to hard x rays with energies of hundreds of keV with uniquely high photon
intensities that can be used to determine the composition and properties of materials using a
variety of techniques. Most of these techniques represent extensions of earlier work performed
with ordinary tube-type x-ray sources. The properties of the synchrotron source such as the
continuous range of energy, high degree of photon polarization, pulsed beams, and photon flux
many orders of magnitude higher than from x-ray tubes have made possible major advances in
the possible chemical applications.
We describe here ways that materials analyses can be made using the high intensity
beams for measurements with small beam sizes and/or high detection sensitivity. The relevant
characteristics of synchrotron x-ray sources are briefly summarized to give an idea of the x-ray
parameters to be exploited. The experimental techniques considered include x-ray fluorescence,
absorption, and diffraction. Examples of typical experimental apparatus used in these
experiments are considered together with descriptions of actual applications.
A number of similar reviews have been published in the past. A comprehensive survey of
the overall field of synchrotron research was given in a book edited by Winick and Doniach’
about 20 years ago. Obviously, there have been massive changes in this rapidly growing field
since that time; nevertheless, the different chapters in this collection remain a very valuable
introductory survey covering the basics of the production and use of synchrotron radiation.
Recent reviews have been given that are more specialized and are thus perhaps more relevant to
the topics considered here*-“.
6

In considering applications that are appropriate for consideration in this survey, we had
recourse to a dictionary definition of chemistry: “the science dealing with the composition and
properties of substances, and with the reactions by which substances are produced from or
converted into other substances.“” The application of x-ray microbeams or other imaging
technologies that measure elemental composition or structure will fit this very broad definition.
Thus, we have felt free to discuss topics that might reasonably be included in materials sciences,
earth and planetary sciences, biomedical sciences, and environmental science--if a very
specialized view is taken.
Our main emphasis will be on the use of high-energy (> 1 keV) x rays that can be used to
investigate elemental compositions with excellent spatial resolutions and low detection limits
using two techniques. One technique uses synchrotron radiation-induced x-ray emission
(SRIXE). This acronym is chosen in preference to the acronym x-ray fluorescence (XRF) to
emphasize relationship with the analogous particle induced x-ray emission (PIXE) technique.
The other technique is that of computed microtomography (CMT) which is based primarily on
the measurement of the absorption of the x-ray beam in a sample. CMT gives a means of non-
invasively measuring a volume in the sample and determining the varying composition in a
heterogeneous material.
There is now a large literature describing experiments based on the techniques of SRIXE
and CMT. We have emphasized work done at the Brookhaven National Laboratory (BNL)
National Synchrotron Light Source (NSLS), but have also included descriptions of work done at
other synchrotron laboratories around the world. This is a very selective description of the field,
and no effort was made to produce a complete bibliography that covered all experiments
performed.
7
2. Basic Approaches
2.1 Synchrotron x-ray production
The synchrotron x-ray source has been developed over the course of many years. Various
stages of development have been described as Generations 1,2,3, and 4. At present, we are in
an era when both Generation 2 and Generation 3 facilities are in operation and development work
for Generation 4 facilities is in progress. From the standpoint of the facility user, it is not
necessary to have a very detailed knowledge of the operation of a synchrotron. Rather, the
important need is to define the beams supplied to the end user. The beams are produced as the
electron beam in the synchrotron passes through a bending magnet used to contain the circulating
beam or through undulator or wiggler insertion devices which can be used to increase the beam
intensity or shift the energy to higher values. A very broad definition of the difference between
the second- and third-generation x-ray sources is that the third-generation source has been
engineered to maximize the use of insertion devices.
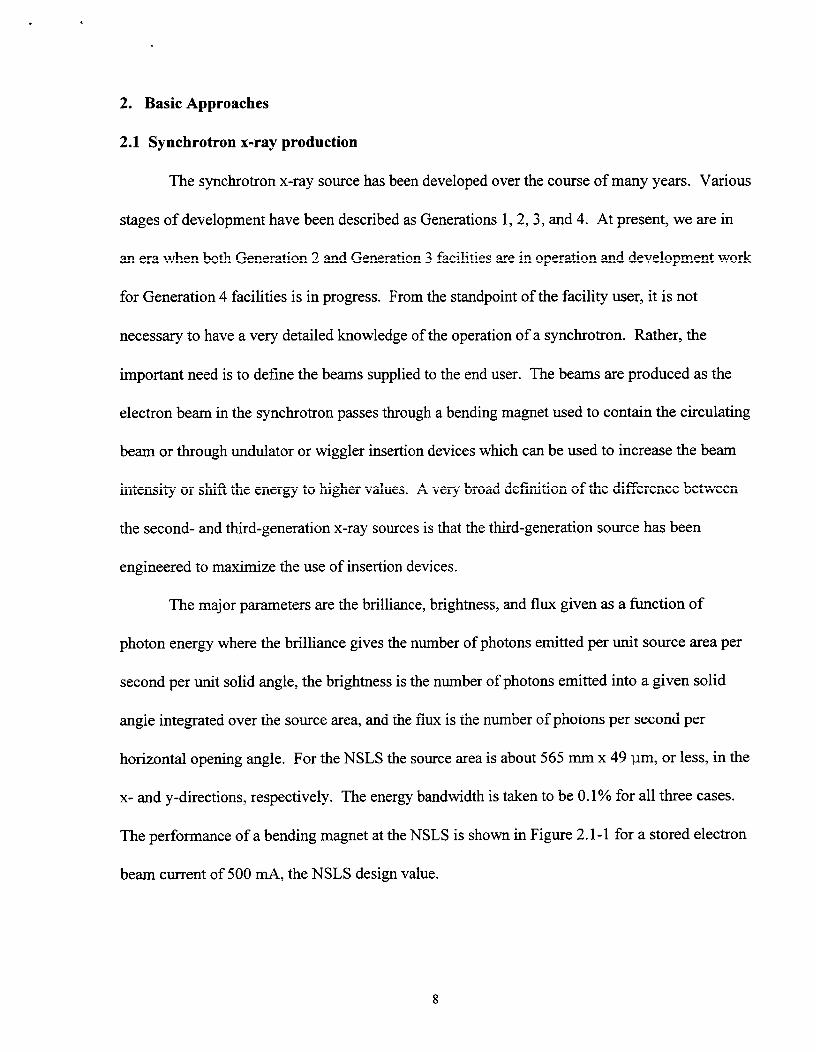
The major parameters are the brilliance, brightness, and flux given as a function of
photon energy where the brilliance gives the number of photons emitted per unit source area per
second per unit solid angle, the brightness is the number of photons emitted into a given solid
angle integrated over the source area, and the flux is the number of photons per second per
horizontal opening angle. For the NSLS the source area is about 565 mm x 49 urn, or less, in the
x- and y-directions, respectively. The energy bandwidth is taken to be 0.1% for all three cases.
The performance of a bending magnet at the NSLS is shown in Figure 2. l-l for a stored electron
beam current of 500 mA, the NSLS design value.
8

The source distance for the x-ray microprobe located on the NSLS X26A beam line is 10
m. The x rays passing through a 1 urn x 1 urn aperture can then be estimated as about 6 x 10’
1 0-keV photons/s/O. 1% bandwidth at 500 mA by reference to Figure 2. l-lb. An increase in
beam intensity can be achieved by either increasing the bandwidth or using a focusing device to
reduce the size of a beam that has been defined by a larger aperture.
2.2 X-ray cross sections
A knowledge of cross sections for the interaction of x-ray beams with matter is often
useful in designing synchrotron experiments and for the interpretation of experimental results. A
convenient compendium of relevant information is provided by the National Institute of
Standards and Technology’*.
2.3 Synchrotron-radiation-induced x-ray emission (SRIXE)
SRIXE is used to determine elemental concentrations through the detection of
characteristic x rays produced by the interaction of the synchrotron x-ray beams with a sample
material. The main concern from an experimental standpoint is to balance the need for high
spatial resolution for the analysis of heterogeneous materials with the conflicting requirement for
obtaining the best possible detection limits.
The SRIXE apparatus consists of basically four components: first, monochromators,
collimators and focusing lenses for producing a microbeam; second, a computer-controlled
sample stage for point-by-point mapping the elemental spatial distributions; third, a suitable x-
ray detection system such as a lithium-drifted silicon x-ray detector.

The simplest approach to the solution of this problem is to rely on a pinhole collimator
for production of a microbeam. We can easily make a rough estimate of the number of
characteristic x rays produced. Assume that a 1 pm x 1 pm beam irradiates 1 fg of Fe (1.08 x 10’
atoms) with 6 x lo5 lo-keV photons/s (see above) and the fluorescent Fe K-x rays are detected
with a 30-mm2 Si(Li) detector placed 4 cm from the sample at 90 degrees to the incident beam.
The detector counting rate for the Fe-x rays is then 20 counts per second. A white beam can be
used to eliminate the need for the monochromator and to maximize the number of available
photons. The presence of a background of scattered photons will, of course, affect the minimum
detection limits that can be achieved. This approach has been used at the NSLS for a number of
years with great success’ and does show that detection limits around 1 fg can be reached.
The addition of a monochromator for production of a monoenergetic beam is desirable,
but results in a concomitant reduction in the photon flux. This then necessitates the use of a
compensating focussing element to increase the photon flux at the sample. A discussion and
summary of the different focusing methods that have been employed has been given recently by
Hayakawa and Gohshi’.
One of the commonly-used devices was developed many years ago by Kirkpatrick and
Baez13. An initial demonstration experiment using the Kirkpatrick-Baez (KB) mirror system was
carried out at the NSLS by a team from Lawrence Berkeley National Laboratory, University of
Chicago, and BNL14. The results showed that it was possible to achieve excellent spatial
resolution, approximately 10 urn x 10 urn, and minimum detection limits as low as 2 fg on a
bending magnet source at a beam energy of 10 keV and a band-pass of 1 keV. The photon flux
was about 3 x 10’ photons/s at a source distance of 20 m and a 0.5 mm x 0.5 mm object size. The
detection limits obtained under these conditions are shown in Table 1.
10

A similar system has been placed in operation by the University of Chicago” on another
NSLS bending magnet beam line with an experimental station at 10 m from the source position.
The KB mirrors in this case are designed to work in conjunction with monoenergetic x rays
produced by a Si monochromator. They have a heavy metal coating to enhance the reflectivity
for high-energy x rays. A schematic diagram of the beam line is shown in photograph of the
apparatus is given in Figure 2.3-l. A photograph of the apparatus is given in Figure 2.3-2. The
spatial resolution of the system is typically 10-l 5 urn obtained with an object size of 350 pm.
The x-ray flux is about lo9 photons/s/pm*/O.l% bandwidth.
Typical x-ray spectra measured with the KB system for National Bureau of Standards
Standard Reference Materials (SRMs) 1832 and 1833 are shown in Figure 2.3-3. These
standards are glass films 0.55 pm thick with known trace-element concentrations. SRM 1832
contains Na, Al, Si, Ca, V, Mn, Co, and Cu. SRM 1833 contains Si, K, Ti, Fe, Zn, and Pb. The
spectra were obtained using a beam energy of 16.95 keV and an acquisition time of 15 minutes.
As an example, estimated minimum detection limits are 1- 10 ppm.
The Chicago group has recently reported on a similar system now in operation at the
Argonne Advanced Photon Source (APS). There it was possible to take advantage of an
undulator source to produce x-ray fluxes which are not only much higher than those from the
NSLS bending magnets but which also cover a much broader energy range. This makes feasible
the measurement of rare earth elements using K-x rays thereby eliminating interference from
transition element K-x rays found when it is necessary to use L-x rays. A photograph of the APS
system is shown in Figure 2.3-4. The x-ray detection efficiency is also enhanced by use of a 13-
element Ge detector system. The object size for the KEI mirror system is 350 pm x 350 pm. A
measurement of the spatial resolution obtained, about 0.8 pm, is shown in Figure 2.3-5. The
11

photon flux of the APS system is 1 O’* photons/s/vm*/O. 1% bandwidth with a minimum detection
limit of about 10 ag. Thus, there is an improvement over the NSLS instrumentation of about a
factor of a thousand for minimum detection limits and a factor of 10 to 20 for the spatial
resolution.
The use of tapered capillary focusing is another approach that has been developed by
several groups. Bilderback et al-l6 showed that it was possible to obtain spatial resolutions of
about 0.1 pm. Riekel et al.” working at the European Synchrotron Research Facility @RF) and
Cargill and Noyan et a1.18 working at the NSLS have both produced x-ray microprobes based on
capillary focussing and applied them to microdiffraction experiments. The Riekel group used an
undulator source, Si monochromator, and a tapered capillary which reduced the beam size to
about 2 pm. The photon flux was about 2 x 10” photons/s&m* for a photon energy of 13 keV.
2.4 Extended x-ray absorption fine structure (EXAFS) and extended x-ray absorption
near-edge structure (XANES)
Extended x-ray absorption fine structure (EXAFS) and extended x-ray absorption near-
edge structure (XANES) experiments are well known techniques for measuring the redox state of
elements and determining their nearest neighbors in chemical compounds. The basis of these
methods have been presented by Brown and Doniachlg, Brown*‘, Lytle, Via, and Sinfelt*l,
Doniach, Eisenberger, and Hodgson**, Koningsberger and Prins23, and Fendoti4.
2.5 Computed microtomography (CMT)
Computed microtomography (CMT) is a non-destructive technique which can be used to
determine the microstructure of materials with best spatial resolutions of the order of 1 pm. The
12

structures can be defined in terms of either the x-ray absorption coefficients or in terms of
elemental concentrations. The techniques have been intensively developed for many years for
application in medical diagnostics and for industrial applications. High intensity synchrotron x-
ray beams have made it possible to extend the applicability to voxel sizes in the 1 pm3 range and
simultaneously maintain reasonable data acquisition times.
Early work in the field was carried out by several groups. Spanne and Rivers25 described
a first-generation apparatus that was based on a pencil x-ray beam formed by a collimator. Data
were then obtained by scanning the beam across the sample combined with measurements at
different sample angles with respect to the beam at each position. D’Amico et al. 26 , Flannery et
a12’ , Bonse et al. 28 , and Kinney et a1.2g used a third-generation apparatus that eliminated the
need for translation of the sample through the beam by use of an area detector which recorded the
transmission of a beam that covered the entire sample.
More recently, a third-generation apparatus was put into operation at the NSLS by Dowd
et al. 30,3’ A schematic diagram of the apparatus is shown in Figure 2.5-l and a photograph of the
apparatus in Figure 2.5-2. The x rays are detected with a thin scintillator of CsI(Na) or YAG:Ce.
A mirror/lens system is used to focus light from the scintillator on the CCD camera. Blurring
effects caused by scattering of the x rays in the scintillator are minimized by the small depth-of-
field of the magnifying lens. The spatial resolution of the system is estimated at 1.7 pm. The
CCD cameras used employed CCD chips with 13 17 x 1035 and 3072 x 2048 pixels. In practice,
the pixels are often binned to reduce the size of the tomographic volumes and thereby ensure
practicable times for data acquisition and reconstruction. A monochromator can be used to select
x-ray energies from 5.5 to 36 keV. Filtered white beam can be used to obtain higher x-ray
13
intensities and to make measurements at higher energies. The total time for these two steps is
about 1 hour for a 2563 volume.
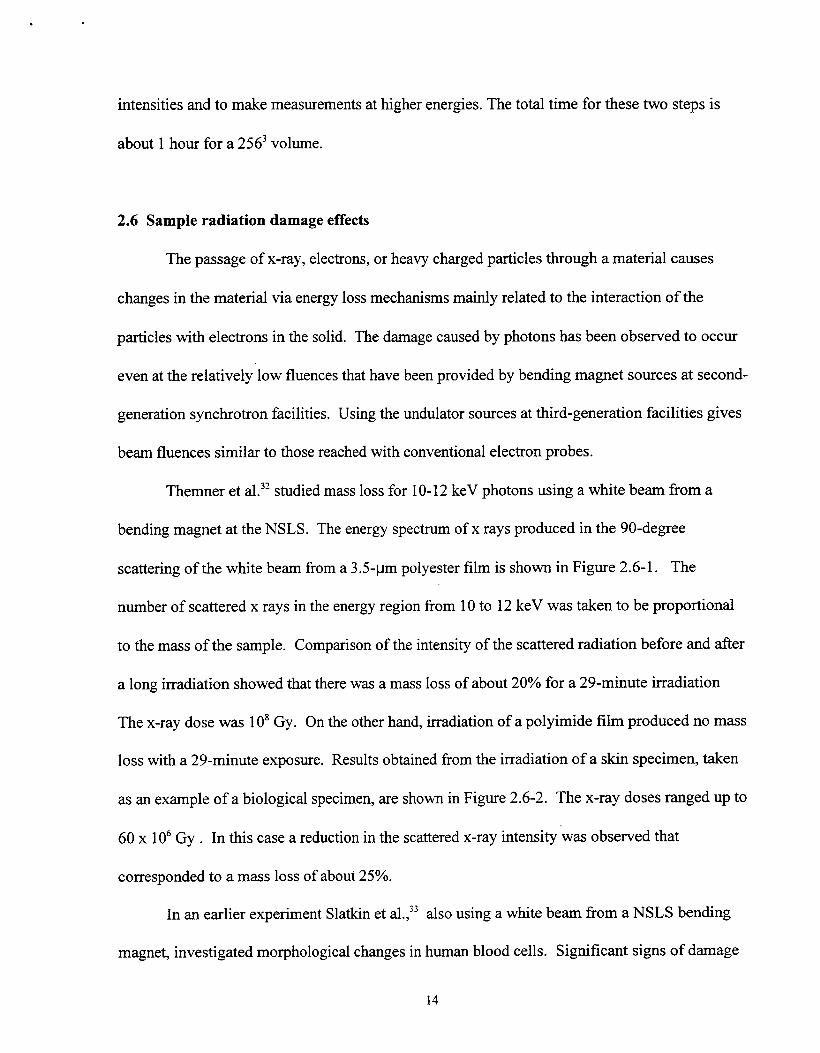
2.6 Sample radiation damage effects
The passage of x-ray, electrons, or heavy charged particles through a material causes
changes in the material via energy loss mechanisms mainly related to the interaction of the
particles with electrons in the solid. The damage caused by photons has been observed to occur
even at the relatively low fluences that have been provided by bending magnet sources at second-
generation synchrotron facilities. Using the undulator sources at third-generation facilities gives
beam fluences similar to those reached with conventional electron probes.
Themner et al.32 studied mass loss for 1 O-12 keV photons using a white beam from a
bending magnet at the NSLS. The energy spectrum of x rays produced in the 90-degree
scattering of the white beam from a 3.5~pm polyester film is shown in Figure 2.6-l. The
number of scattered x rays in the energy region from 10 to 12 keV was taken to be proportional
to the mass of the sample. Comparison of the intensity of the scattered radiation before and after
a long irradiation showed that there was a mass loss of about 20% for a 29-minute irradiation
The x-ray dose was 10’ Gy. On the other hand, irradiation of a polyimide film produced no mass
loss with a 29-minute exposure. Results obtained from the irradiation of a skin specimen, taken
as an example of a biological specimen, are shown in Figure 2.6-2. The x-ray doses ranged up to
60 x lo6 Gy . In this case a reduction in the scattered x-ray intensity was observed that
corresponded to a mass loss of about 25%.
In an earlier experiment Slatkin et al.,j3 also using a white beam from a NSLS bending
magnet, investigated morphological changes in human blood cells. Significant signs of damage
14

were found after exposure to 10” photons/pm2. This value is similar to the value of 8 x 10”
photon fluence estimated for the case of the skin irradiation.
Mass loss or morphological change are probably somewhat crude measures of the
damage caused by the synchrotron beam. Diffraction experiments are well known to be affected
by radiation-induced changes in the sample structure. Singer et a1.34 examined Laue diffraction
patterns of orthorhombic trypsin, tetragonal hen egg-white lysozyme, and hexagonal glutathione
synthase on NSLS bending magnet and 25-pole wiggler beam lines. A series of exposures were
taken in order to simulate a dynamic experiment. Measurements of trypsin crystals were found
to be very radiation resistant and glutathione synthase very radiation sensitive and were found to
be damaged in a single exposure of 125 ms on the wiggler beam line.
In another experiment, a collaboration between ESRF, BNL, and the University of
Massachusetts (C. R. Riekel and P. Engstrom, ESRF; K. W. Jones, BNL; and W. C. Connor, Jr.,
University of Massachusetts) examined the crystallinity of thin sections of polyethylene
polymerization particles at the ESRF beam line described above. In this case it was found that
crystallinity was destroyed in an irradiation time of about 1 minute.
Taken together, these experiments show that radiation damage effects can be of
importance in affecting the results of synchrotron experiments. The amount of damage to a
sample will depend on the irradiation conditions and the chemical composition and physical state
of the sample. This damage is of importance even at relatively low fluxes from the NSLS and
certainly will deserve increased attention at the higher fluxes from the APS, ALS, and other
similar storage facilities.
15

3. Applications
3.1 Biological applications
There are many ways that synchrotron radiation is used for study of biological
materials. The most prominent example is the application of x-ray diffraction methods for
determination of protein structures. This is an extremely active field of research pursued at many
synchrotron facilities by scientists from universities, industrial, and government laboratories.
The high fluxes and time structure of the x-ray beams from the synchrotrons have been effective
in reducing data acquisition times and making kinetic measurements feasible on very small
samples. We have chosen to exclude this field from consideration in this review since its scope
precludes a reasonable summary in the space available.
We have, instead considered other applications where analysis of small biological
samples with synchrotron x-ray beams is a useful experimental approach that complements more
traditional methods. The techniques involved are SRIXE and CMT. Applications of SRLXE are
given for elemental analysis of tissue samples where the quantity of tissue is not large enough for
easy use of atomic absorption spectroscopy or inductively-coupled plasma mass spectrometry
and of CMT for determination of the structure of bone and teeth.
3.1.1 H. T. Cline, S. Witte, and K. W. Jones. Reversible effect of low lead levels on
neuronal growth3’
Lead is a toxic metal that represents a major public health problem for several reasons.
In particular, it affects the development of the brain in children and can cause learning
disabilities and behavioral problems that include deficits in visual system function. Questions
about lead toxicity include determination of the exposure that causes neurological damage and
16
whether or not this damage is reversible. These questions were investigated by considering the
development of visual projection in frogs including neuronal growth, synaptic transmission, and
the maintenance of topographic retinotectal projections. In addition, an assessment was made of
the relative effects of using the chelating agent 2,3 dimercaptosuccinic acid (DMSA) to reverse
the effect of lead exposure on neuronal growth as compared to the effect produced by the simple
removal of the lead source from the animal.
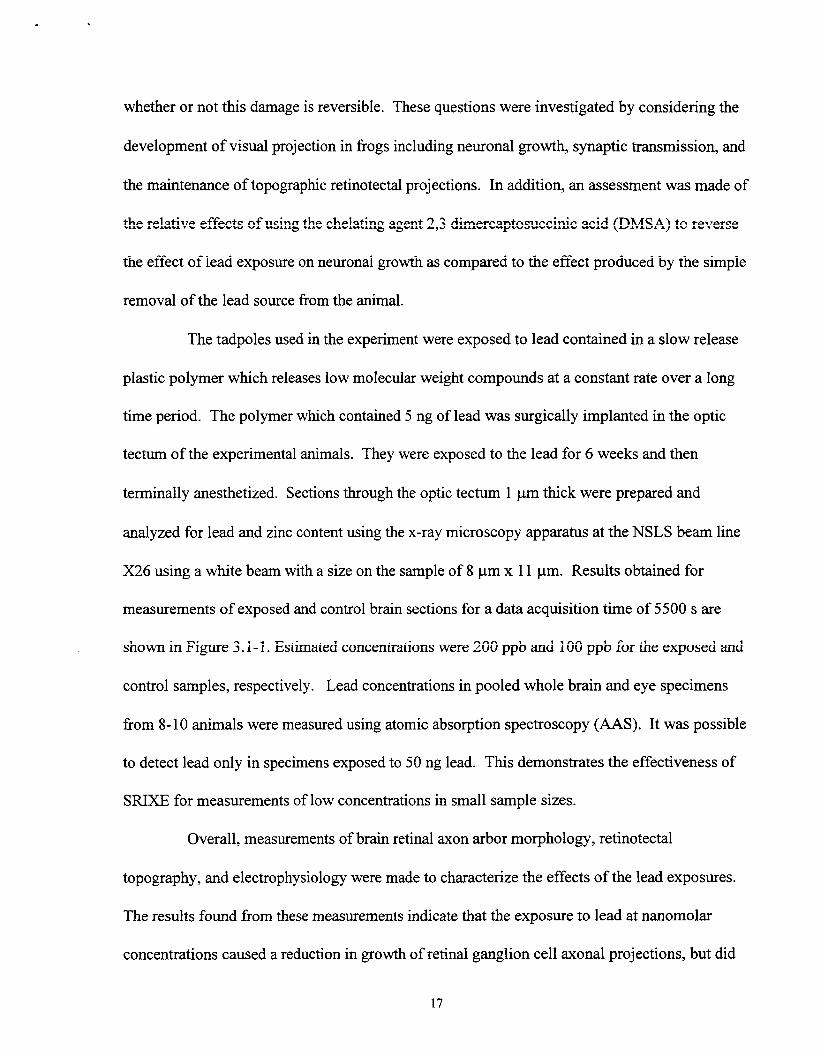
The tadpoles used in the experiment were exposed to lead contained in a slow release
plastic polymer which releases low molecular weight compounds at a constant rate over a long
time period. The polymer which contained 5 ng of lead was surgically implanted in the optic
tectum of the experimental animals. They were exposed to the lead for 6 weeks and then
terminally anesthetized. Sections through the optic tectum 1 pm thick were prepared and
analyzed for lead and zinc content using the x-ray microscopy apparatus at the NSLS beam line
X26 using a white beam with a size on the sample of 8 pm x 11 pm. Results obtained for
measurements of exposed and control brain sections for a data acquisition time of 5500 s are
shown in Figure 3. l-l. Estimated concentrations were 200 ppb and 100 ppb for the exposed and
control samples, respectively. Lead concentrations in pooled whole brain and eye specimens
from S-10 animals were measured using atomic absorption spectroscopy (AAS). It was possible
to detect lead only in specimens exposed to 50 ng lead. This demonstrates the effectiveness of
SRIXE for measurements of low concentrations in small sample sizes.
Overall, measurements of brain retinal axon arbor morphology, retinotectal
topography, and electrophysiology were made to characterize the effects of the lead exposures.
The results found from these measurements indicate that the exposure to lead at nanomolar
concentrations caused a reduction in growth of retinal ganglion cell axonal projections, but did
17

not change the topographic organization of the retinotectal projection. The effects are greater
than previously observed at the low lead concentrations used in this.experiment. It is argued that
development of nervous systems in amphibians and humans relies on similar cellular
mechanisms and that, as a consequence, lead-induced cognitive defects in humans could be
traced, at least in part, to changes in neuronal growth caused by the exposure. Finally, treatment
with DMSA was shown to effectively reverse the effect of lead on neuronal growth whereas
removal of the lead source did not. This finding is important since it supports the use of DMSA
chelation therapy in children.
3.1.2. T. Pfister, E. Wimmer, K. W. Jones and H. Feng. Analysis of zinc binding
capabilities of a protein domain36737
Poliovirus is the causative agent of poliomyelitis and is a prototypical member of the
Picomaviridae, a family of small, icosahedral viruses containing a single positive-sense RNA
moleculethat encodes structural and non-structural proteins. The non-structural protein 2C of
poliovirus is an ATPase and contains the motifs characteristic for superfamily 3 helicases.
However, helicase activity has not been found. Protein 2C has been reported to be involved in
RNA replication, virus assembly and rearrangement. of the host cell membranes. The molecular
mechanisms that underlie the diverse involvement of protein 2C are not known. In the present
study we focused on a cysteine-rich motif near the carboxy terminus of poliovirus protein 2C.
Genetic evidence indicated that the cysteine-rich motif is required for a function of 2C in RNA
replication. The sequence of the motif is CKNCHQPANFKRCCPLVC. The arrangement of the
cysteine residues resembles that of zinc finger proteins in which one zinc atom is coordinated by
four thiol groups.
18

SRIXE was used to test for the ability of the cysteine-rich motif to bind zinc. The
cysteine-rich motif fused with the carboxy terminus of glutathione S-transferase (GST-CRT was
expressed in Escherichia coli and purified on glutathione-sepharose beads. The eluted protein
was applied in solution onto hydrophobic membranes3* and the emission spectrum was recorded.
GST (GST) and GST fused to the motif of which all cysteine residues were replaced by serine
residues (GST-CRmU? were used as negative controls. GST fused to the proximal zinc finger
motif of the human transcription factor 3A (GST-ZF3A) was used as a positive control. The data
indicated that GST alone bound zinc. However, the amount of zinc bound to GST-ZFM and
GST-ZF3A was significantly higher than that of GST and GST-ZF4. Quantification of zinc
suggested that GST binds one zinc atom by itself and the cysteine-rich motif binds an additional
zinc atom. We suggest that SRIXE is a powerful method to detect zinc and other atoms in
proteinaceous samples. The high sensitivity of SRIXE and the small protein sample required is
especially advantageous when only a small amount of the target protein is available. In
combination with the widely used GST expression system, two major advantages became
apparent. First, GST fused to small protein domains are usually expressed to large amounts and
their easy to purify features are often not observed with full-size proteins. Second, the method
not only allows us to address metal binding capabilities of a protein, but, also, metal binding
capabilities of a particular domain within a protein.
19

.
3.1.3 G. C. Newman, S. Trowbridge (Northport VAMC, SUNY/Stony Brook, Department
of Neurology, School of Medicine), and K. W. Jones (BNL). Stroke and calcium
concentrations in the brain39
There are wide reaching disturbances of Ca*’ metabolism under conditions of ischemia.
At ischemia onset, there is depolarization of the tissue with release and accumulation of
glutamate and K’ in the extracellular space (ECS). Early depolarization results in a rise of free
cytoplasmic Ca*’ due to release of Ca*’ from intracellular stores and influx from ECS. As
hypoxia limits ATP generation and acidosis results from the anaerobic glycolysis which
accelerates in an effort to compensate, Ca*’ cannot be properly sequestered and concentration
gradients in the cell gradually disintegrate. As Ca*’ rises toward 5 PM in the cytoplasm, the
mitochondria develop membrane pores which permit free movement of all molecules less than
1000 MW. Eventually, ischemic brain undergoes anoxic depolarization with massive release of
K” into the ECS and entry of Ca*’ into the cell.
The present experiment was designed to test the hypothesis that tissue Ca*’ is regulated
independent of extracellular Ca*’ concentration. Brain slices isolated from rat hippocampus were
incubated in buffers with a range of Ca*’ concentrations from 4.5 m.M to 0.001 n&I. Buffer Ca*’
was labeled with 45Ca. A volume of distribution for 45Ca was calculated at each buffer Ca*’ , and
total tissue Cd’ can be calculated from that volume. Contrary to expectations, based on the
experiments with 45Ca, it appears that the volume of distribution remains nearly constant from
4.5 mM to below 0.5 n-&i so that tissue Ca” is directly related to extracellular Ca*‘. Even below
0.5 mM external Ca*‘, the rise in the volume of distribution is not very great so that the
relationship between tissue and buffer Ca*’ remains very nearly linear. In this experiment, it is
assumed that 1) all tissue Ca*’ pools are labeled by 45Ca during the one-hour incubation with
20
.
isotope or at least that 2) the fraction of labeled tissue Ca2’ remains constant at all buffer Ca2’.
Either or both of these assumptions may be incorrect. There is need, therefore, to measure tissue
Ca2’ independently of radiolabeling by exchange equilibrium and thus determine the fraction of
tissue Ca” which equilibrates as a function of buffer Ca2’.
The approach we chose was to repeat the slice incubations to create the concentration
response curve, but without 45Ca in the buffer and to measure tissue Ca2’ SRIXE which has high-
spatial resolution combined with excellent minimum detection levels. Measurements were made
on 450~pm thick sections of rat hippocampus for buffer concentrations from 0 to 4.5 mM. The
Ca concentrations were normalized to the tissue K concentrations to remove uncertainties arising
from variations in tissue thickness.
These experiments suggest that the assumption that 45Ca labels either all or a constant
fraction of Ca2’ is not valid. Certainly the results suggest that when buffer Ca2’ is below 1 n&f, a
significant portion of the tissue Ca2’ is not labeled by 45Ca. A rough estimate of the size of the
unlabeled Ca2’ pool is about 0.1 r&l. Questions surrounding the 45Ca measurements take on
greater significance in light of our recent finding that, in brain slices, ischemic injury is
accompanied by irreversible uptake of 45Ca in a tissue compartment. The nature of the
compartment may hold an important clue for how Ca” contributes to irreversible tissue injury in
ischemia.
3.1.4 Studies of bone and cartilage
Measurements of the elemental composition of bone and cartilage are important for
achieving better understanding of age-related changes in structure and chemistry and for
understanding the fate and transport of toxic elements such as lead or elements used for
21

therapeutic purposes. A number of related studies have been carried out at the BNL X26 beam
line to investigate these points.
Yasamura et a1.4o used CMT, SRIXE, photon and neutron activation analysis, and whole
body counting of 40K to investigate changes in the femur of rats aged 6, 12, and 24 months.
results showed that there were changes in both the bone morphology and regional chemical
composition as a function of age. It was also pointed out that the use of CMT for structure
determinations could be applied in vivo so that longitudinal studies could be carried out for
studies of effects of treatment for disease or other reasons.
The
Bockman et a1.4’ investigated the uptake of gallium nitrate in rats. This compound has
been used for treatment of cancer patients suffering from accelerated bone resorption. Samples
of rat tibia for analysis were obtained from animals treated with gallium nitrate in doses
comparable to those used for treatment of human patients. Maps of the distribution of gallium
and other elements were obtained using SRIXE. It was found that the gallium was preferentially
absorbed in metabolically active regions in the metaphysis and in the endosteal and periosteal
surfaces of diaphyseal bone where new bone formation and modeling occur. Theresults imply
that the gallium enhances osteoblast function and decreases osteoclastic activity on a local scale.
Changes in the iron and zinc concentrations also observed may help in searching for more
refined explanations on a molecular level.
Similar experiments have been carried out to investigate the absorption of lead in
bone42A4. Lead, even now, represents a serious threat to human health in the United States and
elsewhere. Lead accumulates in the skeleton and is stored there with a residence time of one to
two decades. Remodeling of the bone can cause release of the lead and thereby expose other
organs of the body over long time periods. Maps made on sections of rat tibia indicate that the
22

lead is located in a manner similar to that found for gallium. Changes in the morphology of the
bone were also found to be caused by the lead exposure44 .
The elemental distributions in growth plate cartilage from calf scapula and normal and
arthritic equine cartilage were measured in a collaboration between groups from the University of
Trieste and BNL.45 The growth plate measurements involved determinations of the major
elements (Ca and S) and trace elements (Ni, Cu, Zn and Sr). The distribution of Ca was
consistent with known concepts of bone formation. S distributions are assumed to reveal the
concentration of the S-containing proteoglycan molecules, and the Zn atoms are presumed to be
bound to molecules of alkaline phosphatase. The Cu distribution was found to have a uniform
distribution over the different zones of cartilage examined. This is consistent with assignment to
lysil oxidase, an enzyme involved in collagen synthesis. Ni distributions were similar to those
found for Ca. However, it was not clear what the biological role of this element was. The
measurements on equine cartilage were similar in approach with measurements made on S, Ca,
and Zn. In this study, marked differences are observed for the concentrations of these elements
in the several components of the cartilage. It is also argued here that the zinc is present in the
enzyme alkaline phosphatase.
The SRIXE approach makes possible multi-element maps at the trace element
concentration level on the cartilage structure at a cellular size scale. The results obtained are in
agreement with conclusions drawn from use of biochemical methods. In the future, aside from
the implications of the biochemical results obtained, the microanalytical properties of SIUXE
should result in its wide acceptance as a general tool for study of bone and cartilage.
23

3.2 Geological and extraterrestrial materials
Synchrotron x-ray techniques including SRIXE, CMT, XANES/EXAFS, and diffraction
have been widely employed for the characterization of geological materials. Our work at the NSLS
covers several topics which illustrate this point. The main emphasis is on the use of CMT.
3.2.1. H. Feng and K. W. Jones, Brookhaven National Laboratory; C. R. Hagelberg, Los
Alamos National Laboratory; and M. Hiltl, Lawrence Livermore National
Laboratory. Microstructure of shock-recovered Berea sandstone
The microstructure of shocked geological materials is of great interest. For example, data
describing the three-dimensional pore structure of rocks can be used as input for making better
models for predicting fluid flow in porous media which in turn can help in developing methods
for improved techniques for oil and gas recovery. Another need is to obtain better understanding
of changes in the structure when a shaped-charge is used to perforate an oil well casing to
provide connectivity to the reservoir rock. We investigated samples obtained from shock-
recovery experiments46 performed at LLNL using a single-stage light-gas gun and analyzed them
using synchrotron CMT at BNL with a voxel size of 3.6 pm. It is possible to distinguish the
differences between the undamaged (Figure 3.2-l) and shocked (Figure 3.2-2) materials and to
explore the transition region between the two regions. Porosity measurements of the two regions
give values of 21 .O% and 13.3% for the undamaged and shocked regions, respectively. The
value for the undamaged material is in agreement with the accepted value of 21.92%. Detailed
analysis of the tomographic data is now in progress to give the depth dependence of the porosity
and to investigate the connectivity of the pore structure through the interface region. The use of
24
synchrotron CMT is a useful complement and extension to analyses obtained with scanning
electron microscopy and laser scattering techniques.
3.2.2 H. Feng, K. W. Jones (BNL), G. F. Herzog, C. Schnabel (Rutgers University), and
D. E. Brownlee (University of Washington, Seattle). Internal structure of two type-1
deep-sea spheres by x-ray computed microtomography4’
CMT at high resolution makes it possible to explore the three-dimensional structures of
small and scarce extraterrestrial objects such as micrometeorites. In particular, an experiment to
ascertain the structure of the interiors of a subclass of micrometeorites known as type-1
spheres48,49 was undertaken. The type-1 spheres consist mainly of oxides of iron and nickel that
formed as the precursor bodies passed rapidly through the Earth’s atmosphere, melted, oxidized,
and finally cooled abruptly on plunging into the ocean. Though small, the type-1 spheres have
fairly complex structures. By examining these structures, we obtain information about the
changes the precursor bodies underwent and hence valuable clues to the original nature of the
precursor bodies. CMT has the advantages of being non-destructive, fast, and producing digital
data, which can readily be transformed and processed to reveal relationships that might otherwise
be difficult to see.
In this experiment, we used a filtered white beam of x-rays from a bending magnet. For
these measurements, one volume element (voxel) corresponds to 3.6 pm3. Data for sphere KKl-
98-6, which were stored in a volume of 658 x 658 x 100 voxels, took less than 2 h to acquire.
Representative tomographs (Figure 3.2-3) show many of the features previously
reported for type-1 spheres” . Most of the mass appears to consist of two oxide phases, probably
magnetite (Fe304) and wiistite (non-stoichiometric FeO). Interestingly, in our suite of samples,
25

we do not observe the eccentric metal beads commonly remarked by others (e.g., Castaing and
Frederiksson51). Many spheres contain one compact (~10 pm), high-attenuation feature close to
the rim, which we interpret as an oxidation-resistant nugget rich in Ni and platinum-group
elements. In the past, such nuggets have been found only through much more laborious
experimental work5* . The tomographs and independent measurements of density also establish
for the first time the prevalence of holes (Figure 3.2-4) in the spheres, typically about lo-20% of
the total volume. The holes normally emanate inward from a single circular entry point on the
surface, branching as they go. Their locations, which tend to be antipodal to that of the nuggets,
may reflect segregation of low- and high-density phases that accompanies the deceleration of a
fluid. Possible explanations for the holes include the loss of a metal rich bead just before the
molten sphere froze and the preservation, again through rapid quenching, of bubbles created by
evaporation of the molten material.
3.2.3 Hydrothermal vents
Hydrothermal vent systems at the mid-ocean ridge are of great interest to marine
geochemists and geo10gistss3-56 . The chemical reactions that occur in hydrothermal systems are
largely the results of interactions between seawater and molten basalt. When the basalt cools and
freezes, some elements are solubilized and others deposited. Hydrogenous deposits (or
metalliferous sediments) commonly blanket the central rift valley and flanks of mid-ocean ridges
and rises. In addition to metalliferous sediments, massive polymetallic sulfides are also observed
in various stages of formation around hydrothermal vents. In the hydrothermal systems, the
fluids that are emitted from hydrothermal vents are hot, acidic, and enriched in reduced trace
metals and sulfides53. Some chemical reactions happen at a temperature of about 350°C in the
26

vent system, releasing metals (e.g., K”, Fe2’, Mn2+, Cu2’, Zn2’, Ca2’, etc.) from basalts and
producing mineral precipitation (e.g., Mg(OH)SiO,, Fe,O, , quartz, and pyrite). Low-
temperature (< 1 OOOC) reactions occur when fluid has escaped into the deep ocean and heated sea
water rises due to its decreased density, producing black and white smokers. The formation of
black smokers is the consequence of little mixing of the fluid with “fi-esh” seawater and
precipitation of metal sulfides53~55~57 . Some of these particles deposit as chimneys. White
smokers are the result of subsurface mixing (lo-200 m below the sea floor). When these fluids
enter the deep sea, the precipitates are milky white because they are primarily zinc sulfide53*55*57.
As sulfides deposit within the chimneys, the hydrothermal flow eventually ceases and the
sulfides oxidize, causing the chimneys to collapse into basal mounds.
The structure of hydrothermal vent samples has been investigated by Tivey56 and Tivey
and Singh5’. CMT was employed as a way to determine the distribution of sulfide and anhydrite
materials, the morphology of flow conduits, and porosity. Their experiments utilized an
industrial computed tomography (CT) scanner with a beam energy greater than 80 keV. The
slice thickness was about 100 urn, and the horizontal pixel size was about 50 pm. Volume
images were made by measuring sequential horizontal sections at 100 pm and 1000 pm steps.
The diameter of the core samples was 2.5 cm. Substantial information was obtained on the
distribution of pore space and internal structures of the measured samples. However, it was
pointed out that the grain sizes often encountered were in the range from 5 pm to 50 pm. Hence,
estimates of porosity and other parameters could be affected by the spatial resolution of the
tomography. CMT measurements were made on several samples taken from the Mid-Atlantic
Ridge using synchrotron computed microtomography at BNL with a voxel size of 3.6 urn. This
resolution is approximately one order of magnitude smaller than the data obtained using an
27
industrial scanner. Volume images from hydrothermal vent chimneys are shown for location
SCTl in Figure 3.2-5 and for SCT2 in Figure 3.2-6. The calculated porosities for SCTl and
SCT2 are 0.129 and 0.127, respectively. The images displayed in the figures also show that there
are variations in the composition of the materials that would not be observed with the resolutions
obtained with the industrial scanner. It is concluded that the use of CMT combined with coarser
scans will be essential for obtaining a more complete description of the materials obtained from
the hydrothermal vent chimneys.
3.2.4 H. Feng and K. W. Jones (BNL), S.-R. Song (Taiwan National University), U.
Neuhaeusler , C. Jacobsen (State University of New York, Stony Brook), and N. Marinkov,
Albert Einstein College of Medicine). Investigation of New York/New Jersey Harbor
dredged material
Many sites in the United States are contaminated with organic and inorganic materials
associated with the manufacture of goods, their use, and their disposal. Cleanup of these sites to
meet present environmental standards entails the expenditure of large amounts of money and
places a strong emphasis on the development of new decontamination methods that are both
environmentally acceptable and economically affordable. One particularly challenging task is to
cope with the contaminated sediments widely found in the ports, rivers, and lakes of the United
States. These sediments often must be removed in order to reduce their direct environmental
impact on the biota or to maintain navigational channels and other areas related to commercial
shipping activities. The need for new treatment technologies and the problems of contaminated
sediments have been reviewed recently59’60.
28

A specific example of the effort to cope with the problem of contaminated sediments is
given by work focused on the Port of New York and New Jersey. In this case, Congress has
appropriated funding through the Water Resources Development Acts (1990, 1992, 1996, and
1999) for a program aimed at testing the effectiveness and economic feasibility of different
treatment technologies. This is a phased program that is moving from bench-scale testing to
deployment of full-scale facilities that can process from 76,000 to 190,000 m3 of sediment per
year. The program is directed by the U. S. Environmental Protection Agency - Region 2 in
collaboration with the U. S. Army Corps of Engineers - New York District, and the U. S.
Department of Energy - Brookhaven National Laboratory. The aim is to target technologies
which can be brought into operation without extensive research and development efforts.
Nevertheless, as the work went forward it became clear that supplementary research work closely
tied to the demonstrations would be useful. As a result, supporting experiments using several
techniques were developed through use of other funding sources.
A sediment-washing technology is one method that is being brought into operation at the
present time. This method uses high-pressure water jets combined with surfactants and chelators
to separate organic materials from the sediments and to extract the metals. Points where more
information would be useful include:
Sedimentation processes
Distribution of contaminants as a function of particle size
Distribution of contaminants on individual particles
Relationship of organic materials and sediment particles
Nature of the organic materials found in the sediments
Chemical state of the metal contaminants
29
contamination on a limited number of grains. They also suggest that it would be difficult to
make a physical separation of the sediments into clean and contaminated fractions.
Sediment-washing techniques that employ high-pressure water jets can be used to
separate organic materials containing contaminants from the sediment grains. The effectiveness
of the approach depends on the geometry of the organic material/sediment particle. The
chemical state of the organic materials is also important for evaluation of the effectiveness of the
treatment technology and for gaining understanding of possible methods for improving the
treatment efficiency.
Soft x-ray microscopy can be used to investigate these questions. Neuhausler et al.@ used
the instrumentation on the NSLS Xl beam line to investigate dilute specimens of sediment
contained in a wet cell. Measurements were made above and below the C K-edge to show the
spatial distributions of C and the sediment grains. In addition, XANESEXAFS measurements
were made to investigate differences in the form of C present in the sample. Images obtained
above and below the C K-edge for particles taken from a sample of New-town Creek, a highly
contaminated waterway in New York City, are shown in Figure 3.2-9. It can be seen that the C is
associated with the sediment grains and that the shape of the particles is highly irregular. These
data are being used as input for a calculation that attempts to model the actual physical washing
process. Results for absorption spectroscopy are shown in Figure 3.2-10. Here, there is evidence
that different forms of carbon compounds exist not only in the contaminated sediments, but also
in sediments that have been processed in a proprietary treatment developed by BioGenesis
Enterprises of Milwaukee, Wisconsin.
The form of the organic compounds can also be investigated using Fourier Transform
Infrared Radiation (FTIR) spectroscopy. In this case, the apparatus uses commercial
31

spectrometers combined with high flux synchrotron IR beams to make measurements with a
resolution of 15 pm. It was possible to conclude from these measurements that the washing
process was successful in removing several contaminant peaks from the contaminated material.
In addition, information is gained on the lipid and protein compounds present that will be helpful
for understanding the importance of naturally occurring and contaminant organic materials.
3.3 Environmental chemistry
Environmental chemistry is a somewhat diffuse topic. It can certainly be considered to
include experiments on the bioaccumulation of metals in bone or the fate and transport of
contaminants in sediments. Osan and TBr6k65 included measurements on aerosols, fly ash, and
tree rings in a review of the environmental applications of SRIXE. In addition to the
experiments mentioned above, we include here a discussion of recent work undertaken to
investigate the uptake of metals in trees located on a contaminated site in Canada.
3.3.1 R. R. Martin, T. K. Sham, G. W. Won, P. van der Heide, K. W. Jones, S-.R Song,
and R. Protz. Secondary ion mass spectroscopy and synchrotron x-ray fluorescence
in the study of the qualitative variation in metal content with time in tree ringsti
Measurement of the microscopic distribution of metals in wood can be useful in
understanding their role in the normal growth of a tree. Metals deposited in soils as a result of
anthropogenic activities may also be incorporated in the tissue structure of the wood. It is thus
possible that the concentrations found in tree rings will reflect the time-dependent variation in the
concentrations of the polluting elements. However, the pathways for uptake in the tree must be
taken into account in searching for a correlation between time-dependent pollutant concentrations
32

and the concentrations in the tree rings. The complexity of these pathways is such that it will be
difficult to use tree ring concentrations as time-dependent pollution indicators until they are
better understood. Submicrometer analysis of the metal distributions in wood will help to
resolve them. This is reflected in several studies with conflicting findings. Work by Trueby6’
finds no correlation while Qian et al.68 believe that there is one.
Measurements of the elemental concentrations in the rings need to be made using
different analytical methods since the interest may be in accumulation of elements at the cellular
level or in the concentrations averaged over a larger area in a given ring. Here, two
complementary analytical methods were applied to the measurement of heavy elements in
specimens taken from black spruce trees in northern Canada. Secondary ion mass spectrometry
(SIMS) with a lateral resolution of about 10 pm was used for high spatial resolution
measurements. The depth of the material analyzed was less than 1 pm. SRIXE with a
comparable lateral resolution was used with thick samples to obtain values averaged over the
much larger volumes determined by the escape depth of the fluorescent x rays. These depths are
appreciable even for light elements such as Ca (- 175 pm). Results from the two types of
analytical measurements are shown in Figure 3.3-l where SRIXE results for Ca, Fe, Zn, and Fe
are shown and compared with the SIMS results for Fe. The scan distance covers a time period of
7 years from 1920 to 1927. The maxima shown are consistent with the annual growth rings over
that period. The SIMS and SRIXE results are reasonably consistent considering the differences
in volumes of material analyzed. The results also show that, in general, the elements observed
do not rapidly diffuse through the wood structure. Hence, the ring contents do give an indication
of the uptake of the elements as a function of time. Relation of these concentrations to the input
from the pollutant sources needs to be investigated further.
33

3.4 Materials analysis
The fields of material science and chemical science have benefited greatly from
application of synchrotron-radiation based analytical methods. Studies of thermal spray
materials, catalysts, and integrated circuit materials are presented that illustrate the usefulness of
CMT and microdiffraction methods. Obviously, synchrotron x-ray beams have been used
intensively for years for materials studies and there is no intention here to give an exhaustive
summary of all applications.
3.4.1 Thermal spray
Thermal spray is a widely used method for deposition of thermal barrier materials and
other protective coatings for improvement of wear properties, increasing corrosion resistance,
protection of parts in gas turbine engines, and formation of engineered structural materials.
Problems related to the technology have been reviewed by Bemdt et a1.6g They list questions
requiring further investigation in the areas of plasma-particle interactions, deposit formation
dynamics, thermal properties of thermal barrier coatings, mechanical properties of coatings,
feedstock materials, porosity, and manufacture of intermetallics. CMT is cited as a method that
provides data not provided by other techniques and that may help in developing correlations
between quality and preparation conditions. Based on the experiment of Spanne et aL7’ , possible
future development of the CMT method is discussed.
Spamre et aL70 used first-generation CMT to investigate two coatings of tungsten
carbide/cobalt sprayed onto a steel substrate. They were produced so that it was expected that
there would be differences in their porosity. The CMT work was carried out with bending
magnet radiation from the NSLS which had low energy x rays removed by passage through a 254
34

pm Hf foil. The resulting mean x-ray energy was about 4.5 keV with beam sizes of about 3-4
pm. Histograms of the measured attenuation coefficients are shown in Figures 3.4-l and 3.4-2.
The difference in the composition of the two samples is clearly seen. The mean values of the
attenuation coefficients are different by about 20%, and the peak for the less dense material
shows pronounced tailing on the low attenuation coefficient side. These two factors indicate a
difference in the porosity of the two materials and show that the CMT method is an effective
diagnostic method for study of these materials.
3.4.2 Study of supported catalysts
Catalysts are widely used for chemical processing, petroleum refining, and emission
control. While investigations of their action often focus on reactions on surfaces at essentially
the molecular level, there is also need to consider their behavior on larger size scales. In the’
latter case, the application of CMT can be useful.
Nichols et al.‘* used a third-generation CMT apparatus72 for investigation of a
simulated carbon-supported catalyst intended to simulate an electrode for a hydrogen battery.
The resolution of the system was about 15 l_trn. The catalyst in this case was Pd deposited in a
film about 5 pm thick. A total of 300 tomographic slices were obtained so that it was possible to
present the data in a three-dimensional format. Inspection of the tomographic sections and
volume showed that the Pd was not deposited uniformly and that it is deposited in interior
regions previously thought to be inaccessible to the deposition process.
A number of experiments were also carried out at Brookhaven using the NSLS and
first-generation tomography apparatus. Three heterogeneous catalysts were measured: Cr/SiO,
and TiCl, /MgCl, catalysts used for polyethylene po1ymerization73~74~75*76~77, a rare-earth exchanged
35

zeolite fluid catalytic cracking catalyst (FCC)7”, and a Ni-Mo hydrotreating catalyst73 for use in
the refining of petroleum. Only single-slice data was taken in these experiments. The pixel sizes
varied from experiment to experiment, but were about 3 - 10 l_trn in general.
Measurements on the Cr/SiO, system showed that, under some conditions, the catalyst
fragments tended to be swept to the periphery of the polymerization particles, but this was not
found for the TiCl, /MgCl, material. Analyses of the sections were made using two-point
correlation theory to obtain surface areas and porosities. Measurements on the spent FCC
material, which was a rare-earth exchanged Y-type zeolite, showed that the distribution of the
catalyst in the microspheroidal particle of clay, silica, and alumina it was contained in was not
uniform. Distribution of elements such as V, F’e, Ni, and Ti were measured using SRIXE. Ti
and V were distributed uniformly in the particle, while Fe and Ni were concentrated on the
periphery. The combination of SIUXE and CMT are useful in understanding the accumulation
and transport of contaminant metals in the catalyst pellet. CMT sections were also made on new
and used hydrotreating pellets. The concentration of Mo was determined by taking the difference
between sections measured below and above the MO K-x ray absorption edge. Changes in the
morphology of the pellets after use was also clearly seen.
These experiments demonstrate the power of CMT and SRIXE as analytical methods
for the investigation of various types of catalysts. The use of third-generation tomography
geometry and x-ray beams from third-generation synchrotron sources will greatly enhance the
quality of the data. Introduction of more sophisticated analytical methods78, originally developed
for analysis of geological samples, will make it possible to understand the three-dimensional
structures in more detail.
36

3.4.3 Investigation of integrated circuit structures using CMT and microdiffraction
Integrated circuits are a challenging analytical problem since they are three-
dimensional structures with features that have sub-micrometer dimensions. CMT is, in principle,
a valuable method for making non-destructive measurements on materials such as these. The
spatial resolutions needed make demands that are not met by the third-generation equipment now
available because of limitations on detectors and optics of the detector viewing systems.
A solution to this problem has been described by Levine et a1.79 They used a zone plate
to focus 1.573-keV x rays from an undulator source at the APS for a source size of 77 pm to an
object size of 200 nm. The objective of the experiment was to image the structure of aluminum
interconnects so the x-ray energy was selected to be slightly above the Al K edge at 1.559 keV to
obtain maximum absorption. The samples were then investigated using a first-generation
technique. The beam was scanned over a 301 x 301 pixel matrix with step sizes of 77 and 57 nm
in the x and y directions at 13 angles between +/- 69.2 degrees. Although the number of
projections is limited, it was found that it was possible to reconstruct the data and make
tomographic views that showed the three-dimensional structure of a two-level Al integrated
circuit interconnect.
Other aspects of integrated circuits have been investigated using x-ray
microdifiaction. These aspects include investigation of electromigration-induced stress in Al
conductors”, substrate/thin-film interfaces”, and deformations caused by metallization featuress2.
The work was carried out on two different beam lines at the NSLS. The x-ray beams were
formed using both pinholes and capillary focussing optics to produce beams with diameters of
roughly 2-15 pm. Standard x-ray diffraction apparatus was then employed to accumulate x-ray
37

diffraction data. The small size and high flux of the x-ray beams were the key factor in making
these measurements feasible.
38
4. Summary
We have outlined some of the technical details related to the use of synchrotron
radiation for application of several analytical methods, principally CMT and SRIXE, to a variety
of materials. The emphasis was on experiments done at the Brookhaven NSLS and especially on
experiments where we were personally involved. Other experiments were discussed to illustrate
specific points. Taken together, we believe that it is clear that there are important uses for these
methods and that the scope of applications will grow in the future.
It also seems clear that there will be a growth in the number of beam lines suitable for
microbeam analyses using several different techniques. This is true of the BNL X26A beam line
where SRIXE, XANES, and EXAFS are presently feasible and where addition of CMT is under
consideration. Other beam lines at the ESRF and APS are also using combinations of these
methods on undulator beam lines. An experiment that illustrates this point was carried out by
Isaacs et als3 to investigate the composition and structure of rare earth activated phosphors.
They worked on NSLS beam line X16C and applied SRIXE, x-ray diffraction and XANES in the
course of the work. The combination of these techniques in a single apparatus should have a
major scientific impact in years to come.
39

5. Acknowledgements
We thank S. R. Sutton, M. L. Rivers, A. Lanzirotti, S. G. Cargill III, and I. C. Noyan
for helpful discussions and for permission to use several photographs and figures. We also thank
Lore Barbier for her suggestions and for her essential and skilled work in preparing the
manuscript for publication.
40

6. References
1.
2.
3.
4.
5.
6.
7.
8.
9.
H. Winick and S. Doniach, “Synchrotron Radiation Research” (Plenum Press, New York,
1980).
B. M. Gordon and K. W. Jones, in “Spectroscopic and Microscopic Imaging of the
Chemical State”, ed. Michael D. Morris (Marcel Dekker, Inc., New York, 1993), p. 303.
K. W. Jones, in “Handbook of X-Ray Spectrometry: Second Edition, Revised”, eds. R.
Van Grieken and A. Markowicz (Marcel Dekker, Inc., New York, 1999), in press.
K. W. Jones, in “Microscopic X-Ray Fluorescence Analysis”, eds. K. Janssens, A.
Rindby, and F. Adams (John Wiley & Sons Ltd., Sussex, England, 1999), in press.
Sz. Tiirok, K. W. Jones, and C. Tuniz, in ‘Nuclear Methods in Mineralogy and Geology,
Techniques and Applications”, eds. A. V&es, S. Nagy, and K. Siivegh (Plenum Press,
New York, 1998), p. 217.
P. Chevallier and P. Dhez, in “Accelerator-Based Atomic Physics Techniques and
Applications”, eds. S. M. Shafroth and J. C. Austin (American Institute of Physics, New
York, 1997), p. 309.
S. Hayakawa and Y. Gohshi, in “Applications of Synchrotron Radiation to Materials
Analysis”, eds. H. Saisho and Y. Gohshi (Elsevier Science B. V., Amsterdam, 1996), p.
171.
J. V. Smith, The AnaZyst 120, 123 1 (1995).
J. V. Smith and M. L. Rivers, in “Microprobe Techniques in the Earth Sciences”, eds. P.
Potts, J. F. W. Bowles, S. J. B. Reed, and M. R. Cave (Chapman and Hall, London,
1995), p. 163.
41

10.
11.
12.
13.
14.
15.
16.
17.
18.
19.
20.
21.
22.
D. G. Schulze, J. W. Stucki, and P. M. Bertsch, eds., “Synchrotron X-ray Methods in
Clay Science, Volume 9, CMS Workshop Lectures” (The Clay Mineral Society, Boulder,
1999), 224 pp.
David B. Guralnik, “Webster’s New World Dictionary, Second College Edition (Prentice
Hall Press, New York, 1986).
httn://nhvsics.nist.aovPhysRefData/contents.html.
P. Kirkpatrick and A. V. Baez, J. Opt. Sot. Am. 39,766 (1948).
R. D. Giauque, A. C. Thompson, J. H. Underwood, Y. Wu, K. W. Jones, and M. L.
Rivers, Anal. Chem. 60,855 (1988).
S. R. Sutton, M. L. Rivers, P. J. Eng, and G. Shea-McCarthy, in National Synchrotron
Light Source Activity Report 1997”, BNL 52540, p. B-238, May 1998.
S. A. Hoffman, D. J. Thiel, and D. H. Bilderback, Optical Engineering 33, 303 (1994).
P. Engstrom and C. Riekel, J. Synchrotron Rad. S3,97 (1996).
G. S. Cargill III, K. Hwang, J. W. Lam, P.-C. Wang, E. Liniger, and I. C. Noyan, SPIE
Proceedings 2516, 120 (1995).
G. S. Brown and S. Doniach, in “Synchrotron Radiation Research”, eds. H. Winick and
S. Doniach (Plenum Press, New York, 1980), p. 353.
G. S. Brown, in “Synchrotron Radiation Research”, eds. H. Winick and S. Doniach
(Plenum Press, New York, 1980), p. 387.
F. W. Lytle, G. H. Via, and J. H. Sinfelt, in “Synchrotron Radiation Research”, eds. H.
Winick and S. Doniach (Plenum Press, New York, 1980), p. 401.
S. Doniach, P. Eisenberger, and Keith 0. Hodgson, in “Synchrotron Radiation Research,
eds. H. Winick and S. Doniach (Plenum Press, New York, 1980), p. 425.
42

23. D. C. Koningsberger and R. Prins, “X-Ray Absorption. Principles, Applications,
24.
25.
26.
27.
28.
29.
30.
31.
32.
33.
Techniques of EXAS, SEXAFS, and XANES” (Wiley and Sons, New York, 1988), 673
PP.
S. Fendorf, in “Synchrotron X-ray Methods in Clay Science, Volume 9, CMS Workshop
Lectures”, eds. D. G. Schulze, J. W. Stucki, and P. M. Bertsch (The Clay Minerals
Society, Boulder, 1999), p. 19.
P. Spanne and M. L. Rivers, Nucl. Instrum. Methods B24/25, 1063 (1987).
K. L. D’Amico, H. W. Decamp, J. H. Dunsmuir, B. P. Flannery, and W. G. Roberge, Rev.
Sci. Instrum. 60, 1524 (1989).
B. P. Flannery, H. W. Deckman, W. Roberge, and K. L. D’Amico, Science 237,1439
(1987).
U. Bonse, Q. C. Johnson, M. C. Nichols, R. Nuflhardt, S. Krasnicki, and J. Kinney, Nucl.
Instrum. Methods A246,644 (1986).
J. Kinney, Q. C. Johnson, M. C. Nichols, U. Bonse, and R. Nuflhardt, Appl. Optics 25,
4583 (1986).
B. A. Dowd, A. B. Andrews, R. B. Max-r, D. P. Siddons, K. W. Jones, and A. M. Peskin,
in “Advances in X-Ray Analysis”, Volume 42 (1999).
Betsy A. Dowd, Graham H. Campbell, Robert B. Marr, Vivek Nagarkar, Sameer Tipnis,
Lisa Axe, D. Peter Siddons, SPIE Proceedings 3772,224 (1999).
K. Themner, P. Spanne, and K. W. Jones, Nucl. Instrum. Methods B49,52 (1990).
D. N. Slatkin, A. L. Hanson, K. W. Jones, H. W. Kraner, J. B. Warren, and G. C. Finkel,
Nucl. Instrum. Methods 227,378 (1984).
43

34.
35.
36.
37.
38.
39.
40.
41.
42.
43.
44.
P. T. Singer, R. P. Carty, L. E. Berman, I. Schlichting, A. Stock, A. Smalls, Z. Cai, W. F.
Mangel, K. W. Jones, and R. M. Sweet, Phil. Trans. R. Sot. Lond. A 340,285 (1992).
Hollis T. Cline, Sonia Witte, and Keith W. Jones, Proc. Natl. Acad. Sci. USA, 93,9915
(1996).
Thomas Pfister, Keith W. Jones, and Eckard Wimmer, J. ViroZogy 74(l), 334 (2000):
T. Pfister, E. Wimmer, H. Feng, and K. W. Jones, in “National Synchrotron Light Source
Activity Report 1999”, in press.
Process Analytics, Orem, Utah.
G. Newman, S. Trowbridge, and K. W. Jones, in “National Synchrotron Light Source
Activity Report 1996”, BNL 525 17, p. B-227, May 1997.
S. Yasurnura, K. Jones, P. Spanne, G. Schidlovsky, L. Wielopolski, X. Ren, D. Glaros,
and Y. Xatzikonstantinou, in “Proceedings of a Symposium on Aging and Body
Composition: Technological Advances and Physiological Interrelationships, 76* Annual
Meeting of the Federation of American Societies for Experimental Biology”, eds. S. B.
Heymsfield and S. Yasumura (American Institute of Nutrition, 1993), p. 459.
R. S. Bockman, M. A. Repo, R. P. Warrell, Jr., J. G. Pounds, G. Schidlovksy, B. M.
Gordon, and K. W. Jones, Proc. Natl. Acad. Sci. USA 87,4149 (1990).
K. W. Jones, G. Schidlovsky, D. E. Burger, F. L. Milder, and H. Hu, in “Advances in In
Vivo Body Composition Studies”, eds. S. Yasumura, J. E. Harrison, K. G. McNeill, A. D.
Woodhead, and F. A. Dilmanian (Plenum Press, New York, 1990), p. 28 1.
K. W. Jones, R. S. Bockman, and F. Bronner, NeuroToxicoZogy 13,835 (1992).
K. W. Jones, W. J. Berry, D. J. Borsay, H. T. Cline, W. C. Conner, Jr., and C. S.
Fullmer, X-Ray Spectrometry 26,350 (1997).
44

45.
46.
47.
48.
49.
50.
51.
52.
53.
54.
55.
56.
57.
R. Rizzo, M. Grandolfo, C. Godeas, K. W. Jones, and F. Vittur, J. of Experimental
Zoology 273, 82 (1995).
M. Hiltl, C. R. Hagelberg, R. P. Switft, T. C. Camey, and W. J. Nellis, in “Proceedings,
International Association for the Advancement of High Pressure Science and Technology
(AIRAPT) International Conference on High Pressure Science and Technology
(AIRAPT-17), July 25 - July 30, 1999, University of Hawaii, Honolulu, Hawaii, USA.”
H. Feng, K. W. Jones, B. Stewart, G. F. Herzog, C. Schnable, and D. E. Brownlee, Lunar
Planet. Sci. XXX, Abstract #1209 (Lunar and Planetary Institute, Houston, Texas, 1999),
(CD-ROM).
D. E. Brownlee, Annual Reviews of Earth and Planetary Science 13, 147 (1985).
G. F. Herzog, S. Xue, G. S. Hall, L. E. Nyquist, C.-Y. Shih, H. Wiesmann, and D. E.
Brownlee, Geochim. Cosmochim. Acta 63B, 1443 (1998).
A. Kosakevitch and J. R. Disnar, Geochim. Cosmochim. Acta 61, 1073 (1997).
R. Castaing and K. Fredriksson, Geochim. Cosmochim. Acta 14, 114 (1958).
Ph. Bonte, C. Jehanno, MM. Maurette, and D. E. Brownlee, in “Proceedings of the 17”
Lunar and Planetary Science Conference, Part 2”, J. Geophys. Res. 92, E641 (1987).
J. M. Edmond and K. Van Damm, Scientific American 248,78 (1983).
H. W. Jannasch and M. J. Mottl, Science 229,719 (1985).
K. L. Van Damm, Annu. Rev. Earth Planet. Sci. 18, 173 (1990).
M. K. Tivey, in “Proceedings of the Ocean Drilling Program, Scientific Results”, eds. P.
M. Herzig, S. E. Humphris, D. J. Miller, and R. A. Zierenberg, Volume 158,201 (1998).
S. M. Libes, “An Introduction to Marine Biogeochemistry” (John Wiley & Son, Inc.,
New York, 1992).
45

58.
59.
60.
61.
62.
63.
64.
65.
66.
67.
68.
69.
M. K. Tivey and S. Singh, Geology 25,93 1 (1997).
Committee on Innovative Remediation Technologies, Innovations in Ground Water and
Soil Cleanup, from Concept to Commercialization (National Academy Press,
Washington, DC, 1997).
Committee on Contaminated Marine Sediments. Contaminated Sediments in Ports and
Waterways, Cleanup Strategies and Technologies (National Academy Press, Washington,
DC, 1997).
D. Coelho, J.-F. Thovert, and P. M. Adler, Phys. Rev. E 55, 1959 (1997).
J. Quintanilla and S. Torquato, Phyx Rev. E 55, 1558 (1997).
K. W. Jones, S.-R. Song, R. C. Klein, and G. Shea-McCarthy. Presented at 1997 Spring
Meeting of American Geophysical Union, Baltimore, Maryland, May 1997.
U. Neuhausler, S. Abend, S. Ziesmer, D. Schulze, D. Stott, K. Jones, H. Feng, C.
Jacobsen, and G. Lagaly, in “Proceedings of VIth International Conference on X-Ray
Microscopy (XRM99)“, in press (1999).
J. O&n and S. T&ok, in “Chemical Applications of Synchrotron Radiation”, ed. T. K.
Sham (World Scientific Publishing Co., Inc. ), Chapter 10, in press.
R. R. Martin, T. K. Sham, G. W. Won, P. van der Heide, K. W. Jones, S.-R. Song, and R.
Protz, Can J For. Rex 28, 1464 (1998).
P. Trueby, Angew. Bot. 69, 135 (1995).
J.-L. Quian, S.-Z. Huang, and C.-X. Xiang, Pedosphere 3, 109 (1993).
C. A. Bemdt, W. Brindley, A. N.Goland, H. Herman, D. L. Houck, K. Jones, R. A.
Miller, R. Neiser, W. Riggs, S. Sampath, M. Smith, and P. Spanne, J. Thermal Spray
Technology 1,341 (1992).
46

70.
71.
72.
73.
74.
75.
76.
77.
78.
79.
80.
P. Spanne, K. W. Jones, H. Herman, and W. L. Riggs, J. Thermal Spray Technology 2,
121 (1993).
M. C. Nichols, J. H. Kinney, Q. C. Johnson, R. A. Saroyan, U. Bonse, R. Nusshardt, and
R. Pahl, Rev. Sci. Instrum. 60,2475 (1989).
U. Bonse, R. Nusshardt, F. Busch, R. Pahl, Q. C. Johnson, J. H. Kinney, R. Saroyan, and
M. C. Nichols, Rev. Sci. Instrum. 60,247s (1989).
W. C. Conner, S. W. Webb, P. Spanne, and K. W. Jones, Macromolecules 23,4742
(1990).
K. W. Jones, P. Spanne, S. W. Webb, W. C. Conner, R. A. Beyerlein, W. J. Reagan, and
F. M. Dautzenberg, Nucl. Instrum. Methods B57/57,427 (1991).
K. W. Jones, P. Spanne, W. B. Lindquist, W. C. Conner, and M. Ferrero, Nucl. Instrum.
Methods B68, 105 (1992).
W. C. Conner, M. Ferrero, S. Webb, R. Sonnner, M. Chiovetta, K. Jones, and P. Spanne,
in “Proc. 10” International Congress on Catalysis, Budapest Hungary, July 1992”, eds. L.
Guczi et al. (Elsevier Science Publishers B. V., 1993), p. 1827.
M. A. Ferrero, R. Sommer, P. Spanne, K. W. Jones, and W. Curtis Conner, J. Polymer
Science: Part A: Polymer Chemistry 31,2507 (1993).
‘W. B. Lindquist, S.-M. Lee, D. A. Coker, K. W. Jones, and P. Spanne, J: Geophys. Rex
101,8297 (1996).
2. H. Levine, A. R. Kalukin, S. P. Frigo, I. McNulty, and M. Kuhn, AppZ. Phys. Letters
74, 150 (1999).
P.-C. Wang, G. S. Cargill III, I. C. Noyan, and C.-K. Hu, AppZ. Phys. Letters 72, 1296
(1998).
47

81.
82.
83.
I. C. Noyan, J. Jordan-Sweet, E. G. Liniger, and S. K. Kaldor, Appl. Phys. Letters 72,
3338 (1998).
I. C. Noyan, P.-C. Wang, S. K. Kaldor, and J. L. Jordan-Sweet, Appl. Phys. Letters 74,
2352 (1999).
E. D. Isaacs, M. Marcus, G. Aeppli, X.-D. Xiang, X.-D. Sun, P. Schultz, H.-K. Kao, G. S.
Cargill III, and R. Haushalter, Appl. Phys. Letters 73, 1820 (1998).
48

.
7. Table 1. Minimum detection limits for KB mirror demonstration at the NSLS
Element 1 Minimum Detection Limit 1
Mn
Fe
Ni
Zn 3
49
8. Figure Captions
Figure 2. l-l. The performance of a bending magnet at the NSLS is shown for a stored electron
beam current of 5OOmA, the NSLS design value. Values for brilliance,
brightness, and flux are shown in Figures 2. l-la, -1 b, and -lc, respectively.
(From K. W. Jones, B. M. Gordon, A. L. Hanson, W. M. Kwiatek, and J. G.
Pounds, Ultramicroscopy 24,3 13 (1988)
Figure 2.3-l Schematic diagram of the NSLS X26A beam line with monochromator and KB
mirror focusing. (Drawing courtesy of A. Lanzirotti, University of Chicago.)
Figure 2.3-2. Photograph of the NSLS X26A x-ray microprobe. Components of the microprobe
are identified in the photograph. (Photograph courtesy of A. Lanzirotti,
LJniversity of Chicago.)
Figure 2.3-3. Typical x-ray spectra for thin film Standard Reference Materials 1832 and 1833
from the National Bureau of Standards obtained using the NSLS X26A KB
system. (Courtesy of A. Lanzirotti, University of Chicago.)
Figure 2.3-4. Photograph of the University of Chicago Consortium of Advanced Radiation
Sources (CARS) Geology, Soil, and Environmental subgroup KB mirror
microprobe system at Sector 13 of the APS. (Photograph courtesy of S. R.
Sutton, University of Chicago.)
Figure 2.3-5. Demonstration of sub-micrometer spatial resolution attained with the CARS KB
microprobe system. The measurement was made by scanning a knife edge
through the beam and observing the fluorescent x rays produced. (P. J. Eng, M
Newville, M. L. Rivers, and S. R. Sutton, SPIE Proceedings 3449, 145 (1998).)
50

Figure 2.5-l Schematic diagram of the CMT system at the NSLS X27A beam line. (From Ref.
30.)
Figure 2.5-2 Photograph of the NSLS X27A CMT system hardware. The x-ray beam travels
from right-to-left in the picture.
Figure 2.6-l. Energy spectrum of x rays produced in the 90-degree scattering of the NSLS
white beam from a 3.5~pm polyester film. Mass loss of a sample following
irradiation can be estimated from changes in the intensity of the scattered x rays.
(From Ref. 32.)
Figure 2.6-2. The relative intensity of x rays scattered from a skin sample, taken as an example
of a biological specimen, is shown as a function of absorbed dose. The change in
the number of scattered x rays shows the mass loss caused by the irradiation.
(From Ref. 32.)
Figure 3.1-l Portions of the SRIXE spectrum obtained from x-ray analysis of the composition
of a thin-section of tadpole optic tectum are shown. Pb La and Zn Ka x rays are
clearly observed. The lead La line is shown in (a) and the Cu Ka, Zn Kaand Zn
Kj3 lines in (b). (From Ref. 44.)
Figure 3.2-1 Tomographic volume showing the structure of an undamaged Berea sandstone
sample prior to shock loading. The voxel size is 3.6 urn. (From H. Feng, K. W.
Jones, C. Hagelberg, and M. Hiltl, in “National Synchrotron Light Source
Activity Report 1999”, in press.)
51

Figure 3.2-2 Tomographic volume showing the structure of a Berea sandstone following shock
loading of the dry specimen. at about 6.1 Gpa. (From H. Feng, K. W. Jones, C.
Hagelberg, and M. Hiltl, in “National Synchrotron Light Source Activity Report
1999”, in press.)
Figure 3.2-3 Tomographic section of a micrometeorite showing existence of a nugget of Ni and
platinum-group elements at the surface of the micrometeorite. The voxel size is
2.3 pm. The color scale shows the relative x-ray attenuation coefficient. (From
Ref. 47.)
Figure 3.2-4 Tomographic volume showing the structure of a hole in a micrometeorite. The
existence of this type of hole is a common feature of this type of micrometeorite.
The voxel size is 3.6 pm. (From Ref. 47.)
Figure 3.2-5 Internal microstructure of a hydrothermal vent chimney sample from location
SCTl at the Mid-Atlantic Ocean Ridge. The voxel size is 3.6 urn. (From H.
Feng and K. W. Jones, in “National Synchrotron Light Source Activity Report
1999”, in press.)
Figure 3.2-6 Internal microstructure of a hydrothermal vent chimney sample from location
SCT2 at the Mid-Atlantic Ocean Ridge. The voxel size is 3.6 urn. (From H.
Feng and K. W. Jones, in “National Synchrotron Light Source Activity Report
1999”, in press.)
Figure 3.2-7 Tomographic volume obtained for a sandy sediment. The voxel size is 6.8 I_rm.
The microstructure of the sediment is clearly displayed. . (From H. Feng and K.
W. Jones, in “National Synchrotron Light Source Activity Report 1999”, in
press.)
52

Figure 3.2-8 Results of SRIXE measurements of Cr distributions on individual particles from a
sediment specimen obtained from New York Harbor. Results are shown for
several grain-size ranges.
Figure 3.2-9 High-resolution x-ray microscopy images obtained above and below the C K-edge
for particles taken from a sample of Newtown Creek, New York. The results
clearly delineate the structures of the organic and inorganic components of the
sediments.
Figure 3.2- 10 Infrared spectra obtained using the Fourier Transform Infrared Spectrometer at the
NSLS U2B beam line. Spectra are shown for data obtained from a specimen of
sediment taken from Newtown Creek in New York Harbor and from a specimen
of the same material following treatment of the sediment with a sediment washing
technology. Differences in the organic compounds present can be seen.
Figure 3.3-l Relative concentrations of Ca, Fe, Zn, and Fe obtained using SRIXE are shown
for a scan over a thick section of wood representing several years of growth The
results for Fe are compared with results found for the same material using SIMS.
The information gained by use of the two techniques are discussed by Martin et
a1.66 (From Ref. 66.)
Figure 3.4- 1 Histogram of the frequency of occurrence of the reconstructed linear attenuation
coefficients found in the picture elements of a tomographic section of a thermal
spray specimen produced by an externally injected plasma. (From Ref. 70.)
Figure 3.4-2 Histogram of the frequency of occurrence of the reconstructed linear attenuation
coefficients found in the picture elements of a tomographic section of a thermal
spray specimen produced by an internally injected plasma. (From Ref. 70.)
53

. .
0 0 0 0 0 00;
0 0

10 14
10 13
10 12
10 11
10 10
10 9
I 1
01 .
1 IO
Ener
gy
(keV
) Figure 2.1-lb

0 0
0

X26
A M
icro
pro
be
Bea
mlin
e
.015
m
m f
ocus
ed
beam
K
-B
foco
usin
g m
irror
M
onoc
hrom
ator
C
hann
el-C
ut
Si(1
,l ,
l)
350
mm
. be
am
Mon
ochr
omat
ic
Bea
m
Figure
2.3-
l

. .

l t Z’ ::
I
ii
--
L - --
8 ;
i ;
Y
I


b-l I
E s

A/D&
Fram
e R
eado
ut
;o
Indi
go
r .
I I I I I I I f I I I I I I I I I I 1
4 i
Shut
ter;
____
__-
‘rigg
er S
igna
l
GPI
B M
otor
C
ontro
ller
1
r I-
I I]
L
SGI
Dat
a C
olle
ctio
n &
Rec
onst
ruct
ion
Fold
CC
D M
icro
scop
e O
bjec
tive
r Liqu
id C
oolin
g U
nit
X-ra
y So
urce
Mot
or
Driv
ers
Hei
g hi
] C
ente
ring
Stag
es
1
Mirr
or
Cam
era
Elec
troni
cs
Filte
rs
or L
X27A
_J M
onoc
hrom
ator
I I
I I
Figure 2.5-l

. .

I .
-
-
I
N 0

I 0 6, 00

.
19000 L 1 I I I f I
840 860 880 900
8000
7000
6000
5000
4000
3000
2000
1000
cu K, ia 600
Zn K, w -
Figure 3.1-l

.
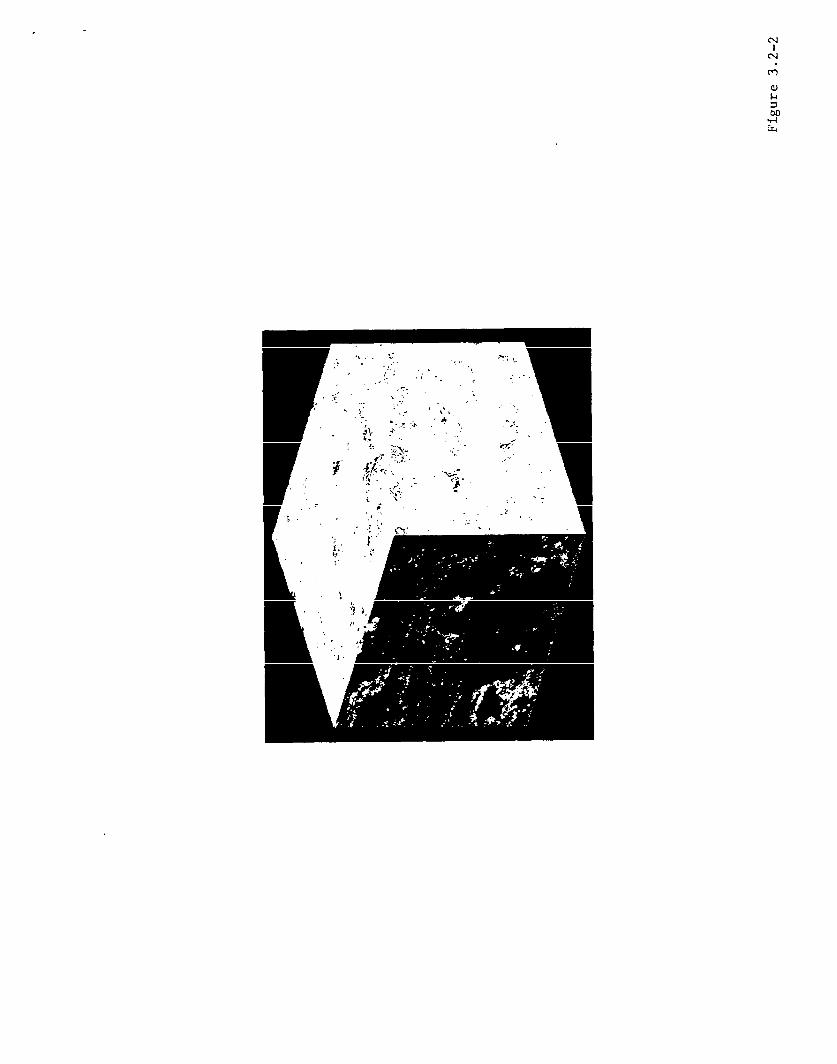
r


h I
N
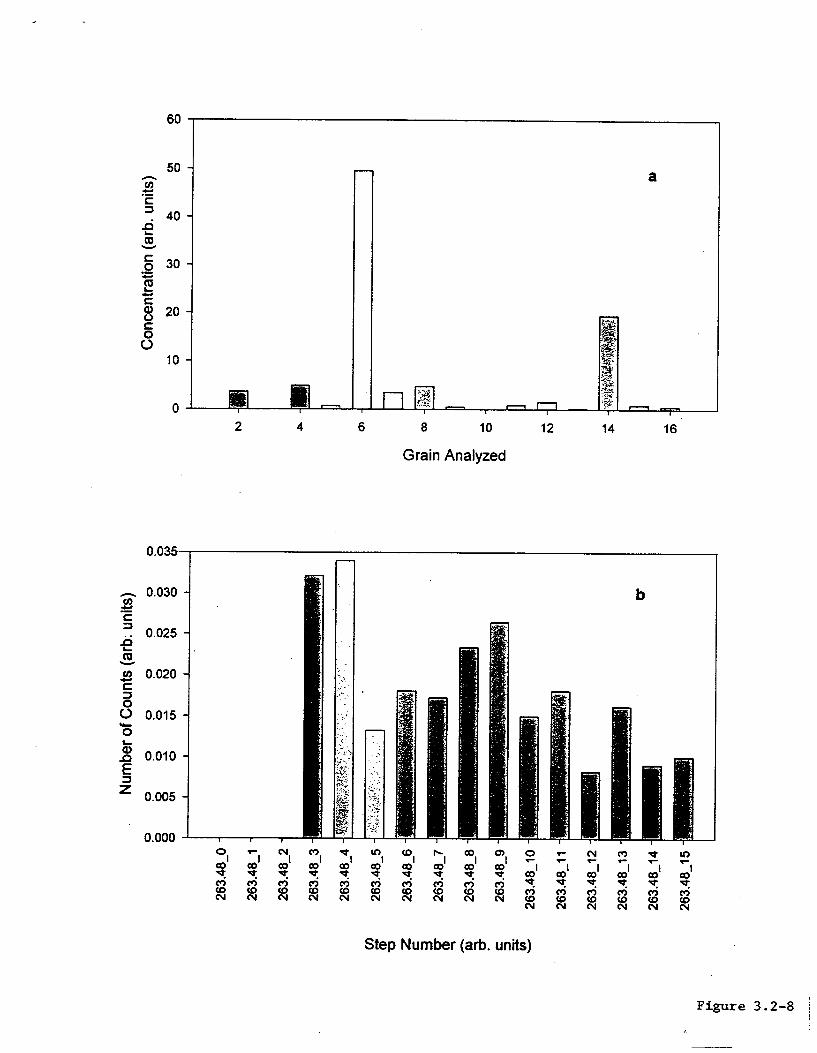
Num
ber o
f Cou
nts
(arb
; uni
ts)
263S
48_o
i. F
F
!
F
F
,I
263.
46-l
263.
46-2
263.
48-3
263.
48-4
263.
48-5
263.
48-6
263.
48-7
263.
48-8
263.
48-g
263.
48-1
0
263.
48-1
1
263.
48-1
2
263.
48-1
3
263.
48-1
4
263.
48-M
Con
cent
ratio
n (a
rb. u
nits
)
0 ;f
?i
k
i 8
g g

31 juldl.xas
0.0-
2u2 284 2w 281 290 OV
31 julskO1 .xos
0.6 -
0.4 -
0.2 -
2uQ 282 204 286 2M 290 OV
Figure 3.2-g

Contaminated Raw Sediments
CY : V
a
3.0
2.5
2.0
1.5
1.0
0.5
0.0
- spot 1
spot 2 -- spot3
- spot4
- spot 5
4000 3000 2000
Wave number (cm-‘)
1000
Treated Clean Sediments
2.0
1.5
,,,.,...,,, ,_... “‘.’ ‘Y- ,.; ,,_
_. . . ...’ ,. ,.,. ,(, I
I
4000 3000 2000
Wave numbers (cm-‘)
1000
$- v 1.0
E
0.5
1
Figure 3.2-10

9
a 7
6
5
4
3
2
0
0 200 400 600 800 1000 1200 1400
Diince (pm)
0 200 4ocl600 8001ooo12001400 Dh-WN
0 200 400 600 aoo loo0 1200 1400
Diitance (jlm)
Figure 3.3-l

t
t
.
1
I
7 A-
L
SC _C
C _C
-C
0 0
0.2
I I I I I I I I I I 1 I I I I I I I I
0 a
0 co

B99
120.
I 1
1 I
I 1
I I
I I
I I
I 1
I
loo-
r)
m
80-
, r L
0:
1 I
L I
I 1
1 In _mTJ
1 I
1 1
1 0
2000
4000
6000
8000
Rec
onst
ruct
ed
valu
e,
m-’
Figure 3.4-2
![METROLOGY WITH SYNCHROTRON RADIATION · 3 METROLOGY WITH SYNCHROTRON RADIATION When synchrotron radiation began to be utilized for spectroscopic investigations in the 1950s [1], the](https://img.pdfslide.net/doc/110x75/5d4f2a0288c993720d8bc765/metrology-with-synchrotron-radiation-3-metrology-with-synchrotron-radiation.jpg)