Embed Size (px)
Citation preview
Microarray Analysis with a Microarray Analysis with a Small Number of ReplicatesSmall Number of Replicates
By Kung-Hua Chang & Dhondup PembaBy Kung-Hua Chang & Dhondup Pemba
Mentors: Cecilie Boysen, Ph.D & Jim Breaux, Ph.DMentors: Cecilie Boysen, Ph.D & Jim Breaux, Ph.D
Southern California Bioinformatics InstituteSouthern California Bioinformatics Institute
Summer 2005Summer 2005
Funded By NSF/NIHFunded By NSF/NIH
OutlineOutline
Our TaskOur Task
• Statistical Analysis with a Statistical Analysis with a Small Number of ReplicatesSmall Number of Replicates
• Functional AnalysisFunctional Analysis
• Additional ProjectsAdditional Projects
BackgroundBackground
• Affymetrix GeneChipAffymetrix GeneChip® ®
MicroarraysMicroarrays
• VMAxSVMAxS
• Steps in Microarray Data Steps in Microarray Data AnalysisAnalysis
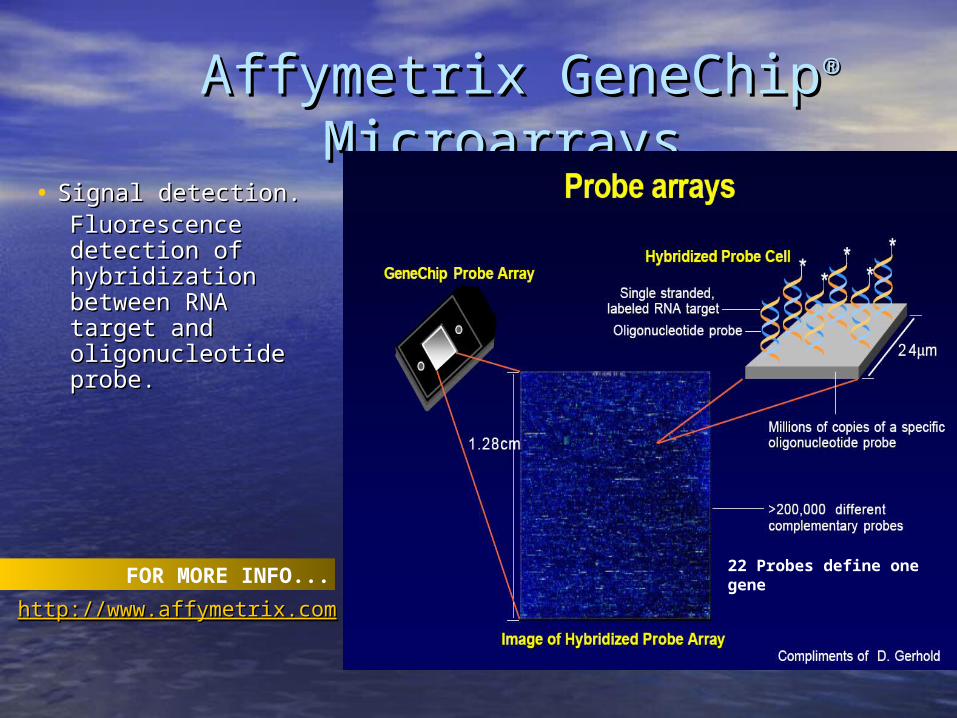
Affymetrix GeneChipAffymetrix GeneChip®® Microarrays Microarrays
FOR MORE INFO...
http://www.affymetrix.comhttp://www.affymetrix.com
22 Probes define one gene
• Signal detection.Signal detection.Fluorescence Fluorescence detection of detection of hybridization hybridization between RNA target between RNA target and oligonucleotide and oligonucleotide probe.probe.
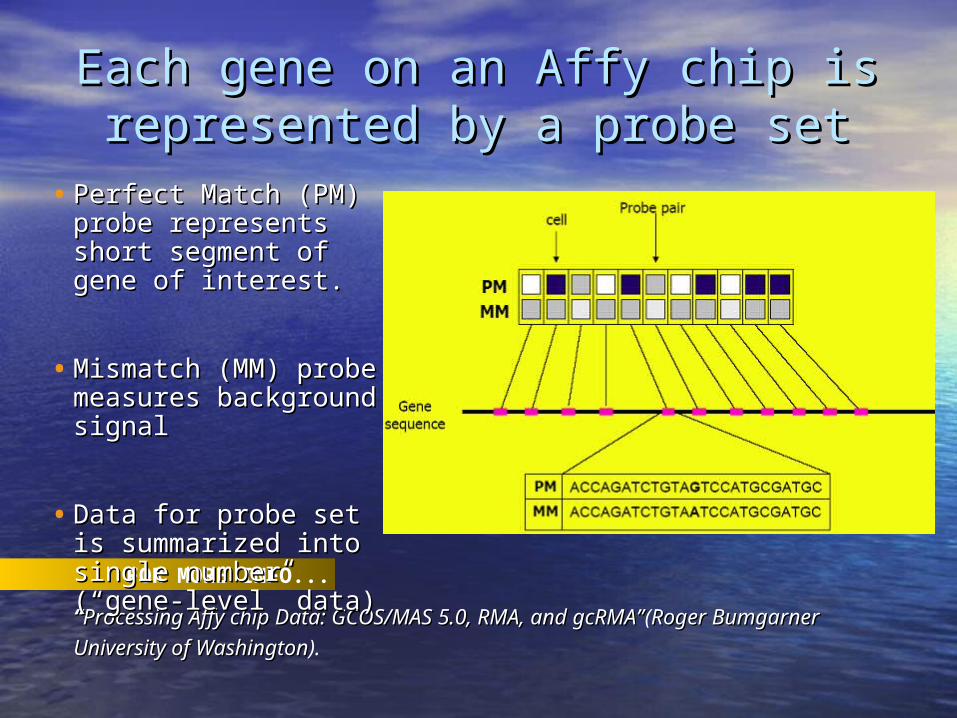
Each gene on an Affy chip is Each gene on an Affy chip is represented by a probe setrepresented by a probe set
FOR MORE INFO...
““Processing Affy chip Data: GCOS/MAS 5.0, RMA, and gcRMA”Processing Affy chip Data: GCOS/MAS 5.0, RMA, and gcRMA”(Roger Roger Bumgarner Bumgarner
University of WashingtonUniversity of Washington).
• Perfect Match (PM) Perfect Match (PM) probe represents short probe represents short segment of gene of segment of gene of interest.interest.
• Mismatch (MM) probe Mismatch (MM) probe measures background measures background signalsignal
• Data for probe set is Data for probe set is summarized into single summarized into single number (“gene-level” number (“gene-level” data)data)
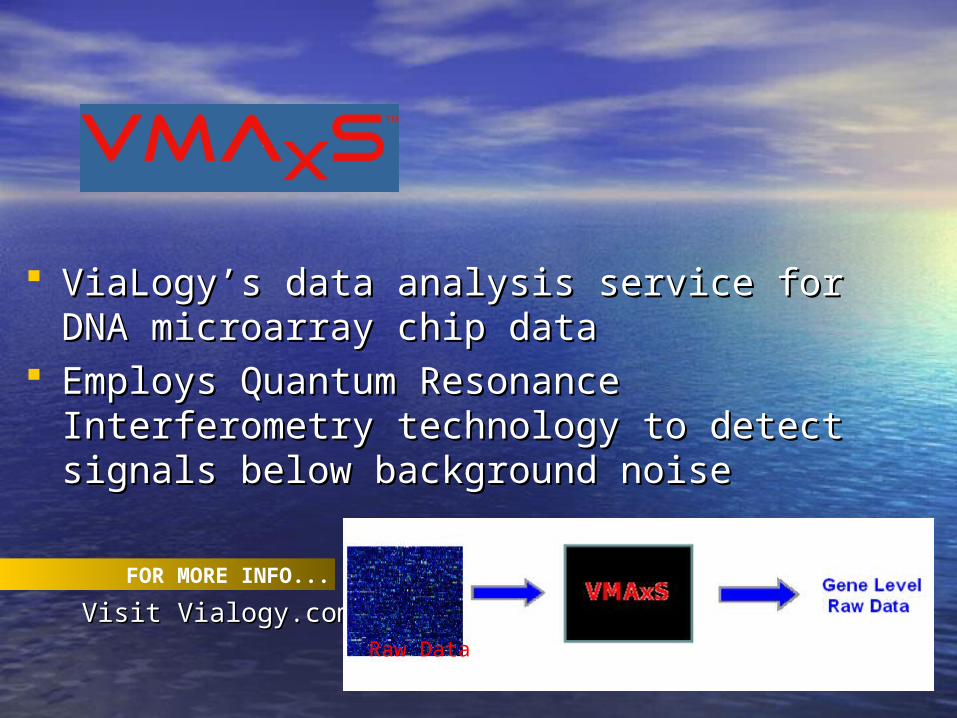
ViaLogy’s data analysis service for DNA microarray ViaLogy’s data analysis service for DNA microarray chip datachip data
Employs Quantum Resonance Interferometry Employs Quantum Resonance Interferometry technology to detect signals below background technology to detect signals below background noisenoise
FOR MORE INFO...
Visit Vialogy.com.Visit Vialogy.com.Raw Data
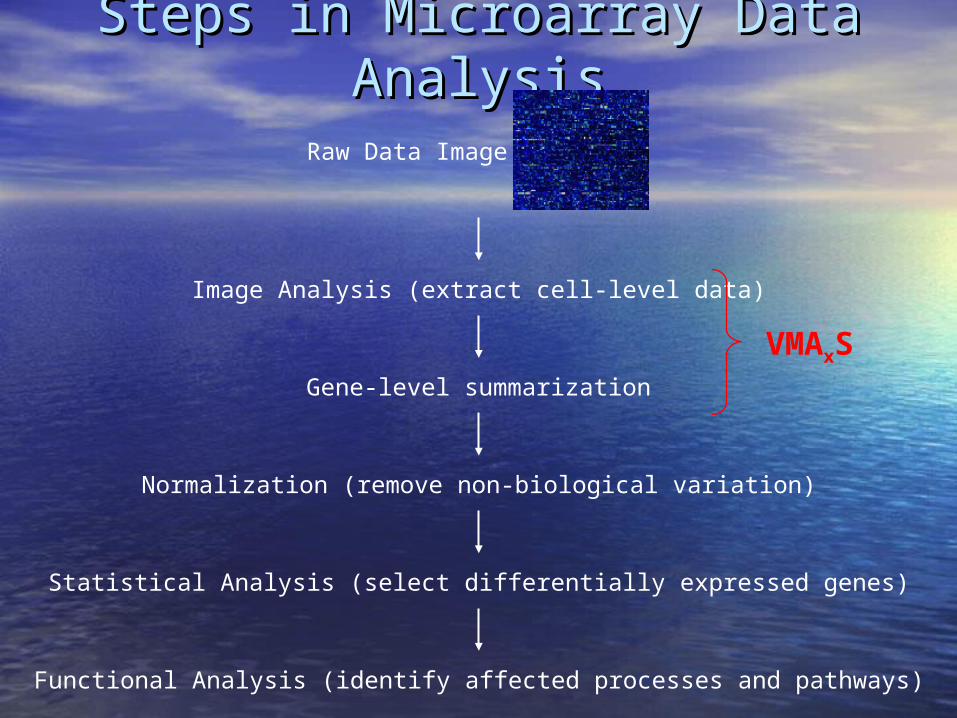
Steps in Microarray Data AnalysisSteps in Microarray Data Analysis
Raw Data Image
Image Analysis (extract cell-level data)
VMAxSGene-level summarization
Normalization (remove non-biological variation)
Statistical Analysis (select differentially expressed genes)
Functional Analysis (identify affected processes and pathways)
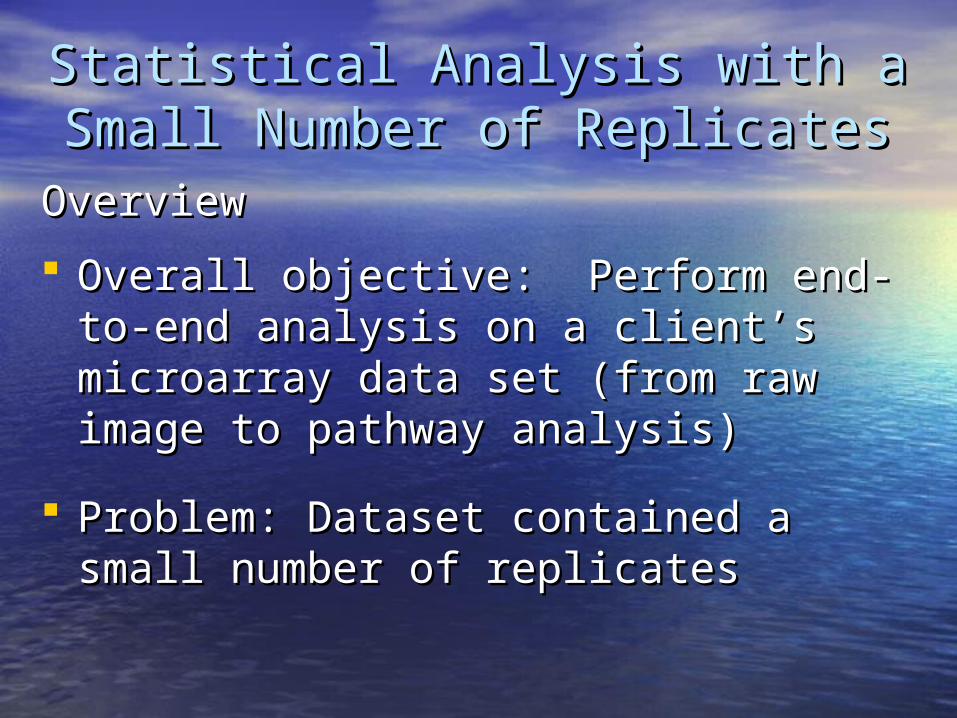
Statistical Analysis with a Small Statistical Analysis with a Small Number of ReplicatesNumber of Replicates
Overall objective: Perform end-to-end Overall objective: Perform end-to-end analysis on a client’s microarray data set analysis on a client’s microarray data set (from raw image to pathway analysis)(from raw image to pathway analysis)
Problem: Dataset contained a small number Problem: Dataset contained a small number of replicatesof replicates
OverviewOverview
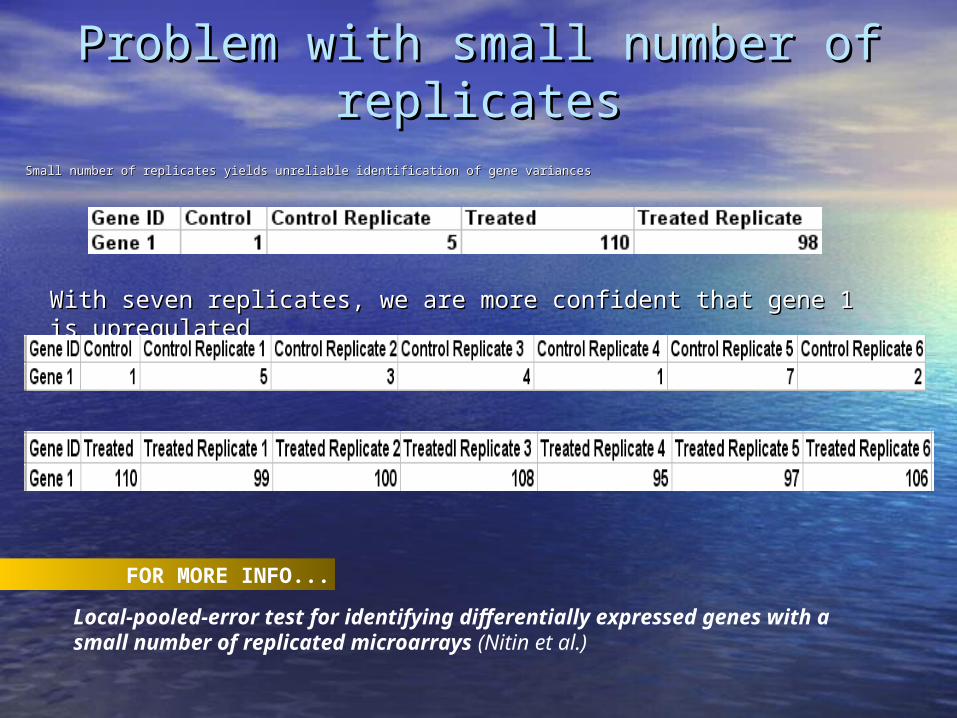
Problem with small number of replicatesProblem with small number of replicates
Small number of replicates yields unreliable identification of gene variancesSmall number of replicates yields unreliable identification of gene variances
FOR MORE INFO...
Local-pooled-error test for identifying differentially expressed genes with a small number of replicated microarrays (Nitin et al.)
With seven replicates, we are more confident that gene 1 is With seven replicates, we are more confident that gene 1 is upregulatedupregulated
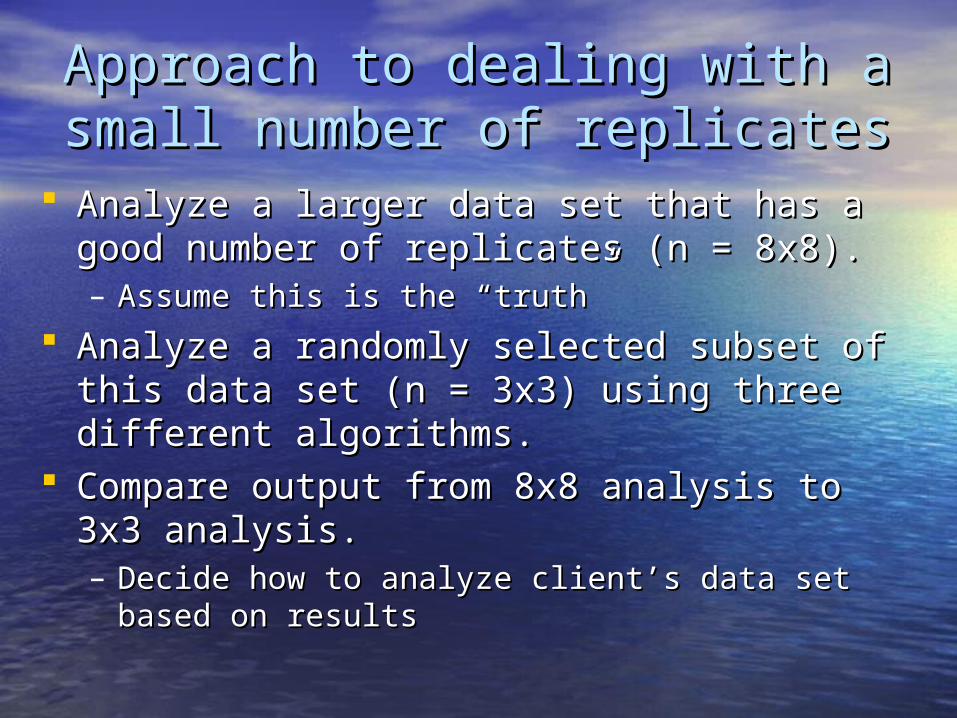
Approach to dealing with a small Approach to dealing with a small number of replicatesnumber of replicates
Analyze a larger data set that has a good number Analyze a larger data set that has a good number of replicates (n = 8x8).of replicates (n = 8x8).– Assume this is the “truth”Assume this is the “truth”
Analyze a randomly selected subset of this data Analyze a randomly selected subset of this data set (n = 3x3) using three different algorithms.set (n = 3x3) using three different algorithms.
Compare output from 8x8 analysis to 3x3 analysis.Compare output from 8x8 analysis to 3x3 analysis.– Decide how to analyze client’s data set based on resultsDecide how to analyze client’s data set based on results
Statistical Analysis AlgorithmsStatistical Analysis Algorithms
SAM: Significance Analysis of MicroarraySAM: Significance Analysis of Microarray
(Tusher, Tibshirani & Chu)(Tusher, Tibshirani & Chu) J-Score (Jim Breaux)J-Score (Jim Breaux) Cyber-T (Baldi & Long)Cyber-T (Baldi & Long)
SAMSAM Each gene receives a score based on the Each gene receives a score based on the
difference in average gene expression relative to difference in average gene expression relative to the standard deviation of the repeated the standard deviation of the repeated measurements.measurements.
Genes with scores greater than a threshold are Genes with scores greater than a threshold are considered significant.considered significant.
This threshold is determined by the false discovery This threshold is determined by the false discovery rate the user desires.rate the user desires.
FOR MORE INFO...
Significance analysis of microarrays applied to the ionizing radiation response(Tusher et al)
J-ScoreJ-Score
Each gene receives a score based on average Each gene receives a score based on average fold-change in gene expression relative to the fold-change in gene expression relative to the standard deviation of the repeated measurements.standard deviation of the repeated measurements.
Cut-off for selection of “significant” genes is Cut-off for selection of “significant” genes is arbitrary.arbitrary.
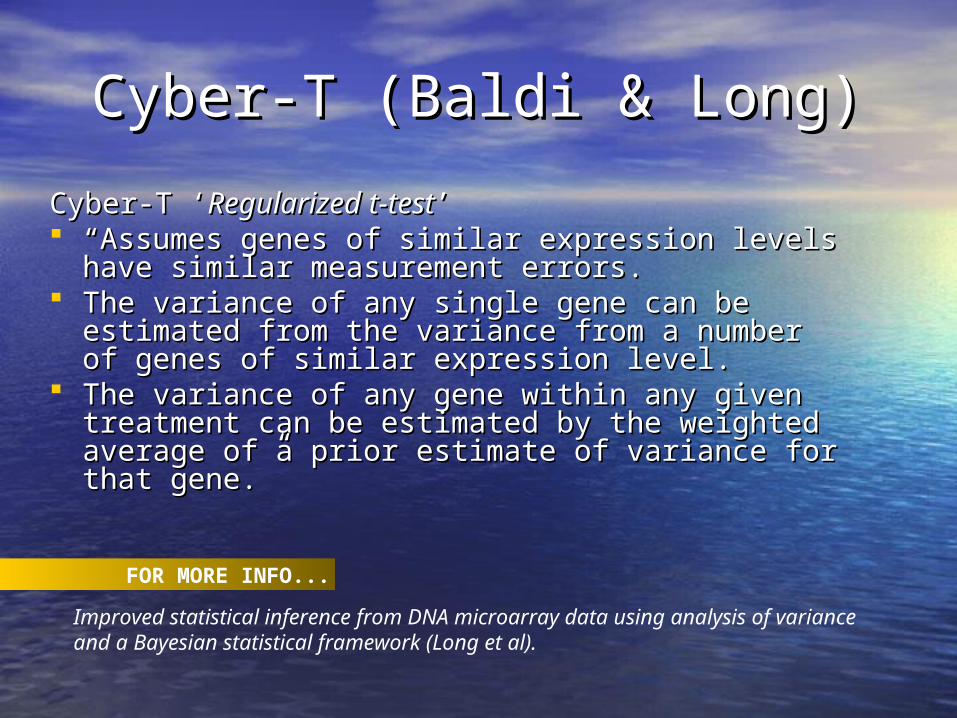
Cyber-T (Baldi & Long)Cyber-T (Baldi & Long)
Cyber-T ‘Cyber-T ‘Regularized t-testRegularized t-test’’ ““Assumes genes of similar expression levels have Assumes genes of similar expression levels have
similar measurement errors.similar measurement errors. The variance of any single gene can be estimated The variance of any single gene can be estimated
from the variance from a number of genes of similar from the variance from a number of genes of similar expression level.expression level.
The variance of any gene within any given treatment The variance of any gene within any given treatment can be estimated by the weighted average of a prior can be estimated by the weighted average of a prior estimate of variance for that gene.”estimate of variance for that gene.”
FOR MORE INFO...
Improved statistical inference from DNA microarray data using analysis of variance and a Bayesian statistical framework (Long et al).
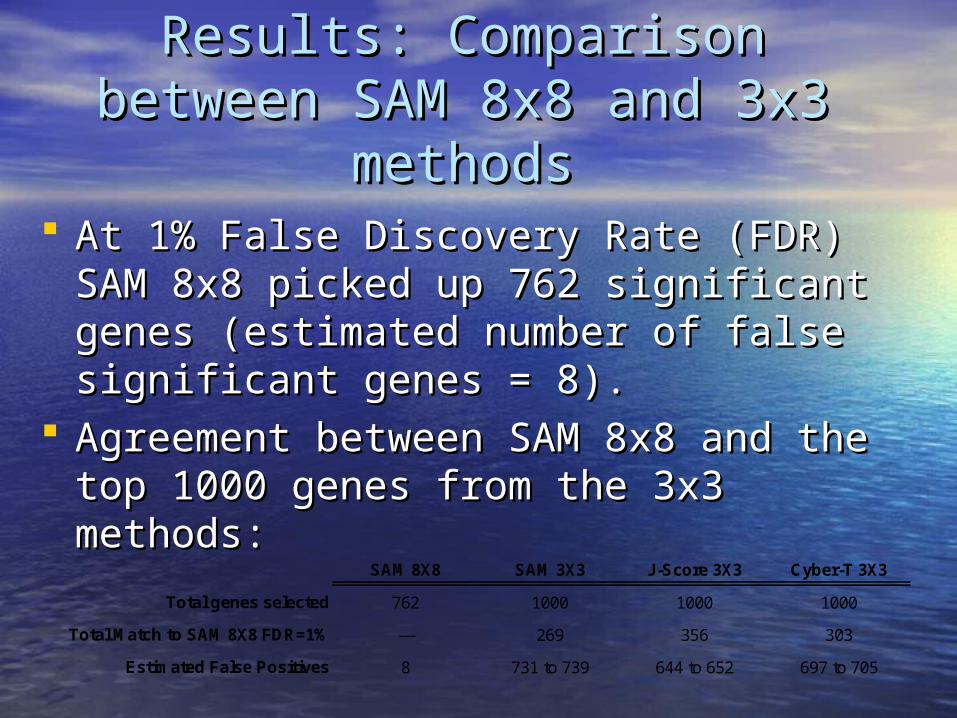
At 1% False Discovery Rate (FDR) SAM At 1% False Discovery Rate (FDR) SAM 8x8 picked up 762 significant genes 8x8 picked up 762 significant genes (estimated number of false significant genes (estimated number of false significant genes = 8).= 8).
Agreement between SAM 8x8 and the top Agreement between SAM 8x8 and the top 1000 genes from the 3x3 methods:1000 genes from the 3x3 methods:
Results: Comparison between SAM Results: Comparison between SAM 8x8 and 3x3 methods8x8 and 3x3 methods
SAM 8X8 SAM 3X3 J-Score 3X3 Cyber-T 3X3
Total genes selected 762 1000 1000 1000
Total Match to SAM 8X8 FDR=1% --- 269 356 303
Estimated False Positives 8 731 to 739 644 to 652 697 to 705
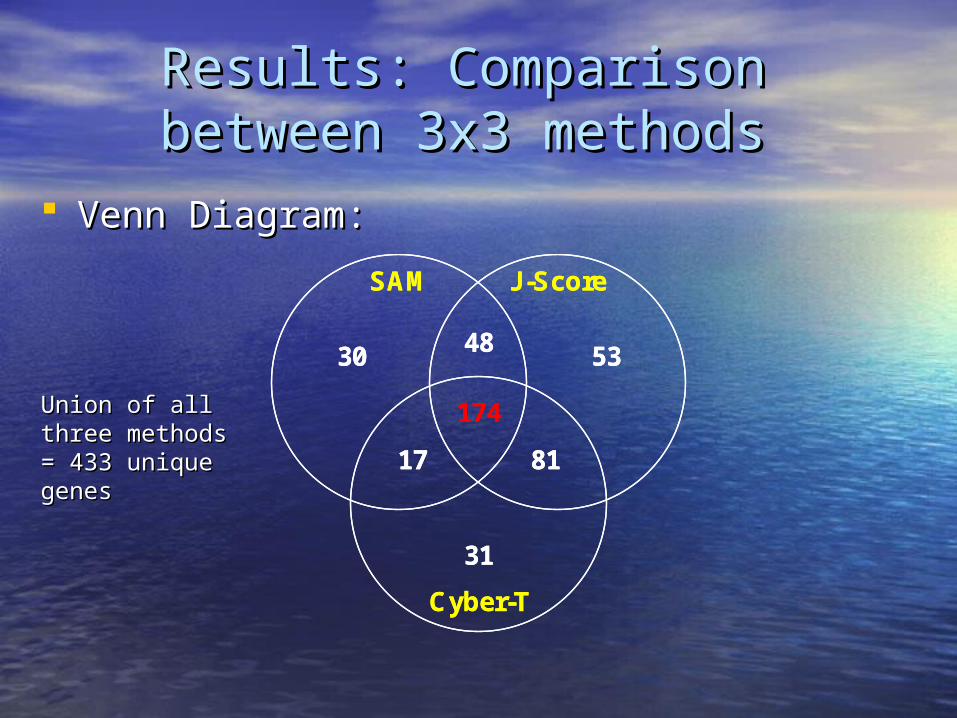
Venn Diagram:Venn Diagram:
48 53
174
31
17 81
J-Score
Cyber-T
30
SAM
48 53
174
31
17 81
J-Score
Cyber-T
30
SAM
Results: Comparison between 3x3 Results: Comparison between 3x3 methodsmethods
Union of all Union of all three methods three methods = 433 unique = 433 unique genesgenes
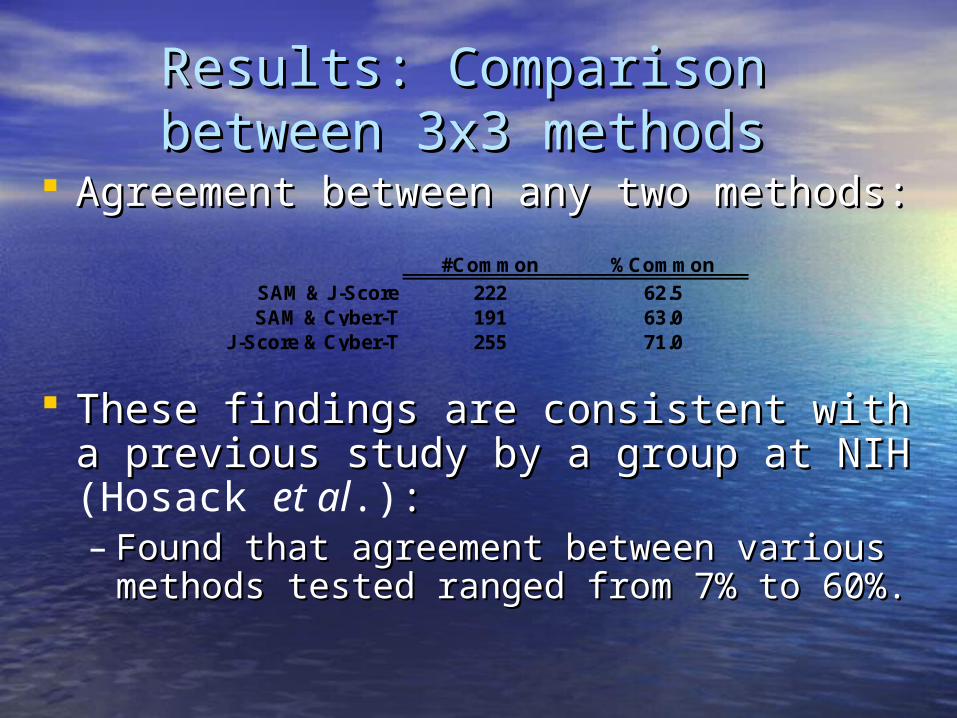
Agreement between any two methods:Agreement between any two methods:
These findings are consistent with a These findings are consistent with a previous study by a group at NIH previous study by a group at NIH (Hosack et al.)::– Found that agreement between various Found that agreement between various
methods tested ranged from 7% to 60%.methods tested ranged from 7% to 60%.
Results: Comparison between 3x3 Results: Comparison between 3x3 methodsmethods
#Common %Common
SAM & J-Score 222 62.5SAM & Cyber-T 191 63.0
J-Score & Cyber-T 255 71.0
Possible Approaches for Final AnalysisPossible Approaches for Final Analysis
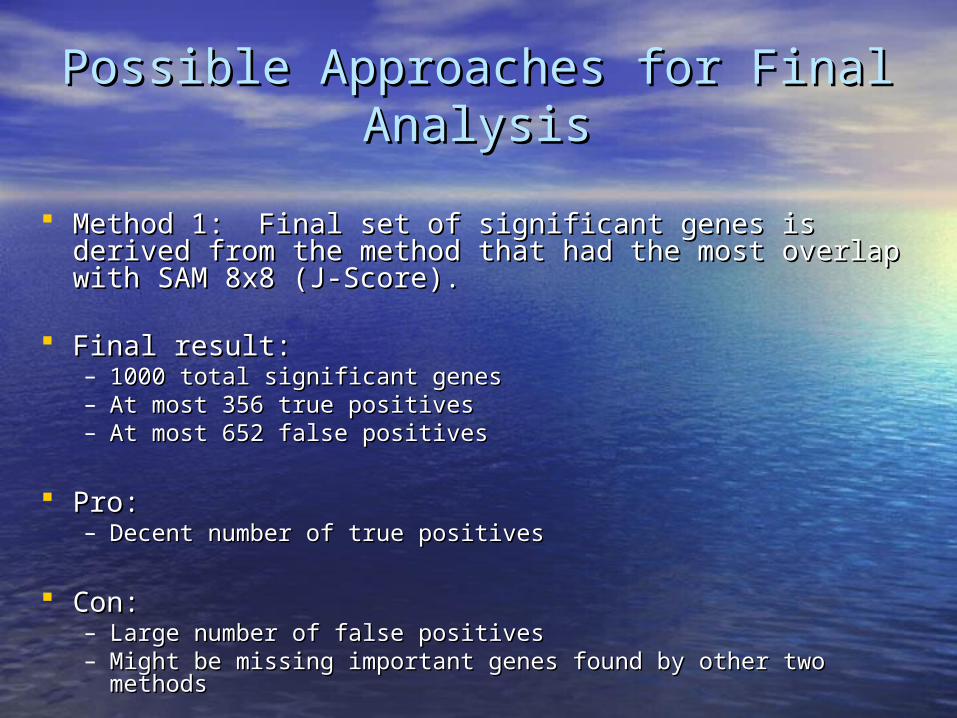
Method 1: Final set of significant genes is derived from the Method 1: Final set of significant genes is derived from the method that had the most overlap with SAM 8x8 (J-Score).method that had the most overlap with SAM 8x8 (J-Score).
Final result:Final result:– 1000 total significant genes1000 total significant genes– At most 356 true positivesAt most 356 true positives– At most 652 false positivesAt most 652 false positives
Pro:Pro:– Decent number of true positivesDecent number of true positives
Con:Con:– Large number of false positivesLarge number of false positives– Might be missing important genes found by other two methodsMight be missing important genes found by other two methods
Possible Approaches for Final AnalysisPossible Approaches for Final Analysis
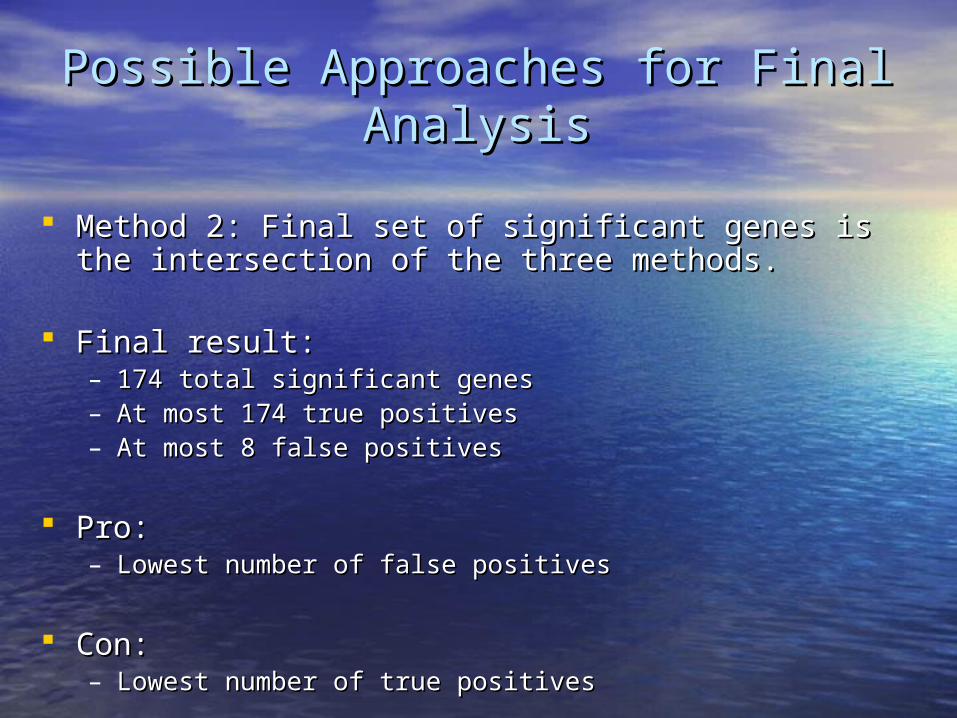
Method 2: Final set of significant genes is the intersection Method 2: Final set of significant genes is the intersection of the three methods.of the three methods.
Final result:Final result:– 174 total significant genes174 total significant genes– At most 174 true positivesAt most 174 true positives– At most 8 false positivesAt most 8 false positives
Pro:Pro:– Lowest number of false positivesLowest number of false positives
Con:Con:– Lowest number of true positivesLowest number of true positives
Possible Approaches for Final AnalysisPossible Approaches for Final Analysis
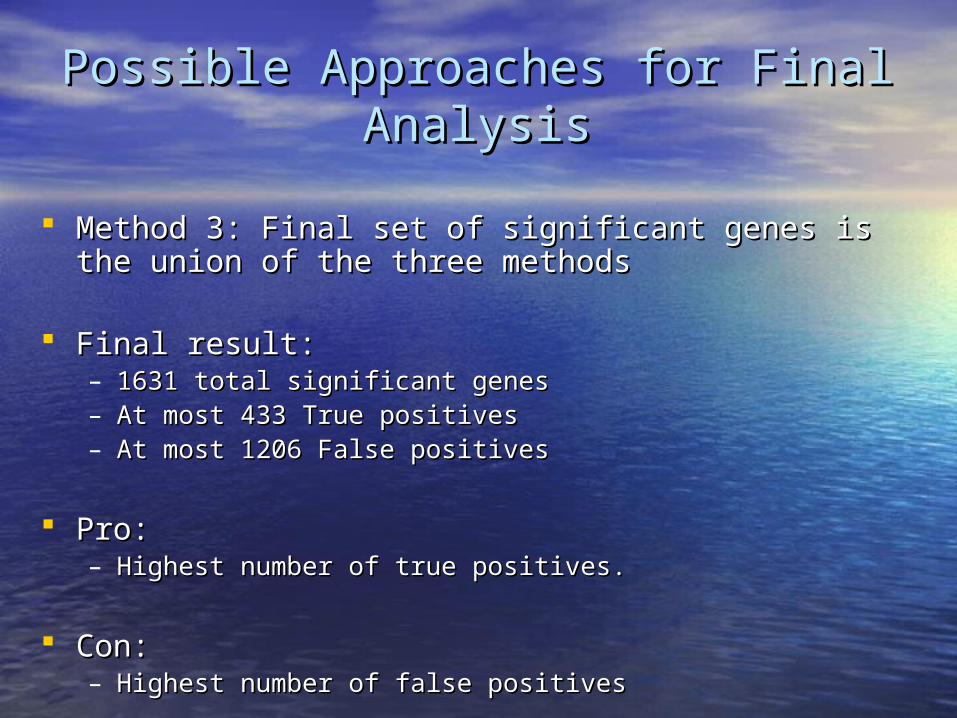
Method 3: Final set of significant genes is the union of the Method 3: Final set of significant genes is the union of the three methodsthree methods
Final result:Final result:– 1631 total significant genes1631 total significant genes– At most 433 True positivesAt most 433 True positives– At most 1206 False positivesAt most 1206 False positives
Pro:Pro:– Highest number of true positives.Highest number of true positives.
Con:Con:– Highest number of false positivesHighest number of false positives

Final ApproachFinal Approach
Return the largest number of true positives to the Return the largest number of true positives to the client (Method 3).client (Method 3).
To deal with large number of potential false To deal with large number of potential false positives in the results, we rank each gene based positives in the results, we rank each gene based on the ranking from Cyber-T, J-Score, and SAM on the ranking from Cyber-T, J-Score, and SAM methods.methods.– For example, if “Gene 02” is ranked number 2 in Cyber-For example, if “Gene 02” is ranked number 2 in Cyber-
T, number 3 in J-Score, and number 4 in SAM, then the T, number 3 in J-Score, and number 4 in SAM, then the overall ranking is (2 + 3 + 4) / 3 = 3overall ranking is (2 + 3 + 4) / 3 = 3
– Higher ranking = more likely to be true positiveHigher ranking = more likely to be true positive
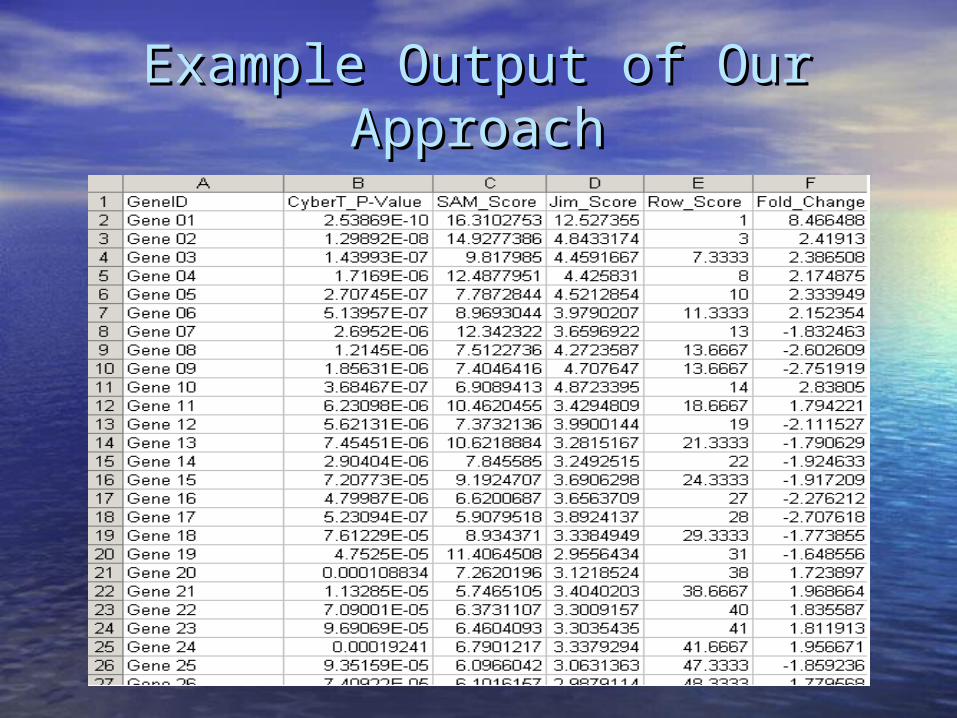
Example Output of Our ApproachExample Output of Our Approach
Functional AnalysisFunctional Analysis
FOR MORE INFO...
http://apps1.niaid.nih.gov/david/http://apps1.niaid.nih.gov/david/
http://www.ariadnegenomics.com/products/pathway.htmlhttp://www.ariadnegenomics.com/products/pathway.html
• Mapping to biological processes.Mapping to biological processes.
-- EASE, the Expression Analysis Systematic EASE, the Expression Analysis Systematic Explorer from the National Institute of Allergy Explorer from the National Institute of Allergy and Infectious Diseases at the National and Infectious Diseases at the National Institute of Health. Institute of Health.
• Mapping to pathways.Mapping to pathways.
-- PathwayAssist software from Ariadne PathwayAssist software from Ariadne Genomics. Genomics.
Mapping to biological processesMapping to biological processes
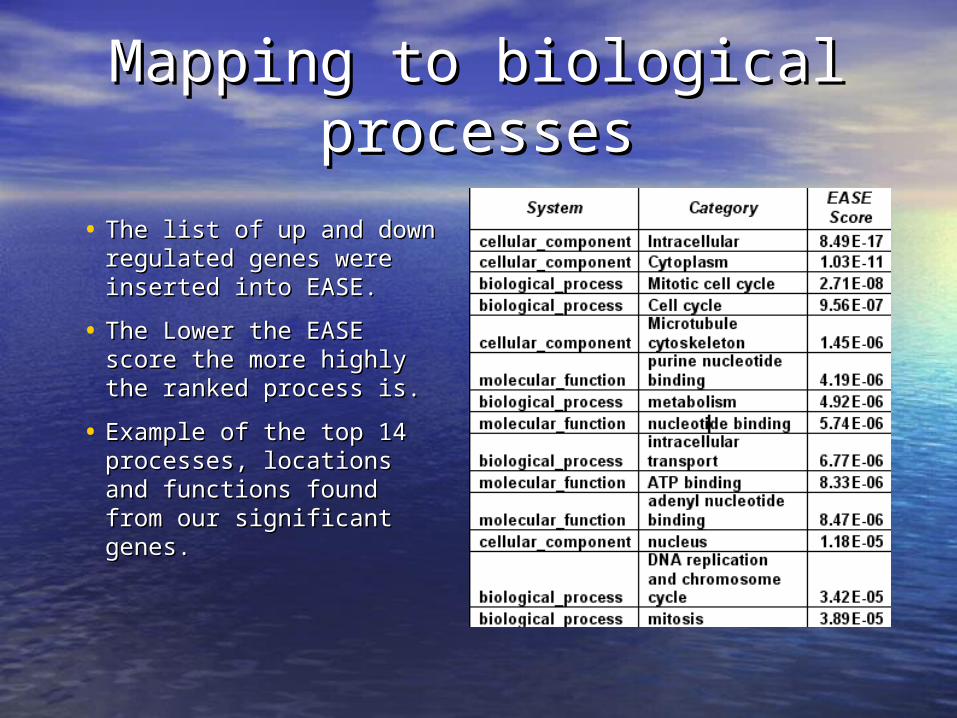
• The list of up and down The list of up and down regulated genes were regulated genes were inserted into EASE.inserted into EASE.
• The Lower the EASE score The Lower the EASE score the more highly the ranked the more highly the ranked process is.process is.
• Example of the top 14 Example of the top 14 processes, locations and processes, locations and functions found from our functions found from our significant genes.significant genes.
Mapping to pathwaysMapping to pathways
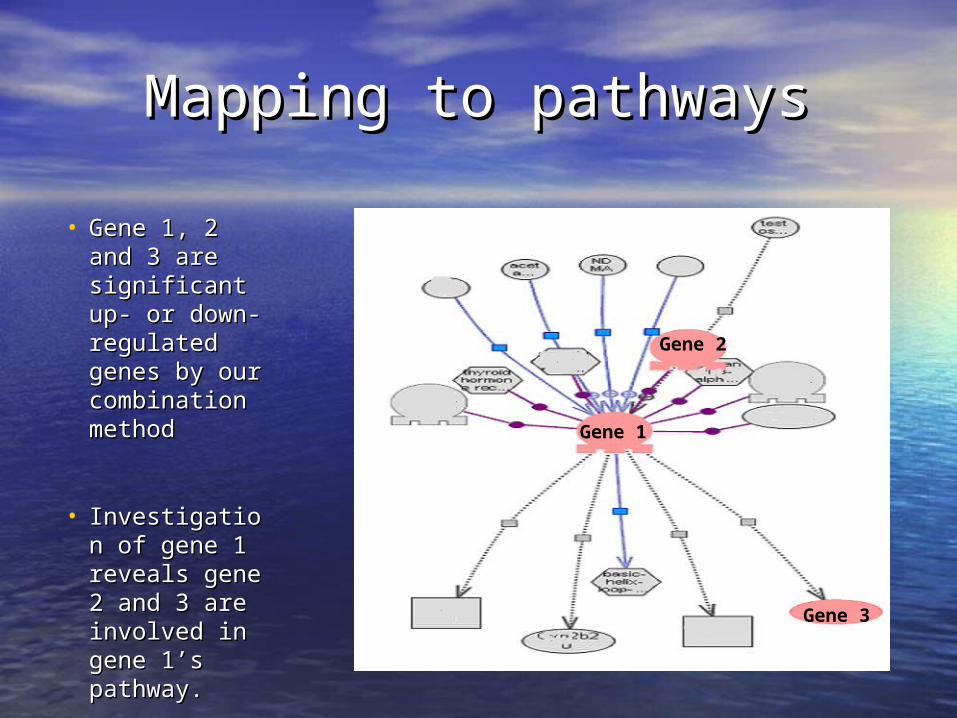
• Gene 1, 2 and Gene 1, 2 and 3 are 3 are significant up- significant up- or down-or down-regulated regulated genes by our genes by our combination combination methodmethod
• Investigation Investigation of gene 1 of gene 1 reveals gene 2 reveals gene 2 and 3 are and 3 are involved in involved in gene 1’s gene 1’s pathway.pathway.
Gene 2
Gene 1
Gene 3
ConclusionConclusion
Three algorithms for selecting differentially Three algorithms for selecting differentially expressed genes produced different lists of genes expressed genes produced different lists of genes with ~60% to 70% agreement.with ~60% to 70% agreement.
Taking the union of the results from the three Taking the union of the results from the three algorithms yielded the most true positives for our algorithms yielded the most true positives for our client.client.
Biological processes and pathways found through Biological processes and pathways found through functional analysis correspond to what we functional analysis correspond to what we expected based on samples studied.expected based on samples studied.– Helps to make microarray results more believable.Helps to make microarray results more believable.

Additional Projects: Chris’s GUIAdditional Projects: Chris’s GUI
Automation of the previously discussed Automation of the previously discussed analyses with a GUI.analyses with a GUI.

Chris’ GUI projectChris’ GUI project
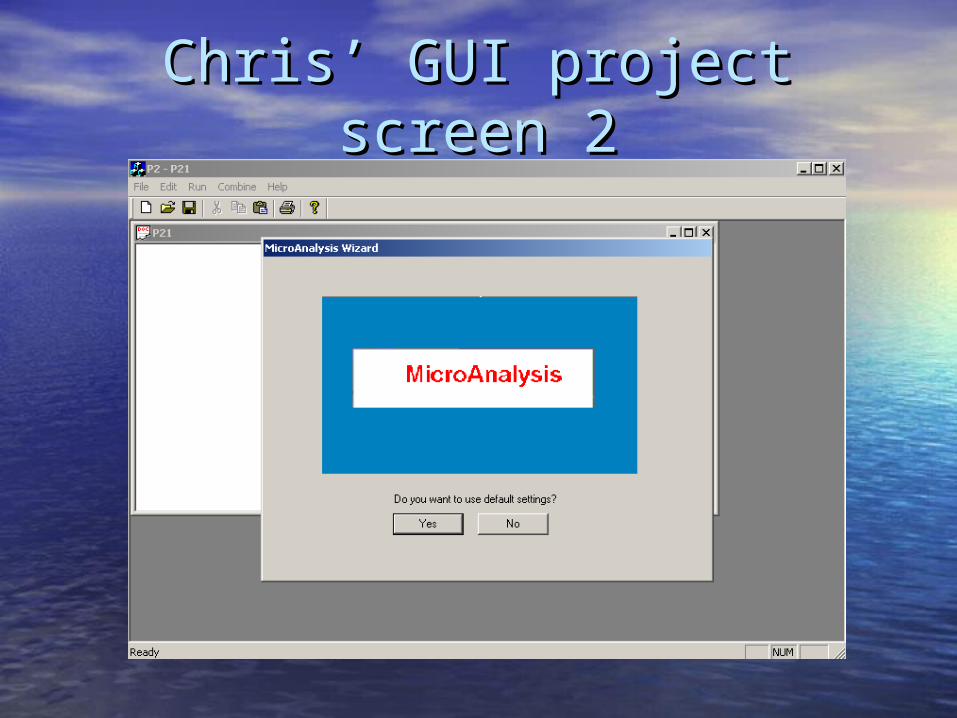
Chris’ GUI project screen 2Chris’ GUI project screen 2
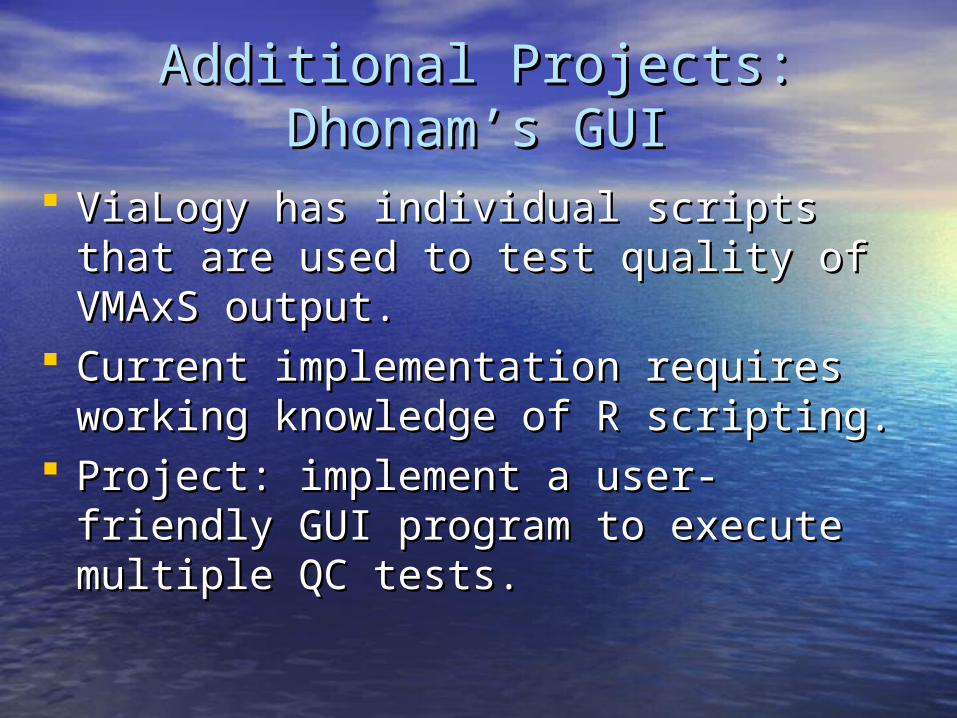
Additional Projects: Dhonam’s GUIAdditional Projects: Dhonam’s GUI
ViaLogy has individual scripts that are used ViaLogy has individual scripts that are used to test quality of VMAxS output.to test quality of VMAxS output.
Current implementation requires working Current implementation requires working knowledge of R scripting.knowledge of R scripting.
Project: implement a user-friendly GUI Project: implement a user-friendly GUI program to execute multiple QC tests.program to execute multiple QC tests.

Dhonam’s GUI Project Screen 1Dhonam’s GUI Project Screen 1
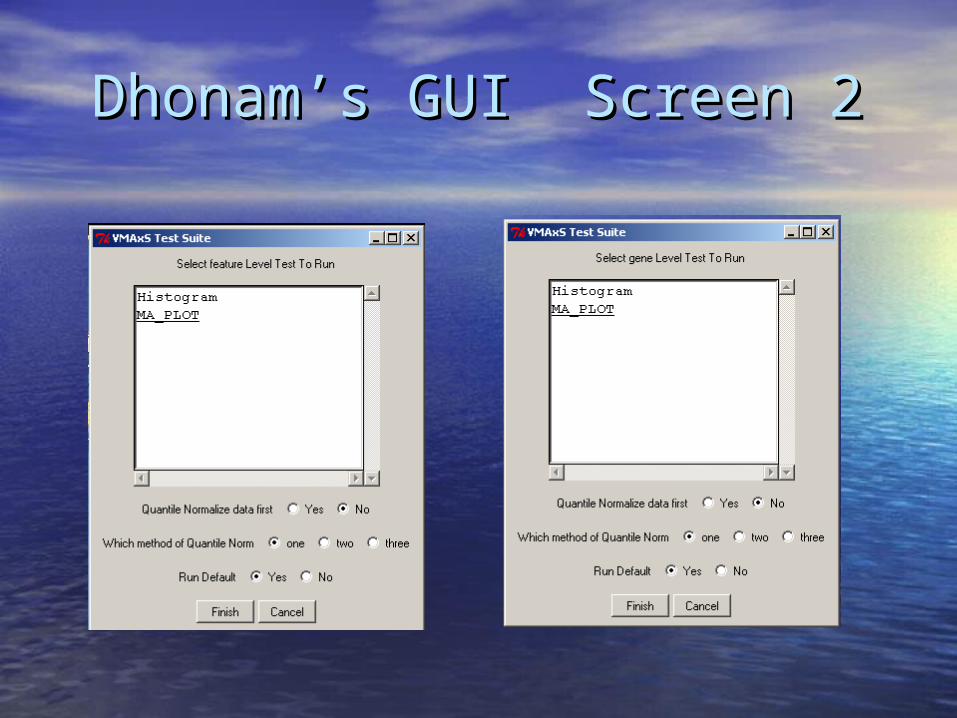
Dhonam’s GUI Screen 2Dhonam’s GUI Screen 2
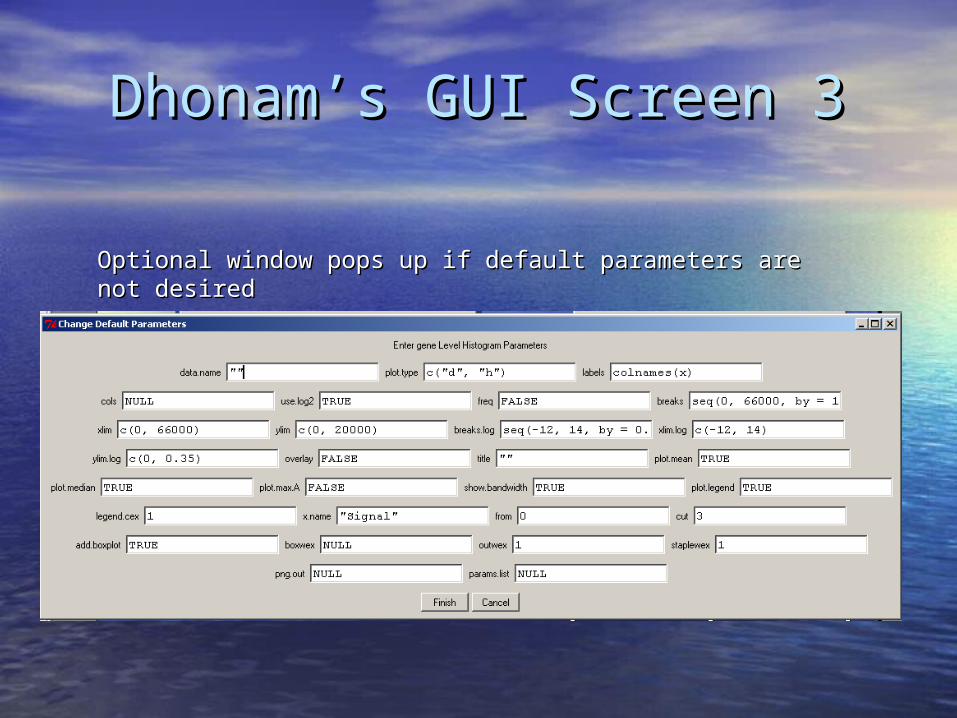
Dhonam’s GUI Screen 3Dhonam’s GUI Screen 3
Optional window pops up if default parameters are not Optional window pops up if default parameters are not desireddesired
AcknowledgementsAcknowledgements
Dr. Sandra SharpDr. Sandra Sharp Dr. Wendie JohnstonDr. Wendie Johnston Dr. Jamil MomandDr. Jamil Momand Dr. Nancy Warter-PerezDr. Nancy Warter-Perez Other SoCalBSI Staff and FacultyOther SoCalBSI Staff and Faculty SoCalBSI 2005 Participants SoCalBSI 2005 Participants Lien Chung (SoCalBSI Lien Chung (SoCalBSI
Participant 2004)Participant 2004)
Dr. Cecilie BoysenDr. Cecilie Boysen Dr. Jim BreauxDr. Jim Breaux Other ViaLogy EmployeesOther ViaLogy Employees
SoCalBSISoCalBSI ViaLogyViaLogy
ReferencesReferences Hosack DA, Dennis GJ, Sherman BT, Lane HC, Lempicki RA: Identifying biological themes within lists of Hosack DA, Dennis GJ, Sherman BT, Lane HC, Lempicki RA: Identifying biological themes within lists of
genes with EASE.Gengenes with EASE.Genome Biolome Biol 2003, 4:R70. 2003, 4:R70. Leslie M. Cope, Irizarry RA, Jaffee HA, Wu J, Speed, TP. A benchmark for Affymetrix GeneChip expression Leslie M. Cope, Irizarry RA, Jaffee HA, Wu J, Speed, TP. A benchmark for Affymetrix GeneChip expression
measures. measures. BioinformaticsBioinformatics 2004;20:323–331 2004;20:323–331 Long, A.D., Mangalam, H.J., Chann, B.Y.P., Tolleri, L., Hatfield, G.W., and Baldi, P. (2001) Improved Long, A.D., Mangalam, H.J., Chann, B.Y.P., Tolleri, L., Hatfield, G.W., and Baldi, P. (2001) Improved
statistical inference from DNA microarray data using analysis of variance and a Bayesian statistical statistical inference from DNA microarray data using analysis of variance and a Bayesian statistical framework. The Journal of Biological Chemistry 276(23):19937-19944.framework. The Journal of Biological Chemistry 276(23):19937-19944.
Nitin Jain, Jayant Thatte, Thomas Braciale, Klaus Ley, Michael O'Connell, Jae K. Lee: Local-pooled-error Nitin Jain, Jayant Thatte, Thomas Braciale, Klaus Ley, Michael O'Connell, Jae K. Lee: Local-pooled-error test for identifying differentially expressed genes with a small number of replicated microarrays. test for identifying differentially expressed genes with a small number of replicated microarrays. Bioinformatics 19(15): 1945-1951 (2003)Bioinformatics 19(15): 1945-1951 (2003)
Processing Affy chip Data: GCOS/MAS 5.0, RMA, and gcRMA (Roger Bumgarner )Processing Affy chip Data: GCOS/MAS 5.0, RMA, and gcRMA (Roger Bumgarner ) Saviozzi S, Calogero RA. 2003. Microarray probe expression measures,.Saviozzi S, Calogero RA. 2003. Microarray probe expression measures,.
data normalization and statistical validation. Comparative and Functional Genomics data normalization and statistical validation. Comparative and Functional Genomics Comp Funct Genom Comp Funct Genom 2003; 4: 442–446.Conference review2003; 4: 442–446.Conference review
Tusher, V.G., Tibshirani, R., and Chu, G. (2001). Significance analysis of microarrays applied to the Tusher, V.G., Tibshirani, R., and Chu, G. (2001). Significance analysis of microarrays applied to the ionizing radiation response, ionizing radiation response, PNASPNAS, 98, 5116-5121, 98, 5116-5121
http://www.tau.ac.il/lifesci/bioinfo/teaching/2002-2003/Differential_Genes_Dec03.ppthttp://www.tau.ac.il/lifesci/bioinfo/teaching/2002-2003/Differential_Genes_Dec03.ppt http://www.kochi-u.ac.jp/~tatataa/RA/RA-targets.htmlhttp://www.kochi-u.ac.jp/~tatataa/RA/RA-targets.html http://www.biostat.jhsph.edu/~ririzarr/Teaching/688/04-preproc-norm.pdf/http://www.biostat.jhsph.edu/~ririzarr/Teaching/688/04-preproc-norm.pdf/ http://nibn.bgu.ac.il/core_units/microarray_facility/microarray_technique.htmhttp://nibn.bgu.ac.il/core_units/microarray_facility/microarray_technique.htm http://www.Vialogy.comhttp://www.Vialogy.com
![PEMBA - Boston Universityquestromworld.bu.edu/grad/files/2019/08/PEMBA... · revised summer 2019 [ 9] pemba total credits required for questrom residency: 32](https://img.pdfslide.net/doc/110x75/603b2feb3badd21ad432d8e9/pemba-boston-uni-revised-summer-2019-9-pemba-total-credits-required-for-questrom.jpg)