Embed Size (px)
Citation preview
Microbial Ecology Dynamics Reveal a Succession in the CoreMicrobiota Involved in the Ripening of Pasta Filata CaciocavalloPugliese Cheese
Ilaria De Pasquale,a Raffaella Di Cagno,a Solange Buchin,b Maria De Angelis,a Marco Gobbettia
Department of Soil, Plant and Food Science, University of Bari Aldo Moro, Bari, Italya; INRA, UR 342, Technologie et Analyses Laitières, Poligny, Franceb
Pyrosequencing of the 16S rRNA targeting RNA, community-level physiological profiles made with Biolog EcoPlates, proteoly-sis, and volatile component (VOC) analyses were mainly used to characterize the manufacture and ripening of the pasta filatacheese Caciocavallo Pugliese. Plate counts revealed that cheese manufacture affected the microbial ecology. The results agreedwith those from culture-independent approaches. As shown by urea-PAGE, reverse-phase high pressure liquid chromatography(RP-HPLC), and free-amino-acid (FAA) analyses, the extent of secondary proteolysis mainly increased after 30 to 45 days of rip-ening. VOCs and volatile free fatty acids (VFFA) were identified by a purge-and-trap method (PT) and solid-phase microextrac-tion (SPME) coupled with gas chromatography-mass spectrometry (GC-MS), respectively. Except for aldehydes, the levels ofmost of VOCs and VFFA mainly increased from 30 to 45 days onwards. As shown through pyrosequencing analysis, raw cows’milk was contaminated by Firmicutes (53%), Proteobacteria (39%), Bacteroidetes (7.8%), Actinobacteria (0.06%), and Fusobacte-ria (0.03%), with heterogeneity at the genus level. The primary starter Streptococcus thermophilus dominated the curd popula-tion. Other genera occurred at low incidence or sporadically. The microbial dynamics reflected on the overall physiological di-versity. At 30 days, a microbial succession was clearly highlighted. The relative abundance of Streptococcus sp. and especially St.thermophilus decreased, while that of Lactobacillus casei, Lactobacillus sp., and especially Lactobacillus paracasei increased con-sistently. Despite the lower relative abundance compared to St. thermophilus, mesophilic lactobacilli were the only organismspositively correlated with the concentration of FAAs, area of hydrophilic peptide peaks, and several VOCs (e.g., alcohols,ketones, esters and all furans). This study showed that a core microbiota was naturally selected during middle ripening, whichseemed to be the main factor responsible for cheese ripening.
Pasta filata cheeses are a group of cheese varieties that origi-nated primarily from the northern Mediterranean area, en-
compassing Italy, Greece, the Balkans, Turkey, and Eastern Eu-rope. Pasta filata cheeses include soft or semisoft varieties,typically consumed fresh or after a short ripening (e.g., high- andlow-moisture mozzarella and pizza cheese). Others are hard orsemihard varieties that undergo considerable ageing before beingconsumed (e.g., provolone, ragusano, and caciocavallo) (1). Lit-erally, the Italian term “pasta filata” means “spun paste” or“stretched curd” and refers to a unique processing step of curdplasticization and stretching. In particular, pasta filata cheeses un-dergo a texturization process that involves soaking of the acidifiedcurd in hot water or salt brine until the plastic consistency isachieved. The hot plastic curd is manually or mechanicallykneaded and stretched to produce a homogeneous cheese with afiber-like structure, which is molded into a variety of shapes (2).
Caciocavallo is one of the most typical Italian pasta filatacheeses and has very wide market popularity. Several types of ca-ciocavallo are manufactured in the Mediterranean area, whichdiffer in their names (e.g., kashkaval, cascaval, kashar, and kasseri)and features of the technology used to produce them. CaciocavalloPugliese is manufactured from raw cows’ milk in the Apulia re-gion. The cheese is sold after 2 weeks of ripening or, more com-monly, after 2 to 4 months or longer (�12 months), only if it hasto be grated. Natural whey or commercial thermophilic culturesare used as primary starters (1, 3).
Previously, culture-dependent approaches were used to deter-mine the microbiological features of ripened Caciocavallo Pug-liese cheese (4), even after the addition of autochthonous non-
starter lactic acid bacteria (NSLAB) or attenuated adjunct cultures(5, 6). The microbial dynamics which lead from raw cows’ milk toripened pasta filata cheese, including all typical manufacturingsteps, had never been thoroughly described, and deep-sequencingapproaches had never been used.
The microbial contribution to cheese flavor is mainly deter-mined by the protocol of cheese making. During the manufactureof pasta filata cheeses, the main role of starter cultures is to syn-thesize enough lactic acid to demineralize and transform the curdinto the state that undergoes stretching in hot water at the targetpH. Primary starters provide the most significant contribution tothe microbial biomass in young curd, typically attaining densitiesof �108 CFU g�1 within 1 day and declining throughout ripening(7). This decline marks the beginning of a presumptive microbialsuccession, which should involve the appearance of adventitiousmicroorganisms, mainly represented by NSLAB (7, 8). NSLABderive from raw milk (9) or the dairy environment and equipmentsurfaces (10), and their growth may be affected by primary starters
Received 25 June 2014 Accepted 28 July 2014
Published ahead of print 1 August 2014
Editor: M. W. Griffiths
Address correspondence to Raffaella Di Cagno, [email protected].
Supplemental material for this article may be found at http://dx.doi.org/10.1128/AEM.02097-14.
Copyright © 2014, American Society for Microbiology. All Rights Reserved.
doi:10.1128/AEM.02097-14
October 2014 Volume 80 Number 19 Applied and Environmental Microbiology p. 6243– 6255 aem.asm.org 6243
on March 4, 2018 by guest
http://aem.asm
.org/D
ownloaded from

(11). Although an extensive body of literature (7, 9, 12) has de-scribed the sources and factors affecting the growth of NSLAB, thetransition between primary starters and NSLAB during ripeningof pasta filata caciocavallo cheese had not been examined throughdeep-sequencing approaches.
The most recent literature (13, 14) shows how deep-sequenc-ing approaches are successful in describing the structure and evo-lution of the cheese microbiota. None of these studies establishedthe influence of the successive microbial populations on proteol-ysis and synthesis of volatile components during cheese ripening.Recently, one study proposed a polyphasic approach to find the insitu causal relationship between microbiota composition and pro-teolysis of raw ewes’ milk pecorino cheese (15). When used for thepasta filata cheese Caciocavallo Pugliese, this approach might pro-vide new insights regarding (i) raw cows’ milk as the source ofmicrobial diversity; (ii) the cheese manufacture, including the ad-dition of primary starters, as the main factor influencing microbialdiversity; (iii) the unpredictable and dynamic occurrence ofNSLAB; and (iv) the causal relationship among technology, mi-crobiota, and features of pasta filata cheese.
This study used a polyphasic approach, which was based onpyrosequencing of the 16S rRNA targeting RNA, community-level physiological profiles obtained with Biolog EcoPlates, andproteolysis and volatile-component analyses to characterize thepasta filata cheese Caciocavallo Pugliese during manufacture andripening.
MATERIALS AND METHODSManufacture of cheese. Caciocavallo Pugliese was manufactured withraw cows’ milk (Friesian cow breed), using commercial freeze-dried(Sacco, Cadorago, Como, Italy) primary starter Streptococcus thermophi-lus (initial cell count of ca. 7.0 � 0.2 log CFU ml�1 of milk). The manu-facture was carried out at the industrial plant Ignalat (vat of about 200liters), located in Noci, Bari (Apulia region), Italy. Cheese making wascarried out on 3 consecutive days (total of 3 batches), using cows’ milkfrom 2 daily milkings. All the results were the averages for 3 batches, whichwere analyzed in triplicate (total of 9 samples analyzed). Raw cows’ milkwas heated at 37°C and inoculated with primary starter, and liquid calfrennet (10 ml 100 l�1) was added. Coagulation took place within 30 min.The coagulum was first cut coarsely by hand, held under whey at 37°C for2 h, and then reduced mechanically to particles of 1.5 to 2 cm. When thecurd reached a pH of 5.25 (ca. 5 h, at room temperature), it was stretchedin hot water (80°C). Cheeses were salted in brine (30% [wt/vol] NaCl) for12 h. Ripening was at ca. 10°C and a relative humidity of 83% for 90 days.The weight of the cheese was approximately 1.5 kg. Raw cows’ milk, curdimmediately after coagulation, curd after 5 h of incubation (when the pHreached ca. 5.25), curd after stretching, and cheeses after 1 (C1), 3 (C3), 7(C7), 15 (C15), 30 (C30), 45 (C45), 60 (C60), 75 (C75), and 90 (C90) daysof ripening (after brine treatment) were collected from each batch. Allsamples were transported to the laboratory in thermal plastic bags underrefrigerated conditions (ca. 4°C) and analyzed immediately (microbiolog-ical analysis and community-level catabolic profiles) or frozen (�80°C)(biochemical analysis and extraction of total bacterial genomic RNA).
Compositional, microbiological, and biochemical analyses. Sam-ples of milk, curd, and cheese were analyzed for protein (16), fat (17),moisture (oven drying at 102°C) (18), and salt (19). The pH was measuredby a Foodtrode electrode (Hamilton, Bonaduz, Switzerland). The rawcows’ milk used had the following composition: pH 6.7; fat, 3.8%; protein,3.7%; lactose, 4.9%; and salt, 0.09%. No significant (P � 0.05) differenceswere found between the 3 batches.
Microbiological analyses were carried out as described previously(20). Twenty grams of sample was homogenized with 180 ml of sterilesodium citrate (2% [wt/vol]) solution. Presumptive mesophilic lactoba-
cilli and lactococci were enumerated on MRS and M17 agar (Oxoid),respectively, under anaerobiosis at 30°C for 48 h. Presumptive thermo-philic streptococci were enumerated on M17 agar (Oxoid, Basingstoke,Hampshire, United Kingdom) under anaerobiosis at 42°C for 48 h. En-terococci were counted on Slanetz and Bartley agar (Oxoid) at 37°C for 48h. The number of yeasts was estimated at 30°C for 48 h on Sabourauddextrose agar (SDA) (Oxoid) medium supplemented with chloramphen-icol (0.1 g liter�1). The number of molds was estimated on wort agar(Oxoid) at 25°C for 5 days. Total coliforms were counted using violet redbile lactose (Oxoid) at 37°C for 24 h. Except for enterococci, the media forplating bacteria were supplemented with cycloheximide at 0.1 g liter�1.
The pH 4.6-insoluble and -soluble nitrogen fractions of the cheeseswere analyzed by urea polyacrylamide gel electrophoresis (urea-PAGE)and reverse-phase high pressure liquid chromatography (RP-HPLC), asdescribed by Andrews (21) and Gobbetti et al. (4), respectively. Total andindividual free amino acids (FAA) from the water-soluble extracts weredetermined by a Biochrom 30 series amino acid analyzer (Biochrom Ltd.,Cambridge Science Park, United Kingdom), as described by Di Cagno etal. (22).
Determinations of volatile components and volatile free fatty acids.Neutral volatile components (VOC) were determined by a purge-and-trap method (PT) coupled with gas chromatography-mass spectrometry(PT–GC-MS). Prior to PT, 3 g of cheese was mixed with 27 g of ultra-high-quality (UHQ) deionized water with an Ultra-Turrax 4 times for 40 s eachtime, separated by 10-s rests, in a glass flask with a narrow neck plungedinto ice. Ten milliliters of this suspension was placed in a glass extractorconnected to the PT apparatus (Tekmar 3000; Agilent Instruments, NY,USA). Extraction was performed with helium at a flow rate of 40 ml min�1
on a Tenax trap at 37°C. The trap was desorbed at 225°C, and injectionused a cryoconcentrator at �150°C. The chromatograph (model 6890;Agilent Instruments) was equipped with a DB5-like capillary column(RTX5 Restek; Agilent Instruments) with a 60-m length, 0.32-�m internaldiameter, and 1-�m thickness. The helium flow rate was 2 ml min�1; theoven temperature was 40°C during the first 6 min and then was increasedat 3°C min�1 to 230°C. The mass detector (MSD5973; Agilent Instru-ments) was used in electronic impact at 70 eV and in scan mode, at anatomic mass from 29 to 206. Quantification of compounds was expressedin arbitrary units of area.
For solid-phase microextraction (SPME) extraction of volatile freefatty acids (VFFA), each sample was analyzed twice with two differentdilutions. A 400- or 1,000-�l portion of the suspension described abovewas poured into a 10-ml flask with 100 �l of 2 N sulfuric acid and 1,200 �lof UHQ water. The flask was sealed and placed in a bath at 60°C for 15min. An SPME Carboxen-polydimethylsiloxane 75-�m fiber (Supelco,L’Isle d’Abeau, France) was introduced into the flask and held in theheadspace for 30 min at 60°C. It was then removed and desorbed for 5 minin a splitless chromatograph injector at 240°C. The chromatograph(CE8160; Thermoquest, Les Ulis, France) was equipped with an FFAPcolumn with a 30-m length, 0.53-�m diameter, and 1-�m thickness (Sta-bilwax DA; Restek, Lisses, France) and a flame ionization detector (FID).The helium flow rate was 6 ml min�1; the oven temperature was 120°C for1 min, was increased to 162°C at 1.8°C min�1 and to 240°C at 10°C min�1,and lastly was held at 240°C for 5 min. Concentrations of VFFAs werecalculated from calibration curves established with external standards(Sigma, L’Isle d’Abeau, France).
Extraction of total bacterial genomic RNA. Total RNA was extractedusing the RiboPure bacterial kit (Ambion RNA; Life Technologies Co.,Carlsbad, CA, USA), according to the manufacturer’s instructions. Thequality of the RNA was checked by agarose gel electrophoresis. The RNAconcentration was measured in a NanoDrop ND-1000 spectrophotome-ter (NanoDrop Technologies, Rockland, DE). The purified RNA (100 ng;final volume, 20 �l) was incubated at 42°C for 2 min in 2 �l of genomicDNA (gDNA) wipeout buffer (7�; QuantiTect reverse transcription kit;Qiagen srl, Milan, Italy) and RNase-free water (final volume, 14 �l). ThecDNA was obtained with the QuantiTect reverse transcription kit
De Pasquale et al.
6244 aem.asm.org Applied and Environmental Microbiology
on March 4, 2018 by guest
http://aem.asm
.org/D
ownloaded from
(Qiagen), according to the manufacturer’s instructions. All reactions wereset up in a Rotor Gene 6000 instrument (Corbett Life Science, New SouthWales, Australia) equipped with a 36-well reaction rotor.
Pyrosequencing and data analyses. Three cDNA samples, corre-sponding to the three batches, were pooled and used for 16S based bacte-rial diversity analysis. Bacterial diversity was assessed via pyrosequencingon a 454 FLX sequencer (454 Life Sciences, Branford, CT, USA) and wasperformed by Research and Testing Laboratories (Lubbock, TX), accord-ing to standard laboratory procedures. Primers targeting the V1-V3 re-gion (Escherichia coli positions 27 to 519; forward, 28F [GAGTTTGATCNTGGCTCAG], and reverse, 519R [GTNTTACNGCGGCKGCTG]) ofthe 16S rRNA gene (23) were used. Pyrosequencing procedures were car-ried out based upon protocols from Research and Testing Laboratories.
Bioinformatics. Sequence data were processed using Researchand Testing Laboratory’s in-house pipeline, described at http://www.researchandtesting.com/. Briefly, sequences were grouped using theirbarcodes, and any sequence that contained a low-quality barcode or thatfailed to be at least half the expected amplicon length (or 250 bp, which-ever was shorter) was removed from the data pool. Sequences that passedthe quality filter were denoised using an algorithm based on USEARCH(24) and then checked for chimeras using UCHIME (25). Finally, se-quence data were separated into operational taxonomic units (OTUs) andannotated using USEARCH and a distributed .NET algorithm that utilizesBLASTN�. The output from BLASTN� was then parsed, and the taxo-nomic information for each sequence was resolved using the followingrules: sequences with more than 97% identity to well-characterized data-base sequences (�3% divergence) were resolved at the species level, thosewith 95% to 97% at the genus level, those with 90% to 95% at the familylevel, those with 85% to 90% at the order level, those with 80 to 85% at theclass level, and those with 77% to 80% at the phylum level. Any matchbelow this percent identity was discarded. In addition, the highest-scoringpair had to be at least 75% of the query sequence or it was discarded,regardless of identity.
Community level catabolic profiles (CLCPs). Biolog Eco-Micro-plates (Biolog, Inc., Hayward, CA, USA) were used to determine bacterialCLCPs (26). Microplates contain 31 carbon sources grouped by chemicalclass (carbohydrates, carboxylic acids, polymers, amino acids and amines)and the control, without a carbon source, in triplicate. Ten grams of sam-ple was homogenized with 90 ml of sterile sodium chloride (0.9% [wt/vol]) solution and centrifuged at 10,000 � g for 15 min at 4°C. The pelletwas washed with sterile 50 mM Tris-HCl (pH 7.0) and again with sterilesodium chloride solution and then centrifuged again. The cell suspensionwas diluted (1:1,000) in sterile sodium chloride solution and dispensed(150 �l) into each of the 96 wells of the Biolog Eco-Microplates. Incuba-tion was at 30°C in the dark, and color development was measured at 590nm with a microplate reader (Biolog Microstation), every 24 h up to 120 h.Three indices were determined (27). Shannon’s diversity (H=), indicatingthe substrate utilization pattern, was calculated as ��pi ln(pi), where pi isthe ratio of the activity of a particular substrate to the sums of activities ofall substrate activity at 120 h. Substrate richness (S), measuring the num-ber of different substrates used, was calculated as the number of wells witha corrected absorbance greater than 0.25. Substrate evenness (E) was de-fined as the equitability of activities across all utilized substrates: E H=/log(S).
Statistical analyses. Data were subjected to one-way analysis of vari-ance (ANOVA), and pairwise comparison of treatment means wasachieved by Tukey’s procedure at a P value of �0.05, using the statisticalsoftware Statistica 7.0 for Windows. Data for VOC and VFFA analyseswere subjected to permutation analysis using PermutMatrix (28).
RESULTSCompositional and microbiological analyses. Table S1 in thesupplemental material shows the main chemical composition ofCaciocavallo Pugliese during manufacture and ripening. As ex-pected, the pH decreased from the curd immediately after coagu-
lation (6.40 � 0.04) to the curd after ca. 5 h of incubation (5.28 �0.02). An increase (5.62 � 0.03) was found after curd stretching,followed by a decrease at the beginning of ripening (5.24 � 0.01)until 30 days of ripening (5.09 � 0.03). Then, the pH increasedover time, reaching 5.36 � 0.04 at 90 days and varying only slightlyduring ripening. The highest increase in the NaCl concentrationwas found at the beginning of ripening, even though it progres-sively rose over time. As expected, the cheese moisture decreasedprogressively during ripening, reaching a value of 38.1 � 1.5% at90 days. The concentration of fat and protein inversely followedthe moisture trend. At 90 days, the cheese had 33.1% � 1.5% fatand 23.8% � 1.5% protein.
Presumptive mesophilic lactobacilli were already present in theraw cows’ milk (4.2 � 0.2 log CFU g�1) (Table 1). Their numbersincreased by ca. 1.4 log cycles after curd incubation and decreasedafter curd stretching (4.1 � 0.2 log CFU g�1). During ripening,presumptive mesophilic lactobacilli progressively increased, espe-cially after 30 days (7.2 � 0.1 log CFU g�1), and attained thehighest number during late aging (average value of ca. 8.5 log CFUg�1). Compared to mesophilic lactobacilli, raw cows’ milk con-tained a slight but significantly (P � 0.05) higher number of pre-sumptive mesophilic lactococci, which decreased after curdstretching (4.1 � 0.1 log CFU g�1) and remained almost constantthroughout ripening. As expected, a high number of presumptivethermophilic streptococci was found after coagulation and incu-bation of the curd (average value of ca. 8.7 log CFU g�1). Althoughthe number decreased by ca. 1 log cycle after stretching of the curd,it progressively increased up to 15 days (9.0 � 0.3 log CFU g�1).From 30 days onwards, the number decreased and attained thelowest value at the end of ripening (7.3 � 0.1 log CFU g�1). En-terococci were found in the raw cows’ milk (2.6 � 0.1 log CFUg�1), and the number increased after 1 day of ripening (4.1 � 0.2log CFU g�1) and remained almost constant for 15 days but de-creased during late ripening (from 30 to 90 days). Yeasts andmolds disappeared during ripening and manufacture, respec-tively. Total coliforms were detected in the raw cows’ milk butprogressively disappeared.
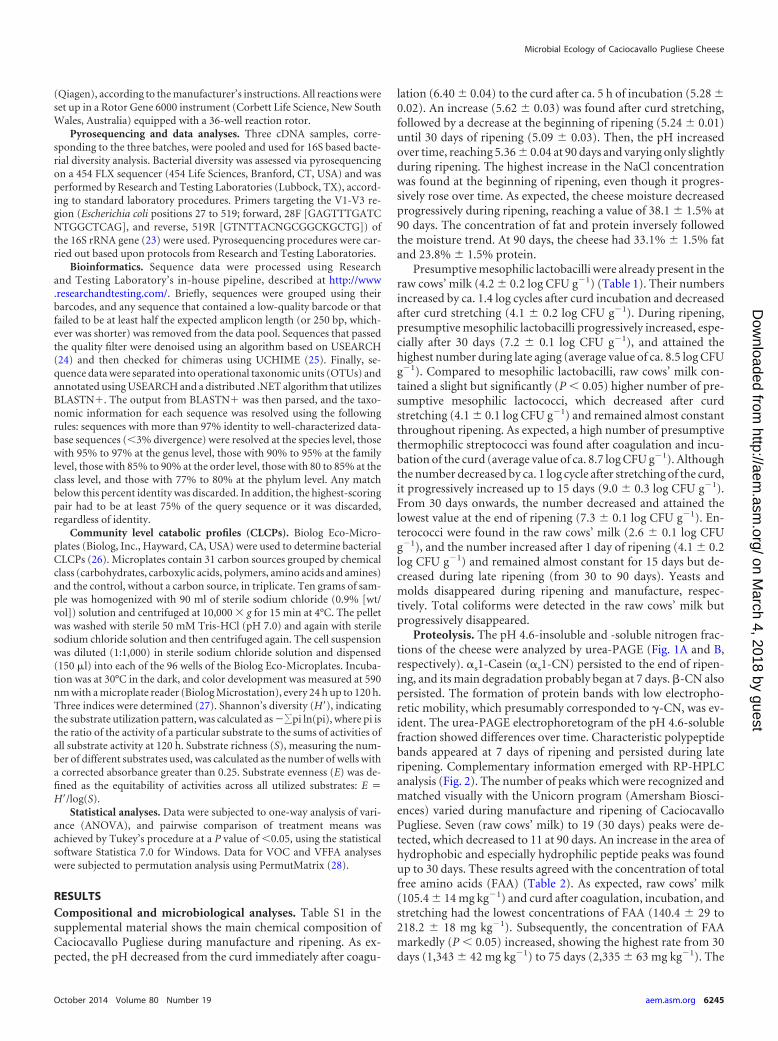
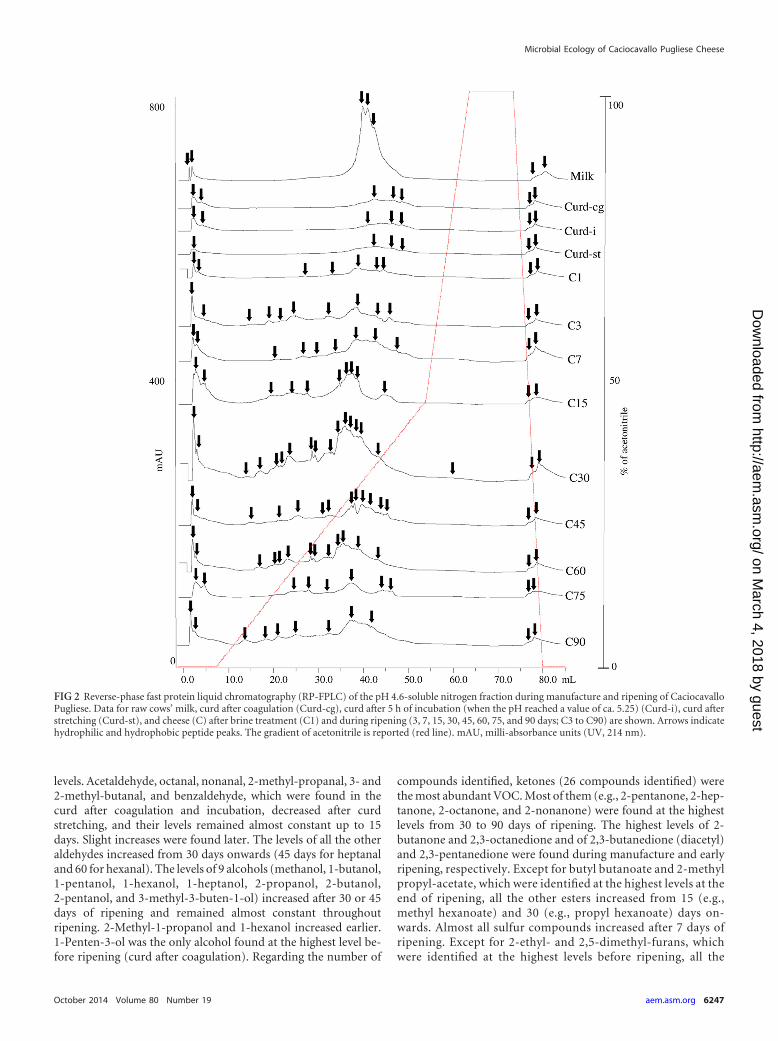
Proteolysis. The pH 4.6-insoluble and -soluble nitrogen frac-tions of the cheese were analyzed by urea-PAGE (Fig. 1A and B,respectively). s1-Casein (s1-CN) persisted to the end of ripen-ing, and its main degradation probably began at 7 days. �-CN alsopersisted. The formation of protein bands with low electropho-retic mobility, which presumably corresponded to �-CN, was ev-ident. The urea-PAGE electrophoretogram of the pH 4.6-solublefraction showed differences over time. Characteristic polypeptidebands appeared at 7 days of ripening and persisted during lateripening. Complementary information emerged with RP-HPLCanalysis (Fig. 2). The number of peaks which were recognized andmatched visually with the Unicorn program (Amersham Biosci-ences) varied during manufacture and ripening of CaciocavalloPugliese. Seven (raw cows’ milk) to 19 (30 days) peaks were de-tected, which decreased to 11 at 90 days. An increase in the area ofhydrophobic and especially hydrophilic peptide peaks was foundup to 30 days. These results agreed with the concentration of totalfree amino acids (FAA) (Table 2). As expected, raw cows’ milk(105.4 � 14 mg kg�1) and curd after coagulation, incubation, andstretching had the lowest concentrations of FAA (140.4 � 29 to218.2 � 18 mg kg�1). Subsequently, the concentration of FAAmarkedly (P � 0.05) increased, showing the highest rate from 30days (1,343 � 42 mg kg�1) to 75 days (2,335 � 63 mg kg�1). The
Microbial Ecology of Caciocavallo Pugliese Cheese
October 2014 Volume 80 Number 19 aem.asm.org 6245
on March 4, 2018 by guest
http://aem.asm
.org/D
ownloaded from

FAA found at the highest concentrations (�100 mg kg�1) wereSer, Cys, Val, Ile, Leu, Phe, His, Trp, Lys, Arg, and Pro.
Volatile components. Volatile components (VOC) (95 in to-tal) were identified by PT-GC/MS. VOC belonged to severalchemical classes: aldehydes (17), alcohols (19), ketones (26), es-ters (14), sulfur compounds (7), and furans (8). The levels of 80VOC significantly (P � 0.05) differentiated samples during man-ufacture and ripening (Fig. 3; also, see Table S2 in the supplemen-tal material). Overall, aldehydes were the VOC found at the lowestT
AB
LE1
Cel
lnu
mbe
rs,d
eter
min
edby
acu
ltu
re-d
epen
den
tm
eth
od,o
fvar
iou
sm
icro
bial
grou
psdu
rin
gm
anu
fact
ure
and
ripe
nin
gof
Cac
ioca
vallo
Pu
glie
se
Mic
robi
algr
oup
Log
CFU
g�1
ina:
Milk
Cu
rd-c
gbC
urd
-ic
Cu
rd-s
td
Ch
eese
atin
dica
ted
day
ofri
pen
ing
1e3
715
3045
6075
90
Mes
oph
ilic
lact
obac
illi
4.2
�0.
2F
5.2
�0.
1D
E5.
6�
0.1
D4.
1�
0.2
F5.
0�
0.1
E5.
1�
0.3
E6.
2�
0.3
C6.
6�
0.3
C7.
2�
0.1
B7.
5�
0.5
B8.
4�
0.2
A8.
6�
0.2
A8.
5�
0.3
A
Mes
oph
ilic
lact
ococ
ci5.
2�
0.1
A5.
3�
0.3
A5.
5�
0.2
A4.
1�
0.1
C4.
2�
0.4
C4.
3�
0.4
C4.
2�
0.2
C4.
6�
0.1
B4.
5�
0.3
B4.
4�
0.4
B4.
6�
0.3
B4.
2�
0.2
C4.
0�
0.1
B
Th
erm
oph
ilic
stre
ptoc
occi
4.7
�0.
1E
8.6
�0.
2B
8.8
�0.
2B
7.9
�0.
2C
8.8
�0.
4B
8.9
�0.
2B
9.3
�0.
2A
9.0
�0.
3A
8.2
�0.
1C
8.1
�0.
2C
8.0
�0.
2C
7.7
�0.
3C
D7.
3�
0.1
D
En
tero
cocc
i2.
6�
0.1
E3.
9�
0.2
B4.
3�
0.2
A3.
5�
0.2
C4.
1�
0.2
AB
4.0
�0.
1A
B4.
3�
0.2
A4.
1�
0.2
AB
3.0
�0.
1D
2.5
�0.
1E
2.0
�0.
2F
1.7
�0.
2G
1.5
�0.
2G
Yea
sts
3.4
�0.
2B
4.5
�0.
1A
5.4
�0.
3A
3.7
�0.
1B
3.7
�0.
1B
2.6
�0.
1C
2.4
�0.
2C
2.3
�0.
1C
1.8
�0.
2D
�1
�1
�1
�1
Mol
ds2.
3�
0.0
A2.
2�
0.1
B2.
1�
0.1
C�
1�
1�
1�
1�
1�
1�
1�
1�
1�
1
Tot
alco
lifor
ms
3.4
�0.
2C
D4.
4�
0.1
B5.
2�
0.3
A3.
2�
0.1
C2.
7�
0.2
CD
2.5
�0.
2C
D2.
3�
0.1
D2.
9�
0.1
CD
2.4
�0.
2D
2.4
�0.
1D
�1
�1
�1
aD
ata
are
mea
ns
�st
anda
rdde
viat
ion
sfo
rtw
oba
tch
esof
each
type
ofch
eese
,an
alyz
edin
trip
licat
e.D
ata
inth
esa
me
row
wit
hdi
ffer
ent
lett
ers
are
sign
ifica
ntl
ydi
ffer
ent
(P�
0.05
).b
Cu
rdaf
ter
coag
ula
tion
.c
Cu
rdaf
ter
5h
ofin
cuba
tion
,wh
enth
epH
reac
hed
ava
lue
ofca
.5.2
5.d
Cu
rdaf
ter
stre
tch
ing.
eC
urd
afte
rbr
ine
trea
tmen
t.
FIG 1 Urea-polyacrylamide gel electrophoresis (PAGE) of pH 4.6-insoluble(A) and -soluble (B) nitrogen fractions during manufacture and ripening ofCaciocavallo Pugliese. Lanes: 1, bovine casein (CN) standard; 2, curd aftercoagulation; 3, curd after 5 h of incubation (when the pH reached a value of ca.5.25); 4, curd after stretching and molding; 5 to 13, cheese (after brine treat-ment) after 1, 3, 7, 15, 30, 45, 60, 75, and 90 days of ripening, respectively.
De Pasquale et al.
6246 aem.asm.org Applied and Environmental Microbiology
on March 4, 2018 by guest
http://aem.asm
.org/D
ownloaded from
levels. Acetaldehyde, octanal, nonanal, 2-methyl-propanal, 3- and2-methyl-butanal, and benzaldehyde, which were found in thecurd after coagulation and incubation, decreased after curdstretching, and their levels remained almost constant up to 15days. Slight increases were found later. The levels of all the otheraldehydes increased from 30 days onwards (45 days for heptanaland 60 for hexanal). The levels of 9 alcohols (methanol, 1-butanol,1-pentanol, 1-hexanol, 1-heptanol, 2-propanol, 2-butanol,2-pentanol, and 3-methyl-3-buten-1-ol) increased after 30 or 45days of ripening and remained almost constant throughoutripening. 2-Methyl-1-propanol and 1-hexanol increased earlier.1-Penten-3-ol was the only alcohol found at the highest level be-fore ripening (curd after coagulation). Regarding the number of
compounds identified, ketones (26 compounds identified) werethe most abundant VOC. Most of them (e.g., 2-pentanone, 2-hep-tanone, 2-octanone, and 2-nonanone) were found at the highestlevels from 30 to 90 days of ripening. The highest levels of 2-butanone and 2,3-octanedione and of 2,3-butanedione (diacetyl)and 2,3-pentanedione were found during manufacture and earlyripening, respectively. Except for butyl butanoate and 2-methylpropyl-acetate, which were identified at the highest levels at theend of ripening, all the other esters increased from 15 (e.g.,methyl hexanoate) and 30 (e.g., propyl hexanoate) days on-wards. Almost all sulfur compounds increased after 7 days ofripening. Except for 2-ethyl- and 2,5-dimethyl-furans, whichwere identified at the highest levels before ripening, all the
FIG 2 Reverse-phase fast protein liquid chromatography (RP-FPLC) of the pH 4.6-soluble nitrogen fraction during manufacture and ripening of CaciocavalloPugliese. Data for raw cows’ milk, curd after coagulation (Curd-cg), curd after 5 h of incubation (when the pH reached a value of ca. 5.25) (Curd-i), curd afterstretching (Curd-st), and cheese (C) after brine treatment (C1) and during ripening (3, 7, 15, 30, 45, 60, 75, and 90 days; C3 to C90) are shown. Arrows indicatehydrophilic and hydrophobic peptide peaks. The gradient of acetonitrile is reported (red line). mAU, milli-absorbance units (UV, 214 nm).
Microbial Ecology of Caciocavallo Pugliese Cheese
October 2014 Volume 80 Number 19 aem.asm.org 6247
on March 4, 2018 by guest
http://aem.asm
.org/D
ownloaded from
TA
BLE
2Le
vels
ofFA
Ain
Cac
ioca
vallo
Pu
glie
sedu
rin
gm
anu
fact
ure
and
ripe
nin
g
FAA
Mea
nco
ncn
ofFA
A(m
gkg
�1)
ina:
Milk
Cu
rd-c
gbC
urd
-ic
Cu
rd-s
td
Ch
eese
atin
dica
ted
day
ofri
pen
ing
1e3
715
3045
6075
90
Asp
0.0
0.0
0.0
4.5
9.4
11.3
11.3
23.0
40.0
47.6
55.1
56.9
59.6
Th
r0.
04.
95.
75.
05.
05.
96.
07.
37.
88.
59.
412
.616
.4Se
r11
.016
.516
.917
.217
.517
.918
.520
.228
.139
.666
.412
2.5
133.
3G
lu10
.015
.515
.621
.724
.025
.024
.730
.531
.329
.337
.638
.939
.9G
ly2.
44.
54.
96.
46.
716
.616
.824
.517
.622
.531
.242
.042
.2A
la6.
17.
27.
89.
215
.512
.015
.827
.526
.128
.848
.644
.447
.3C
ys2.
13.
24.
911
.517
.917
.718
.849
.212
2.6
130.
813
8.3
190.
119
0.5
Val
14.7
18.6
22.3
4.3
7.2
8.0
7.3
12.9
66.5
70.5
103.
114
4.6
149.
6M
et3.
14.
24.
80.
03.
03.
54.
57.
216
.613
.229
.955
.557
.7Il
e2.
85.
47.
610
.515
.614
.215
.645
.014
1.0
141.
514
1.8
175.
318
5.1
Leu
10.3
11.0
11.3
6.7
10.3
9.6
13.6
20.4
161.
719
1.1
267.
936
1.0
372.
1T
yr4.
58.
88.
910
.318
.819
.324
.938
.710
6.7
132.
712
0.0
45.5
53.8
Ph
e8.
29.
913
.818
.916
.317
.514
.828
.911
3.7
133.
417
4.4
242.
923
9.6
His
2.3
2.7
4.2
5.9
15.6
21.1
25.4
35.2
71.4
85.4
95.6
121.
713
8.7
Trp
0.0
2.2
2.0
1.7
12.6
32.1
18.4
62.4
90.8
98.1
99.3
176.
318
3.6
Orn
1.0
3.1
3.4
10.5
14.3
17.5
21.3
26.4
28.8
47.0
49.6
134.
912
6.6
Lys
9.8
10.3
15.5
25.5
29.1
34.8
32.6
49.7
80.7
91.1
117.
313
2.9
148.
5A
rg0.
00.
02.
16.
413
.614
.813
.335
.310
3.6
119.
915
3.8
109.
510
6.9
Pro
17.1
12.4
24.3
42.0
44.1
45.6
43.8
54.9
88.3
111.
211
9.2
127.
513
4.6
Tot
al10
5.4
�14
H14
0.4
�29
G17
5.9
�24
G21
8.2
�18
F29
6.5
�19
F34
4.4
�31
E34
7.4
�32
E59
9.2
�19
D13
43�
42C
1542
.2�
51C
1858
.5�
58B
2335
�63
A24
26�
51A
aD
ata
are
mea
ns
�st
anda
rdde
viat
ion
sfo
rtw
oba
tch
esof
each
type
ofch
eese
,an
alyz
edin
trip
licat
e.D
ata
inth
esa
me
row
wit
hdi
ffer
ent
lett
ers
are
sign
ifica
ntl
ydi
ffer
ent
(P�
0.05
).b
Cu
rdaf
ter
coag
ula
tion
.c
Cu
rdaf
ter
5h
ofin
cuba
tion
,wh
enth
epH
reac
hed
ava
lue
ofca
.5.2
5.d
Cu
rdaf
ter
stre
tch
ing.
eC
hee
seaf
ter
brin
etr
eatm
ent.
De Pasquale et al.
6248 aem.asm.org Applied and Environmental Microbiology
on March 4, 2018 by guest
http://aem.asm
.org/D
ownloaded from
others furans increased after 15 (e.g., 2-methyl furan) and 30(e.g., furfural) days onwards.
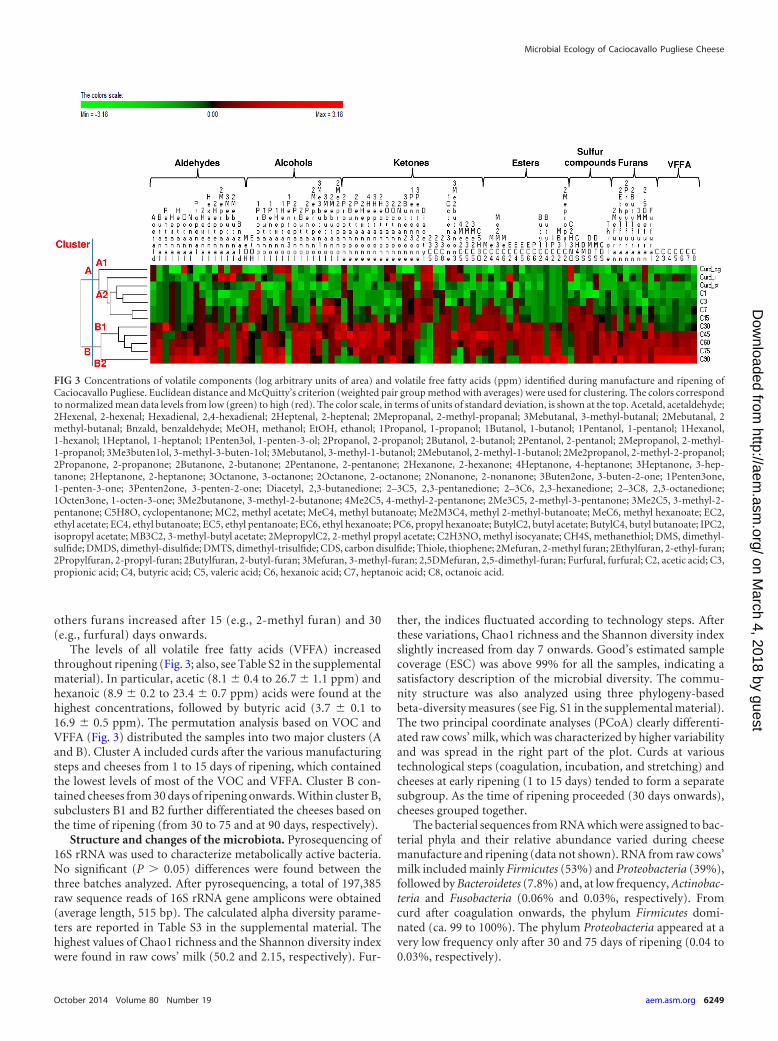
The levels of all volatile free fatty acids (VFFA) increasedthroughout ripening (Fig. 3; also, see Table S2 in the supplementalmaterial). In particular, acetic (8.1 � 0.4 to 26.7 � 1.1 ppm) andhexanoic (8.9 � 0.2 to 23.4 � 0.7 ppm) acids were found at thehighest concentrations, followed by butyric acid (3.7 � 0.1 to16.9 � 0.5 ppm). The permutation analysis based on VOC andVFFA (Fig. 3) distributed the samples into two major clusters (Aand B). Cluster A included curds after the various manufacturingsteps and cheeses from 1 to 15 days of ripening, which containedthe lowest levels of most of the VOC and VFFA. Cluster B con-tained cheeses from 30 days of ripening onwards. Within cluster B,subclusters B1 and B2 further differentiated the cheeses based onthe time of ripening (from 30 to 75 and at 90 days, respectively).
Structure and changes of the microbiota. Pyrosequencing of16S rRNA was used to characterize metabolically active bacteria.No significant (P � 0.05) differences were found between thethree batches analyzed. After pyrosequencing, a total of 197,385raw sequence reads of 16S rRNA gene amplicons were obtained(average length, 515 bp). The calculated alpha diversity parame-ters are reported in Table S3 in the supplemental material. Thehighest values of Chao1 richness and the Shannon diversity indexwere found in raw cows’ milk (50.2 and 2.15, respectively). Fur-
ther, the indices fluctuated according to technology steps. Afterthese variations, Chao1 richness and the Shannon diversity indexslightly increased from day 7 onwards. Good’s estimated samplecoverage (ESC) was above 99% for all the samples, indicating asatisfactory description of the microbial diversity. The commu-nity structure was also analyzed using three phylogeny-basedbeta-diversity measures (see Fig. S1 in the supplemental material).The two principal coordinate analyses (PCoA) clearly differenti-ated raw cows’ milk, which was characterized by higher variabilityand was spread in the right part of the plot. Curds at varioustechnological steps (coagulation, incubation, and stretching) andcheeses at early ripening (1 to 15 days) tended to form a separatesubgroup. As the time of ripening proceeded (30 days onwards),cheeses grouped together.
The bacterial sequences from RNA which were assigned to bac-terial phyla and their relative abundance varied during cheesemanufacture and ripening (data not shown). RNA from raw cows’milk included mainly Firmicutes (53%) and Proteobacteria (39%),followed by Bacteroidetes (7.8%) and, at low frequency, Actinobac-teria and Fusobacteria (0.06% and 0.03%, respectively). Fromcurd after coagulation onwards, the phylum Firmicutes domi-nated (ca. 99 to 100%). The phylum Proteobacteria appeared at avery low frequency only after 30 and 75 days of ripening (0.04 to0.03%, respectively).
FIG 3 Concentrations of volatile components (log arbitrary units of area) and volatile free fatty acids (ppm) identified during manufacture and ripening ofCaciocavallo Pugliese. Euclidean distance and McQuitty’s criterion (weighted pair group method with averages) were used for clustering. The colors correspondto normalized mean data levels from low (green) to high (red). The color scale, in terms of units of standard deviation, is shown at the top. Acetald, acetaldehyde;2Hexenal, 2-hexenal; Hexadienal, 2,4-hexadienal; 2Heptenal, 2-heptenal; 2Mepropanal, 2-methyl-propanal; 3Mebutanal, 3-methyl-butanal; 2Mebutanal, 2methyl-butanal; Bnzald, benzaldehyde; MeOH, methanol; EtOH, ethanol; 1Propanol, 1-propanol; 1Butanol, 1-butanol; 1Pentanol, 1-pentanol; 1Hexanol,1-hexanol; 1Heptanol, 1-heptanol; 1Penten3ol, 1-penten-3-ol; 2Propanol, 2-propanol; 2Butanol, 2-butanol; 2Pentanol, 2-pentanol; 2Mepropanol, 2-methyl-1-propanol; 3Me3buten1ol, 3-methyl-3-buten-1ol; 3Mebutanol, 3-methyl-1-butanol; 2Mebutanol, 2-methyl-1-butanol; 2Me2propanol, 2-methyl-2-propanol;2Propanone, 2-propanone; 2Butanone, 2-butanone; 2Pentanone, 2-pentanone; 2Hexanone, 2-hexanone; 4Heptanone, 4-heptanone; 3Heptanone, 3-hep-tanone; 2Heptanone, 2-heptanone; 3Octanone, 3-octanone; 2Octanone, 2-octanone; 2Nonanone, 2-nonanone; 3Buten2one, 3-buten-2-one; 1Penten3one,1-penten-3-one; 3Penten2one, 3-penten-2-one; Diacetyl, 2,3-butanedione; 2–3C5, 2,3-pentanedione; 2–3C6, 2,3-hexanedione; 2–3C8, 2,3-octanedione;1Octen3one, 1-octen-3-one; 3Me2butanone, 3-methyl-2-butanone; 4Me2C5, 4-methyl-2-pentanone; 2Me3C5, 2-methyl-3-pentanone; 3Me2C5, 3-methyl-2-pentanone; C5H8O, cyclopentanone; MC2, methyl acetate; MeC4, methyl butanoate; Me2M3C4, methyl 2-methyl-butanoate; MeC6, methyl hexanoate; EC2,ethyl acetate; EC4, ethyl butanoate; EC5, ethyl pentanoate; EC6, ethyl hexanoate; PC6, propyl hexanoate; ButylC2, butyl acetate; ButylC4, butyl butanoate; IPC2,isopropyl acetate; MB3C2, 3-methyl-butyl acetate; 2MepropylC2, 2-methyl propyl acetate; C2H3NO, methyl isocyanate; CH4S, methanethiol; DMS, dimethyl-sulfide; DMDS, dimethyl-disulfide; DMTS, dimethyl-trisulfide; CDS, carbon disulfide; Thiole, thiophene; 2Mefuran, 2-methyl furan; 2Ethylfuran, 2-ethyl-furan;2Propylfuran, 2-propyl-furan; 2Butylfuran, 2-butyl-furan; 3Mefuran, 3-methyl-furan; 2,5DMefuran, 2,5-dimethyl-furan; Furfural, furfural; C2, acetic acid; C3,propionic acid; C4, butyric acid; C5, valeric acid; C6, hexanoic acid; C7, heptanoic acid; C8, octanoic acid.
Microbial Ecology of Caciocavallo Pugliese Cheese
October 2014 Volume 80 Number 19 aem.asm.org 6249
on March 4, 2018 by guest
http://aem.asm
.org/D
ownloaded from
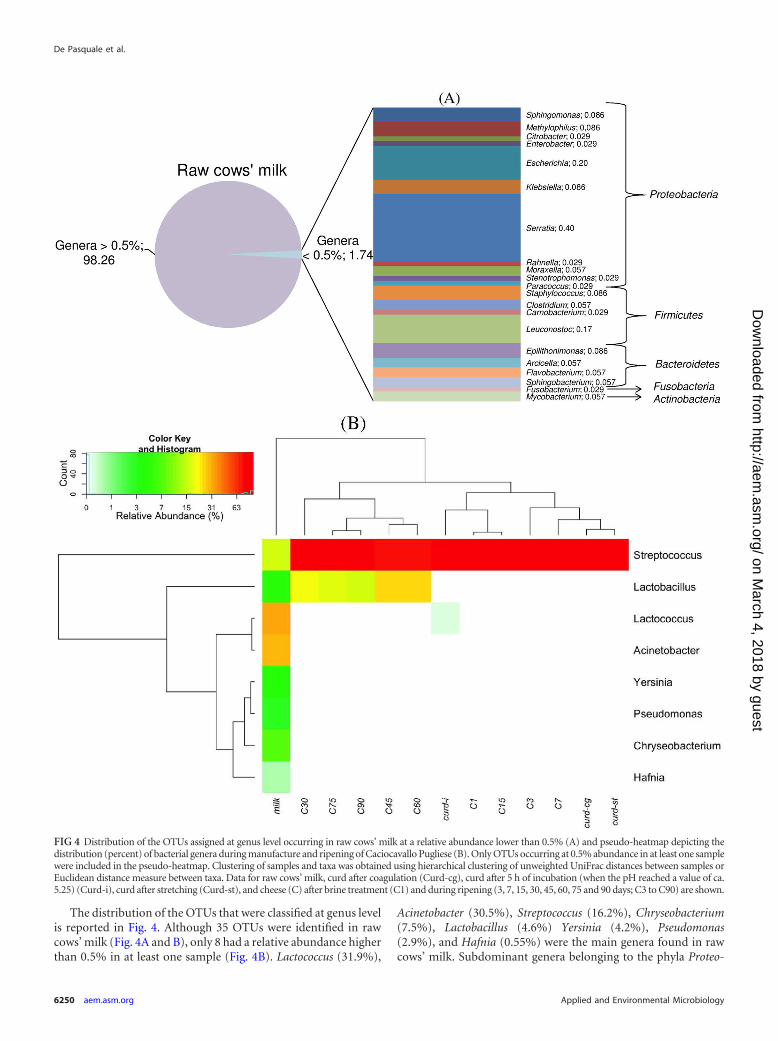
The distribution of the OTUs that were classified at genus levelis reported in Fig. 4. Although 35 OTUs were identified in rawcows’ milk (Fig. 4A and B), only 8 had a relative abundance higherthan 0.5% in at least one sample (Fig. 4B). Lactococcus (31.9%),
Acinetobacter (30.5%), Streptococcus (16.2%), Chryseobacterium(7.5%), Lactobacillus (4.6%) Yersinia (4.2%), Pseudomonas(2.9%), and Hafnia (0.55%) were the main genera found in rawcows’ milk. Subdominant genera belonging to the phyla Proteo-
FIG 4 Distribution of the OTUs assigned at genus level occurring in raw cows’ milk at a relative abundance lower than 0.5% (A) and pseudo-heatmap depicting thedistribution (percent) of bacterial genera during manufacture and ripening of Caciocavallo Pugliese (B). Only OTUs occurring at 0.5% abundance in at least one samplewere included in the pseudo-heatmap. Clustering of samples and taxa was obtained using hierarchical clustering of unweighted UniFrac distances between samples orEuclidean distance measure between taxa. Data for raw cows’ milk, curd after coagulation (Curd-cg), curd after 5 h of incubation (when the pH reached a value of ca.5.25) (Curd-i), curd after stretching (Curd-st), and cheese (C) after brine treatment (C1) and during ripening (3, 7, 15, 30, 45, 60, 75 and 90 days; C3 to C90) are shown.
De Pasquale et al.
6250 aem.asm.org Applied and Environmental Microbiology
on March 4, 2018 by guest
http://aem.asm
.org/D
ownloaded from
bacteria (Sphingomonas, Methylophilus, Citrobacter, Enterobacter,Escherichia, Klebsiella, Serratia, Rahnella, Moraxella, Paracoccus,and Stenotrophomonas) (0.40 to 0.029%), Firmicutes (Staphylococ-cus, Clostridium, Carnobacterium, and Leuconostoc) (0.17 to0.029%), Bacteroidetes (Epilithonimonas, Arcicella, Flavobacte-rium, and Sphingobacterium) (0.086 to 0.057%), Fusobacteria(Fusobacterium) (0.029%), and Actinobacteria (Mycobacterium)(0.057%) were also found at very low frequency (Fig. 4A). Asexpected, the bacterial profile of the curd after the inoculum of theprimary starter (St. thermophilus) and coagulation markedlychanged and became dominated by Streptococcus (100%) (Fig.4B). At this manufacturing step, all the other genera were notdetectable. Only in the curd after incubation was Streptococcusaccompanied by Lactococcus (0.22%) and Lactobacillus at very lowfrequency (0.04%). From the curd after stretching to 15 days ofripening, Streptococcus still dominated (ca. 99%) and Lactobacilluswas present in low numbers. In agreement with the numbers ofpresumptive thermophilic streptococci and mesophilic lactoba-cilli (Table 1), Streptococcus and Lactobacillus, respectively, de-creased (80.7%) and increased (19.2%) at 30 days of ripening.This trend maintained throughout ripening, and at 90 days thebacterial profile of the Caciocavallo Pugliese was characterized byStreptococcus (79.2%), followed by Lactobacillus (20.1%). Othergenera, occasionally and in low abundance, were also present. Inparticular, Paracraurococcus, Pseudoalteromonas, and Rhodococcus(after 30 days) and Azospirillum and Gelria (after 75 days) werefound.
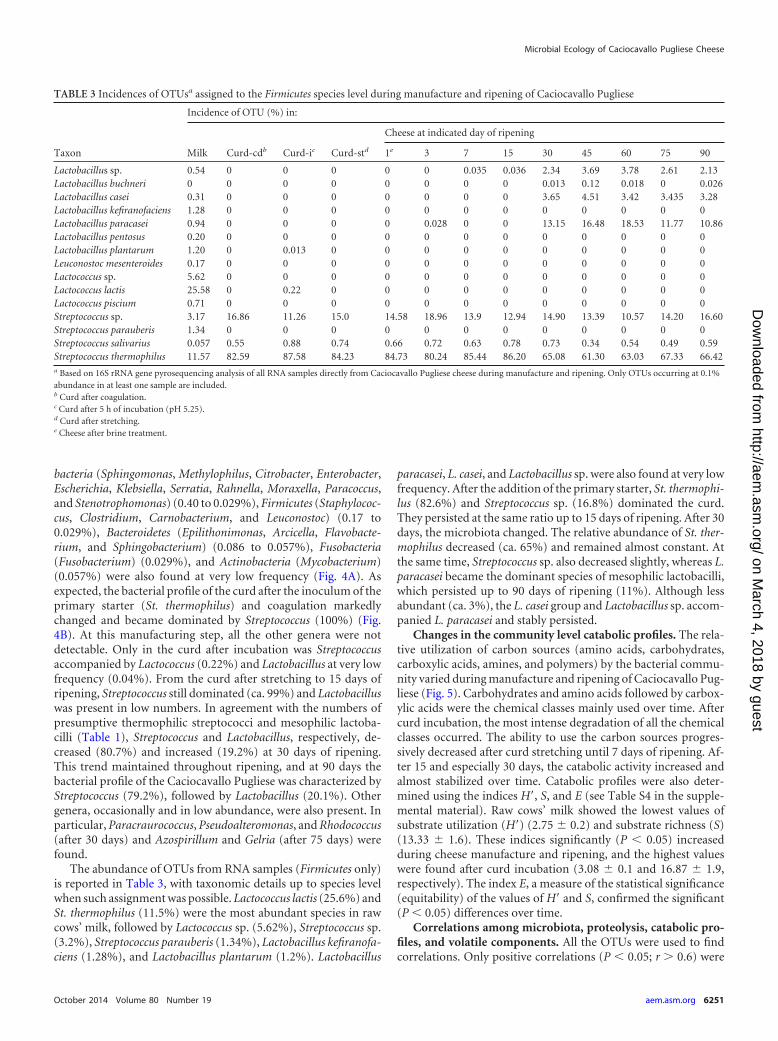
The abundance of OTUs from RNA samples (Firmicutes only)is reported in Table 3, with taxonomic details up to species levelwhen such assignment was possible. Lactococcus lactis (25.6%) andSt. thermophilus (11.5%) were the most abundant species in rawcows’ milk, followed by Lactococcus sp. (5.62%), Streptococcus sp.(3.2%), Streptococcus parauberis (1.34%), Lactobacillus kefiranofa-ciens (1.28%), and Lactobacillus plantarum (1.2%). Lactobacillus
paracasei, L. casei, and Lactobacillus sp. were also found at very lowfrequency. After the addition of the primary starter, St. thermophi-lus (82.6%) and Streptococcus sp. (16.8%) dominated the curd.They persisted at the same ratio up to 15 days of ripening. After 30days, the microbiota changed. The relative abundance of St. ther-mophilus decreased (ca. 65%) and remained almost constant. Atthe same time, Streptococcus sp. also decreased slightly, whereas L.paracasei became the dominant species of mesophilic lactobacilli,which persisted up to 90 days of ripening (11%). Although lessabundant (ca. 3%), the L. casei group and Lactobacillus sp. accom-panied L. paracasei and stably persisted.
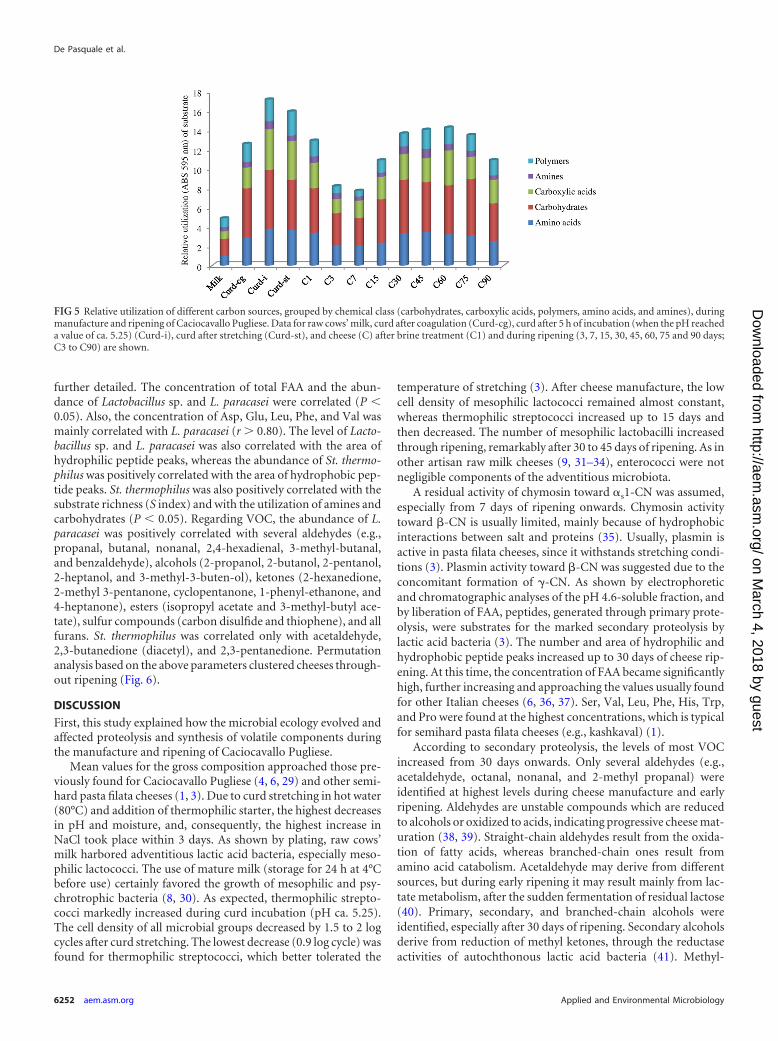
Changes in the community level catabolic profiles. The rela-tive utilization of carbon sources (amino acids, carbohydrates,carboxylic acids, amines, and polymers) by the bacterial commu-nity varied during manufacture and ripening of Caciocavallo Pug-liese (Fig. 5). Carbohydrates and amino acids followed by carbox-ylic acids were the chemical classes mainly used over time. Aftercurd incubation, the most intense degradation of all the chemicalclasses occurred. The ability to use the carbon sources progres-sively decreased after curd stretching until 7 days of ripening. Af-ter 15 and especially 30 days, the catabolic activity increased andalmost stabilized over time. Catabolic profiles were also deter-mined using the indices H=, S, and E (see Table S4 in the supple-mental material). Raw cows’ milk showed the lowest values ofsubstrate utilization (H=) (2.75 � 0.2) and substrate richness (S)(13.33 � 1.6). These indices significantly (P � 0.05) increasedduring cheese manufacture and ripening, and the highest valueswere found after curd incubation (3.08 � 0.1 and 16.87 � 1.9,respectively). The index E, a measure of the statistical significance(equitability) of the values of H= and S, confirmed the significant(P � 0.05) differences over time.
Correlations among microbiota, proteolysis, catabolic pro-files, and volatile components. All the OTUs were used to findcorrelations. Only positive correlations (P � 0.05; r � 0.6) were
TABLE 3 Incidences of OTUsa assigned to the Firmicutes species level during manufacture and ripening of Caciocavallo Pugliese
Taxon
Incidence of OTU (%) in:
Milk Curd-cdb Curd-ic Curd-std
Cheese at indicated day of ripening
1e 3 7 15 30 45 60 75 90
Lactobacillus sp. 0.54 0 0 0 0 0 0.035 0.036 2.34 3.69 3.78 2.61 2.13Lactobacillus buchneri 0 0 0 0 0 0 0 0 0.013 0.12 0.018 0 0.026Lactobacillus casei 0.31 0 0 0 0 0 0 0 3.65 4.51 3.42 3.435 3.28Lactobacillus kefiranofaciens 1.28 0 0 0 0 0 0 0 0 0 0 0 0Lactobacillus paracasei 0.94 0 0 0 0 0.028 0 0 13.15 16.48 18.53 11.77 10.86Lactobacillus pentosus 0.20 0 0 0 0 0 0 0 0 0 0 0 0Lactobacillus plantarum 1.20 0 0.013 0 0 0 0 0 0 0 0 0 0Leuconostoc mesenteroides 0.17 0 0 0 0 0 0 0 0 0 0 0 0Lactococcus sp. 5.62 0 0 0 0 0 0 0 0 0 0 0 0Lactococcus lactis 25.58 0 0.22 0 0 0 0 0 0 0 0 0 0Lactococcus piscium 0.71 0 0 0 0 0 0 0 0 0 0 0 0Streptococcus sp. 3.17 16.86 11.26 15.0 14.58 18.96 13.9 12.94 14.90 13.39 10.57 14.20 16.60Streptococcus parauberis 1.34 0 0 0 0 0 0 0 0 0 0 0 0Streptococcus salivarius 0.057 0.55 0.88 0.74 0.66 0.72 0.63 0.78 0.73 0.34 0.54 0.49 0.59Streptococcus thermophilus 11.57 82.59 87.58 84.23 84.73 80.24 85.44 86.20 65.08 61.30 63.03 67.33 66.42a Based on 16S rRNA gene pyrosequencing analysis of all RNA samples directly from Caciocavallo Pugliese cheese during manufacture and ripening. Only OTUs occurring at 0.1%abundance in at least one sample are included.b Curd after coagulation.c Curd after 5 h of incubation (pH 5.25).d Curd after stretching.e Cheese after brine treatment.
Microbial Ecology of Caciocavallo Pugliese Cheese
October 2014 Volume 80 Number 19 aem.asm.org 6251
on March 4, 2018 by guest
http://aem.asm
.org/D
ownloaded from
further detailed. The concentration of total FAA and the abun-dance of Lactobacillus sp. and L. paracasei were correlated (P �0.05). Also, the concentration of Asp, Glu, Leu, Phe, and Val wasmainly correlated with L. paracasei (r � 0.80). The level of Lacto-bacillus sp. and L. paracasei was also correlated with the area ofhydrophilic peptide peaks, whereas the abundance of St. thermo-philus was positively correlated with the area of hydrophobic pep-tide peaks. St. thermophilus was also positively correlated with thesubstrate richness (S index) and with the utilization of amines andcarbohydrates (P � 0.05). Regarding VOC, the abundance of L.paracasei was positively correlated with several aldehydes (e.g.,propanal, butanal, nonanal, 2,4-hexadienal, 3-methyl-butanal,and benzaldehyde), alcohols (2-propanol, 2-butanol, 2-pentanol,2-heptanol, and 3-methyl-3-buten-ol), ketones (2-hexanedione,2-methyl 3-pentanone, cyclopentanone, 1-phenyl-ethanone, and4-heptanone), esters (isopropyl acetate and 3-methyl-butyl ace-tate), sulfur compounds (carbon disulfide and thiophene), and allfurans. St. thermophilus was correlated only with acetaldehyde,2,3-butanedione (diacetyl), and 2,3-pentanedione. Permutationanalysis based on the above parameters clustered cheeses through-out ripening (Fig. 6).
DISCUSSION
First, this study explained how the microbial ecology evolved andaffected proteolysis and synthesis of volatile components duringthe manufacture and ripening of Caciocavallo Pugliese.
Mean values for the gross composition approached those pre-viously found for Caciocavallo Pugliese (4, 6, 29) and other semi-hard pasta filata cheeses (1, 3). Due to curd stretching in hot water(80°C) and addition of thermophilic starter, the highest decreasesin pH and moisture, and, consequently, the highest increase inNaCl took place within 3 days. As shown by plating, raw cows’milk harbored adventitious lactic acid bacteria, especially meso-philic lactococci. The use of mature milk (storage for 24 h at 4°Cbefore use) certainly favored the growth of mesophilic and psy-chrotrophic bacteria (8, 30). As expected, thermophilic strepto-cocci markedly increased during curd incubation (pH ca. 5.25).The cell density of all microbial groups decreased by 1.5 to 2 logcycles after curd stretching. The lowest decrease (0.9 log cycle) wasfound for thermophilic streptococci, which better tolerated the
temperature of stretching (3). After cheese manufacture, the lowcell density of mesophilic lactococci remained almost constant,whereas thermophilic streptococci increased up to 15 days andthen decreased. The number of mesophilic lactobacilli increasedthrough ripening, remarkably after 30 to 45 days of ripening. As inother artisan raw milk cheeses (9, 31–34), enterococci were notnegligible components of the adventitious microbiota.
A residual activity of chymosin toward s1-CN was assumed,especially from 7 days of ripening onwards. Chymosin activitytoward �-CN is usually limited, mainly because of hydrophobicinteractions between salt and proteins (35). Usually, plasmin isactive in pasta filata cheeses, since it withstands stretching condi-tions (3). Plasmin activity toward �-CN was suggested due to theconcomitant formation of �-CN. As shown by electrophoreticand chromatographic analyses of the pH 4.6-soluble fraction, andby liberation of FAA, peptides, generated through primary prote-olysis, were substrates for the marked secondary proteolysis bylactic acid bacteria (3). The number and area of hydrophilic andhydrophobic peptide peaks increased up to 30 days of cheese rip-ening. At this time, the concentration of FAA became significantlyhigh, further increasing and approaching the values usually foundfor other Italian cheeses (6, 36, 37). Ser, Val, Leu, Phe, His, Trp,and Pro were found at the highest concentrations, which is typicalfor semihard pasta filata cheeses (e.g., kashkaval) (1).
According to secondary proteolysis, the levels of most VOCincreased from 30 days onwards. Only several aldehydes (e.g.,acetaldehyde, octanal, nonanal, and 2-methyl propanal) wereidentified at highest levels during cheese manufacture and earlyripening. Aldehydes are unstable compounds which are reducedto alcohols or oxidized to acids, indicating progressive cheese mat-uration (38, 39). Straight-chain aldehydes result from the oxida-tion of fatty acids, whereas branched-chain ones result fromamino acid catabolism. Acetaldehyde may derive from differentsources, but during early ripening it may result mainly from lac-tate metabolism, after the sudden fermentation of residual lactose(40). Primary, secondary, and branched-chain alcohols wereidentified, especially after 30 days of ripening. Secondary alcoholsderive from reduction of methyl ketones, through the reductaseactivities of autochthonous lactic acid bacteria (41). Methyl-
FIG 5 Relative utilization of different carbon sources, grouped by chemical class (carbohydrates, carboxylic acids, polymers, amino acids, and amines), duringmanufacture and ripening of Caciocavallo Pugliese. Data for raw cows’ milk, curd after coagulation (Curd-cg), curd after 5 h of incubation (when the pH reacheda value of ca. 5.25) (Curd-i), curd after stretching (Curd-st), and cheese (C) after brine treatment (C1) and during ripening (3, 7, 15, 30, 45, 60, 75 and 90 days;C3 to C90) are shown.
De Pasquale et al.
6252 aem.asm.org Applied and Environmental Microbiology
on March 4, 2018 by guest
http://aem.asm
.org/D
ownloaded from
branched alcohols are synthesized from reduction of aldehydes,which are formed from branched FAA microbial activity (42).Ketones, the most abundant chemical class of VOC identified, areformed by enzymatic oxidation of free fatty acids to keto acidsand subsequent decarboxylation to methyl ketones (40). Ke-tones are intermediate compounds which are further reducedto alcohols. Indeed, the levels of 3-penten-2-one, 2,3-butanedi-one, and 2,3-pentanedione decreased throughout ripening. Diac-etyl, which mainly originates from the unstable precursor-aceto-lactate via citrate metabolism (43), was mainly foundduring early ripening. As shown for the Turkish pasta filata cheesekashar (39), esters (e.g., ethyl acetate and ethyl butanoate) in-creased throughout ripening. VFFA contribute to the cheese fla-vor but also serve as precursors for the synthesis of methyl-ke-tones, alcohols, and esters (40). As in other pasta filata cheeses,acetic, hexanoic, and butyric acids were the most abundant (1, 3,39). A relationship between autolysis of primary starters (e.g., Lc.lactis subsp. lactis and St. thermophilus) and levels of VFFA duringcheese ripening may be hypothesized (44, 45).
The culture-independent analysis was carried out using RNAas the template, and the OTUs found during processing were ac-tive members of the microbial population (46). According to plat-ing, the alpha diversity analysis demonstrated that the microbialcommunity fluctuated during curd incubation and stretching.
Further, diversity enlarged and varied during ripening. Raw cows’milk contained bacterial phyla that resulted from environmentalcontamination. Bacteroidetes, Actinobacteria, and especially Pro-teobacteria and Firmicutes dominate different areas throughoutthe farm, which include teat surfaces, milking parlors, hay, air, anddust (30). Genera belonging to Proteobacteria (e.g., Acinetobacter,Pseudomonas, and Hafnia), Firmicutes (e.g., Lactococcus, Strepto-coccus, and Lactobacillus), and Bacteroidetes (Chryseobacterium)were mainly identified. Psychrotrophic Chryseobacterium spp. waspreviously detected in raw cows’ milk through culture-dependentand -independent approaches (30). Overall, Acinetobacter spp.and Pseudomonas spp., which dominated the raw cows’ milk, mayconstitute 70 to 90% of the microbial population during milkstorage at low temperature (47). Cows’ milk also contains a pop-ulation of lactic acid bacteria, including Lactococcus spp., Strepto-coccus spp., and Lactobacillus spp., that also adapt well to low tem-peratures (30). A large subpopulation of taxa, corresponding to�1% of the total reads, was also highlighted. Almost the sametaxonomic structure characterized the microbiota of raw ewes’milk used for making pecorino cheese (15). Most of the abovegenera were inhibited after the thermophilic starter was grown.Only after incubation and stretching of the curd did Lactococcusand Lactobacillus recur at low frequency. The Gram-negative or-ganisms Paracraurococcus, Pseudoalteromonas, and Azospirillum
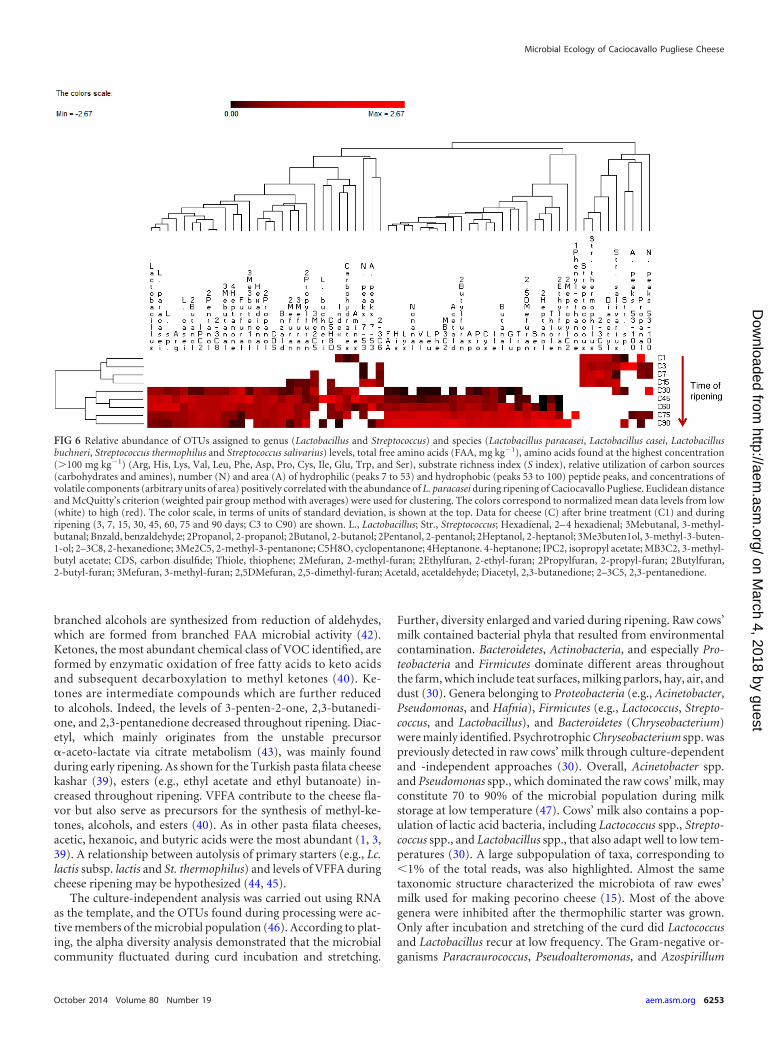
FIG 6 Relative abundance of OTUs assigned to genus (Lactobacillus and Streptococcus) and species (Lactobacillus paracasei, Lactobacillus casei, Lactobacillusbuchneri, Streptococcus thermophilus and Streptococcus salivarius) levels, total free amino acids (FAA, mg kg�1), amino acids found at the highest concentration(�100 mg kg�1) (Arg, His, Lys, Val, Leu, Phe, Asp, Pro, Cys, Ile, Glu, Trp, and Ser), substrate richness index (S index), relative utilization of carbon sources(carbohydrates and amines), number (N) and area (A) of hydrophilic (peaks 7 to 53) and hydrophobic (peaks 53 to 100) peptide peaks, and concentrations ofvolatile components (arbitrary units of area) positively correlated with the abundance of L. paracasei during ripening of Caciocavallo Pugliese. Euclidean distanceand McQuitty’s criterion (weighted pair group method with averages) were used for clustering. The colors correspond to normalized mean data levels from low(white) to high (red). The color scale, in terms of units of standard deviation, is shown at the top. Data for cheese (C) after brine treatment (C1) and duringripening (3, 7, 15, 30, 45, 60, 75 and 90 days; C3 to C90) are shown. L., Lactobacillus; Str., Streptococcus; Hexadienal, 2– 4 hexadienal; 3Mebutanal, 3-methyl-butanal; Bnzald, benzaldehyde; 2Propanol, 2-propanol; 2Butanol, 2-butanol; 2Pentanol, 2-pentanol; 2Heptanol, 2-heptanol; 3Me3buten1ol, 3-methyl-3-buten-1-ol; 2–3C8, 2-hexanedione; 3Me2C5, 2-methyl-3-pentanone; C5H8O, cyclopentanone; 4Heptanone. 4-heptanone; IPC2, isopropyl acetate; MB3C2, 3-methyl-butyl acetate; CDS, carbon disulfide; Thiole, thiophene; 2Mefuran, 2-methyl-furan; 2Ethylfuran, 2-ethyl-furan; 2Propylfuran, 2-propyl-furan; 2Butylfuran,2-butyl-furan; 3Mefuran, 3-methyl-furan; 2,5DMefuran, 2,5-dimethyl-furan; Acetald, acetaldehyde; Diacetyl, 2,3-butanedione; 2–3C5, 2,3-pentanedione.
Microbial Ecology of Caciocavallo Pugliese Cheese
October 2014 Volume 80 Number 19 aem.asm.org 6253
on March 4, 2018 by guest
http://aem.asm
.org/D
ownloaded from
and the Gram-positive organisms Rhodococcus and Gelria werepart of the subdominant population at the end of manufacture.The distribution of these low-abundance OTUs was variableamong the samples, indicating sporadic contamination. The mi-crobial succession reflected the overall physiological diversity(Fig. 3 and Fig. 6). The lowest utilization pattern substrate wasfound in raw cows’ milk. The greatest ability to degrade carbonsources and the highest H= index were observed almost at the endof cheese manufacturing, which coincided with environmentalconditions becoming hostile. The starter organism St. thermophi-lus dominated the population of the curd. It was accompanied byStreptococcus sp., and both persisted at an almost constant ratio upto 15 days. At 30 days, a microbial succession was clearly high-lighted. The relative abundances of Streptococcus sp. and especiallyof St. thermophilus decreased, while those of L. casei, Lactobacillussp., and especially L. paracasei increased consistently. Mesophiliclactobacilli persisted at high levels up to the end of ripening. Pre-vious studies (3, 4, 7) showed the coexistence of thermophilicprimary starters and NSLAB (Lactobacillus parabuchneri, L. casei,and L. paracasei subsp. paracasei) during ripening of CaciocavalloPugliese, but none clearly described the succession and diversity ofthe microbiota. Compared to the previous pyrosequencing anal-yses of the microbiota of the raw ewes’ milk cheese pecorino (15),a lower diversity was found during ripening, and mesophilic lac-tobacilli were noticeably more abundant. Middle ripening (ca. 30to 45 days) was the pivotal phase, where microbiota, secondaryproteolysis, and synthesis of VOC concomitantly switched to con-fer the typical features of the semihard Caciocavallo Pugliese,which was completed at 90 days of ripening (Fig. 3 and 6). Despitethe lower relative abundance of mesophilic lactobacilli with re-spect to St. thermophilus, only these bacteria were positively cor-related with the total and individual (Ser, Val, Leu, and Phe) con-centrations of FAA and the area of hydrophilic peptide peaks. L.paracasei was also positively correlated with several VOC (e.g.,aldehydes, alcohols, ketones, esters, and all furans), which con-firms the role of raw milk microbiota, especially that of NSLAB,during ripening of most cheeses (48, 49). St. thermophilus wascorrelated only with acetaldehyde, diacetyl, and 2,3-pentanedi-one. The synthesis of diketones and acetaldehyde by St. thermo-philus from different substrates, including amino acids, was welldocumented (50, 51). All these compounds are common constit-uents of several foods (52), and the amounts commonly found aretoo low to be detrimental to health. However, many compoundswere sufficiently concentrated in the mature cheeses to be per-ceived and contribute to flavor.
This study described the microbial ecology dynamics duringmanufacture and ripening of the pasta filata cheese CaciocavalloPugliese through a deep-sequencing approach. Technology (e.g.,curd stretching and use of thermophilic primary starter) affectsthe microbial diversity of raw cows’ milk. A core microbiota wasnaturally selected during middle ripening, which seemed to be themain factor responsible for cheese ripening.
ACKNOWLEDGMENTS
We thank the industrial plant Ignalat, located in Noci, Bari (Apulia re-gion), Italy, for the supply of cows’ milk, cheese manufacture, and tech-nical support.
This work was funded by Ministero dell’Istruzione, dell’Università edella Ricerca, Ministero dello Sviluppo Economico and Fondo Europeo diSviluppo Regionale (PON02_00186_3417037, project PROINNO_BIT).
REFERENCES1. Kindstedt P, Caric M, Milanovic S. 2004. Pasta-filata cheeses, p
251–277. In Fox PF, McSweeney PLH, Cogan TM, Guinee TP (ed),Cheese: chemistry, physics and microbiology, 3rd ed, vol 2. Elsevier Aca-demic Press, London, United Kingdom. http://dx.doi.org/10.1016/S1874-558X(04)80047-2.
2. Salvadori del Prato O. 1998. Trattato di tecnologia casearia. Edagricole—Edizioni Agricole della Calderini s.r.l. Press, Bologna, Italy.
3. De Angelis M, Gobbetti M. 2011. Cheese: pasta-filata cheeses: traditionalpasta-filata cheese, p 745–752. In Fuquay JW, Fox PF, McSweeney PLH(ed), Encyclopedia of dairy sciences, 2nd ed, vol 1. Elsevier AcademicPress, San Diego, CA.
4. Gobbetti M, Morea M, Baruzzi F, Corbo MR, Matarante A, ConsidineT, Di Cagno R, Guineee T, Fox PF. 2002. Microbiological, composi-tional, biochemical and textural characterization of Caciocavallo Pugliesecheese during ripening. Int. Dairy J. 12:511–523. http://dx.doi.org/10.1016/S0958-6946(02)00042-0.
5. Morea M, Matarante A, Di Cagno R, Baruzzi F, Minervini F. 2007.Contribution of autochthonous non-starter lactobacilli to proteolysis inCaciocavallo Pugliese cheese. Int. Dairy J. 17:525–534. http://dx.doi.org/10.1016/j.idairyj.2006.05.010.
6. Di Cagno R, De Pasquale I, De Angelis M, Gobbetti M. 2012. Acceler-ated ripening of Caciocavallo Pugliese cheese with attenuated adjuncts ofselected non-starter lactobacilli. J. Dairy Sci. 9:4784 – 4795. http://dx.doi.org/10.3168/jds.2011-5283.
7. Gobbetti M, De Angelis M, Di Cagno R, Rizzello CG. 2007. Relativecontributions of starter cultures and non-starter bacteria to flavour ofcheese, p 121–156. In Weimer BC (ed), Improving the flavour of cheese.CRC Press, Boca Raton, FL.
8. Quigley L, O’Sullivan O, Beresford TP, Ross RP, Fitzgerald GF, CotterPD. 2011. Molecular approaches to analyzing the microbial compositionof raw milk and raw milk cheese. Int. J. Food Microbiol. 150:81–94. http://dx.doi.org/10.1016/j.ijfoodmicro.2011.08.001.
9. Berthier F, Beuvier E, Dasen A, Grappin R. 2001. Origin and diversity ofmesophilic lactobacilli in Comtè cheese, as revealed by PCR with repetitiveand species-specific primers. Int. Dairy J. 11:293–305. http://dx.doi.org/10.1016/S0958-6946(01)00059-0.
10. Somers EB, Johnson ME, Wong ACL. 2001. Development of amino acidsand organic acids in Norvegia, influence of milk treatment and adjunctLactobacillus. J. Dairy Sci. 84:1926 –1936. http://dx.doi.org/10.3168/jds.S0022-0302(01)74634-6.
11. Di Cagno R, De Angelis M, Upadhyayd VK, McSweeney PLH, Min-ervini F, Gallo G, Gobbetti M. 2003. Effect of proteinases of starterbacteria on the growth and proteolytic activity of Lactobacillus plantarumDPC2741. Int. Dairy J. 13:145–157. http://dx.doi.org/10.1016/S0958-6946(02)00143-7.
12. Fox PF, Guinee TP, Cogan TM, McSweeney PLH. 2000. Fundamentalsof cheeses sciences. Aspen Publishers, Gaithersburg, MD.
13. Alegria A, Szczenny P, Mayo B, Bardowski J, Kowalczyk M. 2012.Biodiversity in Oscypek, a traditional Polish cheese, determined by cul-ture-dependent and independent approaches. Appl. Environ. Microbiol.78:1890 –1898. http://dx.doi.org/10.1128/AEM.06081-11.
14. De Filippis F, La Storia A, Stellato G, Gatti M, Ercolini D. 2014. Aselected core microbiome drives the early stages of three popular Italiancheese manufactures. PLoS One 9:1– 8. http://dx.doi.org/10.1371/journal.pone.0089680.
15. De Pasquale I, Calasso M, Mancini L, Ercolini D, La Storia A, DeAngelis M, Di Cagno R, Gobbetti M. 2014. Causal relationship betweenmicrobial ecology dynamics and proteolysis during manufacture and rip-ening of Canestrato Pugliese PDO cheese. Appl. Environ. Microbiol. 80:4085– 4094. http://dx.doi.org/10.1128/AEM.00757-14.
16. International Dairy Federation. 1964. Determination of the protein con-tent of processed cheeses products. Standard 25. International Dairy Fed-eration, Brussels, Belgium.
17. Institute for Industrial Research and Standards. 1955. Determination ofthe percentage of fat in cheese. Irish standard 69. Institute for IndustrialResearch and Standards, Dublin, Ireland.
18. International Dairy Federation. 1982. Cheese and processed cheese. De-termination of the total solid content. IDF standard 4A. InternationalDairy Federation, Brussels, Belgium.
19. Fox PF. 1963. Potentiometric determination of salt in cheese. J. Dairy Sci.46:744 –745. http://dx.doi.org/10.3168/jds.S0022-0302(63)89134-1.
De Pasquale et al.
6254 aem.asm.org Applied and Environmental Microbiology
on March 4, 2018 by guest
http://aem.asm
.org/D
ownloaded from
20. Di Cagno R, Quinto M, Corsetti A, Minervini F, Gobbetti M. 2006.Assessing the proteolytic and lipolytic activities of single strains of meso-philic lactobacilli as adjunct cultures using a Caciotta cheese model sys-tem. Int. Dairy J. 16:119 –130. http://dx.doi.org/10.1016/j.idairyj.2005.01.012.
21. Andrews AT. 1983. Proteinases in normal bovine milk and their actionon caseins. J. Dairy Res. 50:45–55. http://dx.doi.org/10.1017/S0022029900032519.
22. Di Cagno R, Buchin S, de Candia S, De Angelis M, Fox PF, Gobbetti M.2007. Characterization of Italian cheeses ripened under nonconventionalconditions. J. Dairy Sci. 90:2689 –2704. http://dx.doi.org/10.3168/jds.2006-654.
23. Reeder J, Knight R. 2010. Rapidly denoising pyrosequencing ampliconreads by exploiting rank-abundance distributions. Nat. Methods 7:668 –669. http://dx.doi.org/10.1038/nmeth0910-668b, http://dx.doi.org/10.1038/nmeth0910-668a.
24. Edgar RC. 2010. Search and clustering orders of magnitude faster thanBLAST. Bioinformatics 26:2460 –2461. http://dx.doi.org/10.1093/bioinformatics/btq461.
25. Edgar RC, Haas BJ, Clemente JC, Quince C, Knight R. 2011. UCHIMEimproves sensitivity and speed of chimera detection. Bioinformatics 27:2194 –2200. http://dx.doi.org/10.1093/bioinformatics/btr381.
26. Siragusa S, Di Cagno R, Ercolini D, Minervini F, Gobbetti M, DeAngelis M. 2009. Taxonomic structure and monitoring of the dominantpopulation of lactic acid bacteria during wheat flour sourdough type Ipropagation using Lactobacillus sanfranciscensis starters. Appl. Environ.Microbiol. 75:1099 –1109. http://dx.doi.org/10.1128/AEM.01524-08.
27. Shannon CE. 1948. A mathematical theory of communication. Bell Syst.Tech. J. 27:379 – 423, 623– 656. http://dx.doi.org/10.1002/j.1538-7305.1948.tb01338.x.
28. Minervini F, Di Cagno R, Lattanzi A, De Angelis M, Antonielli L,Cardinali G, Cappelle S, Angelis M, Gobbetti M. 2012. Lactic acidbacterium and yeast microbiotas of 19 sourdoughs used for traditional/typical Italian breads: interactions between ingredients and microbial spe-cies diversity. Appl. Environ. Microbiol. 78:1251–1264. http://dx.doi.org/10.1128/AEM.07721-11.
29. Ottogalli G. 2001. Atlante dei Formaggi. Hoepli Editore, Milan, IT.30. Quigley L, O’Sullivan O, Beresford TP, Ross RP, Fitzgerald GF, Ross
RP, Stanton C, Cotter PD. 2013. The microbial content of raw andpasteurised cow’s milk as determined by molecular approaches. J. DairySci. 96:1–10. http://dx.doi.org/10.3168/jds.2012-5409.
31. Aquilanti L, Dell’Aquila L, Zannini E, Zocchetti A, Clementi F. 2006.Resident lactic acid bacteria in raw milk Canestrato Pugliese cheese.Lett. Appl. Microbiol. 43:161–167. http://dx.doi.org/10.1111/j.1472-765X.2006.01935.x.
32. Cogan TM, Barbosa M, Beuvier E, Bianchi-Salvadori B, Cocconcelli PS,Fernandes I, Gomez J, Gomez R, Kalantzopoulos G, Ledda A, MedinaM, Rea MC, Rodriguez E. 1997. Characterization of the lactic acid bac-teria in artisanal dairy products. J. Dairy Res. 64:409 – 421. http://dx.doi.org/10.1017/S0022029997002185.
33. Prodromou K, Thasitou P, Haritonidou E, Tzanetakis N, Litopoulou-Tzanetaki E. 2001. Microbiology of “Orinotyri,” a ewe’s cheese from theGreek mountains. J. Food Microbiol. 18:319 –328. http://dx.doi.org/10.1006/fmic.2001.0403.
34. Dolci P, Alessandria V, Rantsiou K, Rolle L, Zeppa G, Cocolin L. 2008.Microbial dynamics of Castelmagno PDO, a traditional Italian cheese,with a focus on lactic acid bacteria ecology. Int. J. Food Microbiol. 122:302–311. http://dx.doi.org/10.1016/j.ijfoodmicro.2007.12.018.
35. Fox PF. 1989. Proteolysis during cheese manufacture and ripen-ing. J. Dairy Sci. 72:1379 –1383. http://dx.doi.org/10.3168/jds.S0022-0302(89)79246-8.
36. Coda R, Brechany E, De Angelis M, De Candia S, Di Cagno R,Gobbetti M. 2006. Comparison of the compositional, microbiological,
biochemical, and volatile profile characteristics of nine Italian ewes’ milkcheeses. J. Dairy Sci. 89:4126 – 4143. http://dx.doi.org/10.3168/jds.S0022-0302(06)72458-4.
37. Di Cagno R, Banks J, Sheehan L, Fox PF, Brechany EY, Corsetti A,Gobbetti M. 2003. Comparison of the microbiological, compositional,biochemical, volatile profile and sensory characteristics of three ItalianPDO ewes’ milk cheeses. Int. Dairy J. 13:961–972. http://dx.doi.org/10.1016/S0958-6946(03)00145-6.
38. Carbonell M, Nunez M, Fernandéz-Garcìa E. 2002. Evolution of thevolatile components of ewe raw milk La Serena cheese during ripening.Correlation with flavour characteristics. Lait 82:683– 698. http://dx.doi.org/10.1051/lait:2002042.
39. Hayaloglu AA. 2007. Comparisons of different single-strain starter cul-tures for their effects on ripening and grading of Beyaz cheese. Int. J. FoodSci. Technol. 42:930 –938. http://dx.doi.org/10.1111/j.1365-2621.2006.01312.x.
40. McSweeney PLH, Sousa MJ. 2000. Biochemical pathways for the produc-tion of flavour compounds in cheese during ripening: a review. Lait 80:293–324. http://dx.doi.org/10.1051/lait:2000127.
41. Molimard P, Spinnler HE. 1996. Compounds involved in the flavor ofsurface mold-ripened cheese: origins and properties. J. Dairy Sci. 79:169 –184. http://dx.doi.org/10.3168/jds.S0022-0302(96)76348-8.
42. Yvon M, Rijnen L. 2001. Cheese flavor formation by amino acidcatabolism. Int. Dairy J. 11:185–201. http://dx.doi.org/10.1016/S0958-6946(01)00049-8.
43. Garde S, Carbonell M, Fernandez-Garcia E, Medina M, Nunez M. 2002.Volatile compounds in Hispanico cheese manufactured using a meso-philic starter, a thermophilic starter and bacteriocin-producing Lactococ-cus lactis subsp. lactis INIA 415. J. Agric. Food Chem. 50:6752– 6757. http://dx.doi.org/10.1021/jf020577v.
44. Chich JF, Marchessau K, Gripon JC. 1997. Intracellular esterase fromLactococcus lactis subsp. lactis NDCO763: purification and characteriza-tion. Int. Dairy J. 7:169 –174. http://dx.doi.org/10.1016/S0958-6946(97)00001-0.
45. Collins YF, McSweeney PLH, Wilkinson MG. 2003. Evidence for arelationship between autolysis of starter bacteria and lipolysis inCheddar cheese. J. Dairy Res. 70:105–113. http://dx.doi.org/10.1017/S0022029902005915.
46. Ercolini D. 2013. High-throughput sequencing and metagenomics: mov-ing forward in the culture-independent analysis of food microbial ecology.Appl. Environ. Microbiol. 79:3148 –3155. http://dx.doi.org/10.1128/AEM.00256-13.
47. Raats D, Offek M, Minz D, Halpern M. 2011. Molecular analysis ofbacterial communities in raw cow milk and the impact of refrigeration onits structure and dynamics. Food Microbiol. 28:465– 471. http://dx.doi.org/10.1016/j.fm.2010.10.009.
48. Beuvier E, Buchin S. 2004. Raw milk cheeses, p 319 –346. In Fox PF,McSweeney PLH, Cogan T, Guinee T. (ed), Cheese: chemistry, physicsand microbiology, 3th ed, vol 1, Elsevier Academic Press, London, UnitedKingdom.
49. Montel MC, Buchin S, Mallet A, Delbes-Paus C, Vuitton DA, Des-masures N, Berthier F. 2014. Traditional cheeses: rich and diverse micro-biota with associated benefits. Int. J. Food Microbiol. 177:136 –154. http://dx.doi.org/10.1016/j.ijfoodmicro.2014.02.019.
50. Ott A, Germond JE, Chaintreau A. 2000. Vicinal diketone formation inyogurt: 13C-labeled precursors and effect of branched-chain amino acids.J. Agric. Food Chem. 48:724 –731. http://dx.doi.org/10.1021/jf990487z.
51. Ott A, Germond JA, Chaintreau A. 2000. Origin of acetaldehyde duringmilk fermentation using 13C-labeled precursors. J. Agric. Food Chem.48:1512–1517. http://dx.doi.org/10.1021/jf9904867.
52. Maarse H, Visscher CA. 1989. In Maarse H, Visscher CA, Willemsens LC,Boelens MH (ed), Volatile compounds in food, qualitative and quantita-tive data. TNO-CIVO, Zeist, The Netherlands.
Microbial Ecology of Caciocavallo Pugliese Cheese
October 2014 Volume 80 Number 19 aem.asm.org 6255
on March 4, 2018 by guest
http://aem.asm
.org/D
ownloaded from


![REVIEW: Potential of Thermophile Inoculation and Substrate … · 2015. 4. 27. · Definably preparation of compost substrate determines the succession of microbial inoculation [14-16]](https://img.pdfslide.net/doc/110x75/61251958131a1c2ab80d976b/review-potential-of-thermophile-inoculation-and-substrate-2015-4-27-definably.jpg)

![Functional ecology of soil microbial communities along a glacier … · 2018-02-16 · thesis of antibiotics along the succession [24,52] and, there-fore, the antibiotic resistance](https://img.pdfslide.net/doc/110x75/5e7cafcf317c32133d1ea1dd/functional-ecology-of-soil-microbial-communities-along-a-glacier-2018-02-16-thesis.jpg)