Embed Size (px)
Citation preview
Microbial Ecology of Four Coral Atolls in the NorthernLine IslandsElizabeth A. Dinsdale1,2.*, Olga Pantos1.¤, Steven Smriga3, Robert A. Edwards4,5, Florent Angly1, Linda
Wegley1, Mark Hatay1, Dana Hall1, Elysa Brown1, Matthew Haynes1, Lutz Krause6, Enric Sala3, Stuart A.
Sandin3, Rebecca Vega Thurber1, Bette L. Willis7, Farooq Azam3, Nancy Knowlton3, Forest Rohwer1,4*
1 Department of Biology, San Diego State University, San Diego, California, United States of America, 2 School of Biological Sciences, Flinders University, Adelaide, South
Australia, Australia, 3 Center for Marine Biodiversity and Conservation, Scripps Institution of Oceanography, University of California San Diego, La Jolla, California, United
States of America, 4 Center for Microbial Sciences, San Diego State University, San Diego, California, United States of America, 5 Fellowship for Interpretation of Genomes,
Burr Ridge, Illinois, United States of America, 6 Center for Biotechnology (CeBiTec), Bielefeld University, Bielefeld, Germany, 7 Australian Research Council (ARC) Centre of
Excellence for Coral Reef Studies, School of Marine and Tropical Biology, James Cook University, Townsville, Queensland, Australia
Abstract
Microbes are key players in both healthy and degraded coral reefs. A combination of metagenomics, microscopy, culturing,and water chemistry were used to characterize microbial communities on four coral atolls in the Northern Line Islands,central Pacific. Kingman, a small uninhabited atoll which lies most northerly in the chain, had microbial and water chemistrycharacteristic of an open ocean ecosystem. On this atoll the microbial community was equally divided between autotrophs(mostly Prochlorococcus spp.) and heterotrophs. In contrast, Kiritimati, a large and populated (,5500 people) atoll, which ismost southerly in the chain, had microbial and water chemistry characteristic of a near-shore environment. On Kiritimati,there were 10 times more microbial cells and virus-like particles in the water column and these microbes were dominatedby heterotrophs, including a large percentage of potential pathogens. Culturable Vibrios were common only on Kiritimati.The benthic community on Kiritimati had the highest prevalence of coral disease and lowest coral cover. The middle atolls,Palmyra and Tabuaeran, had intermediate densities of microbes and viruses and higher percentages of autotrophicmicrobes than either Kingman or Kiritimati. The differences in microbial communities across atolls could reflect variation in1) oceaonographic and/or hydrographic conditions or 2) human impacts associated with land-use and fishing. The fact thathistorically Kingman and Kiritimati did not differ strongly in their fish or benthic communities (both had large numbers ofsharks and high coral cover) suggest an anthropogenic component in the differences in the microbial communities.Kingman is one of the world’s most pristine coral reefs, and this dataset should serve as a baseline for future studies of coralreef microbes. Obtaining the microbial data set, from atolls is particularly important given the association of microbes in theongoing degradation of coral reef ecosystems worldwide.
Citation: Dinsdale EA, Pantos O, Smriga S, Edwards RA, Angly F, et al (2008) Microbial Ecology of Four Coral Atolls in the Northern Line Islands. PLoS ONE 3(2):e1584. doi:10.1371/journal.pone.0001584
Editor: Niyaz Ahmed, Centre for DNA Fingerprinting and Diagnostics, India
Received December 28, 2007; Accepted January 4, 2008; Published February 27, 2008
Copyright: � 2008 Dinsdale et al. This is an open-access article distributed under the terms of the Creative Commons Attribution License, which permitsunrestricted use, distribution, and reproduction in any medium, provided the original author and source are credited.
Funding: The research was supported by the Marine Microbial Initiative of the Gordon and Betty Moore Foundation to FLR. Further support came from MooreFamily Foundation, the Fairweather Foundation, National Geographic Society, the Marine Managed Areas Science Project of Conservation International, ScrippsInstitution of Oceanography, E. Scripps, I. Gayler, and several private donors. Additional support came from the Coral Reef Targeted Research Program’s CoralDisease Working Group and an NSF Graduate Research Fellowship to SS.
Competing Interests: The authors have declared that no competing interests exist.
*E-mail: [email protected] (ED); [email protected] (FR)
¤ Current address: Centre for Marine Studies, University of Queensland, St Lucia, Queensland, Australia
.These authors contributed equally to this work.
Introduction
The roles of microbes, both Bacteria and Archaea, and viruses on
coral reefs are just starting to be elucidated. Most studies concern
microbes in the water column, although actual densities are much
higher in the benthos [1]. Microbes may play an important role in
the nutrition of reef organisms. For example, the number of
microbes in the water column declines from the windward to
leeward (forereef to backreef) areas of coral reefs [2], suggesting
ingestion by coral reef organisms [3–5]. Similarly, decreasing
densities of bacteria have also been documented within the vertical
structure of a coral reef, with the over-lying water column containing
approximately 4.5 times the amount of bacteria compared with the
water within crevices of the coral reef structure [6].
Our ability to understand these microbes has increased greatly
with the development of molecular and genomic approaches that
provide a far more accurate picture of community composition
and activities. In the marine environment molecular techniques
have identified new organisms and new metabolic processes [7].
For coral reefs, molecular techniques, such as 16S rDNA analysis
has identified that microbial communities associated with corals
are diverse and develop both species specific [8], and generalist
associations [9]. These molecular techniques have also revealed
the etiological agents of diseases of coral reef organisms, such as,
corals [10] and sponges [11,12]. In some cases the etiological
agents are not specific to corals, but infect multiple and distinctive
marine organisms [13], leading to difficulties in identify causative
agents of the increasing number coral diseases that are described
PLoS ONE | www.plosone.org 1 February 2008 | Volume 3 | Issue 2 | e1584
[14]. The lack of identified pathogens suggests opportunistic
bacterial infections or hard-to-culture pathogens (e.g., viruses) are
important mediators of coral disease. Because of these difficulties,
metagenomics, which allows the entire genome of all the micro-
organisms within an environment to be sampled rapidly [15], may
be required to describe microbial associations on coral reefs and
how they change with environmental fluctuations and anthropo-
genic activities. Metagenomic studies are not restricted by
targeting single gene regions, but provide information on all
genomic regions, enabling both taxonomic descriptions and
potential metabolic functions of the micro-organisms within an
environment to be described [16]. For coral reefs, a comprehen-
sive evaluation of the microbial and viral community may be
particularly important because coral diseases are an increasing
factor in the global collapse of reef ecosystems [14,17].
In this study, the coral reef microbial communities associated
with four coral atolls in the Northern Line Islands (central Pacific)
were surveyed. These atolls are of interest because although they
are relatively close to each other (750 km), they span an array of
oceanographic conditions and are variably impacted by human
activities. One of the atolls is pristine with respect to local
anthropogenic effects, and thus provides an important microbial
baseline against which other reefs can be compared. Microbial and
viral abundances were complemented with metagenomic analyses
of these communities. Coral cover and disease prevalence were
also measured to determine if there were correlations between
microbial communities and coral health. A companion study
complements the microbial data by measuring functional changes
of the fish and benthic communities [18].
Materials and MethodsStudy sites
Surveys were conducted on four atolls in the Northern Line
Islands in the central Pacific (Figure 1; [18]). The atolls are
separated by ,750 km and span a gradient in oceanic
productivity and climate. The level of rainfall declines from north
to south [19], whereas oceanic productivity declines from south to
north.
Two atolls, Kingman and Palmyra, are part of the US national
refuge system and have little or no local anthropogenic impacts.
The most northern atoll, Kingman, is uninhabited and has only a
few emergent sand bars (,0.1 km2), and the reef crest surrounds a
relatively large lagoon (60 km2). As such, it is expected to have a
high flushing rate and no terrestrial influence of any kind (e.g.,
human sewage, bird guano, agricultural runoff). Palmyra has
,7 km2 of land and a relatively small lagoon (15 km2) that was
extensively remodeled during World War II. There are only ,20
people on Palmyra at any one time, and sewage is treated and
contained. Seabirds are numerous and a potential source of
nitrogen, but guano was never mined on Palmyra because it does
not accumulate in significant quantities. Ammunition dumps are
also potential sources of nitrogen compounds. There are a number
of small wrecks and former military structures, which may increase
local levels of iron. Shark finning occurred on Palmyra in the past.
The remaining two atolls, Tabuaeran and Kiritimati, are
inhabited and part of the Republic of Kiribati. Tabuaeran has
34 km2 of land and a 110 km2 lagoon; a natural passage on the
west side of the island was widened by blasting of coral heads by
the British, in the 1890s. There are ,2500 people and a large
wreck just north of the lagoon passage. All that visually remains of
this wreck are a number of large boilers. Kiritimati has 390 km2 of
land and 324 km2 of lagoon, and ,5500 people. Human sewage is
untreated on both Tabuaeran and Kiritimati and there was no
evidence of any traditional management of sewage. There are
some septic tanks associated with the hotel and larger buildings on
Kiritimati; many of these leak, and combined with the untreated
sewage, there are a number sanitation problems associated with
the island’s water supply. Recently installed composting toilets
are often not used because of local customs and beliefs (http://
www.unep.or.jp/ietc/publications/techpublications/techpub-15/
3-8IlandPacific/8-11-2_1.asp). There have been several agricul-
ture initiatives on Tabuaeran and Kiritimati, including seaweed
and coconuts. Guano was mined on Kiritimati in the 1850’s and
1860’s, but it is not known how much mining actually took place;
mining stopped in 1866 because it was unproductive. Atomic
bomb testing was conducted on Kiritimati between 1957 and 1962
by both the British and American military. Kiritimati has a series
of lagoons, a large main one and then many smaller lagoons that
are both connected and unconnected to the main lagoon. The
highest fluctuations in physio-chemical properties occurs in the
unconnected lagoons [20,21], however the main lagoon has
salinities and pH similar to seawater. Dissolved oxygen levels were
low in the main lagoon and found to increase only in close
proximity to settlements, suggesting eutrophication of small areas
[20]. Microbial activity in the lagoon sediments was high, but
similar to levels in other Pacific lagoons [21].
Survey overviewMicrobial communities were surveyed in the coral reef waters
on each of the four atolls at 10–12 m depth (,400 m from shore),
between August 4th and September 6th 2005. We used the
following approaches: 1) Quantification of Bacteria and Archaea
(microbes), virus-like particles (VLPs), and protists using direct
counts on water collected from above the reef substratum, 2)
Abundances of culturable Vibrio spp. determined by counting
colony forming units (cfu) on thiosulfate citrate bile sucrose plates
(TCBS), and 3) Taxonomical and metabolic potential of the
microbial and viral communities using metagenomic analyses. In
addition, we characterized the coral community (percent cover,
disease prevalence) and the water chemistry [concentrations of
total dissolved inorganic nitrogen compounds (TDIN: ammonium,
nitrate, nitrite), phosphate, and dissolved organic carbon (DOC)].
At each atoll we used the same sampling strategy (one site for
metagenomic analyses, four to five sites for other microbial and
water chemistry samples, 10–12 sites to characterize the benthic
community, ,30 sites (separated by 2 km) to characterize the fish
community). The general sampling scheme was centered at the
leeward side and worked out in both directions around the island
(Figure 1, see Sandin et al [18]; further details below). Because of
the differing rates at which the fish, benthic, and microbial surveys
could be conducted, not all groups were characterized at each site.
Thus about 50% of total sites sampled for coral cover and other
benthic properties were also microbiologically characterized.
For the metagenome samples, areas underneath the lagoon
currents were targeted because: 1) It was expected that these areas
would be the most likely to show signs of human disturbance, 2)
Time and resources limited the survey to one microbial and one
viral metagenome per atoll, and 3) This limited sampling meant
that it was necessary to target an area of the reef that had similar
hydrological characters, and lagoon currents are a relatively
constant feature of coral reefs. The lagoons of Palmyra,
Tabuaeran, and Kiritimati tend to flush in a northerly direction.
The samples for the metagenomes were taken from benthic sites
that are flushed with the lagoonal waters. In the case of Kingman,
the water flows over the reef. The prevailing current, during the
cruise was from the north to south (as determined with a float), so
this metagenome sample was taken on one of the gaps on the
southside of the atoll (Figure 1).
Microbes with Coral Reefs
PLoS ONE | www.plosone.org 2 February 2008 | Volume 3 | Issue 2 | e1584
Direct counts of Bacteria, Archaea and virus-like particlesThe numbers of microbes (both Bacteria and Archaea) and
virus-like particles (VLPs) in the water column were determined
via direct counts using epifluorescent microscopy. Pre-washed
diver-adapted polycarbonate Niskin bottles were used to sample
the water at each site. Each Niskin bottle sampled 2 liters of
seawater, which was used for the direct counts, culturing, and
water chemistry. Four of the bottles were collected from the reef
surface (,10 m depth), two bottles were collected 25 cm above the
benthos, and two bottles were collected 500 cm above the benthos.
No statistical difference was found between counts taken at various
depths (F32 = 0.321, P = 1 for microbes and F32 = 0.320, P = 1.0 for
VLPs), therefore samples were analyzed at the site level. The
counts were conducted on 2 or 8 ml of sea water (two
concentrations were prepared to ensure that we obtained
countable slides). The samples were fixed with electron microsco-
py-grade paraformaldehyde (4% final concentration) and stained
with SYBR Gold (16 final concentration; formally Molecular
Probes, Inc., now Invitrogen, Solana Beach, CA) and filtered onto
0.02 mm Anodisc filters (Whatman, Inc, Florham Park, NJ),
mounted on glass slides and directly counted by epifluorescence
microscopy. Cells and VLPs were counted (.200 per sample) in
10 fields selected at random. The microbes and VLPs counts were
log transformed and compared using an unbalanced multivariate
analysis of variance with sites nested within atolls. Normality and
heterogeneity were tested using Kolmogorov-Smirnov and Levene
tests, respectively. Atoll pairings were tested using a Wilcoxon one-
sided analysis.
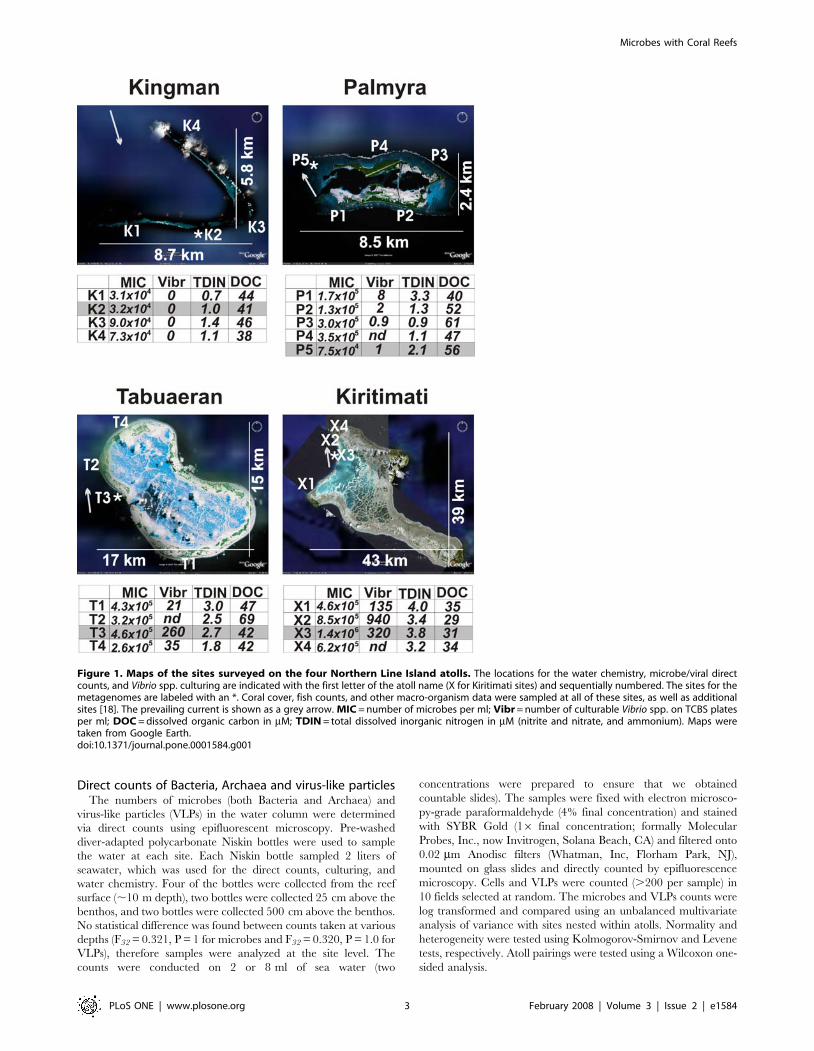
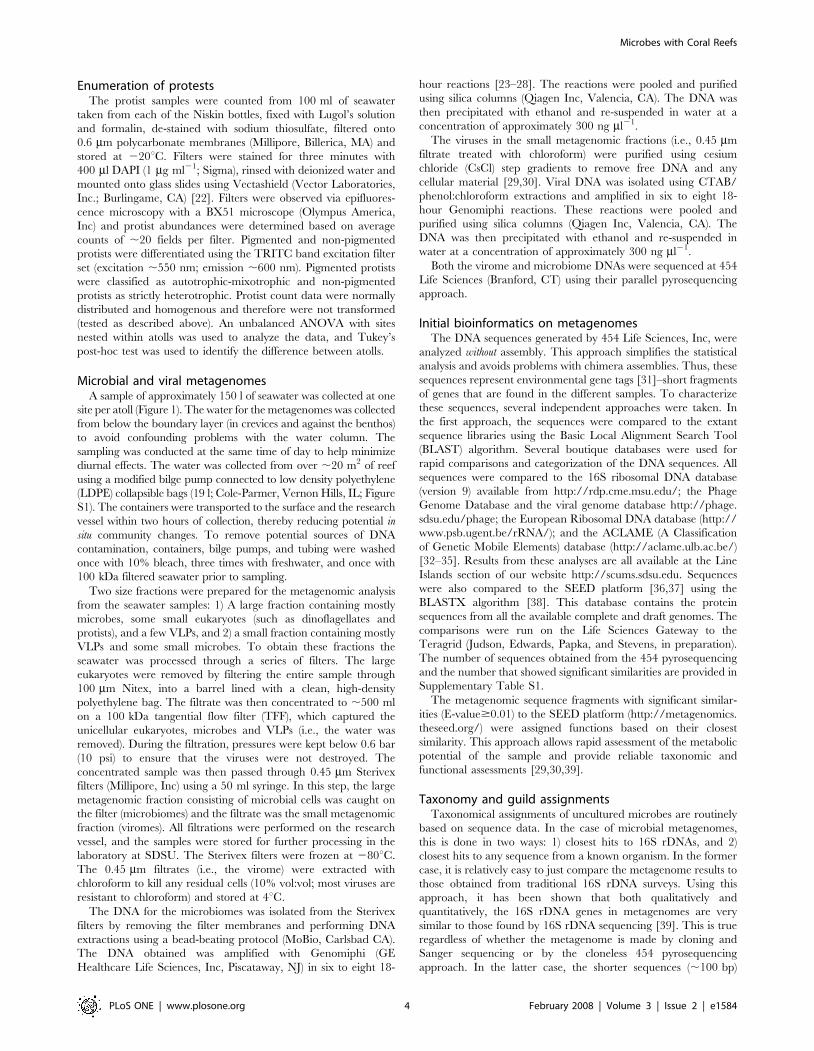
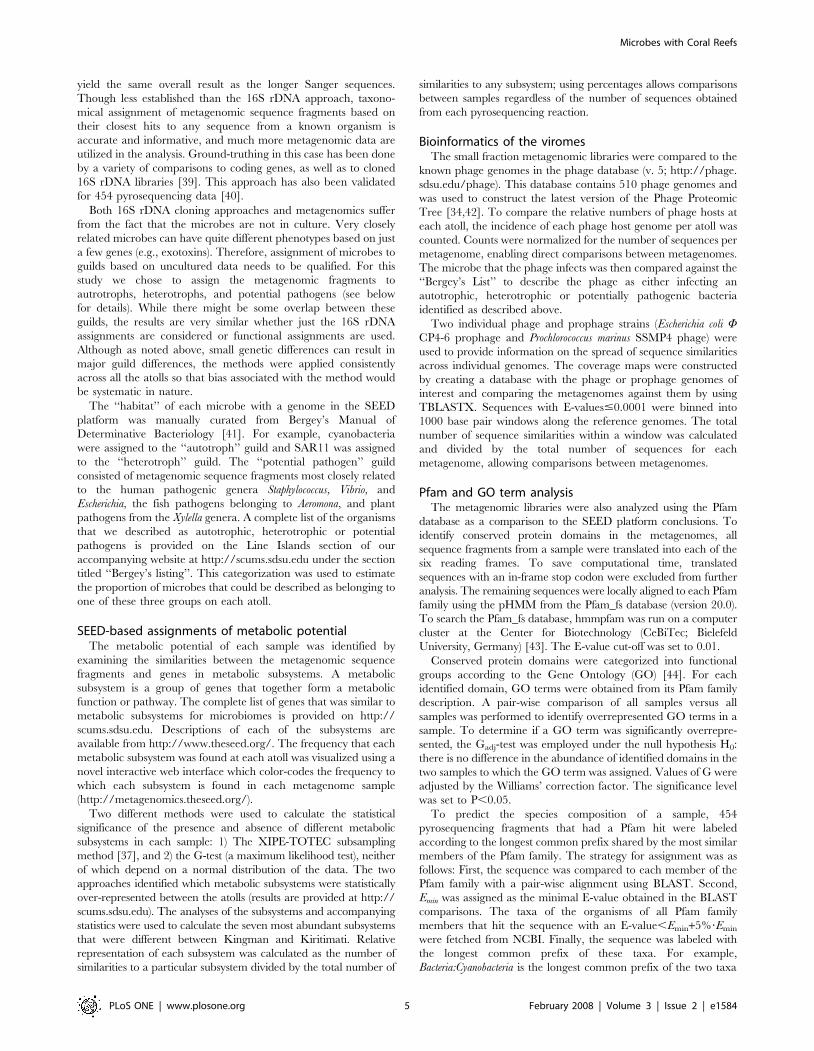
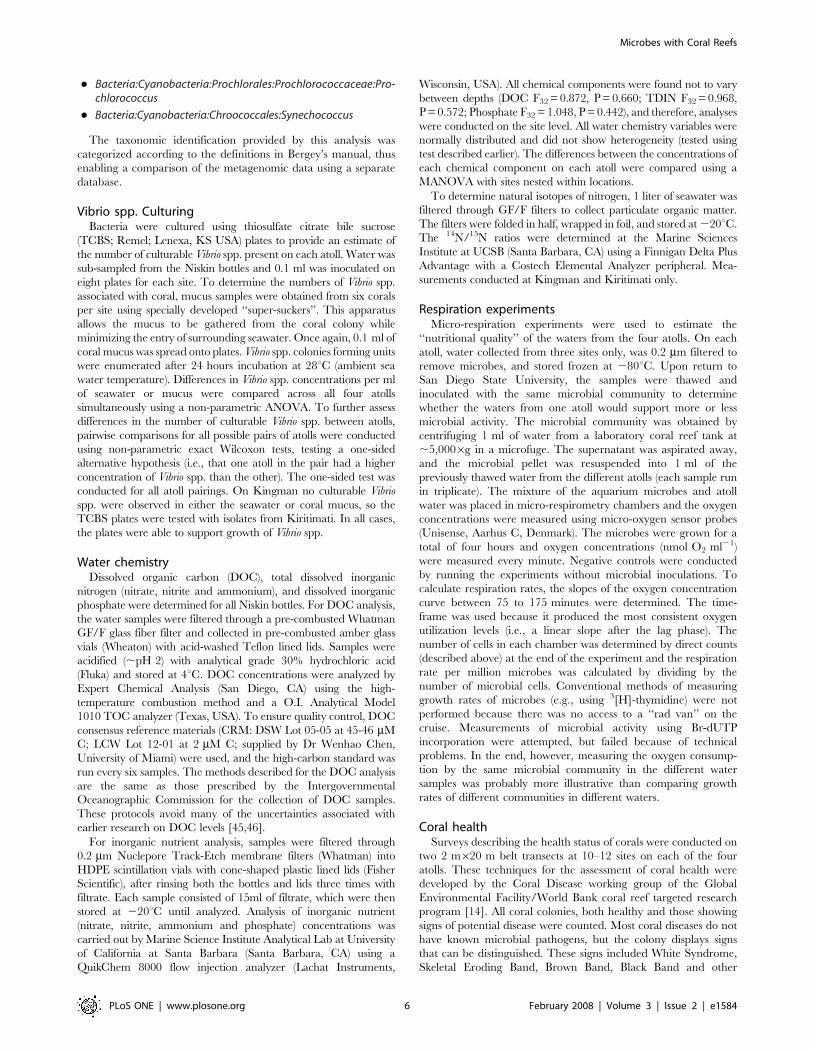
Figure 1. Maps of the sites surveyed on the four Northern Line Island atolls. The locations for the water chemistry, microbe/viral directcounts, and Vibrio spp. culturing are indicated with the first letter of the atoll name (X for Kiritimati sites) and sequentially numbered. The sites for themetagenomes are labeled with an *. Coral cover, fish counts, and other macro-organism data were sampled at all of these sites, as well as additionalsites [18]. The prevailing current is shown as a grey arrow. MIC = number of microbes per ml; Vibr = number of culturable Vibrio spp. on TCBS platesper ml; DOC = dissolved organic carbon in mM; TDIN = total dissolved inorganic nitrogen in mM (nitrite and nitrate, and ammonium). Maps weretaken from Google Earth.doi:10.1371/journal.pone.0001584.g001
Microbes with Coral Reefs
PLoS ONE | www.plosone.org 3 February 2008 | Volume 3 | Issue 2 | e1584
Enumeration of protestsThe protist samples were counted from 100 ml of seawater
taken from each of the Niskin bottles, fixed with Lugol’s solution
and formalin, de-stained with sodium thiosulfate, filtered onto
0.6 mm polycarbonate membranes (Millipore, Billerica, MA) and
stored at 220uC. Filters were stained for three minutes with
400 ml DAPI (1 mg ml21; Sigma), rinsed with deionized water and
mounted onto glass slides using Vectashield (Vector Laboratories,
Inc.; Burlingame, CA) [22]. Filters were observed via epifluores-
cence microscopy with a BX51 microscope (Olympus America,
Inc) and protist abundances were determined based on average
counts of ,20 fields per filter. Pigmented and non-pigmented
protists were differentiated using the TRITC band excitation filter
set (excitation ,550 nm; emission ,600 nm). Pigmented protists
were classified as autotrophic-mixotrophic and non-pigmented
protists as strictly heterotrophic. Protist count data were normally
distributed and homogenous and therefore were not transformed
(tested as described above). An unbalanced ANOVA with sites
nested within atolls was used to analyze the data, and Tukey’s
post-hoc test was used to identify the difference between atolls.
Microbial and viral metagenomesA sample of approximately 150 l of seawater was collected at one
site per atoll (Figure 1). The water for the metagenomes was collected
from below the boundary layer (in crevices and against the benthos)
to avoid confounding problems with the water column. The
sampling was conducted at the same time of day to help minimize
diurnal effects. The water was collected from over ,20 m2 of reef
using a modified bilge pump connected to low density polyethylene
(LDPE) collapsible bags (19 l; Cole-Parmer, Vernon Hills, IL; Figure
S1). The containers were transported to the surface and the research
vessel within two hours of collection, thereby reducing potential in
situ community changes. To remove potential sources of DNA
contamination, containers, bilge pumps, and tubing were washed
once with 10% bleach, three times with freshwater, and once with
100 kDa filtered seawater prior to sampling.
Two size fractions were prepared for the metagenomic analysis
from the seawater samples: 1) A large fraction containing mostly
microbes, some small eukaryotes (such as dinoflagellates and
protists), and a few VLPs, and 2) a small fraction containing mostly
VLPs and some small microbes. To obtain these fractions the
seawater was processed through a series of filters. The large
eukaryotes were removed by filtering the entire sample through
100 mm Nitex, into a barrel lined with a clean, high-density
polyethylene bag. The filtrate was then concentrated to ,500 ml
on a 100 kDa tangential flow filter (TFF), which captured the
unicellular eukaryotes, microbes and VLPs (i.e., the water was
removed). During the filtration, pressures were kept below 0.6 bar
(10 psi) to ensure that the viruses were not destroyed. The
concentrated sample was then passed through 0.45 mm Sterivex
filters (Millipore, Inc) using a 50 ml syringe. In this step, the large
metagenomic fraction consisting of microbial cells was caught on
the filter (microbiomes) and the filtrate was the small metagenomic
fraction (viromes). All filtrations were performed on the research
vessel, and the samples were stored for further processing in the
laboratory at SDSU. The Sterivex filters were frozen at 280uC.
The 0.45 mm filtrates (i.e., the virome) were extracted with
chloroform to kill any residual cells (10% vol:vol; most viruses are
resistant to chloroform) and stored at 4uC.
The DNA for the microbiomes was isolated from the Sterivex
filters by removing the filter membranes and performing DNA
extractions using a bead-beating protocol (MoBio, Carlsbad CA).
The DNA obtained was amplified with Genomiphi (GE
Healthcare Life Sciences, Inc, Piscataway, NJ) in six to eight 18-
hour reactions [23–28]. The reactions were pooled and purified
using silica columns (Qiagen Inc, Valencia, CA). The DNA was
then precipitated with ethanol and re-suspended in water at a
concentration of approximately 300 ng ml21.
The viruses in the small metagenomic fractions (i.e., 0.45 mm
filtrate treated with chloroform) were purified using cesium
chloride (CsCl) step gradients to remove free DNA and any
cellular material [29,30]. Viral DNA was isolated using CTAB/
phenol:chloroform extractions and amplified in six to eight 18-
hour Genomiphi reactions. These reactions were pooled and
purified using silica columns (Qiagen Inc, Valencia, CA). The
DNA was then precipitated with ethanol and re-suspended in
water at a concentration of approximately 300 ng ml21.
Both the virome and microbiome DNAs were sequenced at 454
Life Sciences (Branford, CT) using their parallel pyrosequencing
approach.
Initial bioinformatics on metagenomesThe DNA sequences generated by 454 Life Sciences, Inc, were
analyzed without assembly. This approach simplifies the statistical
analysis and avoids problems with chimera assemblies. Thus, these
sequences represent environmental gene tags [31]–short fragments
of genes that are found in the different samples. To characterize
these sequences, several independent approaches were taken. In
the first approach, the sequences were compared to the extant
sequence libraries using the Basic Local Alignment Search Tool
(BLAST) algorithm. Several boutique databases were used for
rapid comparisons and categorization of the DNA sequences. All
sequences were compared to the 16S ribosomal DNA database
(version 9) available from http://rdp.cme.msu.edu/; the Phage
Genome Database and the viral genome database http://phage.
sdsu.edu/phage; the European Ribosomal DNA database (http://
www.psb.ugent.be/rRNA/); and the ACLAME (A Classification
of Genetic Mobile Elements) database (http://aclame.ulb.ac.be/)
[32–35]. Results from these analyses are all available at the Line
Islands section of our website http://scums.sdsu.edu. Sequences
were also compared to the SEED platform [36,37] using the
BLASTX algorithm [38]. This database contains the protein
sequences from all the available complete and draft genomes. The
comparisons were run on the Life Sciences Gateway to the
Teragrid (Judson, Edwards, Papka, and Stevens, in preparation).
The number of sequences obtained from the 454 pyrosequencing
and the number that showed significant similarities are provided in
Supplementary Table S1.
The metagenomic sequence fragments with significant similar-
ities (E-value$0.01) to the SEED platform (http://metagenomics.
theseed.org/) were assigned functions based on their closest
similarity. This approach allows rapid assessment of the metabolic
potential of the sample and provide reliable taxonomic and
functional assessments [29,30,39].
Taxonomy and guild assignmentsTaxonomical assignments of uncultured microbes are routinely
based on sequence data. In the case of microbial metagenomes,
this is done in two ways: 1) closest hits to 16S rDNAs, and 2)
closest hits to any sequence from a known organism. In the former
case, it is relatively easy to just compare the metagenome results to
those obtained from traditional 16S rDNA surveys. Using this
approach, it has been shown that both qualitatively and
quantitatively, the 16S rDNA genes in metagenomes are very
similar to those found by 16S rDNA sequencing [39]. This is true
regardless of whether the metagenome is made by cloning and
Sanger sequencing or by the cloneless 454 pyrosequencing
approach. In the latter case, the shorter sequences (,100 bp)
Microbes with Coral Reefs
PLoS ONE | www.plosone.org 4 February 2008 | Volume 3 | Issue 2 | e1584
yield the same overall result as the longer Sanger sequences.
Though less established than the 16S rDNA approach, taxono-
mical assignment of metagenomic sequence fragments based on
their closest hits to any sequence from a known organism is
accurate and informative, and much more metagenomic data are
utilized in the analysis. Ground-truthing in this case has been done
by a variety of comparisons to coding genes, as well as to cloned
16S rDNA libraries [39]. This approach has also been validated
for 454 pyrosequencing data [40].
Both 16S rDNA cloning approaches and metagenomics suffer
from the fact that the microbes are not in culture. Very closely
related microbes can have quite different phenotypes based on just
a few genes (e.g., exotoxins). Therefore, assignment of microbes to
guilds based on uncultured data needs to be qualified. For this
study we chose to assign the metagenomic fragments to
autrotrophs, heterotrophs, and potential pathogens (see below
for details). While there might be some overlap between these
guilds, the results are very similar whether just the 16S rDNA
assignments are considered or functional assignments are used.
Although as noted above, small genetic differences can result in
major guild differences, the methods were applied consistently
across all the atolls so that bias associated with the method would
be systematic in nature.
The ‘‘habitat’’ of each microbe with a genome in the SEED
platform was manually curated from Bergey’s Manual of
Determinative Bacteriology [41]. For example, cyanobacteria
were assigned to the ‘‘autotroph’’ guild and SAR11 was assigned
to the ‘‘heterotroph’’ guild. The ‘‘potential pathogen’’ guild
consisted of metagenomic sequence fragments most closely related
to the human pathogenic genera Staphylococcus, Vibrio, and
Escherichia, the fish pathogens belonging to Aeromona, and plant
pathogens from the Xylella genera. A complete list of the organisms
that we described as autotrophic, heterotrophic or potential
pathogens is provided on the Line Islands section of our
accompanying website at http://scums.sdsu.edu under the section
titled ‘‘Bergey’s listing’’. This categorization was used to estimate
the proportion of microbes that could be described as belonging to
one of these three groups on each atoll.
SEED-based assignments of metabolic potentialThe metabolic potential of each sample was identified by
examining the similarities between the metagenomic sequence
fragments and genes in metabolic subsystems. A metabolic
subsystem is a group of genes that together form a metabolic
function or pathway. The complete list of genes that was similar to
metabolic subsystems for microbiomes is provided on http://
scums.sdsu.edu. Descriptions of each of the subsystems are
available from http://www.theseed.org/. The frequency that each
metabolic subsystem was found at each atoll was visualized using a
novel interactive web interface which color-codes the frequency to
which each subsystem is found in each metagenome sample
(http://metagenomics.theseed.org/).
Two different methods were used to calculate the statistical
significance of the presence and absence of different metabolic
subsystems in each sample: 1) The XIPE-TOTEC subsampling
method [37], and 2) the G-test (a maximum likelihood test), neither
of which depend on a normal distribution of the data. The two
approaches identified which metabolic subsystems were statistically
over-represented between the atolls (results are provided at http://
scums.sdsu.edu). The analyses of the subsystems and accompanying
statistics were used to calculate the seven most abundant subsystems
that were different between Kingman and Kiritimati. Relative
representation of each subsystem was calculated as the number of
similarities to a particular subsystem divided by the total number of
similarities to any subsystem; using percentages allows comparisons
between samples regardless of the number of sequences obtained
from each pyrosequencing reaction.
Bioinformatics of the viromesThe small fraction metagenomic libraries were compared to the
known phage genomes in the phage database (v. 5; http://phage.
sdsu.edu/phage). This database contains 510 phage genomes and
was used to construct the latest version of the Phage Proteomic
Tree [34,42]. To compare the relative numbers of phage hosts at
each atoll, the incidence of each phage host genome per atoll was
counted. Counts were normalized for the number of sequences per
metagenome, enabling direct comparisons between metagenomes.
The microbe that the phage infects was then compared against the
‘‘Bergey’s List’’ to describe the phage as either infecting an
autotrophic, heterotrophic or potentially pathogenic bacteria
identified as described above.
Two individual phage and prophage strains (Escherichia coli WCP4-6 prophage and Prochlorococcus marinus SSMP4 phage) were
used to provide information on the spread of sequence similarities
across individual genomes. The coverage maps were constructed
by creating a database with the phage or prophage genomes of
interest and comparing the metagenomes against them by using
TBLASTX. Sequences with E-values#0.0001 were binned into
1000 base pair windows along the reference genomes. The total
number of sequence similarities within a window was calculated
and divided by the total number of sequences for each
metagenome, allowing comparisons between metagenomes.
Pfam and GO term analysisThe metagenomic libraries were also analyzed using the Pfam
database as a comparison to the SEED platform conclusions. To
identify conserved protein domains in the metagenomes, all
sequence fragments from a sample were translated into each of the
six reading frames. To save computational time, translated
sequences with an in-frame stop codon were excluded from further
analysis. The remaining sequences were locally aligned to each Pfam
family using the pHMM from the Pfam_fs database (version 20.0).
To search the Pfam_fs database, hmmpfam was run on a computer
cluster at the Center for Biotechnology (CeBiTec; Bielefeld
University, Germany) [43]. The E-value cut-off was set to 0.01.
Conserved protein domains were categorized into functional
groups according to the Gene Ontology (GO) [44]. For each
identified domain, GO terms were obtained from its Pfam family
description. A pair-wise comparison of all samples versus all
samples was performed to identify overrepresented GO terms in a
sample. To determine if a GO term was significantly overrepre-
sented, the Gadj-test was employed under the null hypothesis H0:
there is no difference in the abundance of identified domains in the
two samples to which the GO term was assigned. Values of G were
adjusted by the Williams’ correction factor. The significance level
was set to P,0.05.
To predict the species composition of a sample, 454
pyrosequencing fragments that had a Pfam hit were labeled
according to the longest common prefix shared by the most similar
members of the Pfam family. The strategy for assignment was as
follows: First, the sequence was compared to each member of the
Pfam family with a pair-wise alignment using BLAST. Second,
Emin was assigned as the minimal E-value obtained in the BLAST
comparisons. The taxa of the organisms of all Pfam family
members that hit the sequence with an E-value,Emin+5%?Emin
were fetched from NCBI. Finally, the sequence was labeled with
the longest common prefix of these taxa. For example,
Bacteria:Cyanobacteria is the longest common prefix of the two taxa
Microbes with Coral Reefs
PLoS ONE | www.plosone.org 5 February 2008 | Volume 3 | Issue 2 | e1584
N Bacteria:Cyanobacteria:Prochlorales:Prochlorococcaceae:Pro-chlorococcus
N Bacteria:Cyanobacteria:Chroococcales:Synechococcus
The taxonomic identification provided by this analysis was
categorized according to the definitions in Bergey’s manual, thus
enabling a comparison of the metagenomic data using a separate
database.
Vibrio spp. CulturingBacteria were cultured using thiosulfate citrate bile sucrose
(TCBS; Remel; Lenexa, KS USA) plates to provide an estimate of
the number of culturable Vibrio spp. present on each atoll. Water was
sub-sampled from the Niskin bottles and 0.1 ml was inoculated on
eight plates for each site. To determine the numbers of Vibrio spp.
associated with coral, mucus samples were obtained from six corals
per site using specially developed ‘‘super-suckers’’. This apparatus
allows the mucus to be gathered from the coral colony while
minimizing the entry of surrounding seawater. Once again, 0.1 ml of
coral mucus was spread onto plates. Vibrio spp. colonies forming units
were enumerated after 24 hours incubation at 28uC (ambient sea
water temperature). Differences in Vibrio spp. concentrations per ml
of seawater or mucus were compared across all four atolls
simultaneously using a non-parametric ANOVA. To further assess
differences in the number of culturable Vibrio spp. between atolls,
pairwise comparisons for all possible pairs of atolls were conducted
using non-parametric exact Wilcoxon tests, testing a one-sided
alternative hypothesis (i.e., that one atoll in the pair had a higher
concentration of Vibrio spp. than the other). The one-sided test was
conducted for all atoll pairings. On Kingman no culturable Vibrio
spp. were observed in either the seawater or coral mucus, so the
TCBS plates were tested with isolates from Kiritimati. In all cases,
the plates were able to support growth of Vibrio spp.
Water chemistryDissolved organic carbon (DOC), total dissolved inorganic
nitrogen (nitrate, nitrite and ammonium), and dissolved inorganic
phosphate were determined for all Niskin bottles. For DOC analysis,
the water samples were filtered through a pre-combusted Whatman
GF/F glass fiber filter and collected in pre-combusted amber glass
vials (Wheaton) with acid-washed Teflon lined lids. Samples were
acidified (,pH 2) with analytical grade 30% hydrochloric acid
(Fluka) and stored at 4uC. DOC concentrations were analyzed by
Expert Chemical Analysis (San Diego, CA) using the high-
temperature combustion method and a O.I. Analytical Model
1010 TOC analyzer (Texas, USA). To ensure quality control, DOC
consensus reference materials (CRM: DSW Lot 05-05 at 45-46 mM
C; LCW Lot 12-01 at 2 mM C; supplied by Dr Wenhao Chen,
University of Miami) were used, and the high-carbon standard was
run every six samples. The methods described for the DOC analysis
are the same as those prescribed by the Intergovernmental
Oceanographic Commission for the collection of DOC samples.
These protocols avoid many of the uncertainties associated with
earlier research on DOC levels [45,46].
For inorganic nutrient analysis, samples were filtered through
0.2 mm Nuclepore Track-Etch membrane filters (Whatman) into
HDPE scintillation vials with cone-shaped plastic lined lids (Fisher
Scientific), after rinsing both the bottles and lids three times with
filtrate. Each sample consisted of 15ml of filtrate, which were then
stored at 220uC until analyzed. Analysis of inorganic nutrient
(nitrate, nitrite, ammonium and phosphate) concentrations was
carried out by Marine Science Institute Analytical Lab at University
of California at Santa Barbara (Santa Barbara, CA) using a
QuikChem 8000 flow injection analyzer (Lachat Instruments,
Wisconsin, USA). All chemical components were found not to vary
between depths (DOC F32 = 0.872, P = 0.660; TDIN F32 = 0.968,
P = 0.572; Phosphate F32 = 1.048, P = 0.442), and therefore, analyses
were conducted on the site level. All water chemistry variables were
normally distributed and did not show heterogeneity (tested using
test described earlier). The differences between the concentrations of
each chemical component on each atoll were compared using a
MANOVA with sites nested within locations.
To determine natural isotopes of nitrogen, 1 liter of seawater was
filtered through GF/F filters to collect particulate organic matter.
The filters were folded in half, wrapped in foil, and stored at 220uC.
The 14N/15N ratios were determined at the Marine Sciences
Institute at UCSB (Santa Barbara, CA) using a Finnigan Delta Plus
Advantage with a Costech Elemental Analyzer peripheral. Mea-
surements conducted at Kingman and Kiritimati only.
Respiration experimentsMicro-respiration experiments were used to estimate the
‘‘nutritional quality’’ of the waters from the four atolls. On each
atoll, water collected from three sites only, was 0.2 mm filtered to
remove microbes, and stored frozen at 280uC. Upon return to
San Diego State University, the samples were thawed and
inoculated with the same microbial community to determine
whether the waters from one atoll would support more or less
microbial activity. The microbial community was obtained by
centrifuging 1 ml of water from a laboratory coral reef tank at
,5,0006g in a microfuge. The supernatant was aspirated away,
and the microbial pellet was resuspended into 1 ml of the
previously thawed water from the different atolls (each sample run
in triplicate). The mixture of the aquarium microbes and atoll
water was placed in micro-respirometry chambers and the oxygen
concentrations were measured using micro-oxygen sensor probes
(Unisense, Aarhus C, Denmark). The microbes were grown for a
total of four hours and oxygen concentrations (nmol O2 ml21)
were measured every minute. Negative controls were conducted
by running the experiments without microbial inoculations. To
calculate respiration rates, the slopes of the oxygen concentration
curve between 75 to 175 minutes were determined. The time-
frame was used because it produced the most consistent oxygen
utilization levels (i.e., a linear slope after the lag phase). The
number of cells in each chamber was determined by direct counts
(described above) at the end of the experiment and the respiration
rate per million microbes was calculated by dividing by the
number of microbial cells. Conventional methods of measuring
growth rates of microbes (e.g., using 3[H]-thymidine) were not
performed because there was no access to a ‘‘rad van’’ on the
cruise. Measurements of microbial activity using Br-dUTP
incorporation were attempted, but failed because of technical
problems. In the end, however, measuring the oxygen consump-
tion by the same microbial community in the different water
samples was probably more illustrative than comparing growth
rates of different communities in different waters.
Coral healthSurveys describing the health status of corals were conducted on
two 2 m620 m belt transects at 10–12 sites on each of the four
atolls. These techniques for the assessment of coral health were
developed by the Coral Disease working group of the Global
Environmental Facility/World Bank coral reef targeted research
program [14]. All coral colonies, both healthy and those showing
signs of potential disease were counted. Most coral diseases do not
have known microbial pathogens, but the colony displays signs
that can be distinguished. These signs included White Syndrome,
Skeletal Eroding Band, Brown Band, Black Band and other
Microbes with Coral Reefs
PLoS ONE | www.plosone.org 6 February 2008 | Volume 3 | Issue 2 | e1584
cyanobacterial infections [47], tissue necrosis caused by sediments
containing a high mucus load and low numbers of cyanobacteria,
algal interactions with corals that cause tissue erosion, bleached
white patches, and pink coloration [48,49]. Predator feeding scars
from Drupella spp. and Acanthaster planci were identified and
excluded from the analysis. Corals showing signs of compromised
health were used to analyze the relationship between the number
of unhealthy and healthy corals at each site. The prevalence of
unhealthy corals was calculated by dividing the numbers of
unhealthy corals by the total number of corals on each transect.
Only scleractinian corals were used in the assessment.
Percent cover of benthic organismsQuantitative assessments of the benthos were made using the
photoquadrat method [50]. Ten points were randomly selected
and surveyed per transect (i.e., the same transects that were laid for
the coral health surveys). At each point a photograph was taken
using an Olympus 7070 digital camera that was connected to a
tripod (1 m high) and a frame (0.960.6 m or 0.54 m2). Therefore,
for each site 20 photoquadrats were sampled. During surveys, notes
were made for each photoquadrat and collections were made for
organisms that were unidentifiable in situ. Upon return to the
research vessel, the twenty photographs were numbered and color
adjusted using Adobe Photoshop v. 7.0. Image analysis was
completed using the program Photogrid 1.0. For each photograph,
100 points were randomly generated and the organism under each
point was identified. Therefore, for each site 2000 points were
quantified. All organisms were identified to the finest level of
resolution possible (genus level for scleractinian and soft corals,
functional group for algal turfs and crustose coralline algae, and
species level for macroalgae and macroinvertebrates where possible).
The percent of coral cover was calculated by dividing the number of
points that were assigned to scleractinian corals by the total number
of points counted for each photoquadrat. Percent cover of
scleractinian corals was used to identify the density dependent
nature of the distribution of unhealthy corals on each atoll.
Results
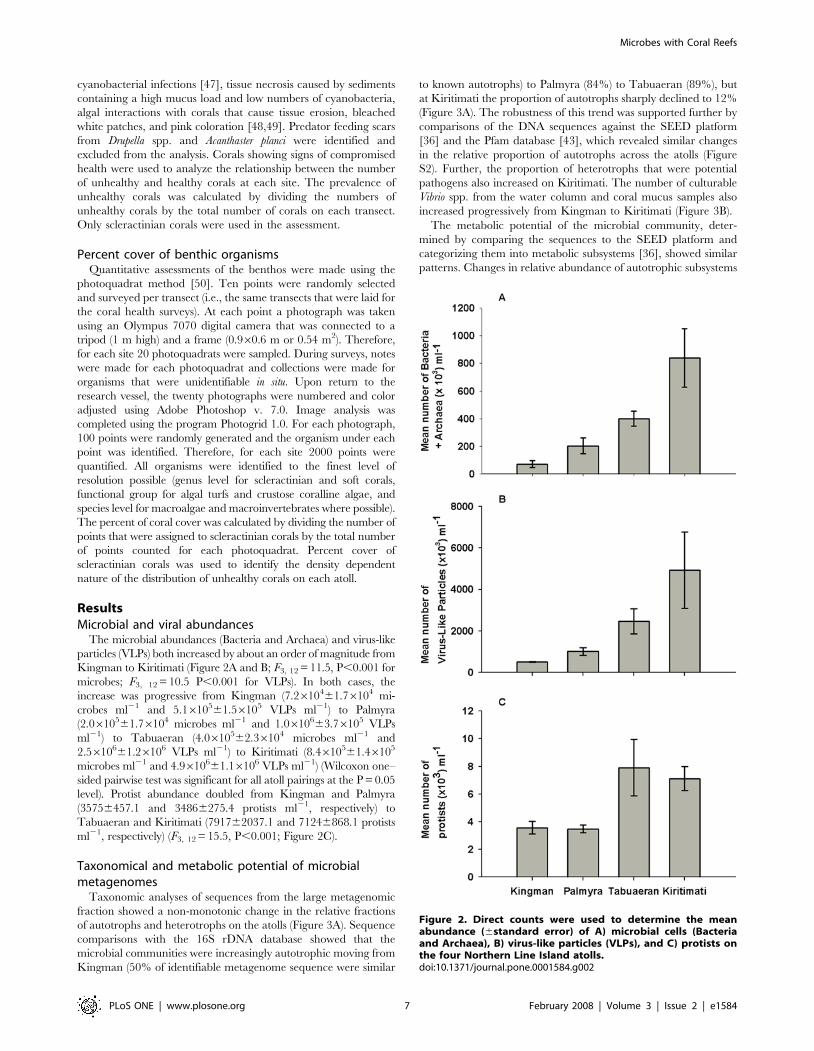
Microbial and viral abundancesThe microbial abundances (Bacteria and Archaea) and virus-like
particles (VLPs) both increased by about an order of magnitude from
Kingman to Kiritimati (Figure 2A and B; F3, 12 = 11.5, P,0.001 for
microbes; F3, 12 = 10.5 P,0.001 for VLPs). In both cases, the
increase was progressive from Kingman (7.2610461.76104 mi-
crobes ml21 and 5.1610561.56105 VLPs ml21) to Palmyra
(2.0610561.76104 microbes ml21 and 1.0610663.76105 VLPs
ml21) to Tabuaeran (4.0610562.36104 microbes ml21 and
2.5610661.26106 VLPs ml21) to Kiritimati (8.4610561.46105
microbes ml21 and 4.9610661.16106 VLPs ml21) (Wilcoxon one–
sided pairwise test was significant for all atoll pairings at the P = 0.05
level). Protist abundance doubled from Kingman and Palmyra
(35756457.1 and 34866275.4 protists ml21, respectively) to
Tabuaeran and Kiritimati (791762037.1 and 71246868.1 protists
ml21, respectively) (F3, 12 = 15.5, P,0.001; Figure 2C).
Taxonomical and metabolic potential of microbialmetagenomes
Taxonomic analyses of sequences from the large metagenomic
fraction showed a non-monotonic change in the relative fractions
of autotrophs and heterotrophs on the atolls (Figure 3A). Sequence
comparisons with the 16S rDNA database showed that the
microbial communities were increasingly autotrophic moving from
Kingman (50% of identifiable metagenome sequence were similar
to known autotrophs) to Palmyra (84%) to Tabuaeran (89%), but
at Kiritimati the proportion of autotrophs sharply declined to 12%
(Figure 3A). The robustness of this trend was supported further by
comparisons of the DNA sequences against the SEED platform
[36] and the Pfam database [43], which revealed similar changes
in the relative proportion of autotrophs across the atolls (Figure
S2). Further, the proportion of heterotrophs that were potential
pathogens also increased on Kiritimati. The number of culturable
Vibrio spp. from the water column and coral mucus samples also
increased progressively from Kingman to Kiritimati (Figure 3B).
The metabolic potential of the microbial community, deter-
mined by comparing the sequences to the SEED platform and
categorizing them into metabolic subsystems [36], showed similar
patterns. Changes in relative abundance of autotrophic subsystems
Figure 2. Direct counts were used to determine the meanabundance (6standard error) of A) microbial cells (Bacteriaand Archaea), B) virus-like particles (VLPs), and C) protists onthe four Northern Line Island atolls.doi:10.1371/journal.pone.0001584.g002
Microbes with Coral Reefs
PLoS ONE | www.plosone.org 7 February 2008 | Volume 3 | Issue 2 | e1584
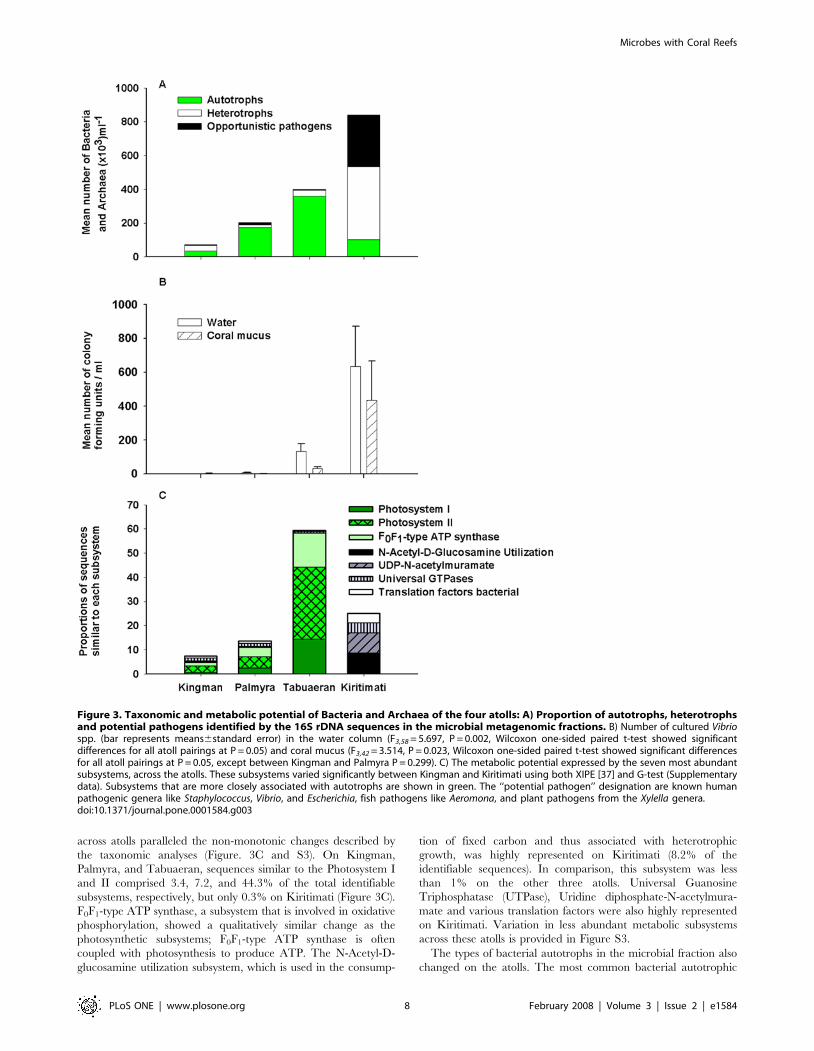
across atolls paralleled the non-monotonic changes described by
the taxonomic analyses (Figure. 3C and S3). On Kingman,
Palmyra, and Tabuaeran, sequences similar to the Photosystem I
and II comprised 3.4, 7.2, and 44.3% of the total identifiable
subsystems, respectively, but only 0.3% on Kiritimati (Figure 3C).
F0F1-type ATP synthase, a subsystem that is involved in oxidative
phosphorylation, showed a qualitatively similar change as the
photosynthetic subsystems; F0F1-type ATP synthase is often
coupled with photosynthesis to produce ATP. The N-Acetyl-D-
glucosamine utilization subsystem, which is used in the consump-
tion of fixed carbon and thus associated with heterotrophic
growth, was highly represented on Kiritimati (8.2% of the
identifiable sequences). In comparison, this subsystem was less
than 1% on the other three atolls. Universal Guanosine
Triphosphatase (UTPase), Uridine diphosphate-N-acetylmura-
mate and various translation factors were also highly represented
on Kiritimati. Variation in less abundant metabolic subsystems
across these atolls is provided in Figure S3.
The types of bacterial autotrophs in the microbial fraction also
changed on the atolls. The most common bacterial autotrophic
Figure 3. Taxonomic and metabolic potential of Bacteria and Archaea of the four atolls: A) Proportion of autotrophs, heterotrophsand potential pathogens identified by the 16S rDNA sequences in the microbial metagenomic fractions. B) Number of cultured Vibriospp. (bar represents means6standard error) in the water column (F3,58 = 5.697, P = 0.002, Wilcoxon one-sided paired t-test showed significantdifferences for all atoll pairings at P = 0.05) and coral mucus (F3,42 = 3.514, P = 0.023, Wilcoxon one-sided paired t-test showed significant differencesfor all atoll pairings at P = 0.05, except between Kingman and Palmyra P = 0.299). C) The metabolic potential expressed by the seven most abundantsubsystems, across the atolls. These subsystems varied significantly between Kingman and Kiritimati using both XIPE [37] and G-test (Supplementarydata). Subsystems that are more closely associated with autotrophs are shown in green. The ‘‘potential pathogen’’ designation are known humanpathogenic genera like Staphylococcus, Vibrio, and Escherichia, fish pathogens like Aeromona, and plant pathogens from the Xylella genera.doi:10.1371/journal.pone.0001584.g003
Microbes with Coral Reefs
PLoS ONE | www.plosone.org 8 February 2008 | Volume 3 | Issue 2 | e1584
genus on Kingman and Palmyra was Prochlorococcus (75 and 91% of
the cyanobacterial population, respectively), whereas on Ta-
buaeran and Kiritimati, Synechococcus was the most common genus
(66 and 64% of the cyanobacterial population, respectively; Figure
S4). This pattern may reflect variations observed in the water
chemistry across the atolls, because Prochlorococcus is common in
oligotrophic water, whereas Synechococcus becomes dominant in
increasingly nutrient rich water [51,52].
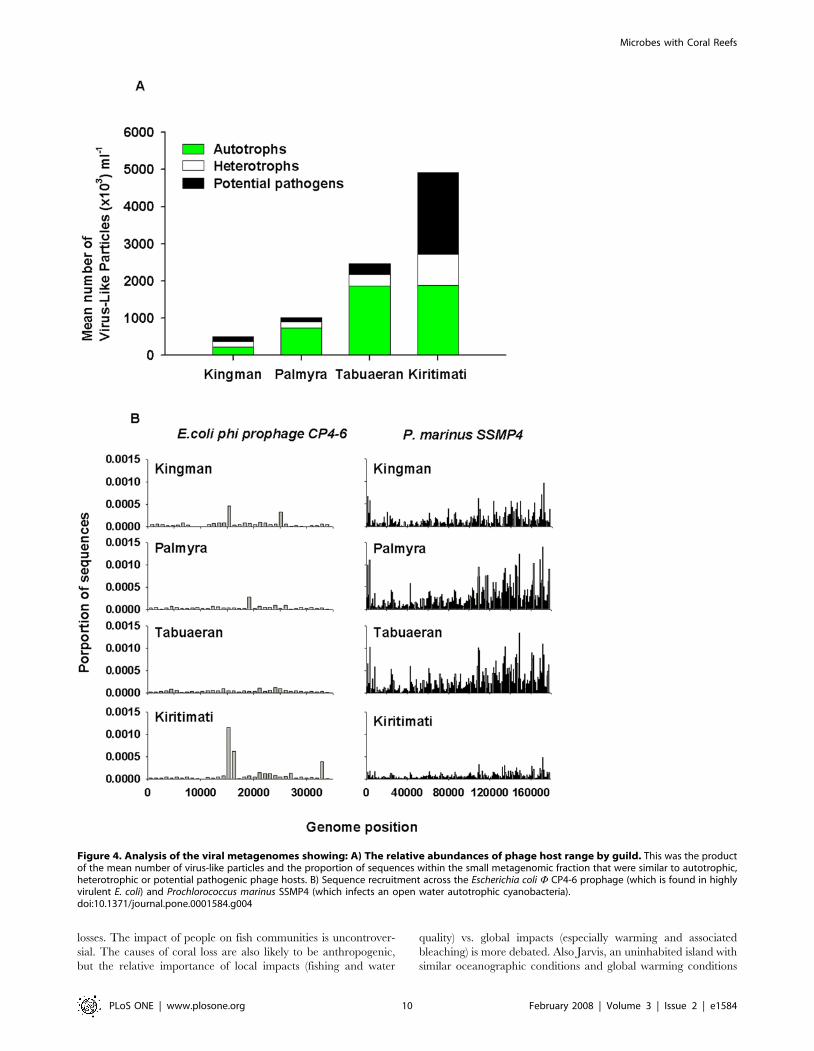
ViromesThe viral metagenomic fraction was compared to a database of
all known phage and prophage genome sequences (http://phage.
sdsu.edu/phage). Significant similarities to this database (E-
value#0.001) were used to identify the types of phages on each
atoll. Since phage are host specific the proportion of phage
infecting autotrophic and heterotrophic microbes was calculated.
In parallel with the microbial analysis, the analysis of the phage
hosts showed the phage known to infect cyanobacteria increased
from Kingman (44%) to Palmyra (73%) and Tabuaeran (61%),
and then at Kiritimati the phage known to infect heterotrophic
microbes became dominant (61%; Figure 4A). A further
breakdown of the potential host range of the phage is provided
in the Figure S5.
The virome sequences were also analyzed using a fragment
recruitment method to known genomes (described in [29]), which
maps sequences to their relevant position on the reference genome
(Figure 4B). Sequences similar to Escherichia coli W CP4-6 prophage,
which is found in highly virulent enterohemorrhagic Escherichia coli
strains [53], were more common on Kiritimati. In contrast,
sequences similar to the Prochlorococcus marinus SSMP4 phage were
more common in Kingman, Palmyra, and Tabuaeran (Figure 4B).
The differences between the sequence distributions also became
apparent when the average number of sequences showing similarities
to each section of the genome was compared. For example, the
number of sequences similar to Escherichia coli W CP4-6 prophage
steadily increased from Kingman (29 sequences per 5000 bp), to
Palmyra (66 sequences per 5000 bp) to Tabuaeran (91 sequences per
5000 bp) to Kiritimati (147 sequences per 5000 bp).
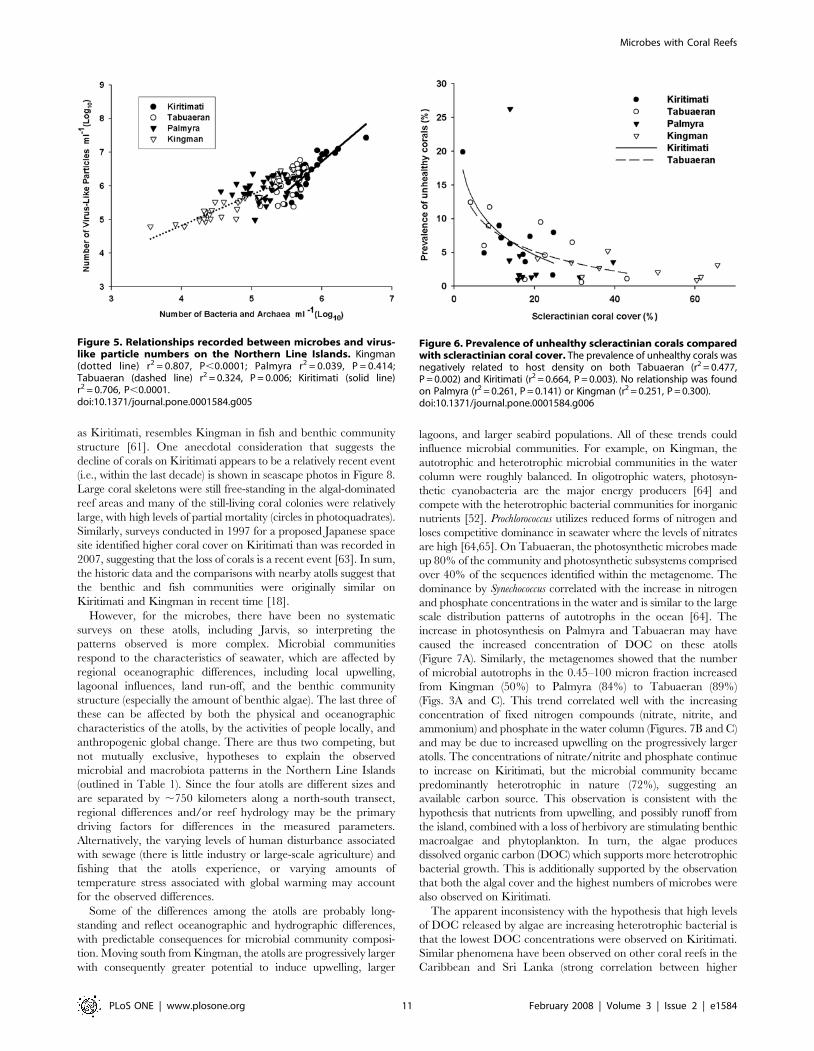
Microbial predator-prey ratiosVirus-like particles (VLPs) and microbial numbers were positively
correlated on Kingman, Tabuaeran, and Kiritimati, but not on
Palmyra (Figure 5). The steepness of the slope of the VLPs:microbes
increased from Kingman (0.909) to Tabuaeran (1.378) to Kiritimati
(1.768). Microbes on Kiritimati were able to sustain approximately
two times the number of VLPs than on Kingman, which suggests
that the characteristics of the relationship are not static, but may be
associated with conditions on each atoll.
The overall abundances of the protists increased from Kingman
to Kiritimati, but the protists:microbe ratio declined. There were
0.0301 (60.018) protists per microbial cell at Kingman, 0.013
(60.005) at Palmyra, 0.015 (60.004) at Tabuaeran, and 0.008
(60.004) at Kiritimati. On Kingman, 66% of protists were strict
heterotrophs (i.e., contained no chlorophyll) compared with 22%
on Kiritimati.
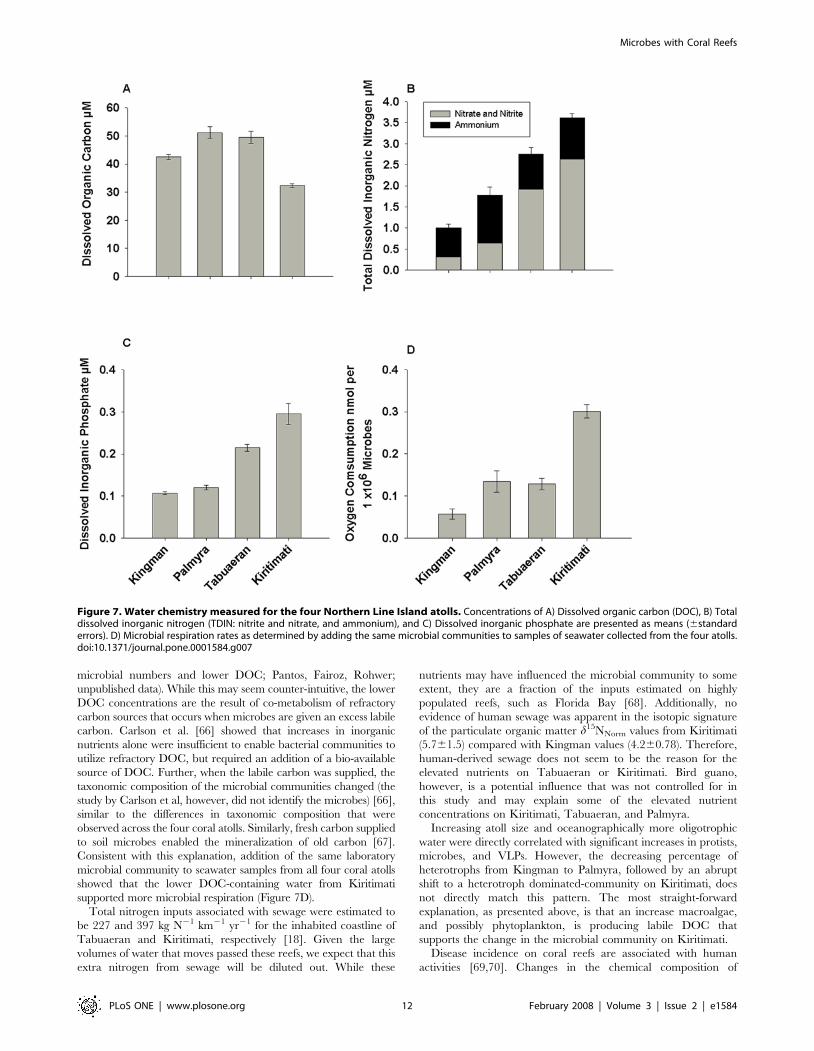
Coral cover and disease prevalenceAs shown in Figure 6, coral cover declined from Kingman
(43.8%65.4) to Palmyra (20.4%62.3) to Tabuaeran (19.5%61.0)
to Kiritimati (14.9%62.3), whereas prevalence of disease on hard
corals was lowest on Kingman (2.5%60.5) and highest on
Kiritimati (6.3%61.4) and Tabuaeran (6.2%61.4). Palmyra
showed medium prevalence of disease (4.8%62.0) (Kruskal Wallis
test; H = 8.0, df = 3, p = 0.04).
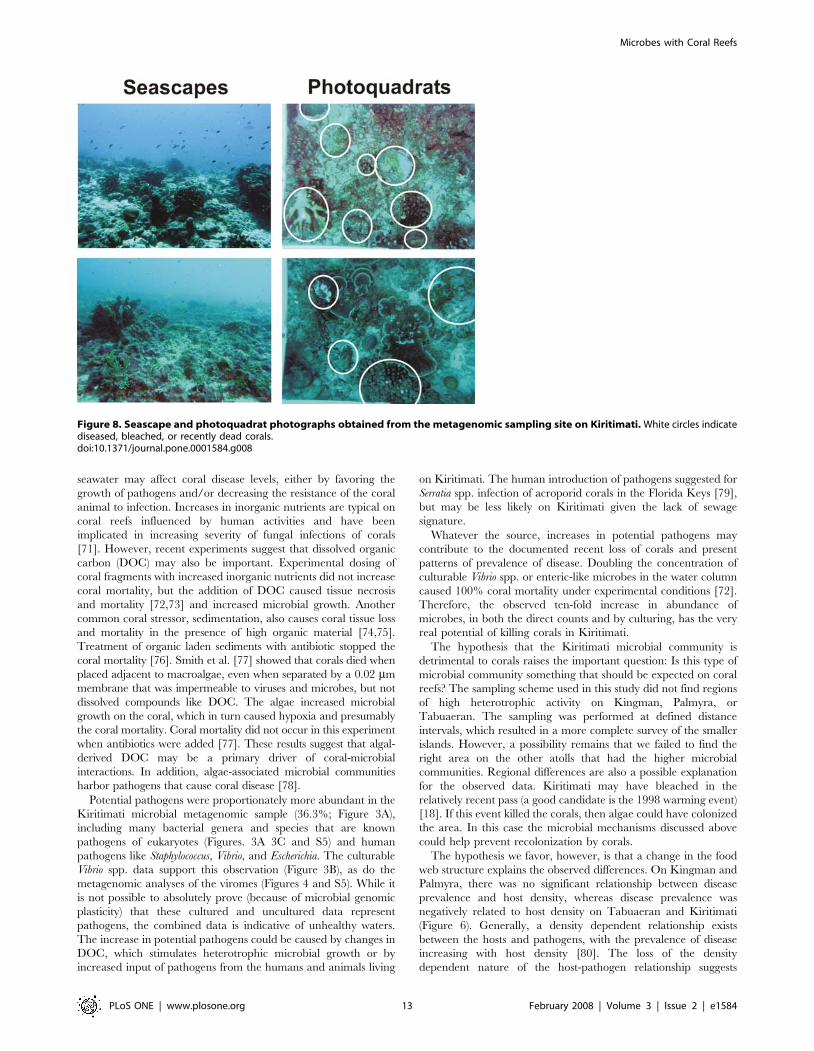
Water chemistryDissolved organic carbon (DOC) concentrations were highest on
Palmyra (51.162.1 mmol l21) and Tabuaeran (49.562.4 mmol l21),
lower on Kingman (42.560.9 mmol l21), and lowest on Kiritimati
(32.360.6 mmol l21) (Figure 7A). Given the low numbers of
measurements of DOC on coral reefs, a range of these values has
been provided in Table S2 for comparison.
Total dissolved inorganic nitrogen (TDIN) increased almost
four-fold from Kingman (1.360.08) to Kiritimati (3.660.1)
(Figure 7B; F3,12 = 38.735, P,0.001), and similarly inorganic
phosphate concentrations increased from Kingman (0.160.003) to
Kiritimati (0.360.024) (Figure 7C; F3,12 = 395.2, P,0.001). No
clear pattern was apparent in the concentrations of particulate
organic carbon and particulate organic nitrogen (data not shown).
No significant differences were found in the d15NNorm values in the
particulate organic matter from Kingman (4.260.78) and
Kiritimati (5.761.5) (not measured on Palmyra or Tabuaeran).
These differences in water chemistry were also reflected in
results of the assays of oxygen consumption rates of a standard
microbial community grown in seawater from each of the atolls.
Microbes grown in water from Kingman had the lowest respira-
tion rates (0.05860.012 nmol oxygen consumed per 16106
microbes), whereas the same microbes grown in water from
Kiritimati had much higher respiration rates (0.30960.016 nmol
oxygen consumed per 16106 microbes) (Figure 7D; P,0.001).
Discussion
Microbial numbers in the water column overlying coral reefs
usually range from 2–66105 cells ml21 [2,54,55]. Our mean
values were roughly comparable, although the lowest and highest
mean values observed exceeded this range: Kingman averaged
7.26104 microbes ml21, Palmyra averaged 2.06105 microbes
ml21, Tabuaeran averaged 4.06105microbes ml21, and Kiritimati
averaged 8.46105microbes ml21. Reports for viral like particles
(VLPs) range from 0.3–1.256107 VLPs ml21 in the water column
[56], densities that exceeded those were not observed: Kingman
averaged 5.16105 VLPs ml21, Palmyra averaged 1.06106 VLPs
ml21, Tabuaeran averaged 2.56106 VLPs ml21, and Kiritimati
averaged 4.96106 VLPs ml21. For both microbes and VLPs,
densities increased steadily across the four atolls; protists also
increased, although in a stepwise fashion. There were also
differences in community composition, most notably a sharp
increase in heterotrophic Bacteria and Archaea and in potential
pathogens in Kiritimati. Finally, we observed a steady increase in
total dissolved inorganic nitrogen, which was 4-fold higher on
Kiritimati than Kingman, and a similar pattern for inorganic
phosphate, which increased 3-fold. In contrast, dissolved organic
carbon (DOC) concentrations were highest on Palmyra and
Tabuaeran and lowest on Kiritimati.
A study of the macrobiota conducted simultaneously with our
microbial study documented equally striking changes. Fish
biomass dropped steadily from 527 to 132 g m21 from Kingman
to Kiritimati, primarily due to the loss of top predators. In parallel
with these differences, coverage of corals and coralline algae
declined from 71% to 21%, and cover by fleshy and turf algae
increased from ,20% to 68% from Kingman to Kiritimati [18].
For the macrobiota, historical data and data from nearby Pacific
atolls [18] suggest that anthropogenic impacts are likely to be
important factors in explaining these differences across the atolls.
Historical records for Kiritimati indicate that sharks were once
very abundant [57–60], and more recent surveys indicate a decline
in fish biomass by 50% and coral cover by 30% in the last decade
[61–63]; in contrast, uninhabited Kingman has not suffered such
Microbes with Coral Reefs
PLoS ONE | www.plosone.org 9 February 2008 | Volume 3 | Issue 2 | e1584
losses. The impact of people on fish communities is uncontrover-
sial. The causes of coral loss are also likely to be anthropogenic,
but the relative importance of local impacts (fishing and water
quality) vs. global impacts (especially warming and associated
bleaching) is more debated. Also Jarvis, an uninhabited island with
similar oceanographic conditions and global warming conditions
Figure 4. Analysis of the viral metagenomes showing: A) The relative abundances of phage host range by guild. This was the productof the mean number of virus-like particles and the proportion of sequences within the small metagenomic fraction that were similar to autotrophic,heterotrophic or potential pathogenic phage hosts. B) Sequence recruitment across the Escherichia coli W CP4-6 prophage (which is found in highlyvirulent E. coli) and Prochlorococcus marinus SSMP4 (which infects an open water autotrophic cyanobacteria).doi:10.1371/journal.pone.0001584.g004
Microbes with Coral Reefs
PLoS ONE | www.plosone.org 10 February 2008 | Volume 3 | Issue 2 | e1584
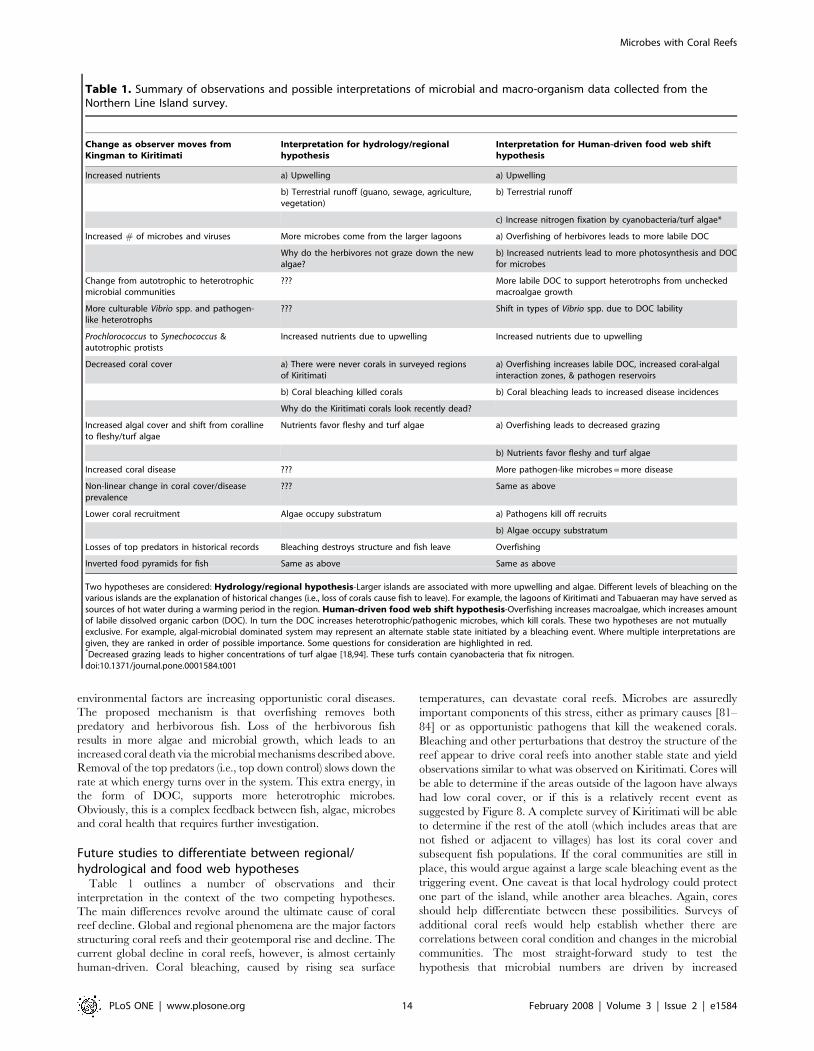
as Kiritimati, resembles Kingman in fish and benthic community
structure [61]. One anecdotal consideration that suggests the
decline of corals on Kiritimati appears to be a relatively recent event
(i.e., within the last decade) is shown in seascape photos in Figure 8.
Large coral skeletons were still free-standing in the algal-dominated
reef areas and many of the still-living coral colonies were relatively
large, with high levels of partial mortality (circles in photoquadrates).
Similarly, surveys conducted in 1997 for a proposed Japanese space
site identified higher coral cover on Kiritimati than was recorded in
2007, suggesting that the loss of corals is a recent event [63]. In sum,
the historic data and the comparisons with nearby atolls suggest that
the benthic and fish communities were originally similar on
Kiritimati and Kingman in recent time [18].
However, for the microbes, there have been no systematic
surveys on these atolls, including Jarvis, so interpreting the
patterns observed is more complex. Microbial communities
respond to the characteristics of seawater, which are affected by
regional oceanographic differences, including local upwelling,
lagoonal influences, land run-off, and the benthic community
structure (especially the amount of benthic algae). The last three of
these can be affected by both the physical and oceanographic
characteristics of the atolls, by the activities of people locally, and
anthropogenic global change. There are thus two competing, but
not mutually exclusive, hypotheses to explain the observed
microbial and macrobiota patterns in the Northern Line Islands
(outlined in Table 1). Since the four atolls are different sizes and
are separated by ,750 kilometers along a north-south transect,
regional differences and/or reef hydrology may be the primary
driving factors for differences in the measured parameters.
Alternatively, the varying levels of human disturbance associated
with sewage (there is little industry or large-scale agriculture) and
fishing that the atolls experience, or varying amounts of
temperature stress associated with global warming may account
for the observed differences.
Some of the differences among the atolls are probably long-
standing and reflect oceanographic and hydrographic differences,
with predictable consequences for microbial community composi-
tion. Moving south from Kingman, the atolls are progressively larger
with consequently greater potential to induce upwelling, larger
lagoons, and larger seabird populations. All of these trends could
influence microbial communities. For example, on Kingman, the
autotrophic and heterotrophic microbial communities in the water
column were roughly balanced. In oligotrophic waters, photosyn-
thetic cyanobacteria are the major energy producers [64] and
compete with the heterotrophic bacterial communities for inorganic
nutrients [52]. Prochlorococcus utilizes reduced forms of nitrogen and
loses competitive dominance in seawater where the levels of nitrates
are high [64,65]. On Tabuaeran, the photosynthetic microbes made
up 80% of the community and photosynthetic subsystems comprised
over 40% of the sequences identified within the metagenome. The
dominance by Synechococcus correlated with the increase in nitrogen
and phosphate concentrations in the water and is similar to the large
scale distribution patterns of autotrophs in the ocean [64]. The
increase in photosynthesis on Palmyra and Tabuaeran may have
caused the increased concentration of DOC on these atolls
(Figure 7A). Similarly, the metagenomes showed that the number
of microbial autotrophs in the 0.45–100 micron fraction increased
from Kingman (50%) to Palmyra (84%) to Tabuaeran (89%)
(Figs. 3A and C). This trend correlated well with the increasing
concentration of fixed nitrogen compounds (nitrate, nitrite, and
ammonium) and phosphate in the water column (Figures. 7B and C)
and may be due to increased upwelling on the progressively larger
atolls. The concentrations of nitrate/nitrite and phosphate continue
to increase on Kiritimati, but the microbial community became
predominantly heterotrophic in nature (72%), suggesting an
available carbon source. This observation is consistent with the
hypothesis that nutrients from upwelling, and possibly runoff from
the island, combined with a loss of herbivory are stimulating benthic
macroalgae and phytoplankton. In turn, the algae produces
dissolved organic carbon (DOC) which supports more heterotrophic
bacterial growth. This is additionally supported by the observation
that both the algal cover and the highest numbers of microbes were
also observed on Kiritimati.
The apparent inconsistency with the hypothesis that high levels
of DOC released by algae are increasing heterotrophic bacterial is
that the lowest DOC concentrations were observed on Kiritimati.
Similar phenomena have been observed on other coral reefs in the
Caribbean and Sri Lanka (strong correlation between higher
Figure 5. Relationships recorded between microbes and virus-like particle numbers on the Northern Line Islands. Kingman(dotted line) r2 = 0.807, P,0.0001; Palmyra r2 = 0.039, P = 0.414;Tabuaeran (dashed line) r2 = 0.324, P = 0.006; Kiritimati (solid line)r2 = 0.706, P,0.0001.doi:10.1371/journal.pone.0001584.g005
Figure 6. Prevalence of unhealthy scleractinian corals comparedwith scleractinian coral cover. The prevalence of unhealthy corals wasnegatively related to host density on both Tabuaeran (r2 = 0.477,P = 0.002) and Kiritimati (r2 = 0.664, P = 0.003). No relationship was foundon Palmyra (r2 = 0.261, P = 0.141) or Kingman (r2 = 0.251, P = 0.300).doi:10.1371/journal.pone.0001584.g006
Microbes with Coral Reefs
PLoS ONE | www.plosone.org 11 February 2008 | Volume 3 | Issue 2 | e1584
microbial numbers and lower DOC; Pantos, Fairoz, Rohwer;
unpublished data). While this may seem counter-intuitive, the lower
DOC concentrations are the result of co-metabolism of refractory
carbon sources that occurs when microbes are given an excess labile
carbon. Carlson et al. [66] showed that increases in inorganic
nutrients alone were insufficient to enable bacterial communities to
utilize refractory DOC, but required an addition of a bio-available
source of DOC. Further, when the labile carbon was supplied, the
taxonomic composition of the microbial communities changed (the
study by Carlson et al, however, did not identify the microbes) [66],
similar to the differences in taxonomic composition that were
observed across the four coral atolls. Similarly, fresh carbon supplied
to soil microbes enabled the mineralization of old carbon [67].
Consistent with this explanation, addition of the same laboratory
microbial community to seawater samples from all four coral atolls
showed that the lower DOC-containing water from Kiritimati
supported more microbial respiration (Figure 7D).
Total nitrogen inputs associated with sewage were estimated to
be 227 and 397 kg N21 km21 yr21 for the inhabited coastline of
Tabuaeran and Kiritimati, respectively [18]. Given the large
volumes of water that moves passed these reefs, we expect that this
extra nitrogen from sewage will be diluted out. While these
nutrients may have influenced the microbial community to some
extent, they are a fraction of the inputs estimated on highly
populated reefs, such as Florida Bay [68]. Additionally, no
evidence of human sewage was apparent in the isotopic signature
of the particulate organic matter d15NNorm values from Kiritimati
(5.761.5) compared with Kingman values (4.260.78). Therefore,
human-derived sewage does not seem to be the reason for the
elevated nutrients on Tabuaeran or Kiritimati. Bird guano,
however, is a potential influence that was not controlled for in
this study and may explain some of the elevated nutrient
concentrations on Kiritimati, Tabuaeran, and Palmyra.
Increasing atoll size and oceanographically more oligotrophic
water were directly correlated with significant increases in protists,
microbes, and VLPs. However, the decreasing percentage of
heterotrophs from Kingman to Palmyra, followed by an abrupt
shift to a heterotroph dominated-community on Kiritimati, does
not directly match this pattern. The most straight-forward
explanation, as presented above, is that an increase macroalgae,
and possibly phytoplankton, is producing labile DOC that
supports the change in the microbial community on Kiritimati.
Disease incidence on coral reefs are associated with human
activities [69,70]. Changes in the chemical composition of
Figure 7. Water chemistry measured for the four Northern Line Island atolls. Concentrations of A) Dissolved organic carbon (DOC), B) Totaldissolved inorganic nitrogen (TDIN: nitrite and nitrate, and ammonium), and C) Dissolved inorganic phosphate are presented as means (6standarderrors). D) Microbial respiration rates as determined by adding the same microbial communities to samples of seawater collected from the four atolls.doi:10.1371/journal.pone.0001584.g007
Microbes with Coral Reefs
PLoS ONE | www.plosone.org 12 February 2008 | Volume 3 | Issue 2 | e1584
seawater may affect coral disease levels, either by favoring the
growth of pathogens and/or decreasing the resistance of the coral
animal to infection. Increases in inorganic nutrients are typical on
coral reefs influenced by human activities and have been
implicated in increasing severity of fungal infections of corals
[71]. However, recent experiments suggest that dissolved organic
carbon (DOC) may also be important. Experimental dosing of
coral fragments with increased inorganic nutrients did not increase
coral mortality, but the addition of DOC caused tissue necrosis
and mortality [72,73] and increased microbial growth. Another
common coral stressor, sedimentation, also causes coral tissue loss
and mortality in the presence of high organic material [74,75].
Treatment of organic laden sediments with antibiotic stopped the
coral mortality [76]. Smith et al. [77] showed that corals died when
placed adjacent to macroalgae, even when separated by a 0.02 mm
membrane that was impermeable to viruses and microbes, but not
dissolved compounds like DOC. The algae increased microbial
growth on the coral, which in turn caused hypoxia and presumably
the coral mortality. Coral mortality did not occur in this experiment
when antibiotics were added [77]. These results suggest that algal-
derived DOC may be a primary driver of coral-microbial
interactions. In addition, algae-associated microbial communities
harbor pathogens that cause coral disease [78].
Potential pathogens were proportionately more abundant in the
Kiritimati microbial metagenomic sample (36.3%; Figure 3A),
including many bacterial genera and species that are known
pathogens of eukaryotes (Figures. 3A 3C and S5) and human
pathogens like Staphylococcus, Vibrio, and Escherichia. The culturable
Vibrio spp. data support this observation (Figure 3B), as do the
metagenomic analyses of the viromes (Figures 4 and S5). While it
is not possible to absolutely prove (because of microbial genomic
plasticity) that these cultured and uncultured data represent
pathogens, the combined data is indicative of unhealthy waters.
The increase in potential pathogens could be caused by changes in
DOC, which stimulates heterotrophic microbial growth or by
increased input of pathogens from the humans and animals living
on Kiritimati. The human introduction of pathogens suggested for
Serratia spp. infection of acroporid corals in the Florida Keys [79],
but may be less likely on Kiritimati given the lack of sewage
signature.
Whatever the source, increases in potential pathogens may
contribute to the documented recent loss of corals and present
patterns of prevalence of disease. Doubling the concentration of
culturable Vibrio spp. or enteric-like microbes in the water column
caused 100% coral mortality under experimental conditions [72].
Therefore, the observed ten-fold increase in abundance of
microbes, in both the direct counts and by culturing, has the very
real potential of killing corals in Kiritimati.
The hypothesis that the Kiritimati microbial community is
detrimental to corals raises the important question: Is this type of
microbial community something that should be expected on coral
reefs? The sampling scheme used in this study did not find regions
of high heterotrophic activity on Kingman, Palmyra, or
Tabuaeran. The sampling was performed at defined distance
intervals, which resulted in a more complete survey of the smaller
islands. However, a possibility remains that we failed to find the
right area on the other atolls that had the higher microbial
communities. Regional differences are also a possible explanation
for the observed data. Kiritimati may have bleached in the
relatively recent pass (a good candidate is the 1998 warming event)
[18]. If this event killed the corals, then algae could have colonized
the area. In this case the microbial mechanisms discussed above
could help prevent recolonization by corals.
The hypothesis we favor, however, is that a change in the food
web structure explains the observed differences. On Kingman and
Palmyra, there was no significant relationship between disease
prevalence and host density, whereas disease prevalence was
negatively related to host density on Tabuaeran and Kiritimati
(Figure 6). Generally, a density dependent relationship exists
between the hosts and pathogens, with the prevalence of disease
increasing with host density [80]. The loss of the density
dependent nature of the host-pathogen relationship suggests
Figure 8. Seascape and photoquadrat photographs obtained from the metagenomic sampling site on Kiritimati. White circles indicatediseased, bleached, or recently dead corals.doi:10.1371/journal.pone.0001584.g008
Microbes with Coral Reefs
PLoS ONE | www.plosone.org 13 February 2008 | Volume 3 | Issue 2 | e1584
environmental factors are increasing opportunistic coral diseases.
The proposed mechanism is that overfishing removes both
predatory and herbivorous fish. Loss of the herbivorous fish
results in more algae and microbial growth, which leads to an
increased coral death via the microbial mechanisms described above.
Removal of the top predators (i.e., top down control) slows down the
rate at which energy turns over in the system. This extra energy, in
the form of DOC, supports more heterotrophic microbes.
Obviously, this is a complex feedback between fish, algae, microbes
and coral health that requires further investigation.
Future studies to differentiate between regional/hydrological and food web hypotheses
Table 1 outlines a number of observations and their
interpretation in the context of the two competing hypotheses.
The main differences revolve around the ultimate cause of coral
reef decline. Global and regional phenomena are the major factors
structuring coral reefs and their geotemporal rise and decline. The
current global decline in coral reefs, however, is almost certainly
human-driven. Coral bleaching, caused by rising sea surface
temperatures, can devastate coral reefs. Microbes are assuredly
important components of this stress, either as primary causes [81–
84] or as opportunistic pathogens that kill the weakened corals.
Bleaching and other perturbations that destroy the structure of the
reef appear to drive coral reefs into another stable state and yield
observations similar to what was observed on Kiritimati. Cores will
be able to determine if the areas outside of the lagoon have always
had low coral cover, or if this is a relatively recent event as
suggested by Figure 8. A complete survey of Kiritimati will be able
to determine if the rest of the atoll (which includes areas that are
not fished or adjacent to villages) has lost its coral cover and
subsequent fish populations. If the coral communities are still in
place, this would argue against a large scale bleaching event as the
triggering event. One caveat is that local hydrology could protect
one part of the island, while another area bleaches. Again, cores
should help differentiate between these possibilities. Surveys of
additional coral reefs would help establish whether there are
correlations between coral condition and changes in the microbial
communities. The most straight-forward study to test the
hypothesis that microbial numbers are driven by increased
Table 1. Summary of observations and possible interpretations of microbial and macro-organism data collected from theNorthern Line Island survey.
Change as observer moves fromKingman to Kiritimati
Interpretation for hydrology/regionalhypothesis
Interpretation for Human-driven food web shifthypothesis
Increased nutrients a) Upwelling a) Upwelling
b) Terrestrial runoff (guano, sewage, agriculture,vegetation)
b) Terrestrial runoff
c) Increase nitrogen fixation by cyanobacteria/turf algae*
Increased # of microbes and viruses More microbes come from the larger lagoons a) Overfishing of herbivores leads to more labile DOC
Why do the herbivores not graze down the newalgae?
b) Increased nutrients lead to more photosynthesis and DOCfor microbes
Change from autotrophic to heterotrophicmicrobial communities
??? More labile DOC to support heterotrophs from uncheckedmacroalgae growth
More culturable Vibrio spp. and pathogen-like heterotrophs
??? Shift in types of Vibrio spp. due to DOC lability
Prochlorococcus to Synechococcus &autotrophic protists
Increased nutrients due to upwelling Increased nutrients due to upwelling
Decreased coral cover a) There were never corals in surveyed regionsof Kiritimati
a) Overfishing increases labile DOC, increased coral-algalinteraction zones, & pathogen reservoirs
b) Coral bleaching killed corals b) Coral bleaching leads to increased disease incidences
Why do the Kiritimati corals look recently dead?
Increased algal cover and shift from corallineto fleshy/turf algae
Nutrients favor fleshy and turf algae a) Overfishing leads to decreased grazing
b) Nutrients favor fleshy and turf algae
Increased coral disease ??? More pathogen-like microbes = more disease
Non-linear change in coral cover/diseaseprevalence
??? Same as above
Lower coral recruitment Algae occupy substratum a) Pathogens kill off recruits
b) Algae occupy substratum
Losses of top predators in historical records Bleaching destroys structure and fish leave Overfishing
Inverted food pyramids for fish Same as above Same as above
Two hypotheses are considered: Hydrology/regional hypothesis-Larger islands are associated with more upwelling and algae. Different levels of bleaching on thevarious islands are the explanation of historical changes (i.e., loss of corals cause fish to leave). For example, the lagoons of Kiritimati and Tabuaeran may have served assources of hot water during a warming period in the region. Human-driven food web shift hypothesis-Overfishing increases macroalgae, which increases amountof labile dissolved organic carbon (DOC). In turn the DOC increases heterotrophic/pathogenic microbes, which kill corals. These two hypotheses are not mutuallyexclusive. For example, algal-microbial dominated system may represent an alternate stable state initiated by a bleaching event. Where multiple interpretations aregiven, they are ranked in order of possible importance. Some questions for consideration are highlighted in red.*Decreased grazing leads to higher concentrations of turf algae [18,94]. These turfs contain cyanobacteria that fix nitrogen.doi:10.1371/journal.pone.0001584.t001
Microbes with Coral Reefs
PLoS ONE | www.plosone.org 14 February 2008 | Volume 3 | Issue 2 | e1584
macroalgae growth and release of DOC, would be a caging
experiment where grazers are added back to a degraded reef to
determine if the microbial communities respond. While many caging
experiments have been conducted (normally excluding herbivores),
none have measured DOC and microbial numbers. Obviously
understanding coral reef decline is an active area of research, and the
survey presented here provides some insights into microbial
involvement in that process. It is important to establish the
mechanism driving changes in microbial growth and coral condition
because of their importance for management actions.
ConclusionsIn the last thirty years, coral reefs worldwide have suffered an
unprecedented loss of coral cover [85]. The positive correlation
between human-associated disturbance and coral reef decline is
now clear, but there is considerable debate about the precise
mechanisms of coral loss. Research to identify these mechanisms
has focused on the effects of overfishing, habitat destruction,
tourism, global warming, and increases in nutrients from terrestrial
run-off [86–88]. With the exception of direct destruction (cyanide,
blasting, construction), it is not clear why corals actually die.
Bleaching, while important does not always lead to coral mortality
[89], direct overgrowth by algae is insufficient to explain the
widespread loss of corals. An obvious common denominator in the
major scenarios of coral death is disease caused by microbes, either
as epidemics causes by specific microbes, such as white band
disease which devastated acroporid corals in the Caribbean [90] or
opportunistic pathogens as suggested on Kiritimati and Ta-
buaeran. Specific pathogens can also cause food web to shifts, such
as the phase shift triggered by the disease of the sea urchin Diadema
spp. in the Caribbean [91–93]. As in the overfishing food web shift
proposed above, opportunistic pathogens were probably the
ultimate cause of coral death after the sea urchin die-off.
Ecosystem-based management of coral reefs has traditionally
focused on animals and plants. Our findings highlight the need to
explicitly include microbial processes and their influence on coral
reef ecosystem function. Such a framework is also needed to
elucidate factors that sustain coral health.
Supporting Information
Figure S1 Underwater sampling equipment used to obtain the
150-liter water sample for the metagenomic analysis. The water
was taken from the surfaces and crevices of the reef structure.
Found at: doi:10.1371/journal.pone.0001584.s001 (1.01 MB TIF)
Figure S2 The taxonomic components of the large metage-
nomic fraction analyzed via sequence similarities to the A) whole
genome within the SEED platform, and B) Pfam database.
Found at: doi:10.1371/journal.pone.0001584.s002 (2.18 MB TIF)
Figure S3 The subsystems that showed differences between
Kingman and Kiritimati.
Found at: doi:10.1371/journal.pone.0001584.s003 (2.18 MB TIF)
Figure S4 Proportions of Prochlorococcus and Synechococcus
present in the large metagenomic fraction.
Found at: doi:10.1371/journal.pone.0001584.s004 (2.11 MB TIF)
Figure S5 The percentage of the predicted host range of phage
in the small metagenomic libraries.
Found at: doi:10.1371/journal.pone.0001584.s005 (2.18 MB
DOC)
Table S1 Total number of sequences retrieved in each
metagenomic library and the number that showed similarities to
those stored in the SEED platform.
Found at: doi:10.1371/journal.pone.0001584.s006 (0.03 MB
DOC)
Table S2 Nutrient and organic carbon concentrations measured
on coral reefs.
Found at: doi:10.1371/journal.pone.0001584.s007 (0.10 MB
DOC)
Acknowledgments
All metagenomic data is held at http://scums.sdsu.edu.au, an open access
website. Data are being released through SEED platform (http://
:www.theseed.org) and GenBank short read database. SEED accession
numbers: Kingman microbial-4440037.3, Palmyra microbial-4440039.3,
Tabuaeran microbial–4440279.3, Kiritimati microbial–4440041.3, King-
man viral-4440036.3, Palmyra viral-4440040.3, Tabuaeran viral-
4440280.3 and Kiritimati viral -4440038.3. Genbank accession numbers:
Kingman microbial-28343, Palmyra microbial-28363, Tabuaeran micro-
bial–28367, Kiritimati microbial–28347, Kingman viral-28345, Palmyra
viral-28365, Tabuaeran viral-28369 and Kiritimati viral-28349. Direct
access to data from these metagenomes is available at http://www.theseed.
org/DinsdaleSupplementalMaterial/.
Author Contributions
Conceived and designed the experiments: FR ED OP ES SS. Performed
the experiments: SS MH FR OP RE EB RV MH. Analyzed the data: ED
RE FA DH LK. Contributed reagents/materials/analysis tools: FR LW.
Wrote the paper: FR ED. Other: Expedition organizer: SS. Commented
on paper: NK. Contributed to design: FA. Supported field work for ED:
BW. Organized expedition: ES.
References
1. Paul JH, Deflaun MF, Jeffrey WH (1986) Elevated levels of microbial activity in
the coral surface microlayer. MEPS 33: 29–40.
2. Ayukai T (1995) Retention of phytoplankton and planktonic microbes on coral
reefs within the Great Barrier Reef, Australia. Coral Reefs 14: 141–147.
3. Bak RPM, Joenje M, de Jong I, Lambrechts DYM, Nieuwand G (1998)
Bacterial suspension feeding by coral benthic organisms. MEPS 175: 285–288.
4. Sorokin YI (1972) Bacteria as Food for Coral Reef Fauna. Oceanology-USSR
12: 169–177.
5. Sorokin YI (1973) Trophical Role of Bacteria in Ecosystem of Coral Reef.
Nature 242: 415–417.
6. van Duyl FC, Scheffers SR, Thomas FIM, Driscoll M (2006) The effect of water
exchange on bacterioplankton depletion and inorganic nutrient dynamics incoral reef cavities. Coral Reefs 25: 23–36.
7. Beja O, Aravind L, Koonin EV, Suzuki MT, Hadd A, et al. (2000) Bacterialrhodopsin: evidence for a new type of phototrophy in the sea. Science 289:
1902–1906.
8. Rohwer F, Seguritan V, Azam F, Knowlton N (2002) Diversity and distribution
of coral associated bacteria. MEPS 243: 1–10.
9. Wegley L, Yu Y, Breitbart M, Casas V, Kline DL, et al. (2004) Coral-associated
Archaea. MEPS 273: 89–96.
10. Bourne DG, Munn CB (2005) Diversity of bacteria associated with the coralPocillopora damicornis from the Great Barrier Reef. Environ Microbiol 7:
1162–1174.
11. Webster NS (2007) Sponge disease: a global threat? Environ Microbiol 9:1363–1375.
12. Webster NS, Negri AP, Webb RI, Hill RT (2002) A spongin-boring alpha-
proteobacterium is the etiological agent of disease in the Great Barrier Reef
sponge Rhopaloeides odorabile. MEPS 232: 305–309.
13. Pantos O, Bythell JC (2006) Bacterial community structure associated with whiteband disease in the elkhorn coral Acropora palmata determined using culture-
independent 16S rRNA techniques. Dis Aquatic Organisms 69: 79–88.
14. Harvell D, Group CDW (2007) Coral disease, environmental drivers and thebalance between coral and microbial associates. Oceanogr 20: 172–195.
15. Edwards RA, Dinsdale EA (2007) Marine environmental genomics: unlocking
the oceans secrets. Oceanogr 20: 26–61.
16. Wegley L, Breitbart M, Edwards RA, Rohwer F (2007) Metagenomic analysis ofthe microbial community associated with the coral Porites astreoides. Environ
Microbiol 9: 2707–2727.
17. Ward JR, Lafferty KD (2004) The elusive baseline of marine disease: Are
diseases in ocean ecosystems increasing? PLoS Biology 2: 542–547.
Microbes with Coral Reefs
PLoS ONE | www.plosone.org 15 February 2008 | Volume 3 | Issue 2 | e1584
18. Sandin SA, Smith JE, DeMartini EE, Dinsdale EA, Donner SD, et al. (2008)Coral reef communities in the Northern Line Islands. Plos One In Press.
19. Taylor RC (1973) An atlas of Pacific islands rainfall. In: Publication DoM, ed.Honolulu University Press.
20. Saenger C, Miller M, Smittenberg RH, Sachs JP (2006) A physiochemical surveyof inland lakes and saline ponds: Christmas Island (Kiritimati and Washington
(Teraina) Islands, Republic of Kiribati. Saline Sys 2.
21. Trichet J, Defarge C, Tribble J, Tribble G, Sansone F (2001) Christmas Island
lagoonal lakes, models for the deposition of carbonate-evaporite-organiclaminated sediments. Sed Geol 140: 177–189.
22. Sherr EB, Caron DA, SB F (1993) Staining of heterotrophic protists forvisualization via epifluorescence microscopy. In: Kemp P, Sherr B, Sherr E,
Cole J, eds. Current Methods in Aquatic Microbial Ecology. New York: LewisPublishing. pp 213–228.
23. Gunn MR, Hartnup K, Boutin S, Slate J, Coltman DW (2007) A test of theefficacy of whole-genome amplification on DNA obtained from low-yield
samples. Mol Ecol Notes 7: 393–399.
24. Kumar G, Rech R, Kapolka K, Lavrenov K, Garnova E, et al. (2007) Genomic
DNA preparation using illustra GenomiPhi V2 and HY DNA Amplification kits.Nature Methods. pp An30–An32.
25. Pinard R, de Winter A, Sarkis GJ, Gerstein MB, Tartaro KR, et al. (2006)Assessment of whole genome amplification-induced bias through high-
throughput, massively parallel whole genome sequencing. BMC Genomics 7:
216.
26. Sato M, Ohtsuka M, Ohmi Y (2005) Usefulness of repeated GenomiPhi, a phi29
DNA polymerase-based rolling circle amplification kit, for generation of largeamounts of plasmid DNA. Biomol Eng 22: 129–132.
27. Dhulipala PDK, Li WZ, Jones K, Brito A, Deadman R, et al. (2003) GenomiPhi
amplification of human genomic DNA: Utility of amplified DNA in genetic
variation experiments. Faseb Journal 17: A587–A587.
28. Cai YYC, Sriraman P, Kavita U, Ortiz-rivera M, Reddy P, et al. (2003)
GenomiPhi amplification of human genomic DNA: Characterization ofamplified material. Faseb Journal 17: A987–A987.
29. Angly F, Felts B, Breibart M, Salamon P, Edwards RA, et al. (2006) The marineviromes of four oceanic regions. Plos Biology 4: e368.
30. Breitbart M, Salamon P, Andresen B, Mahaffy JM, Segall AM, et al. (2002)
Genomic analysis of uncultured marine viral communities. PNAS 22:
14250–14255.
31. Tringe SG, von Mering C, Kobayashi A, Salamov AA, Chen K, et al. (2005)
Comparative metagenomics of microbial communities. Science 308: 544–557.
32. Cole JR, Chai B, Farris RJ, Wang Q, Kulam SA, et al. (2005) The Ribosomal
Database Project (RDP-II): sequences and tools for high-throughput rRNAanalysis. Nucleic Acids Res 33: D294–D296.
33. Leplae R, Hebrant A, Wodak SJ, Toussaint A (2004) ACLAME: a
CLAssification of Mobile genetic Elements. Nucleic Acids Res 32: D45–49.
34. Rohwer F, Edwards R (2002) The Phage Proteomic Tree: a genome-based
taxonomy for phage. J Bacteriology 184: 4529–4535.
35. Wuyts J, Perriere G, de Peer YV (2004) The European ribosomal RNA
database. Nucleic Acids Res 32: D101–D103.
36. Overbeek R, Begley T, Butler RM, Choudhuri JV, Chuang HY, et al. (2005)
The subsystems approach to genome annotation and its use in the project to
annotate 1000 genomes. Nucleic Acids Res 33: 5691–5702.
37. Rodriguez-Brito B, Rohwer F, Edwards R (2006) An application of statistics tocomparative metagenomics. BMC Bioinformatics 7: 162.
38. Altschul SF, Gish W, Miller W, Myers EW, Lipman DJ (1990) Basic localalignment search tool. J Mol Biol 215: 403–410.
39. Edwards RA, Rodriguez-Brito B, Wegley L, Haynes M, Breitbart M, et al.(2006) Using pyrosequencing to shed light on deep mine microbial ecology.
BMC Genomics 7: 57.
40. Huson DH, Auch AF, Qi J, Schuster SC (2007) MEGAN analysis of
metagenomic data. Genome Res 17: 377–386.
41. Holt JG, Krieg NR, Sneath PHA, Staley JT (1994) Bergey’s manual of
determinative bacteriology. Baltimore: The Williams and Wilkins Co. 666 p.
42. Edwards RA, Rohwer F (2005) Viral Metagenomics. Nature Rev Microbiol 3:
504–510.
43. Bateman A, Birney E, Durbin R, Eddy SR, Finn RD, et al. (1999) Pfam 3.1:
1313 multiple alignments and profile HMMs match the majority of proteins.Nucleic Acids Res 27: 260–262.
44. Shaw DR, Ashbumer M, Blake JA, Baldarelli RM, Botstein D, et al. (1999) GeneOntology: a controlled vocabulary to describe the function, biological process
and cellular location of gene products in genome databases. Am J HumanGenetics 65: A419–A419.
45. UNESCO (1994) Protocols for the Joint Global Ocean Flux study (JGOFS) CoreMeasurements. IOC report Manuals and Guidelines 29. 170 p.
46. Fasham MJR, Balino BM, Bowles MC, Anderson R, Archer D, et al. (2001) Anew vision of ocean biogeochemistry after a decade of the Joint Global Ocean
Flux Study (JGOFS). Ambio. pp 4–31.
47. Willis BL, Page C, Dinsdale EA (2004) Coral disease on the Great Barrier Reef.
In: Rosenberg E, Loya Y, eds. Coral health and disease. Berlin: Springer. pp69–104.
48. Aeby GS (2005) Outbreak of coral disease in the Northern Hawaiian Islands.Coral Reefs 24: 481–481.
49. Ravindran J, Raghukumar C (2002) Pink line syndrome (PLS) in thescleractinian coral Porites lutea. Coral Reefs 21: 252–253.
50. Preskitt LB, Vroom PS, Smith CM (2004) A rapid ecological assessment (REA)quantitative survey method for benthic algae using photo quadrats with SCUBA.
Pac Sci 58: 201–209.
51. Scanlan DJ, West NJ (2002) Molecular ecology of the marine cyanobacterial
genera Prochlorococcus and Synechococcus. FEMS Microbiol Ecol 40: 1–12.
52. Zubkov MV, Fuchs BM, Terran GA, Burkill PH, Amann R (2003) High rate of
uptake of organic nitrogen compounds by Prochlorococcus cyanobacteria as a key
to their dominance in oligotrophic oceanic waters. App Environ Microbiol 69:1299–1304.
53. Perna NT, Mayhew GF, Posfai G, Elliott S, Donnenberg MS, et al. (1998)
Molecular evolution of a pathogenicity island from enterohemorrhagic Escherichia
coli O157: H7. Infection Immun 66: 3810–3817.
54. Moriarty DJW (1970) Biomass of suspended bacteria over coral reefs. Mar Biol
53: 193–200.
55. Moriarty DJW, Pollard PC, Hunt WG (1985) Temporal and spatial variation inbacterial production in the water column over a coral reef. Mar Biol 85:
285–292.
56. Seymour JR, Patten NL, Bourne DG, Mitchell JG (2005) Spatial dynamics ofvirus-like particles and heterotrophic Bacteria within a shallow coral reef system.
MEPS 288: 1–8.
57. Cook J (1784) A voyage to the Pacific Ocean undertaken by the command of HisMajesty for making discoveries in the northern hemisphere. To determine the
position and extent of the west side of North America; its distance from Asia; and
the practicability of a northern passage to Europe. Preformed under thedirection of Captains Cook, Clerke, and Gore, in His Majesty’s ships the
Resolution and Discovery. London: Order of the Lords Commissioners of theAdmiralty.
58. Fanning E (1833) Voyages around the world; with selected sketches of voyages to
the South Seas, north and south Pacific oceans, China, etc., performed under thecommand and agency of the author. Also, information relating to the important
late discoveries; between the years 1792-1832, together with the report of the
commander of the first American exploring expedition, patronised by the UnitedStates government in the Brigs Seraph and Annawan, to the southern
hemisphere. New York: Collins & Hannay.
59. Tresilian FH (1838) Remarks on Christmas Island read before the SandwichIsland Institute. The Hawaiian Spectator 1: 241–247.
60. Farrell A (1928) John Cameron’s Odyssey. New York: The Macmillan
Company.
61. Brainard R, Maragos J, Schroeder R, Kenyon J, Vroom P (2005) The state ofcoral reef ecosystems of the Pacific Remote Island Areas. The state of coral reef
ecosystems of the United States and Pacific Freely Associated States: 2005.Honolulu: NOAA Technical Memorandum NOS NCCOS. pp 338–372.
62. Friedlander A (1997) Ecological surveys of the coral and reef environments at
Kiritimati atoll for the proposed space shuttle and hotel projects. Honolulu: ReefFishes. 35 p.
63. Maragos JE (1997) Ecological surveys of the coral and reef environments at
Kiritimati atoll for the proposed space shuttle and hotel projects. Honolulu.30 p.
64. Bouman HA, Ulloa O, Scanlan DJ, Zwirglmier K, Li WKW, et al. (2006)
Oceanographic basis of the global surface distribution of Prochlorococcus ecotypes.Science 312: 918–921.
65. Rocap G, Larimer FW, Lamerdin J, Malfatti S, Chain P, et al. (2003) Genome
divergence in two Prochlorococcus ecotypes reflects oceanic niche differentiation.
Nature 424: 1042–1047.
66. Carlson CA, Giovannoni SJ, Hansell DA, Goldberg SJ, Parsons R, et al. (2002)
Effect of nutrient amendments on bacterioplankton production, community
structure, and DOC utilization in the northwestern Sargasso Sea. Aqu MicrobialEcol 30: 19–36.
67. Fontaine S, Barot S, Barre P, Bdioui N, Mary B, et al. (2007) Stability of organic
carbon in deep soil layers controlled by fresh carbon supply. Nature 450:277–280.
68. Corbett DR, Chanton J, Burnett W, Dillon K, Rutkowski C, et al. (1999)
Patterns of groundwater discharge into Florida Bay. Limnol Oceanogr 44:1045–1055.
69. Green EP, Bruckner AW (2000) The significance of coral disease epizootiology
for coral reef conservation. Biol Conser 96: 347–361.
70. Harvell CD, Kim K, Burkholder JM, Colwell RR, Epstein PR, et al. (1999)Review: Marine ecology - Emerging marine diseases - Climate links and
anthropogenic factors. Science 285: 1505–1510.
71. Voss JD, Richardson LL (2006) Nutrient enrichment enhances black banddisease progression in corals. Coral Reefs 25: 569–576.
72. Kline DL, Kuntz NM, Breitbart M, Knowlton N, Rohwer F (2006) Role of
elevated organic carbon levels and microbial activity in coral mortality. MEPS314: 119–125.
73. Kuntz NM, Kline DL, Sandin SA, Rohwer F (2005) Pathologies and mortality
rates caused by organic carbon and nutrient stressors in three Caribbean coralspecies. MEPS 294: 173–180.
74. Fabricius K, Wild C, Wolanski E, Abele D (2003) Effects of transparent
exopolymer particles (TEP) and muddy terrigenous sediments on the survival of
hard coral recruits. Coastal Shelf Sci 57: 613–621.
75. Fabricius KE (2005) Effects of terrestrial runoff on the ecology of corals and
coral reefs: review and synthesis. Mar Pollution Bull 50: 125–146.
76. Hodgson G (1990) Tetracycline reduces sedimentation damage to corals. Mar
Biol 104: 493–496.
Microbes with Coral Reefs
PLoS ONE | www.plosone.org 16 February 2008 | Volume 3 | Issue 2 | e1584
77. Smith JE, Shaw M, Edwards RA, Obura DO, Pantos O, et al. (2006) Indirect
effects of algae on coral: Algae-mediated, microbe-induced coral mortality. EcolLetters 9: 835–845.
78. Nugues MM, Smith GW, Hooidonk RJ, Seabra MI, Bak RPM (2004) Algal
contact as a trigger for coral disease. Ecol Letters 7: 919–923.79. Patterson KL, Porter JW, Ritchie KE, Polson SW, Mueller E, et al. (2002) The
etiology of white pox, a lethal disease of the Caribbean elkhorn coral, Acropora
palmata. PNAS 99: 8725–8730.
80. Anderson RM, May RM (1981) The population dynamics of microparasites and
their invertebrate hosts. Phil Trans Royal Soc London Ser B 291: 451–524.81. Ben-Haim Y, Rosenberg E (2002) A novel Vibrio sp pathogen of the coral
Pocillopora damicornis. Mar Biol 141: 47–55.82. Rosenberg E, Ben-Haim Y (2002) Microbial diseases of corals and global
warming. Environ Microbiol 4: 318–326.83. Rosenberg E, Falkovitz L (2004) The Vibrio shiloi/Oculina patagonica model system
of coral bleaching. Ann Rev Microbiol 58: 143–159.
84. Thompson FL, Thompson CC, Naser S, Hoste B, Vandemeulebroecke K, et al.(2005) Photobacterium rosenbergii sp nov and Enterovibrio coralii sp nov., vibrios
associated with coral bleaching. Int J Sys Evol Microbiol 55: 913–917.85. Wilkinson C (2004) Status of coral reefs of the World: 2004. Townsville: Global
Coral Reef Monitoring Network and Australian Institute of Marine Science.
558 p.
86. Aronson RB, Precht WF (2006) Conservation, precaution and Caribbean reefs.
Coral Reefs 25: 441–450.
87. Jackson JBC, Kirby MX, Berger WH, Bjorndal KA, Botsford LW, et al. (2001)
Historical overfishing and the recent collapse of coastal ecosystems. Science 293:
629–638.
88. Pandolfi JM, Bradbury RH, Sala E, Hughes TP, Bjorndal KA, et al. (2003)
Global trajectories of the long-term decline of coral reef ecosystem. Science 301:
955–959.
89. Baker AC (2003) Flexibility and specificity in coral-algal symbiosis: Diversity,
ecology, and biogeography of Symbiodinium. Ann Rev Ecol Evol Sys 34: 661–689.
90. Aronson RB, Precht WF (2001) White-band disease and the changing face of
Caribbean reefs. Hydrobiologia 460: 25–38.
91. Hughes TP (1994) Catastrophes, phase shift, and large-scale degradation of a
Caribbean reef. Science 265: 1547–1551.
92. Lessios HA (2005) Diadema antillarum populations in Panama twenty years
following mass mortality. Coral Reefs 24: 125–127.
93. Lessios HA (1988) Mass mortality of Diadema antillarum in the Caribbean: what
have we learned? Ann Rev Ecol Syst 19: 371–393.
94. Thacker RW, Ginsburg DW, Paul VJ (2001) Effects of herbivore exclusion and
nutrient enrichment on coral reef macroalgae and cyanobacteria. Coral Reefs
19: 318–329.
Microbes with Coral Reefs
PLoS ONE | www.plosone.org 17 February 2008 | Volume 3 | Issue 2 | e1584

![Coral Microbial Ecology - USGSMicrobial Ecology of Deep-Sea Corals [Christina Kellogg] Most people are familiar with tropical coral reefs, located in warm, shallow waters. However,](https://img.pdfslide.net/doc/110x75/60710c32309eab6c47176885/coral-microbial-ecology-usgs-microbial-ecology-of-deep-sea-corals-christina-kellogg.jpg)