Embed Size (px)
Citation preview

MICROBIAL NITROGEN CYCLING DYNAMICS IN COASTAL SYSTEMS
A DISSERTATION SUBMITTED TO THE DEPARTMENT OF
ENVIRONMENTAL EARTH SYSTEM SCIENCE AND THE COMMITTEE ON
GRADUATE STUDIES OF STANFORD UNIVERSITY IN PARTIAL
FULFILLMENT OF THE REQUIREMENTS FOR THE DEGREE OF DOCTOR OF
PHILOSOPHY
Annika Carlene Mosier
May 2011

http://creativecommons.org/licenses/by-nc/3.0/us/
This dissertation is online at: http://purl.stanford.edu/wt558td2044
© 2011 by Annika Carlene Mosier. All Rights Reserved.
Re-distributed by Stanford University under license with the author.
This work is licensed under a Creative Commons Attribution-Noncommercial 3.0 United States License.
ii

I certify that I have read this dissertation and that, in my opinion, it is fully adequatein scope and quality as a dissertation for the degree of Doctor of Philosophy.
Christopher Francis, Primary Adviser
I certify that I have read this dissertation and that, in my opinion, it is fully adequatein scope and quality as a dissertation for the degree of Doctor of Philosophy.
Kevin Arrigo
I certify that I have read this dissertation and that, in my opinion, it is fully adequatein scope and quality as a dissertation for the degree of Doctor of Philosophy.
Alexandria Boehm
I certify that I have read this dissertation and that, in my opinion, it is fully adequatein scope and quality as a dissertation for the degree of Doctor of Philosophy.
Craig Criddle
I certify that I have read this dissertation and that, in my opinion, it is fully adequatein scope and quality as a dissertation for the degree of Doctor of Philosophy.
Scott Fendorf
Approved for the Stanford University Committee on Graduate Studies.
Patricia J. Gumport, Vice Provost Graduate Education
This signature page was generated electronically upon submission of this dissertation in electronic format. An original signed hard copy of the signature page is on file inUniversity Archives.
iii

iv
Abstract
Human influence on the global nitrogen cycle (e.g., through fertilizer and
wastewater runoff) has caused a suite of environmental problems including
acidification, loss of biodiversity, increased concentrations of greenhouse gases, and
eutrophication. These environmental risks can be lessened by microbial
transformations of nitrogen; nitrification converts ammonia to nitrite and nitrate,
which can then be lost to the atmosphere as N2 gas via denitrification or anammox.
Microbial processes thus determine the fate of excess nitrogen and yet recent
discoveries suggest that our understanding of these organisms is deficient. This
dissertation focuses on microbial transformations of nitrogen in marine and estuarine
systems through laboratory and field studies, using cutting-edge techniques from
molecular biology, genomics, microbial ecology, and microbiology.
Recent studies revealed that many archaea can oxidize ammonia (AOA;
ammonia-oxidizing archaea), in addition to the well-described ammonia-oxidizing
bacteria (AOB). Considering that these archaea are among the most abundant
organisms on Earth, these findings have necessitated a reevaluation of nitrification to
determine the relative contribution of AOA and AOB to overall rates and to determine
if previous models of global nitrogen cycling require adjustment to include the AOA.
I examined the distribution, diversity, and abundance of AOA and AOB in the San
Francisco Bay estuary and found that the region of the estuary with low-salinity and
high C:N ratios contained a group of AOA that were both abundant and
phylogenetically distinct. In most of the estuary where salinity was high and C:N
ratios were low, AOB were more abundant than AOA—despite the fact that AOA
v
outnumber AOB in soils and the ocean, the two end members of an estuary. This
study suggested that a combination of environmental factors including carbon,
nitrogen, and salinity determine the niche distribution of the two groups of ammonia-
oxidizers.
In order to gain insight into the genetic basis for ammonia oxidation by
estuarine AOA, we sought to sequence the genome of AOA grown in an enrichment
culture (84% pure) from San Francisco Bay; however, standard genome sequencing
methods require large amounts of DNA from pure cultures. These genomic methods
are severely limited because they can only be applied to the ~1% of microbes in nature
that can be isolated in the lab. We overcame this deficiency using novel technology
developed by Dr. Stephen Quake (Stanford University) that relies on microfluidics and
laser tweezing to sequence the genome of a single microbial cell, thereby creating the
potential for genomic sequencing of the ~99% of microbes found in nature that cannot
be isolated. We demonstrated the feasibility of the method by sequencing the genome
of single AOA cells, which proved to represent a new genus within the Archaea. The
genome data revealed that the AOA have genes for both autotrophic and heterotrophic
carbon metabolism, unlike the autotrophic AOB. These AOA may be chemotactic and
motile based on numerous chemotaxis and motility-associated genes in the genome
and electron microscopy evidence of flagella. Physiological studies showed that the
AOA grow aerobically but they also oxidize ammonia at low oxygen concentrations
and may produce the potent greenhouse gas N2O. Continued cultivation and genomic
sequencing of AOA will allow for in-depth studies on the physiological and metabolic

vi
potential of this novel group of organisms that will ultimately advance our
understanding of the global carbon and nitrogen cycles.
Denitrifying bacteria are widespread in coastal and estuarine environments and
account for a significant reduction of external nitrogen inputs, thereby diminishing the
amount of bioavailable nitrogen and curtailing the harmful effects of nitrogen
pollution. I determined the abundance, community structure, biogeochemical activity,
and ecology of denitrifiers over space and time in the San Francisco Bay estuary.
Salinity, carbon, nitrogen and some metals were important factors for denitrification
rates, abundance, and community structure. Overall, this study provided valuable new
insights into the microbial ecology of estuarine denitrifying communities and
suggested that denitrifiers likely play an important role in nitrogen removal in San
Francisco Bay, particularly at high salinity sites.

vii
Acknowledgments
My advisor, Chris Francis, has been the single most influential figure in the
development and execution of my dissertation. He has provided continual guidance
and encouragement, as well as the freedom to pursue my own research interests and
financial support to participate in national and international conferences—an
invaluable learning opportunity.
I am extremely grateful to my dissertation committee members: Scott Fendorf,
Alexandria Boehm, Kevin Arrigo, and Craig Criddle. I thank each of them for their
time, constructive feedback on my research, and interest in my intellectual
development and future success in academia. I also extend my appreciation to my
mentors Mary Beth Mudgett and Karla Kirkegaard who have both provided valuable
conversations about research and academic life.
This research would not have been possible without Paul Salop, Sarah Lowe,
Applied Marine Sciences, the San Francisco Estuary Institute, and the crew of the
R.V. Endeavor. I thank them for allowing us to participate in the San Francisco Bay
RMP sediment cruises, providing access to the RMP data, and assisting in sample
collection.
I thank all of my past and present labmates for their support, friendship, and
assistance in the lab and field. In particular, I look to Alyson, George, Jason, and
Kevan as colleagues and I am enriched from the countless scientific discussions we
have shared over the years.
Lastly, I thank all of my family. I thank my mom who taught me the value of
education at a young age and has provided unwavering support of my academic

viii
pursuits ever since. Above all, to Jeremy, I could never thank you enough for all the
ways that you made this process better, easier, happier. From your refreshing outside
perspective to your exceptional editorial skills, you have been there every step of the
way and I am so grateful to have you in my life.
The work presented in this dissertation was funded by the Diversifying
Academia, Recruiting Excellence Doctoral Fellowship (Stanford University), the
Environmental Protection Agency STAR Graduate Fellowship, and National Science
Foundation grants to Chris Francis.
ix
Table of Contents Abstract ........................................................................................................................ iv Acknowledgments.......................................................................................................vii List of Tables................................................................................................................xi List of Figures .............................................................................................................xii Chapter 1. Introduction ..............................................................................................1
Importance of Nitrogen Cycling in Estuaries .............................................................2 Microbial Biogeochemistry of Ammonia Oxidation..................................................4 Microbial Biogeochemistry of Denitrification ...........................................................7 Dissertation Organization and Chapter Descriptions .................................................8 Figures ......................................................................................................................10 Literature Cited.........................................................................................................11
Chapter 2. Determining the distribution of marine and coastal ammonia-oxidizing archaea and bacteria using a quantitative approach..............................23
Abstract.....................................................................................................................24 Introduction ..............................................................................................................25 Methods for Measuring the Abundance of AOA and AOB within Marine and Coastal Systems........................................................................................................29 Methodological Considerations................................................................................36 Targeting Specific Ecotypes: Quantifying Shallow and Deep Clades of Marine Water Column AOA.................................................................................................38 Acknowledgments ....................................................................................................41 Tables .......................................................................................................................42 Figures ......................................................................................................................43 Literature Cited.........................................................................................................44
Chapter 3. Relative abundance and diversity of ammonia-oxidizing archaea and bacteria in the San Francisco Bay estuary ...............................................................56
Abstract.....................................................................................................................57 Introduction ..............................................................................................................58 Results and Discussion .............................................................................................60 Experimental Procedures..........................................................................................73 Acknowledgements ..................................................................................................80 Tables .......................................................................................................................81 Figures ......................................................................................................................83 Supporting Information ............................................................................................88 Literature Cited.........................................................................................................89
Chapter 4. Genome of a Low-Salinity Ammonia-Oxidizing Archaeon Determined by Single-Cell and Metagenomic Analysis ........................................104
Abstract...................................................................................................................105 Introduction ............................................................................................................107

x
Results and Discussion ...........................................................................................108 Materials and Methods ...........................................................................................125 Acknowledgments ..................................................................................................131 Tables .....................................................................................................................132 Figures ....................................................................................................................135 Supporting Information ..........................................................................................140 Literature Cited.......................................................................................................142
Chapter 5. Physiology of a novel low-salinity type AOA reveals niche adaptation....................................................................................................................................154
Abstract...................................................................................................................155 Introduction ............................................................................................................156 Results and Discussion ...........................................................................................157 Materials and Methods ...........................................................................................167 Acknowledgments ..................................................................................................169 Figures ....................................................................................................................170 Supporting Information ..........................................................................................175 Literature Cited.......................................................................................................176
Chapter 6. Abundance and Potential Rates of Denitrifiers Across the San Francisco Bay Estuary .............................................................................................184
Abstract...................................................................................................................185 Introduction ............................................................................................................186 Results and Discussion ...........................................................................................188 Experimental Procedures........................................................................................198 Acknowledgments ..................................................................................................201 Tables .....................................................................................................................203 Figures ....................................................................................................................204 Supporting Information ..........................................................................................208 Literature Cited.......................................................................................................210

xi
List of Tables Chapter 2 Table 1. Primers and probes for archaeal amoA asssays specific to water column group A and group B marine sequences……………………………………………...42 Chapter 3 Table 1. Physical and chemical properties of San Francisco Bay bottom water and sediments……………………………………………………………………………...81 Table 2. Abundance-based Sørensen-type (Labd) similarities among archaeal and bacterial amoA clone libraries………………………………………………………...82 Chapter 4 Table 1. N. limnia assembly statistics for the consensus genome (metagenome and five single cells), single cell coassembly (five single cells), and three individual cell assemblies…………………………………………………………………………...132 Table 2. Genome features for N. limnia, N. maritimus, and C. symbiosum A…...…132 Table 3. Whole genome nucleotide identity comparisons between N. limnia, N. maritimus, and C. symbiosum A……………………………………………………..133 Table 4. N. limnia genes putatively associated with motility………………………133 Table 5. Nucleotide (NT) and amino acid (AA) identities for key individual genes in N. limnia, N. maritimus, and C. symbiosum A………………………………………134 Chapter 6 Table 1. Abundance-based Sørensen-type (Labd) similarities among nirK (below diagonal) and nirS (above diagonal) clone libraries………………………………...203

xii
List of Figures Chapter 1 Figure 1. Microbial nitrogen cycling in the marine environment (figure from Francis et al., 2007)……………………………………………………………………………10 Chapter 2 Figure 1. Abundance of the shallow and deep archaeal amoA clades within seawater collected at a depth of 891 meters in Monterey Bay, CA……...……………………..43 Chapter 3 Figure 1. Location of sampling sites within San Francisco Bay…...…………….…..83 Figure 2. Log ratio of AOA:β-AOB amoA copy numbers in San Francisco Bay sediments as determined by quantitative PCR………………………………...……...84 Figure 3. Neighbor-joining phylogenetic tree showing the affiliation of archaeal amoA sequences (579 base-pair fragment) from San Francisco Bay and GenBank sequences from other environments. A more detailed phylogeny of the low-salinity group is shown to the left………………………………………………………………………85 Figure 4. Neighbor-joining phylogenetic tree showing the affiliation of bacterial amoA sequences (444 base-pair fragment) from San Francisco Bay and GenBank sequences from other environments………………………...……………………………………86 Figure 5. Canonical correspondence analysis (CCA) of archaeal (left panel) and bacterial (right panel) amoA clone libraries and environmental variables from bottom water and sediments………..…………………………………………………………87 Chapter 4 Figure 1. Phylogeny of ammonia-oxidizing archaea gene sequences. Neighbor-joining phylogenetic tree of (A) archaeal amoA gene sequences and (B) archaeal 16S rRNA gene sequences……………………………………………………………….135 Figure 2. Assembly of the N. limnia datasets. Rarefaction analysis of the N. limnia sequence data showing assembly of the enrichment, single cell, and combined datasets……...……………………………………………………………………….136 Figure 3. Circular representation of the N. limnia genome. From the outer ring to the inner ring: Scaffold breakpoints are indicated by the inside tick marks, predicted genes on the forward strand, predicted genes the reverse strand, G+C content, GC skew, and GGGT skew………………...……………………………………………………….137 Figure 4. Comparison of three AOA genomes. (A) The top panel shows nucleotide identity of blast hits between the reference genomes and the N. limnia genome. Hits
xiii
for N. maritimus and C. symbiosum A are colored according to the position in the reference (query) genome. The arrow direction indicates the hit direction. On the right, box plots summarize the distribution of hits from each reference genome to the N. limnia genome. (B) The positions of the two largest consensus scaffolds are shown. (C) The sequence novelty index, defined as 2 minus the sum of nucleotide identity of blast hits to N. maritimus and C. symbiosum A at each position is plotted. A histogram of the values is present at right. (D) The alignment depth in the final assembly is shown. A histogram of the values is present at right…………………………………….……………………………………….138-139 Chapter 5 Figure 1. BlastP analysis of N. limnia proteins against all metagenomic ORF peptides (in CAMERA database). Sequence hits are color coded by habitats from which the samples were collected……………………………………………………………....170 Figure 2. Ammonia oxidation by N. limnia under different growth conditions….…171
Figure 3. Gas production from N. limnia enrichment cultures grown under different conditions…...……………………...……………………………………………..…172 Figure 4. Motility gene cassette on the N. limnia genome…………..……………..173 Figure 5. Transmission electron micrograph of a typical flagellated cell from the N. limnia enrichment……………………………………………………………….…..174 Chapter 6 Figure 1. Location of sampling sites within San Francisco Bay……………………204 Figure 2. Dissolved inorganic nitrogen concentrations in San Francisco Bay bottom water from 2004 to 2008……………...……………………………………………..205 Figure 3. Quantitative PCR measurements for nirK (left panel) and nirS (right panel) gene copy numbers expressed per gram of sediment (wet weight)………...……….206 Figure 4. Denitrification potential rate measurements from San Francisco Bay sediments in 2007 (left panel) and 2008 (right panel)..……………………………..207

1
Chapter 1. Introduction Annika C. Mosier1
1Department of Environmental Earth System Science, Stanford University, Stanford, CA 94305-4216, USA
2
Importance of Nitrogen Cycling in Estuaries
Estuaries and the vital ecological processes at work within them serve as a
filter of the world’s watersheds, attenuating the impact of pollutants on their local
environments. Center stage as one of the preeminent issues threatening estuarine
systems is nutrient pollution. One of the offending nutrients, dissolved inorganic
nitrogen (DIN; ammonium, nitrate, and nitrite), has been associated with numerous
toxicological and environmental problems. Excess DIN can accelerate eutrophication,
which often leads to hypoxia, the reduction of biodiversity, and new species invasions
(e.g., Ryther and Dunstan, 1971; Fisher et al., 1992; Rabalais and Nixon, 2002). Over
half of the estuaries in the United States experience the effects of eutrophication at
some time each year. Despite the enormous environmental impact of DIN pollution,
relatively little is known about the microbial communities that play critical roles in
transferring nitrogen within estuarine ecosystems.
My research examines microbial nitrogen cycling in San Francisco Bay, one of
the most anthropogenically-altered estuaries in the United States. Since 1970 the
population encircling San Francisco Bay has grown nearly 35%. This expansion and
the expectation of unabated growth in the near-term are exacerbating an already
present dichotomy: dependence on the estuary is increasing as agricultural and urban
stress on it increases. Now more than ever, the delicate health of the estuary hinges on
the effectiveness of regulation to mitigate the impacts of nutrients and other pollutants.
As regulation and education assume increasing importance in sustaining the health of
the estuary, so too does the scientific data that serves as its foundation.

3
San Francisco Bay has historically been considered a high-nutrient, low-
chlorophyll system (Cloern, 2001) where standing stocks of phytoplankton are low
despite high concentrations of inorganic nutrients, including nitrogen. Comparable
nutrient concentrations in Chesapeake Bay cause large phytoplankton blooms and
recurrent hypoxia (e.g., Boesch et al., 2001). Resistance to phytoplankton blooms in
San Francisco Bay has been a result of strong light limitation of photosynthesis by
phytoplankton and rapid consumption of phytoplankton by bivalve mollusks (Cloern,
2001). However, recent studies suggest that this resistance might be changing;
phytoplankton blooms increased in frequency and magnitude beginning after the late
1990s (new seasonal blooms coupled with an increased baseline chlorophyll a; Cloern
et al., 2007). The increase in phytoplankton blooms is a consequence of a decline in
bivalve populations and reduced phytoplankton grazing that coincided with physical
changes in the California Current System (Cloern et al., 2007). Increasing concerns
about the rising frequency and magnitude of phytoplankton blooms, as well as the
decline of pelagic organisms (e.g., delta and longfin smelts, striped bass and threadfin
shad; Sommer et al., 2007) and major shifts in community composition of algae
(Lehman, 2000; Lehman et al., 2005), highlight the importance of microbial nitrogen
removal from this heavily impacted, urbanized estuarine system.
My research in San Francisco Bay is therefore timely and focuses on three
aspects aimed at gaining a better understanding of nitrogen cycling in the estuary: a)
quantifying and describing the diversity of nitrogen cycling microorganisms in the
estuary, b) examining the effect of environmental factors such as salinity, nitrate,
oxygen and temperature on their abundance and rates, and c) cultivating ecologically-

4
relevant organisms to elucidate their physiological, biochemical, and genomic
potential.
Microbial Biogeochemistry of Ammonia Oxidation
Harmful levels of DIN can be diminished through coupled nitrification and
denitrification. Nitrification (the conversion of NH3 to NO3-) links production of NH4
+
to nitrogen removal via denitrification (the conversion of NO3- to N2 gas, which is
rapidly lost to the atmosphere) (Figure 1). It is estimated that over 50% of external
DIN inputs to estuaries are removed by coupled nitrification-denitrification
(Seitzinger, 1990). By removing a large percentage of anthropogenic N pollution
from estuaries, coupled nitrification-denitrification effectively creates a sink for DIN
and thereby plays an important role in lessening the risk of eutrophication.
Nitrification and denitrification thus are particularly significant processes where the
complex interplay of microbial populations determines the fate of excess nutrients in
estuaries.
The oxidation of ammonia (the first step in nitrification) is often the rate-
limiting process in the removal of nitrogen from marine systems (Herbert, 1999). For
over a century (Winogradsky, 1890), scientists have assumed that the most important
contributors to ammonia oxidation were two groups of ammonia-oxidizing bacteria
(AOB): the beta-proteobacteria (βAOB) from the genus Nitrosomonas and
Nitrosospira (Head et al., 1993; Purkhold et al., 2000; Purkhold et al., 2003) and
gamma-proteobacteria (γAOB) from the genus Nitrosococcus (Ward and O'Mullan,
2002). However, recently published research linking nitrification to the Archaeal
5
domain of life has turned this assumption upside-down. A combination of
metagenomic analyses (Venter et al., 2004; Treusch et al., 2005) and the cultivation of
a novel, ammonia-oxidizing, marine crenarchaeote (Könneke et al., 2005) revealed the
first evidence for nitrification within the Archaeal domain and definitively linked the
novel ammonia monooxygenase (amoA) genes to this chemoautotrophic metabolism.
The widespread presence of archaeal amoA genes in marine water columns and
sediments (Francis et al., 2005; Wuchter et al., 2006; Mincer et al., 2007) and the
demonstration that ~83% of the archaeal community in deep ocean waters is
autotrophic (Ingalls et al., 2006) indicates that the ability to oxidize ammonia may be
broadly distributed within the Crenarchaeota and may be biogeochemically important
in marine systems. Studies have shown that ammonia-oxidizing archaea (AOA) may
be up to several 1000-fold more abundant than their well-known bacterial counterparts
in soils, the open ocean, and the Black Sea suboxic zone (e.g., Leininger et al., 2006,
Wuchter et al., 2006, Lam et al., 2007).
Ammonia-oxidizing populations exhibit distinct spatial structure in estuaries.
Studies in the Chesapeake Bay, Plum Island Sound, and Ythan estuaries showed shifts
in AOB diversity along salinity gradients (Francis et al., 2003; Bernhard et al., 2005;
Freitag et al., 2006). All three studies reported Nitrosospira-like sequences at high
salinities and Nitrosomonas-like sequences at low salinities. AOA also showed strong
spatial variability in the Bahía del Tóbari estuary, with distinct AOA communities
within the interior of the bay and at the mouths of the estuary (Beman and Francis,
2006). Nitrification potentials also vary across estuarine salinity gradients with
greatest values observed at low and intermediate salinities (Rysgaard et al., 1999;
6
Bernhard et al., 2007). Although salinity appears to play a role in shaping the
ammonia-oxidizing communities in these environments, many physical and chemical
parameters fluctuate (and covary) across a typical estuarine transect making it difficult
to separate the controlling variables.
The vast majority of amoA gene sequences reported in most estuarine studies
appear to be novel and distinct from sequences of cultivated ammonia oxidizers,
indicating that we know very little about the organisms actually responsible for this
process in nature. Despite the fact that the first βAOB were isolated in the late 1800’s
(Winogradsky, 1890), to date there are large groups of βAOB with no cultivated
representatives, including Nitrosospira cluster 1 and Nitrosomonas cluster 5 (Freitag
and Prosser, 2003; Freitag et al., 2006). These 16S rRNA-based groups dominate
AOB communities in many marine and estuarine systems (McCaig et al., 1999; Bano
and Hollibaugh, 2000; Freitag and Prosser, 2003, 2004) and yet very little is known
about them. The presumption that these groups oxidize ammonia is based on
clustering of their 16S rRNA genes within a monophyletic group containing cultivated
AOB, and on reports of non-persisting enrichment cultures of Nitrosomonas cluster 5
(Stephen et al., 1996). Likewise, only one archaeal ammonia oxidizer has been
isolated—Nitrosopumilus maritimus derived from a tropical marine aquarium
(Könneke et al., 2005). There have been a few other reports of cultivation of AOA in
enrichment cultures (Wuchter et al., 2006; de la Torre et al., 2008; Hatzenpichler et
al., 2008; Mosier and Francis, 2008; Santoro et al., 2008). Cultivation of
environmentally relevant AOB and AOA will be important for understanding the
physiology of these organisms.
7
Microbial Biogeochemistry of Denitrification
Denitrification mediates nitrogen load reduction enabling estuaries to act as
natural nitrogen sinks, curtailing nitrate pollution. Denitrification is the main process
responsible for the conversion of nitrate to dinitrogen gases, which are rapidly lost to
the atmosphere (NO3- → NO2
- → NO → N2O → N2) (Zumft, 1997). The conversion
of nitrate to a less-bioavailable form (dinitrogen gases) can limit excessive growth of
algae that ultimately stimulates hypoxic conditions. The conversion to gaseous
nitrogen forms within the estuary also mitigates the flux of nitrate into the ocean,
preventing secondary pollution of that system.
Recent reports of anammox activity (the anaerobic oxidation of ammonia to N2
via nitrite) have drawn into question the relative significance of denitrification versus
anammox in estuarine sediments. The contribution of N2 formation from anammox
relative to denitrification in estuarine sediments has been observed to range from 1 to
8% in the Thames Estuary (Trimmer et al., 2003), 5 to 24% in Randers Fjord and 0%
in Norsminde Fjord, Denmark (Risgaard-Petersen et al., 2004). Based on these
studies, denitrification appears to represent the dominant nitrogen removal process in
estuarine sediments.
Because denitrifying bacteria are found within a variety of phylogenetically
unrelated groups from over 50 genera (Zumft, 1997), efforts have been directed
toward amplification of functional genes involved in denitrification (e.g., narG, nirK,
nirS, norB, nosZ), rather than the common 16S rRNA-based approach. These genes
have been used to examine denitrifying communities in a variety of environments
8
including: soils (Prieme et al., 2002; Kramer et al., 2006); groundwater (Yan et al.,
2003); coastal aquifer (Santoro et al., 2006); Baltic Sea (Brettar et al., 2006; Hannig et
al., 2006); Arabian Sea (Jayakumar et al., 2004); Black Sea suboxic zone (Oakley et
al., 2007); the deep sea (Tamegai et al., 2007); marine sediments (Braker et al., 2000;
Liu et al., 2003; Hunter et al., 2006; Tiquia et al., 2006); and estuarine sediments
(Nogales et al., 2002).
Nitrite reductase (Nir) is considered the key reductase in the denitrification
pathway because it catalyzes the first committed step to a gaseous product (Zumft,
1997). Two structurally different but functionally equivalent enzymes catalyze nitrite
reduction: NirS, containing iron (cytochrome-cd1); and NirK, containing copper.
Diversity of nirS and nirK genes were recently examined in two estuaries. Relatively
high diversity of expressed nirS genes was observed in the River Colne estuary and
most of the sequences exhibited site specificity (Nogales et al., 2002). Transcripts
were not detected for three of the five denitrification genes found in the sediments
(narG, napA, and nirK), despite the fact that the sediments had high denitrification
rates. The Chesapeake Bay had extensive and unprecedented nirS diversity and
distinct spatial structure (Francis et al., unpublished). Interestingly, nirS richness,
nitrate concentrations, and sediment denitrification rates (N2-flux) all ranged from
extremely high at the low salinity stations to quite low at the most marine station near
the mouth of the Bay.
Dissertation Organization and Chapter Descriptions
This dissertation focuses on microbial transformations of nitrogen in marine
9
systems through laboratory and field studies. Chapters 2, 3, 4, and 6 have been
published in peer-reviewed journals as indicated on the chapter title pages. Chapter 2
describes quantitative approaches used to determine the distribution of marine and
coastal ammonia-oxidizing archaea and bacteria. This chapter also details some of the
current debates about ammonia oxidation in marine systems. Chapter 3 uses
molecular biology techniques to determine the relative abundance and diversity of
ammonia-oxidizing archaea and bacteria in the San Francisco Bay estuary. The
ecology of these organisms is also explored using statistical analyses of environmental
data. In Chapter 4, we analyze the genome of a low-salinity AOA isolated from the
north part of San Francisco Bay. This study represents only the second genome from
a free-living AOA and the third overall AOA genome (the third being a metagenome
from a sponge symbiont). I share the first author position for this article with Paul
Blainey; we both contributed equally to the conception, design, and execution of the
experiments and to the data analysis and interpretation. The physiology of this low-
salinity AOA culture is explored in Chapter 5. Finally, Chapter 6 describes the
abundance and activity of denitrifiers in the San Francisco Bay estuary.

10
Figures
Figure 1. Microbial nitrogen cycling in the marine environment (figure from Francis
et al., 2007).
11
Literature Cited
Bano, N., and Hollibaugh, J.T. (2000) Diversity and distribution of DNA sequences
with affinity to ammonia-oxidizing bacteria of the beta subdivision of the class
Proteobacteria in the Arctic Ocean. Applied and Environmental Microbiology 66:
1960-1969.
Beman, J.M., and Francis, C.A. (2006) Diversity of ammonia-oxidizing archaea and
bacteria in the sediments of a hypernutrified subtropical estuary: Bahia del Tobari,
Mexico. Applied and Environmental Microbiology 72: 7767-7777.
Bernhard, A.E., Donn, T., Giblin, A.E., and Stahl, D.A. (2005) Loss of diversity of
ammonia-oxidizing bacteria correlates with increasing salinity in an estuary system.
Environmental Microbiology 7: 1289-1297.
Bernhard, A.E., Tucker, J., Giblin, A.E., and Stahl, D.A. (2007) Functionally distinct
communities of ammonia-oxidizing bacteria along an estuarine salinity gradient.
Environmental Microbiology 9: 1439-1447.
Boesch, D.F., Brinsfield, R.B., and Magnien, R.E. (2001) Chesapeake Bay
eutrophication: Scientific understanding, ecosystem restoration, and challenges for
agriculture. Journal of Environmental Quality 30: 303-320.

12
Braker, G., Zhou, J.Z., Wu, L.Y., Devol, A.H., and Tiedje, J.M. (2000) Nitrite
reductase genes (nirK and nirS) as functional markers to investigate diversity of
denitrifying bacteria in Pacific northwest marine sediment communities. Applied And
Environmental Microbiology 66: 2096-2104.
Brettar, I., Labrenz, M., Flavier, S., Botel, J., Kuosa, H., Christen, R., and Hofle, M.G.
(2006) Identification of a Thiomicrospira denitrificans-like epsilonproteobacterium as
a catalyst for autotrophic denitrification in the central Baltic Sea. Applied And
Environmental Microbiology 72: 1364-1372.
Cloern, J.E. (2001) Our evolving conceptual model of the coastal eutrophication
problem. Marine Ecology-Progress Series 210: 223-253.
Cloern, J.E., Jassby, A.D., Thompson, J.K., and Hieb, K.A. (2007) A cold phase of the
East Pacific triggers new phytoplankton blooms in San Francisco Bay. Proceedings of
the National Academy of Sciences 104: 18561-18565.
de la Torre, J.R., Walker, C.B., Ingalls, A.E., Konneke, M., and Stahl, D.A. (2008)
Cultivation of a thermophilic ammonia oxidizing archaeon synthesizing crenarchaeol.
Environmental Microbiology 10: 810-818.
Fisher, T., Peele, E., Ammerman, J., and Harding, L. (1992) Nutrient limitation of
phytoplankton in Chesapeake Bay. Marine Ecology Progress Series 82: 51-63.
13
Francis, C.A., Beman, J.M., and Kuypers, M.M.M. (2007) New processes and players
in the nitrogen cycle: the microbial ecology of anaerobic and archaeal ammonia
oxidation. ISME J 1: 19-27.
Francis, C.A., O'Mullan, G.D., and Ward, B.B. (2003) Diversity of ammonia
monooxygenase (amoA) genes across environmental gradients in Chesapeake Bay
sediments. Geobiology 1: 129-140.
Francis, C.A., Roberts, K.J., Beman, J.M., Santoro, A.E., and Oakley, B.B. (2005)
Ubiquity and diversity of ammonia-oxidizing archaea in water columns and sediments
of the ocean. Proceedings of the National Academy of Sciences 102: 14683-14688.
Francis, C.A., Beman, J.M., and Kuypers, M.M.M. (2007) New processes and players
in the nitrogen cycle: the microbial ecology of anaerobic and archaeal ammonia
oxidation. ISME J 1: 19-27.
Freitag, T.E., and Prosser, J.I. (2003) Community structure of ammonia-oxidizing
bacteria within anoxic marine sediments. Applied and Environmental Microbiology
69: 1359-1371.

14
Freitag, T.E., and Prosser, J.I. (2004) Differences between betaproteobacterial
ammonia-oxidizing communities in marine sediments and those in overlying water.
Applied and Environmental Microbiology 70: 3789-3793.
Freitag, T.E., Chang, L., and Prosser, J.I. (2006) Changes in the community structure
and activity of betaproteobacterial ammonia-oxidizing sediment bacteria along a
freshwater-marine gradient. Environmental Microbiology 8: 684-696.
Hannig, M., Braker, G., Dippner, J., and Jurgens, K. (2006) Linking denitrifier
community structure and prevalent biogeochemical parameters in the pelagial of the
central Baltic Proper (Baltic Sea). FEMS Microbiology Ecology 57: 260-271.
Hatzenpichler, R., Lebedeva, E.V., Spieck, E., Stoecker, K., Richter, A., Daims, H.,
and Wagner, M. (2008) A moderately thermophilic ammonia-oxidizing crenarchaeote
from a hot spring. Proceedings of the National Academy of Sciences 105: 2134-2139.
Head, I.M., Hiorns, W.D., Embley, T.M., McCarthy, A.J., and Saunders, J.R. (1993)
The phylogeny of autotrophic ammonia-oxidizing bacteria as determined by analysis
of 16S ribosomal RNA gene sequences. Journal of General Microbiology 139: 1147-
1153.
Herbert, R.A. (1999) Nitrogen cycling in coastal marine ecosystems. FEMS
Microbiology Reviews 23: 563-590.
15
Hunter, E.M., Mills, H.J., and Kostka, J.E. (2006) Microbial community diversity
associated with carbon and nitrogen cycling in permeable shelf sediments. Applied
and Environmental Microbiology 72: 5689-5701.
Ingalls, A.E., Shah, S.R., Hansman, R.L., Aluwihare, L.I., Santos, G.M., Druffel,
E.R.M., and Pearson, A. (2006) Quantifying archaeal community autotrophy in the
mesopelagic ocean using natural radiocarbon. Proceedings of the National Academy of
Sciences 103: 6442-6447.
Jayakumar, D.A., Francis, C.A., Naqvi, S.W.A., and Ward, B.B. (2004) Diversity of
nitrite reductase genes (nirS) in the denitrifying water column of the coastal Arabian
Sea. Aquatic Microbial Ecology 34: 69-78.
Könneke, M., Bernhard, A.E., de la Torre, J.R., Walker, C.B., Waterbury, J.B., and
Stahl, D.A. (2005) Isolation of an autotrophic ammonia-oxidizing marine archaeon.
Nature 437: 543-546.
Kramer, S.B., Reganold, J.P., Glover, J.D., Bohannan, B.J.M., and Mooney, H.A.
(2006) Reduced nitrate leaching and enhanced denitrifier activity and efficiency in
organically fertilized soils. Proceedings of the National Academy of Sciences 103:
4522-4527.
16
Lam, P., Jensen, M., Lavik, G., McGinnis, D., Muller, B., Schubert, C. et al. (2007)
Linking crenarchaeal and bacterial nitrification to anammox in the Black Sea.
Proceedings of the National Academy of Sciences 104: 7104-7109.
Lehman, P.W. (2000) Phytoplankon biomass, cell diameter, and species composition
in the low salinity zone of northern San Francisco Bay estuary. Estuaries 23: 216-230.
Lehman, P.W., Boyer, G., Hall, C., Waller, S., and Gehrts, K. (2005) Distribution and
toxicity of a new colonial Microcystis aeruginosa bloom in the San Francisco Bay
Estuary, California. Hydrobiologia 541: 87-99.
Leininger, S., Urich, T., Schloter, M., Schwark, L., Qi, J., Nicol, G. et al. (2006)
Archaea predominate among ammonia-oxidizing prokaryotes in soils. Nature 442:
806-809.
Liu, X.D., Tiquia, S.M., Holguin, G., Wu, L.Y., Nold, S.C., Devol, A.H. et al. (2003)
Molecular diversity of denitrifying genes in continental margin sediments within the
oxygen-deficient zone off the Pacific coast of Mexico. Applied And Environmental
Microbiology 69: 3549-3560.
McCaig, A.E., Phillips, C.J., Stephen, J.R., Kowalchuk, G.A., Harvey, S.M., Herbert,
R.A. et al. (1999) Nitrogen cycling and community structure of proteobacterial beta-

17
subgroup ammonia-oxidizing bacteria within polluted marine fish farm sediments.
Applied and Environmental Microbiology 65: 213-220.
Mincer, T.J., Church, M.J., Taylor, L.T., Preston, C., Karl, D.M., and DeLong, E.F.
(2007) Quantitative distribution of presumptive archaeal and bacterial nitrifiers in
Monterey Bay and the North Pacific Subtropical Gyre. Environmental Microbiology 9:
1162-1175.
Mosier, A.C., and Francis, C.A. (2008) Relative abundance and diversity of ammonia-
oxidizing archaea and bacteria in the San Francisco Bay estuary. Environmental
Microbiology 10: 3002-3016.
Nogales, B., Timmis, K.N., Nedwell, D.B., and Osborn, A.M. (2002) Detection and
diversity of expressed denitrification genes in estuarine sediments after reverse
transcription-PCR amplification from mRNA. Applied And Environmental
Microbiology 68: 5017-5025.
O'Mullan, G.D., and Ward, B.B. (2005) Relationship of temporal and spatial
variabilities of ammonia-oxidizing bacteria to nitrification rates in Monterey Bay,
California. Applied and Environmental Microbiology 71: 697-705.
Oakley, B.B., Francis, C.A., Roberts, K.J., Fuchsman, C.A., Srinivasan, S., and Staley,
J.T. (2007) Analysis of nitrite reductase (nirK and nirS) genes and cultivation reveal

18
depauperate community of denitrifying bacteria in the Black Sea suboxic zone.
Environmental Microbiology 9: 118-130.
Prieme, A., Braker, G., and Tiedje, J.M. (2002) Diversity of nitrite reductase (nirK and
nirS) gene fragments in forested upland and wetland soils. Applied And Environmental
Microbiology 68: 1893-1900.
Purkhold, U., Wagner, M., Timmermann, G., Pommerening-Roser, A., and Koops,
H.P. (2003) 16S rRNA and amoA-based phylogeny of 12 novel betaproteobacterial
ammonia-oxidizing isolates: extension of the dataset and proposal of a new lineage
within the nitrosomonads. International Journal of Systematic and Evolutionary
Microbiology 53: 1485-1494.
Purkhold, U., Pommerening-Roser, A., Juretschko, S., Schmid, M.C., Koops, H.P.,
and Wagner, M. (2000) Phylogeny of all recognized species of ammonia oxidizers
based on comparative 16S rRNA and amoA sequence analysis: implications for
molecular diversity surveys. Applied and Environmental Microbiology 66: 5368-5382.
Rabalais, N., and Nixon, S. (2002) Preface: nutrient overenrichment of the coastal
zone. Estuaries 25: 639.

19
Risgaard-Petersen, N., Meyer, R.L., Schmid, M., Jetten, M.S.M., Enrich-Prast, A.,
Rysgaard, S., and Revsbech, N.P. (2004) Anaerobic ammonium oxidation in an
estuarine sediment. Aquatic Microbial Ecology 36: 293-304.
Rysgaard, S., Thastum, P., Dalsgaard, T., Christensen, P.B., and Sloth, N.P. (1999)
Effects of salinity on NH4+ adsorption capacity, nitrification, and denitrification in
Danish estuarine sediments. Estuaries 22: 21-30.
Ryther, J.H., and Dunstan, W.M. (1971) Nitrogen, phosphorus, and eutrophication in
the coastal marine environment. Science 171: 1008-1013.
Santoro, A.E., Boehm, A.B., and Francis, C.A. (2006) Denitrifier community
composition along a nitrate and salinity gradient in a coastal aquifer. Applied And
Environmental Microbiology 72: 2102-2109.
Santoro, A.E., Francis, C.A., de Sieyes, N.R., and Boehm, A.B. (2008) Shifts in the
relative abundance of ammonia-oxidizing bacteria and archaea across
physicochemical gradients in a subterranean estuary. Environmental Microbiology 10:
1068-1079.
Seitzinger, S.P. (1990) Denitrification in aquatic sediments. In Denitrification in soil
and sediment. Revsbech, N.P., and Sorensen, J. (eds). New York, N.Y.: Plenum Press,
pp. 301-322.
20
Sommer, T., Armor, C., Baxter, R., Breuer, R., Brown, L., Chotkowski, M. et al.
(2007) The collapse of pelagic fishes in the upper San Francisco Estuary. Fisheries 32:
270-277.
Stephen, J.R., McCaig, A.E., Smith, Z., Prosser, J.I., and Embley, T.M. (1996)
Molecular diversity of soil and marine 16S rRNA gene sequences related to beta-
subgroup ammonia-oxidizing bacteria. Applied and Environmental Microbiology 62:
4147-4154.
Tamegai, H., Aoki, R., Arakawa, S., and Kato, C. (2007) Molecular analysis of the
nitrogen cycle in deep-sea microorganisms from the Nankai Trough: genes for
nitrification and denitrification from deep-sea environmental DNA. Extremophiles 11:
269-275.
Tiquia, S.M., Masson, S.A., and Devol, A. (2006) Vertical distribution of nitrite
reductase genes (nirS) in continental margin sediments of the Gulf of Mexico. FEMS
Microbiology Ecology 58: 464-475.
Treusch, A.H., Leininger, S., Kletzin, A., Schuster, S.C., Klenk, H.P., and Schleper, C.
(2005) Novel genes for nitrite reductase and Amo-related proteins indicate a role of
uncultivated mesophilic crenarchaeota in nitrogen cycling. Environmental
Microbiology 7: 1985-1995.
21
Trimmer, M., Nicholls, J.C., and Deflandre, B. (2003) Anaerobic ammonium
oxidation measured in sediments along the Thames estuary, United Kingdom. Applied
and Environmental Microbiology 69: 6447-6454.
Venter, J.C., Remington, K., Heidelberg, J.F., Halpern, A.L., Rusch, D., Eisen, J.A. et
al. (2004) Environmental genome shotgun sequencing of the Sargasso Sea. Science
304: 66-74.
Ward, B.B., and O'Mullan, G.D. (2002) Worldwide distribution of Nitrosococcus
oceani, a marine ammonia-oxidizing gamma-proteobacterium, detected by PCR and
sequencing of 16S rRNA and amoA genes. Applied and Environmental Microbiology
68: 4153-4157.
Winogradsky, S. (1890) Sur les organismes de la nitrofication. Comptes Rendus
Biologies 110: 1013-1016.
Wuchter, C., Abbas, B., Coolen, M.J., Herfort, L., van Bleijswijk, J., Timmers, P. et
al. (2006) Archaeal nitrification in the ocean. Proceedings of the National Academy of
Sciences 103: 12317-12322.
Yan, T.F., Fields, M.W., Wu, L.Y., Zu, Y.G., Tiedje, J.M., and Zhou, J.Z. (2003)
Molecular diversity and characterization of nitrite reductase gene fragments (nirK and

22
nirS) from nitrate- and uranium-contaminated groundwater. Environmental
Microbiology 5: 13-24.
Zumft, W.G. (1997) Cell biology and molecular basis of denitrification. Microbiology
And Molecular Biology Reviews 61: 533-542.
23
Chapter 2. Determining the distribution of marine and coastal ammonia-oxidizing archaea and bacteria using a quantitative approach Annika C. Mosier1 and Christopher A. Francis1
1Department of Environmental Earth System Science, Stanford University, Stanford, CA 94305-4216, USA Published as: Mosier, A.C., and C.A. Francis. 2011. Determining the distribution of marine and coastal ammonia-oxidizing archaea and bacteria using a quantitative approach. Methods in Enzymology 486: 205-221.
24
Abstract
The oxidation of ammonia to nitrite is the first and often rate-limiting step in
nitrification and plays an important role in both nitrogen and carbon cycling. This
process is carried out by two distinct groups of microorganisms: ammonia-oxidizing
archaea and ammonia-oxidizing bacteria. This chapter describes methods for
measuring the abundance of ammonia-oxidizing archaea and bacteria using ammonia
monooxygenase subunit A (amoA) genes, with a particular emphasis on marine and
coastal systems. We also describe quantitative measures designed to target two
specific clades of marine ammonia-oxidizing archaea: the ‘shallow’ and ‘deep’ water
column AOA.
25
Introduction
Nitrification—the microbial conversion of ammonia to nitrate—links the
fixation of atmospheric nitrogen (N2 gas to ammonium) to nitrogen removal processes
(denitrification and anaerobic ammonium oxidation [anammox]), which ultimately
convert nitrate or ammonium to N2 gas. Through tight coupling with nitrogen removal
processes, nitrification plays a critical role in reducing the associated risks of elevated
dissolved inorganic nitrogen (DIN: ammonia, nitrate, and nitrite) often found in
coastal systems, including loss of biodiversity, nuisance/toxic algal blooms, and
depleted dissolved oxygen (e.g., Bricker et al., 1999). In fact, it is estimated that over
50% of external DIN inputs to estuaries are removed by these microbial processes
(e.g., Seitzinger, 1988). Nitrifiers are thought to be primarily autotrophic and thus
also play a role in supplying organic carbon to coastal and marine systems.
Nitrification is carried out by two functional groups (or guilds) of
chemoautotrophic organisms: ammonia-oxidizers convert ammonia to nitrite and then
nitrite-oxidizers convert nitrite to nitrate. Ammonia oxidation is thought to be the
rate-limiting step of the overall reaction, in part because the free energy of the reaction
is significantly higher than that of nitrite oxidation and because nitrite rarely
accumulates in the environment. Two distinct groups of microbes are capable of
ammonia oxidation: (1) the recently discovered ammonia-oxidizing archaea (AOA);
and (2) the ammonia-oxidizing bacteria (AOB), including betaproteobacteria (β-AOB)
from the genera Nitrosomonas and Nitrosospira, as well as gammaproteobacteria (γ-
AOB) from the genus Nitrosococcus.

26
Despite the biogeochemical importance of ammonia oxidation, only recently
have quantitative molecular approaches been employed to determine the relative
abundance of the key microbes responsible for this process—the AOA and AOB.
AOB amoA genes appear to be more abundant than AOA amoA genes in many coastal
and estuarine sediments based on quantitative PCR (qPCR) estimates (Caffrey et al.,
2007; Mosier and Francis, 2008; Santoro et al., 2008; Magalhaes et al., 2009; Wankel
et al., in revision). However, AOA amoA genes are more abundant than AOB amoA
genes in other estuaries and salt marshes (Caffrey et al., 2007; Moin et al., 2009; Abell
et al., 2010; Bernhard et al., 2010). The relative distribution of these two ammonia-
oxidizing groups in estuarine environments has been shown to depend on salinity
(Mosier and Francis, 2008; Santoro et al., 2008), sediment C:N ratio (Mosier and
Francis, 2008), oxygen concentration (Santoro et al., 2008), and chlorophyll-a (Abell
et al., 2010). Other physical and geochemical factors shown to specifically affect
AOA, AOB, or overall nitrification rates will likely impact the ratio of AOA:AOB,
such as sulfide concentrations (Joye and Hollibaugh, 1995), Fe(III) content (Dollhopf
et al., 2005), light (Horrigan and Springer, 1990), temperature (Berounsky and Nixon,
1993), and exogenous inputs from rivers and wastewater treatment plants (Dang et al.,
2010). Based on a review of the current literature, Erguder et al. (2009) proposed
specific AOA and AOB niches corresponding to varying dissolved oxygen, ammonia,
pH, phosphate, and sulfide levels. Substrate availability likely plays a major role in
the relative distribution of AOA versus AOB, particularly since it was recently
demonstrated that the cultivated ammonia-oxidizing crenarchaeote, Nitrosopumilus
maritimus SCM1, has a far greater affinity (lower Km) for ammonium than many AOB
27
(Martens-Habbena et al., 2009). The community composition of AOA and AOB
should be also considered when evaluating the relative abundance of these two groups
across different sites because ammonia-oxidizers often exhibit distinct spatial structure
in coastal/estuarine systems with different phylotypes dominanting at different sites
(e.g., Francis et al., 2003; Bernhard et al., 2005; Beman and Francis, 2006; Freitag et
al., 2006; Mosier and Francis, 2008).
In the open ocean, fixed nitrogen typically enters the deep ocean as ammonia
(NH3/NH4+) but it accumulates as nitrate (Karl, 2007). Nitrifiers rapidly convert the
ammonia into nitrate, and thus are responsible for producing the large nitrate reservoir
(20-40 µM) in the deep waters. Nitrification also plays a critical role in the upper
ocean, both as a source of NO3- to fuel primary production (Wankel et al., 2007; Yool
et al., 2007) and as a source of the greenhouse gas N2O to the atmosphere (Dore et al.,
1998). Interestingly, a number of studies have now shown that AOA amoA genes are
often several 100- to 1000-fold more abundant than AOB amoA genes in the open
ocean (Wuchter et al., 2006; Mincer et al., 2007; Beman et al., 2008; Beman et al.,
2010; Santoro et al., 2010).
It appears that the vast majority of crenarchaea in the open ocean (particularly
in the mesopelagic zone) possess ammonia monooxygenase genes and thus may be
capable of oxidizing ammonia to nitrite. In fact, several oceanic water column studies
have found that archaeal amoA gene copy numbers are equal to or even higher than
archaeal 16S rRNA gene copies, based on qPCR estimates. For instance, archaeal
amoA and marine Group 1 (MGI) crenarchaeal 16S rRNA genes have a ratio of ≥1 at
the San Pedro Ocean Time-series (SPOT) site in the Southern California Bight

28
(Beman et al., 2010), the Guaymas and Carmen Basins in the Gulf of California
(Beman et al., 2008), the central California Current (Santoro et al., 2010), Monterey
Bay (Mincer et al., 2007), the central Pacific Ocean (Church et al., 2010), and station
ALOHA near Hawaii (Mincer et al., 2007). Wuchter et al. (2006) also found similar
results when comparing amoA gene copy numbers to crenarchaeal cell counts
generated by catalyzed reporter deposition-fluorescence in situ hybridization (CARD-
FISH). In a whole-genome shotgun library from 4,000-m depth at Station ALOHA,
Konstantinidis et al. (2009) showed that the ratio of individual crenarchaeal ammonia
monooxygenase sequence reads to crenarchaeal 16S rRNA sequence reads was
consistent with a 1:1 amoA:16S rRNA ratio. Taken together, all of these results imply
that most MGI crenarchaea contain amoA genes and thus are likely capable of
oxidizing ammonia. Indeed, MGI crenarchaeal 16S rRNA gene copies and group A
(see below) archaeal amoA gene copies were significantly correlated with measured
15NH4+oxidation rates in the Gulf of California (Beman et al., 2008), providing further
evidence for marine crenarchaeal nitrification. Considering that previous studies have
shown that MGI crenarchaea constitute ~10-40% of the total microbial community in
the ocean below the euphotic zone (Karner et al., 2001; Herndl et al., 2005; Teira et
al., 2006; Kirchman et al., 2007), the crenarchaea are likely the dominant ammonia-
oxidizers in the open ocean and ultimately responsible for the deep nitrate reservoir.
Studies in the North Atlantic (Agogué et al., 2008), Eastern Mediterranean Sea
(de Corte et al., 2009) and Antarctic (Kalanetra et al., 2009) have suggested that some
crenarchaea lack the amoA gene because of low 16S rRNA:amoA gene ratios, and may
thus be incapable of ammonia oxidation. However, all three of these studies used

29
amoA qPCR primers developed by Wuchter et al. (2006), which have several
mismatches to marine AOA and therefore may lead to spurious quantitative results
(primer mismatches analyzed and discussed by Konstantinidis et al., 2009; Church et
al., 2010; and Santoro et al., 2010). Thus it seems that the majority of crenarchaea in
the ocean likely possess the capacity to oxidize ammonia. Even still, some marine
crenarchaea may utilize alternate metabolic pathways. For instance, isotopic
(Ouverney and Fuhrman, 2000; Herndl et al., 2005; Teira et al., 2006; Varela et al.,
2008) and genomic (Hallam et al., 2006; Walker et al., 2010; Blainey et al., 2011)
studies have suggested that AOA may be capable of mixotrophic growth.
Additionally, urease genes have been reported in the Cenarchaeum symbiosum A
genome (Hallam et al., 2006) and in a crenarchaeal genomic scaffold from the Pacific
Ocean (Konstantinidis et al., 2009), suggesting that at least some marine AOA may
have the potential to use urea as an energy source. It is also possible that the archaeal
AMO proteins act on substrates other than, or in addition to, ammonia. Further
studies, including cultivation-based approaches, will be necessary to confirm whether
or not AOA derive energy from sources other than ammonia.
Methods for Measuring the Abundance of AOA and AOB within Marine and
Coastal Systems
Sample Collection
Sediment cores for molecular analyses are generally collected from a Young-
modified, Van Veen grab sampler (deployed off a research vessel) using sterile, cut-
off 5-cc syringes. Syringe cores are collected towards the interior of the sediment grab
30
in order to avoid disturbed sediment near the outer edges of the sampler. Larger cores
can be collected using larger syringes (e.g., 60-cc), PVC piping, or acrylic tubing.
Water samples are collected at discrete depths with a Niskin or multi-bottle rosette
sampler. Water samples (1-4 liters) are vacuum-filtered onto a 25 mm, 0.2 µm filter
and filters are placed in bead-beating tubes. The water samples can also be size
fractionated using filters with different pore sizes (e.g., 10 µm pore size filter to
remove larger plankton). For filters specified for RNA extraction, 600 µl RLT Buffer
(Qiagen) with 1% ß-mercaptoethanol is added to the tube containing the filter (Santoro
et al., 2010). Water filters and sediment cores for DNA and RNA analyses are
immediately frozen on liquid nitrogen or dry ice until permanent storage at -80°C.
DNA Extraction
We routinely use the FastDNA SPIN Kit for Soil (MP Biomedicals) to recover
total community DNA from sediment samples (Francis et al., 2005; Beman and
Francis, 2006; Santoro et al., 2008; Mosier and Francis, 2008). The kit produces
‘PCR-ready’ genomic DNA after bead-beating lysis, sample homogenization and
protein solubilization, and DNA purification. DNA is extracted from approximately
0.5g of sediment from the upper 5 mm of the syringe cores. All steps in the
manufacturer’s protocol are followed, except that the purified DNA is eluted in 100 µl
DNase/RNase-free water.
For water samples, we use the DNA extraction method described by Santoro et
al. (2010). Briefly, sucrose-EDTA lysis buffer and 10% sodium dodecyl sulfate are
added to the bead-beating tubes containing the frozen filters. Following bead beating,
31
proteinase K is added and filters are incubated at 55°C for approximately 4 h. The
supernatant is then purified using DNeasy columns (Qiagen) following the
manufacturer’s protocol with the incorporation of an additional wash step with wash
buffer AW2 (Qiagen). The purified DNA is eluted in 200 µl of DNase/RNase-free
water.
RNA Extraction and cDNA Synthesis
Total RNA extracts are analyzed to determine which amoA genes are actively
expressed in the environment. RNA is extracted from sediment samples using the
RNA PowerSoil Total RNA Isolation Kit (MO BIO). RNA from filtered water
samples is extracted according the methods described by Santoro et al. (2010), which
are based on modifications of the RNeasy Kit (Qiagen). RNA extracts are
immediately treated with DNase I to remove any residual DNA. Complimentary DNA
(cDNA) is generated from mRNA using the SuperScript III first strand cDNA
synthesis kit (Invitrogen).
PCR Screening and Gene Sequencing
Mixed template DNA and cDNA is PCR amplified with primers targeting
betaproteobacterial and archaeal amoA: amoA-1F* (Stephen et al., 1999) or amoA-1F
and amoA-2R (Rotthauwe et al., 1997) for ß-AOB; Arch-amoAF and Arch-amoAR
(Francis et al., 2005) for AOA. Clone libraries of amoA gene fragments are
constructed using a TOPO TA cloning kit (Invitrogen) and individual clones are
sequenced. Both nucleic acid and amino acid sequences are subjected to phylogenetic

32
analysis. Sequences are manually aligned with GenBank sequences using MacClade
(http://macclade.org) and phylogenetic trees are constructed in ARB (Ludwig et al.,
2004).
Quantifying Archaeal and Bacterial amoA Genes and Transcripts
Quantitative PCR (qPCR) is used to estimate the number of archaeal and
bacterial amoA gene or transcript copies in sediment or water samples. It is advisable
to analyze replicate DNA or RNA extractions for each sediment or water sample to
minimize biases associated with sample heterogeneity and extraction efficiency.
Reactions are carried out in a qPCR thermal cycler such as the StepOnePlus™ Real-
Time PCR System (Applied Biosystems).
A standard curve is prepared from a dilution series of control template of
known concentration, such as a plasmid containing a cloned gene of interest, genomic
DNA, or cDNA. We use plasmids containing cloned amoA PCR amplicons that have
been extracted with the Qiagen Miniprep Spin Kit. Plasmids are linearized with the
NotI restriction enzyme, purified, and quantified using the Quant-iT™ Broad Range
DNA assay with the Qubit Fluorometer (Invitrogen). The standard curve should
include at least four data points spanning the range of template concentrations in a
given set of samples (often several orders of magnitude). Following amplification, the
threshold cycle (Ct) value for each standard dilution is plotted against the logarithm of
the copy number of each dilution, generating the standard curve. The efficiency of the
qPCR reaction is calculated using the equation below:

33
Efficiency = [10(–1/slope)]–1]100
When the efficiency is perfect (100%), the slope of the standard curve is –3.32,
indicating that there is a perfect doubling of target amplicon every cycle. Correlation
coefficients (R2) for the standard curve should be very close to 1 (ideally > 0.985).
Melt curves (for SYBR assays) and gels should be analyzed to check the specificity of
amplification.
Sample nucleic acids are simultaneously amplified alongside the standards.
Sample Ct values are compared to the standard curve to estimate the copy numbers
within each reaction. All sample reactions are performed in triplicate and an average
value is calculated. An outlier may be removed from some triplicate measurements to
maintain a standard deviation of less than 10-15% for each sample. The number of
genes or transcripts in the original sample can then be calculated using the initial
volume of water filtered or weight of sediment extracted, the total amount of nucleic
acids recovered from the extraction, and the amount of nucleic acids added to each
qPCR reaction.
SYBR Green qPCR assays are commonly used for amplification of archaeal
and bacterial amoA genes or transcripts. Although TaqMan assays have advantages
over SYBR assays, divergence of the archaeal and bacterial amoA genes precludes
development of universal TaqMan probes that capture the full phylogenetic diversity
of each gene. Primers Arch-amoAF and Arch-amoAR (Francis et al., 2005) are
frequently used for AOA amoA quantification and amoA-1F and amoA-2R
(Rotthauwe et al., 1997) for ß-AOB amoA quantification. Other archaeal amoA
primers used for qPCR in marine studies (e.g., Bernhard et al., 2010; Church et al.,
34
2010; Mincer et al., 2007; Moin et al., 2009) include CrenAmoAQ-F (Mincer et al.,
2007) and CrenAmoAQModF (Moin et al., 2009). Variations on the amoA-1F and
amoA-2R primers have been used in some marine studies (e.g., Dang et al., 2010 and
Magalhaes et al., 2009) for ß-AOB amoA quantification: amoA-1F* (Stephen et al.,
1999) and amoA-2R’ (Okano et al., 2004). Primer amoA-3F and amoB-4R (Purkhold
et al., 2000) have been used to quantify γ-AOB (Lam et al., 2009).
Reaction conditions for SYBR assays using primers Arch-amoAF and Arch-
amoAR for AOA amoA quantification and amoA-1F and amoA-2R for ß-AOB amoA
quantification follow. qPCR reactions are prepared on a cold block (~4°C) to avoid
non-specific priming. AOA amoA qPCR is performed in a 25 µl reaction mixture with
a known amount of template DNA (typically 0.2-10 ng), 0.4 µM of each primer, 2
mM MgCl2, 1.25 Units AmpliTaq DNA polymerase (Applied Biosystems), 1 µl
passive reference dye, 40 ng µl-1 BSA and 12.5 µl Failsafe Green Premix E
(Epicentre). The qPCR protocol is as follows: 3 min at 95°C, then 32 cycles
consisting of 30 s at 95°C, 45 s at 56°C and 1 min at 72°C with a detection step at the
end of each cycle. ß-AOB amoA qPCR is performed in the same manner but with 0.3
µM of each primer, Failsafe Green Premix F (Epicentre), and no addition of BSA or
MgCl2. The PCR protocol is as follows: 5 min at 95°C, then 34 cycles consisting of
45 s at 94°C, 30 s at 56°C, 1 min at 72°C and a detection step for 10 s at 80.5°C.
Other Potential Target Genes for Ammonia-Oxidizers
The sheer number of amoA sequences in GenBank (e.g., currently over 8,000
archaeal amoA sequences) makes these genes excellent candidates for phylogenetic

35
and quantitative studies. However, there are also a number of other genes that can
potentially be used to target ammonia-oxidizers. Primers have been designed to
amplify the amoB and amoC subunits of the ammonia monooxygenase enzyme for
both AOA and AOB (Purkhold et al., 2000; Norton et al., 2002; Könneke et al., 2005;
Junier et al., 2008b; Junier et al., 2008a). Genes encoding other enzymes involved in
key nitrogen transformations have been amplified from AOB, including the copper-
containing dissimilatory nitrite reductase gene (nirK; Casciotti and Ward, 2001) and
the nitric oxide reductase gene (norB; Casciotti and Ward, 2005). However, primers
for these genes must to be optimized for qPCR assays to ensure that they are only
targeting AOB, while still capturing the full range of sequence diversity within AOB.
Notably, putative nirK homologues have recently been identified in marine (Walker et
al., 2010), low-salinity (Blainey et al., 2011), and soil AOA (Treusch et al., 2005;
Bartossek et al., 2010), which may prove to be powerful molecular markers for
characterizing and quantifying AOA in marine and estuarine systems (Lund and
Francis, unpublished).
Beyond nitrogen cycling genes, carbon fixation genes can also be targeted for
phylogenetic and quantitative studies of ammonia-oxidizers. While RuBisCO genes
can be used to examine AOB (Sinigalliano et al., 2001; Utåker et al., 2002), AOA
apparently lack RuBisCO genes (Hallam et al., 2006; Walker et al., 2010; Blainey et
al., 2011). Instead, genes encoding the acetyl-CoA carboxylase enzyme (e.g., accC)
involved in the 3-hydroxypropionate/4-hydroxybutyrate autotrophic carbon fixation
cycle have been used as molecular markers for CO2 assimilation linked to archaeal
autotrophy (Auguet et al., 2008). While this enzyme is found in all sequenced AOA

36
genomes (Hallam et al., 2006; Walker et al., 2010; Blainey et al., 2011), it is also
found in other (non-ammonia-oxidizing) crenarchaea, so the primer sets should be
further refined for a qPCR assay specific to the AOA. In general, we prefer using C-
cycling functional genes as a complement to (rather than a replacement for) amoA-
based quantitiave analyses of AOA and AOB in marine and coastal systems, as amoA
genes are directly linked to the process of ammonia oxidation.
Methodological Considerations
It is important to note that different DNA extraction protocols may yield
different gene copy numbers. For instance, Leininger et al. (2006) demonstrated that
the use of different bead-beating times yielded different abundances of AOA and AOB
amoA gene copies. In four different soil samples, bead-beating times of 30 s for
quantification of AOA amoA and between 120-150 s for quantification of bacterial
amoA yielded the highest abundances. Thus, care should be taken when comparing
absolute copy numbers across different samples and/or studies, however, general
patterns and trends can still yield valuable insights into the dynamics of microbial
populations.
PCR inhibition should also be considered in quantitative assays. The effects of
inhibition can be seen by comparing the amplification of a positive control with the
amplification of the positive control plus environmental template: inhibitors in the
environmental template would decrease the amplification efficiency of the positive
control. Additionally, PCR inhibition can be detected by screening amplification of
varying concentrations of template DNA (e.g., 0.5, 1, 5, 10 ng): the presence of
37
inhibitors at higher DNA concentrations can result in lower quantification values.
When setting up a new qPCR experiment, careful consideration should be
given to primer and probe choice and design. The specificity of the primers/probes is
critical to ensure that the assay only quantifies the target gene of interest. If the
primers are too specific, the qPCR results will underestimate the abundance of the
target gene; however, if the primers are too broad, various non-target sequences will
be amplified (e.g., amplify both amoA and pmoA sequences) and abundance will be
overestimated. We design new primers/probes (generally between 15-30 bp in length)
by manually visualizing a multi-sequence nucleotide alignment and determining
candidate oligonucleotide regions. After taking G+C content, potential secondary
structure, and annealing temperature into consideration, we run a BLAST search on
the primer/probe sequences to determine which targets they might anneal to.
Candidate primers/probes are then scanned against the entire database of sequences
using ARB to determine specificity in silico.
The qPCR assay and thermal cycle program are then optimized. Particular
attention is given to the choice of qPCR premix, primer/probe concentrations, and
MgCl2 concentrations. A variety of qPCR premixes are commercially available (e.g.,
Epicentre’s Failsafe Green Premix A-L, Invitrogen’s AccuPrime SuperMix I-II,
Applied Biosystem’s Power SYBR Green PCR Master Mix, etc.) and each is made
with a proprietary recipe with varying concentrations of MgCl2, PCR enhancers (e.g.,
betaine), BSA, dNTPs, etc. Therefore, it is necessary to test several different premixes
when optimizing a new qPCR assay because some will undoubtedly work better than
others. Primer concentrations influence the amplification efficiency and specificity of

38
the reaction. Low concentrations can decrease PCR efficiency, whereas high
concentrations can cause nonspecific priming and primer-dimer formation. MgCl2
concentrations influence DNA polymerase activity and fidelity, DNA denaturation
temperature, primer annealing, PCR specificity, and primer-dimer formation.
Generally speaking, excess magnesium can cause non-specific amplification and
insufficient magnesium reduces the overall yield. Finally, it is imperative to sequence
the amplification products from the qPCR assay to ensure that only the product of
interest is amplified under the optimized conditions.
Fluorescent in situ hybridization (FISH) is an alternative approach for
quantifying AOA and AOB in marine and coastal systems. FISH requires 16S rRNA
gene probes that have high specificity for AOA or AOB and yet capture the full
phylogenetic diversity with each group. Functional gene- and mRNA-based FISH
approaches are in development but are still not widely accessible. We prefer to use
qPCR to quantify AOA and AOB because of the high throughput nature of the
method, the ability to rapidly examine multiple genes/organisms in the same samples,
and the ease of use with multiple sample types (e.g., sediment, water column, soil).
Targeting Specific Ecotypes: Quantifying Shallow and Deep Clades of Marine
Water Column AOA
The vast majority of archaeal amoA genes from marine water columns fall into
two phylogenetically distinct clades: group A and group B (first identified by Francis
et al., 2005). These clades are distinct from N. maritimus, which falls in the
marine/coastal sediment clade (approximately 82% nucleotide identity between group

39
A and N. maritimus amoA sequences and 75% between group B and N. maritimus).
Group A amoA sequences appear to represent a primarily surface water ecotype
(predominately found at depths <200 m) and group B amoA sequences represent a
deep-water ecotype (predominately found at depths >200 m) (Hallam et al., 2006;
Mincer et al., 2007; Beman et al., 2008; Santoro et al., 2010). Crenarchaeal depth-
specific groups have also been identified from phylogenetic analyses of 16S rRNA
sequences (García-Martínez and Rodríguez-Valera, 2000; Massana et al., 2000). The
deep group B AOA are predominantly found in waters below ~200 m but they may
periodically be transported to the surface waters during upwelling events. In the
central California Current (off the coast of Monterey Bay), the deep group B amoA
sequences were abundant in clone libraries from the upper water column (25–100 m)
at a site experiencing upwelling, whereas group B sequences comprised only a small
percentage of the sequences (down to 150 m) at an offshore site without upwelling
(Santoro et al., 2010). Interestingly, deep group B amoA gene transcripts were not
detected at 25 m depth at the upwelling site, suggesting that these AOA may indeed be
specifically adapted to deep waters (Santoro et al., 2010).
In a study of the water column of the Gulf of California—a biologically
productive subtropical sea bordered by the Baja California peninsula and mainland
Mexico—Beman et al. (2008) designed amoA PCR primers/assays to specifically
quantify shallow (group A) versus deep (group B) clades of planktonic AOA, using
SYBR Green reaction chemistry (Table 1). Clade-specific qPCR analysis using these
assays revealed that AOA communities in the upper water column (0–100 m) were
composed exclusively of group A. In contrast, group B amoA genes comprised over

40
50% of the archaeal amoA copies within most of the deeper sampling depths within
the oxygen minimum zone (300-650m). Notably, the sum of the group A and B
assays correlated with the general AOA amoA qPCR assay (r2=0.89, slope=1.15).
Thus, although the extensively used Arch-amoAF/R primer set was designed based on
a limited number of sequences (Francis et al., 2005) and undoubtedly miss some
archaeal amoA sequences (de la Torre et al., 2008), these primers still work
remarkably well as a general proxy for AOA.
For certain applications (e.g., high-throughput and/or automated qPCR
screening), it is particularly useful, if not essential, to have TaqMan assays available
for quantifying specific genes of interest. Toward this end, we have designed
TaqMan-based qPCR assays to target the shallow group A and deep group B archaeal
amoA clades. The assays are specific for amoA sequence types from each group with
no cross-amplification. For both assays, the qPCR protocol is as follows: 94°C for 75
s, then 42 cycles consisting of 94°C for 15 s and 55°C for 30 s. Each 25 µL reaction
contains: 12.5 µL AccuPrime™ SuperMix I (Invitrogen), 1 µL template DNA, 2.5
mM MgCl2, forward primer, reverse primer, and probe. Primers and probes for the
individual assays are shown in Table 1.
In addition to standard qPCR analyses, these AOA qPCR assays can be
deployed on the Environmental Sample Processor (ESP; Scholin et al., 2001; Scholin
et al., 2009; http://www.mbari.org/ESP/). The ESP is a field-deployable system that
can quantify specific genes of interest (Scholin et al., 2009;
http://www.mbari.org/esp/mfb/mfb.htm; http://www.mbari.org/ESP/PCR/pcr.htm),
detect 16S rRNAs without amplification (recently demonstrated in Monterey Bay, CA;

41
Preston et al., 2009), and measure relevant environmental parameters using bundled
chemical and physical sensors. In collaboration with Christopher Scholin's group
(MBARI), our qPCR assays are being used on the ESP to assess fine scale variations
in the abundance of the shallow group A and deep group B archaeal amoA clades in
surface and deep waters in Monterey Bay, CA. Preliminary data shows that at 891
meters, deep group B archaeal amoA gene copies are several orders of magnitude
more abundant than the shallow group A clade (Figure 1). The abundance of both the
shallow and deep clades fluctuates significantly over time (Figure 1). Persistent
measurements of these amoA genes in Monterey Bay and elsewhere will illuminate
marine AOA dynamics on a time continuum that cannot be captured by traditional
discrete shipboard sampling. Quantitative data generated by the ESP has the potential
to refine, if not dramatically change, our understanding of the molecular microbial
ecology of the oceanic nitrogen cycle.
Acknowledgments
We thank two anonymous reviewers for constructive feedback on this
manuscript and Christopher Scholin for useful comments on the ESP text. We also
thank both Christopher Scholin and Christina Preston for providing access to samples
collected in Monterey Bay. This work was supported in part by National Science
Foundation grants MCB-0604270, OCE-0825363, and OCE-0847266 (to C.A.F.), as
well as an EPA STAR Graduate Fellowship (to A.C.M.).
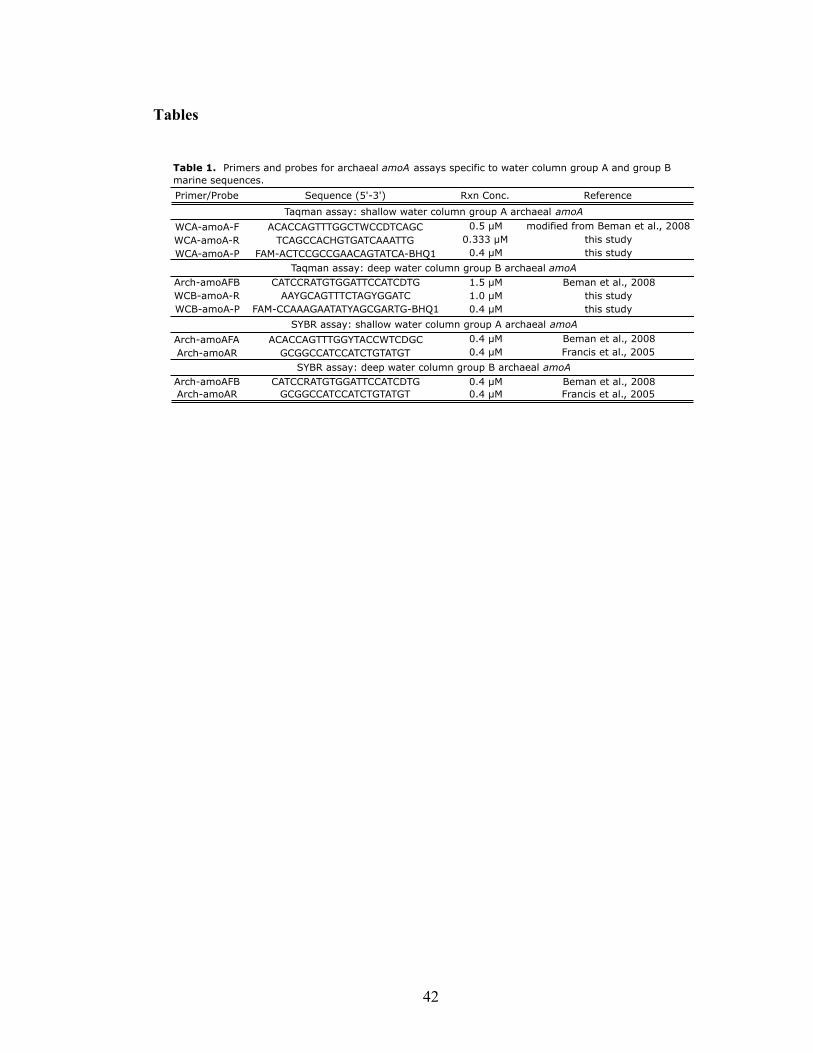
42
Tables
Primer/Probe Sequence (5'-3') Rxn Conc. Reference
WCA-amoA-F ACACCAGTTTGGCTWCCDTCAGC 0.5 !M modified from Beman et al., 2008
WCA-amoA-R TCAGCCACHGTGATCAAATTG 0.333 !M this study
WCA-amoA-P FAM-ACTCCGCCGAACAGTATCA-BHQ1 0.4 !M this study
Arch-amoAFB CATCCRATGTGGATTCCATCDTG 1.5 !M Beman et al., 2008
WCB-amoA-R AAYGCAGTTTCTAGYGGATC 1.0 !M this study
WCB-amoA-P FAM-CCAAAGAATATYAGCGARTG-BHQ1 0.4 !M this study
Arch-amoAFA ACACCAGTTTGGYTACCWTCDGC 0.4 !M Beman et al., 2008
Arch-amoAR GCGGCCATCCATCTGTATGT 0.4 !M Francis et al., 2005
Arch-amoAFB CATCCRATGTGGATTCCATCDTG 0.4 !M Beman et al., 2008
Arch-amoAR GCGGCCATCCATCTGTATGT 0.4 !M Francis et al., 2005
Taqman assay: deep water column group B archaeal amoA
SYBR assay: shallow water column group A archaeal amoA
SYBR assay: deep water column group B archaeal amoA
Taqman assay: shallow water column group A archaeal amoA
Table 1. Primers and probes for archaeal amoA assays specific to water column group A and group B
marine sequences.
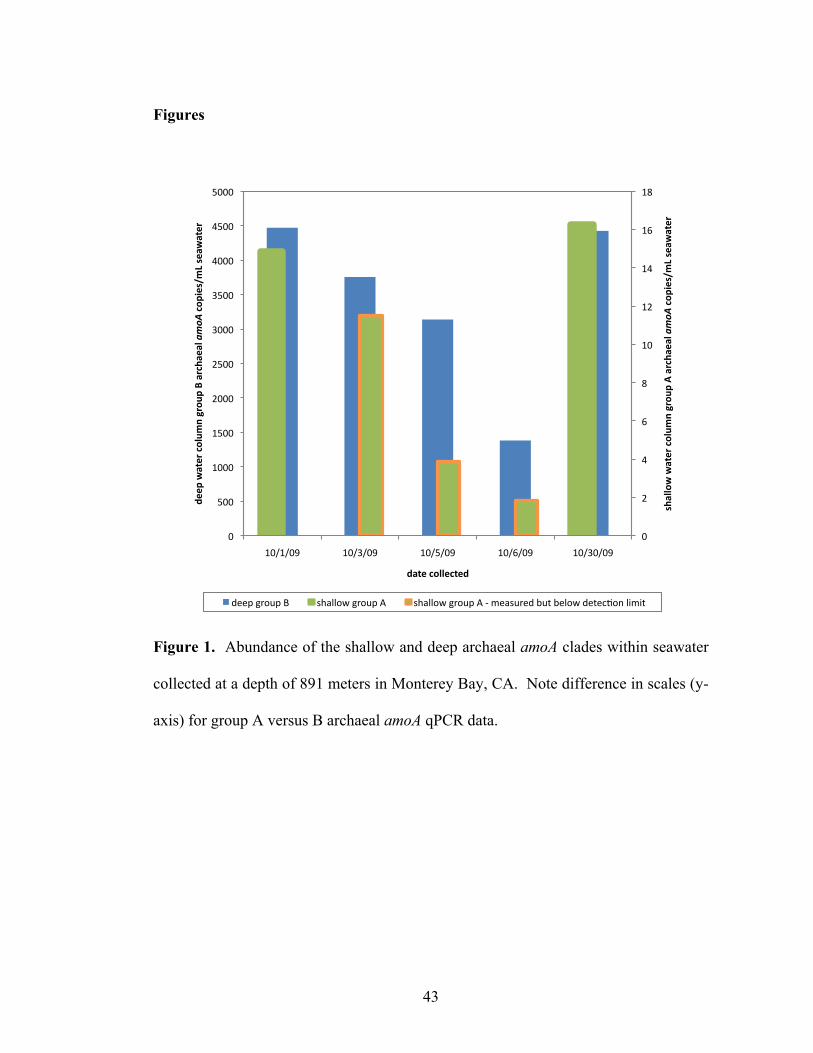
43
Figures
Figure 1. Abundance of the shallow and deep archaeal amoA clades within seawater
collected at a depth of 891 meters in Monterey Bay, CA. Note difference in scales (y-
axis) for group A versus B archaeal amoA qPCR data.
!"
#"
$"
%"
&"
'!"
'#"
'$"
'%"
'&"
!"
(!!"
'!!!"
'(!!"
#!!!"
#(!!"
)!!!"
)(!!"
$!!!"
$(!!"
(!!!"
'!*'*!+" '!*)*!+" '!*(*!+" '!*%*!+" '!*)!*!+"
!"#$$%&'&#()*'+%$,-.'/*%,0'1'#*+"#)#$'!"#$%+%02)!3-4'!)#&#()*'
5))0'&#()*'+%$,-.'/*%,0'6'#*+"#)#$'!"#$%+%02)!3-4'!)#&#()*'
5#()'+%$$)+()5'
,--."/012."3" 4567718"/012."9" 4567718"/012."9":";-6420-,"<2="<-718",-=->?1@"7A;A="

44
Literature Cited
Abell, G.C.J., Revill, A.T., Smith, C., Bissett, A.P., Volkman, J.K., and Robert, S.S.
(2010) Archaeal ammonia oxidizers and nirS-type denitrifiers dominate sediment
nitrifying and denitrifying populations in a subtropical macrotidal estuary. The ISME
Journal 4: 286-300.
Agogué, H., Brink, M., Dinasquet, J., and Herndl, G.J. (2008) Major gradients in
putatively nitrifying and non-nitrifying Archaea in the deep North Atlantic. Nature
456: 788-791.
Auguet, J.-C., Borrego, C.M., Bañeras, L., and Casamayor, E.O. (2008) Fingerprinting
the genetic diversity of the biotin carboxylase gene (accC) in aquatic ecosystems as a
potential marker for studies of carbon dioxide assimilation in the dark. Environmental
Microbiology 10: 2527-2536.
Bartossek, R., Nicol, G.W., Lanzen, A., Klenk, H.-P., and Schleper, C. (2010)
Homologues of nitrite reductases in ammonia-oxidizing archaea: diversity and
genomic context. Environmental Microbiology 12: 1075-1088.
Beman, J.M., and Francis, C.A. (2006) Diversity of ammonia-oxidizing archaea and
bacteria in the sediments of a hypernutrified subtropical estuary: Bahia del Tobari,
Mexico. Applied and Environmental Microbiology 72: 7767-7777.
45
Beman, J.M., Popp, B.N., and Francis, C.A. (2008) Molecular and biogeochemical
evidence for ammonia oxidation by marine Crenarchaeota in the Gulf of California.
The ISME Journal 2: 429-441.
Beman, J.M., Sachdeva, R., and Fuhrman, J.A. (2010) Population ecology of
nitrifying Archaea and Bacteria in the Southern California Bight. Environmental
Microbiology 12: 1282-1292.
Bernhard, A.E., Donn, T., Giblin, A.E., and Stahl, D.A. (2005) Loss of diversity of
ammonia-oxidizing bacteria correlates with increasing salinity in an estuary system.
Environmental Microbiology 7: 1289-1297.
Bernhard, A.E., Landry, Z.C., Blevins, A., De La Torre, J.R., Giblin, A.E., and Stahl,
D.A. (2010) Abundance of ammonia-oxidizing archaea and bacteria along an estuarine
salinity gradient in relation to potential nitrification rates. Applied and Environmental
Microbiology 76: 1285-1289.
Bricker, S.B., Clement, C., Pirhalla, D., Orlando, S., and Farrow, D. (1999) National
Estuarine Eutrophication Assessment: Effects of Nutrient Enrichment in the Nation's
Estuaries. NOAA, National Ocean Service, Special Projects Office and the National
Centers for Coastal Ocean Science Silver Spring, MD: 71.
46
Caffrey, J.M., Bano, N., Kalanetra, K., and Hollibaugh, J.T. (2007) Ammonia
oxidation and ammonia-oxidizing bacteria and archaea from estuaries with differing
histories of hypoxia. The ISME Journal 1: 660-662.
Casciotti, K.L., and Ward, B.B. (2001) Dissimilatory nitrite reductase genes from
autotrophic ammonia-oxidizing bacteria. Applied and Environmental Microbiology
67: 2213-2221.
Casciotti, K.L., and Ward, B.B. (2005) Phylogenetic analysis of nitric oxide reductase
gene homologues from aerobic ammonia-oxidizing bacteria. FEMS Microbiology
Ecology 52: 197-205.
Church, M., Wai, B., Karl, D., and Delong, E. (2010) Abundances of crenarchaeal
amoA genes and transcripts in the Pacific Ocean. Environmental Microbiology 12:
679-688.
de la Torre, J.R., Walker, C.B., Ingalls, A.E., Konneke, M., and Stahl, D.A. (2008)
Cultivation of a thermophilic ammonia oxidizing archaeon synthesizing crenarchaeol.
Environmental Microbiology 10: 810-818.
De Corte, D., Yokokawa, T., Varela, M.M., Agogué, H., Herndl, G.J. (2009) Spatial
distribution of Bacteria and Archaea and amoA gene copy numbers throughout the
water column of the Eastern Mediterranean Sea. The ISME Journal 3: 147-158.

47
Dang, H., Li, J., Chen, R., Wang, L., Guo, L., Zhang, Z., and Klotz, M.G. (2010)
Diversity, abundance, and spatial distribution of sediment ammonia-oxidizing
Betaproteobacteria in response to environmental gradients and coastal eutrophication
in Jiaozhou Bay, China. Applied And Environmental Microbiology 76: 4691-4702.
Dore, J.E., Popp, B.N., Karl, D.M., and Sansone, F.J. (1998) A large source of
atmospheric nitrous oxide from subtropical North Pacific surface waters. Nature 396:
63-66.
Erguder, T., Boon, N., Wittebolle, L., Marzorati, M., and Verstraete, W. (2009)
Environmental factors shaping the ecological niches of ammonia-oxidizing archaea.
FEMS Microbiology Reviews 33: 855-869.
Francis, C.A., O'Mullan, G.D., and Ward, B.B. (2003) Diversity of ammonia
monooxygenase (amoA) genes across environmental gradients in Chesapeake Bay
sediments. Geobiology 1: 129-140.
Francis, C.A., Roberts, K.J., Beman, J.M., Santoro, A.E., and Oakley, B.B. (2005)
Ubiquity and diversity of ammonia-oxidizing archaea in water columns and sediments
of the ocean. Proceedings of the National Academy of Sciences 102: 14683-14688.
48
Freitag, T.E., Chang, L., and Prosser, J.I. (2006) Changes in the community structure
and activity of betaproteobacterial ammonia-oxidizing sediment bacteria along a
freshwater-marine gradient. Environmental Microbiology 8: 684-696.
García-Martínez, J., and Rodríguez-Valera, F. (2000) Microdiversity of uncultured
marine prokaryotes: the SAR11 cluster and the marine Archaea of Group I. Molecular
Ecology 9: 935-948.
Hallam, S.J., Mincer, T.J., Schleper, C., Preston, C.M., Roberts, K., Richardson, P.M.,
and DeLong, E.F. (2006) Pathways of carbon assimilation and ammonia oxidation
suggested by environmental genomic analyses of marine Crenarchaeota. PLoS Biology
4: e95.
Herndl, G.J., Reinthaler, T., Teira, E., van Aken, H., Veth, C., Pernthaler, A., and
Pernthaler, J. (2005) Contribution of Archaea to total prokaryotic production in the
deep Atlantic Ocean. Applied and Environmental Microbiology 71: 2303-2309.
Junier, P., Kim, O.-S., Hadas, O., Imhoff, J.F., and Witzel, K.-P. (2008a) Evaluation
of PCR primer selectivity and phylogenetic specificity by using amplification of 16S
rRNA genes from betaproteobacterial ammonia-oxidizing bacteria in environmental
samples. Applied and Environmental Microbiology 74: 5231-5236.
49
Junier, P., Kim, O.S., Molina, V., Limburg, P., Junier, T., Imhoff, J.F., and Witzel,
K.P. (2008b) Comparative in silico analysis of PCR primers suited for diagnostics and
cloning of ammonia monooxygenase genes from ammonia-oxidizing bacteria. FEMS
Microbiology Ecology 64: 141-152.
Karl, D.M. (2007) Microbial oceanography: paradigms, processes and promise.
Nature Reviews Microbiology 5: 759-769.
Karner, M.B., DeLong, E.F., and Karl, D.M. (2001) Archaeal dominance in the
mesopelagic zone of the Pacific Ocean. Nature 409: 507-510.
Kirchman, D.L., Elifantz, H., Dittel, A.I., Malmstrom, R.R., and Cottrell, M.T. (2007)
Standing stocks and activity of Archaea and Bacteria in the western Arctic Ocean.
Limnology and Oceanography 52: 495-507.
Könneke, M., Bernhard, A.E., de la Torre, J.R., Walker, C.B., Waterbury, J.B., and
Stahl, D.A. (2005) Isolation of an autotrophic ammonia-oxidizing marine archaeon.
Nature 437: 543-546.
Konstantinidis, K.T., Braff, J., Karl, D.M., and Delong, E.F. (2009) Comparative
metagenomic analysis of a microbial community residing at a depth of 4,000 meters at
station ALOHA in the North Pacific subtropical gyre. Applied and Environmental
Microbiology 75: 5345-5355.

50
Lam, P., Lavik, G., Jensen, M.M., van de Vossenberg, J., Schmid, M., Woebken, D.,
et al. (2009) Revising the nitrogen cycle in the Peruvian oxygen minimum zone.
Proceedings of the National Academy of Sciences 106: 4752-4757.
Leininger, S., Urich, T., Schloter, M., Schwark, L., Qi, J., Nicol, G.W. et al. (2006)
Archaea predominate among ammonia-oxidizing prokaryotes in soils. Nature 442:
806-809.
Ludwig, W., Strunk, O., Westram, R., Richter, L., Meier, H., Yadhukumar et al.
(2004) ARB: a software environment for sequence data. Nucleic Acids Research 32:
1363-1371.
Magalhaes, C.M., Machado, A., and Bordalo, A.A. (2009) Temporal variability in the
abundance of ammonia-oxidizing bacteria vs. archaea in sandy sediments of the Douro
River estuary, Portugal. Aquatic Microbial Ecology 56: 13-23.
Martens-Habbena, W., Berube, P.M., Urakawa, H., de La Torre, J.R., and Stahl, D.A.
(2009) Ammonia oxidation kinetics determine niche separation of nitrifying Archaea
and Bacteria. Nature 461: 976-979.
51
Massana, R., DeLong, E.F., and Pedrós-Alió, C. (2000) A few cosmopolitan
phylotypes dominate planktonic archaeal assemblages in widely different oceanic
provinces. Applied and Environmental Microbiology 66: 1777-1787.
Mincer, T.J., Church, M.J., Taylor, L.T., Preston, C.M., Karl, D.M., and DeLong, E.F.
(2007) Quantitative distribution of presumptive archaeal and bacterial nitrifiers in
Monterey Bay and the North Pacific Subtropical Gyre. Environmental Microbiology 9:
1162-1175.
Moin, N.S., Nelson, K.A., Bush, A., and Bernhard, A.E. (2009) Distribution and
diversity of archaeal and bacterial ammonia oxidizers in salt marsh sediments. Applied
and Environmental Microbiology 75: 7461-7468.
Mosier, A.C., and Francis, C.A. (2008) Relative abundance and diversity of ammonia-
oxidizing archaea and bacteria in the San Francisco Bay estuary. Environmental
Microbiology 10: 3002-3016.
Norton, J.M., Alzerreca, J.J., Suwa, Y., and Klotz, M.G. (2002) Diversity of ammonia
monooxygenase operon in autotrophic ammonia-oxidizing bacteria. Archives of
Microbiology 177: 139-149.
Okano, Y., Hristova, K.R., Leutenegger, C.M., Jackson, L.E., Denison, R.F.,
Gebreyesus, B. et al. (2004) Application of real-time PCR to study effects of
52
ammonium on population size of ammonia-oxidizing bacteria in soil. Applied And
Environmental Microbiology 70: 1008-1016.
Ouverney, C.C., and Fuhrman, J.A. (2000) Marine planktonic archaea take up amino
acids. Applied and Environmental Microbiology 66: 4829-4833.
Preston, C.M., Marin, R., Jensen, S.D., Feldman, J., Birch, J.M., Massion, E.I. et al.
(2009) Near real-time, autonomous detection of marine bacterioplankton on a coastal
mooring in Monterey Bay, California, using rRNA-targeted DNA probes.
Environmental Microbiology 11: 1168-1180.
Purkhold, U., Pommerening-Roser, A., Juretschko, S., Schmid, M.C., Koops, H-.P.,
and Wagner, M. (2000) Phylogeny of all recognized species of ammonia oxidizers
based on comparative 16S rRNA and amoA sequence analysis: implications for
molecular diversity surveys. Applied and Environmental Microbiology 66: 5368-5382.
Rotthauwe, J.H., Witzel, K.P., and Liesack, W. (1997) The ammonia monooxygenase
structural gene amoA as a functional marker: Molecular fine-scale analysis of natural
ammonia-oxidizing populations. Applied and Environmental Microbiology 63: 4704-
4712.
Santoro, A.E., Francis, C.A., de Sieyes, N.R., and Boehm, A.B. (2008) Shifts in the
relative abundance of ammonia-oxidizing bacteria and archaea across
53
physicochemical gradients in a subterranean estuary. Environmental Microbiology 10:
1068-1079.
Santoro, A.E., Casciotti, K.L., and Francis, C.A. (2010) Activity, abundance and
diversity of nitrifying archaea and bacteria in the central California Current.
Environmental Microbiology 12: 1989-2006.
Scholin, C.A., Massion, E.I., Wright, D.K., Cline, D.E., Mellinger, E., and Brown, M.
(2001) Aquatic Autosampler Device. US patent 6187530.
Scholin, C.A., Doucette, G.J., Jensen, S., Roman, B., Pargett, D., Marin, R. et al.
(2009) Remote detection of marine microbes, small invertebrates, harmful algae, and
biotoxins using the Environmental Sample Processor (ESP). Oceanography 22: 158-
167.
Seitzinger, S.P. (1988) Denitrification in freshwater and coastal marine ecosystems:
Ecological and geochemical significance. Limnology and Oceanography 33: 702-724.
Sinigalliano, C.D., Kuhn, D.N., Jones, R.D., and Guerrero, M.A. (2001) In situ reverse
transcription to detect the cbbL gene and visualize RuBisCO in chemoautotrophic
nitrifying bacteria. Lett Appl Microbiol 32: 388-393.

54
Stephen, J.R, Chang, Y.J., Macnaughton, S.J., Kowalchuk, G.A., Leung, K.T.,
Flemming, C.A., and White, D.C. (1999) Effect of toxic metals on indigenous soil
beta-subgroup proteobacterium ammonia oxidizer community structure and protection
against toxicity by inoculated metal-resistant bacteria. Applied and Environmental
Microbiology 65: 95-101.
Teira, E., Lebaron, P., van Aken, H., and Herndl, G.J. (2006) Distribution and activity
of Bacteria and Archaea in the deep water masses of the North Atlantic. Limnology
and Oceanography 51: 2131-2144.
Treusch, A.H, Leininger, S., Kletzin, A., Schuster, S.C., Klenk, H-.P., and Schleper,
C. (2005) Novel genes for nitrite reductase and Amo-related proteins indicate a role of
uncultivated mesophilic crenarchaeota in nitrogen cycling. Environmental
Microbiology 7: 1985-1995.
Utåker, J.B., Andersen, K., Aakra, A., Moen, B., and Nes, I.F. (2002) Phylogeny and
functional expression of ribulose 1,5-bisphosphate carboxylase/oxygenase from the
autotrophic ammonia-oxidizing bacterium Nitrosospira sp. isolate 40KI. Journal Of
Bacteriology 184: 468-478.
Varela, M.M., van Aken, H.M., Sintes, E., and Herndl, G.J. (2008) Latitudinal trends
of Crenarchaeota and Bacteria in the meso- and bathypelagic water masses of the
Eastern North Atlantic. Environmental Microbiology 10: 110-124.
55
Walker, C.B., La Torre, J.R.D., Klotz, M.G., Urakawa, H., Pinel, N., Arp, D.J. et al.
(2010) Nitrosopumilus maritimus genome reveals unique mechanisms for nitrification
and autotrophy in globally distributed marine crenarchaea. Proceedings of the
National Academy of Sciences 107: 8818-8823.
Wankel, S.D., Kendall, C., Pennington, J.T., Chavez, F.P., and Paytan, A. (2007)
Nitrification in the euphotic zone as evidenced by nitrate dual isotopic composition:
Observations from Monterey Bay, California. Global Biogeochemical Cycles 21:
GB2009.
Wankel, S.D., Mosier, A.C., Hansel, C.M., Paytan, A., and Francis, C.A. Spatial
variability in nitrification rates and ammonia-oxidizing microbial communities in the
agriculturally-impacted Elkhorn Slough estuary. In revision.
Wuchter, C., Abbas, B., Coolen, M.J.L., Herfort, L., van Bleijswijk, J., Timmers, P. et
al. (2006) Archaeal nitrification in the ocean. Proceedings of the National Academy of
Sciences 103: 12317-12322.
Yool, A., Martin, A.P., Fernandez, C., and Clark, D.R. (2007) The significance of
nitrification for oceanic new production. Nature 447: 999-1002.
56
Chapter 3. Relative abundance and diversity of ammonia-oxidizing archaea and bacteria in the San Francisco Bay estuary Annika C. Mosier1 and Christopher A. Francis1
1Department of Environmental Earth System Science, Stanford University, Stanford, CA 94305-4216, USA
Published as: Mosier, A.C., and C.A. Francis. 2008. Relative abundance and diversity of ammonia-oxidizing archaea and bacteria in the San Francisco Bay estuary. Environmental Microbiology 10(11): 3002-3016.

57
Abstract
Ammonia oxidation in marine and estuarine sediments plays a pivotal role in
the cycling and removal of nitrogen. Recent reports have shown that the newly
discovered ammonia-oxidizing archaea can be both abundant and diverse in aquatic
and terrestrial ecosystems. In this study, we examined the abundance and diversity of
ammonia-oxidizing archaea (AOA) and betaproteobacteria (β-AOB) across
physicochemical gradients in San Francisco Bay—the largest estuary on the west coast
of the United States of America. In contrast to reports that AOA are far more
abundant than β-AOB in both terrestrial and marine systems, our quantitative PCR
estimates indicated that β-AOB amoA (encoding ammonia monooxygenase subunit A)
copy numbers were greater than AOA amoA in most of the estuary. AOA were only
more pervasive than β-AOB in the low-salinity northern region of the estuary. Both
AOA and β-AOB communities exhibited distinct spatial structure within the estuary.
AOA amoA sequences from the north part of the estuary formed a large and distinct
low-salinity phylogenetic group. The majority of the β-AOB sequences were closely
related to other marine/estuarine Nitrosomonas-like and Nitrosospira-like sequences.
Both ammonia-oxidizer community composition and abundance were strongly
correlated with salinity. Ammonia-oxidizing enrichment cultures contained AOA and
β-AOB amoA sequences with high similarity to environmental sequences. Overall,
this study significantly enhances our understanding of estuarine ammonia-oxidizing
microbial communities and highlights the environmental conditions and niches under
which different AOA and β-AOB phylotypes may thrive.
58
Introduction
Anthropogenic influence on the global nitrogen cycle has resulted in a suite of
environmental problems including global acidification, loss of biodiversity, increased
concentrations of the potent greenhouse gas N2O, and eutrophication of terrestrial and
aquatic systems (Vitousek et al., 1997; Gruber and Galloway, 2008). Eutrophication
is of particular concern in estuaries—over half of the estuaries in the United States of
America experience its effects (82 of 138 studied; Bricker et al., 1999). Harmful
levels of nitrogen (N) in estuaries can be diminished through tightly coupled processes
in the microbial nitrogen cycle; nitrification converts ammonia to nitrite and nitrate,
which can then be lost to the atmosphere as N2 gas via denitrification or anammox.
Coupled nitrification-denitrification removes up to 50% of external dissolved
inorganic nitrogen (DIN; ammonium, nitrate, and nitrite) inputs to estuaries
(Seitzinger et al., 2006), thereby reducing the risk of eutrophication. The fate of
excess nitrogen in estuaries is thus determined by the microbially-driven nitrogen
cycle and yet recent discoveries suggest that our understanding of these processes is
deficient (Francis et al., 2007).
Removal of DIN from aquatic systems is often directly dependent on the
supply of products from nitrification (Jensen et al., 1993; Jensen et al., 1994). It has
long been assumed that the most important contributors to ammonia oxidation—the
first and rate-limiting step in nitrification—are two groups of ammonia-oxidizing
bacteria (AOB): the betaproteobacteria (β-AOB) from the genus Nitrosomonas and
Nitrosospira (e.g., Head et al., 1993; Purkhold et al., 2000; Purkhold et al., 2003) and
gammaproteobacteria (γ-AOB) from the genus Nitrosococcus (e.g., Ward and

59
O'Mullan, 2002). Distinct groups of Nitrosospira-like and Nitrosomonas-like AOB
(uncultivated as of yet) are commonly detected in marine and estuarine systems (e.g.,
Francis et al., 2003; Bernhard et al., 2005; O'Mullan and Ward, 2005). Recently, a
combination of metagenomic and genomic analyses (Venter et al., 2004; Treusch et
al., 2005; Hallam et al., 2006b; Hallam et al., 2006a) and the cultivation of a novel
ammonia-oxidizing marine crenarchaeote (Könneke et al., 2005) revealed strong
evidence for nitrification within the domain Archaea, including identification of genes
putatively encoding archaeal ammonia monooxygenase subunits (amoA, amoB, and
amoC). Active gene expression of archaeal amoA has since been detected in
enrichment cultures (Hatzenpichler et al., 2008; Santoro et al., 2008), microcosms
(Treusch et al., 2005), and the natural environment (Treusch et al., 2005; Leininger et
al., 2006; Lam et al., 2007).
The abundance of open ocean Crenarchaeota (~1.0 x 1028 cells, equivalent to
20% of picoplankton in the global ocean; Karner et al., 2001) and the demonstration
that >80% of the archaeal metabolism in the deep ocean is autotrophic (Ingalls et al.,
2006) implies that AOA may be significant contributors to ammonia oxidation in
marine settings. Indeed, archaeal amoA genes are found in marine water columns and
sediments (Francis et al., 2005; Wuchter et al., 2006; Herfort et al., 2007; Lam et al.,
2007; Mincer et al., 2007; Nakagawa et al., 2007; Beman et al., 2008), estuaries
(Francis et al., 2005; Beman and Francis, 2006; Caffrey et al., 2007), and a coastal
aquifer (Francis et al., 2005; Santoro et al., 2008). Archaeal amoA gene copy numbers
are greater than bacterial amoA in the North Atlantic and North Sea (Wuchter et al.,
2006), Monterey Bay and Hawaii (Mincer et al., 2007), the Japan Sea (Nakagawa et
60
al., 2007), the Gulf of California (Beman et al., 2008) and several estuaries (Caffrey et
al., 2007). The dynamics of these two distinct ammonia-oxidizing groups (AOA and
AOB) are likely to be complex—as they compete for a common substrate and
ecological niche—and additional studies are needed to discern the specific physical
and geochemical conditions under which AOA or AOB are more abundant and/or
diverse.
Natural gradients of salinity, nutrients, dissolved oxygen, temperature,
turbidity and substrate, amongst others, make estuaries ideal systems in which to
address such questions. In the present study, we examined the abundance and
diversity of AOA and β-AOB (based on amoA genes) in sediments of San Francisco
Bay, the largest estuary on the west coast of the United States of America
(encompassing nearly 178,000 km2). San Francisco Bay’s historical resistance to the
harmful consequences of nutrient enrichment has recently weakened due to changes in
interdecadal oceanic regimes (Cloern et al., 2007), making microbial cycling of the
large standing stock of DIN even more important. We analyzed sediments from sites
spanning a range of physical and chemical conditions in the Bay allowing us to
examine spatial, geochemical and temporal (between two summers) effects on
ammonia-oxidizer community structure and abundance.
Results and Discussion
Environmental setting
San Francisco Bay effectively connects two individual estuaries to the Pacific
Ocean (Fig. 1). The northern portion of the bay—encompassing classic estuarine
61
gradients of salinity and nutrients—originates at the San Joaquin and Sacramento
River Delta, which drains approximately 40% of the area of the entire state of
California. The southern half of the bay is considered a weakly mixed lagoonal
system with wastewater treatment plant effluent as the primary source of freshwater
(Hager and Schemel, 1996). In this study, sampling sites covered four distinct
regions: North Bay (BG20, BG30, SU02, SU16, BF21), San Pablo Bay (BD31, SP19),
Central Bay (BC11, CB20, CB18), and South Bay (SB02, BA41, SB18, LSB2, BA10)
(Fig. 1). Physical and chemical conditions varied throughout the estuary but did not
change considerably between 2004 and 2005 (Table 1). Salinity in the North Bay did
not exceed 10 practical salinity units (psu) and was less than 0.6 psu at the riverine
sites (BG20 and BG30). Salinity in the rest of the estuary ranged from 22 to 31 psu.
Total C:N ratios were highest in the North Bay, likely due to allochthonous riverine
inputs (Jassby et al., 1993; Jassby and Cloern, 2000; Kennish, 2000), compared to
lower ratios in the Central and South Bay where autochthonous organic matter inputs
are typically more dominant (Jassby et al., 1993; Canuel et al., 1995; Kennish, 2000).
Bottom water nitrite and nitrate concentrations were highest at the southernmost sites
(2.1-3.7 µM nitrite and 34-88 µM nitrate at BA10 and LSB2) where there are long
residence times and high loading from wastewater treatment plants (Kimmerer, 2004;
Wankel et al., 2006).
AOA and β-AOB abundance
Abundance of archaeal and betaproteobacterial amoA genes was determined at
13 sites distributed throughout the Bay from August 2004 and 8 sites from August
62
2005 (Table S1). AOA amoA gene copy numbers ranged from 5.6 x 10² to 4.3 x 10⁶
copies per µg DNA and from 1.4 x 10⁴ to 3.9 x 10⁷ copies per g of sediment (wet
weight). β-AOB amoA ranged from 9.1 x 10³ to 4.2 x 10⁶ copies per µg DNA and from
3.1 x 10⁴ to 5.3 x 10⁷ copies per g of sediment (wet weight). AOA amoA gene copy
numbers (normalized to sediment wet weight) were most abundant in the North Bay
(BG20, BG30, SU02, SU16, BF21) and then decreased nearly 70-fold in the rest of the
estuary (abundances averaged across regions compared). β-AOB amoA copy numbers
were lowest at BG20, BG30, and SU02 in the north and then increased 50-fold along
the rest of the estuarine transect. In San Francisco Bay, AOA amoA copy numbers
spanned a broader range than observed in coastal aquifer sediments (~105 copies per g
of sediment wet weight; Santoro et al., 2008), whereas β-AOB amoA copy numbers
were similar to those in salt marsh and coastal aquifer sediments (104 to 106 copies per
g sediment wet weight; Dollhopf et al., 2005; Santoro et al., 2008).
In contrast to numerous recent studies suggesting that AOA are more abundant
than AOB in marine and terrestrial ecosystems (Leininger et al., 2006; Wuchter et al.,
2006; Lam et al., 2007; Mincer et al., 2007; Nakagawa et al., 2007; Beman et al.,
2008), our quantitative PCR estimates indicated that β-AOB amoA copy numbers
were greater than AOA amoA in most of the San Francisco Bay estuary (Fig. 2). β-
AOB amoA were on average 215 times more abundant than AOA amoA at all sites
from San Pablo Bay to South Bay in both 2004 and 2005 (average log10 ratio of
AOA:β-AOB = -2.1). However, at BG20, BG30, and SU02 in the North Bay, AOA
amoA were 47 times more abundant than β-AOB amoA on average (average log10 ratio
of AOA:β-AOB = 1.5). The westernmost North Bay sites (SU16 and BF21) marked a
63
transition point where AOA and β-AOB amoA gene abundances were nearly identical
(average log10 ratio of AOA:β-AOB = 0.1; salinity = 6-9 psu). Following a similar
pattern to that described here, coastal aquifer sediment β-AOB were more abundant
than AOA (up to 30-fold) at high salinities but less abundant than AOA at low
salinities (Santoro et al., 2008). This is particularly striking given the fact that the
coastal aquifer shift in AOA/AOB abundance occurred over just tens of meters,
whereas the San Francisco Bay transition occurred over tens of kilometers. Caffrey et
al. (2007) also found that β-AOB were more abundant than AOA at many of the
estuarine sites examined, particularly in the Weeks Bay estuary.
AOA and β-AOB richness and phylogenetic diversity
Archaeal and betaproteobacterial amoA sequences were recovered from 13
sites from August 2004 and 5 sites from August 2005 chosen as representatives of the
main regions in the estuary. From all environmental clone libraries combined, we
recovered 67 unique archaeal amoA operational taxonomic units (OTUs) and 41
unique bacterial amoA OTUs defined at a 5% distance cutoff. Within each individual
site, between 4-11 AOA OTUs and 3-11 β-AOB OTUs were observed (Table S2). In
some cases, these numbers may have been higher if more clones were sequenced,
based on non-asymptotic rarefaction curves (Fig. S1). β-AOB richness estimates for
libraries from a given site (4-15 predicted OTUs by Chao1; Table S2) were within the
same range reported in other estuaries (Francis et al., 2003; Beman and Francis, 2006)
and, similar to Chesapeake Bay, were highest at sites in the low-salinity North Bay
region. Overall, archaeal amoA Chao1 richness estimates (4-46 predicted OTUs;

64
Table S2) were consistently higher than bacterial amoA, with three exceptions
(4BG20, 4SU02, 5BG30; 4BA10 had equal AOA and β-AOB estimates). On average,
the number of observed AOA OTUs at a site represented 71% of the total number of
AOA OTUs predicted (Chao1 estimates) to occur at that site. For β-AOB, 86% of the
predicted OTUs were observed. The highest β-AOB richness and lowest AOA
richness occurred at North Bay sites in both 2004 (site SU02) and 2005 (site BG30).
Archaeal amoA Shannon diversity was higher than bacterial amoA at 12 of the 18
sites. AOA and β-AOB Shannon diversity did not change greatly between 2004 and
2005 (average difference ≤0.5).
Phylogenetic analysis of archaeal amoA sequences showed that a large
proportion (174 out of 415) fell into a cluster comprised almost entirely of
coastal/estuarine sediment sequences from Northern California, along with the amoA
sequence of Nitrosopumilus maritimus (Könneke et al., 2005) (Fig. 3, Fig. S2).
Approximately 15% of the 415 archaeal amoA sequences from San Francisco Bay
sediments fell into the soil/sediment group (Francis et al., 2005), which includes the
soil metagenomic (fosmid) clone 54d9 (Treusch et al., 2005) derived from
uncultivated Group 1.1b Crenarchaeota (the most ubiquitous lineage of Crenarchaeota
in terrestrial environments; Ochsenreiter et al., 2003). Interestingly, none of the
5BG30, 4BG20, 4BG30, 4SU02, or 4CB18 sequences fell into the soil/sediment
group.
Archaeal amoA sequences from the North Bay (BG20, BG30, SU02, and
SU16) formed a large and distinct low-salinity cluster (Fig. 3). Some sequences from
San Pablo Bay also fell into this group (1 from 4SP19, 3 from 4BD31, and 13 from
65
5BD31); despite having relatively high salinities at the time of sampling, salinity in
this region is often oligo- or mesohaline in the winter and spring due to high flow from
the San Joaquin and Sacramento rivers (http://sfbay.wr.usgs.gov/access/wqdata). This
may imply that these putative low-salinity AOA phylotypes are tolerant of higher
salinities. GenBank sequences within this clade were from the rhizosphere of
freshwater macrophytes (Herrmann et al., 2008), coastal aquifer sediments at
freshwater and freshwater-saltwater interface sites (Santoro et al., 2008), and a
wastewater treatment plant (WWTP) in McMinnville, OR (Park et al., 2006).
Sequences from the sandy flat of the Douro River estuary (Magalhaes et al.,
unpublished; direct GenBank submission) grouped closely with San Francisco Bay
sequences. The entire Douro River estuary has been shown to become river-like
during high flow (Vieira and Bordalo, 2000), and mesophilic Crenarchaeota 16S
rRNA sequences have been previously reported from brackish (1 to 5 psu) intertidal
sediments from this estuary (Abreu et al., 2001). Two sequences from South San
Francisco Bay (SF04-LSB002S-H02 and one sequence from low-salinity sediments
near the Palo Alto WWTP; Park et al., 2006) were also found in this cluster.
Bacterial amoA sequences from San Francisco Bay showed substantial overlap
with Chesapeake Bay, Plum Island Sound, and Bahía del Tóbari estuaries (Francis et
al., 2003; Bernhard et al., 2005; Beman and Francis, 2006) (Fig. 4, Fig. S3, and Fig.
S4). A majority of the bacterial amoA sequences fell into two distinct groups with
other estuarine sequences in the ‘estuarine/marine Nitrosospira-like’ and
‘estuarine/marine Nitrosomonas-like’ clusters. Sequences from BG20 and BG30 in
the North Bay fell almost exclusively into a ‘low salinity Nitrosomonas ureae- and N.

66
oligotropha-like’ group along with sequences from low salinity sites in Plum Island
Sound and Chesapeake Bay (Francis et al., 2003; Bernhard et al., 2005). Studies in
the Chesapeake Bay, Plum Island Sound, and Ythan (Scotland) estuaries reported
Nitrosospira-like amoA sequences at high salinities and Nitrosomonas-like sequences
at low salinities (Francis et al., 2003; Bernhard et al., 2005; Freitag et al., 2006). In
contrast to the predominantly Nitrosomonas-dominated freshwater sites in San
Francisco Bay (BG20 and BG30), sequences from the other North Bay sites (SU02
and SU16 with salinities of 2.9 and 6.3 psu, respectively) fell almost exclusively (38
of 42 sequences) into the estuarine/marine Nitrosospira-like group, along with
sequences from sites with salinities ≥22.0 psu. In the rest of San Francisco Bay (San
Pablo Bay to South Bay with salinities ≥22.0 psu), sequences were distributed
between both the estuarine/marine Nitrosospira-like (219 sequences) and
estuarine/marine Nitrosomonas-like (117 sequences) groups.
AOA and β-AOB community structure
There was significant compositional overlap between the 2004 and 2005 clone
libraries for both archaeal and bacterial amoA (Table 2), based on abundance-based
Sørensen’s indices of similarity (Labd) greater than 0.5 (i.e., for OTUs found in at least
one of the communities, there is a 50% probability that a randomly selected OTU is
found in both communities; Schloss and Handelsman, 2006). Likewise, at four out of
five sites in the Bahía del Tóbari estuary, AOA communities sampled 9 months apart
were virtually indistinguishable (Beman and Francis, 2006). β-AOB at a high-salinity
site in the Plum Island Sound estuary showed little variability over 3 years, while mid-

67
and low-salinity sites were less consistent among sampling dates (Bernhard et al.,
2005). Although there was little variation in AOA and β-AOB community
composition in San Francisco Bay between two summers, seasonal influence
(particularly higher precipitation and lower temperature in the winter months) on
diversity and community structure remain uncharacterized.
Ammonia oxidizers often exhibit strong spatial structure in estuaries. In the
Bahía del Tóbari estuary, AOA communities differ between the interior and mouths of
the bay (Beman and Francis, 2006). Studies in the Chesapeake Bay, Plum Island
Sound, and Ythan (Scotland) estuaries have shown shifts in AOB communities along
salinity gradients (Francis et al., 2003; Bernhard et al., 2005; Freitag et al., 2006).
Distinct spatial patterns were also evident in the San Francisco Bay estuary (Table 2).
For archaeal amoA, there was little compositional overlap between the North Bay and
the Central and South Bays (Labd < 0.5). All sites within the North Bay (SU16, SU02,
BG30, and BG20) had high similarity with each other but not with any other sites in
the estuary and, conversely, Central and South Bay sites (CB20, CB18, SB02, SB18,
LSB2, and BA10) overlapped with each other but not with North Bay sites. In 2004,
the central-most site with a direct connection to the ocean (4BC11) only exhibited
significant overlap with one other site (4BD31). In 2004, the San Pablo Bay sites
(BD31 and SP19) showed high similarity to Central and South Bay sites and low
similarity to the North Bay sites. However, in 2005, the San Pablo Bay sites were
much more compositionally similar to the North Bay sites. For bacterial amoA, the
two northernmost river sites (BG20 and BG30) had no significant overlap with any
other sites in the estuary. 4BG30 had low similarity (Labd < 0.18) to all other sites
68
except the same site sampled in 2005 (Labd = 0.72). There was high similarity between
the other North Bay sites (SU02, SU16) and the San Pablo Bay sites (BD31, and
SP19). High compositional overlap occurred amongst sites from San Pablo, Central
and South Bays.
Relationship between environmental variables and ammonia-oxidizer community
structure and abundance
Many physical and geochemical factors influence nitrification, including
oxygen concentrations (e.g., Christensen et al., 1990), sulfide concentrations (Joye and
Hollibaugh, 1995), Fe(III) content (Dollhopf et al., 2005), salinity (Rysgaard et al.,
1999; Caffrey et al., 2003; Bernhard et al., 2007), C:N ratios (Ballinger et al., 2002),
availability of ammonium (e.g., Jones and Hood, 1980), light (Horrigan and Springer,
1990), and temperature (Berounsky and Nixon, 1993). In estuarine sediments, salinity
plays a particularly significant role in shaping β-AOB diversity and population
structure (Francis et al., 2003; Bernhard et al., 2005). In our study, Canonical
Correspondence Analysis (CCA) showed that salinity and temperature had the greatest
correlation with archaeal amoA community composition of the 27 factors tested, while
the bacterial amoA community composition was most correlated with C:N ratio,
salinity, and nickel concentrations (Fig. 5). In both cases, the North Bay sites grouped
independently from all other regions.
Because microbial nitrogen cycling processes involve metalloenzymes, trace
metal availability may be a key factor regulating nitrogen transformations (Morel and
Price, 2003). For example, copper limitation decreases the activity of the copper-

69
containing enzyme nitrous oxide reductase (NosZ) in denitrifiers (Granger and Ward,
2003). Likewise, nickel (Ni) incorporation is required for microbial synthesis of
active urease enzymes (Mobley et al., 1995). Many AOB, including various
Nitrosomonas, Nitrosospira, and Nitrosococcus species, have Ni-containing urease
enzymes and are capable of using urea for growth (Koper et al., 2004). The
correlation between β-AOB community composition and sediment nickel
concentrations in San Francisco Bay is thus intriguing and warrants further
exploration.
Environmental factors also influence the abundance of ammonia oxidizers in
estuaries. In San Francisco Bay, the log ratio of AOA:β-AOB amoA copy numbers
was strongly correlated to bottom water salinity (Spearman correlation: r = -0.85, P =
0.00, n = 20). When analyzed individually, AOA amoA abundance (gene copies per g
sediment) was negatively correlated with salinity (Spearman correlation: r = -0.79, P =
0.00, n = 21) and β-AOB amoA abundance was positively correlated with salinity
(Spearman correlation: r = 0.77, P = 0.00, n = 20). At sites where AOA amoA were
more abundant than β-AOB amoA, the bottom water salinity averaged 2 psu (range =
0.2-9 psu), whereas when β-AOB amoA were more abundant than AOA amoA the
average salinity was 27 (range = 22-31 psu). The transition sites where AOA and β-
AOB amoA abundances were similar had intermediate salinity values.
Salinity is a particularly important parameter for ammonia oxidation in
estuaries, in part because of its influence on NH4+ adsorption in sediments (Boatman
and Murray, 1982; Boynton and Kemp, 1985). As was found in this study, salinity
was strongly correlated to the ratio of AOA and β-AOB in coastal aquifer sediments

70
(Santoro et al., 2008), and AOB abundance in Plum Island Sound estuary sediments
was lowest at low salinity (Bernhard et al., 2007). However, in contrast to these
studies, abundance of AOA was positively correlated with salinity across six different
estuaries, while AOB abundance showed no correlation with salinity (Caffrey et al.,
2007). It is unclear whether this discrepancy is due to variation in physical and
chemical conditions in the estuaries studied or to methodological differences.
The abundance of AOA and β-AOB amoA and the log ratio of AOA:β-AOB
were all strongly correlated with C:N ratios (Spearman correlation > ±0.7; Table S3).
However, because C:N ratios can covary with salinity (e.g., riverine inputs in the
North Bay likely cause both high C:N ratios and low salinity), partial correlation
analyses were used to separate the individual effect of these variables (Table S4).
When controlling for C:N ratios, AOA amoA abundance and the log ratio of AOA:β-
AOB were still significantly and strongly correlated to salinity. Correlation between
salinity and β-AOB amoA abundance decreased when controlling for C:N ratios and
yet there was no correlation between C:N ratios and abundance when controlling for
salinity.
The abundance of AOA amoA was also strongly correlated with lead (Pb)
concentrations and percent clay (Table S3). Partial correlation between salinity, lead,
and clay (Table S4) makes it difficult to establish a direct link between these variables
and AOA amoA abundance. It is possible that other parameters not measured here
also influence AOA and β-AOB, including sediment macrofauna (e.g., bioturbation),
porewater sulfide, porewater NH4+ and porewater dissolved oxygen concentrations.
Even so, as has been shown previously for several other estuaries (e.g., Francis et al.,

71
2003; Bernhard et al., 2005; Bernhard et al., 2007; Santoro et al., 2008), salinity
appears to play a central role in shaping the structure of the ammonia-oxidizer
community (both in terms of composition and abundance) in San Francisco Bay.
AOA and β-AOB enrichments
The vast majority of amoA gene sequences reported in most cultivation-
independent estuarine studies appear to be novel and distinct from sequences of
cultivated ammonia oxidizers, indicating that we know little about the specific
organisms actually responsible for this process in nature. Ammonia-oxidizing
enrichment cultures were initiated from 5 San Francisco Bay sites that spanned the
estuarine gradient and overlapped with our environmental samples from 2004 and
2005. After 6 months, archaeal amoA was successfully amplified from all 5
enrichments, while bacterial amoA only amplified from 4 enrichments (excluding the
freshwater site BG30). Archaeal amoA sequences from all 5 enrichments showed
significant compositional overlap with environmental sequences from sediments at the
same sites (>90% of sequences belong to shared OTUs with the 2004 and/or 2005
environmental sequences from the same site; also highlighted in the phylogenetic trees
in Fig. 3 and Fig. S2), suggesting that these enriched AOA may be representative of
estuarine Crenarchaeota.
To date there are large groups of β-AOB with no cultivated representatives,
including the 16S rRNA-based Nitrosospira cluster 1 and Nitrosomonas cluster 5
(Freitag and Prosser, 2003; Freitag et al., 2006) found to dominate AOB communities
in many marine and estuarine systems (e.g., McCaig et al., 1999; Bano and
72
Hollibaugh, 2000; Freitag and Prosser, 2003, 2004). The presumption that these
groups oxidize ammonia is based on clustering of their 16S rRNA genes within a
monophyletic group containing cultivated AOB, and on reports of non-persisting
enrichment cultures of Nitrosomonas cluster 5 (Stephen et al., 1996). We found
bacterial amoA sequences in our enrichment cultures from both the estuarine/marine
Nitrosospira-like and Nitrosomonas-like groups (Fig. 4, Fig. S3 and Fig. S4)
commonly detected in estuarine systems (Francis et al., 2003; Bernhard et al., 2005).
Additional efforts, including continued cultivation over a longer time period, will be
necessary to definitively confirm ammonia oxidation by these AOB groups.
Conclusions
In summary, we have provided evidence for niche specialization of AOA and
β-AOB in estuary sediments from San Francisco Bay. Both groups exhibit distinct
spatial structure and little temporal variability between two summers. AOA and β-
AOB community composition and abundance are highly correlated with salinity. β-
AOB community composition is also correlated with sediment nickel concentrations,
which is intriguing given the nickel requirement for active urease enzymes. β-AOB
amoA genes are far more abundant than AOA amoA genes in much of the estuary
where salinity is high and C:N ratios are low. In contrast, the region of the estuary
with low-salinity and high C:N ratios contains a group of AOA that are both abundant
and phylogenetically distinct amongst San Francisco Bay ammonia oxidizers, forming
a low-salinity amoA gene cluster. β-AOB amoA sequences at the riverine sites (BG20
and BG30) are primarily Nitrosomonas-like, whereas estuarine/marine Nitrosospira-
73
like and Nitrosomonas-like amoA sequences predominate the rest of San Francisco
Bay.
Experimental Procedures
Sample collection
Sediment and water samples were collected from San Francisco Bay in
northern California during the summers of 2004-2006 in conjunction with the
Regional Monitoring Program (RMP) managed by the San Francisco Estuary Institute
(http://www.sfei.org/). Annual cruises took place aboard the R/V Endeavor (operated
by the Bureau of Land Management). Sediment cores were collected from a Young-
modified, Van Veen grab using sterile, cut-off 5-cc syringes and stored on dry ice until
permanent storage at –80ºC. Bottom water samples for nutrient analyses were
immediately 0.2 µm-filtered (Nalgene PES or Millipore MillexGV) and frozen at –
20ºC. In 2006, sediment samples were collected for ammonia-oxidizing enrichment
cultures and stored at 4ºC until inoculation.
Environmental parameters
Water column profiles of temperature, salinity and dissolved oxygen (DO)
were measured at each site using a SeaBird™ SBE-19 CTD. Bottom water samples
from 2004 were previously analyzed for nitrate (NO3-), nitrite (NO2
-), and ammonium
(NH4+) (Wankel et al., 2006). In 2005, nutrients were measured on a QuikChem 8000
Flow Injection Analyzer (Lachat Instruments). The RMP analyzed sediment samples
for pH, trace elements (Ag, Al, As, Cd, Cu, Fe, Hg, MeHg, Mn, Ni, Pb, Se and Zn),
grain size, total organic carbon and total nitrogen. C:N ratios were calculated using
74
total organic carbon and total nitrogen percentages.
Quantification of amoA gene abundance
Quantitative PCR (Q-PCR) was used to estimate the number of archaeal and
bacterial amoA copies in sediments at 13 sites in 2004 (4BG20, 4BG30, 4SU02,
4SU16, 4BD31, 4SP19, 4BC11, 4CB20, 4CB18, 4SB02, 4SB18, 4LSB2, 4BA10) and
8 sites in 2005 (5BG20, 5BG30, 5SU02, 5BF21, 5BD31, 5BC11, 5BA41, and
5BA10). The number preceding the sampling site name indicates the year sampled
(e.g., 4BA10 and 5BA10 correspond to site BA10 sampled in 2004 and 2005,
respectively). DNA was extracted from approximately 250-300 mg of sediment from
the upper 5 mm of the cores using the FastDNA SPIN kit for soil (MP Biomedicals,
Inc.) with a 30 second bead beating time. Duplicate DNA extractions were performed
for each sediment core. Reactions were carried out using a StepOnePlus™ Real-Time
PCR System (Applied Biosystems). Primers Arch-amoAF and Arch-amoAR (Francis
et al., 2005) were used for archaeal amoA quantification and amoA-1F and amoA-2R
(Rotthauwe et al., 1997) for bacterial amoA quantification. Plasmids containing
cloned amoA PCR amplicons were extracted with the Qiagen Miniprep Spin Kit for
use in standard curves: archaeal amoA clone SF06E-BC11-A02 and bacterial amoA
clone SF06E-BA10-C02. Sediment and standard DNA was quantified using the
Quant-iT™ High-Sensitivity and Broad Range DNA assays, respectively, with the
Qubit Fluorometer (Invitrogen). Standard curves spanned a range from 11 to 1.07 x
105 amoA copies per µl for the AOA assay and from 16 to 1.62 x 10⁵ amoA copies per
µl for the β-AOB assay. All sample and standard reactions were performed in
triplicate and an average value was calculated. An outlier was removed from some
75
triplicate measurements to maintain a standard deviation of less than 15% for each
sample. Melt curves were generated after each assay to check the specificity of
amplification. PCR efficiencies were 90-99% (average 94%) for archaeal amoA and
76-94% (average 86%) for bacterial amoA. Correlation coefficients (R2) for both
assays averaged 0.99 (standard deviation of 0.003). The ratio of AOA amoA to β-AOB
amoA was calculated using copy numbers normalized to µg DNA and then log10
transformed.
Archaeal amoA Q-PCR was performed in a 25 µl reaction mixture with 0.2-63
ng template DNA, 0.4 µM of each primer, 2 mM MgCl2, 1.25 Units AmpliTaq® DNA
polymerase (Applied Biosystems), 1 µl passive reference dye, 40 ng µl-1 BSA, and
12.5 µl Failsafe Green Premix E (Epicentre). The PCR protocol was as follows: 3 min
at 95°C, then 32 cycles consisting of 30 s at 95°C, 45 s at 56°C, and 1 min at 72°C
with a detection step at the end of each cycle.
Bacterial amoA Q-PCR was performed in a 20 µl reaction mixture with 0.2-23
ng template DNA, 0.3 µM of each primer, 1 Unit AmpliTaq® DNA polymerase
(Applied Biosystems), 0.8 µl passive reference dye, and 10 µl Failsafe Green Premix
F (Epicentre). The PCR protocol was as follows: 5 min at 95°C, then 34 cycles
consisting of 45 s at 94°C, 30 s at 56°C, 1 min at 72°C, and a detection step for 10 s at
80.5°C.
Ammonia-oxidizing community composition
AOA and β-AOB amoA diversity was analyzed at 18 of the sites used for
qPCR: 4BG20, 4BG30, 4SU02, 4SU16, 4BD31, 4SP19, 4BC11, 4CB20, 4CB18,

76
4SB02, 4SB18, 4LSB2, 4BA10, 5BG30, 5BD31, 5BC11, 5BA41, and 5BA10. Total
community DNA was extracted as described above. Sediment DNA extracts were
PCR amplified with primers targeting archaeal and bacterial amoA: Arch-amoAF and
Arch-amoAR (Francis et al., 2005) for AOA; and amoA-1F* (Stephen et al., 1999)
and amoA-2R (Rotthauwe et al., 1997) for β-AOB. Clone libraries of amoA gene
fragments were constructed using the TOPO TA cloning® kit (Invitrogen, Inc.) and 17
to 31 clones from each library were sequenced (ABI 3100 Capillary Sequencer).
Nucleotide sequences were aligned with GenBank sequences using MacClade version
4.08 (Maddison and Maddison, 2000). A 582-bp region of the sequence alignment
was used for archaeal amoA richness and diversity analyses and a 579-bp region was
used for phylogenetic analyses. For bacterial amoA, a 444-bp region was used for
richness, diversity and phylogenetic analyses.
Jukes-Cantor distance matrices were generated in PAUP 4.0b10 (Sinauer
Associates). Operational Taxanomic Units (OTUs), diversity indices (Shannon and
Simpson), and nonparametric richness estimates (Chao1 and ACE; Chao, 1984; Chao
and Lee, 1992; Chao et al., 1993) were determined using the furthest neighbor
algorithm in DOTUR (Schloss and Handelsman, 2005). Abundance-based Sørensen-
type similarity indices (Labd) (Chao et al., 2005, 2006) were calculated using SONS
with 10,000 iterations (Schloss and Handelsman, 2006). Labd values were used to
estimate community composition similarity between libraries (Labd standard error for
all AOA and β-AOB comparisons was < 0.32). For this analysis, site SB18 from 2004
and site BA41 from 2005 were compared because of their close physical proximity to
each other (2.7 kilometers apart). OTUs were defined at a ≤5% nucleic acid sequence

77
difference. Neighbor joining phylogenetic trees (based on Jukes-Cantor correction)
were constructed in ARB (Ludwig et al., 2004). Distance and parsimony bootstrap
analyses (100 replicates) were performed using PAUP version 4.0b10 (Swofford,
2003).
Statistical Analyses
Correlation between amoA abundance and environmental variables was
calculated using SPSS, version 11.0.4. Non-parametric Spearman correlation and
partial correlation analyses were used for AOA amoA copies per g sediment, β-AOB
amoA copies per g sediment, and the log10 ratio of AOA:β-AOB. Bottom water
parameters included in the statistical analyses were: salinity (psu), temperature (ºC),
dissolved oxygen (mg/L), nitrite+nitrate (µM), nitrite (µM), nitrate (µM), ammonium
(µM), DIN (µM), water depth (m), and pH. Sediment parameters included in the
statistical analyses were: TOC (%), TN (%), C:N ratio, Ag (mg/Kg), Al (mg/Kg), As
(mg/Kg), Cd (mg/Kg), Cu (mg/Kg), Fe (mg/Kg), Hg (mg/Kg), MeHg (ug/Kg), Mn
(mg/Kg), Ni (mg/Kg), Pb (mg/Kg), Se (mg/Kg), Zn (mg/Kg), % Clay, % Fine, %
Granule and Pebble, % Sand, and % Silt.
Correlations between amoA community composition and environmental
parameters were analyzed by Canonical Correspondence Analysis (CCA) using the
program Canoco (ter Braak and Smilauer, 2002). CCA was chosen to determine if the
community structure is more strongly related to specific environmental variables than
expected by chance. Detrended CCA showed that a unimodal response model better
approximated both AOA and β-AOB species relationship to the explanatory variables
(maximum gradient length exceeds 4 S.D.). Relative abundance of sequences in each
78
OTU (defined at 0.05 distance) was used as species input (i.e., the number of
sequences in an OTU divided by the total number of sequences in the library).
Significant environmental variables were determined by forward selection (P < 0.05
for AOA; P ≤ 0.06 for β-AOB). Bottom water parameters included in the forward
selection were: salinity (psu), temperature (ºC), dissolved oxygen (mg/L),
nitrite+nitrate (µM), nitrite (µM), nitrate (µM), ammonium (µM), DIN (µM), water
depth (m), and pH. Sediment parameters included in the forward selection were: TOC
(%), TN (%), C:N ratio, As (mg/Kg), Cd (mg/Kg), Cu (mg/Kg), Hg (mg/Kg), Mn
(mg/Kg), Ni (mg/Kg), Pb (mg/Kg), Se (mg/Kg), Zn (mg/Kg), % Clay, % Fine, %
Granule and Pebble, % Sand, and % Silt. Analyses used non-transformed data and
biplot scaling.
LC scores (linear combinations of the environmental variables) were used as
points in the CCA ordination plots. In the plots, the length of the environmental line
corresponds to the strength of the relationship of that variable with the community
composition, whereas the perpendicular position of the sampling site points relative to
the environmental line is an approximate ranking of species response curves to that
environmental variable (McCune and Grace, 2002). The first canonical axis and all of
the canonical axes taken together were significant (P ≤ 0.002) based on Monte Carlo
tests (499 permutations under reduced model). The variance of the species-
environment relation represented in each ordination was: axis 1 = 70.2% and axis 2 =
29.8% for AOA; axis 1 = 49.8% and axis 2 = 32.5% for β-AOB. The variance of the
species data represented in each ordination was: axis 1 = 19.0% and axis 2 = 8.1% for
AOA; axis 1 = 20.4% and axis 2 = 13.3% for β-AOB.

79
Cultivation of estuarine ammonia-oxidizers
Ammonia-oxidizer enrichment cultures were initiated in 2006 from 5 sites
overlapping with the samples collected in 2004 and 2005 (BG30, BD31, BC11, BA41,
and BA10). Surface sediments were inoculated into a modified version of Synthetic
Crenarchaeota Medium (Könneke et al., 2005) made with 500 µM ammonium
chloride, 1 mL selenite/tungstate solution, 1 mL vitamin solution (Balch et al., 1979),
1 mL sodium bicarbonate (1M), 10 mL KH2PO4 (4g g L-1), 1 mL trace metals (Biebl
and Pfennig, 1978), and 988 mL artificial seawater (35.1 g L-1 sodium chloride, 24.7 g
L-1 magnesium sulfate, 2.9 g L-1 calcium chloride, and 1.5 g L-1 potassium chloride)
diluted to 10 or 32 psu salinity. Cultures were grown in static culture flasks or serum
vials in the dark at room temperature (approximately 22°C). Approximately 10% of
the culture volume was transferred into fresh media 2-3 times over 6 months (BA41
was only transferred once following original transfer from a sediment slurry to media),
at which point DNA was extracted from enrichment cultures as previously described
(Santoro and Boehm, 2007; Santoro et al., 2008). Archaeal and bacterial amoA genes
were amplified, cloned, sequenced and phylogenetically analyzed as described above.
Compositional overlap with sequences from the environmental amoA libraries from
the same site was determined using the Vobs statistic in SONS at 0.05 distance, which
represents the fraction of sequences found in shared OTUs (Schloss and Handelsman,
2006).
Nucleotide sequence accession numbers
Sequences reported in this study have been deposited in GenBank under
accession numbers EU650799 to EU651305 (archaeal amoA) and EU651306 to

80
EU651796 (bacterial amoA). Sequence names in GenBank are referred to as SF04 and
SF05 for sampling years 2004 and 2005 and SF06E for enrichment cultures. For sites
with longer names, the original site name was used in GenBank (SU002S abbreviated
here as SU02, SU016S = SU16, SPB019S = SP19, CB020S = CB20, CB018S =
CB18, SB002S = SB02, SB018S = SB18, LSB002S = LSB2).
Acknowledgements
We thank Paul Salop, Sarah Lowe, Applied Marine Sciences, the San
Francisco Estuary Institute, and the crew of the R.V. Endeavor for allowing us to
participate in the San Francisco Bay RMP sediment cruises, providing access to the
RMP data, and assisting in sample collection. We thank Scott Wankel for sampling
and performing nutrient analyses from the 2004 cruise. We greatly appreciate those
who provided advice and comments on the manuscript (A. Santoro, G. Wells, M.
Beman, J. Smith, S. Ying, and J. Lee). This work was supported in part by National
Science Foundation Grants MCB-0433804 and MCB-0604270 (to C.A.F.) and an
EPA STAR Graduate Fellowship (to A.C.M.).
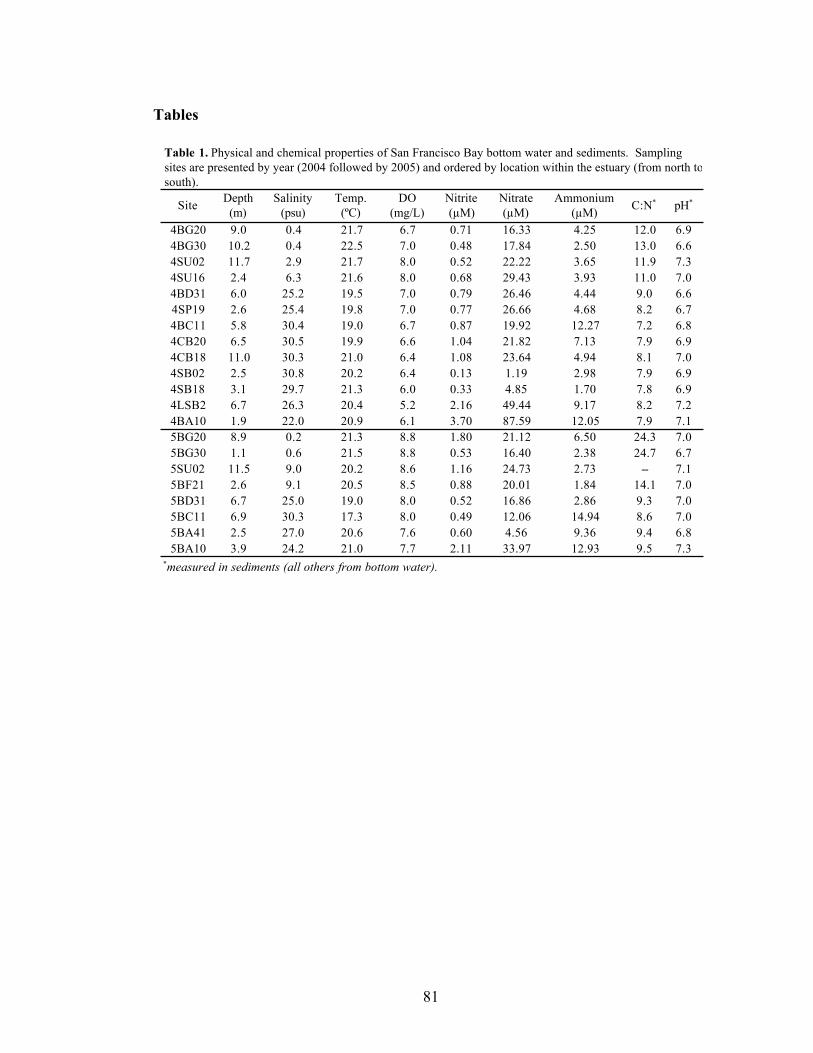
81
Tables
SiteDepth
(m)
Salinity
(psu)
Temp.
(ºC)
DO
(mg/L)
Nitrite
(!M)
Nitrate
(!M)
Ammonium
(!M)C:N* pH*
4BG20 9.0 0.4 21.7 6.7 0.71 16.33 4.25 12.0 6.9
4BG30 10.2 0.4 22.5 7.0 0.48 17.84 2.50 13.0 6.6
4SU02 11.7 2.9 21.7 8.0 0.52 22.22 3.65 11.9 7.3
4SU16 2.4 6.3 21.6 8.0 0.68 29.43 3.93 11.0 7.0
4BD31 6.0 25.2 19.5 7.0 0.79 26.46 4.44 9.0 6.6
4SP19 2.6 25.4 19.8 7.0 0.77 26.66 4.68 8.2 6.7
4BC11 5.8 30.4 19.0 6.7 0.87 19.92 12.27 7.2 6.8
4CB20 6.5 30.5 19.9 6.6 1.04 21.82 7.13 7.9 6.9
4CB18 11.0 30.3 21.0 6.4 1.08 23.64 4.94 8.1 7.0
4SB02 2.5 30.8 20.2 6.4 0.13 1.19 2.98 7.9 6.9
4SB18 3.1 29.7 21.3 6.0 0.33 4.85 1.70 7.8 6.9
4LSB2 6.7 26.3 20.4 5.2 2.16 49.44 9.17 8.2 7.2
4BA10 1.9 22.0 20.9 6.1 3.70 87.59 12.05 7.9 7.1
5BG20 8.9 0.2 21.3 8.8 1.80 21.12 6.50 24.3 7.0
5BG30 1.1 0.6 21.5 8.8 0.53 16.40 2.38 24.7 6.7
5SU02 11.5 9.0 20.2 8.6 1.16 24.73 2.73 -- 7.1
5BF21 2.6 9.1 20.5 8.5 0.88 20.01 1.84 14.1 7.0
5BD31 6.7 25.0 19.0 8.0 0.52 16.86 2.86 9.3 7.0
5BC11 6.9 30.3 17.3 8.0 0.49 12.06 14.94 8.6 7.0
5BA41 2.5 27.0 20.6 7.6 0.60 4.56 9.36 9.4 6.8
5BA10 3.9 24.2 21.0 7.7 2.11 33.97 12.93 9.5 7.3*measured in sediments (all others from bottom water).
Table 1. Physical and chemical properties of San Francisco Bay bottom water and sediments. Sampling
sites are presented by year (2004 followed by 2005) and ordered by location within the estuary (from north to
south).

82
4B
G2
04
BG
30
4S
U0
24
SU
16
4B
D3
14
SP
19
4B
C1
14
CB
20
4C
B1
84
SB
02
4S
B1
84
LS
B2
4B
A1
05
BG
30
5B
D3
15
BC
11
5B
A4
15
BA
10
4B
G2
00
.17
0.2
00
.09
0.0
90
.09
0.0
00
.07
0.0
00
.00
0.0
00
.00
0.0
00
.49
0.0
90
.07
0.0
00
.00
4B
G3
00
.93
0.1
10
.00
0.0
00
.00
0.0
00
.00
0.0
00
.00
0.0
00
.00
0.0
00
.72
0.0
00
.00
0.0
00
.00
4S
U0
20
.95
0.8
60
.91
0.8
00
.88
0.0
90
.16
0.0
00
.07
0.0
70
.00
0.0
90
.18
0.9
30
.38
0.0
70
.08
4S
U1
60
.86
0.6
30
.66
0.6
80
.78
0.0
00
.17
0.0
00
.00
0.0
60
.00
0.0
60
.06
0.8
40
.18
0.0
60
.00
4B
D3
10
.13
0.1
70
.18
0.4
50
.95
0.3
80
.61
0.3
00
.49
0.4
20
.52
0.5
00
.06
0.9
00
.81
0.3
50
.46
4S
P1
90
.07
0.0
80
.08
0.4
50
.65
0.3
10
.79
0.1
70
.55
0.4
80
.48
0.5
00
.06
0.9
71
.00
0.2
50
.49
4B
C1
10
.00
0.0
00
.00
0.1
60
.54
0.2
50
.61
0.7
90
.98
0.7
80
.76
0.7
00
.00
0.2
90
.85
0.4
60
.71
4C
B2
00
.00
0.0
00
.00
0.0
70
.85
0.6
00
.37
0.7
00
.79
0.6
00
.87
0.5
60
.00
0.4
70
.76
0.5
70
.70
4C
B1
80
.00
0.0
00
.00
0.0
00
.53
0.4
80
.27
0.8
10
.95
0.8
00
.83
0.6
10
.00
0.0
60
.83
0.6
40
.67
4S
B0
20
.00
0.0
00
.00
0.0
00
.48
0.5
70
.26
0.8
10
.75
1.0
00
.97
0.8
90
.00
0.4
41
.00
0.8
00
.98
4S
B1
80
.00
0.0
00
.00
0.0
00
.53
0.3
70
.43
0.8
50
.71
0.6
60
.87
0.8
60
.00
0.4
00
.95
0.6
30
.76
4L
SB
20
.09
0.1
00
.10
0.2
40
.54
0.6
10
.29
0.6
60
.70
0.6
80
.75
0.9
90
.00
0.1
71
.00
0.6
20
.99
4B
A1
00
.00
0.0
00
.00
0.0
60
.70
0.5
70
.42
0.9
00
.80
0.8
40
.72
0.6
60
.00
0.4
30
.85
0.6
40
.92
5B
G3
00
.60
0.7
20
.63
0.6
70
.18
0.0
80
.00
0.0
00
.00
0.0
00
.00
0.1
00
.00
0.0
60
.00
0.0
00
.00
5B
D3
10
.65
0.5
40
.74
0.8
70
.69
0.5
90
.42
0.2
90
.44
0.4
00
.24
0.4
60
.42
0.5
31
.00
0.1
30
.36
5B
C1
10
.00
0.0
00
.00
0.0
70
.79
0.4
70
.60
0.5
50
.24
0.4
20
.27
0.5
10
.36
0.0
00
.34
0.7
30
.82
5B
A4
10
.00
0.0
00
.00
0.3
00
.49
0.3
50
.72
0.5
30
.50
0.4
90
.52
0.6
00
.64
0.0
00
.43
0.3
80
.57
5B
A1
00
.00
0.0
00
.00
0.3
00
.50
0.7
10
.60
0.7
00
.30
0.3
60
.30
1.0
00
.64
0.0
00
.50
0.9
60
.68
lib
rary
Ta
ble
2.
Ab
un
dan
ce-b
ased
Sø
ren
sen
-ty
pe
(La
bd)
sim
ilar
itie
s am
on
g a
rch
aeal
an
d b
acte
rial
am
oA
clo
ne
lib
rari
es.
La
bd
val
ues
gre
ater
th
an o
r eq
ual
to
0.5
are
in
bo
ld a
nd
sh
aded
. L
ibra
ries
are
pre
sen
ted
by
yea
r (2
00
4 a
nd
20
05
) an
d o
rder
ed b
y l
oca
tio
n w
ith
in t
he
estu
ary
(fr
om
no
rth
to
so
uth
).

83
Figures
Figure 1. Location of sampling sites within San Francisco Bay. Sites within
geographic regions are color coded: North Bay – red; San Pablo Bay – yellow; Central
Bay – green; South Bay – blue. Image courtesy of and adapted from the U.S.
Geological Survey.
NORTH BAY
SAN PABLO BAY
CENTRAL BAY
SOUTH BAY
BG30
SU16
SP19
BD31
BC11
CB20
CB18
LSB2
BA10
SB18
SB02
BA41
BF21
SU02 BG20
PACIFIC
OCEAN
NORTH
15 km
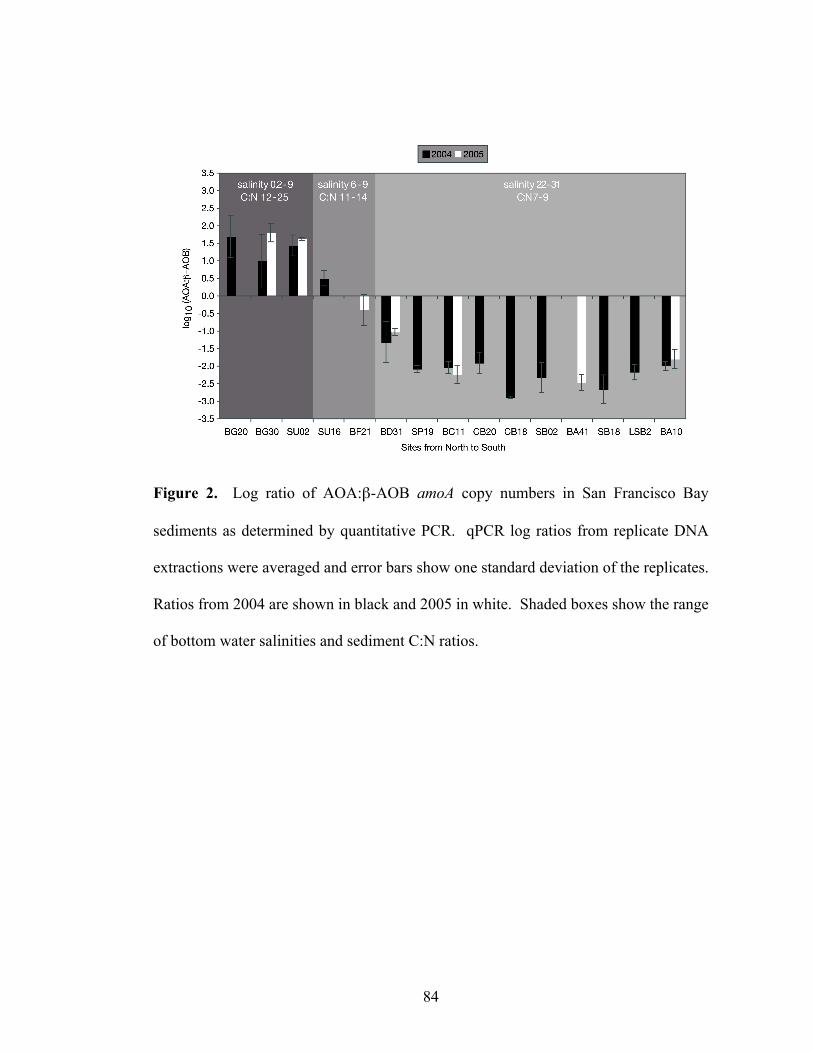
84
Figure 2. Log ratio of AOA:β-AOB amoA copy numbers in San Francisco Bay
sediments as determined by quantitative PCR. qPCR log ratios from replicate DNA
extractions were averaged and error bars show one standard deviation of the replicates.
Ratios from 2004 are shown in black and 2005 in white. Shaded boxes show the range
of bottom water salinities and sediment C:N ratios.
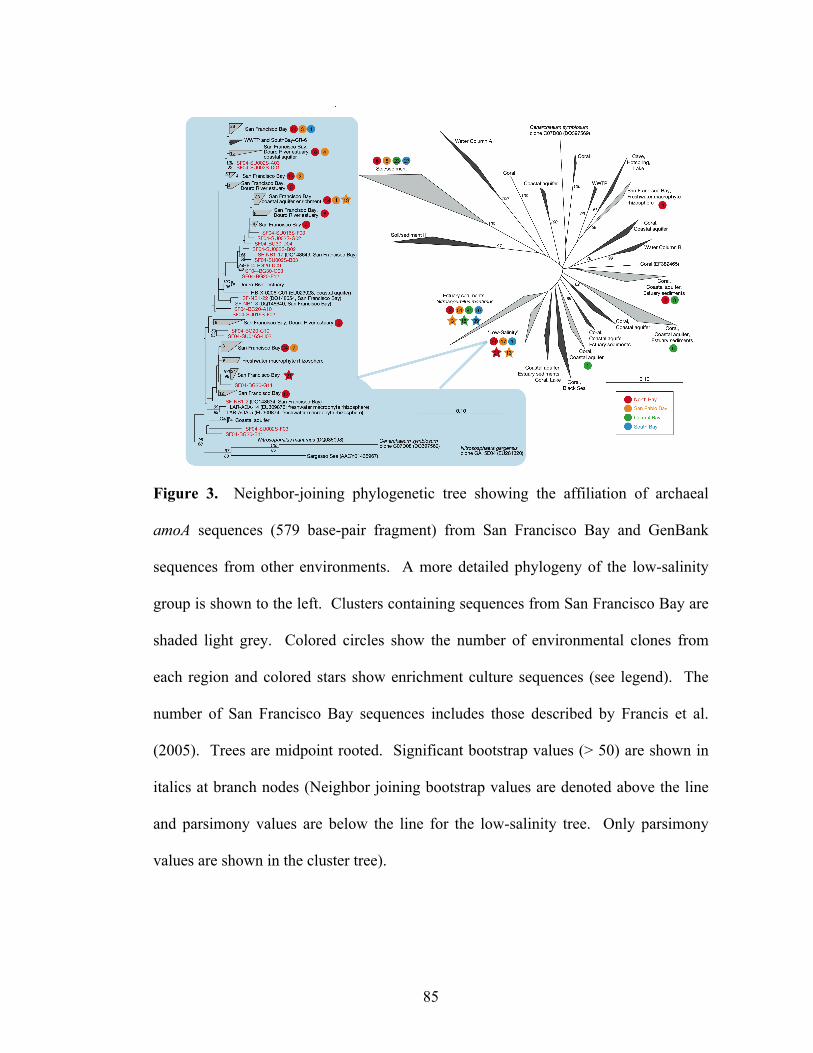
85
Figure 3. Neighbor-joining phylogenetic tree showing the affiliation of archaeal
amoA sequences (579 base-pair fragment) from San Francisco Bay and GenBank
sequences from other environments. A more detailed phylogeny of the low-salinity
group is shown to the left. Clusters containing sequences from San Francisco Bay are
shaded light grey. Colored circles show the number of environmental clones from
each region and colored stars show enrichment culture sequences (see legend). The
number of San Francisco Bay sequences includes those described by Francis et al.
(2005). Trees are midpoint rooted. Significant bootstrap values (> 50) are shown in
italics at branch nodes (Neighbor joining bootstrap values are denoted above the line
and parsimony values are below the line for the low-salinity tree. Only parsimony
values are shown in the cluster tree).

86
Figure 4. Neighbor-joining phylogenetic tree showing the affiliation of bacterial
amoA sequences (444 base-pair fragment) from San Francisco Bay and GenBank
sequences from other environments. Clusters containing sequences from San
Francisco Bay are shaded light grey. Colored circles represent the number of
environmental clones from each region and colored stars show enrichment culture
sequences (see legend). The tree is midpoint rooted. Significant bootstrap values (>
50; parsimony analysis) are shown in italics at branch nodes.

87
Figure 5. Canonical correspondence analysis (CCA) of archaeal (left panel) and
bacterial (right panel) amoA clone libraries and environmental variables from bottom
water and sediments.

88
Supporting Information
Additional Supporting Information may be found in the online version of this article:
Figure S1. Rarefaction curves for AOA (top panel) and β-AOB (bottom panel) amoA
clone libraries. OTUs were defined at a 5% sequence cutoff.
Figure S2. Neighbor-joining phylogenetic tree of the archaeal amoA sediment group.
Sequences from San Francisco Bay are color coded by region (see legend) and
GenBank sequences are in black. Significant bootstrap values (> 50; parsimony
analysis) are shown in italics at branch nodes.
Figure S3. Neighbor-joining phylogenetic tree of the bacterial amoA estuarine/marine
Nitrosospira-like group. Sequences from San Francisco Bay are color coded by
region (see legend) and GenBank sequences are in black. Significant bootstrap values
(> 50; parsimony analysis) are shown in italics at branch nodes.
Figure S4. Neighbor-joining phylogenetic tree of the bacterial amoA estuarine/marine
Nitrosomonas-like group. Sequences from San Francisco Bay are color coded by
region (see legend) and GenBank sequences are in black. Significant bootstrap values
(> 50; parsimony analysis) are shown in italics at branch nodes.
89
Literature Cited
Abreu, C., Jurgens, G., De Marco, P., Saano, A., and Bordalo, A.A. (2001)
Crenarchaeota and Euryarchaeota in temperate estuarine sediments. J Appl Microbiol
90: 713-718.
Balch, W.E., Fox, G.E., Magrum, L.J., Woese, C.R., and Wolfe, R.S. (1979)
Methanogens: Reevaluation of a unique biological group. Microbiol Rev 43: 260-296.
Ballinger, S.J., Head, I.M., Curtis, T.P., and Godley, A.R. (2002) The effect of C/N
ratio on ammonia oxidising bacteria community structure in a laboratory nitrification-
denitrification reactor. Water Sci Technol 46: 543-550.
Bano, N., and Hollibaugh, J.T. (2000) Diversity and distribution of DNA sequences
with affinity to ammonia-oxidizing bacteria of the beta subdivision of the class
Proteobacteria in the Arctic Ocean. Appl Environ Microbiol 66: 1960-1969.
Beman, J.M., and Francis, C.A. (2006) Diversity of ammonia-oxidizing archaea and
bacteria in the sediments of a hypernutrified subtropical estuary: Bahia del Tobari,
Mexico. Appl Environ Microbiol 72: 7767-7777.

90
Beman, J.M., Popp, B.N., and Francis, C.A. (2008) Molecular and biogeochemical
evidence for ammonia oxidation by marine Crenarchaeota in the Gulf of California.
ISME J 2: 429-441.
Bernhard, A.E., Donn, T., Giblin, A.E., and Stahl, D.A. (2005) Loss of diversity of
ammonia-oxidizing bacteria correlates with increasing salinity in an estuary system.
Environ Microbiol 7: 1289-1297.
Bernhard, A.E., Tucker, J., Giblin, A.E., and Stahl, D.A. (2007) Functionally distinct
communities of ammonia-oxidizing bacteria along an estuarine salinity gradient.
Environ Microbiol 9: 1439-1447.
Berounsky, V.M., and Nixon, S.W. (1993) Rates of nitrification along an estuarine
gradient in Narragansett Bay. Estuaries 16: 718-730.
Biebl, H., and Pfennig, N. (1978) Growth yields of green sulfur bacteria in mixed
cultures with sulfur and sulfate reducing bacteria. Arch Microbiol 117: 9-16.
Boatman, C.D., and Murray, J.W. (1982) Modeling exchangeable NH4+ adsorption in
marine sediments: Process and controls of adsorption. Limnol Oceanogr 27: 99-110.
91
Boynton, W.R., and Kemp, W.M. (1985) Nutrient regeneration and oxygen
consumption by sediments along an estuarine salinity gradient. Mar Ecol Prog Ser 23:
45-55.
Bricker, S.B., Clement, C.G., Pirhalla, D.E., Orlando, S.P., and Farrow, D.R.G. (1999)
National estuarine eutrophication assessment: Effects of nutrient enrichment in the
nation's estuaries. In. Silver Spring, MD: NOAA, National Ocean Service, Special
Projects Office and the National Centers for Coastal Ocean Science, p. 71.
Caffrey, J.M., Harrington, N., Solem, I., and Ward, B.B. (2003) Biogeochemical
processes in a small California estuary. 2. Nitrification activity, community structure
and role in nitrogen budgets. Mar Ecol Prog Ser 248: 27-40.
Caffrey, J.M., Bano, N., Kalanetra, K., and Hollibaugh, J.T. (2007) Ammonia
oxidation and ammonia-oxidizing bacteria and archaea from estuaries with differing
histories of hypoxia. ISME J 1: 660-662.
Canuel, E.A., Cloern, J.E., Ringelberg, D.B., Guckert, J.B., and Rau, G.H. (1995)
Molecular and isotopic tracers used to examine sources of organic matter and its
incorporation into the food webs of San Francisco Bay. Limnol Oceanogr 40: 67-81.
Chao, A. (1984) Nonparametric-estimation of the number of classes in a population.
Scandinavian Journal Of Statistics 11: 265-270.
92
Chao, A., and Lee, S.M. (1992) Estimating the number of classes via sample coverage.
J Am Stat Assoc 87: 210-217.
Chao, A., Ma, M.C., and Yang, M.C.K. (1993) Stopping rules and estimation for
recapture debugging with unequal failure rates. Biometrika 80: 193-201.
Chao, A., Chazdon, R.L., Colwell, R.K., and Shen, T.J. (2005) A new statistical
approach for assessing similarity of species composition with incidence and
abundance data. Ecol Lett 8: 148-159.
Chao, A., Chazdon, R.L., Colwell, R.K., and Shen, T.J. (2006) Abundance-based
similarity indices and their estimation when there are unseen species in samples.
Biometrics 62: 361-371.
Christensen, P.B., Nielsen, L.P., Sorensen, J., and Revsbech, N.P. (1990)
Denitrification in nitrate-rich streams: diurnal and seasonal variation related to benthic
oxygen metabolism. Limnol Oceanogr 35: 640-652.
Cloern, J.E., Jassby, A.D., Thompson, J.K., and Hieb, K.A. (2007) A cold phase of the
East Pacific triggers new phytoplankton blooms in San Francisco Bay. Proc Natl Acad
Sci USA 104: 18561-18565.

93
Dollhopf, S.L., Hyun, J.H., Smith, A.C., Adams, H.J., O'Brien, S., and Kostka, J.E.
(2005) Quantification of ammonia-oxidizing bacteria and factors controlling
nitrification in salt marsh sediments. Appl Environ Microbiol 71: 240-246.
Francis, C.A., O’mullan, G.D., and Ward, B.B. (2003) Diversity of ammonia
monooxygenase (amoA) genes across environmental gradients in Chesapeake Bay
sediments. Geobiology 1: 129-140.
Francis, C.A., Beman, J.M., and Kuypers, M.M.M. (2007) New processes and players
in the nitrogen cycle: the microbial ecology of anaerobic and archaeal ammonia
oxidation. ISME J 1: 19-27.
Francis, C.A., Roberts, K.J., Beman, J.M., Santoro, A.E., and Oakley, B.B. (2005)
Ubiquity and diversity of ammonia-oxidizing archaea in water columns and sediments
of the ocean. Proc Natl Acad Sci USA 102: 14683-14688.
Freitag, T.E., and Prosser, J.I. (2003) Community structure of ammonia-oxidizing
bacteria within anoxic marine sediments. Appl Environ Microbiol 69: 1359-1371.
Freitag, T.E., and Prosser, J.I. (2004) Differences between betaproteobacterial
ammonia-oxidizing communities in marine sediments and those in overlying water.
Appl Environ Microbiol 70: 3789-3793.
94
Freitag, T.E., Chang, L., and Prosser, J.I. (2006) Changes in the community structure
and activity of betaproteobacterial ammonia-oxidizing sediment bacteria along a
freshwater-marine gradient. Environ Microbiol 8: 684-696.
Granger, J., and Ward, B.B. (2003) Accumulation of nitrogen oxides in copper-limited
cultures of denitrifying bacteria. Limnol Oceanogr 48: 313-318.
Gruber, N., and Galloway, J.N. (2008) An Earth-system perspective of the global
nitrogen cycle. Nature 451: 293-296.
Hager, S., and Schemel, L. (1996) Dissolved inorganic nitrogen, phosphorus and
silicon in South San Francisco Bay; I. Major factors affecting distributions. In San
Francisco Bay: The ecosystem; Further investigations into the natural history of San
Francisco Bay and Delta with reference to the influence of man. Hollibaugh, J.T. (ed):
American Association for the Advancement of Science, p. 542.
Hallam, S.J., Mincer, T.J., Schleper, C., Preston, C.M., Roberts, K., Richardson, P.M.,
and DeLong, E.F. (2006a) Pathways of carbon assimilation and ammonia oxidation
suggested by environmental genomic analyses of marine Crenarchaeota. PLoS Biology
4: e95.
95
Hallam, S.J., Konstantinidis, K.T., Putnam, N., Schleper, C., Watanabe, Y., Sugahara,
J. et al. (2006b) Genomic analysis of the uncultivated marine crenarchaeote
Cenarchaeum symbiosum. Proc Natl Acad Sci USA 103: 18296-18301.
Hatzenpichler, R., Lebedeva, E.V., Spieck, E., Stoecker, K., Richter, A., Daims, H.,
and Wagner, M. (2008) A moderately thermophilic ammonia-oxidizing crenarchaeote
from a hot spring. Proc Natl Acad Sci USA 105: 2134-2139.
Head, I.M., Hiorns, W.D., Embley, T.M., McCarthy, A.J., and Saunders, J.R. (1993)
The phylogeny of autotrophic ammonia-oxidizing bacteria as determined by analysis
of 16S ribosomal RNA gene sequences. J Gen Microbiol 139: 1147-1153.
Herfort, L., Schouten, S., Abbas, B., Veldhuis, M.J., Coolen, M.J., Wuchter, C. et al.
(2007) Variations in spatial and temporal distribution of Archaea in the North Sea in
relation to environmental variables. FEMS Microbiol Ecol 62: 242-257.
Herrmann, M., Saunders, A.M., and Schramm, A. (2008) Archaea dominate the
ammonia-oxidizing community in the rhizosphere of the freshwater macrophyte
Littorella uniflora. Appl Environ Microbiol 74: 3279-3283.
Horrigan, S.G., and Springer, A.L. (1990) Oceanic and estuarine ammonium oxidation
- effects of light. Limnol Oceanogr 35: 479-482.
96
Ingalls, A.E., Shah, S.R., Hansman, R.L., Aluwihare, L.I., Santos, G.M., Druffel,
E.R.M., and Pearson, A. (2006) Quantifying archaeal community autotrophy in the
mesopelagic ocean using natural radiocarbon. Proc Natl Acad Sci USA 103: 6442-
6447.
Jassby, A.D., and Cloern, J.E. (2000) Organic matter sources and rehabilitation of the
Sacramento-San Joaquin Delta (California, USA). Aquatic Conservation: Marine and
Freshwater Ecosystems 10: 323-352.
Jassby, A.D., Cloern, J.E., and Powell, T.M. (1993) Organic carbon sources and sinks
in San Francisco Bay: variability induced by river flow. Mar Ecol Prog Ser 95: 39-54.
Jensen, K., Revsbech, N.P., and Nielsen, L.P. (1993) Microscale Distribution of
Nitrification Activity in Sediment Determined with a Shielded Microsensor for
Nitrate. Appl Environ Microbiol 59: 3287-3296.
Jensen, K., Sloth, N.P., Risgaard-Petersen, N., Rysgaard, S., and Revsbech, N.P.
(1994) Estimation of Nitrification and Denitrification from Microprofiles of Oxygen
and Nitrate in Model Sediment Systems. Appl Environ Microbiol 60: 2094-2100.
Jones, R.D., and Hood, M.A. (1980) Effects of temperature, pH, salinity, and
inorganic nitrogen on the rate of ammonium oxidation by nitrifiers isolated from
wetland environments. Microb Ecol 6: 339-347.
97
Joye, S.B., and Hollibaugh, J.T. (1995) Influence of sulfide inhibition of nitrification
on nitrogen regeneration in sediments. Science 270: 623-625.
Karner, M.B., DeLong, E.F., and Karl, D.M. (2001) Archaeal dominance in the
mesopelagic zone of the Pacific Ocean. Nature 409: 507-510.
Kennish, M.J. (ed) (2000) Estuary Restoration and Maintenance: the National
Estuary Program. Boca Raton, FL: CRC Press LLC.
Kimmerer, W.J. (2004) Open Water Processes of the San Francisco Estuary: From
Physical Forcing to Biological Responses. San Francisco Estuary and Watershed
Science 2: 1-147.
Könneke, M., Bernhard, A.E., de la Torre, J.R., Walker, C.B., Waterbury, J.B., and
Stahl, D.A. (2005) Isolation of an autotrophic ammonia-oxidizing marine archaeon.
Nature 437: 543-546.
Koper, T.E., El-Sheikh, A.F., Norton, J.M., and Klotz, M.G. (2004) Urease-encoding
genes in ammonia-oxidizing bacteria. Appl Environ Microbiol 70: 2342-2348.

98
Lam, P., Jensen, M.M., Lavik, G., McGinnis, D.F., Muller, B., Schubert, C.J. et al.
(2007) Linking crenarchaeal and bacterial nitrification to anammox in the Black Sea.
Proc Natl Acad Sci USA 104: 7104-7109.
Leininger, S., Urich, T., Schloter, M., Schwark, L., Qi, J., Nicol, G.W. et al. (2006)
Archaea predominate among ammonia-oxidizing prokaryotes in soils. Nature 442:
806-809.
Ludwig, W., Strunk, O., Westram, R., Richter, L., Meier, H., Yadhukumar et al.
(2004) ARB: a software environment for sequence data. Nucleic Acids Res 32: 1363-
1371.
Maddison, D.R., and Maddison, W.P. (2000) MacClade 4: Analysis of phylogeny and
character evolution. Sunderland, Massachusetts: Sinauer Associates.
McCaig, A.E., Phillips, C.J., Stephen, J.R., Kowalchuk, G.A., Harvey, S.M., Herbert,
R.A. et al. (1999) Nitrogen cycling and community structure of proteobacterial beta-
subgroup ammonia-oxidizing bacteria within polluted marine fish farm sediments.
Appl Environ Microbiol 65: 213-220.
McCune, B., and Grace, J.B. (2002) Analysis of Ecological Communities. Gleneden
Beach, Oregon: MjM Software Design.

99
Mincer, T.J., Church, M.J., Taylor, L.T., Preston, C., Karl, D.M., and DeLong, E.F.
(2007) Quantitative distribution of presumptive archaeal and bacterial nitrifiers in
Monterey Bay and the North Pacific Subtropical Gyre. Environ Microbiol 9: 1162-
1175.
Mobley, H.L., Island, M.D., and Hausinger, R.P. (1995) Molecular biology of
microbial ureases. Microbiol Rev 59: 451-480.
Morel, F.M.M., and Price, N.M. (2003) The biogeochemical cycles of trace metals in
the oceans. Science 300: 944-947.
Nakagawa, T., Mori, K., Kato, C., Takahashi, R., and Tokuyama, T. (2007)
Distribution of cold-adapted ammonia-oxidizing microorganisms in the deep-ocean of
the northeastern Japan Sea. Microbes Environ 22: 365-372.
O'Mullan, G.D., and Ward, B.B. (2005) Relationship of temporal and spatial
variabilities of ammonia-oxidizing bacteria to nitrification rates in Monterey Bay,
California. Appl Environ Microbiol 71: 697-705.
Ochsenreiter, T., Selezi, D., Quaiser, A., Bonch-Osmolovskaya, L., and Schleper, C.
(2003) Diversity and abundance of Crenarchaeota in terrestrial habitats studied by 16S
RNA surveys and real time PCR. Environ Microbiol 5: 787-797.

100
Park, H.D., Wells, G.F., Bae, H., Criddle, C.S., and Francis, C.A. (2006) Occurrence
of ammonia-oxidizing archaea in wastewater treatment plant bioreactors. Appl
Environ Microbiol 72: 5643-5647.
Purkhold, U., Wagner, M., Timmermann, G., Pommerening-Roser, A., and Koops,
H.P. (2003) 16S rRNA and amoA-based phylogeny of 12 novel betaproteobacterial
ammonia-oxidizing isolates: extension of the dataset and proposal of a new lineage
within the nitrosomonads. Int J Syst Evol Microbiol 53: 1485-1494.
Purkhold, U., Pommerening-Roser, A., Juretschko, S., Schmid, M.C., Koops, H.P.,
and Wagner, M. (2000) Phylogeny of all recognized species of ammonia oxidizers
based on comparative 16S rRNA and amoA sequence analysis: implications for
molecular diversity surveys. Appl Environ Microbiol 66: 5368-5382.
Rotthauwe, J.H., Witzel, K.P., and Liesack, W. (1997) The ammonia monooxygenase
structural gene amoA as a functional marker: Molecular fine-scale analysis of natural
ammonia-oxidizing populations. Appl Environ Microbiol 63: 4704-4712.
Rysgaard, S., Thastum, P., Dalsgaard, T., Christensen, P.B., and Sloth, N.P. (1999)
Effects of salinity on NH4+ adsorption capacity, nitrification, and denitrification in
Danish estuarine sediments. Estuaries 22: 21-30.

101
Santoro, A.E., and Boehm, A.B. (2007) Frequent occurrence of the human-specific
Bacteroides fecal marker at an open coast marine beach: relationship to waves, tides
and traditional indicators. Environ Microbiol 9: 2038-2049.
Santoro, A.E., Francis, C.A., de Sieyes, N.R., and Boehm, A.B. (2008) Shifts in the
relative abundance of ammonia-oxidizing bacteria and archaea across
physicochemical gradients in a subterranean estuary. Environ Microbiol 10: 1068-
1079.
Schloss, P.D., and Handelsman, J. (2005) Introducing DOTUR, a computer program
for defining operational taxonomic units and estimating species richness. Appl Environ
Microbiol 71: 1501-1506.
Schloss, P.D., and Handelsman, J. (2006) Introducing SONS, a Tool for Operational
Taxonomic Unit-Based Comparisons of Microbial Community Memberships and
Structures. Appl Environ Microbiol 72: 6773-6779.
Seitzinger, S., Harrison, J.A., Bohlke, J.K., Bouwman, A.F., Lowrance, R., Peterson,
B. et al. (2006) Denitrification across landscapes and waterscapes: a synthesis. Ecol
Appl 16: 2064-2090.
102
Stephen, J.R., McCaig, A.E., Smith, Z., Prosser, J.I., and Embley, T.M. (1996)
Molecular diversity of soil and marine 16S rRNA gene sequences related to beta-
subgroup ammonia-oxidizing bacteria. Appl Environ Microbiol 62: 4147-4154.
Stephen, J.R., Chang, Y.J., Macnaughton, S.J., Kowalchuk, G.A., Leung, K.T.,
Flemming, C.A., and White, D.C. (1999) Effect of toxic metals on indigenous soil
beta-subgroup proteobacterium ammonia oxidizer community structure and protection
against toxicity by inoculated metal-resistant bacteria. Appl Environ Microbiol 65: 95-
101.
Swofford, D.L. (2003) PAUP*. Phylogenetic Analysis Using Parsimony (*and Other
Methods). Sunderland, Massachusetts: Sinauer Associates.
ter Braak, C.J.F., and Smilauer, P. (2002) CANOCO Reference Manual and
CanoDraw for Windows User's Guide: Software for Canonical Community Ordination
(version 4.5). Ithaca, NY: Microcomputer Power.
Treusch, A.H., Leininger, S., Kletzin, A., Schuster, S.C., Klenk, H.P., and Schleper, C.
(2005) Novel genes for nitrite reductase and Amo-related proteins indicate a role of
uncultivated mesophilic crenarchaeota in nitrogen cycling. Environ Microbiol 7: 1985-
1995.

103
Venter, J.C., Remington, K., Heidelberg, J.F., Halpern, A.L., Rusch, D., Eisen, J.A. et
al. (2004) Environmental genome shotgun sequencing of the Sargasso Sea. Science
304: 66-74.
Vieira, M., and Bordalo, A. (2000) The Douro estuary (Portugal): a mesotidal salt
wedge. Oceanologica Acta 23: 585-594.
Vitousek, P.M., Aber, J.D., Howarth, R.W., Likens, G.E., Matson, P.A., Schindler,
D.W. et al. (1997) Technical report: Human alteration of the global nitrogen cycle:
Sources and consequences. Ecol Appl 7: 737-750.
Wankel, S.D., Kendall, C., Francis, C.A., and Paytan, A. (2006) Nitrogen sources and
cycling in the San Francisco Bay Estuary: A nitrate dual isotopic composition
approach. Limnol Oceanogr 51: 1654-1664.
Ward, B.B., and O'Mullan, G.D. (2002) Worldwide distribution of Nitrosococcus
oceani, a marine ammonia-oxidizing gamma-proteobacterium, detected by PCR and
sequencing of 16S rRNA and amoA genes. Appl Environ Microbiol 68: 4153-4157.
Wuchter, C., Abbas, B., Coolen, M.J., Herfort, L., van Bleijswijk, J., Timmers, P. et
al. (2006) Archaeal nitrification in the ocean. Proc Natl Acad Sci USA 103: 12317-
12322.
104
Chapter 4. Genome of a Low-Salinity Ammonia-Oxidizing Archaeon Determined by Single-Cell and Metagenomic Analysis Paul C. Blainey*1, Annika C. Mosier*2, Anastasia Potanina1, Christopher A. Francis2 and Stephen R. Quake1 *contributed equally 1Deptartment of Bioengineering, Stanford University, Stanford, CA 94305, USA and Howard Hughes Medical Institute 2Department of Environmental Earth System Science, Stanford University, Stanford, CA 94305-4216, USA Published as: Blainey, P.C.*, Mosier, A.C.*, Potanina, A., Francis, C.A., and S.R. Quake. 2011. Genome of a Low-Salinity Ammonia-Oxidizing Archaeon Determined by Single-Cell and Metagenomic Analysis. PLoS ONE 6: e16626. *contributed equally.

105
Abstract
Ammonia-oxidizing archaea (AOA) are thought to be among the most
abundant microorganisms on Earth and may significantly impact the global nitrogen
and carbon cycles. We sequenced the genome of AOA in an enrichment culture from
low-salinity sediments in San Francisco Bay, using a combined single-cell and
metagenomic approach. Five single cells were isolated inside an integrated
microfluidic device using laser tweezers. Their genomic DNA was amplified by
multiple displacement amplification (MDA) in 50 nL volumes inside the microfluidic
device and then sequenced. This microscopy-based approach to single-cell genomics
minimizes contamination and allows correlation of high-resolution cell images with
genomic sequences. The genome of this AOA, which we designate Candidatus
Nitrosoarchaeum limnia SFB1, is ~1.77 Mb with >2100 genes and a G+C content of
32%. Across the entire genome, the average nucleotide identity to Nitrosopumilus
maritimus, the only AOA in pure culture, is ~70%, suggesting this AOA represents a
new genus of mesophilic Crenarchaeota. Phylogenetically, the 16S rRNA and
ammonia monooxygenase subunit A (amoA) genes of this AOA are most closely
related to sequences reported from a wide variety of freshwater ecosystems. Like N.
maritimus, the low-salinity AOA appear to have an ammonia oxidation pathway
distinct from ammonia oxidizing bacteria (AOB). The genome lacks homologues for
hydroxylamine oxidoreductase or cytochromes c552 and c554, but does encode
numerous copper-binding proteins, including multicopper oxidases and small blue
copper-containing proteins, which may constitute important components of the AOA
electron transfer system. In contrast to other described AOA, these low-salinity AOA
106
appear to be motile, based on the presence of numerous motility- and chemotaxis-
associated genes in the genome. In-depth studies on the physiological and metabolic
potential of this novel group of organisms may ultimately advance our understanding
of the global carbon and nitrogen cycles.

107
Introduction
Mesophilic Crenarchaea (first discovered by Fuhrman et al. [2] and DeLong
[1]) are among the most abundant microorganisms on the planet. [1-2]Crenarchaea
constitute ~10-40% of the total microbial community in the ocean below the euphotic
zone [3-6]. In fact, it is estimated that there are 1.0x1028 crenarchaeal cells in the
world’s oceans compared to 3.1x1028 bacterial cells [3]. In soil systems, Crenarchaea
generally comprise 1-5% of the total prokaryotic community [7-9], but can reach
upwards to 38% in some systems (e.g., temperate acidic forest soils) [10]. It appears
that the vast majority of Crenarchaea in soils and the open ocean possess ammonia
monooxygenase (amoA) genes and thus may be capable of oxidizing ammonia to
nitrite, based on quantitative PCR estimates of 16S rRNA and amoA genes,
fluorescent in situ hybridization, and metagenomic analyses [11-18]. Recent
phylogenetic and genomic analyses suggest that these mesophilic Crenarchaea should
be recognized as a third archaeal phylum, the Thaumarchaeota [19-20].
AOA have proven difficult to isolate in culture, as evidenced by the fact that
only one pure culture [21] has been documented despite reports of several enrichment
cultures [12,22-25]. Many questions remain about the physiology, metabolic and
biogeochemical functions, evolutionary history, and ecological niche partitioning of
AOA. Genome sequencing is a powerful tool that can be used to address these
outstanding questions, yet traditional sequencing approaches require pure cultures or
extreme enrichment of a homogeneous population. Genome sequencing of individual
cells presents a new approach for exploring the genetic makeup of microorganisms
present in heterogeneous mixtures without the need for cell viability or growth.
108
Single-cell genomics can be used independently on uncultured microbes [26-27] or as
a complement to metagenomic studies on enrichment cultures and environmental
samples by aiding in sequence binning and genome reconstruction [28].
Here, we used a combination of single-cell genomic and metagenomic
approaches to sequence the genome of a novel, low salinity-type AOA. The single-
cell approach is useful for obtaining organism-specific sequence datasets from
heterogeneous samples, and furthermore provides an insight into micro-heterogeneity
at the population level. The genomic data reveal sequence features not observed in
other AOA, as well as similarities to published AOA genomes, which speak to the
metabolic potential and environmental relevance of these organisms.
Results and Discussion
Enrichment of ammonia-oxidizing archaea from low-salinity sediments
An ammonia-oxidizing enrichment culture initiated from sediments in the low-
salinity region of San Francisco Bay was dominated by AOA; CARD-FISH showed
that Archaea (Arch915 probe) accounted for approximately 84% of cells in the
enrichment and the remaining 16% were Bacteria (Eub338 I-III probes). The AOA
grew chemoautotrophically by aerobic ammonia oxidation to nitrite. Archaeal amoA
and 16S rRNA gene sequences from the AOA enrichment culture were
phylogenetically distinct (bootstrap supported) from N. martimus [Figure 1], and were
instead most closely related to environmental clones derived from freshwater
ecosystems. In total, over 500 GenBank amoA sequences fell within this phylogenetic
cluster, 79% of which were from low salinity habitats. Another 7% of the sequences
109
were from habitats that experience low salinity at some point in the year (e.g., San
Pablo Bay sites in San Francisco Bay), and 4% of the sequences were from soil. Most
of the remaining sequences were from salt marsh sediments [29], suggesting that this
AOA phylotype may be tolerant of elevated salinity. Nevertheless, the vast majority
of amoA sequences within this clade were from freshwater habitats.
On the basis of these results and the genome analysis described herein, we
propose the provisional classification of this novel archaeon as Candidatus
Nitrosoarchaeum limnia SFB1. The name refers to low-salinity habitat of this
archaeon and to its ability to oxidize ammonia to nitrite. Nitrosoarchaeum comes
from the Latin masculine adjective 'nitrosus' for nitrous and limnia is derived from the
Greek word 'limne' for freshwater (as in limnology) and the strain name SFB1 refers to
its isolation from San Francisco Bay. The short description of Candidatus
Nitrosoarchaeum limnia is a mesophilic, chemolithoautotrophic ammonia-oxidizing
archaeon belonging to the Thaumarchaeota phylum.
On-chip cell sorting
Based on this information suggesting that N. limnia is novel and distinct from
N. maritimus, we employed a combined single cell sorting and metagenomic approach
to obtain the genome sequence of these AOA. A variety of single-cell approaches to
microbial genomics are currently being applied [26-27,30-31]. While all rely on the
multiple displacement amplification (MDA) reaction [32] for the amplification of
unknown genomic DNA sequences, the means by which individual cells are isolated
distinguish the various approaches. Microfluidic flow [30], flow cytometry [31,33],

110
and micromanipulation [27] have all been successfully applied to isolate single cells
for genomic amplification, although each approach has strengths and weaknesses. A
challenge in this case was the tiny, submicron size of the AOA in the enrichment
culture.
We implemented laser tweezer [34-35] based cell sorting inside a microfluidic
device to combine the benefits of a sealed, integrated system for sorting and
amplification, small reaction volumes, and minimum sorting volume. The imaging
and trapping system was adapted to enable visualization and trapping of tiny cells.
This required the application of a high-numerical aperture phase-contrast objective
with high infrared transmission. All reagents were carefully filtered to remove
extraneous particles that could be confused with cells. These features of the optical
sorting method specifically and effectively address the three classes of contamination
with the potential to compromise single cell amplification reactions, namely: the
laboratory environment, amplification reagents, and cells/DNA from the sample itself.
Using this microfludic and laser trapping device, single cells smaller than one micron
in length were sorted from the AOA enrichment culture. The cells were lysed 'on-
chip' using proteinase K and alkaline lysis, and the genomes of each individual cell
were amplified by MDA. Amplified cells were screened for archaeal amoA and 16S
rRNA genes to confirm affiliation with AOA. Based on PCR screening, we selected
the MDA products of five individual AOA cells for genomic sequencing. In addition,
due to the highly enriched nature of the ammonia-oxidizing culture (with respect to the
AOA), we also carried out MDA on a benchtop scale using cells from the enrichment
culture as the template. We directly sequenced the enrichment MDA products to
111
obtain sequences from the 'bulk' enrichment culture metagenome. This combined
single cell/metagenomic approach enabled us to test the single cell assemblies for
completeness and the metagenome for contamination.
Sequencing and assembly
MDA-amplified genomic DNA from the five individual AOA cells was
sequenced using a combination of shotgun (SG) and paired-end (PE) DNA
pyrosequencing approaches on the Roche/454 FLX Titanium platform. MDA
products from both individual cells and the bulk enrichment were used to create
sequencing libraries, which were quantitated using digital PCR [36] and sequenced.
We analyzed 483,350 SG and 56,122 PE reads (119 Mb) obtained from five individual
cells and 160,632 SG and 18,118 PE reads (37 Mb) from the enrichment sample
[table 1]. The G+C contents of the single-cell reads formed a major peak centered at
32.4%, an even lower G+C content than N. maritimus (34.2%) [supplemental figure
1]. To compare the dispersion of the G+C content, we simulated shotgun reads from
N. maritimus with the same average read length as the experimentally derived
datasets. The dispersion of the read G+C content from the single-cell reads was
essentially identical to that found of N. maritimus, confirming that the individual AOA
cells were amplified without contamination from bacterial cells or DNA. The G+C
content of the enrichment reads demonstrated a principal mode similar to the single
cell datasets and N. maritimus (suggesting a large proportion of AOA in the
enrichment), as well as a higher G+C component attributed to sequences from the
bacteria present in the culture.
112
Individually, three of the single-cell datasets gave assemblies in excess of one
megabase from sequencing depths of 10x to 30x, based on an expected genome size of
about 1.7 Mb. The implied 60% genomic coverage is typical in our experience with
single-cell genomic data at such depths of sequencing. The limited genomic coverage
of the single-cell assemblies owes to the phenomenon of MDA amplification bias,
wherein certain regions of the genome are amplified to a greater extent than other
regions. The less-amplified regions are not efficiently sampled by the shotgun
sequencing procedure, and extremely high sequence coverage is required to recover
the under-represented sequences. Interestingly, each of these single-cell assemblies
represents a different 60% of the target genome, indicating that the amplification bias
profile differs from cell to cell. Thus, while further sequencing and efforts to improve
the assembly suffer diminishing returns with respect to an individual cell, great strides
in assembly quality are quickly won by combining the reads obtained from several
individual cells. By pooling the data from the five individual cells sequenced, we
obtain an assembly of 136 elements (26 scaffolds and 110 contigs) for a total of 1.69
Mb of sequence, 1.37 Mb of which was captured in the scaffolds (scaffold N50 = 156
kb) [table 1]. A combination of rarefaction analysis [Figure 1] and comparison to the
metagenomic data indicates (Table 1) that this single-cell assembly represents >95%
of the N. limnia genome.
The metagenome from the bulk enrichment was used as an independent
validation of the single cell data and to supplement the single cell analysis. To
combine the strengths of each dataset—the pure single cell AOA reads with no
bacterial sequences and the bulk enrichment reads with less amplification bias—we
113
generated a high-quality consensus assembly. First, we used five single-cell datasets
to establish a stringent G+C content filter and eliminate high G+C content (>46%)
reads from the enrichment dataset, purging much of the bacterial sequence
contribution prior to assembly of the data. Next, we mapped the single-cell reads to a
de novo assembly of the filtered enrichment reads to identify and reject chimeric
sequences, the occurrence of which is expected to be independent in different datasets.
The small pool of high-G+C reads was mapped against N. maritimus and C.
symbiosum A to recover high G+C content conserved sequences. The overall
consensus assembly contained 2 scaffolds and 29 contigs for a total of 1.77 Mb
(contig N50 = 94 kb) [Table 1]. More than 99% of the assembled bases were
represented by the two scaffolds (1.36 Mb and 0.39 Mb in length). The overall
consensus assembly represents greater than 97% of the genome, based on rarefaction
analysis. The elements from both assemblies were oriented and ordered by homology
to N. maritimus. Orientation was determined by maximizing the sum of the alignment
score to this reference, and the elements ordered according to the hit length-weighted
average subject position of the homologous regions that were co-orientated with the
reference.
Microheterogeneity and sequencing (MDA) error
Comparing homologous regions of the single cell assemblies with each other
and with the enrichment dataset, we consistently find 99.9% average nucleotide
identity. The identity result is a lower limit because of the possibility of errors
introduced in the amplification and sequencing procedures. Newbler reports 5904

114
bases in the assembly as having quality scores lower than 40. If we conservatively
estimate the average quality score of these lower-quality aligned bases at 10 and the
average quality score of the high-quality aligned bases at 40, 234 errors arising from
ambiguous alignments and low-quality raw bases are predicted. Based on independent
measurements (data not shown), we expect a minor contribution of additional errors
based on the MDA procedure, on the order of 1/100,000 bp, or fewer than 20 bases
across the N. limnia genome. Thus, it seems that microheterogeneity among the
enrichment AOA must account for a substantial portion of the SNPs predicted among
the individual cells.
Genome size estimate
Subsets of the enrichment dataset were assembled in a rarefaction analysis to
determine the approximate genome size of N. limnia [figure 2]. The total assembly
size smoothly asymptotes below 1.80 Mb, indicating that the N. limnia assembly
represents an essentially complete genome at 1.77 Mb. We also rarefied the single-
cell data, which we expected to assemble less efficiently than the enrichment dataset,
due to the effect of greater amplification bias in the single cell MDA reactions
compared with the bulk MDA of the enrichment sample. This expectation was borne
out, but the single-cell data does asymptote at approximately the same level. This
suggests that the single-cell dataset contains all the genomic sequences, albeit with
less genomic information per Mb as a result of representation bias. Assembly using
only the single cell data yields a genome that is estimated to be 95% complete [Table
1].
115
Gene prediction and annotation
Gene prediction was carried out on the N. limnia assembly using the FgenesB
platform (Softberry, Inc.), which called 2180 genes, including 2130 protein-coding
ORFs and 50 RNA genes [Table 2]. In total, 86.34 % of the assembled bases were
predicted to code for proteins. The N. limnia genome encodes 45 transfer RNA
(tRNA) genes (42 identified by FgenesB and 3 additional tRNA sequences identified
by comparison with N. maritimus). tRNAs for 18 amino acids were predicted, which
further included two tRNAs with unidentified codon/amino acid specificity. Single
copies of the full-length 16S, 23S, 5S, and 5.8S ribosomal RNA genes exist in the
assembly. The average nucleotide identities of the 16S and 23S genes to N.
maritimus are of 97% and 94%, respectively. In addition, a conserved noncoding
RNA with 93% identity to N. maritimus was identified.
Codon usage and nucleotide skew
The N. limnia codon usage was compared with that of N. maritimus and C.
symbiosum A, with a nucleotide-matched scrambled control as a reference (data not
shown). The codon usage of N. limnia is very similar to that of N. maritimus, which
has a similar G+C content, and distinct from both the high G+C content C. symbiosum
A and the randomized control. This is also the case for N. limnia CDS lacking
homology to database sequences, supporting the identification of these regions as
protein-coding genes.

116
The G+C skew in the N. limnia genome exhibits an irregular pattern
comparable to that observed in other archaeal genomic sequences [figure 3] [37].
Analysis of cumulative G+C and GGG+T skew failed to reveal an obvious origin of
replication, although several strong transition points exist in the genome.
Gene prediction and percent identity comparisons
The N. limnia genome has a coding density of 1.20 protein coding genes per kb
of sequence data, which is slightly higher than the coding density for N. maritimus
(1.09) or C. symbiosum A (0.99) [Table 2]. The N. limnia genome shares 1378 genes
with N. maritimus and 1112 genes with C. symbiosum A (based on Reciprocal Best
Hit [RBH] analysis). The 1378 genes that were RBHs with N. maritimus genes
represent 64.7% of the coding genes predicted in the N. limnia assembly. Conversely,
76.8% of the N. maritimus coding genes were identified as RBHs in the N. limnia
assembly. Only 54.3 % of coding genes in the N. limnia assembly were RBHs with C.
symbiosum A, despite the larger genome size of C. symbiosum A, indicating the
greater evolutionary distance that exists between N. limnia and C. symbiosum A than
exists between N. limnia and N. maritimus.
When compared across the entire length of the genome, N. limnia was distinct
from both N. maritimus and C. symbiosum A [Table 3 and Figure 4]. The average
nucleotide identity across overlapping regions of the N. limnia and N. maritimus
genomes was 76.3% [Table 3]. When scoring non-overlapping genomic regions at an
arbitrary 25% nucleotide identity, the overall nucleotide identity declines to 68.1%.
The percent identity between the N. limnia and C. symbiosum A genomes was even
117
lower, as expected due to the divergent total nucleotide content: 67.4% identity across
overlapping regions and 33.3% when including non-overlapping regions [Table 3].
The cutoff for defining a new species was recently proposed to be 95-96% average
nucleotide identity between two genomes [38]-an updated method of species
circumspcriptions compared to DNA-DNA hybridization. Thus, the much lower
percent identity between N. limnia, N. maritimus and C. symbiosum A across the entire
genome supports the classification of N. limnia as a new genus of AOA. The N.
limnia and N. maritimus genomes shared extensive regions of synteny (gene order),
whereas N. limnia and C. symbiosum A showed very little synteny across the genomes
[Figure 4 and Supplemental Figure 2].
Motility
One of the most striking features of the N. limnia genome, relative to N.
maritimus and C. symbiosum, is the presence of numerous motility-associated genes,
including those required for Flp pilus assembly, flagellar assembly, and chemotaxis
[Table 4]. In total, N. limnia has 38 motility-associated genes, many of which are
clustered in a locus on the largest scaffold [Figure 4]. This is a larger number than
observed in many other archaea including Sulfolobus solfataricus, Aeropyrum pernix,
and Archaeoglobus fulgidus, which all have fewer predicted motility genes (15-20
each). The N. limnia flagellar genes share homology with thermophilic
Crenarchaeota. In addition, the majority of the cells in the AOA enrichment culture
were motile. This appears to be a distinctive trait from N. maritimus and C.
symbiosum A, both of which lack gene suites for assembly of flagella. N. limnia was

118
isolated from estuarine sediments, raising the possibility that this AOA requires
motility to position itself in response to varying substrate and/or oxygen
concentrations in the surface sediments. In contrast, N. maritimus was isolated from
gravel in a tropical fish tank and C. symbiosum A is a symbiont of a marine sponge,
where perhaps motility is less essential. Determining how widespread motility and
chemotaxis are within phylogenetically diverse AOA genera (from water columns,
soils, sediments, etc.) represents an exciting new avenue of research.
Protection from osmotic shock
The N. limnia genome contains one large-conductance mechanosensitive
channel protein and two small-conductance mechanosensitive channel proteins.
Mechanosensitive (MS) channels are found in bacteria, archaea, and eukaryotes. MS
channel proteins protect cells from hypoosmotic shock when a cell transitions from a
high osmolarity environment to a low osmolarity environment [39]. This transition
causes a rapid influx of water into the cells, which increases the internal turgor
pressure and places considerable strain on the cytoplasmic membrane and cell wall.
To release this pressure, the MS channels open, allowing the release of low molecular
mass solutes (K+, glutamate and compatible solutes) out of the cell. This rapidly
decreases the concentration of osmotically-active solutes in the cytoplasm, minimizing
the influx of water and thereby preventing cell lysis. The C. symbiosum A and N.
maritimus genomes appear to lack large-conductance MS channels, although they each
encode at least one small-conductance MS channel protein. N. limnia was isolated
from sediments in the San Francisco Bay estuary that likely experience regular
119
fluctuations in salinity and may depend on these MS channel proteins for protection
from osmotic shock.
The N. maritimus genome contains genes coding for ectoine biosynthesis,
representing the first description of this process in Archaea [40]. Bacteria and
Archaea accumulate many different organic osmolytes, including ectoine, in response
to high osmotic pressure [41]. Notably, the N. limnia genome is missing all four genes
for ectoine biosynthesis (ectA, ectB, ectC, and ectD). Although the N. limnia genome
is not closed, the fact that the genome is missing all four genes suggests that N. limnia
does not use ectoine biosynthesis as a mechanism for dealing with osmotic stress.
These genomic differences may in turn reflect niche differentiation between N.
maritimus (marine) and N. limnia (low-salinity).
Genes conferring resistance
Several phage integrase proteins and one phage SPO1 DNA polymerase-
related protein were identified in the N. limnia genome. However, no obvious
CRISPRs (clustered regularly interspaced short palindromic repeats) were detected in
the genome, which confer resistance to phage infection in many archaeal species,
despite the fact that CRISPRs are found within ~90% of archaeal genomes [[42] and
references within]. Thus, N. limnia may be particularly susceptible to phage infection.
Three transposase genes were also present in the genome and may be an additional
source of genetic exchange and rearrangement. Several genes putatively conferring
antibiotic resistance were found in the N. limnia genome (e.g. beta-lactamase domain-
containing proteins and an antibiotic biosynthesis monooxygenase). The presence of
120
several metal transporters and proteins implicated in metal resistance may reflect
metal exposure in the San Francisco Bay sediments; indeed, there are many potentially
toxic metals in the sediments of North San Francisco Bay [23].
Novel cell division system
In Euryarchaeota and Korarchaeota (as well as most bacteria), cell division is
mediated by FtsZ proteins, which are homologous to tubulin, the building block of the
microtubule cytoskeleton in eukaryotes [43-44]. The sequenced genomes of
hyperthermophilic Crenarchaeota lack FtsZ genes. Instead, it appears that all
Crenarchaeota (with the exception of the Thermoproteales, where the cell division
machinery remains uncharacterized) use a novel Cdv cell division system that is
related to the related to the eukaryotic ESCRT-III sorting complex [44-45]. However,
both the FtsZ and Cdv systems of cell division are evident in the AOA genomes,
including N. limnia, N. maritimus, and C. symbiosum A, as well as the draft genome of
Nitrososphaera gargensis [20]. The striking difference in cell division between these
AOA and all other Crenarchaea supports the proposal that they belong to a third
archaeal phylum, the Thaumarchaeota [19-20].
Chromosome structure and organization
Prokaryotic chromosomal DNA is highly compacted to form a nucleus-like
structure—the nucleoid. Bacteria and Archaea have to compact their genomic DNA
by over 1000-fold [46] by utilizing a wide variety of DNA binding chromatin proteins.
These proteins not only serve to compact the genomic DNA, but also in maintaining
121
the genome in a state that allows access for gene expression, DNA replication and
repair. The two major archaeal chromatin proteins are the archaeal histone and Alba
proteins. Archaeal histones act as spools that DNA wraps around (similar to their
eukaryotic homologs), whereas Alba proteins form extended filamentous fibers
containing DNA [47]. All archaea have either one of these proteins, and many encode
both proteins [48]. The N. limnia genome codes for one histone protein (Nlim1809)
and two Alba proteins (Nlim0610 and Nlim1213).
Carbon metabolism
The N. limnia genome sequence suggests that this organism uses a modified
version of the 3-hydroxypropionate/4-hydroxybutyrate pathway for carbon fixation, as
in N. maritimus and C. symbiosum A [40, 55]. In addition to pathways for autotrophic
carbon fixation, genes putatively inferring the function of organic carbon consumption
have been identified in the genomes of N. limnia, N. maritimus and C. symbiosum A.
Several isotopic studies have suggested that natural populations of AOA may be
capable of mixotrophic growth [4-5,49-51]. It remains to be determined how
important heterotrophy and/or mixotrophy is to AOA in natural environments.
Ammonia oxidation and respiratory chain
In ammonia-oxidizing bacteria (AOB), ammonia is oxidized to hydroxylamine
by ammonia monooxygenase (AMO) composed of α, β, and γ subunits encoded by the
amoA, amoB, and amoC genes, respectively. Hydroxylamine oxidoreductase (HAO)
then oxidizes hydroxylamine to nitrite, generating four electrons that are transferred to

122
the terminal oxidase and AMO via cytochromes c554 and cM552 and the ubiquinone
pool ([52], [53] and references therein).
The N. limnia genome contains genes putatively encoding the α, β, and γ
subunits of the archaeal AMO protein. The gene order in the AMO operon is
conserved amongst N. limnia, N. maritimus [40], and the Sargasso Sea metagenomic
fragments [54]: amoA, hypothetical protein, amoC, followed by amoB. The N. limnia
AMO gene sequences have relatively low identities to N. maritimus, ranging from 80-
91% nucleotide identity and 77-96% amino acid identity [Table 5].
While the details of the ammonia oxidation and electron transfer pathways
remain to be elucidated, AOA, including N. maritimus, C. symbiosum A and N. limnia,
appear to have an ammonia oxidation pathway distinct from AOB [40,55-56]. The N.
maritimus, C. symbiosum A and N. limnia genomes lack homologues for HAO or
cytochromes c554 and cM552, and it remains to be demonstrated whether
hydroxylamine is an intermediate in the pathway. AOA in pure culture produce nitrite
from the oxidation of ammonia [21,57] but the genome sequence annotations do not
include the key HAO enzyme necessary to produce nitrite. The archaeal AMO protein
may not produce hydroxylamine (explaining the missing HAO protein) or the AOA
may contain novel enzymes responsible for the oxidation of hydroxylamine. In either
case, redox reactions in AOA are likely more reliant on copper than iron as seen in the
AOB with the iron-rich HAO enzyme and cytochromes [40,55]. The three AOA
genomes all contain numerous copper-containing proteins, including multicopper
oxidases (MCOs) and small blue copper-containing proteins. These predicted copper-
containing proteins might form the basis of electron transfer in AOA with
123
functionality similar to cytochromes in AOB [40,55]. The N. limnia genome contains
11 blue (type 1) copper domain-containing proteins, 1 cupredoxin blue copper protein,
and 4 multicopper oxidases [Supplemental Table 1]. Alternative pathways for
ammonia oxidation have been proposed by Walker et al. [40]. The N. limnia genome
does not further illuminate the exact mechanism for ammonia oxidation.
Two ammonium transporter genes were identified in the N. limnia genome
(Nlim1421 and Nlim1564). If the AMO protein accesses ammonia outside of the
cytoplasmic membrane (as in AOB), the AOA would not necessarily need ammonium
transporters. However, the RBHs exist between the N. limnia ammonium permeases
and both N. maritimus and C. symbiosum A. The existence of conserved ammonium
transporters in all three genomes suggests a necessary function for this activity. Arp et
al. (2007) [52] proposed that ammonium transporters in AOB might facilitate the
regulation of AMO and HAO that is induced by ammonium or to assist in the uptake
of ammonia for nitrogen assimilation.
Many AOB are able to use urea as an alternative source of ammonia and
carbon dioxide for growth [58]. Ureolysis may therefore be an ecological advantage in
environments with low pH and/or fluctuating ammonia and carbon dioxide
availability. Like N. maritimus [40], there was no evidence that N. limnia has the
ability to use urea as an alternative source of ammonia, because no genes encoding
urea transporters or urease enzymes were identified in the genome. Interestingly,
however, both urea transporter and urease genes were present in the C. symbiosum A
genome [55]. The symbiotic C. symbiosum A may use ureolysis as a mechanism to
remove nitrogenous waste from its host, the marine sponge Axinella mexicana [56].
124
Konstantinidis et al. [16] also reported urease genes in a crenarchaeal genomic
scaffold from 4,000-m-depth at station ALOHA in the Pacific Ocean (along with
amoA, amoB, amoC, and ammonia permease genes), suggesting that urease activity is
a feature of at least some marine water column AOA.
Conclusion
We used an approach combining metagenomic and single cell data to produce
a high quality and complete (but not fully closed) genome of a mesophilic AOA from
a low-salinity estuarine environment – Nitrosoarchaeum limnia. Single-cell genome
sequencing enabled discovery and assembly of 95% of the complete N. limnia
genome; when this data was combined with metagenomic reads derived from the bulk
enrichment culture, greater than 97% of the genome was determined. The genomic
sequence reflects several systems present in the two other AOA genome sequences
available, including the machinery for cell division and ammonia oxidation,
establishing common elements that define this functionally related group of archaea
belonging to the proposed archaeal phylum Thaumarchaeota. The N. limnia genome
also reveals features unique to this environmental AOA, including a substantial suite
of genes for flagellar biosynthesis and chemotaxis, and the presence of a large
mechanosensitive channel that may be crucial for fitness in the estuarine environment.
Several large regions of the genome lacking homology to N. maritimus and C.
symbiosum may encode other functional genes important to the survival of free-living,
estuarine AOA. Cultivation and genomic sequencing of environmentally-relevant
AOA portends further physiological and metabolic studies of this novel and pervasive

125
group of organisms that will ultimately advance our understanding of the global
carbon and nitrogen cycles.
Materials and Methods
Cultivation of archaeal ammonia-oxidizers
Ammonia-oxidizer enrichment cultures were initiated from sediments collected
in northern part of the San Francisco Bay estuary in 2006 (site SU001S; latitude
38°5'55.75"N, longitude 122° 2'47.40"W). Surface sediments were inoculated into a
modified low-salinity version of Synthetic Crenarchaeota Medium [21], as described
by Mosier and Francis (2008) [23]. Cultures were grown in static culture flasks or
serum vials in the dark at room temperature (approximately 22°C). Approximately
10% of the culture volume was routinely transferred into fresh media.
The presence of ammonia-oxidizing archaea was confirmed by gene
sequencing and fluorescent in situ hybridization (FISH). Briefly, DNA was extracted
from the enrichment culture and archaeal 16S rRNA (Arch21F and Arch958R primers;
[1]) and archaeal amoA (Arch-amoAF and Arch-amoAR primers; [59]) genes were
PCR amplified, cloned and sequenced. Catalyzed reporter deposition fluorescence in
situ hybridization (CARD-FISH; e.g., [60]) was carried out with horseradish
peroxidase (HRP)-labeled probes Arch915 [61] and EUB338 I-III [62-63]. Filters
were treated with lysozyme or proteinase K for permeabilization of bacteria and
archaea, respectively.
Phylogenetic trees

126
Archaeal amoA nucleotide sequences were aligned with GenBank sequences
using MacClade version 4.08 [64]. Archaeal 16S rRNA gene sequences were aligned
using the NAST alignment server [65]. Sequences were then manually adjusted and
aligned to the Greengenes 16S rRNA gene database [66] in ARB [67]. For
phylogenetic analyses, a 582-bp region of the sequence alignment was used for amoA
and a 1272-bp region for 16S rRNA. Neighbor joining (based on Jukes-Cantor
correction) and parsimony phylogenetic trees were constructed in ARB [67] with 1000
bootstrap replicates. The set root option in ARB was used to manually root the trees
between the sediment and water column cluster sequences.
Microfluidic device and cell sorting
Microfludidic devices with 32 units for nanoliter MDA reactions were
produced by the Stanford microfluidics foundry. These devices are similar to those
described in Marcy et al. [26]. The chip was pre-treated for 10 minutes with pluronic
F127 at 0.2% in 1x PBS before filling with 1x PBS containing 0.01% Tween-20 and
0.01% pluronic F127 to reduce cell adhesion. The sample was pre-treated with 0.5 - 1
µg/mL proteinase K at room temperature for 10 minutes and then washed in 1x PBS
and resuspended in 50:50 1X PBS:Ethanol. BSA was added to the treated cells (0.1
mg/mL final concentration). Individual cells were sorted one at a time from the bulk
sample using the laser trap, through a two-valve gate, opening one valve at a time to
allow the trapped cell, but not fluid flow, to pass through (see supplemental movie).
Each trapped cell was moved about 1 mm from the bulk sample to the reaction
chamber using the laser trap.
Single-cell amplification

127
The Repli-G midi MDA reagents (Qiagen) were used to amplify individual
cells in 50-60 nL volumes on the device, yielding 107 - 108 genomic equivelants of
dsDNA product. First, cells contained in 0.75 nL PBS with 0.02% Tween-20 were
flushed into the first lysis chamber with 3 nL buffer DLB (supplemented with 0.1 M
dithiothreitol) to complete lysis and denature the genomic DNA. Then, ~50 nL of
reaction mix (45 µL were prepared from 29 µL Repli-G reaction buffer, 10 µL 20 mM
H2O with 0.6% tween, 2 µL Repli-G enzyme, and 2 µL Repli-G stop solution) was
added to each of the 32 reactions. The chip was then transferred to a hot plate set to
32°C and incubated overnight. This was carried out by fitting the outboard product
ports on the chip with plastic pipet tips (P10 size), and by flushing the products into
the pipet tips with the TRIS solution plumbed into the reagent port at 8 psi.
Six µl of each first-round reaction product were re-amplified using the Repli-G
midi kit (Qiagen). Additionally, 1 µl of the proteinase K-treated cell solution used for
sorting was amplified. The template solution was denatured by the addition of 3.5 µl
buffer DLB for 5 minutes at room temperature. The solution was neutralized by
adddition of 3.5 µl stop solution. A reaction mix consisting of 29 µl reaction buffer,
10 µl water, and 1 µl enzyme was prepared on ice, and then added to the denatured
template. Reactions were incubated at 30°C for 12 hours and then diluted 10-fold in
10 mM TRIS with 0.02% Tween-20 and stored at -60°C.
Shotgun and paired-end library prep
Shotgun libraries were prepared from approximately 5 µg of the second round
MDA product according to the Roche/454 protocol for "Titanium" shotgun libraries
with the following modifications. Custom barcoded adaptor oligos (IDT) were used to

128
enable pooling multiple libaries in a single emulsion PCR reaction and picotiter plate
region during sequencing. To obtain dsDNA sequencing libraries and shorten the
library preparation process, the library immobilization, Fill-in, and single-stranded
library isolation steps (steps 3.7 - 3.9) were omitted.
Paired end libraries were prepared from approximately 5 µg of the second
round MDA product according to the Roche/454 protocol for "Titanium 3kb span"
libraries with the following modifications. Custom barcoded adaptor oligos (IDT)
were used in step 3.9.2 to enable pooling multiple libaries in a single emulsion PCR
reaction and picotiter plate region during sequencing. To obtain dsDNA sequencing
libraries and shorten the library preparation process, the library immobilization and
single-stranded library isolation steps (steps 3.12.1 and 3.12.2) were omitted.
Sequencing library quantification
Sequencing libraries were quantified using digital PCR as previously reported
[36], with the exceptions that 48.770 digital arrays (Fluidigm) were used for the
microfluidic dPCR step, and that amplification primers complimentary to the Titanium
adaptor sequences were used. Briefly, serial dilutions of the sequencing libraries were
made in 10 mM TRIS buffer with 0.02% Tween-20. 48 sample preparations were
then combined per the Fluidigm dPCR protocol with a reaction buffer containing
thermostable DNA polymerase, dNTPs, GE sample loading reagent (Fluidigm), and
the primers and probe necessary to carry out the universal Taqman
amplification/detection scheme. The samples were loaded in the chip and run on the
Biomark thermocycler for 45 cycles. Sample analysis was carried out using the
default parameters for dPCR analysis using the Fluidigm analysis software. The
129
quantitated libaries were then diluted to 2 x 10⁶ molecules per microliter in 10 mM
TRIS with 0.02% Tween-20 and aliquotted for storage at -60°C.
Genome sequencing
DNA pyrosequencing of the shotgun and paired-end libraries was carried out
on the Roche 454 Genome Sequencer FLX instrument using "Titanium" chemistry.
Emulsion PCR was carried out with DNA:Bead ratios of 0.3:1 for the shotgun libraries
and 2.5:1 for the paired-end libraries.
Sequence assembly
Reads from the shotgun and paired end pyrosequencing runs were separated by
sample and trimmed using the sfffile tool (Roche) permitting one error in each 10 bp
barcode. The G+C content of the single-cell reads formed a major peak centered at
32.4%, about 2% lower than the average G+C content of N. maritimus (34.2%). The
dispersion of the read G+C content was essentially identical to that of N. maritimus,
with the latter sampled at the same average read length. The few reads with G+C
content greater than 46% were mapped to the N. maritimus genome, and mapping
reads (90% identity over 40 bases) were combined with the low G+C content reads for
subsequent analyses. The reads from the enrichment sample were then assembled de
novo using Newbler (Roche). All assembly operations were carried out with Newbler
v2.3 using default parameters. Paired end reads from the enrichment sample tagged
by the assembler as 'chimeric' were excluded from subsequent operations. Reads from
the single cells were then mapped to the initial enrichment assembly, and 'chimeric'
reads excluded. Contigs made up of single-cell reads were then sampled as 550-mers
with 50 base overlaps and included as reads in the final de novo assembly of the
130
single-cell data. A second, ‘consensus’, de novo assembly was also perfomed using
the single cell pyrosequencing reads (~120 Mb) and the reads from the enrichment
(~37Mb). A small number of short outlier contigs were excluded from the final
assembly due to the identification of sequences from known contaminants from the
MDA kit, such as Delftia acidovorans.
Gene annotation
Genes were predicted on the assembled genome sequence using the FgenesB
program (Softberry, Inc.). Automated FgenesB annotations were manually refined by
reviewing Reciprocal Best Hits (RBH) to Nitrosopumilus maritimus and
Cenarchaeum symbiosum A and BLAST searches against the GenBank database.
Individual proteins of interested were evaluated against “InterPro: the integrative
protein signature database” [68] using InterProScan. RBH were identified using the
blastp algorithm of Blast+ in conjunction with custom Matlab code. RBH are
classified as "high confidence” when the forward hit covered at least 60% of the query
sequence for the gene pair. In total, 1200 genes were functionally annotated and 607
have strong homology to another organism but no assigned function. 323 unannotated
genes (156 of which are 30 aa in length or less) were labeled as "hypothetical
proteins."
Genome sequence analysis
CRISPRFinder [69] and the CRISPR recognition tool (CRT) [70] was used to
search for Clustered Regularly Interspaced Short Palindromic Repeats (CRISPRs)
using the default settings. Synteny plots were created using the Nano+Bio-Center
computational biology software (http://nbc3.biologie.uni-kl.de/). Comparisons were
131
made at the DNA level using Nucmer and then the protein level using Promer by
translating the DNA sequences in all six reading frames. Analyses of nucleotide
content and sequence read statistics were performed using Blast+ on a 64 bit Linux
server and using custom Matlab and Perl code.
Acknowledgments
We thank Richard White for shotgun library preparation and sequencing and
Lolita Penland for sequencing the paired-end libraries. We greatly appreciate Eoghan
Harrington for allowing the use of and providing support for SmashCell in beta release
form (Harrington, Bioinformatics 2010, submitted), and would like to thank Jianbin
Wang and Joshua Weinstein for sharing their analysis of errors arising from MDA of
single template molecules. This work was supported in part by National Science
Foundation Grants MCB-0604270 and OCE-0847266 (to C.A.F.), NIH Director’s
Pioneer Award and NIH 5R01HG004863-02 (to S.R.Q.) and an EPA STAR Graduate
Fellowship (to A.C.M.). The funders had no role in study design, data collection and
analysis, decision to publish, or preparation of the manuscript.
132
Tables
assembly statistic Consensus Single cells only Cell 90507.23 Cell 90507.21 Cell 90507.3
raw reads 693,589 530,748 70,156 200,938 138,886
paired-end reads 33,725 26,953 3,018 517 2,388
raw bases 150,994,537 118,796,782 17,107,411 52,341,561 29,999,202
assembly bases 1,769,573 1,690,404 1,094,113 1,039,820 1,041,604
number of elements 31 136 355 253 348
number of scaffolds 2 26 68 76 83
scaffold bases 1,757,035 1,366,809 852,837 892,230 834,370
scaffold N50 1,363,261 155,965 20,543 16,443 14,147
largest scaffold 1,363,261 263,850 70,423 49,773 41,297
contig bases 1,740,160 1,664,128 1,090,610 1,039,764 1,031,668
contig N50 94,192 28,182 14,827 14,834 9,613
unscaffolded contigs 29 110 287 177 265
largest contig 230,803 135,296 70,423 49,773 27,947
Table 1. N. limnia assembly statistics for the consensus genome (metagenome and five single cells), single
cell coassembly (five single cells), and three individual cell assemblies.
Specifications N. limnia N. maritimus C. symbiosum A
Size, bp 1,769,573 1,645,259 2,045,086
Average G + C content 32 34 58
Predicted genes 2,179 1,840 2,066
Gene density, /kb 1 1 1
Average ORF length (bp) 717 825 924
Coding percentage, % 86 90 91
ORF content
Total number of ORFs 2,130 1,795 2,017
Predicted functional 1,200 1,082 994
Hypotheticals 930 713 1,023
RNA genes
16S-23S rRNA operon 1 1 1
5S rRNA 1 1 1
tRNAs 45 38 45
other RNA 2 2 1
Table 2. Genome features for N. limnia, N. maritimus, and C. symbiosum A.
133
Whole genome comparison N. maritimus C. symbiosum A
number of bases in corresponding regions 1,180,862 398,085
% identity of corresponding regions 76.30% 67.40%
whole genome average % identity* 68.10% 33.30%
Table 3. Whole genome nucleotide identity comparisons between N. limnia, N. maritimus ,
and C. symbiosum A.
* given 25% identity in non-corresponding regions
Motility Associated Genes Number of Genes
Flagella:
Archaeal flagella assembly protein J 1
Archaeal flagellins 5
Predicted ATPases involved in biogenesis of archaeal flagella 1
Type IV secretory pathway, VirB11 components, and related ATPases
involved in archaeal flagella biosynthesis 1
Chemotaxis:
Chemotaxis protein histidine kinase and related kinases 2
Chemotaxis protein; stimulates methylation of MCP proteins 1
Chemotaxis response regulator containing a CheY-like receiver domain
and a methylesterase domain 2
Chemotaxis signal transduction protein 1
CheY-like receiver 19
Methyl-accepting chemotaxis protein 2
Methylase of chemotaxis methyl-accepting proteins 1
Pilus:
Flp pilus assembly protein TadC 2
Table 4. N. limnia genes putatively associated with motility.
134
Individual gene comparison AA Identity NT Identity AA Identity NT Identity
16S rRNA n/a 97% n/a 94%
23S rRNA n/a 94% n/a 89%
ammonia monooxygenase subunit A 95% 89% 95% 78%
ammonia monooxygenase subunit B 92% 88% 76% 75%
ammonia monooxygenase subunit C 96% 91% 93% 81%
AMO-associated hypothetical protein** 77% 80% 73% 72%***
nitrite reductase (nirK) 85% 85% -- --
** ammonia monooxygenase operon-associated hypothetical protein
*** <90% sequence coverage
Table 5. Nucleotide (NT) and amino acid (AA) identities for key individual genes in N. limnia ,
N. maritimus, and C. symbiosum A.
N. limnia vs. N. maritimus N. limnia vs. C. symbiosum A

135
Figures
Figure 1. Phylogeny of ammonia-oxidizing archaea gene sequences. Neighbor-
joining phylogenetic tree of (A) archaeal amoA gene sequences and (B) archaeal 16S
rRNA gene sequences. Grey boxes highlight the putative low-salinity group.
Significant bootstrap values (≥ 50) from 1000 replicates are shown in italics at branch
nodes. Neighbor-joining bootstrap values are above the line and parsimony values are
below the line.
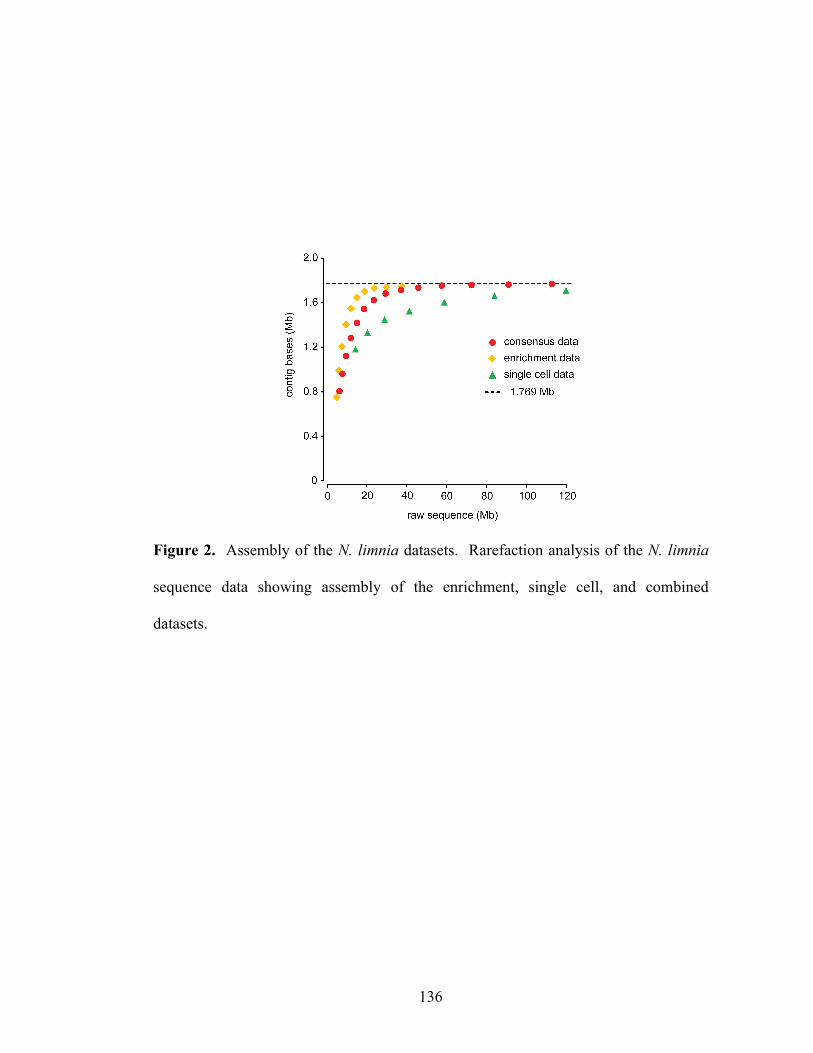
136
Figure 2. Assembly of the N. limnia datasets. Rarefaction analysis of the N. limnia
sequence data showing assembly of the enrichment, single cell, and combined
datasets.

137
Figure 3. Circular representation of the N. limnia genome. From the outer ring to the
inner ring: Scaffold breakpoints are indicated by the inside tick marks, predicted genes
on the forward strand, predicted genes the reverse strand, G+C content, GC skew, and
GGGT skew. On the outer two rings, protein coding sequences are colored gray,
tRNA genes in blue, rRNA genes in red, and noncoding RNA genes in green.

138
Figure 4. Comparison of three AOA genomes. (A) The top panel shows nucleotide
identity of blast hits between the reference genomes and the N. limnia genome. Hits
for N. maritimus and C. symbiosum A are colored according to the position in the
reference (query) genome. The arrow direction indicates the hit direction. On the
right, box plots summarize the distribution of hits from each reference genome to the
N. limnia genome. (B) The positions of the two largest consensus scaffolds are
shown. (C) The sequence novelty index, defined as 2 minus the sum of nucleotide
identity of blast hits to N. maritimus and C. symbiosum A at each position is plotted.

139
A histogram of the values is present at right. (D) The alignment depth in the final
assembly is shown. A histogram of the values is present at right.
140
Supporting Information
Additional Supporting Information may be found in the online version of this article:
Supplemental Figure 1. GC content of raw 454 reads from the 5 single cells and the
AOA enrichment. The GC content of the filtered set of reads used for the final
assembly of N. limnia and simulated reads from the N. maritimus genome are also
shown.
Supplemental Figure 2. Synteny plots of the N. limnia, N. maritimus, and C.
symbiosum A genomes.
Supplemental Table 1. Genes in N. limnia that are putatively involved in ammonia
oxidation and respiration (Table modified from Walker et al., 2010).
Supplemental Movie 1. Movie shows last stage of sorting cell 90507.21 (occurring
in the area on the device beyond the second gate valve). The laser trap is fixed near
the end of the fiducial arrow. In the movie, the cell is moved some 10s of micron
before the stage is stopped. The trap beam is interrupted when the stage is stopped,
freeing the cell to diffuse away. The pixels visible in the fiducial arrow are 0.106
micron wide.

141
Supplemental Dataset. Genbank file Nlimnia_consensus_CAT.gb contains the
concatenated N. limnia genome sequence and annotation. The accession number will
be provided when the database submission is complete.

142
Literature Cited
1. DeLong EF (1992) Archaea in coastal marine environments. Proc Natl Acad Sci U
S A 89: 5685-5689.
2. Fuhrman JA, McCallum K, Davis AA (1992) Novel major archaebacterial group
from marine plankton. Nature 356: 148-149.
3. Karner MB, DeLong EF, Karl DM (2001) Archaeal dominance in the mesopelagic
zone of the Pacific Ocean. Nature 409: 507-510.
4. Herndl GJ, Reinthaler T, Teira E, van Aken H, Veth C, et al. (2005) Contribution of
Archaea to total prokaryotic production in the deep Atlantic Ocean. Appl Environ
Microbiol 71: 2303-2309.
5. Teira E, Lebaron P, van Aken H, Herndl GJ (2006) Distribution and activity of
Bacteria and Archaea in the deep water masses of the North Atlantic. Limnology and
Oceanography 51: 2131-2144.
6. Kirchman DL, Elifantz H, Dittel AI, Malmstrom RR, Cottrell MT (2007) Standing
stocks and activity of Archaea and Bacteria in the western Arctic Ocean. Limnology
and Oceanography 52: 495-507.

143
7. Buckley DH, Graber JR, Schmidt TM (1998) Phylogenetic analysis of
nonthermophilic members of the kingdom Crenarchaeota and their diversity and
abundance in soils. Applied and Environmental Microbiology 64: 4333-4339.
8. Sandaa RA, Enger O, Torsvik V (1999) Abundance and diversity of Archaea in
heavy-metal-contaminated soils. Applied and Environmental Microbiology 65: 3293-
3297.
9. Ochsenreiter T, Selezi D, Quaiser A, Bonch-Osmolovskaya L, Schleper C (2003)
Diversity and abundance of Crenarchaeota in terrestrial habitats studied by 16S RNA
surveys and real time PCR. Environmental Microbiology 5: 787-797.
10. Kemnitz D, Kolb S, Conrad R (2007) High abundance of Crenarchaeota in a
temperate acidic forest soil. Fems Microbiology Ecology 60: 442-448.
11. Leininger S, Urich T, Schloter M, Schwark L, Qi J, et al. (2006) Archaea
predominate among ammonia-oxidizing prokaryotes in soils. Nature 442: 806-809.
12. Wuchter C, Abbas B, Coolen MJ, Herfort L, van Bleijswijk J, et al. (2006)
Archaeal nitrification in the ocean. Proc Natl Acad Sci U S A 103: 12317-12322.

144
13. Mincer TJ, Church MJ, Taylor LT, Preston C, Kar DM, et al. (2007) Quantitative
distribution of presumptive archaeal and bacterial nitrifiers in Monterey Bay and the
North Pacific Subtropical Gyre. Environmental Microbiology 9: 1162-1175.
14. Herfort L, Schouten S, Abbas B, Veldhuis MJW, Coolen MJL, et al. (2007)
Variations in spatial and temporal distribution of Archaea in the North Sea in relation
to environmental variables. Fems Microbiology Ecology 62: 242-257.
15. Beman JM, Popp BN, Francis CA (2008) Molecular and biogeochemical evidence
for ammonia oxidation by marine Crenarchaeota in the Gulf of California. Isme
Journal 2: 429-441.
16. Konstantinidis KT, Braff J, Karl DM, DeLong EF (2009) Comparative
Metagenomic Analysis of a Microbial Community Residing at a Depth of 4,000
Meters at Station ALOHA in the North Pacific Subtropical Gyre. Applied and
Environmental Microbiology 75: 5345-5355.
17. Church MJ, Wai B, Karl DM, DeLong EF (2010) Abundances of crenarchaeal
amoA genes and transcripts in the Pacific Ocean. Environmental Microbiology 12:
679-688.
145
18. Beman JM, Sachdeva R, Fuhrman JA (2010) Population ecology of nitrifying
Archaea and Bacteria in the Southern California Bight. Environmental Microbiology
12: 1282-1292.
19. Brochier-Armanet C, Boussau B, Gribaldo S, Forterre P (2008) Mesophilic
Crenarchaeota: proposal for a third archaeal phylum, the Thaumarchaeota. Nature
Reviews Microbiology 6: 245-252.
20. Spang A, Hatzenpichler R, Brochier-Armanet C, Rattei T, Tischler P, et al. (2010)
Distinct gene set in two different lineages of ammonia-oxidizing archaea supports the
phylum Thaumarchaeota. Trends Microbiol 18: 331-340.
21. Könneke M, Bernhard AE, de la Torre JR, Walker CB, Waterbury JB, et al. (2005)
Isolation of an autotrophic ammonia-oxidizing marine archaeon. Nature 437: 543-546.
22. Santoro AE, Francis CA, de Sieyes NR, Boehm AB (2008) Shifts in the relative
abundance of ammonia-oxidizing bacteria and archaea across physicochemical
gradients in a subterranean estuary. Environ Microbiol 10: 1068-1079.
23. Mosier A, Francis C (2008) Relative abundance and diversity of ammonia-
oxidizing archaea and bacteria in the San Francisco Bay estuary. Environmental
microbiology 10: 3002-3016.

146
24. de la Torre JR, Walker CB, Ingalls AE, Konneke M, Stahl DA (2008) Cultivation
of a thermophilic ammonia oxidizing archaeon synthesizing crenarchaeol. Environ
Microbiol 10: 810-818.
25. Hatzenpichler R, Lebedeva EV, Spieck E, Stoecker K, Richter A, et al. (2008) A
moderately thermophilic ammonia-oxidizing crenarchaeote from a hot spring. Proc
Natl Acad Sci U S A 105: 2134-2139.
26. Marcy Y, Ouverney C, Bik EM, Losekann T, Ivanova N, et al. (2007) Dissecting
biological "dark matter" with single-cell genetic analysis of rare and uncultivated TM7
microbes from the human mouth. Proc Natl Acad Sci U S A 104: 11889-11894.
27. Woyke T, Tighe D, Mavromatis K, Clum A, Copeland A, et al. (2010) One
bacterial cell, one complete genome. Plos One 5: e10314.
28. Dick GJ, Andersson AF, Baker BJ, Simmons SL, Thomas BC, et al. (2009)
Community-wide analysis of microbial genome sequence signatures. Genome Biol 10:
R85.
29. Moin NS, Nelson KA, Bush A, Bernhard AE (2009) Distribution and diversity of
archaeal and bacterial ammonia oxidizers in salt marsh sediments. Appl Environ
Microbiol 75: 7461-7468.
147
30. Marcy Y, Ishoey T, Lasken RS, Stockwell TB, Walenz BP, et al. (2007) Nanoliter
reactors improve multiple displacement amplification of genomes from single cells.
PLoS Genet 3: 1702-1708.
31. Woyke T, Xie G, Copeland A, Gonzalez JM, Han C, et al. (2009) Assembling the
marine metagenome, one cell at a time. Plos One 4: e5299.
32. Dean FB, Nelson JR, Giesler TL, Lasken RS (2001) Rapid amplification of
plasmid and phage DNA using Phi 29 DNA polymerase and multiply-primed rolling
circle amplification. Genome Res 11: 1095-1099.
33. Rodrigue S, Malmstrom RR, Berlin AM, Birren BW, Henn MR, et al. (2009)
Whole genome amplification and de novo assembly of single bacterial cells. Plos One
4: e6864.
34. Ashkin A, Dziedzic JM, Bjorkholm JE, Chu S (1986) Observation of a single-
beam gradient force optical trap for dielectric particles. Opt Lett 11: 288.
35. Neuman KC, Block SM (2004) Optical trapping. Rev Sci Instrum 75: 2787-2809.
36. White RA, 3rd, Blainey PC, Fan HC, Quake SR (2009) Digital PCR provides
sensitive and absolute calibration for high throughput sequencing. BMC Genomics 10:
116.
148
37. Myllykallio H, Lopez P, Lopez-Garcia P, Heilig R, Saurin W, et al. (2000)
Bacterial mode of replication with eukaryotic-like machinery in a hyperthermophilic
archaeon. Science 288: 2212-2215.
38. Richter M, Rossello-Mora R (2009) Shifting the genomic gold standard for the
prokaryotic species definition. Proc Natl Acad Sci U S A 106: 19126-19131.
39. Booth IR, Edwards MD, Black S, Schumann U, Miller S (2007) Mechanosensitive
channels in bacteria: signs of closure? Nature Reviews Microbiology 5: 431-440.
40. Walker CB, de la Torre JR, Klotz MG, Urakawa H, Pinel N, et al. (2010)
Nitrosopumilus maritimus genome reveals unique mechanisms for nitrification and
autotrophy in globally distributed marine crenarchaea. Proc Natl Acad Sci U S A 107:
8818-8823.
41. Burg MB, Ferraris JD (2008) Intracellular organic osmolytes: function and
regulation. J Biol Chem 283: 7309-7313.
42. Horvath P, Barrangou R (2010) CRISPR/Cas, the immune system of bacteria and
archaea. Science 327: 167-170.
149
43. Margolin W (2005) FtsZ and the division of prokaryotic cells and organelles. Nat
Rev Mol Cell Biol 6: 862-871.
44. Lindas AC, Karlsson EA, Lindgren MT, Ettema TJ, Bernander R (2008) A unique
cell division machinery in the Archaea. Proc Natl Acad Sci U S A 105: 18942-18946.
45. Samson RY, Obita T, Freund SM, Williams RL, Bell SD (2008) A role for the
ESCRT system in cell division in archaea. Science 322: 1710-1713.
46. Holmes VF, Cozzarelli NR (2000) Closing the ring: links between SMC proteins
and chromosome partitioning, condensation, and supercoiling. Proc Natl Acad Sci U S
A 97: 1322-1324.
47. Lurz R, Grote M, Dijk J, Reinhardt R, Dobrinski B (1986) Electron microscopic
study of DNA complexes with proteins from the Archaebacterium Sulfolobus
acidocaldarius. EMBO J 5: 3715-3721.
48. Luo X, Schwarz-Linek U, Botting CH, Hensel R, Siebers B, et al. (2007) CC1, a
novel crenarchaeal DNA binding protein. J Bacteriol 189: 403-409.
49. Ouverney CC, Fuhrman JA (2000) Marine planktonic archaea take up amino acids.
Appl Environ Microbiol 66: 4829-4833.
150
50. Ingalls AE, Shah SR, Hansman RL, Aluwihare LI, Santos GM, et al. (2006)
Quantifying archaeal community autotrophy in the mesopelagic ocean using natural
radiocarbon. Proc Natl Acad Sci U S A 103: 6442-6447.
51. Varela MM, van Aken HM, Sintes E, Herndl GJ (2008) Latitudinal trends of
Crenarchaeota and Bacteria in the meso- and bathypelagic water masses of the Eastern
North Atlantic. Environ Microbiol 10: 110-124.
52. Arp, D., Chain, P., and Klotz, M. (2007) The impact of genome analyses on our
understanding of ammonia-oxidizing bacteria. Annual Review of Microbiology 61:
503-528.
53. Hooper A, Mai T, Balny C (2005) Kinetics of reduction by substrate or dithionite
and heme-heme electron transfer in the multiheme hydroxylamine oxidoreductase.
European Journal of Biochemistry 141: 565-571.
54. Venter JC, Remington K, Heidelberg JF, Halpern AL, Rusch D, et al. (2004)
Environmental genome shotgun sequencing of the Sargasso Sea. Science 304: 66-74.
55. Hallam SJ, Mincer TJ, Schleper C, Preston CM, Roberts K, et al. (2006) Pathways
of carbon assimilation and ammonia oxidation suggested by environmental genomic
analyses of marine Crenarchaeota. PLoS Biol 4: e95.

151
56. Hallam SJ, Konstantinidis KT, Putnam N, Schleper C, Watanabe Y, et al. (2006)
Genomic analysis of the uncultivated marine crenarchaeote Cenarchaeum symbiosum.
Proc Natl Acad Sci U S A 103: 18296-18301.
57. Martens-Habbena W, Berube P, Urakawa H, de La Torre J, Stahl D (2009)
Ammonia oxidation kinetics determine niche separation of nitrifying Archaea and
Bacteria. Nature 461: 976-979.
58. Burton SA, Prosser JI (2001) Autotrophic ammonia oxidation at low pH through
urea hydrolysis. Appl Environ Microbiol 67: 2952-2957.
59. Francis CA, Roberts KJ, Beman JM, Santoro AE, Oakley BB (2005) Ubiquity and
diversity of ammonia-oxidizing archaea in water columns and sediments of the ocean.
Proc Natl Acad Sci U S A 102: 14683-14688.
60. Pernthaler A, Pernthaler J (2007) Fluorescence in situ hybridization for the
identification of environmental microbes. Methods Mol Biol 353: 153-164.
61. Stahl DA, Amann RI (1991) Development and application of nucleic acid probes
in bacterial systematics. In: Stackebrandt E, Goodfellow M, editors. Sequencing and
hybridization techniques in bacterial systematics. Chichester, England: John Wiley
and Sons. pp. 205-248.
152
62. Amann RI, Zarda B, Stahl DA, Schleifer KH (1992) Identification of individual
prokaryotic cells by using enzyme-labeled, rRNA-targeted oligonucleotide probes.
Appl Environ Microbiol 58: 3007-3011.
63. Daims H, Bruhl A, Amann R, Schleifer KH, Wagner M (1999) The domain-
specific probe EUB338 is insufficient for the detection of all Bacteria: development
and evaluation of a more comprehensive probe set. Systematic and Applied
Microbiology 22: 434-444.
64. Maddison, D.R., and Maddison, W.P. (2000) Macclade 4: Analysis of Phylogeny
and Character Evolution. Sunderland, MA, USA: Sinauer Associates.
65. DeSantis TZ, Jr., Hugenholtz P, Keller K, Brodie EL, Larsen N, et al. (2006)
NAST: a multiple sequence alignment server for comparative analysis of 16S rRNA
genes. Nucleic Acids Res 34: W394-399.
66. DeSantis TZ, Hugenholtz P, Larsen N, Rojas M, Brodie EL, et al. (2006)
Greengenes, a chimera-checked 16S rRNA gene database and workbench compatible
with ARB. Appl Environ Microbiol 72: 5069-5072.
67. Ludwig W, Strunk O, Westram R, Richter L, Meier H, et al. (2004) ARB: a
software environment for sequence data. Nucleic Acids Res 32: 1363-1371.

153
68. Hunter S, Apweiler R, Attwood TK, Bairoch A, Bateman A, et al. (2009) InterPro:
the integrative protein signature database. Nucleic Acids Res 37: D211-215.
69. Grissa I, Vergnaud G, Pourcel C (2007) CRISPRFinder: a web tool to identify
clustered regularly interspaced short palindromic repeats. Nucleic Acids Res 35: W52-
57.
70. Bland C, Ramsey TL, Sabree F, Lowe M, Brown K, et al. (2007) CRISPR
recognition tool (CRT): a tool for automatic detection of clustered regularly
interspaced palindromic repeats. BMC Bioinformatics 8: 209.
154
Chapter 5. Physiology of a novel low-salinity type AOA reveals niche adaptation Annika C. Mosier1 and Christopher A. Francis1
1Department of Environmental Earth System Science, Stanford University, Stanford, CA 94305-4216, USA

155
Abstract
Ammonia oxidation in marine and terrestrial ecosystems plays a pivotal role in
the cycling of nitrogen and carbon. Recent discoveries have shown that ammonia-
oxidizing archaea (AOA) are both abundant and diverse in these systems, and yet very
little is known about their physiology. Here we report the physiology of a novel low-
salinity type AOA enriched from the San Francisco Bay estuary, ‘Candidatus
Nitrosoarchaeum limnia’ strain SFB1. N. limnia has a much slower growth rate than
Nitrosopumilus maritimus, the only AOA isolate described to date. There was no
change in growth rate or ammonia oxidation when N. limnia was grown under lower
oxygen conditions (5.5% oxygen). Although N. limnia was capable of growing at
75% seawater salinity, growth and ammonia oxidation were inhibited. Allylthiourea
(ATU), a known inhibitor of bacterial ammonia oxidation, inhibited ammonia
oxidation by N. limnia but did not affect the growth rate. We confirmed the presence
of flagella, as suggested by various flagellar genes in the N. limnia genome, using
electron microscopy. Together these findings support the hypothesis that N. limnia is
adapted to specific low-salinity niches where motility may provide an ecological
advantage.

156
Introduction
The recent discovery of ammonia-oxidizing archaea (AOA) capable of
converting ammonia to nitrite has raised many questions about their physiology and
ecology relative to ammonia-oxidizing bacteria (AOB). AOA are found in almost
every environment on Earth, including ocean waters, estuaries, salt marshes,
sediments, soils, hot springs, hydrothermal vents, caves, corals and sponges,
wastewater treatment plants, groundwater, lakes and rivers. AOA outnumber AOB in
many of these environments, often by orders of magnitude (based on quantitative PCR
estimates).
Phylogenetic analysis suggests that different AOA sequence types are found in
different habitats; for example, most soil sequences are phylogenetically distinct from
marine water column sequences. AOA phylogeny and abundance are often correlated
with specific environmental variables (e.g., Erguder et al., 2009; Schleper, 2010 and
references within). A broad-scale biogeography survey of over 8,000 archaeal
ammonia monooxygenase (amoA) sequences from GenBank confirmed that different
habitats contain distinct AOA populations, providing strong evidence for niche
partitioning (Biller et al., in prep).
Physiological studies on AOA cultures are required to further test functional
differences between distinct populations of AOA. Such studies have the potential to
highlight specific traits selected for different habitats. For instance, Nitrosopumilus
maritimus (the only AOA isolate described to date) has a remarkably high affinity for
ammonia and appears to be adapted to life under extreme nutrient limitation (Martens-
157
Habbena et al., 2009). N. maritimus may therefore be able to outcompete AOB in
environments with low ammonia concentrations.
Here, we describe the physiology of a novel, low-salinity type AOA enriched
from the San Francisco Bay estuary, ‘Candidatus Nitrosoarchaeum limnia’ strain
SFB1. The N. limnia genome revealed features that may be crucial for fitness in the
estuarine environment, including a substantial suite of genes for flagellar biosynthesis
and chemotaxis, and the presence of a large mechanosensitive channel protein
involved in protection against osmotic stress (Blainey et al., 2011). Our aim here was
to use the physiological profile of this organism to better understand its potential niche
distribution in the environment.
Results and Discussion
Description of the isolation source
The N. limnia enrichment culture was initiated from sediments in San
Francisco Bay at site SU001S in the northern part of the estuary (Blainey et al., 2011).
At the time of sampling, nutrient concentrations in the bottom water just above the
sediments were 2 µM ammonia, 14 µM nitrate, and 0.9 µM nitrite. Salinity was 7.9,
temperature was 21.6ºC, and sediment C:N ratio was 15.8 (data courtesy of the San
Francisco Bay Regional Monitoring Program). Interestingly, quantitative PCR
suggested that AOA were, on average, 34 times more abundant than AOB in this low-
salinity region of the estuary (Mosier and Francis, 2008). Archaeal amoA sequences
from this region fell into a phylogenetically distinct cluster (Mosier and Francis, 2008)
with sequences from other low-salinity sites, including groundwater (Reed et al.,

158
2010), lakes, rivers (direct GenBank submission; Liu,Z., Huang,S., Sun,G. and
Xu,M.), freshwater macrophytes (Herrmann et al., 2008), and the Douro River estuary
(Magalhaes et al., 2009). The N. limnia archaeal amoA sequence clustered in this
phylogenetic group and its 16S rRNA gene sequence also clustered with sequences
from freshwater ecosystems (Blainey et al., 2011).
Low salinity, estuarine ecotype
Biller et al (in prep) identified six distinct ecotypes amongst AOA amoA
sequences from coastal sediments, lakes, and rivers with strong signals from salinity
and environmental setting. The six ecotypes predominantly corresponded to
populations at 1) high salinity estuary sites; 2) low salinity estuary sites; 3) high
salinity surf zone sites; 4) low salinity surf zone sites; 5) high salinity sites within
estuaries, salt marshes, and heathland pools; and 6) low salinity lake sites. Over 94%
of the sequences from the low salinity region of the San Francisco Bay estuary where
N. limnia was isolated fell within the low-salinity, estuarine ecotype defined by Biller
et al. (in prep). N. limnia is more than 99% identical to sequences from the estuary
sediments (based on amoA genes), and therefore is representative of this low-salinity,
estuarine ecotype.
Habitat distribution of metagenomic blast hits to N. limnia proteins
In order to further explore the biogeography of the N. limnia ecotype, proteins
indentified in the N. limnia genome (Blainey et al., 2011) were queried against “All
Metagenomic ORF peptides” using blastp in CAMERA (Seshadri et al., 2007). Blastp

159
hits to each N. limnia protein were then plotted by habitat type (based on sample
metadata provided by CAMERA). Over 70% of the protien hits were to coastal
sequences (mangrove, estuary, lagoon, coastal ocean) and another 15% hit freshwater
sequences (Figure 1). Among the proteins involved in ammonia oxidation, carbon
cycling, and phophorus aquistion, 82% hit coastal and freshwater sequences. Only
11% of the N. limnia proteins hit open ocean sequences, including 84 hypothetical
proteins, transcription and translation proteins, radical SAM proteins, and others. This
is further evidence that marine AOA are genetically distinct from coastal AOA, which
likely translates into physiological differences as well. Less than 1% hit soil
sequences, which may in part be due to high sequence divergence between
marine/coastal AOA and soil AOA, as well as low representation of soil sequences in
the CAMERA database.
Physiology of N. limnia
N. limnia enrichment cultures were grown under varying conditions, including
low oxygen, high salinity, and in the presence of a nitrification inhibitor. The control
cultures of N. limnia grew chemoautotrophically by aerobic ammonia oxidation to
nitrite with near stoichiometric conversion of ammonia to nitrite (i.e., one mole of
ammonia was converted to one mole of nitrite) (Figure 2). The growth rate was
0.0063 h-1 with a doubling time of 110 h. N. limnia grew much slower than N.
maritimus, which has a growth rate of 0.027 h-1 and a doubling time of 26 h (Martens-
Habbena et al., 2009).
160
When N. limnia was grown under lower oxygen conditions (5.5% oxygen),
there was no significant change in either the oxidation of ammonia to nitrite, growth
rate (0.0065 h-1), or doubling time (107 h) (Figure 2). N. maritimus was unable to
grow under oxygen limitation (Martens-Habbena et al., 2009), although the oxygen
concentration that limited growth was not reported. The lower limit of oxygen that
would support growth of N. limnia is unclear at this time but the data suggest some
capacity to survive under low oxygen conditions.
The N. limnia genotype is most often found in low salinity environments,
although it can be found in environments with high salinity (e.g., salt marshes) or
environments that experience high salinity at some points during the year (e.g., San
Pablo Bay in the San Francisco Bay estuary where the salinity fluctuates seasonally
depending on the volume of freshwater, riverine flow relative to the marine surge). To
test whether N. limnia is tolerant of higher salinity, we grew the enrichment culture at
75% seawater salinity (salinities commonly seen in estuaries). N. limnia grew at high
salinity, yet there was a longer lag time, incomplete oxidation of ammonia to nitrite,
slower growth rate (0.0035 h-1), and longer doubling time (198 h) (Figure 2). Thus, it
appears that N. limnia is capable of surviving at more marine salinities but with
hindered growth that may make it susceptible to being outcompeted by other ammonia
oxidizers.
We also tested the sensitivity of N. limnia to allylthiourea (ATU), which is a
known inhibitor of bacterial ammonia oxidation. At concentration of 172 µM ATU,
N. limnia had no change in growth rate (0.0063 h-1) or doubling time (110 h) but did
show incomplete oxidation of ammonia (Figure 2). Ammonia oxidation by the
161
moderately thermophilic AOA, Nitrososphaera gargensis, was also partially inhibited
at 100 µM ATU (Hatzenpichler et al., 2008). Varied levels of inhibition of ammonia
oxidation were observed in marine water column nitrification rate assays with 86 µM
ATU (Santoro et al., 2010). Each of these ATU concentrations is known to
completely inhibit AOB (Hooper and Terry, 1973; Ginestet et al., 1998) and yet AOA
appear to be much less susceptible to its inhibitory effects. This may be due to
structural differences in the ammonia monoxygenase enzyme between AOA and AOB
since ATU acts directly on this protein. The use of ATU to inhibit nitrification in
marine and terrestrial studies should be reconsidered.
Nitrogen gas production
Nitrous oxide (N2O) is a highly potent greenhouse gas and is currently the
most important contributor to stratospheric ozone depletion (Ravishankara et al.,
2009). N2O concentrations in the atmosphere from natural and anthropogenic sources
may be rising at unprecedented rates (Codispoti, 2010). Ammonia oxidizers are one
of the primary contributors to natural N2O emissions. Under well-oxygenated
conditions, AOB produce N2O at low rates as a by-product of ammonia oxidation. At
low oxygen concentrations, AOB reduce nitrite to N2O via nitrite reductase (Nir) and
nitric oxide reductase (Nor) proteins in a process called nitrifier-denitrification (Arp
and Stein, 2003). Most AOB studied to date have genes coding for the copper-
containing form of nitrite reductase (nirK; Cantera and Stein, 2007).
It appears that many but not all AOA also have nirK genes, providing a
potential pathway for N2O production in AOA. While missing in C. symbiosum,

162
archaeal nirK genes have been identified in N. maritimus, as well as in soils, oceans,
stream biofilms, and lakes (Treusch et al., 2005; Yooseph et al., 2007; Bartossek et al.,
2010; Walker et al., 2010). One nirK gene (Nlim_1007) was identified in the N.
limnia genome (based on analysis of the conserved metal-binding residues within
multicopper oxidases, as described by Bartossek et al. 2010). The N. limnia nirK
sequence shares only 83% and 85% identity to the N. maritimus nirK sequences at the
amino acid level. Using degenerate PCR primers targeting archaeal nirK genes, we
detected a number of N. limnia-like nirK genes in sediments from North San Francisco
Bay (Lund & Francis, unpublished).
Because of the presence of a nirK gene in the N. limnia genome, we measured
N2O gas production from the enrichment cultures (Figure 3). N2O concentrations
increased more than 3.5-fold over the 53 day experiment. Interestingly, N2O
concentrations increased by almost 13-fold in the low oxygen treatment. Carbon
dioxide (CO2) concentrations also increased over the experiment but to a lesser extent
than N2O (average of 1.9-fold across all treatments versus an average of 6.1-fold for
N2O). Oxygen concentrations did not change significantly over time so the increases
in N2O and CO2 are likely not an artifact of the sampling setup (e.g., contamination by
air, vacuum created in the serum vials, etc.). Because the enrichment culture contains
approximately 15-20% bacteria, the production of N2O by N. limnia cannot be
confirmed. However, the N. limnia enrichment conditions are unlikely to support the
growth of other microorganisms known to produce N2O, including AOB, denitrifiers,
and methane oxidizers. A substantial fraction of upper-ocean N2O production may be

163
attributable to archaeal nitrification (Santoro et al., 2010), further suggesting a possible
role of AOA in N2O production.
Motility
The N. limnia genome contains over 38 genes associated with motility,
including those required for Flp pilus assembly, flagellar assembly, and chemotaxis
(Blainey et al., 2011). More than 50% of the motility genes identified in the genome
were found on one gene cassette (Figure 4) containing 13 genes associated with
chemotaxis followed by 8 genes associated with archaeal flagella. The other seven
non-motility genes within the cassette have no annotated function; however, five
genes contained signal peptide or transmembrane domains [identified by InterProScan
(Hunter et al., 2009)]. It is possible that these proteins are also involved in motility or
chemotaxis.
The presence of flagella was confirmed by transmission electron microscopy
(Figure 5). Because >85% of the cells in the enrichment are AOA and the majority of
cells viewed by TEM had flagella (and uniform morphology), we are confident that N.
limnia has a flagellum. The cells appeared as straight rods with an average diameter
of 0.24 µm and length of 0.77 µm (range 0.19 - 0.27 µm x 0.55 - 1.00 µm).
Motility appears to be a distinctive trait of N. limnia; N. maritimus and C.
symbiosum A both of which lack chemotaxis and flagella gene suites. N. limnia was
isolated from estuarine sediments, raising the possibility that it uses motility to
position itself in response to varying substrate and/or oxygen concentrations in the
surface sediments. In contrast, N. maritimus was isolated from gravel in a tropical fish

164
tank and C. symbiosum A is a symbiont of a marine sponge, where motility is perhaps
less essential. Interestingly, in the blastp comparison against all metagenomic proteins
(Figure 1), all of the N. limnia flagellar proteins, both pilus proteins, and 54% of the
chemotaxis proteins had highest hits with sequences from mangroves.
Phosphorus uptake
The N. limnia genome contains genes for phosphorus acquisition using the
high-affinity inorganic phosphate-specific transporter (Pst) system. The Pst system
(Wanner, 1993; Oganesyan et al., 2005) includes proteins that transfer inorganic
phosphorus through the inner membrane (PstA and PstC; Nlim_0923 and Nlim_0924),
an ATPase that energizes transport (PstB; Nlim_0922), a periplasmic inorganic
phosphorus-binding protein (PstS; Nlim_0927), and an uptake regulator (PhoU;
Nlim_0921, Nlim_1362, Nlim_1441, and Nlim_0925). N. limnia does not appear to
have the sensor or response regulator proteins in the Pst system (PhoR and PhoB). N.
limnia may also have the ability to use the low-affinity inorganic phosphate-specific
transporter (Pit) system. The Pit system consists of a single membrane protein
(putatively Nlim_0661 or Nlim_0662) and is the preferential transport system when
inorganic phosphorus is in excess (Wanner, 1993; Gebhard et al., 2009). Unlike N.
maritimus (Walker et al., 2010), the N. limnia genome has no genes for transport of
organic phosphorus. The northern region of San Francisco Bay where N. limnia was
isolated has lower phosphate concentrations (2.7 µM on average) than the rest of the
estuary (Wankel et al., 2006); however, phosphorus does not limit phytoplankton

165
productivity (Peterson et al., 1985; Jassby, 2008). Thus, N. limnia may not require the
utilization of organic phosphorus since inorganic phosphorus is in excess.
Carbon metabolism
Six autotrophic CO2 fixation pathways are known: the reductive pentose
phosphate cycle (Calvin–Benson–Bassham cycle), the reductive citric acid cycle
(Arnon–Buchanan cycle), the reductive acetyl-CoA pathway (Wood–Ljungdahl
pathway), the 3-hydroxypropionate/malyl-CoA cycle, the 3-hydroxypropionate/4-
hydroxybutyrate cycle (Berg et al., 2007), and the dicarboxylate/4-hydroxybutyrate
cycle (Huber et al., 2008). All Crenarchaeota and Thaumarchaeota (N. maritimus and
C. symbiosum A) appear to use either the 3-hydroxypropionate/4-hydroxybutyrate
cycle or the dicarboxylate/4-hydroxybutyrate cycle, but not both (based on
experimental evidence or genome annotations) (Hallam et al., 2006; Berg et al., 2007;
Jahn et al., 2007; Huber et al., 2008; Berg et al., 2010; Walker et al., 2010). It was
previously thought that the fundamental difference between these two autotrophic
pathways was their different sensitivity to oxygen: the 3-hydroxypropionate/4-
hydroxybutyrate cycle can tolerate oxygen, whereas the dicarboxylate/4-
hydroxybutyrate cycle is oxygen sensitive. However, recent evidence suggests that
the distribution of these pathways correlates with 16S rRNA-based phylogeny, rather
than with aerobic or anaerobic metabolism (Berg et al., 2010).
The N. limnia genome contains genes that putatively encode enzymes involved
in most steps of the 3-hydroxypropionate/4-hydroxybutyrate pathway (Supplemental
Figure 1). In this cycle, one acetyl-CoA and two bicarbonate molecules are converted
166
to succinyl-CoA via 3-hydroxypropionate. Succinyl-CoA is then reduced to 4-
hydroxybutyrate and converted into two acetyl-CoA molecules by the key enzyme 4-
hydroxybutyryl-CoA dehydratase. The N. limnia genome is missing enzymes
responsible for the conversion of malonyl-CoA to propionyl-CoA. However, as
proposed by Berg et al. (2007), various alcohol dehydrogenases, aldehyde
dehydrogenases, acyl-CoA synthetases, or enoyl-CoA hydratases may fulfill the same
functions.
Many enzymes of the tricarboxylic acid (TCA) cycle are encoded by the N.
limnia genome. The TCA cycle is involved in the oxidative breakdown of
carbohydrates, lipids, and proteins. The enzyme citrate synthase transfers the two-
carbon acetyl group in acetyl-CoA to the four-carbon compound oxaloacetate to form
the six-carbon compound citrate. Citrate is subsequently oxidized in a stepwise
manner to CO2, supplying NADH for oxidative phosphorylation and other metabolic
processes. Alternatively, the TCA cycle can run in the reverse direction producing
acetyl-CoA from two molecules of CO2 as a means of autotrophy. Acetyl-CoA is then
reduced to pyruvate, from which other central metabolites can be formed. In the
reductive TCA cycle, the enzyme citrate lyase is required to split citrate into acetyl-
CoA and oxaloacetate. Genes potentially encoding steps in both the oxidative and
reductive TCA cycle were identified in the N. limnia genome. However, only one
subunit of the citrate lyase protein, required for the reductive TCA cycle, was
identified. Additionally, genes encoding the enzyme in step five of the cycle between
2-oxoglutarate and succinyl-CoA (2-oxoglutarate ferredoxin oxidoreductase) could not
be confirmed. Taken together, N. limnia may utilize a horseshoe version of the TCA
167
cycle—in the oxidative direction from citrate to 2-oxoglutarate and in the reductive
direction from oxaloacetate to succinate—as described in C. symbiosum A (Hallam et
al., 2006).
Materials and Methods
Cultivation of ammonia oxidizing archaea
Enrichment cultures of Candidatus Nitrosoarchaeum limnia SFB1 were
maintained as previously described (Blainey et al., 2011). Briefly, the cultivation
media contained 500 µM ammonium chloride, 1 mL selenite/tungstate solution, 1 mL
vitamin solution (Balch et al., 1979), 1 mL sodium bicarbonate (1M), 10 mL KH2PO4
(4g g L-1), 1 mL trace metals (Biebl and Pfennig, 1978), and 988 mL artificial
seawater diluted to ~25% seawater salinity.
Physiology experiments
AOA enrichment cultures were grown in sealed serum vials in the dark at room
temperature. The AOA were grown under different treatment conditions: high salinity
media, freshwater media, ~5% oxygen, ~3% oxygen, ~2% oxygen, and with the
addition of 172 µM ATU, an ammonia oxidation inhibitor. Each treatment included
three replicates and a negative control containing only media (with the exception of
the allylthiourea treatment, which did not include a negative control). The high
salinity media was made as described above using artificial seawater diluted to ~75%
seawater salinity. The freshwater media was made as described above except that
minimal salts were added instead of artificial seawater (1 g L-1 NaCl, 0.4 g L-1
MgCl2•6H2O, 0.1 g L-1 CaCl2•2H2O and 0.5 g L-1 KCl; as described by de la Torre et

168
al., 2008). The N. limnia enrichment culture was innoculated into the media at a 1%
volume ratio.
Two mL of the culture was collected periodically for nutrient analysis and
frozen at –20ºC. Nitrite and ammonium concentrations were measured on a
QuikChem 8000 Flow Injection Analyzer (Lachat Instruments). Three mL of
headspace was sampled periodically to measure oxygen, nitrous oxide, carbon dioxide,
and methane gases using the Shimadzu 2014 gas chromatograph.
Flourescent in situ hybridization
For in situ hybridization, cultures were fixed in 2% formaldehyde and filtered
onto 0.2 µm polycarbonate membranes (Millipore). Catalyzed reporter deposition
fluorescence in situ hybridization (CARD-FISH; e.g., Pernthaler and Pernthaler, 2007)
was carried out with horseradish peroxidase (HRP)-labeled probes Arch915 (Stahl and
Amann, 1991) and EUB338 I-III (Amann et al., 1992; Daims et al., 1999). Filters
were treated with lysozyme or proteinase K for permeabilization of bacteria and
archaea, respectively.
Electron microscopy
Scanning and Transmission Electron Microscopy were performed at the Cell
Sciences Imaging Facility at Stanford University. For Scanning Electron Microscopy
(SEM), samples were fixed overnight in 2% glutaraldehyde with 4%
paraformaldehyde (PFA) in 0.1M sodium cacodylate buffer (pH 7.3). 100 µl of
preserved samples were allowed to settle onto poly-L-lysine coated 12mm circular
glass coverslips, before post-fixation (1 hr) in 1% aqueous Osmiumtetroxide. Samples
were then dehydrated in a graded ethanol series (50-70-80-90-100% ethanol; 15

169
minutes each), before critical point drying with liquid CO2 in a Tousimis Autosamdri-
814 apparatus (Tousimis, Rockville, MD, USA). Specimens were mounted onto 12-
mm aluminum stubs with colloidal graphite and sputter-coated with a 100 Å layer of
Au/Pd using a Denton Desk II Vacuum unit. Visualization was performed with a
Hitachi S-3400N Variable Pressure (VP) SEM operated at 10-15 kV, working distance
7 to 8 mm, and secondary electron detector under high-vacuum conditions.
For transmission electron microscopy (TEM) with negative staining, 10 µl
samples (unfixed or fixed in 4% PFA with 2% glutaraldehyde in 0.1M NaCacodylate,
pH 7.3) were spotted onto glow-discharged formvar-coated 100 mesh copper TEM
grids and allowed to settle for 5 minutes. Grids were then stained with 1% Uranyl
Acetate for 2 minutes, and dried overnight before visualization with a JEOL 1230
TEM, operated at 80 kV.
Fragment recruitment
Protein sequences indentified in the N. limnia genome (Blainey et al., 2011)
were blasted against the “All Metagenomic ORF peptides” database in CAMERA
(Seshadri et al., 2007). Blastp searches in CAMERA used the NCBI default blastall
parameters with one database alignment per query. Blast hits to each N. limnia protein
were then plotted by habitat type (based on sample metadata provided by CAMERA).
Acknowledgments
We thank L.M. Joubert at the Stanford Cell Sciences Imaging Facility for
performing electron microscopy. This work was funded by National Science
Foundations grants (OCE-0847266) to C.A.F.
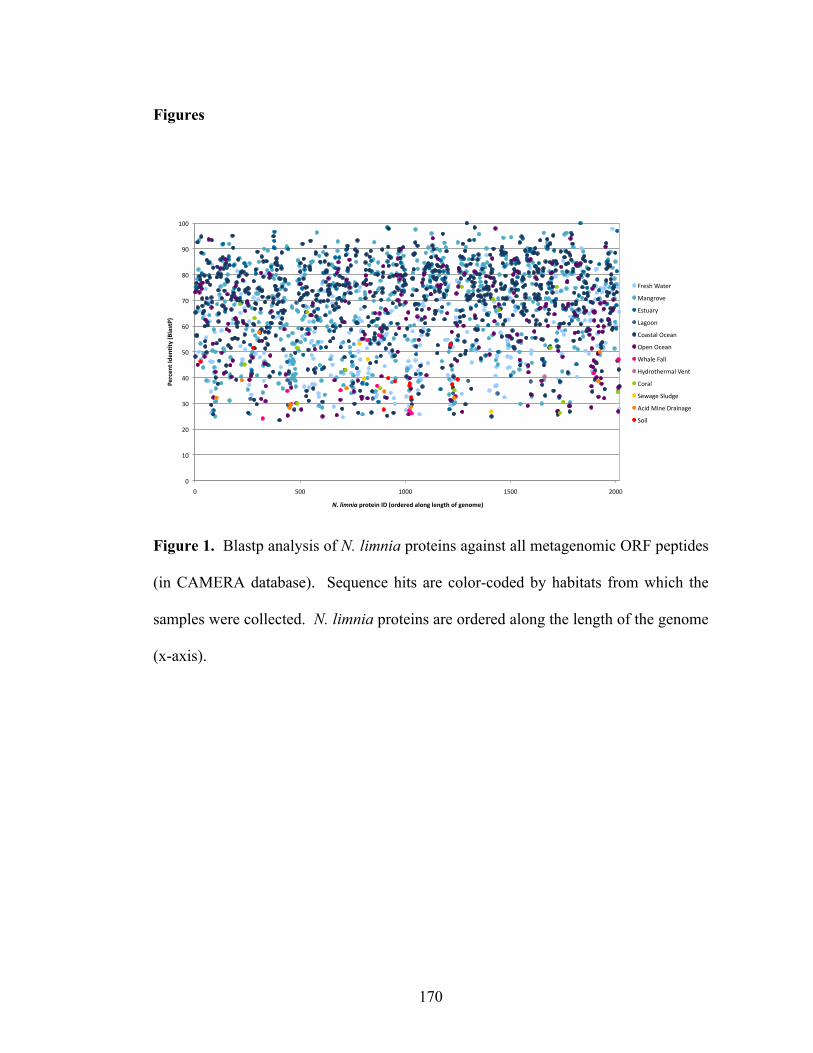
170
Figures
Figure 1. Blastp analysis of N. limnia proteins against all metagenomic ORF peptides
(in CAMERA database). Sequence hits are color-coded by habitats from which the
samples were collected. N. limnia proteins are ordered along the length of the genome
(x-axis).
!"
#!"
$!"
%!"
&!"
'!"
(!"
)!"
*!"
+!"
#!!"
!" '!!" #!!!" #'!!" $!!!"
!"#$"%&'()"%*&+',-./0&!1'
!"#$%&'%(#2#3&"4%'(5',3#)"#")'/.3%6'."%6&7'38'6"%39"1'
,-./0"123.-"
4256-78."
9/3:2-;"
<26775"
=72/32>"[email protected]"
?A.5"[email protected]"
102>.",2>>"
B;C-730.-D2>"E.53"
=7-2>"
F.G26."F>:C6."
H@IC"4I5."J-2I526."
F7I>"

171
Figure 2. Ammonia oxidation by N. limnia under different growth conditions.
!"
#!"
$!!"
$#!"
%!!"
%#!"
&!!"
&#!"
'!!"
'#!"
#!!"
!" (" $'" %$" %)" &#" '%" '*" #+"
µ!"
#$%&"
'('"
,-'"
,.%"
!"
#!"
$!!"
$#!"
%!!"
%#!"
&!!"
&#!"
'!!"
'#!"
#!!"
!" (" $'" %$" %)" &#" '%" '*" #+"
µ!"
#$%&"
)*+"(,%-./"
,-'"
,.%"
!"
#!"
$!!"
$#!"
%!!"
%#!"
&!!"
&#!"
'!!"
'#!"
#!!"
!" (" $'" %$" %)" &#" '%" '*" #+"
µ!"
#$%&"
'01"
,-'"
,.%"
!"
#!"
$!!"
$#!"
%!!"
%#!"
&!!"
&#!"
'!!"
'#!"
#!!"
!" (" $'" %$" %)" &#" '%" '*" #+"
µ!"
#$%&"
23-4"5$63/37%"
,-'"
,.%"
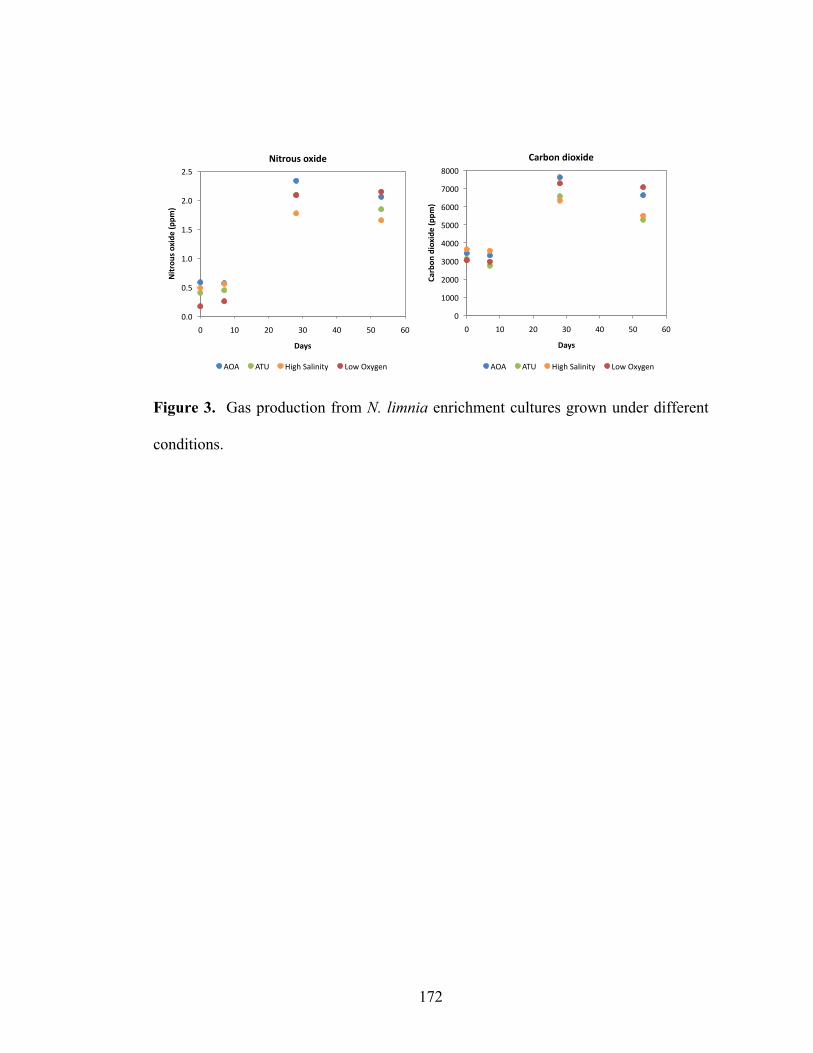
172
Figure 3. Gas production from N. limnia enrichment cultures grown under different
conditions.
!"!#
!"$#
%"!#
%"$#
&"!#
&"$#
!# %!# &!# '!# (!# $!# )!#
!"#$%&'(%)"*+(,--./(
012'(
!"#$%&'(%)"*+(
*+*# *,-# ./01#234/5/67# 89:#+;70<5#
!#
%!!!#
&!!!#
'!!!#
(!!!#
$!!!#
)!!!#
=!!!#
>!!!#
!# %!# &!# '!# (!# $!# )!#
31$4%5(*"%)"*+(,--./(
012'(
31$4%5(*"%)"*+(
*+*# *,-# ./01#234/5/67# 89:#+;70<5#
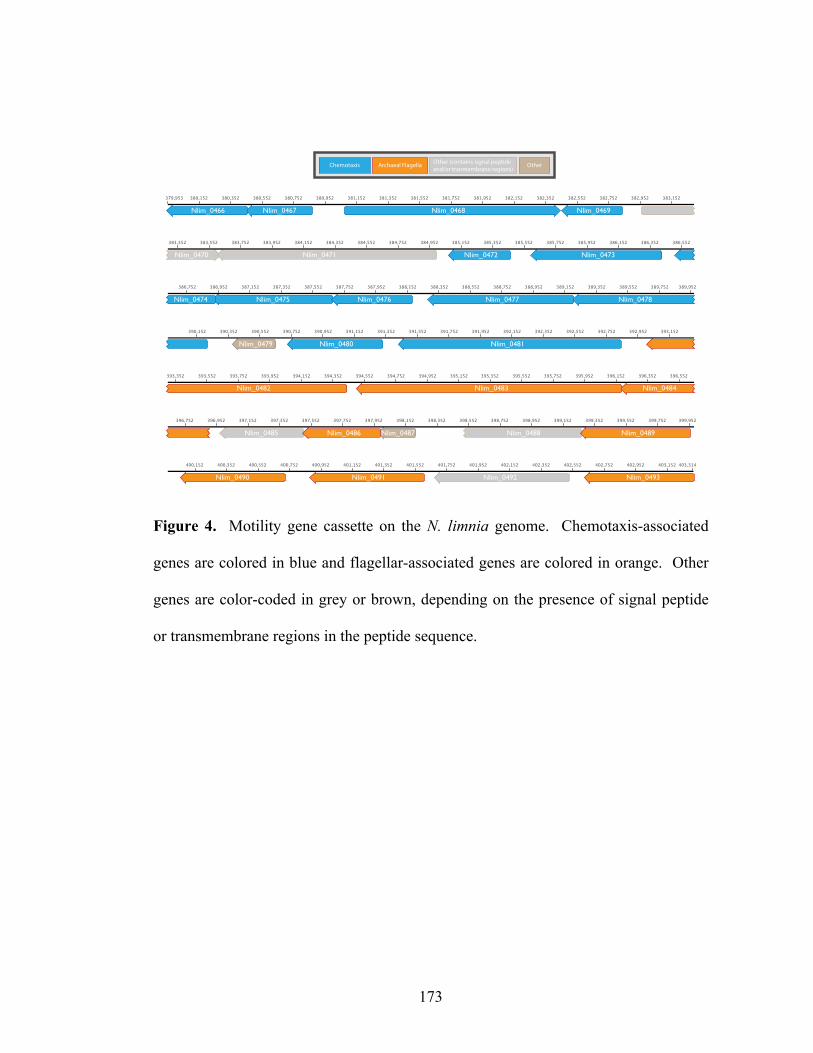
173
Figure 4. Motility gene cassette on the N. limnia genome. Chemotaxis-associated
genes are colored in blue and flagellar-associated genes are colored in orange. Other
genes are color-coded in grey or brown, depending on the presence of signal peptide
or transmembrane regions in the peptide sequence.
Other (contains signal peptide and/or tranmembrane regions)
Chemotaxis Archaeal Flagella Other
Nlim_0478
Nlim_0466 Nlim_0467 Nlim_0468 Nlim_0469
Nlim_0470 Nlim_0471 Nlim_0472 Nlim_0473
Nlim_0474 Nlim_0475 Nlim_0476 Nlim_0477 Nlim_0478
Nlim_0485 Nlim_0486 Nlim_0487 Nlim_0488 Nlim_0489
Nlim_0490 Nlim_0491 Nlim_0492 Nlim_0493
Nlim_0479 Nlim_0480 Nlim_0481
Nlim_0483Nlim_0482 Nlim_0484
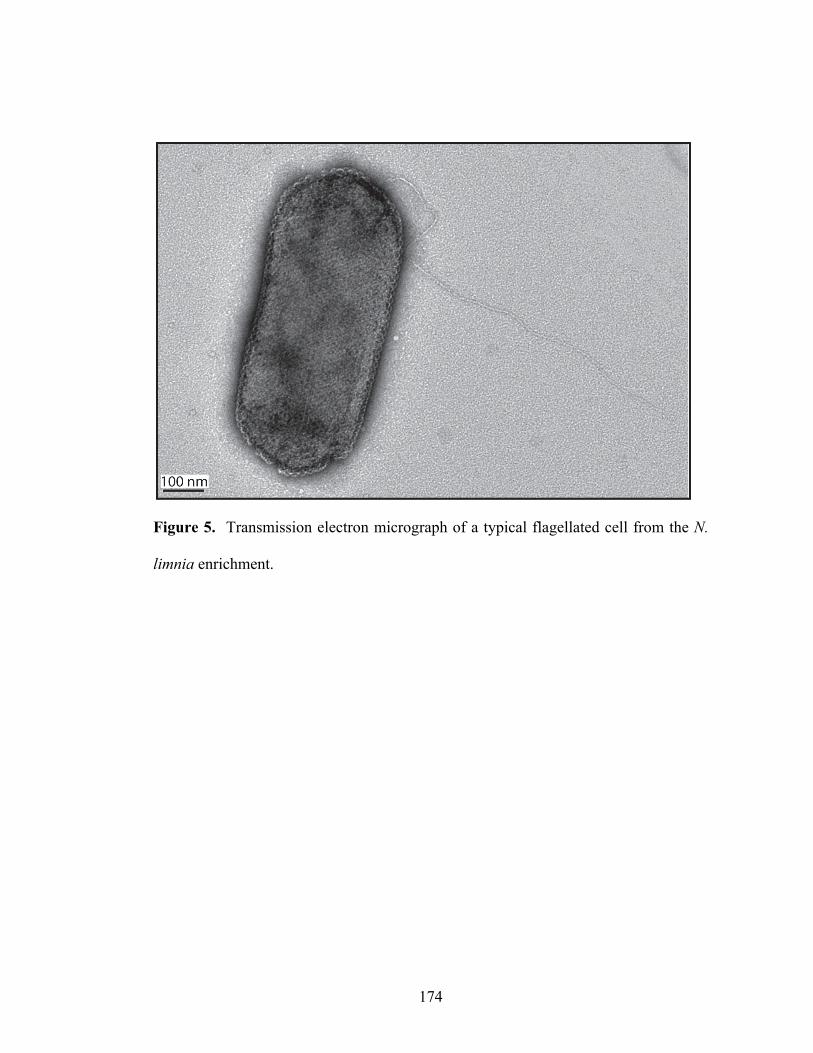
174
Figure 5. Transmission electron micrograph of a typical flagellated cell from the N.
limnia enrichment.
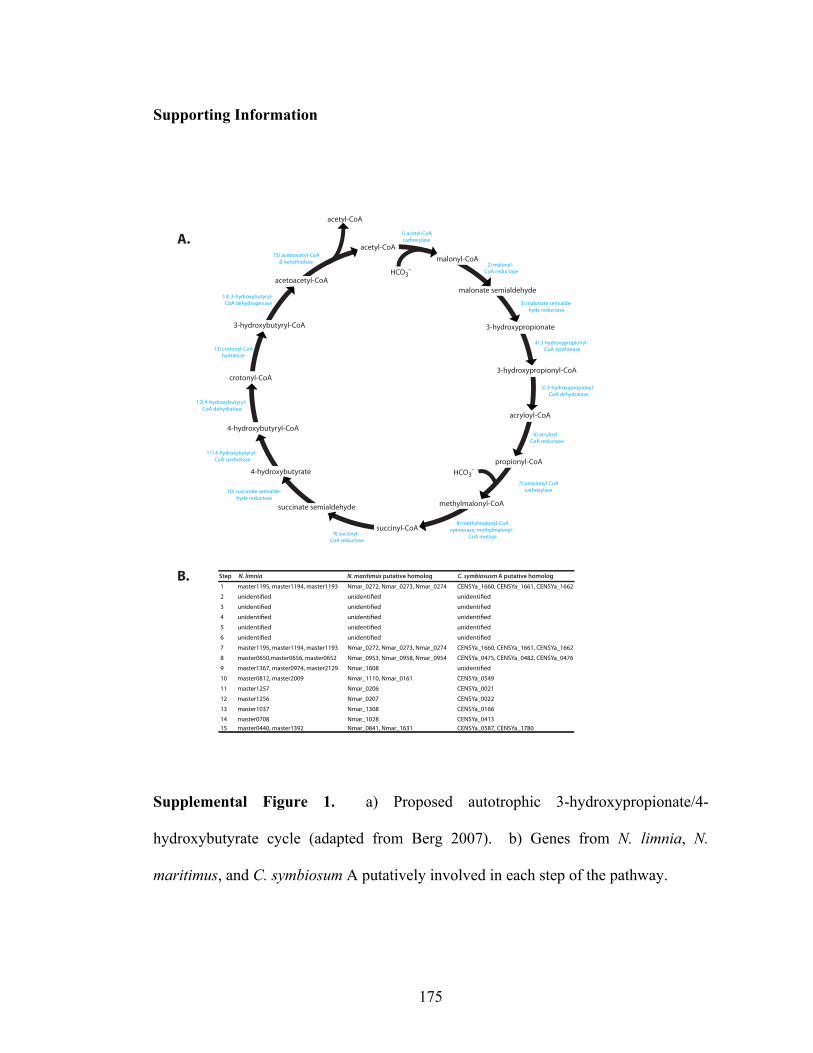
175
Supporting Information
Supplemental Figure 1. a) Proposed autotrophic 3-hydroxypropionate/4-
hydroxybutyrate cycle (adapted from Berg 2007). b) Genes from N. limnia, N.
maritimus, and C. symbiosum A putatively involved in each step of the pathway.
acetyl-CoAmalonyl-CoA
malonate semialdehyde
3-hydroxypropionate
3-hydroxypropionyl-CoA
acryloyl-CoA
propionyl-CoA
methylmalonyl-CoA
succinyl-CoA
succinate semialdehyde
4-hydroxybutyrate
4-hydroxybutyryl-CoA
crotonyl-CoA
3-hydroxybutyryl-CoA
acetoacetyl-CoA
acetyl-CoA
HCO3-
HCO3-
A.
B.
1) acetyl-CoA carboxylase
2) malonyl-CoA reductase
3) malonate semialde-hyde reductase
4) 3-hydroxypropionyl-CoA synthetase
5) 3-hydroxypropionyl-CoA dehydratase
6) acryloyl-CoA reductase
7) propionyl-CoA carboxylase
8) methylmalonyl-CoA epimerase; methylmalonyl-
CoA mutase9) succinyl-CoA reductase
10) succinate semialde-hyde reductase
11) 4-hydroxybutyryl-CoA synthetase
12) 4-hydroxybutyryl-CoA dehydratase
13) crotonyl-CoA hydratase
14) 3-hydroxybutyryl-CoA dehydrogenase
15) acetoacetyl-CoA !-ketothiolase
1 master1195, master1194, master1193 Nmar_0272, Nmar_0273, Nmar_0274 CENSYa_1660, CENSYa_1661, CENSYa_1662
2 unidenti"ed unidenti"ed unidenti"ed
3 unidenti"ed unidenti"ed unidenti"ed
4 unidenti"ed unidenti"ed unidenti"ed
5 unidenti"ed unidenti"ed unidenti"ed
6 unidenti"ed unidenti"ed unidenti"ed
7 master1195, master1194, master1193 Nmar_0272, Nmar_0273, Nmar_0274 CENSYa_1660, CENSYa_1661, CENSYa_1662
8 master0650,master0656, master0652 Nmar_0953, Nmar_0958, Nmar_0954 CENSYa_0475, CENSYa_0482, CENSYa_0476
9 master1367, master0974, master2129 Nmar_1608 unidenti"ed
10 master0812, master2009 Nmar_1110, Nmar_0161 CENSYa_0549
11 master1257 Nmar_0206 CENSYa_0021
12 master1256 Nmar_0207 CENSYa_0022
13 master1037 Nmar_1308 CENSYa_0166
14 master0708 Nmar_1028 CENSYa_041315 master0440, master1392 Nmar_0841, Nmar_1631 CENSYa_0587, CENSYa_1780
Step N. limnia N. maritimus putative homolog C. symbiosusm A putative homolog
176
Literature Cited
Amann, R.I., Zarda, B., Stahl, D.A., and Schleifer, K.H. (1992) Identification of
individual prokaryotic cells by using enzyme-labeled, rRNA-targeted oligonucleotide
probes. Applied and Environmental Microbiology 58: 3007-3011.
Arp, D.J., and Stein, L.Y. (2003) Metabolism of inorganic N compounds by ammonia-
oxidizing bacteria. Crit Rev Biochem Mol Biol 38: 471-495.
Balch, W.E., Fox, G.E., Magrum, L.J., Woese, C.R., and Wolfe, R.S. (1979)
Methanogens: Reevaluation of a unique biological group. Microbiological Reviews
43: 260-296.
Bartossek, R., Nicol, G.W., Lanzen, A., Klenk, H.-P., and Schleper, C. (2010)
Homologues of nitrite reductases in ammonia-oxidizing archaea: diversity and
genomic context. Environmental Microbiology 12: 1075-1088.
Berg, I., Kockelkorn, D., Buckel, W., and Fuchs, G. (2007) A 3-hydroxypropionate/4-
hydroxybutyrate autotrophic carbon dioxide assimilation pathway in Archaea. Science
318: 1782-1786.
Berg, I.A., Ramos-Vera, W.H., Petri, A., Huber, H., and Fuchs, G. (2010) Study of the
distribution of autotrophic CO2 fixation cycles in Crenarchaeota. Microbiology
(Reading, Engl) 156: 256-269.
177
Biebl, H., and Pfennig, N. (1978) Growth yields of green sulfur bacteria in mixed
cultures with sulfur and sulfate reducing bacteria. Archives of Microbiology 117: 9-16.
Blainey, P.C.*, Mosier, A.C.*, Potanina, A., Francis, C.A., and Quake, S.R. (2011)
Genome of a Low-Salinity Ammonia-Oxidizing Archaeon Determined by Single-Cell
and Metagenomic Analysis. PLoS ONE 6: e16626. *contributed equally.
Cantera, J., and Stein, L. (2007) Molecular diversity of nitrite reductase genes (nirK)
in nitrifying bacteria. Environmental Microbiology 9: 765-776.
Codispoti, L.A. (2010) Oceans. Interesting times for marine N2O. Science 327: 1339-
1340.
Daims, H., Brühl, A., Amann, R., Schleifer, K.H., and Wagner, M. (1999) The
domain-specific probe EUB338 is insufficient for the detection of all Bacteria:
development and evaluation of a more comprehensive probe set. Systematic and
Applied Microbiology 22: 434-444.
de la Torre, J., Walker, C., Ingalls, A., Konneke, M., and Stahl, D. (2008) Cultivation
of a thermophilic ammonia oxidizing archaeon synthesizing crenarchaeol.
Environmental Microbiology 10: 810-818.
178
Erguder, T.H., Boon, N., Wittebolle, L., Marzorati, M., and Verstraete, W. (2009)
Environmental factors shaping the ecological niches of ammonia-oxidizing archaea.
FEMS Microbiology Reviews 33: 855-869.
Gebhard, S., Ekanayaka, N., and Cook, G. (2009) The low-affinity phosphate
transporter PitA is dispensable for in vitro growth of Mycobacterium smegmatis.
BMC microbiology 9: 254.
Ginestet, P., Audic, J., Urbain, V., and Block, J. (1998) Estimation of nitrifying
bacterial activities by measuring oxygen uptake in the presence of the metabolic
inhibitors allylthiourea and azide. Applied and Environmental Microbiology 64: 2266-
2268.
Giri, A.V., Anishetty, S., and Gautam, P. (2004) Functionally specified protein
signatures distinctive for each of the different blue copper proteins. BMC
Bioinformatics 5: 127.
Hallam, S., Mincer, T., Schleper, C., Preston, C., Roberts, K., Richardson, P., and
DeLong, E. (2006) Pathways of carbon assimilation and ammonia oxidation suggested
by environmental genomic analyses of marine Crenarchaeota. PLoS Biology 4: e95.

179
Hatzenpichler, R., Lebedeva, E., Spieck, E., Stoecker, K., Richter, A., Daims, H., and
Wagner, M. (2008) A moderately thermophilic ammonia-oxidizing crenarchaeote
from a hot spring. Proceedings of the National Academy of Sciences 105: 2134-2139.
Herrmann, M., Saunders, A.M., and Schramm, A. (2008) Archaea dominate the
ammonia-oxidizing community in the rhizosphere of the freshwater macrophyte
Littorella uniflora. Applied and Environmental Microbiology 74: 3279-3283.
Hooper, A.B., and Terry, K.R. (1973) Specific inhibitors of ammonia oxidation in
Nitrosomonas. Journal Of Bacteriology 115: 480-485.
Huber, H., Gallenberger, M., Jahn, U., Eylert, E., Berg, I.A., Kockelkorn, D. et al.
(2008) A dicarboxylate/4-hydroxybutyrate autotrophic carbon assimilation cycle in the
hyperthermophilic Archaeum Ignicoccus hospitalis. Proceedings of the National
Academy of Sciences 105: 7851-7856.
Hunter, S., Apweiler, R., Attwood, T.K., Bairoch, A., Bateman, A., Binns, D. et al.
(2009) InterPro: the integrative protein signature database. Nucleic Acids Research 37:
D211-215.
Jahn, U., Huber, H., Eisenreich, W., Hügler, M., and Fuchs, G. (2007) Insights into the
autotrophic CO2 fixation pathway of the archaeon Ignicoccus hospitalis:

180
comprehensive analysis of the central carbon metabolism. Journal Of Bacteriology
189: 4108-4119.
Jassby, A. (2008) Phytoplankton in the Upper San Francisco Estuary: Recent biomass
trends, their causes and their trophic significance. San Francisco Estuary & Watershed
Science 6: 1–24.
Magalhaes, C.M., Machado, A., and Bordalo, A.A. (2009) Temporal variability in the
abundance of ammonia-oxidizing bacteria vs. archaea in sandy sediments of the Douro
River estuary, Portugal. Aquatic Microbial Ecology 56: 13-23.
Martens-Habbena, W., Berube, P.M., Urakawa, H., De La Torre, J.R., and Stahl, D.A.
(2009) Ammonia oxidation kinetics determine niche separation of nitrifying Archaea
and Bacteria. Nature 461: 976-979.
Mosier, A., and Francis, C. (2008) Relative abundance and diversity of ammonia-
oxidizing archaea and bacteria in the San Francisco Bay estuary. Environmental
Microbiology 10: 3002-3016.
Oganesyan, V., Oganesyan, N., Adams, P., Jancarik, J., Yokota, H., Kim, R., and Kim,
S. (2005) Crystal structure of the "PhoU-like" phosphate uptake regulator from
Aquifex aeolicus. Journal Of Bacteriology 187: 4238.
181
Pernthaler, A., and Pernthaler, J. (2007) Fluorescence in situ hybridization for the
identification of environmental microbes. Methods Mol Biol 353: 153-164.
Peterson, D., Smith, R., Hager, S., Harmon, D., Herndon, R., and Schemel, L. (1985)
Interannual variability in dissolved inorganic nutrients in Northern San Francisco Bay
Estuary. Hydrobiologia 129: 37-58.
Ravishankara, A.R., Daniel, J.S., and Portmann, R.W. (2009) Nitrous Oxide (N2O):
The Dominant Ozone-Depleting Substance Emitted in the 21st Century. Science 326:
123-125.
Reed, D.W., Smith, J.M., Francis, C.A., and Fujita, Y. (2010) Responses of ammonia-
oxidizing bacterial and archaeal populations to organic nitrogen amendments in low-
nutrient groundwater. Applied and Environmental Microbiology 76: 2517-2523.
Santoro, A.E., Casciotti, K.L., and Francis, C.A. (2010) Activity, abundance and
diversity of nitrifying archaea and bacteria in the central California Current.
Environmental Microbiology 12: 1989-2006.
Schleper, C. (2010) Ammonia oxidation: different niches for bacteria and archaea?
The ISME Journal 4: 1092-1094.
182
Seshadri, R., Kravitz, S.A., Smarr, L., Gilna, P., and Frazier, M. (2007) CAMERA: a
community resource for metagenomics. PLoS Biology 5: e75.
Stahl, D., and Amann, R. (1991) Development and application of nucleic acid probes
in bacterial systematics. In Nucleic acid techniques in bacterial systematics.
Stackebrandt, E., and Goodfellow, M. (eds). Chichester, England: John Wiley & Sons
Ltd., pp. 205–248.
Treusch, A., Leininger, S., Kletzin, A., Schuster, S., Klenk, H., and Schleper, C.
(2005) Novel genes for nitrite reductase and Amo-related proteins indicate a role of
uncultivated mesophilic crenarchaeota in nitrogen cycling. Environmental
Microbiology 7: 1985-1995.
Walker, C.B., de la Torre, J.R., Klotz, M.G., Urakawa, H., Pinel, N., Arp, D.J. et al.
(2010) Nitrosopumilus maritimus genome reveals unique mechanisms for nitrification
and autotrophy in globally distributed marine crenarchaea. Proc Natl Acad Sci USA
107: 8818-8823.
Wankel, S., Kendall, C., Francis, C., and Paytan, A. (2006) Nitrogen sources and
cycling in the San Francisco Bay Estuary: A nitrate dual isotopic composition
approach. Limnology and Oceanography 51: 1654-1664.
183
Wanner, B.L. (1993) Gene regulation by phosphate in enteric bacteria. J Cell Biochem
51: 47-54.
Yooseph, S., Sutton, G., Rusch, D.B., Halpern, A.L., Williamson, S.J., Remington, K.
et al. (2007) The Sorcerer II Global Ocean Sampling expedition: expanding the
universe of protein families. PLoS Biology 5: e16.
184
Chapter 6. Abundance and Potential Rates of Denitrifiers Across the San Francisco Bay Estuary Annika C. Mosier1 and Christopher A. Francis1
1Department of Environmental Earth System Science, Stanford University, Stanford, CA 94305-4216, USA Published as: Mosier, A.C., and C.A. Francis. 2010. Denitrifier abundance and activity across the San Francisco Bay estuary. Environmental Microbiology Reports 2(5): 667-676. Note: An additional paragraph that did not appear in this publication was added to the Environmental context section (see Footnote).

185
Abstract
Over 50% of external dissolved inorganic nitrogen inputs to estuaries are
removed by denitrification—the microbial conversion of nitrate to nitrogen gas under
anaerobic conditions. In this study, denitrifier abundance, potential rates, and
community structure were examined in sediments from the San Francisco Bay estuary.
Abundance of nirK genes (encoding Cu-containing nitrite reductase) ranged from 9.7
x 103 to 4.4 x 10⁶ copies per gram sediment, while the abundance of nirS genes
(encoding cytrochrome-cd1 nitrite reductase) ranged from 5.4 x 10⁵ to 5.4 x 10⁷ copies
per gram sediment. nirK gene abundance was highest in the riverine North Bay,
whereas nirS gene abundance was highest in the more marine Central and South Bays.
Denitrification potential (DNP) rate measurements were highest in the San Pablo and
Central Bays and lowest in the North Bay. nirS-type denitrifiers may be more
biogeochemically important than nirK-type denitrifiers in this estuary because DNP
rates were positively correlated with nirS abundance, nirS abundance was higher than
nirK abundance at every site and time point, and nirS richness was higher than nirK
richness at every site. Statistical analyses demonstrated that salinity, organic carbon,
nitrogen and several metals were key factors influencing denitrification rates, nir
abundance, and community structure. Overall, this study provides valuable new
insights into the abundance, diversity and biogeochemical activity of estuarine
denitrifying communities and suggests that nirS-type denitrifiers likely play an
important role in nitrogen removal in San Francisco Bay, particularly at high salinity
sites.

186
Introduction
Denitrifying bacteria are widespread in coastal and estuarine environments and
account for a significant reduction of external inorganic nitrogen inputs (Seitzinger,
1988). Under anaerobic conditions, denitrifying bacteria reduce nitrate to nitrogen
gases, which are rapidly released to the atmosphere. Denitrification thereby
diminishes the amount of bioavailable nitrogen and curtails the harmful effects of
nitrogen pollution in estuaries, such as stimulated phytoplankton production, depleted
dissolved oxygen, declines in fish populations and loss of biodiversity (e.g., Bricker et
al., 1999; Rabalais, 2002; Diaz and Rosenberg, 2008). Globally, estuarine
denitrification removes approximately 8 Tg of nitrogen per year (Seitzinger et al.,
2006). Key factors known to influence the occurrence and rates of denitrification
include the supply of nitrate and organic carbon, oxygen concentration, temperature,
and pH, among others (e.g., Christensen et al., 1990; Kemp et al., 1990; Nielsen et al.,
1995; Cornwell et al., 1999; Saleh-Lakha et al., 2009). However, despite the well-
established biogeochemical significance of denitrification in estuarine systems,
questions remain about how the underlying microbial communities relate to key
environmental variables and denitrification activity, particularly in nutrient-rich
systems like San Francisco Bay.
Efforts to characterize denitrifying communities are most often directed toward
analysis of denitrification functional genes rather than 16S rRNA genes, because
denitrifiers are found within a variety of phylogenetically unrelated groups from over
50 genera (Zumft, 1997). Nitrite reductase is a particularly important enzyme in the
denitrification pathway because it catalyzes the first committed step to a gaseous
187
product (the reduction of nitrite to nitric oxide; Zumft, 1997). The nitrite reduction
step distinguishes denitrification from other forms of nitrate metabolism, which can be
carried out by a wide range of organisms (Shapleigh, 2006). Nitrite reductase occurs
in two structurally different but functionally equivalent forms: NirK, containing
copper; and NirS, containing iron (cytochrome-cd1). nirK and nirS genes have been
used to examine denitrifying communities in a variety of environments (e.g., Braker et
al., 2000; Braker et al., 2001; Nogales et al., 2002; Prieme et al., 2002; Liu et al.,
2003; Yan et al., 2003; Jayakumar et al., 2004; Sharma et al., 2005; Hannig et al.,
2006; Santoro et al., 2006; Tiquia et al., 2006; Oakley et al., 2007; Tamegai et al.,
2007). Although these studies have resulted in an extensive database of nitrite
reductase sequences, relatively few nirK sequences have been recovered from
estuarine ecosystems and very few studies have attempted to quantify both nirK and
nirS genes.
The relative contribution of denitrification to nitrogen (N) removal from
aquatic systems has been drawn into question with the discovery of anammox as an
alternate N-loss pathway (the anaerobic oxidation of ammonium and nitrite to N2 gas).
Anammox has been shown to be a major source of N-loss in oxygen-deficient marine
water columns (e.g., Kuypers et al., 2005; Francis et al., 2007; Hamersley et al., 2007;
Jensen et al., 2008; Lam et al., 2009). However, in estuaries the measured
contribution of N2 formation from anammox relative to denitrification has been low.
N-loss from anammox ranged from 0 to 25% in several estuaries including the Thames
Estuary (Trimmer et al., 2003), Randers and Norsminde Fjords (Risgaard-Petersen et
al., 2004), Chesapeake Bay (Rich et al., 2008), and Plum Island Sound (Koop-
188
Jakobsen and Giblin, 2009). Based on these studies, denitrification appears to
represent the dominant nitrogen removal process in estuarine sediments.
In this study, we determined the abundance, community structure, and
biogeochemical activity of denitrifiers in San Francisco Bay—the largest estuary on
the west coast of the United States (encompassing an area of ~1200 km2 and draining
a watershed that covers 40% of the area of California). Specifically, we combined
potential denitrification rate measurements, quantitative PCR estimates, and functional
gene sequencing to characterize the variation of nirK- and nirS-type denitrifiers across
the estuarine gradient and assess the relationship with environmental factors in the
estuary.
Results and Discussion
Environmental context
Denitrifiers were analyzed within sediments collected annually during the
summers (July-August) of 2004-2008. Sediments and bottom water were also
analyzed for ancillary variables at each site and time point. Sampling sites covered
four distinct regions: North Bay (BG20, BG30, BF21), San Pablo Bay (BD31, SP19),
Central Bay (BC11, CB18), and South Bay (SB02, BA41, SB18, LSB2, BA10) (Fig.
1). The North Bay originates at the San Joaquin and Sacramento River Delta and
encompasses classic estuarine gradients of salinity and nutrients depending on the
relative amounts of tidal intrusion and freshwater flow. The South Bay is weakly
mixed with wastewater treatment plant effluent as the primary source of freshwater
(Hager and Schemel, 1996), resulting in more marine salinities year-round. Both of
189
these hydrologically distinct portions of the estuary exchange water in the Central
Bay, which has a direct connection to the Pacific Ocean.
During the summertime sampling from 2004 to 2008, bottom water salinity
was less than 1 psu at the riverine sites in the North Bay (BG20 and BG30) and
increased to greater than 25 psu in the Central and South Bays (Table S1). Nitrate,
nitrite, and ammonium concentrations measured across 44 to 48 sites in the estuary
varied little over the five-year period (Fig. 2). Nitrate ranged from 0.02-87.6 µM,
nitrite ranged from 0.03-4.5 µM, and ammonium ranged from 0.2-19 µM. Nitrate and
nitrite concentrations were relatively constant throughout most of the estuary and then
peaked in the South Bay, whereas ammonium concentrations were consistently low in
the North Bay and quite variable throughout the rest of the estuary. Over the five
years, the highest concentrations of nitrate, nitrite, ammonium, and total DIN occurred
in the South Bay, which has long residence times and high loading from wastewater
treatment plants (Kimmerer, 2004; Wankel et al., 2006).
Nutrients and salinity have been shown to display linear relationships during
periods of high river flow to northern San Francisco Bay (Hager and Schemel, 1992;
Wilkerson et al., 2006), because the rate of supply of nutrients by rivers is much larger
than internal estuarine supply and removal rates (Peterson et al. 1985). During the
summers of 2004 to 2008, our data along the entire estuary (not just the northern
portion) showed no linear relationship between salinity and bottom water nitrate,
nitrite, nitrate plus nitrite, or total DIN. This is likely because river flow is low during
the summer months and the northern and southern portions of the bay are effectively
hydrodynamically distinct (e.g., (Wankel et al., 2006). However, ammonia increased
190
linearly with salinity in the estuary (Pearson correlation: r = 0.44, P = 0.01, n = 35).
Higher ammonium concentrations in the high salinity region of the estuary may be the
result of greater nutrient inputs (e.g., from wastewater treatment plants), less
biological uptake of ammonium, or greater rates of ammonium production via organic
matter mineralization. When analyzed from San Pablo Bay to South Bay (excluding
the North Bay), salinity increased linearly with decreasing concentrations of nitrate
(Pearson correlation: r = -0.58, P = 0.01, n = 20), nitrate plus nitrite (Pearson
correlation: r = -0.58, P = 0.01, n = 20), and total DIN (Pearson correlation: r = -0.52,
P = 0.02, n = 20). This pattern was also seen in San Francisco Bay across a larger
number of sites in 2004 (Wankel et al., 2006)†.
Sediment characteristics analyzed from 2004-2007 were found to vary across
the estuary gradient (Table S2). Total C:N sediment ratios were consistently high in
the North Bay (average 15.7) and low in the rest of the estuary (average 8.9). The
percentage of clays (R2= 0.68, P < 0.005, n = 28), fines (R2= 0.51, P < 0.005, n = 28),
and silt (R2= 0.17, P = 0.03, n = 28) increased logarithmically with distance from the
head of the estuary from North to South Bay, whereas the percent sand decreased (R2=
0.64, P < 0.005, n = 28). Distributions of 12 different metals (Ag, As, Cd, Cu, Fe, Hg,
MeHg, Mn, Ni, Pb, Se, and Zn) along the estuary varied considerably (Table S2).
Abundance of nitrite reductase genes
Based on in silico analysis of our extensive 2004 database of estuarine nirK
and nirS sequences from San Francisco Bay (see below) and GenBank sequences, we
† This paragraph did not appear in the original publication.
191
designed and optimized quantitative PCR (qPCR) primers and assays for quantifying
the abundance of these genes. Abundance of nitrite reductase genes (nirK and nirS) in
surface sediments was determined at 7 sites spanning the estuary gradient during the
summers of 2004-2008. Abundance of nirK genes ranged from 9.7 x 10³ to 4.4 x 10⁶
copies per gram sediment and from 3.7 x 10³ to 5.8 x 10⁵ copies per µg of DNA (Fig.
3 and Table S3). There was no statistically significant change in nirK abundance over
the five-year period at each individual site or across the entire estuary. When
averaged over the five-year period, abundance of nirK genes per gram of sediment
was highest at BG20 and BF21 in the North Bay and consistently low across the San
Pablo, Central and South Bay sites.
Abundance of nirS genes ranged from 5.4 x 10⁵ to 5.4 x 10⁷ copies per gram
sediment and from 3.6 x 10⁵ to 5.7 x 10⁶ copies per µg of DNA (Fig. 3 and Table S3).
These values are within the range reported in Chesapeake Bay (2 x 10⁵ to 7 x 10⁷
copies per gram sediment; Bulow et al., 2008) and the Colne estuary (~104 to 107
copies per gram sediment; Smith et al., 2007). In San Francisco Bay, there was no
statistically significant change in nirS abundance over the five-year period at each
individual site or across the entire estuary. During all five years, abundance of nirS
genes was highest in the Central and South Bays and lowest in the North Bay.
Notably, at every site and time point, nirS copies per gram of sediment were higher
than nirK copies (ranging from 5 to 266-fold higher), a trend that was observed in the
subtropical Fitzroy estuary (Abell et al., 2009).
When averaged over the five-year period, nirK gene abundance was highest in
the North Bay, whereas nirS gene abundance was highest in the Central and South

192
Bays and lowest in the North Bay. nirS gene copy numbers were also highest in the
mesohaline sediments from central Chesapeake Bay (Bulow et al., 2008), whereas
nirS gene copy numbers were highest at the head of the Colne estuary (Smith et al.,
2007). Both nirK and nirS gene abundances were relatively constant throughout the
subtropical Fitzroy estuary (Abell et al., 2009). Although geographic,
physical/chemical, and biological differences between these estuaries likely confound
the identification of common patterns and trends in denitrifier abundance, this
quantitative nirK/S dataset represents the first insight into the spatial and inter-annual
distribution of denitrifying genes in the San Francisco Bay estuary.
Denitrification rate potentials
To assess the metabolic capacity of San Francisco Bay sediment communities
to carry out denitrification, denitrification potential (DNP) rate measurements were
performed at 7 sites (same sites used for qPCR anlayses) during the summers of 2007
and 2008. DNP rates ranged from 0.1 to 54 mg N2O-N kg-1 day-1 and from 0.3 to 44
mg N2O-N kg-1 day-1 upon the addition of chloramphenicol (Fig. 4). Chloramphenicol
was added to inhibit synthesis of new denitrifying enzymes while the activity of
previously existing denitrifying enzymes was being measured (Smith and Tiedje,
1979). DNP rates were higher in 2007 than in 2008 at all sites except BA41. DNP
rates were consistently highest in the San Pablo and Central Bays and lowest in the
North Bay, while the South Bay had intermediate rates.
In San Francisco Bay sediments, DNP rates were positively correlated with
nirS abundance (copies per gram sediment; Spearman correlation: ρ = 0.57, P = 0.03,
193
n = 14), whereas nirK abundance (copies per gram sediment) showed no correlation
with DNP rates. However, when expressed in terms of copies per µg DNA, nirK was
negatively correlated with DNP rates (Spearman correlation: ρ = -0.62, P = 0.02, n =
14). Several lines of evidence suggest that nirS-type denitrifiers may be
biogeochemically important in this estuary, including the fact that DNP rates were
positively correlated with nirS abundance, nirS abundance was higher than nirK
abundance at every site and time point, and nirS richness was higher than nirK
richness at every site examined (Fig. S4, Table S4, and Supplementary Material).
Together, this may suggest that denitrifiers harboring NirS play a greater role in N-
removal from the system compared to denitrifiers harboring NirK.
Nitrite reductase gene richness and phylogenetic diversity
nirK and nirS gene sequences were analyzed at 12 sites from 2004 (7 sites used
for the multi-year qPCR analyses and 5 additional sites distributed throughout the
estuary). From all clone libraries combined, we recovered 112 unique nirK
operational taxonomic units (OTUs) and 169 unique nirS OTUs defined at a 5%
distance cutoff (from a total of from 383 nirK sequences and 360 nirS sequences; 28-
45 sequences per site) (Supplementary Material and Table S4).
Across all sites, nirK sequences shared considerable phylogenetic similarity
with sequences from the water column and sediments of two lakes and the Baltic Sea
(O.-S. Kim, P. Junier, J. Imhoff and K.-P. Witzel, unpublished, direct GenBank
submission) (Fig. S1). Approximately 80% of the nirK sequences from the North Bay
riverine BG20 and BG30 sites grouped closely (73-100% amino acid identity) with
194
sequences from soil (e.g., Throback et al., 2007), activated sludge (e.g., Hallin et al.,
2006), and lakes (e.g., Junier et al., 2008). The majority of the sequences from the rest
of the estuary fell into the previously described nirK I-IV groups (Santoro et al.,
2006), but did not correspond to particular salinity or nutrient conditions as observed
in coastal aquifer sediments (Santoro et al., 2006).
nirS sequences from San Francisco Bay grouped phylogenetically with
sequences from many other estuaries (Fig. S2), including: Chesapeake Bay (Francis,
O’Mullan, Cornwell, and Ward, unpublished, direct GenBank submission; Bulow et
al., 2008); Bahía del Tóbari, Mexico (J.M. Beman and C.A. Francis, unpublished;
direct GenBank submission); Changjiang estuary (H. Dang and J. Wang, unpublished,
direct GenBank submission); the Colne estuary (Nogales et al., 2002); Puget Sound
(Braker et al., 2000); and a coastal aquifer/subterranean estuary (Santoro et al., 2006).
Most of the sequences from the low-salinity North Bay grouped independently from
other sites in San Francisco Bay but closely to sequences from low-salinity sites in
Chesapeake Bay (CB1 and CT1, Choptank River, MD). There was also considerable
overlap between high salinity (>20 psu) sites in both of these large North American
estuaries. However, the most abundant and highly expressed nirS phylotypes in
Chesapeake Bay (Bulow et al., 2008) were not as well represented in the San
Francisco Bay sediments (<5% of the sequences fell within this phylogenetic cluster).
Interestingly, mRNA nirS clones from the Colne estuary (Nogales et al., 2002) were
found in many of the phylogenetic clusters containing San Francisco Bay DNA
sequences.

195
Community structure of nitrite reductase genes
Some spatial structure was evident in the distribution of San Francisco Bay
nirK and nirS OTUs (Table 1) in the summer of 2004, based on abundance-based
Sørensen’s indices of similarity (Labd) (Schloss and Handelsman, 2006). For nirK and
nirS, the riverine North Bay (BG20 and BG30) sites showed almost no overlap with
any of the sites in San Pablo, Central, and South Bay (Labd < 0.07). For nirK and nirS,
BF21 in the North Bay was more similar to San Pablo Bay sites than to the other
North Bay sites or to sites in the Central and South Bay. The San Pablo Bay nirK and
nirS communities (BD31 and SP19) exhibited significant compositional overlap (Labd
≥ 0.5) with each other and with sites in the southernmost part of the estuary (LSB2 and
BA10). There was significant similarity (Labd ≥ 0.5) between most Central and South
Bay sites for both nirK and nirS. Interestingly, a previous study on ammonia-
oxidizing archaea and bacteria (AOA and AOB) communities (based on ammonia
monooxygenase subunit A, amoA, genes) at the same sites found similar patterns of
spatial distribution within the estuary; North Bay sites were similar to each other but
not with any other sites in the estuary and, conversely, Central and South Bay sites
overlapped with each other but were dissimilar to the North Bay sites (Mosier and
Francis, 2008).
Relationship between environmental variables and denitrifier community structure,
abundance, and potential rates
Denitrification potential rates (with chloramphenicol treatment) and the
abundance and community composition of nirK and nirS genes were compared to
196
environmental variables measured in the sediments and water column of San
Francisco Bay. Salinity had a strong and significant positive correlation with nirS
abundance (Spearman correlation for copies per gram sediment: ρ = 0.71, P < 0.001, n
= 35). DNP rates also had a strong, but slightly less significant, positive correlation
with salinity (Spearman correlation: ρ = 0.74, P = 0.002, n = 14). For nirK
abundance, salinity had a strong and significant negative correlation with nirK
abundance when expressed in terms of copies per µg DNA (Spearman correlation: ρ =
-0.65, P < 0.001, n = 33), but no correlation in terms of copies per gram sediment.
Salinity also showed a relationship with denitrification rates in other estuaries (e.g.,
Kemp et al., 1990; Rysgaard et al., 1999; Dong et al., 2000), although not always in
the same direction or magnitude—perhaps due to methodological differences in rate
measurements, divergent communities and responses, and/or unclear statistical results
from covarying variables within the estuaries.
Because most denitrifiers are heterotrophic, carbon and nitrogen are likely to
be important determinants of community composition and structure. In San Francisco
Bay sediments, canonical correspondence analysis (CCA) showed that sediment total
organic carbon (TOC) and C:N ratio had the greatest correlation with nirK community
composition of the 31 factors tested, while the nirS community composition was most
strongly correlated with only C:N ratio (Fig. S3). In the CCA plots, the perpendicular
position of the sampling sites relative to the environmental line is an approximate
ranking of species response curves to that environmental variable (McCune and Grace,
2002). For both nirK and nirS, the North Bay sites grouped independently from all
other regions. The Central and South Bay sites clustered together, reflecting

197
similarities in community composition and sediment carbon and nitrogen content.
Additionally, nirS abundance had a strong and significant negative correlation with
sediment C:N ratios (Spearman correlation: ρ = -0.69, P < 0.001, n = 21) and a
positive correlation with total nitrogen (Spearman correlation: ρ = 0.71, P < 0.001, n =
21). Together these results suggest that sediments with high C:N ratios in San
Francisco Bay have distinct nirS phylotypes that are not particularly abundant relative
to the rest of the estuary.
Several metals were correlated with denitrifier abundance and potential rates in
the estuary. nirS abundance (copies per gram sediment) was correlated with lead
(Spearman correlation: ρ = 0.60, P = 0.001, n = 28). nirK abundance (copies per µg
DNA) had a strong and significant negative correlation with silver (Spearman
correlation: ρ = -0.65, P = 0.001, n = 22) and methyl-mercury (Spearman correlation:
ρ = -0.80, P < 0.001, n = 26). Additionally, sediment cadmium concentrations were
negatively correlated with DNP rates in 2007 but with less statistical significance
(Spearman correlation: ρ = -0.86, P = 0.01, n = 7; cadmium concentrations were not
available for 2008). The bioavailability of metals and differences in denitrifying
microbial community tolerances may impact the toxicity on benthic denitrifier
abundance and activity.
While other variables not measured in this study could also affect
denitrification in San Francisco Bay (and we were unable to deduce the potential
effects of covariation), it appears that salinity, sediment C:N ratios, and several metals
may significantly influence denitrifying (nirK and nirS) communities in San Francisco
Bay. Notably, salinity and C:N ratios were also correlated with the ammonia-

198
oxidizing community in this estuary (Mosier and Francis, 2008). Salinity was
correlated with AOA and AOB amoA abundance and community structure, nirK and
nirS abundance, and denitrification potential rates. C:N ratio was correlated with
AOA and AOB amoA abundance, AOB amoA community composition, and nirK and
nirS community composition. Together these studies demonstrate a first-order insight
into nitrification and denitrification across chemical/physical gradients in the largest
estuary on the west coast of the United States.
Experimental Procedures
Sample collection and environmental variables
Sediment and water samples were collected from San Francisco Bay in
northern California during the summers (July-August) of 2004-2008 in conjunction
with the Regional Monitoring Program (RMP) managed by the San Francisco Estuary
Institute (http://www.sfei.org/). Water column profiles of temperature, salinity and
dissolved oxygen (DO) were measured at each site using a SeaBird™ SBE-19 CTD
(RMP). Bottom water samples from 2004 were previously analyzed for nitrate (NO3-),
nitrite (NO2-), and ammonium (NH4
+) (Wankel et al., 2006). For years 2005-2008,
nutrients were measured on a QuikChem 8000 Flow Injection Analyzer (Lachat
Instruments). The RMP analyzed sediment samples for years 2004-2007 for pH, trace
elements (Ag, Al, As, Cd, Cu, Fe, Hg, MeHg, Mn, Ni, Pb, Se and Zn), grain size, total
organic carbon and total nitrogen. C:N ratios were calculated using total organic
carbon and total nitrogen percentages.
Denitrification potential assays

199
Denitrification potential rates were determined from triplicate sediment
samples collected from 7 sites in the summers of 2007 and 2008 using the acetylene
block technique (Sorensen, 1978). Approximately 15 g of wet sediment
(homogenized from the upper 3 cm of 60 ml syringe cores) and 25 mL of
denitrification potential solution (1 mM glucose and 1mM NaNO3 in 0.2 µm filtered
site water) were added to serum bottles. An additional set of triplicate sediment
samples was treated with 0.3 mM chloramphenicol. Serum bottles were sealed and
bubbled with N2 gas for 5 minutes. 30 mL of acetylene gas was added to each bottle.
Bottles were shaken for 1 hour at room temperature. The headspace was sampled for
gas at four time points over the hour. Gas samples were analyzed for N2O on a
Shimadzu GC-14A gas chromatograph fitted with a 63Ni electron capture detector.
Quantification of nirS and nirK gene abundance
Quantitative PCR (qPCR) was used to estimate the number of nirK and nirS
copies in sediments collected during the summers of 2004-2008 at 7 sites
(Supplementary Material). The number preceding the sampling site name in Table S3
indicates the year sampled (e.g., 4BA10 and 5BA10 correspond to site BA10 sampled
in 2004 and 2005, respectively). DNA was extracted from approximately 250-300 mg
of sediment from the upper 5 mm of the cores using the FastDNA SPIN kit for soil
(MP Biomedicals, Inc.) with a 30 second bead beating time at speed 5.5. Duplicate
DNA extractions were performed for each sediment core. Reactions were carried out
using a StepOnePlus™ Real-Time PCR System (Applied Biosystems). Primers used
for nirK quantification were nirK-q-F (5’-TCATGGTGCTGCCGCGYGA; a shorter
version of the nirK583FdegCF forward primer from (Santoro et al., 2006) and

200
nirK1040 (Henry et al., 2004). Primers used for nirS quantification were nirS1F
(Braker et al., 1998) and nirS-q-R (5’-TCCMAGCCRCCRTCRTGCAG), an upstream
and significantly modified version of nirS3R (Braker et al., 1998).
Denitrifier community composition
nirK and nirS diversity was analyzed at 12 of sites from the summer of 2004
(Supplementary Material): 4BG20, 4BG30, 4BF21, 4BD31, 4SP19, 4BC11, 4CB18,
4SB02, 4BA41, 4SB18, 4LSB2, and 4BA10. Total community DNA was extracted as
described above. Sediment DNA extracts were PCR amplified with primers targeting
nirK and nirS: nirK583FdegCF (5’-TCATGGTGCTGCCGCGYGANGG; (Santoro et
al., 2006) and nirK5R (Braker et al., 1998); nirS1F and nirS6R (Braker et al., 1998).
Clone libraries of nirK and nirS gene fragments were constructed using the TOPO TA
cloning® kit (Invitrogen, Inc.) and 28 to 45 clones from each library were sequenced
(ABI 3100 Capillary Sequencer).
Statistical analyses
SPSS, version 17.0 was used for parametric and non-parametric correlation
analyses. nirK abundance, nirS abundance and denitrification potentials were
correlated with bottom water and sediment variables from each site and time point.
Bottom water variables included: salinity (psu), temperature (ºC), dissolved oxygen
(mg/L), nitrite+nitrate (µM), nitrite (µM), nitrate (µM), ammonium (µM), DIN (µM),
water depth (m), and pH. Sediment variables included: TOC (%), TN (%), C:N ratio,
Ag (mg/Kg), Al (mg/Kg), As (mg/Kg), Cd (mg/Kg), Cu (mg/Kg), Fe (mg/Kg), Hg
(mg/Kg), MeHg (µg/Kg), Mn (mg/Kg), Ni (mg/Kg), Pb (mg/Kg), Se (mg/Kg), Zn
(mg/Kg), % Clay (<0.0039 mm), % Fine (<0.0625 mm), % Granule and Pebble (2.0 to

201
<64 mm), % Sand (0.0625 to <2.0 mm), and % Silt (0.0039 to <0.0625 mm).
Correlations between nirK and nirS community composition and
environmental variables were analyzed by Canonical Correspondence Analysis (CCA)
using the program Canoco (ter Braak and Smilauer, 2002) (Supplementary Material).
Relative abundance of sequences in each OTU (defined at 0.05 distance) was used as
species input (i.e., the number of sequences in an OTU divided by the total number of
sequences in the library). Significant environmental variables were determined by
forward selection (P < 0.05). Bottom water variables included in the forward
selection were those described above as well as silicate (µM) and phosphate (µM).
Sediment variables included in the forward selection were all of those described
above, except Ag (mg/Kg) and Al (mg/Kg).
Nucleotide sequence accession numbers
Sequences reported in this study have been deposited in GenBank under
accession numbers GQ454031 to GQ454413 for nirK and GQ453671 to GQ454030
for nirS.
Acknowledgments
We thank Paul Salop, Sarah Lowe, Applied Marine Sciences, the San
Francisco Estuary Institute, and the crew of the R.V. Endeavor for allowing us to
participate in the San Francisco Bay RMP sediment cruises, providing access to the
RMP data, and assisting in sample collection. We thank S. Wankel for sampling and
performing nutrient analyses from the 2004 cruise and K. Roberts, J. Smith, S. Ying,
and G. Wells for assisting in field sampling. We greatly appreciate those who

202
provided advice and comments on the manuscript (A. Santoro, J. Smith, and G.
Wells). This work was supported in part by National Science Foundation Grants
MCB-0433804, MCB-0604270 and OCE-0847266 (to C.A.F.) and an EPA STAR
Graduate Fellowship (to A.C.M.).

203
Tables

204
Figures
Figure 1. Location of sampling sites within San Francisco Bay. Sites are shaded by
geographic region: North Bay, San Pablo Bay, Central Bay, and South Bay. Image
courtesy of and adapted from the U.S. Geological Survey.

205
Figure 2. Dissolved inorganic nitrogen concentrations in San Francisco Bay bottom
water from 2004 to 2008. Sites are ordered from approximate distance from the head
of the estuary.

206
Figure 3. Quantitative PCR measurements for nirK (left panel) and nirS (right panel)
gene copy numbers expressed per gram of sediment (wet weight). Values represent
averages of two duplicate DNA extractions (except where noted in Table S3).

207
Figure 4. Denitrification potential rate measurements from San Francisco Bay
sediments in 2007 (left panel) and 2008 (right panel). Light gray columns are
measurements with no treatment; dark gray columns are measurements with the
addition of chloramphenicol. Error bars represent duplicate or triplicate
measurements.
208
Supporting Information
Additional Supporting Information may be found in the online version of this article:
Supplementary Material. Additional text from the Results and Discussion and
Experimental Procedures sections.
Figure S1. Neighbor-joining phylogenetic tree of nirK sequences. Sequences from
San Francisco Bay are color coded by region (see legend) and GenBank sequences are
in black. Significant bootstrap values (≥ 50) are shown in italics at branch nodes.
Colored circles show the number of environmental clones from each region. Numbers
within each grey cluster represent the total number of San Francisco Bay and
GenBank sequences within that group.
Figure. S2. Neighbor-joining phylogenetic tree of nirS sequences. Sequences from
San Francisco Bay are color coded by region (see legend) and GenBank sequences are
in black. Significant bootstrap values (≥ 50) are shown in italics at branch nodes.
Colored circles show the number of environmental clones from each region. Numbers
within each grey cluster represent the total number of San Francisco Bay and
GenBank sequences within that group.
Figure S3. Canonical correspondence analysis (CCA) of nirK (left panel) and nirS
(right panel) sequence data and environmental variables from bottom water and
sediments.
209
Figure S4. Rarefaction curves for nirK (top panel) and nirS (bottom panel) clone
libraries. OTUs were defined at a 5% sequence cutoff.
Table S1. Physical and chemical properties of San Francisco Bay bottom water
averaged over five years (2004-2008).
Table S2. Physical and chemical properties of San Francisco Bay sediments averaged
over four years (2004-2007).
Table S3. Quantitative PCR measurements for nirK and nirS expressed per µg of
DNA and grams of sediment (wet weight). Averages and standard deviations (stdev)
are of two duplicate DNA extractions (except where noted). The number preceding
the sampling site name indicates the year sampled (e.g., 4BA10 and 5BA10
correspond to site BA10 sampled in 2004 and 2005, respectively).
Table S4. Diversity and richness estimates for nirK and nirS clone libraries. OTUs
were defined at 5% nucleic acid sequence difference. Libraries are ordered by
location within the estuary (from north to south).

210
Literature Cited
Abell, G.C., Revill, A.T., Smith, C., Bissett, A.P., Volkman, J.K., and Robert, S.S.
(2009) Archaeal ammonia oxidizers and nirS-type denitrifiers dominate sediment
nitrifying and denitrifying populations in a subtropical macrotidal estuary. The ISME
Journal: doi:10.1038/ismej.2009.1105.
Braker, G., Fesefeldt, A., and Witzel, K.P. (1998) Development of PCR primer
systems for amplification of nitrite reductase genes (nirK and nirS) to detect
denitrifying bacteria in environmental samples. Applied And Environmental
Microbiology 64: 3769-3775.
Braker, G., Zhou, J.Z., Wu, L.Y., Devol, A.H., and Tiedje, J.M. (2000) Nitrite
reductase genes (nirK and nirS) as functional markers to investigate diversity of
denitrifying bacteria in Pacific northwest marine sediment communities. Applied And
Environmental Microbiology 66: 2096-2104.
Braker, G., Ayala-del-Rio, H.L., Devol, A.H., Fesefeldt, A., and Tiedje, J.M. (2001)
Community structure of denitrifiers, bacteria, and archaea along redox gradients in
Pacific Northwest marine sediments by terminal restriction fragment length
polymorphism analysis of amplified nitrite reductase (nirS) and 16S rRNA genes.
Applied and Environmental Microbiology 67: 1893-1901.
211
Bricker, S.B., Clement, C.G., Pirhalla, D.E., Orlando, S.P., and Farrow, D.R.G. (1999)
National estuarine eutrophication assessment: Effects of nutrient enrichment in the
nation's estuaries. In. Silver Spring, MD: NOAA, National Ocean Service, Special
Projects Office and the National Centers for Coastal Ocean Science, p. 71.
Bulow, S.E., Francis, C.A., Jackson, G.A., and Ward, B.B. (2008) Sediment denitrifier
community composition and nirS gene expression investigated with functional gene
microarrays. Environmental Microbiology 10: 3057-3069.
Christensen, P.B., Nielsen, L.P., Sorensen, J., and Revsbech, N.P. (1990)
Denitrification in nitrate-rich streams: diurnal and seasonal variation related to benthic
oxygen metabolism. Limnology and Oceanography 35: 640-652.
Cornwell, J.C., Kemp, W.M., and Kana, T.M. (1999) Denitrification in coastal
ecosystems: methods, environmental controls, and ecosystem level controls, a review.
Aquatic Ecology 33: 41-54.
Diaz, R.J., and Rosenberg, R. (2008) Spreading dead zones and consequences for
marine ecosystems. Science 321: 926-929.
Dong, L.F., Thornton, D.C.O., Nedwell, D.B., and Underwood, G.J.C. (2000)
Denitrification in sediments of the River Colne estuary, England. Marine Ecology-
Progress Series 203: 109-122.

212
Francis, C.A., Beman, J.M., and Kuypers, M.M.M. (2007) New processes and players
in the nitrogen cycle: the microbial ecology of anaerobic and archaeal ammonia
oxidation. The ISME Journal 1: 19-27.
Hager, S., and Schemel, L. (1996) Dissolved inorganic nitrogen, phosphorus and
silicon in South San Francisco Bay; I. Major factors affecting distributions. In San
Francisco Bay: The ecosystem; Further investigations into the natural history of San
Francisco Bay and Delta with reference to the influence of man. Hollibaugh, J.T. (ed).
San Francisco, CA: American Association for the Advancement of Science, p. 542.
Hallin, S., Throback, I.N., Dicksved, J., and Pell, M. (2006) Metabolic profiles and
genetic diversity of denitrifying communities in activated sludge after addition of
methanol or ethanol. Applied and Environmental Microbiology 72: 5445-5452.
Hamersley, M.R., Lavik, G., Woebken, D., Rattray, J.E., Lam, P., Hopmans, E.C. et
al. (2007) Anaerobic ammonium oxidation in the Peruvian oxygen minimum zone.
Limnology and Oceanography 52: 923-933.
Hannig, M., Braker, G., Dippner, J., and Jurgens, K. (2006) Linking denitrifier
community structure and prevalent biogeochemical parameters in the pelagial of the
central Baltic Proper (Baltic Sea). FEMS Microbiology Ecology 57: 260-271.

213
Henry, S., Baudoin, E., Lopez-Gutierrez, J.C., Martin-Laurent, F., Baumann, A., and
Philippot, L. (2004) Quantification of denitrifying bacteria in soils by nirK gene
targeted real-time PCR. Journal Of Microbiological Methods 59: 327-335.
Jayakumar, D.A., Francis, C.A., Naqvi, S.W.A., and Ward, B.B. (2004) Diversity of
nitrite reductase genes (nirS) in the denitrifying water column of the coastal Arabian
Sea. Aquatic Microbial Ecology 34: 69-78.
Jensen, M.M., Kuypers, M.M.M., Lavik, G., and Thamdrup, B. (2008) Rates and
regulation of anaerobic ammonium oxidation and denitrification in the Black Sea.
Limnology and Oceanography 53: 23-36.
Junier, P., Kim, O.S., Witzel, K.P., Imhoff, J.F., and Hadas, O. (2008) Habitat
partitioning of denitrifying bacterial communities carrying nirS or nirK genes in the
stratified water column of Lake Kinneret, Israel. Aquatic Microbial Ecology 51: 129-
140.
Kemp, W.M., Sampou, P., Caffrey, J., Mayer, M., Henriksen, K., and Boynton, W.R.
(1990) Ammonium Recycling Versus Denitrification in Chesapeake Bay Sediments.
Limnology and Oceanography 35: 1545-1563.

214
Kimmerer, W.J. (2004) Open Water Processes of the San Francisco Estuary: From
Physical Forcing to Biological Responses. San Francisco Estuary and Watershed
Science 2: 1-147.
Koop-Jakobsen, K., and Giblin, A. (2009) Anammox in Tidal Marsh Sediments: The
Role of Salinity, Nitrogen Loading, and Marsh Vegetation. Estuaries and Coasts 32:
238–245.
Kuypers, M.M., Lavik, G., Woebken, D., Schmid, M., Fuchs, B.M., Amann, R. et al.
(2005) Massive nitrogen loss from the Benguela upwelling system through anaerobic
ammonium oxidation. Proceedings of the National Academy of Sciences 102: 6478-
6483.
Lam, P., Lavik, G., Jensen, M.M., van de Vossenberg, J., Schmid, M., Woebken, D. et
al. (2009) Revising the nitrogen cycle in the Peruvian oxygen minimum zone.
Proceedings of the National Academy of Sciences 106: 4752-4757.
Liu, X.D., Tiquia, S.M., Holguin, G., Wu, L.Y., Nold, S.C., Devol, A.H. et al. (2003)
Molecular diversity of denitrifying genes in continental margin sediments within the
oxygen-deficient zone off the Pacific coast of Mexico. Applied And Environmental
Microbiology 69: 3549-3560.
215
McCune, B., and Grace, J.B. (2002) Analysis of Ecological Communities. Gleneden
Beach, Oregon: MjM Software Design.
Mosier, A.C., and Francis, C.A. (2008) Relative abundance and diversity of ammonia-
oxidizing archaea and bacteria in the San Francisco Bay estuary. Environmental
Microbiology 10: 3002-3016.
Nielsen, K., Nielsen, L.P., and Rasmussen, P. (1995) Estuarine nitrogen retention
independently estimated by the denitrification rate and mass-balance method: a study
of Norsminde Fjord, Denmark Marine Ecology-Progress Series 119: 275-283.
Nogales, B., Timmis, K.N., Nedwell, D.B., and Osborn, A.M. (2002) Detection and
diversity of expressed denitrification genes in estuarine sediments after reverse
transcription-PCR amplification from mRNA. Applied And Environmental
Microbiology 68: 5017-5025.
Oakley, B.B., Francis, C.A., Roberts, K.J., Fuchsman, C.A., Srinivasan, S., and Staley,
J.T. (2007) Analysis of nitrite reductase (nirK and nirS) genes and cultivation reveal
depauperate community of denitrifying bacteria in the Black Sea suboxic zone.
Environmental Microbiology 9: 118-130.

216
Prieme, A., Braker, G., and Tiedje, J.M. (2002) Diversity of nitrite reductase (nirK and
nirS) gene fragments in forested upland and wetland soils. Applied And Environmental
Microbiology 68: 1893-1900.
Rabalais, N.N. (2002) Nitrogen in aquatic ecosystems. Ambio 31: 102-112.
Rich, J.J., Dale, O.R., Song, B., and Ward, B.B. (2008) Anaerobic ammonium
oxidation (anammox) in Chesapeake Bay sediments. Microbial Ecology 55: 311-320.
Risgaard-Petersen, N., Meyer, R.L., Schmid, M., Jetten, M.S.M., Enrich-Prast, A.,
Rysgaard, S., and Revsbech, N.P. (2004) Anaerobic ammonium oxidation in an
estuarine sediment. Aquatic Microbial Ecology 36: 293-304.
Rysgaard, S., Thastum, P., Dalsgaard, T., Christensen, P.B., and Sloth, N.P. (1999)
Effects of salinity on NH4+ adsorption capacity, nitrification, and denitrification in
Danish estuarine sediments. Estuaries 22: 21-30.
Saleh-Lakha, S., Shannon, K.E., Henderson, S.L., Goyer, C., Trevors, J.T., Zebarth,
B.J., and Burton, D.L. (2009) Effect of pH and temperature on denitrification gene
expression and activity in Pseudomonas mandelii. Applied and Environmental
Microbiology 75: 3903-3911.
217
Santoro, A.E., Boehm, A.B., and Francis, C.A. (2006) Denitrifier community
composition along a nitrate and salinity gradient in a coastal aquifer. Applied And
Environmental Microbiology 72: 2102-2109.
Schloss, P.D., and Handelsman, J. (2006) Introducing SONS, a Tool for Operational
Taxonomic Unit-Based Comparisons of Microbial Community Memberships and
Structures. Applied and Environmental Microbiology 72: 6773-6779.
Seitzinger, S., Harrison, J.A., Bohlke, J.K., Bouwman, A.F., Lowrance, R., Peterson,
B. et al. (2006) Denitrification across landscapes and waterscapes: a synthesis.
Ecological Applications 16: 2064-2090.
Seitzinger, S.P. (1988) Denitrification in freshwater and coastal marine ecosystems:
Ecological and geochemical significance. Limnology and Oceanography 33: 702-724.
Shapleigh, J.P. (2006) The denitrifying prokaryotes. In Prokaryotes, pp. 769-792.
Sharma, S., Aneja, M.K., Mayer, J., Munch, J.C., and Schloter, M. (2005) Diversity of
transcripts of nitrite reductase genes (nirK and nirS) in rhizospheres of grain legumes.
Applied and Environmental Microbiology 71: 2001-2007.
Smith, C.J., Nedwell, D.B., Dong, L.F., and Osborn, A.M. (2007) Diversity and
abundance of nitrate reductase genes (narG and napA), nitrite reductase genes (nirS

218
and nrfA), and their transcripts in estuarine sediments. Applied and Environmental
Microbiology 73: 3612-3622.
Smith, M.S., and Tiedje, J.M. (1979) Phases of denitrification following oxygen
depletion in soil. Soil Biology and Biochemistry 11: 261-267.
Sorensen, J. (1978) Denitrification Rates in a Marine Sediment as Measured by the
Acetylene Inhibition Technique. Applied and Environmental Microbiology 36: 139-
143.
Tamegai, H., Aoki, R., Arakawa, S., and Kato, C. (2007) Molecular analysis of the
nitrogen cycle in deep-sea microorganisms from the Nankai Trough: genes for
nitrification and denitrification from deep-sea environmental DNA. Extremophiles 11:
269-275.
ter Braak, C.J.F., and Smilauer, P. (2002) CANOCO Reference Manual and
CanoDraw for Windows User's Guide: Software for Canonical Community Ordination
(version 4.5). Ithaca, NY: Microcomputer Power.
Throback, I.N., Johansson, M., Rosenquist, M., Pell, M., Hansson, M., and Hallin, S.
(2007) Silver (Ag+) reduces denitrification and induces enrichment of novel nirK
genotypes in soil. FEMS Microbiology Letters 270: 189-194.
219
Tiquia, S.M., Masson, S.A., and Devol, A. (2006) Vertical distribution of nitrite
reductase genes (nirS) in continental margin sediments of the Gulf of Mexico. FEMS
Microbiology Ecology 58: 464-475.
Trimmer, M., Nicholls, J.C., and Deflandre, B. (2003) Anaerobic ammonium
oxidation measured in sediments along the Thames estuary, United Kingdom. Applied
and Environmental Microbiology 69: 6447-6454.
Wankel, S.D., Kendall, C., Francis, C.A., and Paytan, A. (2006) Nitrogen sources and
cycling in the San Francisco Bay Estuary: A nitrate dual isotopic composition
approach. Limnology And Oceanography 51: 1654-1664.
Yan, T.F., Fields, M.W., Wu, L.Y., Zu, Y.G., Tiedje, J.M., and Zhou, J.Z. (2003)
Molecular diversity and characterization of nitrite reductase gene fragments (nirK and
nirS) from nitrate- and uranium-contaminated groundwater. Environmental
Microbiology 5: 13-24.
Zumft, W.G. (1997) Cell biology and molecular basis of denitrification. Microbiology
And Molecular Biology Reviews 61: 533-542.