Embed Size (px)
Citation preview
© CBE – 023 V2
Microbiology Controls
Environmental Monitoring Programs
© CBE Pty Ltd
This training program is copyright to CBE Pty Ltd and may not be modified,
reproduced, sold, loaned, hired or traded in any form without its the express
written permission.
1

© CBE – 023 V2
Module Topics
Fundamental EM Program – what to monitor
Frequency, Location and Methods
Monitoring Water Systems
Managing an EM program for Sterile Cleanrooms
Introduction

© CBE – 023 V2
Some Important References
EU/PICs/TGA cGMP Annex 1 – Sterile Products
PDA Technical Report #13 Fundamentals of an
Environmental Monitoring Program
USP <1116> Microbiological Evaluation of Cleanrooms
FDA Guidance – Aseptic Processing
ISO 14644 Series - Cleanrooms and associated
controlled environments
3

© CBE – 023 V2
How Important is Environmental
Monitoring ?
The answer lies in risk assessment
The GMPs for sterile products has clearly defined GMP rules
The GMPs for non-sterile products have poorly or un- defined expectations
How important - depends entirely on: the dose form and use of the product
the types of product manufactured (sterile / non-sterile)
Whether potent materials are handled in the facility
Whether processing is closed or open
4

© CBE – 023 V2
WHO Guidance
Environmental Monitoring of Clean Rooms in Vaccine Facilities
Points to consider for manufacturers of human vaccines
EM describes the microbiological testing undertaken in order
to detect changing trends of microbial counts and micro-flora
growth within clean rooms or controlled environments.
The results obtained provide information about the physical
construction of the room, the performance of the Heating,
Ventilation, and Air-Conditioning (HVAC) system, personnel
cleanliness, gowning practices, the equipment, and cleaning
operations.
Use Risk Assessment based on “Open” and “Closed”
systems and considering “Live” and “Inactivated” materials
5

© CBE – 023 V2
Closed vs Open Systems
Closed: Systems are considered closed when materials are added and removed so that product is not exposed to the room environment at any time.
To do so they must be equipped with a barrier technologies allowing the aseptic transfer of solids, liquids, and gasses, such as tube welders, steam-through valves, isolator port assemblies, and other validated transfer systems.
Open: Semi closed or intermittently closed systems for the purpose of defining clean room grades are considered open systems.
6

© CBE – 023 V2
Why do we monitor ?
Particulates: Verify that the HVAC systems is functioning
correctly and rooms are meeting specifications. Particles are
associated with physical contamination and indirectly micro-
biological contamination.
Microbiological: The purpose of viable environmental
monitoring is to:
verify the integrity of the cleanroom air and HVAC systems
monitor the effectiveness of surface C&S programs
monitor operator performance via personnel monitoring.
Monitor aseptic process integrity in Grades A and B
7

© CBE – 023 V2
What should be monitored ?
Physical
Particles at rest
Temperature
Relative Humidity
Room Pressures
Biological
Bacteria
Yeast and moulds
Pharmaceutical Services
Water system and in some cases steam
HVAC
Pharmaceutical gases
8

© CBE – 023 V2
What Methods (Biological) ?
Each method has limitations
Suitable combination of:
Settle plates
Contact (RODAC) Plates
Surface Swabs
Active Air Sampler
Flush Water (from Equipment)
Endotoxin for some sterile products equipment
9

© CBE – 023 V2
What Sample Locations to Choose ?
Defined for particulates generally in ISO14644 and cGMP Annex 1
Risk based decision for micro-biological monitoring
Microbiological driven by the purpose of sampling
Considerations: Proximity to the product
Product contact equipment surfaces
Whether testing for cleaning verification or product purity
10
© CBE – 023 V2
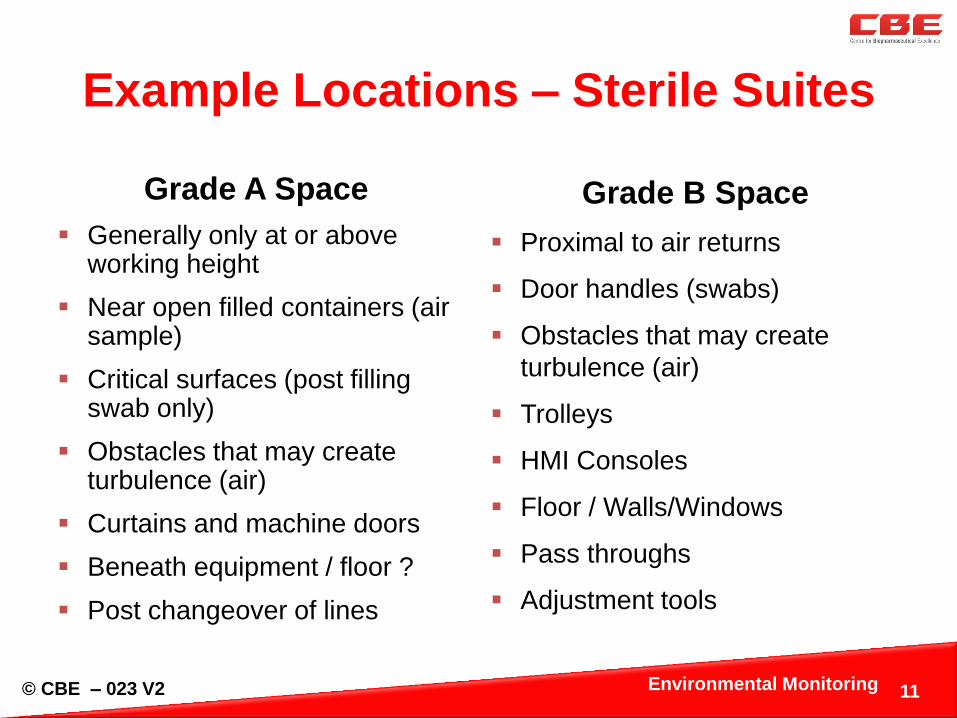
Example Locations – Sterile Suites
Grade A Space
Generally only at or above working height
Near open filled containers (air sample)
Critical surfaces (post filling swab only)
Obstacles that may create turbulence (air)
Curtains and machine doors
Beneath equipment / floor ?
Post changeover of lines
11
Grade B Space
Proximal to air returns
Door handles (swabs)
Obstacles that may create
turbulence (air)
Trolleys
HMI Consoles
Floor / Walls/Windows
Pass throughs
Adjustment tools
Environmental Monitoring

© CBE – 023 V2
Higher Risk Locations in Grade A
near open filled containers (air sample)
proximal to air return (air sample)
floor and door handles (swabs)
filling nozzle (post filling swab only)
gloved hand (contact plate)
obstacles that may create turbulence (air)
12

© CBE – 023 V2
Example Locations – Grades C and D
Post processing product contact equipment cleaning
surfaces
Hardest to clean locations for direct product contact
surfaces
Rooms with open processing – more frequent
Rooms with “contained” processing – lesser frequency
Rooms with closed processing – less frequency
Non-processing rooms – infrequent
Air locks
Drains, washbays ?
13

© CBE – 023 V2
How Frequently to Monitor ?
Is a risk based decision which depends on:
the dose form being processed (aseptic / terminal)
whether the processing is “closed”, “contained” or “open”
Sterile products / aseptic processing have defined
requirements for Grade A, somewhat for Grade B.
Grade A and B expect some frequent/continuous
coverage – settle plate exposure enable this
Defined for Grade C and D by WHO Guidance
Need enough samples to conduct trending over a year
Some fixed locations and some rotational
14

© CBE – 023 V2
WHO Recommended Viables Monitoring
Frequencies
15
(2) The practice of air sampling at the start, middle, and end of filling operations provides better environmental monitoring and facilitates investigations related to filling batch release. This approach should be part of a general environmental monitoring strategy based on risk analysis and considering the types of activities performed.

© CBE – 023 V2
Relative Frequency of Monitoring –
Rooms for Non-Sterile Facilities
Lowest Risk (I) - low risk rooms – monitor 1 - 2 months
Moderate Risk (II) – medium risk rooms monitor 2 - 4
weeks
Higher Risk (III) – higher risk rooms – monitor weekly
16
Room Activity Dry Oral Solids Liquid / Creams
No Product / Materials Exposed I I
Processing Equipment Storage I II
Packaging Areas I II
Open Product Exposed II III

© CBE – 023 V2
Examples of Non-Sterile Limits
Microbiological Limits for Surfaces
Swabs (post clean)
Alert Levels per
Swab (25cm2)
Action Levels per
Swab (25cm2)
Surface not in immediate contact with
product (e.g. lid)
> 2 cfu/swab
Any mould
≥ 5 cfu / swab
> 1 mould
Surface in immediate contact with
product (e.g. inside tank)
Any positive ≥ 2 cfu / swab
Any mould
17
Alert Limit Action Limit Bacteria Yeast Mold Total
Count Bacteria Yeast Mold Total
Count
> 25 > 15 > 40 > 50 > 30 > 100
Cleaned Equipment Limits (Swabs)
Cleaned Facility Limits (Air Sample)
© CBE – 023 V2
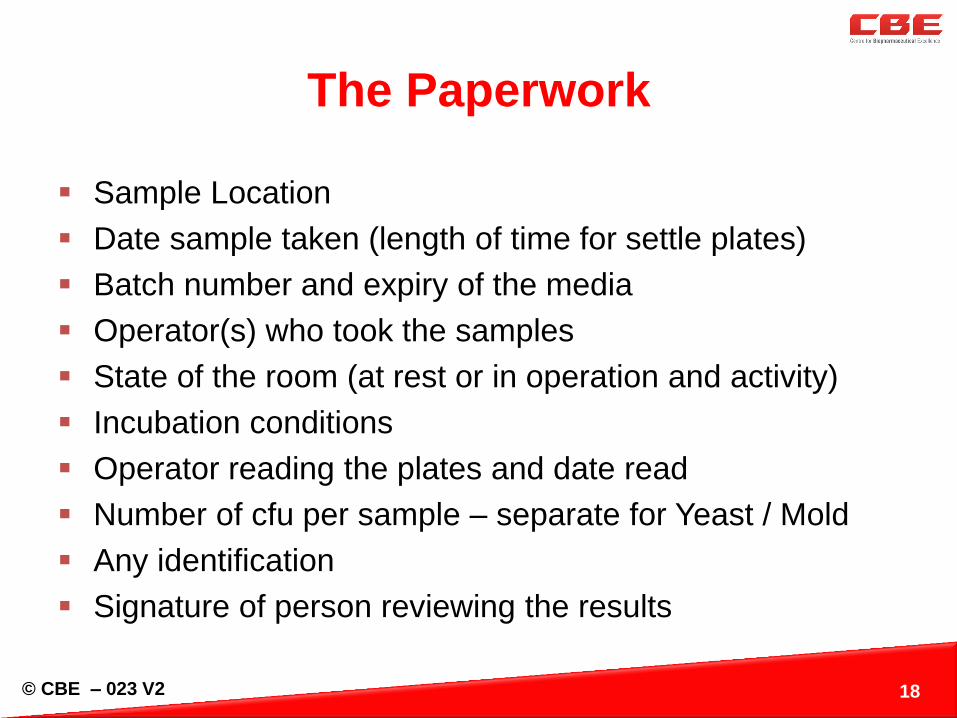
The Paperwork
Sample Location
Date sample taken (length of time for settle plates)
Batch number and expiry of the media
Operator(s) who took the samples
State of the room (at rest or in operation and activity)
Incubation conditions
Operator reading the plates and date read
Number of cfu per sample – separate for Yeast / Mold
Any identification
Signature of person reviewing the results
18

© CBE – 023 V2
Physical Monitoring
Pressure Differentials
Generally continuous by a validated EMS or
Magnehelic gauges outside each processing room read twice daily
Generally > 15Pa (sterile) and > 10Pa (non- sterile) differentials
Verify air flow directions between rooms “at rest”
Temperature / RH % Either EMS system or in- room physical monitors
Record Max and Min per day
Filter Integrity
Annual clean and test for % penetration
Velocity not usually measured for non-sterile rooms, except for validation
purposes / air change rate calculations.
19

© CBE – 023 V2
WHO Particulate Monitoring
20

© CBE – 023 V2
Pharmaceutical Waters
Feed (Potable) Water
Purified Water
Highly Purified Water
Water for Injections – PFW & WFI
Softened Water
Water for Final Rinse
Pure, or clean Steam
Water for cooling Autoclaves
Each has a different monitoring requirement
21

© CBE – 023 V2
What goes on inside your water system if
it’s not maintained
22
Free swimming aquatic bacteria – mostly G-ve .. .see this as
general background bacterial count
Biofilm build up on surfaces – see this as intermittent spikes
Key is a good simple design + periodic validated sanitation
strategy

© CBE – 023 V2
General Water EM Rules
Purified water may use pour plate method:
Minimum sample size: 1ml
Media: PCA or R2A (depending on limits applied)
Incubation: 48 - 72 hours at 30-350C
WFI - use membrane filtration:
Minimum sample size: 100ml (use 250mL)
Media: R2A agar (low nutrient)
Incubation: 48 - 72 hours at 30-350C
Monitor endotoxin levels (< 0.25EU/mL)
Identify recovered organisms to genus level or for WFI to species
level.
23

© CBE – 023 V2
Water Sampling
Must have a water system map – with numbered
sampling valves for up stream and points of use (POU)
Pre-clean outlet with 70% alcohol. (TOC sample last.)
Use “aseptic” technique – requires an SOP
Sample through production use hoses and flush prior to
sampling
Store samples in fridge unless testing within 4 hours.
Test ASAP (<24 hours)
24

© CBE – 023 V2
Water Standards
British and European Pharmacopoeia monographs
United States Pharmacopoeia <1231>
CPMP/QWP/158/01 – Guidance – Quality of water for
pharmaceutical use
25

© CBE – 023 V2
Microbial Limits - USP <1231>
Manufacturers should establish “alert” and “action” limits based on the use of the water plus capability of the system. They may involve levels of total microbial counts or recoveries of specific microorganisms
There are certain maximum microbial levels above which action levels should never be established.
Generally considered maximum action levels are:
100 cfu per mL for Purified Water
10 cfu per 100 mL for Water for Injection
For WFI - LAL < 0.25EU/mL
26

© CBE – 023 V2
Expected Limits
27
• Target < 1cfu/mL on average
• Alert > 10cfu/mL
• Action** >100cfu/mL
Purified
Water
• Target < 1cfu/100mL “effectively sterile”
• Alert > 1cfu/100mL/ any LAL count
• Action** > 10cfu/100mL / 0.25 EU/mL
WFI
** Should set action limits below compendial limits if possible

© CBE – 023 V2
Developing and Managing a
Cleanroom Microbiological Monitoring
Program for Sterile Products
28

© CBE – 023 V2
Who Should Monitor ?
29
Oversight by QC Microbiology
QC Led Team
• Independent of Production
• Policeman approach
• Not efficient utilisation of resources
Production Led Team
• Pragmatic approach
• In-process control
• Must have strong QC oversight
• Training of operators
• QC surveillance program
• Random audits by QC

© CBE – 023 V2
Core EM Documentation
SOP – Viables EM Programs
Location Maps Set Up, Run, Post Run
Risk Assessments
locations / frequency / methods
Grade A Interventions
Trend Monitoring Periodic Trend Reviews EM Isolates Program
Test Methods
Method Validation
surface recovery studies
Incubator qualification Training
Sampling forms Lab tracking logs
Incubation / Results EM OOS Investigations
Other
Gown Validation Gown Monitoring
Media Growth Promotion Vendor Audits Receipt Testing
30

© CBE – 023 V2 31
Physical Environment and Airflow
Patterns
Airflow patterns are studied (visualization studies) to: Look for lack of turbulence and no entrainment across Grade B to A
interfaces;
Identify worst case locations for EM sampling sites
Must do under “at rest” and simulated “in operation” modes
Airflow patterns are established during qualification and re-validation studies to ensure the validated conditions have not changed; Grade B to A interfaces
Movement through pass through cabinets (PTCs)
The patterns should be documented so changes can be detected. Require a protocol and report + raw data (video)
Environmental Monitoring

© CBE – 023 V2
GMP Rules for Grade A and B Air
Monitoring
Non-viable Particles (NVPs)
Grade A must be continuous monitoring during set up and
operation
Grade B continuous not mandatory, but preferred
Must have an SOP for excursion and line clearance
There is an “association” between NVPs and microbes
Viable Particles (VPs)
Variety of techniques – all have reasons and challenges
Settle plates (passive), contact plates, active air, surface swabs
Must be continuous monitoring in Grade A and Grade B
Must monitor operator gloves, post intervention and on exit of
room and gowns periodically
Must have alert and action response program
32 Environmental Monitoring

© CBE – 023 V2
EM Programs and Sanitation
EM data monitors the effectiveness of the C&S program
There is no one magic sanitant so a combination is needed. Vegetative cells Fungal spores Bacterial spores
Sanitisers .... Disinfectants ..... Sporicides…....
EM Trend reviews underpin confidence in C & S program and cleanroom management
Should identify & trend fungi/mold separately to bacteria
For new sanitant should validate effectiveness “in field”. Sanitant surface residues can inhibit EM growth
33

© CBE – 023 V2
Establishing a Viables EM Program for
Grade A and B
1. Engage Microbiologist and Aseptic Operators
2. Study the fill line, process, critical space and Grade B Rooms
3. Study personnel and materials movement
4. Conduct air visualisation studies “at rest” then in “simulated operation”
5. Characterisation study for extended period (if possible) grid rooms
6. Risk assess worst case locations:
Critical space and critical surfaces
Areas with high activity or personnel frequently in proximity
Areas with high personnel traffic or areas frequently touched
Areas difficult to sanitise effectively
7. 3 times OQ at rest after C&S program
8. 3 times PQ in operation after C&S program
9. SOP - Fixed and rotational locations in 1st 12 months – review 3
monthly then update after review.
34

© CBE – 023 V2
Site Selection Considerations
Can use a combination of grid mapping by room and risk
assessment by location in room
Sites or process steps where contamination may adversely effect product
Sites likely to accumulate microbial load during processing or use
Potential “dead spots” in room
Sites most difficult to clean or sanitise
Means of microbial dispersion in the room environment via:
People, equipment, processes, materials and air flows
Must also consider risk to product associated with the sampling itself
Must be able to remove any media residue from surfaces
Must not interfere with operators during processing
35

© CBE – 023 V2
Interpreting Viable Industry Limits (Grade A and B Space)
36
Active Air
cfu per m3
Passive Air (Settle – 4 hr)
Surface (Rodac/Swab)
Personal (Glove 5 finger)
Personal
(Gown)
EU/PICs/Who
Annex 1
A < 1
B 10
A < 1
B 5
A < 1
B 5
A < 1
B 5
Not
specified
US FDA
Class 100
Class 10,000
1
10
1
5
Not
specified
Not
specified
Not
specified
USP <1116>
(incident rate)
ISO 5 <1%
ISO 7 <5%
Same
incident rate
as active air
Same
incident rate
as active air
Same
incident rate
as active air
Same
incident rate
as active air
Japan Aseptic Guide
(JPXV1)
A < 1
B 10
A < 1
B 5
A < 1
B 5
A < 1
B 5
Not
specified

© CBE – 023 V2
Interpreting Viable Industry Limits (Grade C and D Space)
37
Active Air
cfu per m3
Passive Air (Settle – 4 hr)
Surface (Rodac/Swab)
Personal (Glove 5 finger)
Personal
(Gown)
EU/PICs/Who
Annex 1
C 100
D 200
C 50
D 100
C 25
D 50
Not
specified
Not
specified
US FDA
Class 100,000
100
50
Not
specified
Not
specified
Not
specified
USP <1116>
(incident rate)
ISO 8
<10%
Same
incident rate
as active air
Same
incident rate
as active air
Same
incident rate
as active air
Same
incident rate
as active air
Japan Aseptic Guide
(JPXV1)
C 100
D 200
C 50
D 100
C 25
D 50
Not
specified
Not
specified

© CBE – 023 V2 38
0
2
4
6
8
10
12
14
1 2 3 4 5 6 7 8 9 10 11 12 13 14 15 16 17 18 19 20
Grade B Profile
Count (B) Limit
0
2
4
6
8
10
12
1 2 3 4 5 6 7 8 9 10 11 12 13 14 15 16 17 18 19 20
Grade B Profile
Count (B) Limit
✗
✔

© CBE – 023 V2
Minefields in Limit Interpretation
Numbers matter but trend changes matter as much
PICs says “on average” but single excursions matter
Based on total counts but species matter e.g yeast/mold,
pseudomads …..
Limits have caveats regarding methods / conditions
Grades B, C and D limits are generally excessive in a well
controlled cleanroom
These are regulatory or “action” limits – companies expected
to develop “alert” levels
USP <1116> proposes incident rates instead of numbers –
basis is trend monitoring.
Significance is related to the proximity to open product
39

© CBE – 023 V2
Analysis of Microbiological Data
(Modular or Product Specific)
Cleanroom Environmental Monitoring (Modular)
Bioburden (can be both product and modular)
Water Systems (Modular)
Steam and Compressed Air Systems (Modular)
Cannot assume “normal” distribution of data
Most values tend to be “0” – hard to mathematically treat
Must use other techniques
Log e or 10 conversion approach
Rank Percentile approach
40

© CBE – 023 V2
Analysis of Microbiological Data
(Objective)
Want to verify or re-establish alert and
action limits based on historical trends.
Science based approach:
Convert to Log10 or Log e – this tends to
normalise data = problem of zeros.
Rank in order and cut off at say 95% (action)
and 90% (alert)**
Use cumulative frequency approach
** minimal mathematics needed
41

© CBE – 023 V2
Using Recovery / Contamination and Incident Rates
(Refer to USP – 1116)
Recovery (Contamination) Rate: Number of samples with positive
results expressed as a percentage of total samples
Incident Rate: Number of samples with results above the alert /action
limits expressed as a percentage of total samples
42
© CBE – 023 V2
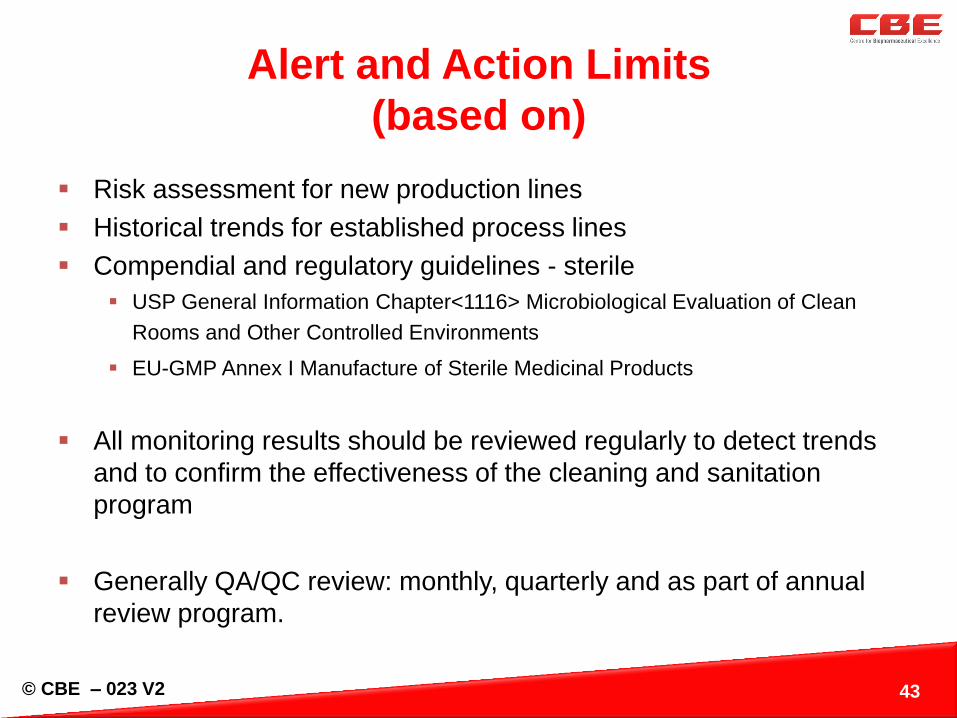
Alert and Action Limits
(based on)
43
Risk assessment for new production lines
Historical trends for established process lines
Compendial and regulatory guidelines - sterile
USP General Information Chapter<1116> Microbiological Evaluation of Clean
Rooms and Other Controlled Environments
EU-GMP Annex I Manufacture of Sterile Medicinal Products
All monitoring results should be reviewed regularly to detect trends
and to confirm the effectiveness of the cleaning and sanitation
program
Generally QA/QC review: monthly, quarterly and as part of annual
review program.
© CBE – 023 V2
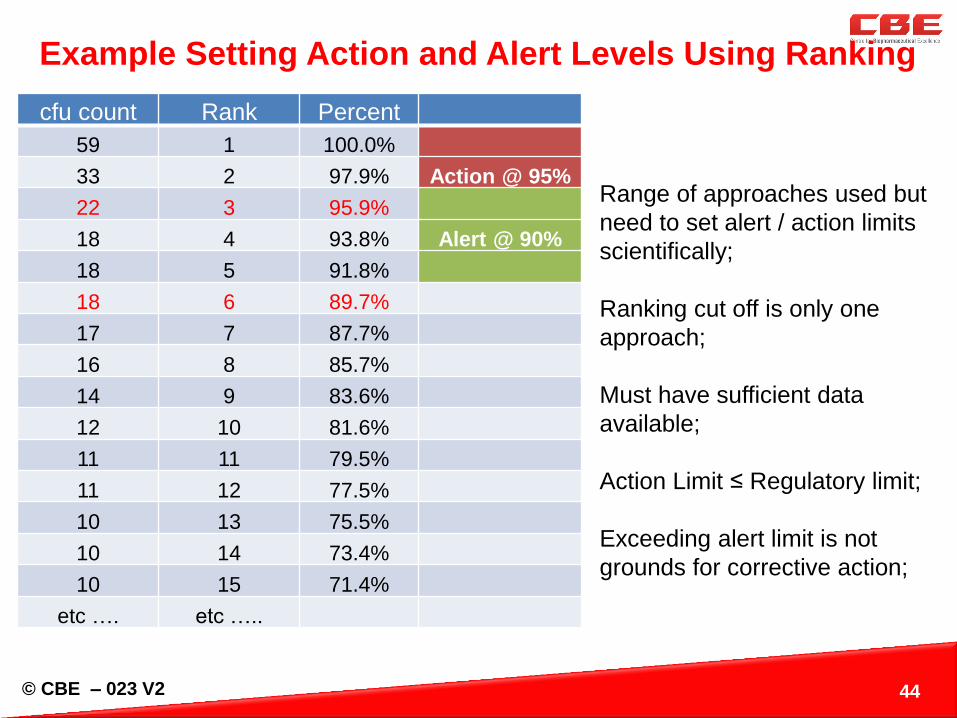
Example Setting Action and Alert Levels Using Ranking
cfu count Rank Percent
59 1 100.0%
33 2 97.9% Action @ 95%
22 3 95.9%
18 4 93.8% Alert @ 90%
18 5 91.8%
18 6 89.7%
17 7 87.7%
16 8 85.7%
14 9 83.6%
12 10 81.6%
11 11 79.5%
11 12 77.5%
10 13 75.5%
10 14 73.4%
10 15 71.4%
etc …. etc …..
44
Range of approaches used but
need to set alert / action limits
scientifically;
Ranking cut off is only one
approach;
Must have sufficient data
available;
Action Limit ≤ Regulatory limit;
Exceeding alert limit is not
grounds for corrective action;

© CBE – 023 V2
Rank Percentile Approach to Establishing Alert
and Action Limits.
45
Alert Limit
Action Limit

© CBE – 023 V2
Example Alert and Action Responses
If …… Then ….. also refer to SOP xxxx
Any result
exceeds the alert
limit (or there is a
trend)
Identify the organism to genus level
Inspect the cleaning record for the equipment to verify it was properly
cleaned and sanitized
Notify the QC Manager of the result
Initiate Alert Report (F xxxx) to notify the QA Manager and Production
Manager
Any result
exceeds the
action limit
Identify the organism to species level
Inspect the cleaning record for the equipment to verify it was properly
cleaned and sanitized
Review the testing trends for all equipment used in non-sterile
production
Notify the QA Manager of the result – determine whether a product risk
assessment is warranted, or not.
Test the product for the absence of the identified organism
Initiate Deviation Report (F xxx) to notify the QA Manager and
Production Manager
46

© CBE – 023 V2
EM Excursions and Product Quality
“Alert and action limits do not define product attributes such
as sterility and therefore should not be considered as product
specifications or extensions of the product specification.”
“Rather they are intended to indicate changes so that
corrective action may be taken before product quality is
adversely affected.”
“Investigations are expected for action level excursions or
adverse trends.” (Using a written investigation plan)
PDA TR 13 EM Fundamentals 2014
47

© CBE – 023 V2 48
Environmental Monitoring:
Relationship to Batch Release
While an inferential relationship exists between microbiological environmental monitoring data and batch release, reaching or exceeding and action level does not necessarily indicate that product quality is adversely affected.
The significance of action level excursions in environmental monitoring is based upon the outcome of a comprehensive investigation of all conditions that might impact the acceptability of the process and the batch(es) produced.
The results of such an action level investigation may indeed lead to the rejection of a batch (e.g., problems at filling line plus action levels in multiple environmental monitoring programs) or may not lead to the rejection of a batch (e.g., isolated event, no action levels in multiple environmental monitoring programs, data acceptable before and after event, similar events in successful media fills).
Environmental Monitoring

© CBE – 023 V2
Example of Good EM Annual Review
Grade Type of
Monitoring
Filling Room #
1
Filling Room #
1 Vial Storage Filling Room
# 2
A Active Air 561
187 19
Passive Air 561
187 19
Surface 1587 0
56
Total EM Samples 2659 374 94
Number Positives 0 0 0
B Active Air
561
38
Passive Air 0 19
Surface 2171 220
Total EM Samples 2732 277
Number Positives 0 0
49
© CBE – 023 V2
The type of bug matters !
Mold is a problem in any facility – hard to remove. Set mold limits lower than for total bacterial count limits
Pseudomonas sp. in water systems and liquids and creams areas
Known objectionable organisms / pathogens
Should occasionally “speciate” the organisms detected and always when there are unusually high numbers or during an investigation.
50

© CBE – 023 V2
What methods are suitable?
Each method has limitations and advantages so needed in
combination.
Suitable combination of:
Settle plates – passive limited space but extended time coverage
Contact (RODAC) Plates – small flat surface areas
Surface Swabs – larger inaccessible areas but harder to recover
Active Air Sampler – better detection but limited time duration
Gloves and garments monitoring – hit or miss.
51

© CBE – 023 V2
How to Report EM results
TAMC = Total Aerobic Microbial Count
TYMC = Total Yeast and Mold Count
TAMC = TYMC + total bacterial count
Never report “zero” always NOD (No Organisms Detected)
TNTC = To Numerous To Count (generally means > 300 cfu
per plate.)
52

© CBE – 023 V2
WHO Recommended Incubation Methods
Minimum of two temperatures to detect both bacteria
and fungi.
3 to 5 days of incubation at 20 to 25oC followed by
incubation 30 to 35oC for an additional 2-3 days
The method chosen should be carefully validated and
standardized.
Option for Separate Incubation Conditions:
Y & M: 20oC - 25
oC for 5 days (SAB or TSA plates) and
Bacteria: 30oC - 35
oC for 3 days – TSA Plates
53

© CBE – 023 V2
EM Test Method Validation - Plates
Required but limited to % recovery and fertility
EM Settle Plates
Qualify plates per supplier by recovery study > 70%
expected. (WHO recommends > 50%)
Add say 100 cfu to the plate then count % recovered for a
bacteria, a yeast and a mold
Consider sanitant inhibitor plates
4 hour exposure
Use near expired plates
Add back specified organisms, or alternative
54

© CBE – 023 V2
EM Test Method Validation - Surface
Required but limited to % recovery and fertility
EM Swabs
Add say 100 cfu to cleanroom (representative) different
surfaces then count % recovered for a bacteria, a yeast
and a mold
Expect >70% recovery (WHO recommends > 50%)
Are qualifying each “swabber” technique
Consider sanitant inhibitor – peptone water
55

© CBE – 023 V2
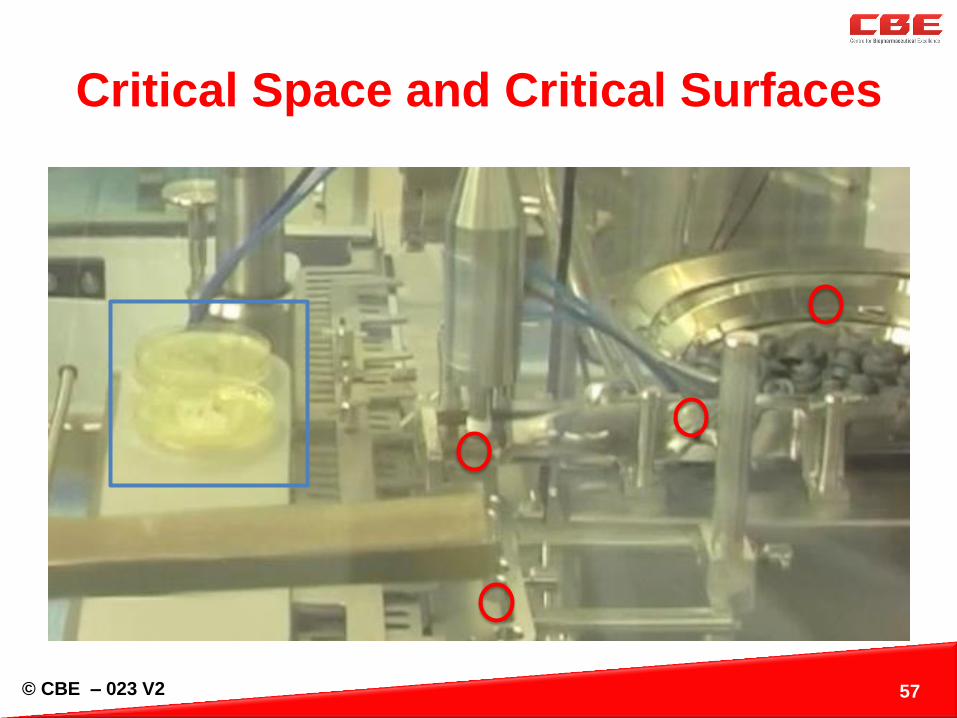
Grade A
Critical Space and Critical Surfaces
Critical Space – Grade A / ISO 5
A critical area is one in which the sterilized drug product, containers, and
closures are exposed to environmental conditions that must be designed to
maintain product sterility.
Critical Surfaces within Critical Space
Not all Grade A space is a critical surface.
Surfaces that may come into contact with or directly affect a sterilized
product or its containers or closures.
Critical surfaces are rendered sterile prior to the start of the manufacturing
operation, and sterility is maintained throughout processing. Generally
monitored post processing.
56
© CBE – 023 V2
Critical Space and Critical Surfaces
57

© CBE – 023 V2
Personnel Monitoring Aseptic Operators
Sterile Gowns
Initial qualification 3 times per operator
6 or 12 monthly gowning verification
End of day surveillance - operators in rotation
Multiple spots in rotation
Gloves
Initial qualification
End of aseptic session / end of shift in rotation
Post entry into Grade A space for all “high risk” interventions
Left and right hands – 5 fingers
58

© CBE – 023 V2
Gown and Glove Monitoring with Rodacs
59

© CBE – 023 V2
Grade A / B Excursions and
Investigations Sample type - contact plate, settle plate, active air sampler, gown)
Location of sample (distance to critical surfaces)
Review of relevant air visualisation / smoke studies
Microbiogical identity to species level
Review of operations during time period (include operator interview,
video review, review of event logs)
Review of relevant EM data (micro, physical - differential pressure,
non viables, temp, humidity)
Review of trend data (historical and after the event)
Further investigations in regard of potential sample contamination
either during sampling or in the labs
Specific monitoring programs to support root cause investigations
60
© CBE – 023 V2
Crucial information for EM Excursion
Risk Assessments
Is it an isolated event (only 1 sample contaminated)?
Quantity of contamination (e.g 1 CFU or 25 CFU)
What is the type of organism ?
Identification of microorganism (human origin, mold, etc.)
Plausible most probable root cause(s) informs
assessment of product exposure or impact
Distance to open product and/or critical surface (including
airflow pattern)
61

© CBE – 023 V2
Usual suspects - sources of organisms
Personnel ! Operators, cleaners, fitters, transients
Personnel ! Poor gowning practices
Personnel ! Poor aseptic techniques / hand sanitisation
Tracked in via ancillary equipment – trolleys, tanks etc.
Poor aseptic transfers of materials through pass through etc.
Inadequate cleaning eg. underneath equipment or on conveyors
Via leaks in HVAC / HEPA system
62

© CBE – 023 V2
Case Example # 1
Single Grade A organism – Bacillus. subtilis
Contact plate post filling
Detected on guard rail for vials near filling station
Track record of line is good No sterility failures
No media fill fails
Excellent history of EMs in last 2 years
Operators are qualified and well trained
Investigation
Source
Fate of the batch
Corrective Action(s)
63

© CBE – 023 V2
Other examples – Grade A Excursions
1. Active air sampler + settle plate, filling area during filling – 1 mold +
1 mold = reject
2. Left glove, set up stopper hopper, below product contact surfaces –
1 bacteria (Staph. epidermidis) = release
3. Filling needle post fill swab – 1cfu Staph. aureas = reject
1. Left glove, freeze dryer loading using RABS technology, operator
well separated from semi stoppered vials – 3 cfu (2 x
Corynebacterium afermentans, Kocuria varians) = release
64

© CBE – 023 V2
In summary
EM is expensive and outcomes can be problematic
Must pay attention to the small details
No direct relationship to product quality – degrees of separation is important
Risk assessment and trend monitoring are fundamental elements
The more distance between personnel and critical space / surfaces the better …. case for RABS and Isolator technology.
65

© CBE – 023 V2
Steve Williams, Director, CBE Pty Ltd www.cbe-ap.com.au +61(0)417116476 [email protected]