Embed Size (px)
Citation preview

7/30/2019 Microbiology of at 00 Greg
http://slidepdf.com/reader/full/microbiology-of-at-00-greg 1/286

7/30/2019 Microbiology of at 00 Greg
http://slidepdf.com/reader/full/microbiology-of-at-00-greg 2/286

7/30/2019 Microbiology of at 00 Greg
http://slidepdf.com/reader/full/microbiology-of-at-00-greg 3/286

7/30/2019 Microbiology of at 00 Greg
http://slidepdf.com/reader/full/microbiology-of-at-00-greg 4/286

7/30/2019 Microbiology of at 00 Greg
http://slidepdf.com/reader/full/microbiology-of-at-00-greg 5/286
PLANT SCIENCE MONOGRAPHS
Edited by
Professor Nicholas Polunin
THE MICROBIOLOGY OF THE ATMOSPHERE
7/30/2019 Microbiology of at 00 Greg
http://slidepdf.com/reader/full/microbiology-of-at-00-greg 6/286
PLANT SCIENCE MONOGRAPHS
Uniform with this volume will be:
*Biology ofMycorrhiza
Encyclopaedia of Weeds and Their Control
Grassland Improvement .
Mangroves of the World
Mutations and Crop Improvement
*Plant Growth Substances
Plant Life and Nitrogen .
*Salt Marshes and Salt Deserts of the Wor
*Seed Preservation and Longevity
Sex in the Lower Ormnisms
Id
J.L. Harley
L.J.
King
A. T. Semple
V.J. Chapman
A. Gustafsson
J. L. Audus
G. Bond
V.J.Chapman
L. V. Barton
H. P. Papazian
FURTHER TITLES ARE UNDER CONSIDERATION
The feeding and clothing of the world's teeming millions can continue to keep
abreast of population increases through the help of effective application of
research in the plant sciences. The publication of this research, by which means
a scientist or technologist makes his findings known to workers elsewhere, tends
to be scattered in literally hundreds of botanical and agricultural journals
emanating from most of the countries of the world. Often it appears in such
polyglot arrays of fragments that it is extremely difficult to bring together even
in some narrow 'line' of endeavour. Consequently advances are slowed and
interests unnecessarily divided, scientific and human progress being thereby
retarded.
The present series of 'monographs' is designed to remedy these deficiencies
in especially important or attractive specialities, by publishing individual book-
length accounts of the entire background and current progress in their fields.
Such detailed surveys, being fully documented and plentifully illustrated,
should prove of real value to the world at large in constituting the bases for
further advances on the ever-expanding horizons of scientific research, and so
lead to improved productivity and, ultimately, standards of living. They are
prepared by specialists usually of international reputation for their work in the
field chosen, and often culminate a lifetime of active investigation. Being as
up-to-date as possible, they will often embody significant advances not pre-
viously published.
*Already published and available
FOR DETAILS OF A COMPANION SERIES SEE THE END OF THIS BOOK

7/30/2019 Microbiology of at 00 Greg
http://slidepdf.com/reader/full/microbiology-of-at-00-greg 7/286
Plate i.—Representative fields from Hirst-trap slides illustrating diverse air sporas.
(Magnification: all x looo. At this magnification i sq. cm. of field corresponds to 2-i cc. of air.)
Frontispiece
(a) Fine-weather air spora, Ascot, Berks., i2-oo hr., 27 June 1958. Showing grass and nettle
pollen, Cladosporiutn, Epicoccutn, etc.
(h) Damp-air spora. Ascot, Berks., 02-00 hr., 17 June 1958. Showing spores ofGanodernia,
Sporobolomyces, Tilletiopsis, and other hyaline basidiospores.
(c) Rain-type air-spora, Ascot, Berks., 04-30 hr., 13 June 1958. Showing various ascospore
types, Sporobolomyces, soot, etc.
{d) Air-spora in a wheat crop at night during a thunder-storm, Harpenden, Herts., 21-30
hr., 10 August 1959. Showing Puccinia graminis uredospores, Cladosporium, and unidentified
ascospore.
{e) Spores of MertiUus lacrymans from air of building with timber affected by dry-rot.
From camera-lucida paintings by Maureen E. Bunce.

7/30/2019 Microbiology of at 00 Greg
http://slidepdf.com/reader/full/microbiology-of-at-00-greg 8/286
^k
& ^
7'i
.07
i.^- v.-
i
a
I
#')ii
1
#
^w
• vlT*
7 (>X-^^^^
V- /^->.
€»
—For details sec preceding page.

7/30/2019 Microbiology of at 00 Greg
http://slidepdf.com/reader/full/microbiology-of-at-00-greg 9/286
PLANT SCIENCE MONOGRAPHS
edited by
Professor Nicholas Polunin
THE MICROBIOLOGYOF THE ATMOSPHERE
By
P. H. GREGORYPh.D., D.Sc. (London), D.I.C.
Head ofPlant Pathology Department,
Rothamsted Experimental Station, Harpenden, England;
formerly Professor ofBotany, Imperial College of Science and
Technology, University ofLondon
1961
LONDON
LEONARD HILL [BOOKS] LIMITED
INTERSCIENCE PUBLISHERS, INC.NEW YORK

7/30/2019 Microbiology of at 00 Greg
http://slidepdf.com/reader/full/microbiology-of-at-00-greg 10/286
LONDONLeonard Hill [Books] Ltd.
9 Eden Street, N.W.i
NEW YORKInterscience Publishers, Inc.
250 Fifth Avenue, New York i
FIRST PUBLISHED IN GREAT BRITAIN I961
© P. H. Gregory, 1961
DEDICATED
to
my wife
Margaret Fearn Gregory
PRINTED IN GREAT BRITAIN AT
THE UNIVERSITY PRESS
ABERDEEN

7/30/2019 Microbiology of at 00 Greg
http://slidepdf.com/reader/full/microbiology-of-at-00-greg 11/286
PREFACE
Aerobiology is usually understood to be the study of passively airborne
micro-organisms—of their identity, behaviour, movements, and survival.
One characteristic, which it shares with many other population studies
in biology, is that the ultimate relevant unit consists of the individual
cell or small group of cells. Analysis at the molecular or sub-atomic level
is irrelevant to our present purpose. Like geography, aerobiology is an
agglutinative study, drawing information from many kinds of scientific
research. Although it already has its patron saint, Pierre Miquel, and its
martyr, Fred C. Meier, aerobiology is best regarded as an activity whose
material will in due course be incorporated into the main body of bio-
logical science—without, I hope, any necessity for splinter societies,
journals, and international conferences.
This book amplifies and extends a course of Intercollegiate Lectures
given to botanical students in the University of London in 1956. The
theme, which has occupied me for over fifteen years, is as follows. Trans-
port through the atmosphere is the main dispersal route for such organic
particles as the spores of many micro-organisms. How do the properties
of the atmosphere, and the properties of these particles themselves,
affect their dispersal? How do the particles get into the air? How far,
and in what numbers, are they dispersed? By what processes do they
become grounded, so that they can continue growth ? What is in the air,
and how can we measure it ? What are the practical consequences of this
process for the micro-organisms themselves, and for man, other animals,
vegetation, and crops ?
Although there are one or two other books on airborne microbes, this
is the first to treat the subject as a world-wide phenomenon. It is, perhaps,
inevitable that it should be attempted by a mycologist. Few other biologists
find their material so dominated by the atmosphere, and no other micro-
organisms have so thoroughlyexploited the possibilities of aerial dispersal as
the fungi. One of the fascinations of the subject is the impact of facets of its
knowledgeon such apparently diverse topics as artificial rain-making, allergy,
smoke screens, effluent of nuclear power-stations, crop protection, icing of
aircraft, air hygiene, and many other topics. This book treats of the
development and principles of aerobiology rather than applications; yet
the stimulus to nearly all aerobiological work comes from applied science.
In this book the term 'microbe' is used freely when a general word is
wanted; but, like the word 'spore', it has admittedly been stretched
beyond its normal meaning. Airborne pollen of flowering plants must be

7/30/2019 Microbiology of at 00 Greg
http://slidepdf.com/reader/full/microbiology-of-at-00-greg 12/286
THE MICROBIOLOGY OF THE ATMOSPHERE
Included and is safely covered by the term 'spore' (botanically : 'micro-
spore') ; but are pollen grains and mushroom spores microbes ? There is
no other commonly accepted word that covers quite what is meant by the
word 'spore' as used here: 'propagule', 'disseminule', 'biota', 'diaspore'?
We have isolated part of the continuum for study but find we are not well-
equipped verbally for the task of dealing with it. The microbial population
of the atmosphere is referred to here as the 'air-spora', using 'spora' as a
word analagous to 'flora' and 'fauna'.
Botanical nomenclature has presented some difficulties: authorities
have not been given for specific names, and the names used by other
authors have usually been quoted as given in the original papers—without
necessarily attempting to guess what was meant, or following the nomen-clature fashionable in i960. I have converted other workers' numerical
data to the metric system, and temperature to the Centigrade scale, to
aid comparison, and have moreover assessed spore concentrations on the
uniform basis of number per cubic metre.
Frequently, in making general statements, I have omitted safeguarding,
but tedious, escape clauses: this has been done to spare the reader who
will understand that biological generalizations aboun-d in exceptions and
complexities.
Interpretations in this book are mostly my own responsibility, but I
am grateful for help received from many people during its preparation.
In particular I offer my thanks to the following : G. Samuel and W. Buddin
for introducing me to dispersal problems in the field; F. C. Bawden for
encouragement in the study of aerobiology and for reading this book in
manuscript; E. C. Large for advice on planning the book; D. A. Boalch
(and many other librarians) for continual help with the literature;
members of the British Mycological Society for named specimens of
fungi, and H. L. K. Whitehouse for mosses; A. Home, V. Stansfield,
and F. D. Cowland for photography; R. Adams, G. C. Ainsworth, J.R. D.
Francis, E.J.
Guthrie, Elizabeth D. Hamilton,J.M. Hirst, C. T. Ingold,
C. G. Johnson, F. T. Last, Kate Maunsell, T. Sreeramulu, and O. J.
Stedman for discussion and help with aerobiological problems and
applications; Audrey Baker, Beatrice E. Allard, and Marie T. Seabrook
for clerical assistance; and Maureen E. Bunce for experimental help,
revision of the manuscript, and preparation of many of the illustrations
—especially the paintings for Plates i, 5, 6, and 7. I also wish to thank
authors, editors, and publishers for permission to copy illustrations
which are acknowledged in the text. Finally, fi)r the calculations involved
in Figs. 24 to 27, and for those chapters needing the help of a mathema-
tician, I have been fortunate in having the constant advice and willing help
ofmy wife, Margaret F. Gregory, to whom I am most deeply grateful.
Rothamsted Experimental Station Philip H. GregoryHarpenden^ Herts., England.
September, i960.
vi

7/30/2019 Microbiology of at 00 Greg
http://slidepdf.com/reader/full/microbiology-of-at-00-greg 13/286
5 W*^ '
VJO\.rf'
.e.
^^^s^:
CONTENTS
Preface
List of Figures in Text
List of Plates
List of Tables
CHAPTER
I Historical Introduction ....Speculations on the origin of disease .
Early microscopists and the discovery of spores
Controversy on spontaneous generation
The germ theory of disease
The hygienists and their investigation of the air
The allergists
......II Sedimentation in Still Air
Factors determining velocit}' of fall
Effects of sedimentation ....III The Atmosphere as an Environment .
The atmosphere and its layers
The troposphere .....Laminar boundary layer
Local eddy layer
.....Turbulent boundary layer
Transitional or outer frictional turbulence layer
Convective layer .....Night radiation and temperature inversion
Role of convection ....The stratosphere .....Circulation of the atmosphere
Air masses
......IV Spore Liberation
Problems of 'take-off' ....Take-off mechanisms in cryptogams etc.
Viruses ......Bacteria ......Actinomycetes .....Myxomycetes .....Fungi
.......Lichens
......Algae .......vii
PAGE
V
xi
xiii
xiv
I
I
I
3
6
7
II
14
14
19
22
22
24
24
25
25
27
27
27
28
29
29
29
31
31
32
33
33
33
33
34
38
38

7/30/2019 Microbiology of at 00 Greg
http://slidepdf.com/reader/full/microbiology-of-at-00-greg 14/286
THE MICROBIOLOGY OF THE ATMOSPHERE
PAGE
Bryophytes .
Pteridophytes
Pollination of phanerogams
Gymnosperms
Angiosperms
V Horizontal Diffusion
Dispersion of the spore-cloud
Diffusion as a result of atmospheric turbulence
Field experiments on diffusion of spore-clouds
Comparison of theories of W. Schmidt and Sutton
VI Deposition Processes
Mechanism of impaction .....Wind-tunnel study of impaction
Impaction on cylinders .....Impaction on a rotating sticky cylinder
Impaction on plane surfaces at various angles to wind
Deposition on horizontal slides
Deposition of Lycopodium spores on inclined plane surfaces
Mean deposit on inclined slides
Deposition of other spores on inclined plane surfaces
Effect of thickness of slide ....Orientation of spores .....
Deposition on 9 cm. diameter Petri dish
Retention and blow-off from clean surfaces .
Deposition and retention on potato and bean leaves
VII Natural Deposition
....Measurement of deposition
Measurement of deposition coefficient, 'p
Loss by deposition from spore-cloud .
Deposition mechanisms outdoors
Boundary-layer exchange
Sedimentation
Impaction
Turbulent deposition
Electrostatic deposition.
Minor deposition mechanisms
Rain-washing ('scrubbing', 'rain-out', 'wash-out'
Relative importance of deposition mechanisms
VIII Air Sampling Technique ....Gravity sedimentation methods .
Sedimentation from still air .
Sedimentation from wind
Sedimentation from artificially moving air
Inertial methods .....Impaction using wind movement
viii

7/30/2019 Microbiology of at 00 Greg
http://slidepdf.com/reader/full/microbiology-of-at-00-greg 15/286
CONTENTS
Forced air-flow impactors
Adhesives
Thermal precipitationElectrostatic precipitation .
Comparison of methods
IX The Air-Spora near the Earth's Surface
Composition of the air-spora
Taxonomic groups needing study in the air-spora
Miquel's work on bacteria and moulds
Effect of rain ....Diurnal periodicity
Relative numbers of bacteria and moulds
Recent study of fungi and pollen
The air-spora at 2 metres above ground-level
The air-spora at other heights near the ground
Diurnal periodicit}' of fine-weather spora
Seasonal changes
Effect of localit}'
Effect of weather
Biotic factors
Marine air
The air of polar regions
The origin of the air-spora
X The Upper-air Spora
Vertical diffusion
Ground stations at different altitudes above sea-level
The role of turbulence .
Early studies of the upper air
Sampling from balloons .
The stratosphere .
Sampling from aeroplanes
Spores of green plants in the lower troposphere
McGill Universit}" studies
Flights over the Arctic
Microbiology of air masses over northern Canada
Air masses over Montreal
Air masses over the North Atlantic Ocean
\'ertical gradient over the ocean
Summary .....XI Deposition in Rain, Snow, and Hail
Rain .....Snow .....Hail
XII The Air-Spora of Enclosed Spaces
Die-away of concentration .
Spore movement in convection currents
ix

7/30/2019 Microbiology of at 00 Greg
http://slidepdf.com/reader/full/microbiology-of-at-00-greg 16/286
THE MICROBIOLOGY OF THE ATMOSPHERE
XIII
XIV
XV

7/30/2019 Microbiology of at 00 Greg
http://slidepdf.com/reader/full/microbiology-of-at-00-greg 17/286
FIGURES IN TEXTPAGE
1. Pasteur's gun-cotton filter for airborne microbes ...5
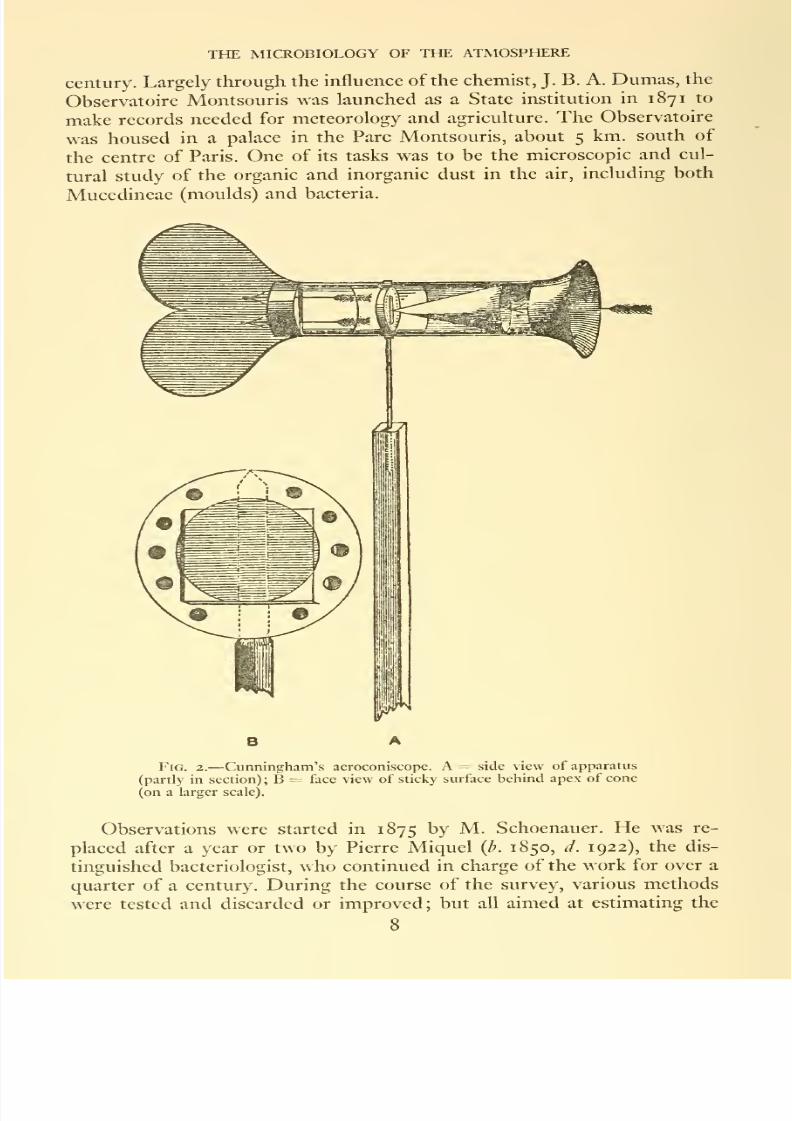
2. Cunningham's aeroconiscope ....... 8
3. Diagrammatic representation of layers of the atmosphere with a
logarithmic vertical scale ....... 23
4. Splash from impact of water drop (5 mm. diameter) falling with
velocity of 440 cm. per sec. on a thin film of water
...36
5. Anthesis of false oat-grass {Arrhenatherum elatius): (i) closed
anther; (2) open anther; (3) spikelets on a calm day; and (4)
spikelets in a wind ........ 41
6. Diffusion of spore-cloud during horizontal travel in wind . . 48
7. Test of agreement of W. Schmidt's and Sutton's diffusion theories
with experiments using Lycopodium spores liberated over grass
field at Imperial College Field Station, Ascot, Berks.: {a) graph of
log CT against log x; (/;) graph of log o against log t . . -578. Diagram showing relation between concentration x = no. of spores
per unit volume; wind-speed = u. ; area dose, A.D. = no. of
spores passing through frame of unit area; and trap dose,
T.D. = no. of spores deposited on unit area of surface . . 58
9. Streamlines of air and particle trajectories around a cylindrical
obstruction ......... 59
10. Observed relation between E per cent and k = Vsu/idg. Solid
lines from Gregory & Stedman (1953). Broken lines = values
predicted by Langmuir & Blodgett (1949) for spheres, strips,
and cylinders for ^ = 10^ . . . . . . .6011. Diagram showing small wind-tunnel used in deposition study at
Rothamsted Experimental Station, elevation view . . .6112. Diagram illustrating gravity theory of particle deposition . . 65
13. Efficiency of deposition oi Lycopodium spores on zones across glass
microscope slide at presentation angles from 0° to 90° as observed
in wind-tunnel experiments ....... 66-67
14. Mean efficiency of deposition o^ Lycopodium spores on glass micro-
scope slide (all zones) at presentation angles of 0° to 180° . .
70
15. Number of raindrops of various diameters passing per second
through I sq. metre (horizontal), with rainfall of intensities varying
from 05 to 25 mm. per hr. . . . . . . .8616. Collection efficiencies of spores of diameters 4 to 40 /x by raindrops
of diameters 003 to 50 mm. ...... 87
17. Diagram of the Hirst automatic volumetric suction-trap: (i) eleva-
tion facing wind; (2) plan of section through orifice; (3) elevation
in side view
.........100
18. Diagram of six-stage Andersen sampler . . . . .102
xi
7/30/2019 Microbiology of at 00 Greg
http://slidepdf.com/reader/full/microbiology-of-at-00-greg 18/286
THE MICROBIOLOGY OF THE ATMOSPHERE
PAGE
19. Diurnal periodicity of total numbers of bacteria in air at the Observa-
toire Montsouris, Paris, based on hourly readings between March
1882 and September 1884. . . . . .
.11220. Mean diurnal periodicity curves of thirteen spore-groups expressed
as percentage of the peak geometric mean concentration. From
Hirst trap records at Rothamsted Experimental Station, summer
1952 .......... 118
21. Diurnal periodicity o( Cladosporium at London (South Kensington)
and Harpenden (Rothamsted), based on Hirst trap catches from
May to September, 1954 . . . . . . .121
22. Exponential form of the die-away of bacteria-carr}ang particles from
the air of a room. Line A : In an observation military canteen after
the occupants had left suddenly. Line B : Observations on the die-
away following a group of sneezes in a small room . . -156
23. Diagram showing changes of circulation in a room according to
relative temperature of walls and of inside air . . -15724. Fraction of spore-cloud remaining airborne (allowing for loss of
spores from spore-cloud bv deposition to ground), expressed as
ax/Qo . . .
"
. . . . . . .171
25to 27. Dilution of spore-cloud by eddy diffusion. For
m=
175(also m = 1-24 and 2-0), expressed as logarithms of d, dw, diw, D(and also for daw with width of 100 metres)
25. Deposition coefficient, p = 005 ..... 173
26. Deposition coefficient, p = 001 ..... 174
27. Deposition coefficient, p = o-ooi ..... 175
28. Infection gradients of potato late-blight {Phytophthora infestans)
observed by Waggoner (1952) at Clear Lake, Iowa, compared
with theoretical line for deposition downwind from a point source 177
Xll

7/30/2019 Microbiology of at 00 Greg
http://slidepdf.com/reader/full/microbiology-of-at-00-greg 19/286
LIST OF PLATES
1. Representative fields from Hirst-trap slides illustrating diverse air
sporas. (Magnification: all x looo. At this magnification i sq. cm. of
field corresponds to 2-i cc. of air.)
(a) Fine-weather air spora, Ascot, Berks., i2-oo hr., 27 June 1958.
Showing grass and nettle pollen, Cladosporiinn, Epicoccum, etc.
(/;) Damp-air spora, Ascot, Berks., 02-00 hr., 17 June 1958. Showing
spores of Ganoderma, Sporoholomyces, Tilletiopsis, and other hyaline
basidiospores.
(c) Rain-t}'pe air-spora. Ascot, Berks., 04-30 hr., 13 June 1958.
Showing various ascospore t}'pes, Sporobolomyces, soot, etc.
(d) Air-spora in a wheat crop at night during a thunder-storm,
Harpenden, Herts., 21-30 hr., 10 August 1959. Showing Puccinia
graminis uredospores, Cladosporinni, and unidentified ascospore.
(e) Spores of Meniliiis lacrjmans from air of building with timber
affected by dry-rot. From camera lucida paintings by Maureen E.
Bunce ......... Frontispiece
facing page
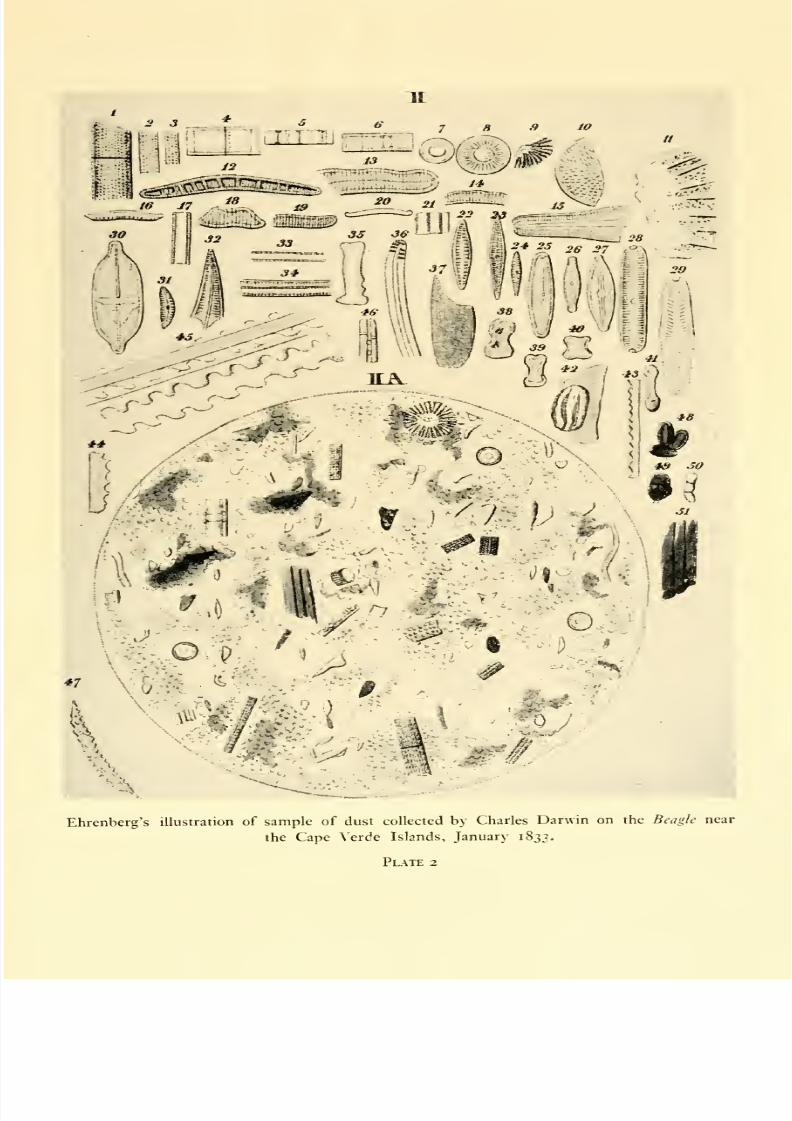
2. Ehrenberg's illustration of sample of dust collected by Charles
Darwin on the Beagle near the Cape Verde Islands, January 1833 . 12
3. Photographs by Worthington & Cole (1897) showing splash of a water
drop weighing 0-2 gm. (coated with lamp-black) falling 40 cm. into a
mixture of milk and water. ....... 36
4. Rosebury-Henderson Capillary Impinger in operation, with air
entering first through a May & Druett Pre-impinger. (Inset shows
the capillary in still conditions) ....... 96
Appendix I. Typical components of the air-spora at a uniform magnifica-
tion. Mag. 1000 X . From camera lucida paintings by Maureen E.
Bunce
...........207
Plate 5. Phycomycetes, Ascomycetes, Fungi Imperfecti, Actinomy-
cetes
Plate 6. Basidiomycetes, Lichens, Bryophytes, Pteridophytes, M\tco-
mycetes
Plate 7. Pollens, and miscellaneous other objects
Xlll

7/30/2019 Microbiology of at 00 Greg
http://slidepdf.com/reader/full/microbiology-of-at-00-greg 20/286
LIST OF TABLES
PAGE
I Observed terminal velocities of pollens and spores . .16-17
II Pollen distribution at different altitudes .... 20
III Size of 5f/z<^7 pollen at different altitudes .... 21
IV Typical characteristics of anemophilous and entomophilous
plants ......... 40
V Results of dispersal of spores of r/7/^?/fl frtr/V5 . . 5^
VI Dispersal of mixed spores of Tilletia caries and Bovista plumhea 53
VII Calculation of parameters of Sutton's diffusion equation from
Stepanov's data ........ 54
VIII Observed values of parameters in Sutton's diffusion equation
from experiments on spore dispersal . . . -55IX Efficiency of deposition on inclined slides in turbulent wind-
tunnel . . . . . . . . -71X Efficiency of deposition of Lycopodium spores on upper and
lower surfaces of potato and broad-bean leaflets in turbulent
wind-tunnel . . . . . . . -75XI Deposition on grass of Lycopodium spores activated with
iodine- 13 1 ......... 78
XII Deposition of spores on ground ..... 79
XIII Observed values of p and Vg for Lycopodium spores on hori-
zontal microscope slide in wind-tunnel
....80
XIV Percentage of total spores liberated near ground-level that were
estimated to have been deposited on ground in open-air tests 80
XV Number of Lycopodium spores deposited on upper and lower
surfaces of horizontal traps ...... 84
XVI Average density of spore deposit from three types of trap 2 m.
above ground ........ loi
XVII Estimated detection thresholds of concentration of Hirst trap
and sticky microscope slides inclined at 45° . . .106XVIII Means of monthly mean numbers of bacteria and moulds per
cubic metre of outdoor air in Paris . . . .111XIX Total number of pollen grains and spores per cubic metre in
oak-birch wood . . . . . . . • 115
XX Diurnal periodicity in the air-spora on land . . 1 16-17
XXI Temperatures at which highest concentrations were recorded 120
XXII Numbers of microbes and distance from land . . . 126
XXIII Analysis of Pady and Kelly's (1954) data on two return flights
over the North Atlantic. . . .
-145XXIV Geometric means of ratios of catches by rain-trap to dry-trap 151
xiv

7/30/2019 Microbiology of at 00 Greg
http://slidepdf.com/reader/full/microbiology-of-at-00-greg 21/286
XXV
XXVI
XXVII
XXVIII
XXIXXXX
THE MICROBIOLOGY OF THE ATMOSPHERE
Spores brought down by thunder rain terminating 7-day dry
spell, Rothamsted .......Mukiple-infection transformation : percentages to infections .
'Probable flight range' based on Rombakis's modification of
Schmidt's theory........Effect of gradient on distance of horizon of infection .
Pollen trapped on lightships in Gulf of Bothnia .
Stakman & Hamilton's (1939) data on long-distance dissemina-
tion of Puccinia graminis ......
PAGE
164
168
184
186
187
XV

7/30/2019 Microbiology of at 00 Greg
http://slidepdf.com/reader/full/microbiology-of-at-00-greg 22/286

7/30/2019 Microbiology of at 00 Greg
http://slidepdf.com/reader/full/microbiology-of-at-00-greg 23/286
I
HISTORICAL INTRODUCTION
The air we breathe, like our food and drink, varies in quality from time to
time and from place to place. This fact was recognized many centuries
before industrialized man assumed the right to pollute the atmosphere
with poisonous chemicals and radioactive isotopes.
In Britain we hold that, 'when the wind is in the East 'tis neither good
for man nor beast'. Some places are noted for invigorating air, and some
for relaxing air; but it is not yet clear whether these properties are
associated merely with differences in temperature, humidity, and move-
ment of a gaseous mixture consisting mainly of 78 per cent nitrogen,
21 per cent oxygen, and 0-03 per cent carbon dioxide with traces of the
inert gases, or whether some other factor or factors are involved.
Speculations on the Origin of Disease
Classical \NTiters believed that the wind sometimes brought sickness
to man, animals, and crops. Hippocrates, the father of medical science,
held that men were attacked by epidemic fevers when they inhaled air
infected 'with such pollutions as are hostile to the human race'. A rival,
though perhaps not entirely incompatible, view held that epidemics were
the result of supernatural agencies, and wereto
be m ardedoff or
cured bytaking appropriate action.
Lucretius in about 55 B.C. held quite modern views. He observed the
scintillation of motes on a sunbeam in a darkened room and concluded
that their movement must result from bombardment by innumerable,
invisible, moving atoms in the air. This brilliant intuition enabled him to
account for many interesting phenomena, including the origin of pesti-
lences. We now know that bodies which transmit human diseases through
the air are larger than those which Lucretius thought of as atoms—themosquitoes carrying malaria, for instance, or the droplets which spread
the common cold and influenza viruses indoors. But in his concept of
baleful particles carried in clouds by the wind, settling on the wheat or
inhaled from the polluted atmosphere, Lucretius touched on some of the
main problems existing in plant patholog}'' and allergy today.
Early Microscopists and the Discovery of Spores
After Lucretius, more than 1,500 years passed before men evenbegan to be aware that the air teems with microscopic living organisms.
A I

7/30/2019 Microbiology of at 00 Greg
http://slidepdf.com/reader/full/microbiology-of-at-00-greg 24/286
THE MICROBIOLOGY OF THE ATMOSPHERE
The discovery had to wait almost until the invention of the micro-
scope.
For a long time after Aristotle and Theophrastus, the lower plants
lacking obvious seeds were believed to be generated spontaneously in
decaying animal or vegetable matter. The same view was held of the
origin ofmany of the lower animals. However, the minute 'seeds' or spores
of several kinds of plants were observed in the mass long before the
invention of the microscope allowed them to be identified and observed
individually. What was more natural than to suppose that these minute
particles were wafted about by the winds }
The discovery of reproduction of ferns is attributed to Valerius Cordus
{b. 1515, d. 1564), and spores of the fungi seem to have been observed
soon after this by a Neapolitan botanist,J.
B. Porta, although the rusty-
coloured spore deposits under bracket-fungi on beech trees must always
have been familiar to the countryman.
It was P. A. Micheli {b. 1679, d. 1737), botanist to the public gardens
at Florence, who first illustrated the 'seeds' of many fungi, including
mushrooms, cup-fungi, truffles, moulds, and slime-moulds. Further, by
sowing spores on fresh-cut pieces of melon, quince, and pear, and repro-
ducing the parent mould for several generations, he showed that the
spores of some common moulds were, indeed, 'seeds' of the fungi. He
noted, however, that some of his control slices also became contaminated,
and he concluded that the spores of moulds are distributed through the
air {see Duller, 191 5).
The hand-made lenses of Anton van Leeuwenhoek rendered visible
the world of minute organisms whose existence had only been guessed at
before, and whose significance in nature had scarcely even been imagined.
He could just see bacteria, and in his letters to the Royal Society in 1680
he described some yeasts, infusoria, and a mould. From his experiments
he came to doubt the current belief in spontaneous generation; it seemed
more plausible to him to suppose that his 'animalcules can be carried over
by the wind, along with the bits of dust floating in the air' (Dobell, 1932).
The controversy over spontaneous generation was to last for a couple of
centuries ; but, in the second half of the eighteenth century, ideas w^ere
developed by Nehemiah Grew and E. F. Geoffrey on the function of the
pollen of flowering plants.J. G. Koelreuter, in 1766, was perhaps the
first to recognize the importance of wind-pollination for some plants and
of insect-pollination for others. C. K. Sprengel in 1793 developed these
views and concluded that flowers lacking a corolla are usually pollinated
in a mechanical fashion by wind. Such flowers have to produce large
quantities of light and easily-transported pollen, much of which misses
its target or is washed out of the air by rain. Thomas A. Knight in 1799
reported that wind could transport pollen to great distances.
By the beginning ofthe nineteenth century, therefore, it was recognized
that pollen of many, but by no means all, species of flowering plants, and

7/30/2019 Microbiology of at 00 Greg
http://slidepdf.com/reader/full/microbiology-of-at-00-greg 25/286
HISTORICAL INTRODUCTION
the microscopic spores of ferns, mosses, and fungi—as well as protozoa
were commonly liberated into the air and transported by the wind. The
potential sources of the air-spora had been discovered and identified in
the main before the year 1 800, but their role remained obscure.
Controversy on Spontaneous Generation*
Leeuwenhoek had come to doubt the belief, dating from Aristotle,
that flies, mites, and moulds were generated spontaneously by decaying
animal and vegetable matter. To him it seemed likely that animalcules
could be carried by the air, and this provided an alternative explanation
to spontaneous generation.J.
T. Needham {b. 1713, d. 1781) had claimed
that minute organisms would appear in heated infusions; but L. Spallan-
zani {b. 1729, d. 1799) showed, by a series of experiments, that when
organic materials were subjected to sufficient heat-treatment (with various
precautions against contamination) they would neither putrify nor breed
animalcules unless exposed to air. From this Spallanzani concluded that the
microbes were present in the air admitted experimentally to his sterilized
vessels. A rearguard action was fought to explain away these results.
J.Priestley (^.
1733,d.
1804)and L.
J.Gay-Lussac {b.
1778,d.
1850)claimed that heating the vessels drove out the air and that it was shortage
of oxygen., not lack of 'seeds', which prevented heat-sterilized materials
from generating a microbial population.
Meanwhile, Appert (1810) put heat sterilization on a commercial
basis by applying it to food preservation ; but the controversy lingered on,
even into the present century, although the experiments and polemics of
Louis Pasteur were decisive. Pasteur showed that food could be conserved
in the presence ofoxygen and that preservation depends on the destructionby heat of something contained in the air. In 1859 F. A. Pouchet, of
Rouen, had raised the objection that a very minute quantity of air sufficed
to allow the development of numerous microbes in heated infusions, and
that the air would have to be a thick soup of microbial germs.
In reply, Pasteur (1861) sterilized a series of evacuated flasks con-
taining nutrient medium. So long as the flasks remained unopened they
all remained sterile; but, even when they were opened and air was ad-
mitted, he found that one or two out of each batch would remain sterile
on incubation. Pasteur replied to Pouchet, denying that only a minute
quantity of air needs to gain access for a microbe population to develop
and for putrefaction to take place. On the contrary, the cause of the
phenomenon was discontinuous and a sample of 250 cc. of air might or
might not contain germs.
Pasteur then showed, by opening batches of about forty such flasks
in various sites, that the quantity of airborne germs differed in different
places. In the open air in Paris he obtained bacteria, yeasts, and moulds
* See also Bulloch (1938) and Oparin (1957).
3

7/30/2019 Microbiology of at 00 Greg
http://slidepdf.com/reader/full/microbiology-of-at-00-greg 26/286
THE MICROBIOLOGY OF THE ATMOSPHERE
but some flasks remained sterile. In cellars of the Observatoire, where the
temperature was constant and the air still and dust-free, many more
flasks remained sterile.
On 5 November i860, Pasteur deposited at the office of the Academy-no fewer than seventy-three quarter-litre flasks, some of which he had
opened to the air in batches of twenty at various heights ranging from the
foothills of the Jura to high up on Mont Blanc, as follow s
:
Number of flasks
Altitude Locality where air sampled Contaminated Sterile
Country air, far from dwelling
houses, on thefirst plateau of
the Jura 8 12
850 metres Jura mountains 5 15
2,000 metres Montanvert, near Mer de
Glace on Mt. Blanc i 19
The cause of this supposed 'spontaneous generation' was not only
discontinuous but, moreover, its concentration decreased with height.
F. A. Pouchet had admitted that among dust particles of vegetable
origin there were some spores of cryptogams, but he held that these
were too few to account for the phenomena of putrefaction.
Pasteur decided that he would abandon Pouchet's method, which
relied on examining spontaneous deposits of dust on the surface of objects,
in favour of a new method of studying the particles by collecting from
actual suspension in the air. Pouchet had drawn invalid conclusions from
surface deposits because, according to Pasteur, the light air-movements
which constantly play over surface deposits would pick up and remove
the extremely minute and light spores of microbes more readily than they
would any coarser particles. (It now appears, however, that the small
numbers of the lighter bodies in surface deposits is due to the extreme
slowness with which they are deposited, rather than to their preferential
removal after deposition.)
Pasteur's apparatus for extracting the suspended dust in the air, for
microscopic examination, was quite simple (Fig. i). A tube of | cm.
diameter was extruded into the open air through a hole drilled in a
window frame several metres above the ground. The rear part of the tube
was packed with a plug of gun-cotton to catch particles. Air was drawn
through the apparatus by means of a filter pump, and the volume of air
was measured by displacement of w^ater. Tests were made on air draw^n
from beside the Rue d'Ulm, and from the garden of the Ecole Normale
in Paris. During aspiration, solid particles were trapped on the fibres of the
gun-cotton plug. After use, the gun-cotton was dissolved in an alcohol-
ether mixture, the particles were allowed to settle, the liquid was decanted,
and the deposit was mounted for microscopical examination.
4

7/30/2019 Microbiology of at 00 Greg
http://slidepdf.com/reader/full/microbiology-of-at-00-greg 27/286
HISTORICAL INTRODUCTION
Fig. I.—Pasteur's gun-cotton filter for airborne microbes.
a = gun-cotton plug, i cm. long, held in position by:
b = spiral platinum wire.
FF = window frame drilled to allow passage of:
T = tube to exterior for sampling outdoor air.
R (m.k.l.) = aspirator.
Pasteur, as usual, had little interest in the specific identity' of his or-
ganisms; he was no taxonomist. The particles exactly resembled the
'germs' of lower organisms. They differed in volume and structure so
much among themselves that they clearly belonged to very many species
or even groups, including bacteria, moulds and yeasts. Their numbers
contradicted the general conclusion that the smallest bubble of air admitted
to a heat-sterilized medium is sufficient to give rise to all the species of
infusoria and cryptogams normal to an infusion. This view was sho\\Ti to be
highly exaggerated, and Pasteur indicated clearly that it is sometimes
possible to bring a considerable volume of ordinary air into contact with an
infusion before living organisms develop in the latter.
Pasteur had demonstrated visually the existence of an air-spora, he
had pointed out that it should be measured while in suspension and not
after deposition on surfaces, and he had made the first rough visual
measurements of its concentration in the atmosphere of the City of
Paris: a few metres above the ground in the Rue d'Ulm, after a succession
of fine days in summer, several thousands of micro-organisms were

7/30/2019 Microbiology of at 00 Greg
http://slidepdf.com/reader/full/microbiology-of-at-00-greg 28/286
THE MICROBIOLOGY OF THE ATMOSPHERE
carried in suspension per cubic metre of air. He then abandoned the
method—remarking, however, that it could doubtless be improved and
used more extensively to study the effects of seasons and localities, and
especially during outbreaks of infectiousdiseases.
The Germ Theory of Disease
We must now look back and trace the growth of the microbial theory
of disease, that had been developing for more than a century.
The minute growths of fungus noticed for centuries on mildewed or
'rusted' plants were believed to be a consequence of the diseases; the
dusty powder on rusted wheat wasregarded as a curiously congealed
exudation of the diseased plant itself. But might this not be putting the
cart before the horse ? Could the rust possibly be the cause of the disease
instead of an effect? Perhaps the first to give reasonably affirmative
evidence was Fontana (1767), who examined wheat rust with his micro-
scope and described what he saw as a grove of parasitic plants nourishing
themselves at the expense of the grain.
As further crop diseases were studied it became clear that, in some,
infection is acquired by planting in contaminated soil, while others are
carried on seed and still others are spread in the wind by airborne fungus
spores {see Large, 1940).
The discovery that microbes can cause disease in man and animals
came somewhat later, and the first animal pathogens to be recognized
were again fungi—no doubt because they were easier to find than bacteria.
In 1835, Agostini Bassi showed conclusively, by inoculation experiments,
that a specific mould is the cause of the 'muscardine' disease of silkworms
which was then threatening the silk industry of Piedmont. Next, histori-
cally, came the recognition of the fungi causing favus, ringworm, and
'thrush' in man, as a result of the work of David Gruby and Charles Robin.
Pasteur had demonstrated that microbes are normally abundant in
the air. Many of them can cause fermentation or putrefaction when intro-
duced into sterile organic substrates; and it was natural to speculate that
others might be the causes of epidemics of some of the so-called 'zymotic'
diseases whose etiology was then unknown. Medical workers soon began
a systematic search among airborne microbes for the unknown causes of
infectious diseases.
The search was long, and on the whole unfruitful because most epi-
demic diseases that attacked man were gradually traced to sources other
than the outdoor air. However, in the course of the search, most of the im-
portant characteristics of the air-sporawere discovered—and then forgotten
.
The search occupied the last thirty years of the nineteenth century and
coincided with the golden age of bacteriology. Listing the dates of contem-
porary salient advances in bacteriology will help to give the background to
this phase of aerobiology {see Bulloch, 1938).
6

7/30/2019 Microbiology of at 00 Greg
http://slidepdf.com/reader/full/microbiology-of-at-00-greg 29/286
HISTORICAL INTRODUCTION
Pasteur, L. Microscopical and cultural demonstration of the existence of
an air-spora, and the fermentation of urea by a Al/V/'oro^n/^ . . i
Koch, L. Introduction of pure-culture methods, and demonstration of spore
production in bacteria. Discovery of cause of anthrax
Statement of Koch's postulates
....Introduction of gelatine to solidify media .
Hansen, G. H. A. Discovery of cause of leprosy
Neisser, a. Discovery of the Gonococcus .
Koch, L. Discovery of the tubercule bacillus
Discovery of the cholera Vibrio....LOEFFLER, F. Discovery of bacillus of swine erysipelas
NicoLAiER, A. Discovery of the tetanus bacillus .
KiTSATO, S
Yersin, a.
ivanovski, d.
Beijerinck, M.W
Discovery of the bacillus of plague
Discovery of filterable viruses in plants
)I-62
1876
1878
1881
1874
1879
1882
1883
i88s
1894
1892
i8q8
The Hygienists and their In\t:stigation of the Air
While the causes of infectious diseases of man and animals were being
unravelled in laboratories and clinics, a series of field investigations into
the air-spora was in progress to find whether fluctuations in number and
types of microbes present in the atmosphere were connected with out-
breaks of such diseases as cholera, t}^phoid, and malaria.
Salisbury (1866) investigated the air-spora in connexion with malaria
in the Ohio and Mississippi Valleys, by exposing sheets of glass above
marshy places during the night and examining them microscopically. He
observed small, oblong, Palmella-like cells singly or in groups on the
upper side of the glass sheets, but never in the droplets which formed on
the underside. He believed that these cells were produced from a grey
mould growing on the surface of prairie soil, and were in fact its spores
which were liberated at night and rose some 30 to 100 ft. in the air, nonebeing present during the daytime. Their liberation could be prevented by
covering the ground with a layer of quicklime or straw.
Some form of the 'aeroconiscope', invented by Maddox (1870,
1 871), was in favour with many investigators in this period. The model
used by Cunningham (1873) consists of a conical funnel, with the mouth
directed into the Avind by a vane, ending in a nozzle behind which is
placed a sticky microscope cover-glass on which were impacted dust
particles driven into the cone by the wind (Fig. 2). Cunningham's studies
were made in two Calcutta gaols where cholera and other fevers were
rife, and where medical statistics were available. He sampled for 24-hour
periods, and illustrations of representative catches of airborne organisms,
mainly fungus spores and pollens, were published in a series of splendid
colour plates. He found no correlation between these micro-organisms
and the incidence of fevers in the gaols. Moist weather diminished inor-
ganic dusts, but it appeared to increase the total number of fungus spores.
The most intensive sustained analysis of bacteria and moulds in the
atmosphere was made in Paris during the last quarter of the nineteenth
7
7/30/2019 Microbiology of at 00 Greg
http://slidepdf.com/reader/full/microbiology-of-at-00-greg 30/286
THE MICROBIOLOGY OF THE ATMOSPHERE
century. Largely through the influence of the chemist, J.B. A. Dumas, the
Observatoire Montsouris was launched as a State institution in 1871 to
make records needed for meteorology and agriculture. The Observatoire
was housedin a palace in the Pare Montsouris, about 5 km. south of
the centre of Paris. One of its tasks was to be the microscopic and cul-
tural study of the organic and inorganic dust in the air, including both
Mucedineae (moulds) and bacteria.
B A
Fig. 2.—Cunningham's aeroconiscope. A = side view of apparatus
(partly in section) ; B = face view of sticky surface behind apex of cone
(on a larger scale).
Observations were started in 1875 by M. Schoenauer. He was re-
placed after a year or two by Pierre Miquel {b. 1850, d. 1922), the dis-
tinguished bacteriologist, who continued in charge of the work for over a
quarter of a century. During the course of the survey, various methods
were tested and discarded or improved; but all aimed at estimating the

7/30/2019 Microbiology of at 00 Greg
http://slidepdf.com/reader/full/microbiology-of-at-00-greg 31/286
HISTORICAL INTRODUCTION
number of particles ofvarious types contained in a measured volume of air.
Moulds were at first estimated microscopically in a 24-28 hour deposit,
obtained by impinging the air to be sampled on a glycerined glass slide
which was placed horizontally 2 to 3 mm. above a downward-facing
orifice. The diameter of the orifice was from 0-5 to 075 mm. Suction of
20 litres per hour was maintained by a water-operated pump (Miquel,
1879). Miquel found that this apparatus yielded about 100 times as
many particles as the aeroconiscopes designed by Maddox and Cunning-
ham, though for qualitative work away from the laboratory he still used
a wind-operated trap of the Maddox type.
Bacteria, especially bacterial spores, could not be satisfactorily counted
microscopically and Miquel was forced to estimate them by cultural
methods. At first he drew known volumes of air through liquid media
(sterile beef extract, etc.), partitioning the liquid either before or after
exposure into 50 or 100 vessels, and adjusting the volume of air sampled
so as to leave from a quarter to a half of the vessels sterile—in order to get
a reliable estimate of the number of bacterial particles in the volume of
air sampled. The numbers of microbes in the air varied greatly in the
same place at different times, and this variation was studied in relation to
season, weather, district, and altitude. Miquel was the first to make along-term survey of the microbial content of the atmosphere by volu-
metric methods.
In the Pare Montsouris, out-of-doors, Miquel estimated that the
mould spores averaged about 30,000 per cubic metre in summer, some-
times rising to 200,000 in rainy weather. In prolonged dry weather they
decreased in number, and were only about 1,000 per cubic metre in
winter, with very few indeed when snow was on the ground. While rain
was falling the numbers of mould spores usually decreased considerably,
but afterwards their numbers recovered quickly—in fact, much more
quickly than did those of particles of inorganic dust. Resting stages (eggs)
of infusoria were estimated at about i or 2 in 10 cubic metres of air.
Pollen grains in June may make up 5 per cent of the airborne organic
particles, while starch grains near habitations may account for i per cent.
Bacterial numbers out-of-doors in the Pare Montsouris were at first
estimated at about 100 per cubic metre; but improved culture media
increased this figure by a factor of 7 to 10 times. The numbers of bacteria
in the centre of Paris were, perhaps, 10 times as high again as in the Pare
Montsouris, with larger numbers inside dwellings, and still more in
crowded hospitals. The work showed signs of settling into a steady routine
with the publication of Miquel's Les organismes vivants de Vatmosphere^
Paris, 1883.
However, in 1883 and 1884 Miquel was stung into a burst of renewed
activity by the intrusion of a rival centre for the study of hygiene which
had been established in Berlin under W. Hesse, who used the new solid
media which Miquel abhorred. With the collaboration of de Freudenrich

7/30/2019 Microbiology of at 00 Greg
http://slidepdf.com/reader/full/microbiology-of-at-00-greg 32/286
THE MICROBIOLOGY OF THE ATMOSPHERE
in field work, Miquel studied the microbial population of the air at high
altitudes in the Alps by volumetric methods (1884, p. 524); with the help
of a sea captain, M. Moreau, the air over the sea was studied on voyages to
Rio de Janeiro, Odessa, Alexandria, and La Plata; the micro-organisms
brought down in rain-water were caught, precipitated, and counted;
hourly variations of fungus spores and bacteria in the air were studied
on improved volumetric traps with sticky slides, or on paper impregnated
with nutrient media and moved by clockwork. At Montsouris, fungus
spores showed a diurnal periodicity with tw^o maxima at about 8 and 20
hours, regardless of wind velocity. When he pressed the study of changes
in spore content of the air with passage of time still further, Miquel found
that thehourly reading was merely a smoothing of
still
shorter-termvariations.
Trapping airborne bacteria at Montsouris on a moving paper disc
imbibed with nutrient agar, Miquel (1885) observed a regular diurnal
periodicity—with two maxima at approximately 7 and 19 hours averaging
about 750 per cubic metre, and with two minima at approximately 2 and
14 hours averaging about 150 per cubic metre. This periodicity was not
related to wind direction, and was not altered by moderate falls of rain.
In the centre of Paris the bacterial content also showed two maxima andtwo minima, but there the minima were about equal to the maxima at
Montsouris, and the times of the maxima were closely related to activities
in the city such as sweeping the street, and to the passage of horse-drawn
traffic
.
Miquel appears to have been overwhelmed by the richness of the
information on the mould spore flora provided by his apparatus, for he
promptly abandoned it, merely remarking 'the micrographer ^^ ho has the
leisure could make some nice [curieuse] studies of this subject'. It was,
however, not abandoned before the main elements in the mould-spora had
been discovered by this excellent method.
Interest in the mould-spora waned when it became clear that the
devastating epidemic diseases prevalent from time to time in cities were
not fungal in origin but were due to bacteria, and attention became ur-
gently focused on drinking water as the source of many of the current
epidemic fevers abounding in Paris. The laboratory at Montsouris then
became the centre for the bacterial analysis of samples of drinking water
sent from wells in Paris and other parts of France.
Meanwhile, in Germany, the work of W. Hesse {b. 1846, d. 191 1) had
proceeded along similar lines. Hesse's apparatus for air sampling con-
sisted of a narrow horizontal tube, 70 cm. long and 3-5 cm. wide, con-
taining a layer of Koch's nutrient gelatine. A known volume of air was
aspirated slowly through the tube, and micro-organisms settled and grew
on the medium. Most colonies developed near the entrance to the tube,
and Hesse assumed that by the time the slow stream of air had reached
the end of its 70 cm. course all micro-organisms had been precipitated
10

7/30/2019 Microbiology of at 00 Greg
http://slidepdf.com/reader/full/microbiology-of-at-00-greg 33/286
HISTORICAL INTRODUCTION
by gravity. Hesse found that moulds penetrated much farther into his
tubes than did the bacteria, and made the important deduction that
mould-germs as found in the atmosphere are on the average lighter than
the bacterial germs. This led him to conclude that, whereas fungus spores
were usually present in the air as single particles, the aerial bacteria
mostly occur in the atmosphere either as large aggregates, or attached to
relatively large carrier particles of dust, soil, or debris (Hesse 1884, 1888).
He also observed that most colonies consisted of a single species—bacteria
usually in small colonies of pure culture, and fungi as isolated spores
and deduced that the airborne germs are not in the form of aggregates of
different t\'pes.
Hesse's method was also used in London by Frankland (1886, 1887)
and Frankland & Hart (1887) on the roof of what is now known as the
Old Huxley Building of the Imperial College of Science and Technology,
and elsewhere. Simultaneous comparisons were made between the number
of micro-organisms per 10 litres (as indicated by colonies growing on
Hesse's tubes of peptone gelatine) and the number deposited on horizon-
tal dishes of the same medium, expressed as the number deposited per
unit area per minute. Tests were made both outdoors and inside crowded
or empt}' buildings. Frankland noted that the number of colonies was
greater when the mouth of the tube faced the wind rather than in other
directions, so he standardized his method by always turning it at an angle
of 135° to the wind. A control tube facing the wind but not aspirated was
always used, and sometimes it had a substantial number of colonics.
Frankland seems to have been the first to realize that aerodynamic effects
are of major importance in techniques for trapping the air-spora.
These methods for studying the air-spora were continued into the
present century, notably by Saito (1904, 1908, 1922) in Japan, and by
Buller & Lowe (191 1) in the Canadian Prairies.
The Allergists
The idea that men, other animals, and plants, could become infected
by microbes which set up pathological changes, had been made acceptable
by the analog}'' of sterile organic infusions that become infected with
putrefying microbes. The idea became widely accepted during the latter
half of the nineteenth century and, when once the cause of the common
epidemic diseases had been established, advances in hygiene and therapy
began to transform the social scene. Yet there remained some diseases
for which no pathogenic or parasitic invader could be found. Some of
these, such as pellagra and beri-beri, have now been traced to a variety
of nutritional deficiencies. Another group, the so-called allergies, were at
first difficult to grasp because a peculiar condition of the patient was a
complicating factor. Allergic diseases, unlike those caused by invasion of
the body by a pathogenic micro-organism, are due to a changed condition
II

7/30/2019 Microbiology of at 00 Greg
http://slidepdf.com/reader/full/microbiology-of-at-00-greg 34/286
THE MICROBIOLOGY OF THE ATMOSPHERE
of an individual patient who has become sensitive and reacts adversely
to substances, often in minute amounts, which normal individuals can
tolerate. The substance or allergen can be taken into the body, for
example in food, or by contact through the skin, or by inhalation fromthe air.
Hay fever was one of these puzzles. Long before Pasteur's epoch,
hay fever had been attributed to inhalation of pollen ; but it remained for
Charles H. Blackley (1873), a Manchester physician, to prove by in-
halation experiments on himself and others that this guess was correct,
and to demonstrate by trapping methods that pollen was at times present
in the air in large quantities. Blackley first tried Pasteur's gun-cotton
filters and obtained some pollens, but too few to satisfy him. Finally he
used four sticky horizontal microscope slides exposed under a roof
supported by a square central post. The slides were placed at 'breathing
level' (about 135 cm.), and he caught a maximum of 880 grains per sq.
cm. per 24 hours on 28 June 1866. In 1867 his maximum was only 106,
and in 1869 he placed his slides vertically in a vane shelter and gave no
numerical data. He found that rain reduced the number of pollen grains
caught to about 5 per cent of the number caught in dry weather. He ex-
plored the air above the ground up to 1,500 ft. by means of kites, and
found that vertical slides facing the wind caught nearly 20 times as much
pollen at the higher altitude as at breathing level.
Blackley showed by means of his sticky slides that the air contains
enough pollen during the grass-flowering season for large quantities to be
deposited on exposed surfaces. He also gave himself an attack of bronchial
catarrh by inhaling Penicillmm and Chaetomiwn spores—an experiment
which he said was too unpleasant to repeat.
According to Durham (1942), after Blackley's pioneer work no progress
was made with these studies until the period 1 910-16, when fresh in-
terest was aroused by the discovery that injections of pollen extracts can
be used to de-sensitize patients who are allergic to pollen.
When the study of airborne allergens was again taken up in the present
century, it was unfortunate that the technique chosen should have been
the so-called 'gravity-slide' adopted by Blackley—a method which
Pasteur had abandoned in 1861 and which Miquel had roundly con-
demned as 'the simplest and most defective method' of collecting air-
borne particles.
By the early years of this century it became possible to assess the
value of the ancient belief that the wind brings disease. Many diseases of
crop, but very few diseases of man, have proved to be caused by minute
particles carried on the wind. The particles are not some sort of invisible
atoms as Lucretius thought; indeed,among
the motes in the sunbeam,
he may himself have been watching some of the baleful fungus spores and
pollens which cause crop disease and respiratory allergy.
12
7/30/2019 Microbiology of at 00 Greg
http://slidepdf.com/reader/full/microbiology-of-at-00-greg 35/286

7/30/2019 Microbiology of at 00 Greg
http://slidepdf.com/reader/full/microbiology-of-at-00-greg 36/286

7/30/2019 Microbiology of at 00 Greg
http://slidepdf.com/reader/full/microbiology-of-at-00-greg 37/286
HISTORICAL INTRODUCTION
Meanwhile evidence was accumulating that these particles might be
carried by wind to distances vastly greater than had been imagined by the
ancients. In dust deposited after transport for hundreds of kilometres
by sirocco and trade winds, Ehrenberg (1849, 1872, 1872^?) found large
quantities of protozoa and plant spores, and gradually he became con-
vinced that viable micro-organisms could survive transport through the
atmosphere. When the Beagle w^as near the Cape Verde Islands, Darwin
(1846) found the atmosphere haz}' with dust from North Africa. In
samples of this dust Ehrenberg found sixty-seven kinds of organisms
including freshwater infusoria and cryptogamic spores (Plate 2)—and
Darwin at once grasped the importance of the phenomenon in the
geographical distribution of organisms.
13

7/30/2019 Microbiology of at 00 Greg
http://slidepdf.com/reader/full/microbiology-of-at-00-greg 38/286
II
SEDIMENTATION IN STILL AIR
All the particles with which we are concerned are heavier than air.
In still air they sink with characteristic and constant 'terminal velocity'.
Stillness as a quality of air is only relative. In the laboratory we can
make the air as still as possible by eliminating draughts and convection
currents, only to find an intense underlying activity revealed by the
scintillation of motes in a beam of light. The motes are small enough to
be jerked irregularly by the impact of gas molecules; but they are too
large to be transported bodily by molecular diffusion, and most of the
phenomena of colloidal suspensions are irrelevant to the air-spora. Weshall meet some analogies with the diffusion of a gas, however, in studying
the diffusion of a cloud of spores in the atmosphere.
In this study we usually ignore the underlying molecular activity of
the medium, and consider a patch of air as 'still' if it is not being trans-
ported bodily at more than a certain speed. Out-of-doors this speed might
be 10 cm. per sec; in a room it might be i cm. per sec; and, under
carefully controlled conditions in special apparatus, a higher standard
might be expected. For the present we must leave the definition vague,
and simply regard air as 'still' when, in a particular context, the effects of
wind, turbulence, and molecular activity are negligible. Knowledge of the
properties of small particles in still air throws light on the behaviour of
spores in moving air out-of-doors.
Factors Determining Velocity of Fall
One effect of its molecular activity is that the air is viscous, i.e. it
resists the movement of solid particles. A small particle liberated into
the air from a resting position tends to fall with an acceleration due to
gravity; however, the resistance of the air increases faster than the speed
of fall, and a state of balance is soon reached in which the particle stops
accelerating and continues to fall through the air at a constant terminal
velocity.
The terminal velocity of smooth spheres with diameters of between
about I /x* and loo ju, is satisfactorily predicted by Stokes's law (for smaller
particles Cunningham's correction becomes applicable, and larger par-
ticles
haveto
be treated experimentally). Stokes's lawcan conveniently
be given in the form
:
* « ==1 oVo mm.
14

7/30/2019 Microbiology of at 00 Greg
http://slidepdf.com/reader/full/microbiology-of-at-00-greg 39/286
SEDIMENTATION IN STILL AIR
2 a — pVs = -. .gr-
9 /^
where, in C.G.S. units at ordinary surface temperature and pressure:
Vs = terminal velocity (velocity of sedimentation) in cm. per sec.
a = density of sphere in gm. per cc. (water = i-oo);
p = density of medium (air = 1-27 X lO"^ gm. per cc);
g = acceleration of gravity (981 cm. per sec.^);
ju, = viscosity of medium (air at i8°C. = i-S X iQ-^gm.percm.sec);
r = radius of sphere in cm. {N.B. radius = \ diameter).
For a water droplet falling in air, Vs = 1-2 X io~^ r^ cm. per sec, whenthe radius is expressed in microns (/it). A fog droplet of 10 p- radius (20 p.
diameter) has a calculated terminal velocity of 1-2 cm. per sec.
The pollens and spores with which we are concerned belong to the
size-range where Stokes's law is valid, but they are seldom anything like
smooth spheres. Stokes's law has given values of at least the right
order, however, for spores whose terminal velocities have been measured
experimentally. At first sight the pollen grains of some species of conifers
appear to fall unexpectedly slowly, but these grains have conspicuous
air sacs which greatly reduce the density of the individual particle.
The diameters of particles constituting the air-spora vary from approxi-
mately I ^ to lOO/Lt or more for the largest pollens and spores {see
Appendix I, p. 207, Plates 5-7). Some spores are filamentous, perhaps one
hundred times as long as wide. Although the densities of the spores of
very few species have yet been measured, there are reasons for expecting
them to be much less dense than mineral particles and indeed to resemble
water droplets in density. The few determinations which have been made,
relative to water = i, are as follows:
Pohl (1937)
(^angiosperm.\e;
Almis glutinosa

7/30/2019 Microbiology of at 00 Greg
http://slidepdf.com/reader/full/microbiology-of-at-00-greg 40/286
THE MICROBIOLOGY OF THE ATMOSPHERE
(Fungi)

7/30/2019 Microbiology of at 00 Greg
http://slidepdf.com/reader/full/microbiology-of-at-00-greg 41/286
SEDIMENTATION IN STILL AIR
TABLE

7/30/2019 Microbiology of at 00 Greg
http://slidepdf.com/reader/full/microbiology-of-at-00-greg 42/286
THE MICROBIOLOGY OF THE ATMOSPHERE
show that part of this skewness was due to the presence of clumps of
spores which fell faster than single units. It is also clear that, with both
uredospores and aecidiospores of rust fungi, a large number of single
spores fall very slowly. Measurements are needed to test whether, within
one species, the single spores arriving first at the bottom are larger than
those arriving at the end of the experiment. Another possibility is that
small eddies may have hastened the fall of some spores and retarded that
of others. A more serious defect of the method is that a vertical circulation
of air by convection in the cylinder might bias the results by introducing a
systematic acceleration or retardation of fall. This drawback could be
overcome by establishing a small temperature difference between the top
and bottom of the column, so that the stratified air would be stabilized
as in a 'temperature inversion'. A thermostat may produce artefacts from
convection currents set up by rhythmic temperature changes. BuUer
(1909) emphasized the difficulty of reducing air to anything like stillness,
even in closed beakers.
In air, spores gain or lose water rapidly and the effect of spore hydra-
tion on terminal velocity, noted earlier by Duller, is evidently complex.
Weinhold (1955) showed that with uredospores of Puccinia graminis
tritici, changes in volume and weight occurred within 3 minutes of transfer
to air of different temperature and humidity. Weinhold reported that,
contrary to expectation, spores stored at 5 per cent relative humidity fell at
1-25 cm. per sec, in spite ofbeing smaller and less dense than spores stored at
80 per cent relative humidity, which fell at i-i cm. per sec. Increasing the
humidity of air through which the spores fell increased the terminal
velocity, which was: 1-03, 1-22, 1-23, and 1-54 cm. per sec. at relative
humidities of24, 45, 52,
and 80 per cent, respectively. With increasing
temperature, terminal velocity decreased from i-o6 cm. per sec. at 23'4°C.
to 0-94 cm. per sec. at 39-9°C.
We still lack observations on the rate of fall of highly elongated fungus
spores found in such genera as Ophiobolus, Epkhloe, Geoglossum^ and
Cordyceps, whose unusual shape makes Stokes's law inapplicable. Falck
(1927) calculated terminal velocities for a number of species with approxi-
mately elliptical spores on the assumption that the expected velocity
Ve = vj i^(a/b), where v^ is the fall velocity of a spherical particle of thesame volume, and a and b are axes of the ellipse. McCubbin (1944)
stressed our lack of observations on asymmetrical spores, and provisionally
suggested a method of calculating terminal velocity on the assumption
that surface drag accounts for most of the retardation. He showed that
observed terminal velocities of most spherical and oval spores fitted the
r 1length X width , . . . .
approximate formula Vs = , where velocity is in mm. per
40
sec. and spore dimensions are in microns. Fusiform spores were treated
18

7/30/2019 Microbiology of at 00 Greg
http://slidepdf.com/reader/full/microbiology-of-at-00-greg 43/286
SEDIMENTATION IN STILL AIR
as consisting of an intercalated cylinder (length = l/it) between two axial
cones (each of axial length = x/x), Vs being again in mm. per sec.
During fall in still air, an asymmetrical particle will assume a charac-
teristic orientation. Hydrodynamical theory requires that the orientation
assumed will be that in which the resistance of the air to the motion of the
particle is greatest. This phenomenon can be observed with the naked eye
if minute airborne particles of fibre are watched in a beam of light in a
still, darkened room.
We know very little as yet about spore orientation. Duller (1909)
observed that some slightly elongated spores tend to fall with their long
axis horizontal, as is to be expected for dynamical reasons. Sometimes
factors other than shape seem to influence the orientation of an asymmetric
spore. When Yarwood & Hazen (1942) watched the smooth conidia of
Erysiphe graininis, measuring 32 X 20 /x, during fall in vertical glass tubes
7 mm. in diameter, they saw that half of the spores fell with the long axis
horizontal and the other half with it vertical. This might indicate an
uneven distribution of materials of different density in the cell contents;
but, more likely, the vertical position was due to drag at the wall boundary,
because if the tube is made even narrower, all the spores fall vertically.
The present author has seen the filamentous ascospores of Cordyceps
gracilis similarly oriented whilst being carried up by convection currents
beside a vertical glass surface. Further, while watching the tailed spores
of the puffball, Bovista phwihea, falling in a small chamber on the stage of
a horizontal microscope, the tail was seen to trail behind the spherical
spore. In Chapter VI it will be indicated that spores tend to be deposited
with characteristic orientation on a surface.
Stokes's law holds for smooth spheres. Few pollens or spores are
spheres, but a large proportion of them are microscopically smooth.
Others, when highly magnified, are seen to possess warts, spines or other
projections, or even to be pitted. These roughnesses would be expected to
increase friction during movement through air and to retard fall, but we
have as yet no experimental evidence of this.
Viewed over the whole range of spore and pollen size of, say, 4 to
100 /x diameter, and of terminal velocities of from 0-05 to 10 cm. per sec,
it is clear that Stokes's law gives a good idea of terminal velocity in still
air, but that asymmetry and surface roughness may play a part as yet
unmeasured.
Effects of Sedimentation
The effects of spore fall in still air can be observed indoors, particu-
larly if a room is left closed and unoccupied—a fact noted early in the
study of air hygiene by workers using Hesse's horizontal tube method of
air sampling, or some modification of it {see Chapter I, p. 10). Although
all these investigations suffer from the defect of being based on highly
19

7/30/2019 Microbiology of at 00 Greg
http://slidepdf.com/reader/full/microbiology-of-at-00-greg 44/286
THE MICROBIOLOGY OF THE ATMOSPHERE
selective culture media, all agree that wind or crowds stir up micro-
organisms, and that these soon settle in buildings when the air is left
undisturbed.
At the Royal Institution in London, England, Tyndall (1881) made a
close study of microbes in the air in relation both to the question of
spontaneous generation and to the antiseptic surgery which was being
developed by Lister at that period. Tyndall showed that the air of a
darkened room scattered a powerful beam of light. Gas molecules did
not appreciably scatter light. Scattered light always arose from suspended
particles^ some of them too fine to be described as motes. By passing a
beam of light through windows in the side walls of a glass-fronted box, he
showed that, after a day or two, the air became optically empty, the par-
ticles having settled on the floor and even on the roof of the box. At the
same time Tyndall found that the air, previously full of microbes, had
become sterile. The ability to generate life was associated with the
presence of the light-scattering particles, and the air of small spaces could
be sterilized by sedimentation. Tyndall had the curious idea that microbes
remained associated in the air in clouds, much as fish are associated in
shoals, and he explained that some of Pasteur's flasks (pp. 3-4) must have
been opened within clouds, while others were opened between clouds of
floating microbes. We now think of micro-organisms as distributed in the
air at random (Home, 1935), but, under certain conditions, it may be that
Tyndall was right.
Outdoors the effects of terminal velocity are usually masked by the
speed and turbulence of the wind. However, conditions are sometimes
tranquil enough for its effects to be detected. One example was found
by Rempe (1937), of Gottingen, who made a series of aeroplane flights
both by day and by night to study the distribution of tree pollen over
German forests. By trapping on sticky cylinders, he obtained evidence
that pollen grains of different sizes and terminal velocities differed in
their relative abundance with altitude, even by day (Table II).
TABLE II
POLLEN DISTRIBUTION AT DIFFERENT ALTITLIDES
(After Rempe, ig^j ; day flight, A 6)

7/30/2019 Microbiology of at 00 Greg
http://slidepdf.com/reader/full/microbiology-of-at-00-greg 45/286
SEDIMENTATION IN STILL AIR
mean diameters of birch pollen on the night flight, A lo (Table III).
The size-range recorded by Rempe varied from 23 ^ to 27-5 |U., so it is
evident that even at night the sorting effect was not great—a difference in
altitude of 1,000 metres was associated with a drop of only 4-5 fi (or i/gth
of the mean diameter), with an estimated terminal velocity differing
between 1-6 and 2-3 cm. per sec.

7/30/2019 Microbiology of at 00 Greg
http://slidepdf.com/reader/full/microbiology-of-at-00-greg 46/286
Ill
THE ATMOSPHERE AS AN ENVIRONMENT
Aerobiology is a synthesis: just as the geographer draws upon astronomy
and geology, so the aerobiologist draws upon many sources.
Tounder-
stand the environment of the air-spora we must go to meteorology. Afuller account of the relevant features of the atmosphere than that given
here can be found in works on dynamical meteorology, e.g. SutclifTe
(1940), Geiger (1950), Sutton (1953), and U.S. Weather Bureau (1955),
the last including many excellent diagrams.
The Atmosphere and its Layers
The atmosphere is usually recognized as layered; some of its main
features are illustrated in Fig. 3, in which altitude is drawn on a logarith-
mic, instead of a linear, scale in order to allow the various layers to be
represented together on one page and to illustrate vividly how the proper-
ties of the atmosphere change most sharply near the ground.
Barometric pressure, density of the air, and (as a rule) temperature,
decrease with increasing height above the Earth's surface. These changes
are all quantitatively important in aviation, and calculations are based on a
table of an agreed 'International Standard Atmosphere'. Changes with
altitude in temperature, humidity, density, and viscosity will be complex
in their effect on a suspended spore, but are not likely greatly to affect
its terminal velocity.
The three vertical panels of the diagram represent conditions in
contrasting weather types. The central panel represents a dull, windy day,
with a cloud layer shielding the ground from direct sunlight (conditions
on a cloudy night are not very different). The right-hand panel represents
a sunny day, and the left-hand panel a still, cloudless night. The thickness
of each individual layer of air varies according to conditions ; the boun-
daries between them vary in definiteness: sometimes transitions are imper-
ceptible, but there is sometimes even a visible interface between layers.
The layers are variously named in the literature and this may be confusing
unless the following approximate equivalents are borne in mind {see p. 23).
It is convenient to describe these layers in the reverse order, from
ground-level upwards, beginning in the troposphere with the laminar
boundary layer.
22

7/30/2019 Microbiology of at 00 Greg
http://slidepdf.com/reader/full/microbiology-of-at-00-greg 47/286
lOkm
lOOm
lOm
ttt t
THE ATMOSPHERE AS AN ENVIRONMENT
STRATOSPHERE
TROPOPAUSE
CONVECTION LAYER
\
OUTER FRICTIONAL TURBULENCE LAYE^
I m _
lOcm V
t t t t
i^I
TURBULENT BOUNDARY LAYER
ii'
LAMINAR BOUNDARY LAYER
t t-J
Still conditions > Wind velocity increasinq
>
CLEAR NIGHT CLOUDY DAY SUNNY DAY
Fig. 3.—Diagrammaticrepresentationof layers of the atmosphere with a logarith-
mic vertical scale.
Nomenclature ofatmospheric layers
STRATOSPHERE

7/30/2019 Microbiology of at 00 Greg
http://slidepdf.com/reader/full/microbiology-of-at-00-greg 48/286
the microbiology of the atmosphere
The Troposphere
The troposphere is the name given collectively to the lower layers of
the atmosphere extending from the ground to a height of approximately
10 km., and is a region characterized by a decrease in temperature with
increasing height—the temperature lapse.
Air is relatively transparent to the short-wave radiation of sunlight
which therefore heats the air very little as it penetrates the lower layers
of the atmosphere. On a sunny day, solar radiation falling on the Earth's
surface is in part temporarily absorbed, and in part reflected back as a
radiation of longer wave-length that is more readily absorbed by air.
This reflected radiation now heats the layer of air near the ground and the
heat later becomes diffused through the lower layers of the atmosphere
from below upwards. Air temperature is thus highest near the ground
and decreases with increasing height, unless a 'temperature inversion' is
formed under conditions described below. The normal temperature
decrease (or 'lapse rate') is about o-6°C. per lOo metres. At the top of the
troposphere is the tropopause—the boundary between troposphere and
stratosphere.
The troposphere comprises the five following layers.
laminar boundary layer
In contact with the surface of the earth and all projecting bodies is a
microscopically thin layer of air held firmly by molecular forces. Except
for molecular diffusion this layer is still and windless.
Above this windless film the atmosphere is usually in motion, set
going either by pressure differences of distant origin, or by convection
currents produced by local heating. The lowest layer of moving air, nextto the still layer, is known as the 'laminar boundary layer' (or sometimes
the ' laminar' layer). This again is a thin layer, of the order of a millimetre
thick, in which there is no turbulence and the air flows in streamlines
parallel to the nearest surface; heat, gases, and water vapour can move
across the streamlines by molecular diffusion. Wind speed is negligible
at the still surface film, and in the laminar boundary layer wind speed
increases linearly with height (momentum being transmitted through the
layer by molecular diffusion only). Particles, droplets, or spores getting
into the laminar layer will sink through it, following trajectories deter-
mined by wind speed and gravity, and will come to rest at the Earth's
surface.
A laminar layer also exists at the interface around any solid body, and
much of the foregoing description applies equally to the air layer at the
surface of a leaf or stem.
The thickness of the laminar boundary layer varies with the wind speed
and with the roughness of the adjacent surface. In a high wind it may be
thinned down to a fraction of a millimetre, and turbulent air from the
24

7/30/2019 Microbiology of at 00 Greg
http://slidepdf.com/reader/full/microbiology-of-at-00-greg 49/286
THE ATMOSPHERE AS AN ENVIRONMENT
next higher layer may reach do\Mi nearly to the surface. In very calm
weather the laminar layer may thicken considerably.
In comparison with the relatively equable air at a metre or two above
the surface, the eco-climate of the laminar boundary layer is violently
changeable (Monteith, i960). Unless protected by a layer of vegetation,
small organisms at ground-level may be subject to extreme heat from the
sun's rays by day, followed by a rapid drop in temperature as heat is lost
by radiation to a clear sky at night.
The laminar boundary layer acts as a dust trap. Particles which have
sunk through it and come to rest in the still or slowly moving air at the
surface, are out of reach of eddies—until some unusual condition arises
which thins the laminar layer enough for eddies to penetrate down andsweep away the dust particles. High winds may do this ; or local heating of
the surface, perhaps on a micro-scale, may set up 'dust-devils'—smaller
or larger whirlwinds raising dust into the air.
LOCAL EDDY LAYER
For biological purposes we need to add the 'local eddy layer'. Even in
streamlined air, local stationary eddies may exist behind small rough-
nesses; and, as will be shown on page 35, air-flow over a cup-shaped
depression may set up a rotation pattern sufficient to throw dust up from
the bowl. This layer is probably important in nature, where ideally smooth
surfaces are rare. A special r\'pe of boundary at the top of a plant layer or
crop has been called the 'outer active surface', or, in forests, the 'crown
layer'.
TURBULENT BOUNDARY LAYER
In this layer, where flux of momentum decreases linearly with height,
solid obstacles, arising at the surface in the laminar boundary layer,
project into the wind and cause eddies which break away from the surface
and travel downwind. A surface is aerodynamically smooth in conditions
when the laminar layer is thick enough to submerge projections from the
surface; but if the irregularities project through the laminar layer, the
surface is considered rough. As the thickness of the laminar layer depends
both on the wind speed and the stability of the atmosphere, it is clear
that a particular surface such as a grass sward or a hairy leaf may be
aerodynamically smooth under one set of conditions and rough under
another. Each surface has a characteristic roughness parameter. Air-flow
over calm water may be smooth ; but, except at extremely low wind-speeds,
flow over land is normally rough and disturbed by surface irregularities
which cause turbulence.
Eddies of two types may occur : local or stationary eddies which may
arise on both the windward and leeward sides of a bluff" obstacle, and
eddies which break away and travel \^ith the wind in the obstacle's wake,
25

7/30/2019 Microbiology of at 00 Greg
http://slidepdf.com/reader/full/microbiology-of-at-00-greg 50/286
THE MICROBIOLOGY OF THE ATMOSPHERE
The forward velocity of a turbulent wind is thus the net result of a com-
plex movement; the wind has vertical and lateral components as well as
the horizontal movement. Further, vertical and horizontal turbulence
may differ in intensity (non-isotropic turbulence).Occurrence of mechanical or frictional turbulence depends on the
wind speed being high enough, and the object large enough, to cause
eddying. Whether or not flow will be turbulent can be calculated by the
method of Osbert Reynolds, who found that flow is turbulent when the
Reynolds number,
, _ , length X wind velocity , ,
Re, denned as —7-. -.—
;
-. , exceeds about 2,000.
kmematic viscosity
Here 'length' is taken as a characteristic dimension of the object, and
kinematic viscosity for air under average surface conditions is 0-14 cm^.
sec.~^ Thus for a leafy bush 100 cm. high in a wind of 100 cm. per sec.
we have
„ 100 cm. X 100 cm. sec.-^
Re = 2 = 7,100
0-14 cm."^ sec.~^
so flow would be expected to be turbulent.
In the turbulent boundary layer, properties such as temperature,
amount of water vapour, and wind velocity, change much less rapidly
with increasing height than in the laminar boundary layer beneath. Eddies
mix the different parts of the layer much more rapidly than do the slow
processes of molecular diffusion. Particles can also be carried by eddies
upwards and laterally in a manner impossible in the laminar layer. In the
turbulent boundary layer the wind velocity, temperature, and amount of
water vapour show a change which is linear with the logarithm ofthe height.
In this layer diurnal changes of temperature are less pronounced than
in the laminar boundary layer underneath, and diurnal changes decrease
still further with increasing height until, at the top of the next layer, they
have almost disappeared.
An increase in wind-speed increases the thickness of the turbulent
boundary layer both downwards, by thinning the laminar boundary
layer, and upwards, by pushing into the transitional layer as turbulence
increases. The turbulent boundary layer is thinnest on clear calm nights
and thickest on hot sunny days, when it may reach to a height of 150
metres.
The turbulent boundary layer is the part of the atmosphere most
familiar to us. While our feet are planted in the violently fluctuating
climate at ground-level, our heads, and the weather-recording instruments
of the conventional Stevenson's screen, inhabit the relatively equable
turbulent layer.
26

7/30/2019 Microbiology of at 00 Greg
http://slidepdf.com/reader/full/microbiology-of-at-00-greg 51/286
THE ATMOSPHERE AS AN ENVIRONMENT
TRANSITIONAL OR OUTER FRICTIONAL TURBULENCE LAYER
Here frictional turbulence, generated in the layer below, still domin-
ates vertical diffusion, but it dies out gradually until, at the top of the
layer, both turbulence and diurnal temperature changes disappear. Both
layers may be dusty, and the top of the transitional zone is sometimes
visible as a distinct dust horizon at 500-1000 metres, marking the upper
limit to which spores are raised by frictional turbulence (though much
greater heights may be attained by convection).
In dynamical meteorology this zone is defined as the region where the
wind structure is determined partly by surface friction and partly by the
Earth's rotation.
CONVECTIVE LAYER
This layer extends from about i km. above the ground to the top of the
troposphere at about 10 km. As in all the layers constituting the tropos-
phere, the temperature continues to decrease with height to the top of the
convective layer, though diurnal temperature variation is almost absent.
Frictional turbulence does not reach here, but, as already indicated,
particles from the Earth's surface can be carried into this layer by large-
scale convection currents when the ground is heated by sunshine.
The height above the ground attained by a mass of heated air before
it loses buoyancy, depends on the temperature gradient and water-vapour
content of the air at the time, as explained in the standard works on
dynamical meteorology. Ascent may be halted if there is a temperature
inversion layer in the upper atmosphere. Under conditions of thermal
instability, 'bubbles' of heated air may arise intermittently from areas
where the ground or vegetation is being heated by the sun. These bubbles
may rise to the convective layer, carrying spores and other particles as
well as water vapour to the level at which cumulus clouds are formed, and
at times reaching to the base of the stratosphere (Mason, 1957).
NIGHT RADIATION AND TEMPERATURE INVERSION
At night, wind speeds tend to diminish; the laminar boundary layer
then becomes thicker than by day and the turbulent boundary layer
may become thinner, being reduced to perhaps only 10 to 15 metres in
thickness.
These changes may be carried still farther if the sky is cloudless, thus
allowing radiation from the ground to escape into space. Loss of heat by
radiation cools the ground and this in turn cools the air lying nearest to
the ground. Thus, instead of temperature decreasing with increasing
height, a 'temperature inversion' is set up: over the cold air near the
ground lies air at a higher temperature—up to a certain height, the top
of the inversion, above which the usual lapse rate is again encountered.
27

7/30/2019 Microbiology of at 00 Greg
http://slidepdf.com/reader/full/microbiology-of-at-00-greg 52/286
THE MICROBIOLOGY OF THE ATMOSPHERE
As the air is coldest and densest at the bottom of the inversion, gravity
tends to prevent it from ascending and mixing with warmer air above.
The air in the inversion becomes stratified according to temperature and
remains very stable, in contrast to the instability that is apt to develop
when the ground is heated. Such a layer of cold, heavy air may flow slowly
downhill as a nearly laminar katabatic wind, filling hollows with cold air
and aiding the formation of frost pockets (Geiger, 1950, p. 203).
In a temperature inversion, spores and dust particles tend to settle
out, leaving the air relatively clean although the air above the inversion
may continue to carry a normal spore-load.
ROLE OF CONVECTIONWhen the surface of the ground is heated by sunshine the lowest
layer of air may be heated in turn. If a large temperature lapse-rate is
established, the atmosphere becomes unstable, because the less dense
ground-layer of air tends to rise and carry its load of microbes upwards,
being replaced by cooler air from above. The pattern of this overturn
is not yet clear. A regular 'cellular' pattern of ascending and descending
air has been suggested, but more recently the ascending air has been
pictured as taking the form of 'chimneys' or of 'bubbles'.
Glider pilots are familiar with the properties of warm ascending
currents of air or 'thermals', as described by Yates (1953). In still air a
glider sinks at about 90 cm. per sec. (about 20 times the terminal velocity
of a pine pollen grain). On dull days thermals do not develop. They reach
their maximum upward velocity of 3 metres per sec, or up to 25 metres
per sec. in cloud, at midday in summer. Yates indicates that, depending
on the type of soil, on Mind strength, and on sun height, a sizeable thermal
is released from an area of 1-25 sq. km. every 5 to 15 minutes in summer.
At a height of 300 metres, thermals may be 300 metres in diameter,
though they are probably often smaller when lower, whereas at still
greater heights a diameter nearer 2 km. was reported by Ludlam & Scorer
(1953). Their vertical movement may cease at a temperature inversion,
or may continue to from 10,000 to 50,000 ft. The temperature in a thermal
appears to average i°-2°C. higher than the surrounding air through which
it is ascending.
The theory of thermals is still a matter of controversy, but there seems
no doubt that air rises from some surfaces more often than from others.
Green vegetation and wet soils may be relatively cool, while a ripe cereal
crop, buildings, roads, or bare rock, may heat up rapidly in the sun and
become the source of rising warm air. Thermals can also arise at a cold
front, and glider pilots regard hilly country as the best source of thermals.
The pattern by which cool air sinks to replace the ascending warm air
is also a matter of debate. Downward draughts reported in the neigh-
bourhood of thermal upcurrents appear to be comparatively feeble.
Probably the downward movement occurs over a much wider area than
28

7/30/2019 Microbiology of at 00 Greg
http://slidepdf.com/reader/full/microbiology-of-at-00-greg 53/286
THE ATMOSPHERE AS AN ENVIRONMENT
the thermal, as a slow sinking of the atmosphere. The sinking speed may
be comparable with that of a fungus spore (Hirst, 1959), but the local
rising velocity may commonly be 100 or more times this velocity. Some
bird species soar in large thermals, as do dragonflies in smaller ones near
the ground. Other birds haunt thermals to prey on the insects carried
upwards (Scorer, 1954).
The Stratosphere
In this region, which extends upwards from the tropopause to the
limit of the atmosphere, the temperature lapse-rate, characteristic of the
troposphere, is zero or may even be reversed. The height of the tropo-
pause varies with season, latitude, and other factors. The bottom of the
stratosphere may be found at an altitude of about 10 km., though under
special conditions it may reach temporarily to much nearer ground-level.
The dust of the stratosphere is believed to be meteoric and to have
entered the Earth's atmosphere from space. It is generally believed that
terrestrial dust, including organic spores, is almost, if not entirely, con-
fined to the troposphere—except for occasional incursions in air currents
dragged up into the stratosphere by volcanic eruptions (or hydrogen
bombs). However, recent studies of atmospheric circulation, discussed by
Machta (1959), may point to exchange of air between troposphere and
stratosphere—with rising air over the equator and descending air in middle
latitudes.
Circulation of the Atmosphere
Under the influence of pressure difl^erences resulting from solar
heating, and of friction between wind and the rotating earth, a general
pattern of atmospheric circulation is set up. The surface winds sho\Mi in
atlases are the ground-level part of a three-dimensional system that has
not yet been well explored. The pattern still being worked out shows a
complex circulation, with air over the Equator ascending and flowing
discontinuously to the poles, which are themselves regions of generally
subsiding air (Palmen, 195 1). Across the Equator there is relatively little
interchange between northern and southern hemispheres.
AIR MASSES
The fact that air may have the same temperature and humidit}' over a
wide geographical area has given rise to the concept of the discrete air
mass, with properties different from adjacent air masses and separated
from them by 'fronts'. When an air mass remains stationary for some
time, it acquires a temperature and humidity dependent on the surface
on which it rests. These characteristics will be retained for some time
29

7/30/2019 Microbiology of at 00 Greg
http://slidepdf.com/reader/full/microbiology-of-at-00-greg 54/286
THE MICROBIOLOGY OF THE ATMOSPHERE
when the air mass moves into a new region. Air masses are classified,
therefore, according to their origin, and we may have, for example:
polar maritime, polar continental, tropical maritime, and tropical con-
tinental types, as well as air masses of indeterminate origin (Belasco, 1952).
The different air masses interest us, not only because they bring different
kinds of weather but also because they might conceivably bring an air-
spora characteristic of their place of origin.
30

7/30/2019 Microbiology of at 00 Greg
http://slidepdf.com/reader/full/microbiology-of-at-00-greg 55/286
IV
SPORE LIBERATION
Up to now we have considered only the physical properties of spores and
of theirenvironment.
Spores,however,
are parts of livingorganisms whose
evolution has been extensively moulded by the environment. The air-
spora comes mainly from species which are highly adapted towards using
wind energy for their dispersal. The physical properties of the atmosphere
make dispersal possible, but also set problems to organisms using it.
Adaptations for wind transport have been evolved in many widely-
separated taxonomic groups.
The process of wind dispersal of spores has three principal stages,
(i) Spore liberation. This chapter describes the processes by which pollengrains or spores 'take-off' into the air from the structure where they have
been formed. (2) Dispersion. Chapter V describes the transport of spores
by gentle air currents or strong winds, and the diffusion of an airborne
spore cloud. (3) Deposition. Chapters VI and VII will deal with the pro-
cesses by which spores leave the air and land on a surface—a necessary
prelude to the germination of a pollen grain or a mould spore on its
substratum.
The spore or pollen output of many species is notoriously large. Forinstance, Pohl (1937) estimated, for the dominant species encountered
by pollen analysts, the pollen production per stamen, flower, inflores-
cence, and branch, revealing an annual production averaging many
millions per square metre of ground covered {see also Erdtman, 1943).
According toJ. J.
Christensen (1942), a field of wheat moderately affected
by Puccinia graminis would produce at least 25 million uredospores per
square metre. Duller (1909) estimated that one giant puff'ball {Calvatia
gigantea) produced 7 million million (7 x 10^^) spores. The spore output
of mosses and ferns is also potentially enormous.
PROBLEMS OF 'tAKE-OFF'
As described in Chapter III, the surface of the ground or plant is
covered by a thin layer of still air and by the laminar boundary layer of
slowly moving air ; a spore will fall through this composite zone under the
influence of gravity.
Totap the
energyof
movingair for
dispersal a sporemust overcome the adhesive forces which tend to keep it in contact with
neighbouring spores or with the substratum. It must cross the still- and
31

7/30/2019 Microbiology of at 00 Greg
http://slidepdf.com/reader/full/microbiology-of-at-00-greg 56/286
THE MICROBIOLOGY OF THE ATMOSPHERE
laminar-air layers, at the interface between the ground or other surface
and the atmosphere, in order to enter the freely moving air of the tur-
bulent boundary layer, where it stands a chance of being carried into
higher layers of the troposphere.
Many species that are distributed as spores have not solved this
problem, but instead have become adapted for dispersal by some other
agency such as water, insects, or other animals. There are more insect-
pollinated (entomophilous) species of flowering plants than wind-pollin-
ated (anemophilous) species, though in the temperate regions at least
there are more wind-pollinated individuals because of the preponderance
of grasses and anemophilous trees.
We maywonder
howimportant in
practice is the occasional dispersal of a spore by some agency other than
that to which it is adapted. However, it is a fundamental principle that the
better a species is adapted to dispersal by one agency, the poorer are its
chances of dispersal by another agency—unless, like many fungi, it
produces spores of several distinct types that are specialized for different
dispersal mechanisms.
If we wish to control the dispersal process, a precise knowledge of the
mechanisms involved is preferable to the vague idea that the spores will
get there somehow anyway! Success in colonization or fertilization de-
pends on logistics—on getting enough material to the right place at the
right time.
Energy is required to detach spores from their source. It may be an
active process through which, by some explosive or hygroscopic mechan-
ism, spores are discharged by energy operating through the parent struc-
ture. Or it may be passive, by the energy of an external agent—usually
wind or the kinetic energy of falling raindrops. Seasonal development of
the parent structure and maturation of the spores commonly determine
what organisms are in the air at a particular time, but other fiictors modify
this pattern. The working of the various discharge mechanisms is more or
less affected by external conditions, and the result is that the output of
spores of a particular species varies greatly from time to time. Conversely,
all the individuals of one species in an area may behave in unison, so that
the composition of the air-spora differs vastly on different occasions.
Take-off Mechanisms in Cryptogams etc.
Spore- and pollen-liberation mechanisms have formed the subject of
classical researches in biology for over a century. The wealth of informa-
tion in the scattered literature on land plants is reviewed by Ingold
(1939), and knowledge about bacteria by Wells (1955), but for protozoa
and algae I know of no comprehensive treatment. In the present connec-
tion we are concerned with those aspects of the mechanism which deter-
mine when, and under what conditions, spores get into the air.
32
7/30/2019 Microbiology of at 00 Greg
http://slidepdf.com/reader/full/microbiology-of-at-00-greg 57/286
SPORE LIBERATION
VIRUSES
The viruses are little adapted to independent air dispersal. Some
viruses infecting the animal respiratory tract are forced into the air on
droplets during coughing and sneezing; but most bacterial and plant
viruses, if they occur in the air at all, only get there on 'rafts' of debris or
water droplets. Some of the so-called polyhedral viruses infecting insects
are exceptional. Reports of outbreaks among pests of forest trees in
eastern Europe speak of copious yellow deposits of the polyhedral bodies,
shed by parasitized insects, which coat the surfaces of vehicles travelling
through the forests. Study of air dispersal of viruses might explain
some of the anomalies in the behaviour of insect viruses. To preventcontamination by an airborne infective particle of the dimensions of a
virus may well require quite unusual experimental precautions.
BACTERIA
Moving air does not normally detach bacterial cells from the surface
of a colony, at least when this is slimy, and in the absence of an active
discharge mechanism natural processes capable of producing an aerosol
of single bacterial cells are unknown. Mechanical disturbance of dust,
clothing, surgical dressings, etc., however, carries into the air contamin-
ated particles of substratum acting as 'rafts' and bearing clumps of bac-
teria (Bourdillon & Colebrook, 1946). Rafts of soil or dust particles are
raised by wind, by 'dust-devils' when the ground is heated by solar
radiation, and by animal and human activity such as cultivation of bare
ground. Rain splash, breakers, and sea spray continuously throw minute,
potentially bacteria-laden, droplets into the atmosphere. Droplets
expelled by coughing and sneezing are important indoors {and see p. 158),
yet processes which put bacteria into the air are still not satisfactorily
known. This is also true of the yeasts whose frequent abundance in the
air remains unexplained, except for the Sporobolomycetaceae which show
the ballistospore discharge mechanism (pp. 37-38).
ACTINOMYCETES
The mycelial organization of this group allows the Streptomycetaceae
to develop aerial hyphae bearing &r^\ powder}'' spores—the first example
of the sporophore elevation device, common in more elaborate organisms,
for raising the spore-producing organ above the substratum and towards
the moving layers of the atmosphere. Take-off conditions in the Actino-
mycetes seem not to have been investigated.
MYXOMYCETES (Mycetozoa, Myxogastrales)
The slime-moulds are a group thoroughly adapted to wind dispersal.
Some, such as Reticidaria^ merely expose a dr}'', powder)'' spore-mass on a
cushion raised above the substratum. Others, such as Stemonitis and
c 33

7/30/2019 Microbiology of at 00 Greg
http://slidepdf.com/reader/full/microbiology-of-at-00-greg 58/286
THE MICROBIOLOGY OF THE ATMOSPHERE
Trichia^ expose small, dry spore-masses on stalks at most a few millimetres
high. The spores are set free by twisting movements of hygroscopic
elaters which take place with changes in air humidity (Ingold, 1939),
or, in a few species, spores may be removed by eddies from shallow
wind-cups.
FUNGI
Adaptations facilitating air dispersal show more diversity in the fungi
than in any other group—except, perhaps, adaptations for seed dispersal
among the flowering plants. They vary from the passive but quite effective
processes in the Fungi Imperfecti, to the spectacular ballistic feats of the
ascus gun. The various mechanisms have been summarized by Dobbs
(1942, 1942^/) and Ingold (1953, i960), and they formed one of the main
topics of the classical work of Buller (1909-50).
In contrast, spores of many other species of fungi rarely get into the
air but are carried by insects, on seeds, or in soil. Mere dispersal by in-
sects may be relatively unimportant; but, where the insect actively
inoculates the substratum or host, it is a mechanism comparable in
efficiency with insect pollination of flowering plants. Passive liberation
by the action of external energy depends on 'spore presentation' (Hirst,
1959)-
(i) Shedding of spores under gravity. Stepanov (1935) concluded that
spores of some CiinninghameUa species, and of some Fungi Imperfecti,
including Botrytis cinerea, Monilia sitophila and Hehninthosporium sativum,
as well as the macroconidia of Fusarium, could be shed under gravity.
However, as he also showed that minor air currents released spores of
some ofthese fungi, the effect remains uncertain.
(ii) Shedding in convection currents. Stepanov (1935) placed open
Petri-dish cultures at the bottom of glass cylinders 10 to 12 cm. high in
which convection currents were induced by differential heating. Sticky
slides or a surface of inverted sterile medium at the top of the cylinder
trapped spores which might become detached and carried aloft by con-
vection. With temperature differences of the order of io°C., conidia of
Monilia sitophihi and Botrytis cinerea were freely transferred upwards, but
CoUetotrichum Uni was not. Smaller temperature differences, such as
resulted from the slight heat produced by a mould culture or an electric
lamp shining on the floor, were ineffective.
(iii) Blowing away ('deflation'). This occurs commonly with dry-
spored fungi including moulds, smuts, and rust uredospores. The spores
are often 'presented' on an elevated sporophore, any stem or leaf patho-
gen usually being adequately raised on its host tissue. Qiiantitative studies
so far are insufficient to lead to a theory of 'deflation'. Little is known
about the quantitative effect of wind-speed on liberation, but there is
good evidence that the higher the wind-speed the more spores are carried
away.
34

7/30/2019 Microbiology of at 00 Greg
http://slidepdf.com/reader/full/microbiology-of-at-00-greg 59/286
SPORE LIBERATION
Stepanov (1935) was apparently the first to use a small wind-tunnel
to blow spores at controlled wind-speeds. Using either cultures or plants
infected with pathogenic fungi, he found that the minimum wind-speed
required to remove spores varied according to the organism being tested
:
for Botrytis cinerea it was o-36-o-5o metres per sec; for Alonilia sitophila^
Ustilago spp., uredospores of Piiccinia triticina, and Hehninthosporhim
sativum it was 0-5 1-0-75 rnetres per sec; for aecidiospores of Puccmia
coronifera and P. priugsheimia, o-'jb-i-o metres per sec; for Ciinning-
hamella sp., 1-5-1 -75 metres per sec. On the other hand, Phytophthora
hifestans and Fusarium cidnwrum spores were not removed at any speed
tested up to 3-37 metres per sec More spores were removed in turbulent
than in streamlined wind.
A special structure facilitating blowing away is the 'wind-cup'
described by Brodie & Gregory (1953). Flow of air over a cup-shaped
structure produces a double eddy system which can effectively remove
dry spores contained in the cup, as shown by wind-tunnel experiments
with smoke and Lycopodium spores. Soredia were also removed from the
podetia oiCladonia at 1-5 to 2-0 metres per sec, and spores were removed
from the cupulate sporangia of certain Myxomycetes at 0-5 metres per sec.
Certain Gasteromycetes, including the puffballs Lycoperdon perlatum
and L. pyriforme^ and the earth-stars {Geaster spp.), have a 'bellows'
mechanism consisting of a thin, flexible, waterproof wall covering the
spore mass. Indenting this wall forces out a jet of air laden with spores.
Contact with animals operates the bellows efficiently, but must be a
relatively rare event in nature. Raindrops or run-off drops from trees also
operate the bello^^ s mechanism, and as one fruit-body would be hit many
thousands of times in a season, rain is probably the most effective mech-
anism in the field (Gregory, 1949). In India W. H. Long & Ahmad (1947)
find that the bellows mechanism of Tylostoma is operated by wind-blown
sand grains in addition to raindrops.
(iv) Mist pick-up. This is a mechanism that has only recently been
recognized. Dry, or even humid, wind fails to detach spores of some fungi
which are nevertheless readily removed from their conidiophores by
collision with minute droplets carried by mist-laden air. This method is
kno^\Tl to functionwith two important
crop pathogens, Cercosporella
herpotrichoides (Gl}Tme, 1953), and Verticillium albo-atrum (R. R. Davies,
1959), and it may play a part also in the dispersal of Cladosporium.
(v) Splash dispersal. Spores of some species are 'presented' in sticky
masses to which they adhere tenaciously in wind. However, spores may
become incorporated in splash droplets (Plate 3, and Fig. 4) which are
thrown up from the impact of a falling raindrop, or a drip from a leaf,
hitting a liquid film containing spores (Gregory et al., 1959). Rain splash
is thus another passive mechanism, quite different from mist pick-upby which slime-spored fungi may become airborne in the smaller droplets.
Experiments suggest, however, that the larger splash-droplets, over 50 or
35

7/30/2019 Microbiology of at 00 Greg
http://slidepdf.com/reader/full/microbiology-of-at-00-greg 60/286
THE MICROBIOLOGY OF THE ATMOSPHERE
100 ju, in diameter, carry most of the spores which are dispersed in this
fashion, and these droplets are massive enough to follow definite tra-
jectories without being truly airborne.
oTT-rrT-v-TT-
-7-rrrrrrrTTTT-
r = 0-002l
r=0-0072"
t- = o
/ / / / ////// i / J
t=0-0035"
r=o-ooq"
'7~r77~7-7-T7~.
r = 00007"
rTy-m^TTTrr-
\ =0-0055"
t = 0-OI75"
Fig. 4.—Splash from impact of water drop (5 mm. diameter) falling with
velocity of 440 cm. per sec. on a thin film of water (drawn from stills from ultra-
high-speed film made by Mr. E. D. Eyles at Kodak Research Laboratories,
Harrow).
(vi) The splash-cup mechanism. This is a device, studied particularly
by Brodie (1951, 1957), which is widespread among lower as well as higher
plants, by which the energy of falling raindrops throws relatively large
bodies to distances of several feet. Examples are the peridioles of the
birds-nest fungi (Nidulariaceae), the gemmae of Polyporus conchatus,
and droplets bearing spermatozoids of the Bryophytes. However, the
projectiles scarcely become airborne, for they follow a definite trajectory.
(vii) Hygroscopic movements of conidiophores, which may result in
detachment of spores during violent twisting, occur in a number of Fungi
Imperfecti and Phycomycetes. The effect depends on rapid changes in
atmospheric humidity and is often most marked in the morning hours.
All active mechanisms for spore liberation depend on the fungus
having sufficient water-supply. The more ephemeral fruit-bodies develop
after rain and discharge spores for a short period only. More durable fungi
can be dried but will discharge spores again when re-wetted; others again
can draw on an extensive mycelium deep in the substratum and may be
almost independent of the weather. Distances of ejection vary and have
been compiled by Spector (1956, p. 153).(viii) Squirt-gun mechanism. This is found in many Ascomycetes in
which the ascus, which contains the ascospores, typically swells at maturity
36

7/30/2019 Microbiology of at 00 Greg
http://slidepdf.com/reader/full/microbiology-of-at-00-greg 61/286
t = o sect = O 0338
t ~ O- OOJ8
t ^ o-ofo44-
t = O 0055
t = O- l52(o
t = o 0072
t = 0*970
t = O 0242 t = 02175
Photographs by Worthington & Cole (1897) showing splash of a water drop weighing 0-2 gm. (coated
.

7/30/2019 Microbiology of at 00 Greg
http://slidepdf.com/reader/full/microbiology-of-at-00-greg 62/286
7/30/2019 Microbiology of at 00 Greg
http://slidepdf.com/reader/full/microbiology-of-at-00-greg 63/286
SPORE LIBERATION
and finally bursts at the tip, projecting the spores Into the air to a distance
varying from a fraction of a millimetre to several centimetres. The larger
the projectile, the further it tends to be shot (Ingold, 1956^; Ingold &
Hadland, 1959).
Four clearly-distinct t}-pes of liberation are recognized in the Asco-
mycetes by Ingold (1953), as follows:
'i. In the Discomycete type the spore-producing surface, consisting
of asci intermixed with parallel paraphyses, is more or less exposed, most
often as a lining to a shallow cup-shaped apothecium. The extensive
exposed hymenium allows opportunities for 'puffing'—the simultaneous
bursting of numerous asci.
'2. In the Pyrenornycete type the asci are contained in a small flask-
shaped structure (perithecium) which opens to the outside by a minute
ostiole. Before each ascus can discharge the spores, its tip must reach the
ostiole, and the canal of the neck is usually so narrow that normally only
one ascus can emerge at a time.
'3. In the Erysiphales type the fruit-body is a cleistocarp. This is
rather like a perithecium but is completely closed; there is no ostiole.
In this t}'pe the swelling asci must first burst the wall of the cleistocarp
before they can emerge and discharge their spores.
'4. In the Myriangium t}'pe, though the hymenium is exposed in a
structure like a small apothecium, the spherical asci are embedded in a
plectenchymatous tissue and are free to discharge only when this gradually
undergoes gelatinization.'
Some Ascomycetes which lack explosive asci may liberate spores in
slime to be dispersed by rain-splash. Other species, again, may be either
explosively or slime-dispersed, according to the conditions obtaining.
With still others, such as Chaetomium whose spores are regularly found
in the air, the spore discharge mechanism is unknown.
(ix) Squirting mechanisms^ which propel spores violently into the air,
occur among Phycomycetes in Pilobolus^ Basidiobolus^ and Entomophthora
muscae, as well as in the imperfect genus Nigrospora (Webster, 1952).
(x) Roundifig-offofturgid cells acts as a discharge mechanism when the
flattened double walls between two turgid cells suddenly separate. By
this means spores of some Phycomycetes can be ejected up to a centimetre
into the air. The same mechanism operates to eject aecidiospores when
aecidia of rusts become moistened. Discharge of all these types is favoured
by high humidities, and indeed aecidiospores of the rust fungi are dis-
charged under conditions unlike those favouring dispersal of uredospores.
(xi) Basidiospore discharge. This is a highly characteristic process
which is found with the same essential features almost throughout the
Basidiomycetes. The basidium is a cell producing one or more sterig-
mata, at the end of each of which one basidiosporeis
formed asymmetri-cally. Typically, when the spore is mature, a drop of water is excreted at
the hilum end of the spore and almost immediately the spore is shot off
37

7/30/2019 Microbiology of at 00 Greg
http://slidepdf.com/reader/full/microbiology-of-at-00-greg 64/286
THE MICROBIOLOGY OF THE ATMOSPHERE
to a distance of a fraction of a millimetre or more. In species which form
the basidia on exposed surfaces, as in many lower Basidiomycetes, the
spore after discharge has a chance of being picked up by an air current.
The higher Basidiomycetes often show great elaboration of a stalked
fruit-body with the basidia lining the vertical surfaces of folds, gills,
pores or spines. Here, in cavities protected from wind and adverse
conditions, the basldiospores are discharged into still air and fall under the
influence of gravity into the moving air-current below the cap-shaped or
bracket-shaped fruit-body. Spore discharge in the higher Basidiomycetes
often goes on continuously throughout almost the entire life of the fruit-
body—to all appearances little affected by wind, temperature, or humidity,
though it must be emphasized that accurate quantitative studies on the
effects of these factors are lacking. Just how a basidiospore is shot off"
the sterigma remains a major puzzle of mycology; several explanations
have been advanced, but none seems entirely satisfactory. Nevertheless
the process is highly efficient and basidiospores are a conspicuous com-
ponent of the air-spora.
The same mechanism occurs in the mirror-yeasts (Sporobolomy-
cetaceae), which may possibly have evolved from lower Basidiomycetes
(unlike the Saccharomycetaceae, which are clearly Ascomycetes). Toavoid prejudging the issue by calling the spores of the mirror-yeasts
'basidiospores', the term 'ballistospores' has been coined to include all
spores showing the drop-excretion discharge mechanism. A moist sub-
stratum is necessary for spore discharge in the Sporobolomycetaceae.
LICHENS
The fungus component of lichens discharges ascospores from typical
apothecia or pcrithecia, or basidiospores from basidia. Fragments of the
thallus including both fungal and algal components are blown about freely.
Rounded groups of algal cells surrounded by fungal hyphae, separating
off" from the lichen thallus as soredia, are also blown away; but we
know little as yet about the relative importance of these various modes of
reproduction.
ALGAE
Adaptations facilitating take-off" into the air are unknown in the algae,
though some of the simpler types of algal cells get into the air regularly.
Pettersson (1940) suggested that Chlamydomonas nivalis is carried away
from its habitat on snow-fields and glaciers in melt-water and becomes
airborne by splash in mountain torrents. Lichen soredia may possibly
aid the dispersal of algae when they become grounded in a habitat moist
enough for the algal component to dominate the fungus, and where the
resulting colony will be an alga instead of a lichen. Again, some terrestrial
and epiphytic algae may crumble and blow away.
38

7/30/2019 Microbiology of at 00 Greg
http://slidepdf.com/reader/full/microbiology-of-at-00-greg 65/286
SPORE LIBERATION
BRYOPHYTES
Spores of mosses and liverworts are formed in sporangia which are
typically raised on stalks above the substratum, but the structure of the
sporangium is quite different in the two groups. The moss sporangium
is a firm 'box' opening at the top, whereas the liverwort sporangium breaks
open completely, exposing the spores in a mass of stiff threads (elaters).
In the simpler liverworts the spores may be blown away by wind from
the mass of elaters, or the elaters may twist hygroscopically, actively
throwing spores into the air. In most leafy liverworts, however, a spring
mechanism released by water-rupture in the dr\'ing elaters throws the
spores into the air (Ingold, 1939, 1956), while in FruUania the sporangium
explodes by an efficient spiral spring mechanism which also is released on
drying.
The mosses liberate spores from the stalked sporangium (capsule) by
two principal methods. Sphagnum has an 'air-gun' mechanism (Ingold,
1939). An air space below the spore mass is compressed by transverse
contraction of the dr}'ing sporangium wall, internal pressure increases
and, finally, the top of the sporangium breaks, ejecting a spore cloud to a
height of 15 or more centimetres.
Most of the other mosses have flask-shaped sporangia, which open
gently at the top when mature. In some genera the mouth of the spor-
angium is surrounded by one or more rows of triangular teeth which move
hygroscopically, closing the mouth at high humidities. To what extent
spore liberation in nature depends on shaking of the sporangium in the
wind, and what role is played by hygroscopic movements of the teeth
in actively throwing out the spores, is still a matter of controversy;
but evidently spore liberation is checked by high humidities and low
wind-speeds.
PTERIDOPHYTES
Spores of Pteridophytes (ferns and their allies) are formed on the
fronds m ithin a closed sporangium, from which they are dispersed into the
air by a 'sling' mechanism depending on water-rupture under great tension
as the maturing sporangial wall dries {see Ingold, 1939). Pettersson (1940),
in Finland, found that effective scattering of fern spores takes place out-
of-doors only when the relative humidity of the air falls to 76 per cent,
or even to 60 per cent, according to the species.
Pollination of Phanerogams
Insects and wind are the chief agents of cross-pollination in flowering
plants. Other pollinating agents that are effective in a far smaller number
of species include water and humming-birds. There are probably ten
times as many entomophilous (insect-pollinated) as anemophilous
(wind-pollinated) species of flowering plants in the world as a whole.
39

7/30/2019 Microbiology of at 00 Greg
http://slidepdf.com/reader/full/microbiology-of-at-00-greg 66/286
THE MICROBIOLOGY OF THE ATMOSPHERE
The characteristics of wind-borne pollen become clear when contrasted
with insect-borne pollen (Table IV). There are many exceptions to the
generalizations in this table and, in particular, some plants make the best
of both methods. Both anemophilous and entomophilous plants often
protect their pollen from the rain, and many store it within the flower for
some time after shedding from the anthers. Anemophilous pollen is not
generally shed into very calm or very damp air.
TABLE IV
TYPICAL CHARACTERISTICS OF ANEMOPHILOUS AND ENTOMOPHILOUS
PLANTS
Wind-pollinated
Flowers Lack conspicuous and attractive
petals, scent, and nectar.
Flower Projecting into air: hanging from
position bare branches before leaves open
(catkins); on erect stalks (grasses,
etc.); or at ends of branches (coni-
fers).
Prevention Male and female organs often in sep-of self- arate flowers or inflorescences, or on
fertilization separate plants. If flowers herma-
phrodite, one sex commonly matures
before the other, or, if sexes are in
separate inflorescences, the female
is often above the male.
Pollen Often shed into the air in vast quan-
tities.
Shape rounded, often nearly spheri-
cal or ellipsoidal.
Size-range narrower than entomo-
philous pollen and seldom less than
15 M-
Surface typically smooth as seen
under the microscope, non-sticky,
easily separating into single grains in
Insect-pollinated
Often with bright colours,
scent; nectar attractive to in-
sects.
Tend to be exposed to view, but
not exposing anthers to wind.
Flowers usually maturing when
plant in full growth and insects
abundant.
Flowers usually hermaphrodite,with structural or genetic bar-
riers to selfing.
Usually restricted pollen pro-
duction with little shedding.
Shape very variable.
Size very variable, 3 to 250 /n,
but often less than 15/11.
Surface typically rough, spiny
or warted, often oily or sticky,
tending to adhere in clumps.
GYMNOSPERMS
Conifer pollen, instead of being formed in stalked anthers as is that of
Angiosperms, is produced in two or more pollen sacs on the lower side of
the male cone-scales. The pollen grains are large and often bear two
conspicuous air-filled bladders which decrease the density of the particle
and so retard its fall under the influence of gravity.
In PmuSy cone-scales of the erect male cone separate as they mature,
and pollen shed from the paired sacs falls into small hollows on the upper
surface of the cone-scale below. From these hollows the pollen is blown
away when the wind reaches sufficient velocity. Some other conifers have
hygroscopic mechanisms protecting their pollen from rain and allowing
40

7/30/2019 Microbiology of at 00 Greg
http://slidepdf.com/reader/full/microbiology-of-at-00-greg 67/286
SPORE LIBERATION
its release only in dty weather. In Taxus, Thuja, Cupressus, and ^uniperus,
the pollen is not winged. In ^uniperus the expanded ends of the cone-
scales interlock closely in damp weather, separating again in dry air and
allowing pollen to be blownout.
ANGIOSPERMS
Details of flowering-plant pollination mechanisms are given by Mari-
laun (1895), Knuth {1906), Erdtman (1943, 1952, 1957), Wodehouse
(1945) and others.
Fig. 5.—Anthesis of false oat-grass {Arrhenatherum elatius): (i) closed anther;
(2) open anther; (3) spikelets on a calm day; and (4) spikelets in a wind. (Repro-
duced from Marilaun's: Natural History of Plants, by permission of Messrs.
Blackie & Son, Limited.)
(i) Grasses, rushes, sedges and their allies. The Gramineae, Cyperaceae,
Typhaceae, and Juncaceae are typically wind-pollinated. From the raised
inflorescences of grasses, the anthers are extruded on long filaments to
which they are so lightly attached that they vibrate in the slightest wind.
Often, as in Arrhenatherum, the end of each pollen-sac bends up (Fig. 5),
forming a spoon into which pollen is shed from a slit, and where it ac-
cumulates until blown away by the wind. Either damp or ver>- dry weather
41

7/30/2019 Microbiology of at 00 Greg
http://slidepdf.com/reader/full/microbiology-of-at-00-greg 68/286
THE MICROBIOLOGY OF THE ATMOSPHERE
may delay both extrusion of the stamens and splitting of the anthers.
Except for rye and maize, most cultivated cereals are self-fertilized and
shed little pollen, but pasture grasses are free shedders.
In central Europe, Marilaun(1895)
found that different grasses
flowered for brief periods of only 1 5 to 20 minutes daily, and at charac-
teristic times of the day
:
hours
04-05 Poa, Koeleria, Avena elatior.
05-06 Briza, Deschainpsia caespitosa, Triticiim, Honleum.
06-07 Secale, Dactylis, Andropogon^ Brachypodiian, {Bromiis?), Festtica spp.,
Holeus (ist anthesis).
07-08 Trisetiiin, Alopecurus, Phkiini, Anthoxanthum.
08-09 Exotic types in Europe: Paniciiiii, Sorghum.09-10 Setaria italica, Gynerium (Cortaderia) argenteum.
11-12 Agrostis spp.
12-13 Melica, Molinia, Nardiis, Elymus, Sclerochloa, some Calamagrostis spp.
14 A few Bramus spp.
15 A few Arena spp.
16 Agropyrum.
17-18 Deschampsia flexuosa
.
19 Hokus (2nd anthesis).
This timetable does not necessarily apply elsewhere, and, in Nebraska,
Jones & Newell (1946) found a less precise timing and showed that
anthesis is determined by temperature. They distinguish cool-season
from warm-season grasses. Cool-season grasses include: Fcstuca elatior
(anthesis at 13.30-15.00 hours); Agropyrum spp. (14.00-18.30 hours);
Bromus inermis (14.30-19.00 hours); Poa pratensis (during the night);
Secale cereale (02.30-11.30 hours, maximum 06.00-08.30 hours). The
warm-season group includes: Boiitcloua gracilis (03.00-09.00 hours, maxi-
mum 04.30-05.30hours during darkness) ; ^m^A/oV dactyloides (06.30-13.00
hours, maximum 07.00-08.30 hours); Paniciini virgatum (10.00-12.00
hours, delayed in cool season); Zea mays (07.30-16.00 hours, maximum
08.30-11.00 hours).
Hyde & Williams (1945, p. 89), from the cooler climate of Wales,
report both discrepancies and agreements with Marilaun's timetable:
Holcus lanatus (04.00-06.00 hours, but mainly at 14.00-19.00 hours);
Cynosurus cristatus (05.00-06.00 hours); Arrhenatheriim (07.00-08.00
hours); Trisetum flavescens (before 08.00 hours); Festuca pratensis (08.00-14.00 hours).
(ii) Aquatic monocotykdonous herbs include a few other wind-pollinated
plants, for example Triglochin and Sparganimn, while in the genus
Potamogeton some species are pollinated by wind and others by water.
(iii) Entomophilous herbs and low shrubs include some species in which
the phase of insect visitation is followed by an opportunity for wind-
pollination, the anthers first shedding pollen within the corolla; but as the
flower matures, the elongating filaments protrude and scatter pollen in the
wind. These types include the semi-parasites Bartsia and Lathraea
42
7/30/2019 Microbiology of at 00 Greg
http://slidepdf.com/reader/full/microbiology-of-at-00-greg 69/286
SPORE LIBERATION
(Rhinanthaceae), and the heaths Calluna and Erica—but not Rhododendron^
which has very sticky pollen.
(iv) Tropical and sub-tropical trees include few anemophilous species,
but Casuarina and Myrothamnus are wind-pollinated, and some of the
palms, although entomophilous, shed a good deal of pollen, which may be
carried by the wind.
(v) Nettles and their allies form an anemophilous group which do not
store pollen after dehiscence of the anthers. The anthers dry as they
mature, tissue tensions are set up, and suddenly, as the pollen sacs burst,
the filaments uncoil, throwing pollen into the air. The process can be
watched on a still, dry day when small puffs of pollen appear as the nettle
flowers explode, but in damp air dehiscence of the anthers is inhibited.
The mechanism occurs in Urtica, Parietaria, Moms, and Broussonetia.
A sifter mechanism similar to that of the grasses occurs in Cannabis and
Humiilus.
(vi) Herbs with inflorescences elevated above the general level of the
foliage include a number of anemophilous types such as Mercurialis.
In Plantago and Globularia the anthers, w^hich are exposed in cups, close
their slits in moist weather but shed their pollen in dry air. Upward-
facing cups occur also in Poterium and Sanguisorba. Sifter mechanisms
occur in some species oi Rimiex and Thalictrum. Other conspicuous pollen
shedders occur in the Chenopodiaceae {Beta, Salsola, Chenopodium) and
in the Amaranthaceae, and also in some groups within the Compositae
especially Ambrosia and Artemisia.
(vii) Deciduous trees of temperate regions form a biological group.
Typically the male flowers are aggregated into pendulous catkins, usually
appearing shortly before the leaves expand. In Alnus, Betula, Castanea,
Corylus, Fagus,Juglans, Populus {Salix, like Tilia, is both insect-pollinated
and a wind shedder), and Qtiercus, pollen is protected from rain after
shedding while temporarily stored on the upper scales of the flower
standing underneath—until it is blown away by w ind in a manner reminis-
cent of Pi?ius. Platanus closes its catkins by a hygroscopic mechanism,
so that pollen is not merely protected from rain but can be blown away
only in dry weather. Hippophae pollen is shed into the base of the flower
while this is still in bud. At maturity the perianth lobes remain united at
the top but separate at the base, leaving slits through which pollen can
be removed by the wind. In another group, including Fraxinus, Buxus,
Phillyrea and Ulmus, the anthers project as upward-facing cups from which
pollen is removed by wind.
The take-off mechanisms briefly sketched in this Chapter, with others
(doubtless including some still undiscovered), are not mere curiosities of
natural history. On the contrary, they are highly efficient processes that
restrict spore liberation to limited meteorological conditions. Pollen and
spores of mosses and ferns tend to be shed into dry winds. Ascomycetes
43

7/30/2019 Microbiology of at 00 Greg
http://slidepdf.com/reader/full/microbiology-of-at-00-greg 70/286
THE MICROBIOLOGY OF THE ATMOSPHERE
and lower Basidiomycetes are more likely to discharge spores when the
substratum is wet. Spore shedding in higher Basidiomycetes is less
affected by air humidity and wind speed. Spores of some Fungi Imperfecti
may depend on wind for removal, or on changes in humidity for hygro-scopic movements, or on rain for splash dispersal. Soil- and dust-borne
bacteria and protozoa are probably borne aloft in high winds from heated
or mechanically disturbed ground. The nature of the 'take-off' mech-
anism profoundly affects the occurrence of different kinds of spores
or pollens in the atmosphere—with consequent significance for hay-
fever patients, seed-crops, plant diseases, evolution, and geographical
distribution.
44

7/30/2019 Microbiology of at 00 Greg
http://slidepdf.com/reader/full/microbiology-of-at-00-greg 71/286
V
HORIZONTAL DIFFUSION
We have now described the particles composing the air-spora and the
relevant properties of the atmosphere. What happens to the particles
after they have been launched into the atmosphere? Common-sense
tells us that they become dispersed—in the sense that their concentration
per unit volume of air decreases with increasing distance from the point
of liberation.
Tyndall (1881) believed that airborne microbes float through the
atmosphere in miniature clouds. He explained Pasteur's demonstration
of non-continuity in the spontaneous generation controversy by postulat-
ing that Pasteur sometimes opened his flask in the midst of a bacterial
cloud and obtained life, and sometimes in the interspace between two
clouds and obtained no life. In hospital practice, opening a wound during
the passage of a bacterial cloud would have an effect very different from
opening it in an interspace between clouds.
It was not necessary to draw this conclusion, however, as Pasteur's
results could be explained equally well if microbes were randomly dis-
tributed in the air. Evidence for random distribution was obtained by
Home (1935), who applied Fisher's x^ test to catches on 1,000 or more
Petri dishes of sterile media which had been exposed in Kentish orchards
by N. W. Nitimargi. The observed frequencies of total bacteria or total
moulds, or of any genera or species tested separately, did not depart
significantly from the Poisson distribution. Home concluded that micro-
organisms are distributed at random in the air, and that, for making valid
comparisons between populations of airbome microbes at different places
and times, analysis of variance could legitimately be applied to plate
counts.
Dispersion of the Spore-cloud
It is still convenient to speak of clouds of spores—not, indeed, keeping
together in the manner of locust swarms, but tending to become dispersed
while suspended passively in the atmosphere. Sampling a region small
enough in relation to the size of the cloud may then reveal a random
distribution of particles.
Dispersion of the spore-cloud can be deduced from early observations
on the distribution of rust on rye by Windt (1806), who observed that
45
7/30/2019 Microbiology of at 00 Greg
http://slidepdf.com/reader/full/microbiology-of-at-00-greg 72/286
THE MICROBIOLOGY OF THE ATMOSPHERE
rust was severe near barberry bushes which are now known to be the
akernate hosts for the fungus: 'the effects are striking and desolating in
the distance of ten to twelve paces, I have also perceived them visibly
at 50, 100, 150 paces and a final attack at above 1,000 paces.' Similarly,
dispersion of the pollen cloud made it possible for Blackley (1873) to
advise his hay-fever patients to keep away from grass fields during the
flowering season of the grasses. Attempts to formulate the process of
spore dispersion through the atmosphere have been based on geometrical,
empirical, or meteorological considerations.
The geometrical approach is suggested by analogy with the laws of
radiation. Niigeli (1877) stated that the amount of dust which comes on an
air current from one place falls off with the inverse square of the distance,
whereas E. Fischer & Gaumann (1929) stated that, with linear increase
of the distance, the chance of infection by rust spores decreases in cubic
progression. Kursanov (1933) stated that, in the absence of wind, the
number of fungus spores would fall off inversely as the cube of the dis-
tance from the source. The ideas that underlie the geometrical approach
are simple. Spores travel away from the point of liberation: at greater
distances the volume of air which they can occupy increases as the cube
of the distance or, alternatively, the surface of the ground on which they
could fall increases as the square of the distance. A third possibility would
be a simple inverse relationship with distance, as the areas of successive
annuli around a point increase in arithmetical progression.
The geometrical method is unsatisfactory because, although in a
general way it illustrates the features of dispersion, it is not clear why
spores should travel and spread out in the manner predicted. The particles
interesting to us here are passively borne and do not behave like radiations,
because the air which carries them is not in process of being continuously
generated at some point in the atmosphere; consequently some totally
different concept is needed.
The approach by empirical curve-fitting has been based on field
records of dispersal gradients, such as the scatter of seeds or seedlings
on the ground, contamination of seed crops by foreign pollen, or the
incidence of plant diseases. Using such data, a curve is fitted to the ob-
served points, either graphically or by thestatistical method of least
squares, and an attempt is made to find an empirical formula to fit the
curve. These methods will be referred to in detail in Chapter XIII, after
the subject of spore deposition has been discussed. In general the empirical
method has the advantage that an equation can usually be obtained,
containing at most three parameters, which gives a good fit to any one set
of field data. On the other hand, it is difficult to compare results obtained
by different workers. The parameters are calculated from the data and
correspond to no obvious natural phenomena;
consequently it is difficult
to use empirical formulae to predict a dispersal pattern under conditions
differing from the original one.
46

7/30/2019 Microbiology of at 00 Greg
http://slidepdf.com/reader/full/microbiology-of-at-00-greg 73/286
HORIZONTAL DIFFUSION
In the long run a more ambitious approach seems essential, with the
aim of developing formulae whose parameters correspond to factors of the
environment, and which take into account the total number of microbes
liberated (if known), allow for variations in weather, and use a standard
unit of distance.
Diffusion as a Result of Atmospheric Turblt^ence
Watching the drift of smoke from a bonfire or factory will convince
the observer that wind, instead of having a steady streaming motion, is
characteristically turbulent as described in Chapter III. According to
Brunt (1934), large numbers of small-scale eddies, whose periods are of
the order of i second, are usually present in the turbulent boundary
layer, and at least two-thirds of the eddying energy is associated with
eddies of less than 5 seconds. The action of these very numerous eddies
of varying size on the very numerous spores produced from plant sources,
makes some regularit}' in the dispersal pattern possible.
The study of eddy diffusion has proved difhcult, but it provides the
most promising approach to the elucidation of dispersal. Before describing
the methods in detail, a few general notions—familiar to physicists, but
mostly unfamiliar to biologists—must be introduced.
We are attempting to discover laws governing spore diffusion in the
atmosphere. In nature this is often a complex process, as there are obstacles
preventing the free flow of air. We therefore use a device familiar to
physicists—making a simplified model in the hope that, if we can under-
stand the process of diffusion under simple conditions, we shall be able
to attack the more complex situations found in nature. The assumptions
we have to make for a simplified model are as follows.
(i) The field. Diffusion is assumed to be taking place in three dimen-
sions in the atmosphere over a plane surface which is of indefinite extent,
free from topographical irregularities—not necessarily 'smooth', but, if
aerod}'namically rough, then uniformly so.
(ii) Co-ordinates. To describe movement over the plane surface we
need a system of co-ordinates. Their origin, 'O', is conveniently taken to
be the point of liberation of the pollen or spores.
The'x'-axis is horizontal
and positive in the down-wind direction, and the 'y'-axis is also hori-
zontal but at right-angles to the direction of the wind. Lengths above and
below the origin are measured on the vertical 'z'-axis.
(iii) Sources. Particles are liberated from a source. The simplest
form of source is a 'point source', and this may either liberate a number
'Q^ of spores at a single instant (an 'instantaneous point source'), or it may
be a 'continuous point source' emitting Oospores per second.
Instead of a point source we may have a 'line source'. For simplicitywe assume that the line is horizontal, and is emitting Oospores per centi-
metre of its (effectively) infinite length. The line source in turn may be
47

7/30/2019 Microbiology of at 00 Greg
http://slidepdf.com/reader/full/microbiology-of-at-00-greg 74/286
THE MICROBIOLOGY OF THE ATMOSPHERE
instantaneous or continuous. Furthermore, we may have an 'area source'
(emitting Q_ spores per square centimetre), or a 'volume source'. Real
sources in the field that correspond approximately to these ideal sources
would be a single plant (point), a hedge (line), a ground crop (area), and
an orchard or forest stand (volume). The dimensions of the source must be
treated as relative to their distance: thus a field would be regarded as
effectively a point source when considered from distances many times its
own width.
Fig. 6.
—Diffusion of spore-cloud during horizontal travel in wind. O = origin ofco-ordinates at source of liberation; x, y, z= down-wind, cross-wind, and vertical axes,
respectively. Growth of cloud is measured by increase in standard deviation after the centre
of the cloud has travelled to three positions down-wind.
All these sources may be instantaneous or continuous. The cloud from
an instantaneous point source is a puff or spherical cloud, whereas the
conical cloud arising from a continuous point source is familiar in the
smoke plume from a chimney. A continuous point source can be viewed
as made up of a succession of overlapping instantaneous emissions.
(iv) Standard deviation. Suppose that a 'puff' of spores has been liber-
ated at an instant from a point source into a wind and has become subject
to the action of atmospheric eddies which move individual spores apart
at random. After a short time the particles composing the cloud will show
a scatter around their origin (Fig. 6). At any instant such a cloud has two
characteristics which we could compute if we had all the data: (i) the
mean position of the particles, i.e.
thecentre of the cloud, which can be
expressed as a point on the system of x, y, and z ordinates ; and (2) the
standard deviation, o-, of the particles from their mean position. When the
48

7/30/2019 Microbiology of at 00 Greg
http://slidepdf.com/reader/full/microbiology-of-at-00-greg 75/286
HORIZONTAL DIFFUSION
cloud has travelled farther down-wind it will have a new mean position,
and during the time the cloud has been travelling it will have been further
diluted by eddies, its particles will have got farther apart, and consequently
their standard deviation will have become larger.
The next problem is to find a relation between the standard deviation
and the distance travelled. How does a grow as x grows ? This is a prob-
lem that has excited the interest of many workers since the First World
War, who were attempting to predict the concentration of gas clouds,
smoke screens, smoke trails, and crop pathogens.
The pioneer in the subject was the Austrian meteorologist, Wilhelm
Schmidt (191 8, 1925), who put forward a theory similar to those being
developed almost simultaneously in Britain by G. I. Taylor and L. F.
Richardson. Schmidt supposed that, with a given state of turbulence of
the air, dijffusion of particles proceeds like the diffusion of heat in a solid,
but with an atmospheric turbulence coefficient A/p replacing the coeffi-
cient of thermal conductivity. He showed that for these conditions
CT^ = 2(A//3)t, where t = time.
His work is now mainly of historical interest, but we should note one
interesting feature : according to Schmidt the standard deviation squared
is proportional to the time during which diffiasion has been taking place,
so that on his theory the standard deviation will not be constant at a given
distance, but will depend on the time taken to reach that distance, i.e.
upon the speed of the wind.
Schmidt also assumed that the particles in the diffijsing cloud are
brought to ground-level by their fall under gravity, and he used measured
values of terminal velocity to fix dispersal limits for various organisms
(cf. Table XXVII).
Sutton (1932) recognized that diffiasion in the atmosphere diffisrs
from molecular diffusion of heat in a solid in one important respect.
Diffusion in a solid is constant (depending on the mean free path of the
molecules) however long the diffusion has been going on. Diffusion in the
atmosphere is much more complex, because atmospheric eddies are of a
vast range of sizes, varying from a centimetre or so up to eddies that we
recognize as fluctuations in
winddirection, and even to cyclones and anti-
cyclones. Sutton realized that the size of eddy effective at a given moment
in diluting a cloud is of the same order as the size of the cloud itself at that
moment. Thus a i-cm. eddy would not effectively dilute a cloud i-metre
in diameter, and a 1,000-metre eddy would merely carry a i-metre cloud
around bodily without diluting it. The eddy that dilutes a i-metre cloud
is itself of the order of i metre. This led Sutton to an equation for the
standard deviation which is fundamentally different from that of Schmidt
:
a2 = iC2(ut)"\
where t = time; u = wind-speed; 'C is a new coefficient of diffusion
D 49

7/30/2019 Microbiology of at 00 Greg
http://slidepdf.com/reader/full/microbiology-of-at-00-greg 76/286
THE MICROBIOLOGY OF THE ATMOSPHERE
with dimensions (L)^; and 'w' is a number varying between 1-24 in
extremely stable, non-turbulent wind, and 2-0 under conditions of extreme
turbulence. The value for normal overcast conditions with a steady wind
is m = 1-75.
Because wind-speed multiplied by time equals distance we can write
Sutton's formula : a^ = IC^x"'. This suggestion that a^ is a function of
the distance, x, is not unreasonable, because the surface roughnesses which
generate eddies are spread out along the distance travelled by the cloud.
It is moreover a tempting theory, because we need not know the wind-
speed under which dispersal takes place.
Values of C decrease with height because conditions at great heights
are unfavourable for the formation of eddies. Values for m appear to
increase with longer sampling periods, and Sutton suggests that m itself
is a function of time. In making continuous observations over a long period
on the density of a cloud, he suggests that the random element may
become smoothed out, so that, over a sufficiently long period, m = 2.
These possibilities should be borne in mind when the density formulae
described below are applied to some biological data where the sampling
period is very long.
In practice it is found that near ground-level, diffusion takes place
faster on the x- and y-axes than on the vertical z-axis. Turbulence is
then said to be 'non-isotropic', and C has to be represented by its com-
ponents : Cx, Cy, and Q.
The number m is an indicator of the degree of turbulence of the air
and is, as a first approximation, independent of the mean wind-velocity.
It is primarily affected only by those factors which tend to damp out or
increase turbulence, such as the vertical temperature gradient and the
roughness of the ground. For conditions of spore dispersal tests it seems
appropriate to assume values of Cy = 0-5-1 -o (metre)^, Q = o- 1-0-2
(metre)", and m = 1-75-2-0.
Expressions for the concentration of particles in a cloud emitted from
various types of source were deduced by Sutton (1932), and are analogous
to heat-conduction equations, as follows
:
(i) An instantaneous point source^ such as a puff of Q^grams of smoke,
or a number Q^of spores emitted at an instant of time. Here the concen-
tration in the cloud is given by
Q_ r r2
^ 7rtC3xt"'^''P\ CH'
where 'r' = distance from the centre of the puff or cloud.
(ii) A continuous point source^ such as a factory chimney emitting Q_
particles per second. Here, to obtain an integral that can be handled
conveniently, the assumption is made that the spread of the cloud laterally
and vertically is small compared with its spread down-wind. When
50

7/30/2019 Microbiology of at 00 Greg
http://slidepdf.com/reader/full/microbiology-of-at-00-greg 77/286
HORIZONTAL DIFFUSION
emission has continued long enough for the distribution to reach a steady
state, the concentration is given approximately by
The cross-wind concentration shows a 'normal' distribution of particles.
On the axis of the cloud (y = z = O) the concentration is given by the
simpler expression
^ ttOux'"
and because, according to the theory, m cannot exceed 2-0, the fall-off
in concentration on the axis of a point-source cloud cannot be more rapid
than the inverse square, no matter how turbulent the wind may be.
(iii) A continuous line source at right-angles to the mean direction of the
wind, emitting (^particles per second per centimetre, and assuming the
line to be of infinite lencfth
a \z,2
^ V(^)Cuxi™^''P\ C^x"
Values obtained by Sutton suggest that, as a rough and ready rule,
a finite line source behaves as a line of infinite length for distances of
travel of the cloud up to 4 times the actual length of the line. For points on
the xOy plane
g^ V(^)Cux^'«
Sutton's statistical method does not exhaust the possible approaches
to the problem of atmospheric diffusion, and attempts to find a still more
useful model continue {see H. L. Green & Lane, 1957). From the theory
of T. von Karman, Calder (1952) developed an equation which is said to
give better predictions than Sutton's theory up to distances of 100 metres,
but not for greater distances. It is also difficult to apply Calder's equations
except to point sources. Another theory of dispersion, based on fluctuations
in wind direction, is outlined by Sheldon & Hewson (1958), and a recent
theory by Clarenburg (i960) will have to be taken into account.
Field Experiments on Diffusion of Spore-clouds
Several experiments have now been reported that give data from which
it is possible to test the applicability of eddy diffusion theories to diffusion
of the spore-cloud in a horizontal direction.
Stepanov (1935) used artificial sources of spores that were liberated
at a point in the open air. He trapped the spores on glass slides, coated
with glycerine jelly, placed on the ground at various distances from the
source and in various directions relative to the wind. At the end of the
experiment cover-glasses were placed on the slides, and the number of
single spores per unit area was counted (spore clusters were disregarded).
51

7/30/2019 Microbiology of at 00 Greg
http://slidepdf.com/reader/full/microbiology-of-at-00-greg 78/286
THE MICROBIOLOGY OF THE ATMOSPHERE
In Experiment i (28 July 1933), on a lawn near the Middle Neva
River, Elagin Island, Leningrad, approximately 1-2 X 10^ spores of
Tilletia caries were disseminated into the air through gauze, at a height
of about 80 to 120 cm. above the ground. According to anemometer
readings the wind varied from 0-5 to 4-0 metres per sec, but sometimes
fell to a complete calm; its direction was also variable. Two glass slides
were placed at each trapping position, the numbers of spores trapped
being shown in Table V.
TABLE V
RESULTS OF DISPERSAL OF SPORES OF Tilletia caries,
Experiment i (Stepanov, 1935)
Number of spores per cover-glass 18 X 18 mm. (average of 2)
Angle
of slide
to wind
-20°
— 10°
+ 30°
+ 45°
+ 55°
+ 65°
+ 75°
+ 85°
At 5 metres
from place of
dispersal of
spores
204
435
964
1 198
659
341
365
20
At 10 metres
from place of
dispersal of
spores
23
45
212
587
123
24
5
ID
At 15 metres
from place of
dispersal of
spores
4
19
207
87
77
26
26
9
At 20 metres
from place of
dispersal of
spores
49
142
15
7
53
14
Experiment 2 (5 September 1933) was made at the same place as the
previous one. This time a mixture of spores of Tilletia caries and Bovista
plumbea was disseminated through a small sieve at a height of about 150
cm. Scattering of the spores occupied 15 minutes, after which 30 to 35
minutes were (perhaps unnecessarily) allowed to elapse for the deposi-
tion of the spores. During this period the wind mostly varied from 2-3 to
3-0 metres per sec, but was sometimes calm. As shown in Table VI, three
slides were placed at each trapping position. Approximately i-8 X 10"
spores of Tilletia were used but those of Bovista were unfortunately not
estimated.
Stepanov's results led him to an empirical law of spore dispersal
which was expressed as : y = C + a/sx, where 'y' = the distance at
which the spores were trapped, x = the number of spores deposited per
unit area of trap surface, s = area of trap surface, and 'C and 'a' are
parameters dependent on the conditions of the experiment. The number
of spores deposited is thus regarded as varying inversely as the first power
of the distance from an origin of co-ordinates that is not coincident
with the source.
It will be shown later that Stepanov's formula, which is the first-
fruits of the experimental approach to the problem, needs modification
52

7/30/2019 Microbiology of at 00 Greg
http://slidepdf.com/reader/full/microbiology-of-at-00-greg 79/286
HORIZONTAL DIFFUSION
if it is to describe spore dispersal over a wide range of conditions (Gregory,
1945). First it will be necessary to re-examine Stepanov's results in the
light of present knowledge of eddy diffusion.
TABLE VI
DISPERSAL OF MIXED SPORES OF Tilktia carks AND Bovistci pliimhea.
Experiment 2 (Stepanov, 1935)
Number of spores per cover-glass 18 x 18 mm. (average of 3)
Tilktia Bovista
Angle
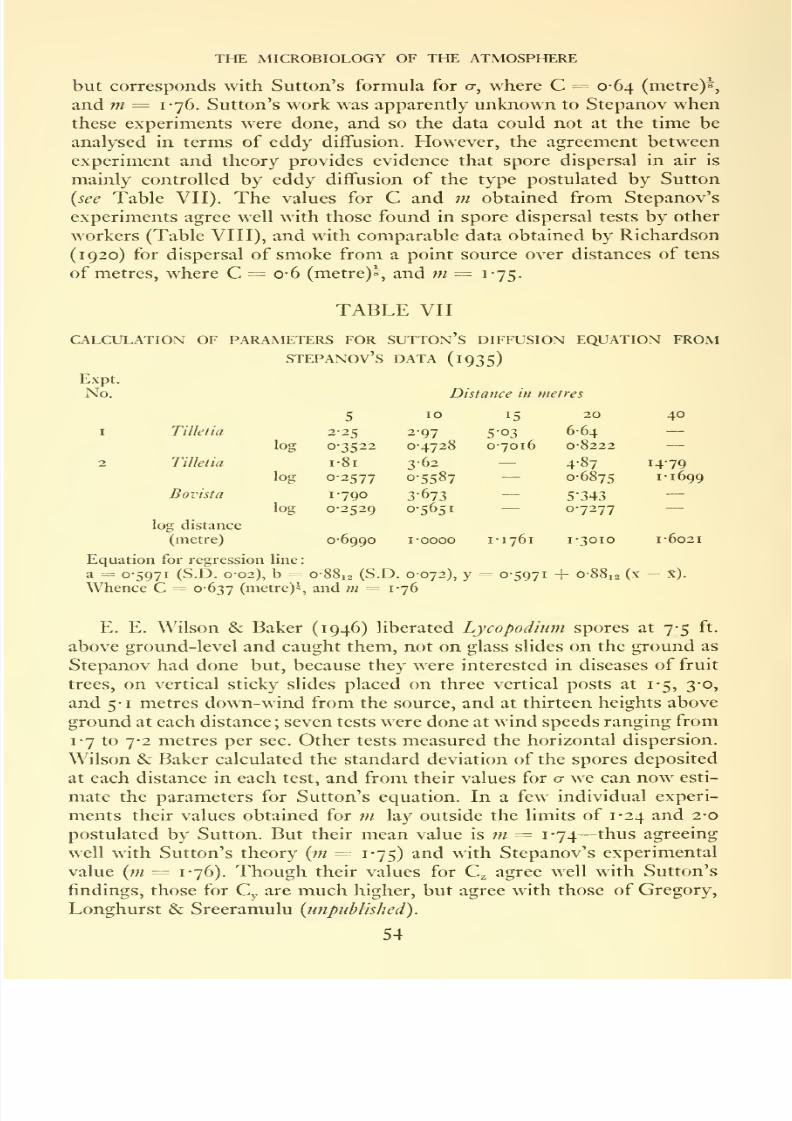
7/30/2019 Microbiology of at 00 Greg
http://slidepdf.com/reader/full/microbiology-of-at-00-greg 80/286
THE MICROBIOLOGY OF THE ATMOSPHERE
but corresponds with Sutton's formula for o-, where C = 0-64 (metre)*,
and m = 1-76. Sutton's work was apparently unknown to Stepanov when
these experiments were done, and so the data could not at the time be
analysed in terms of eddy diffusion. However, the agreement betweenexperiment and theory provides evidence that spore dispersal in air is
mainly controlled by eddy diffusion of the t^'pe postulated by Sutton
{see Table VII). The values for C and m obtained from Stepanov's
experiments agree well with those found in spore dispersal tests by other
workers (Table VIII), and with comparable data obtained by Richardson
(1920) for dispersal of smoke from a point source over distances of tens
of metres, where C = o-6 (metre)«, and m == 1-75.
TABLE VII
CALCULATION OF PARAMETERS FOR SUTTON's DIFFUSION EQUATION FROM
stepanov's data (1935)
Expt.
No.

7/30/2019 Microbiology of at 00 Greg
http://slidepdf.com/reader/full/microbiology-of-at-00-greg 81/286
HORIZONTAL DIFFUSION
Values for C and ;// calculated from various spore-dispersal tests are
sho\Mi in Table VIII. Evidently for microbiological work we must use
high values of C^., perhaps because we are concerned with longer sampling
periods than Sutton. \Xt shall therefore choose Cy = o-8 (metre)*, andQ = 0-12 (metre)*, as standard in Chapter XIII where deposition
gradients are considered in detail. There seems to be little in favour,
however, of adopting m = 2-0 instead of m = 1-75.
TABLE VIII
OBSERVED VALUES OF PARAMETERS IN SUTTON's DIFFUSION EQUATION FROM
EXPERIMENTS ON SPORE DISPERSAL
Stepanov, 1935
Tilletia spores I
Tilletia spores II
Bovista spores
Wilson & Baker, 1946
Lycopodium spores
Wind speed 17 metres/sec.
27
3-2
4-6
(mean of 7 experiments)
Gregory, Longhurst &
Sreeramulu {unpublished)
Lycopodium spores
Wind speed 04 metres/sec.
1-05
1-28
1-63
264
Gregory {unpublished)
Lycopodium spores
Cz
vertical
(metre)7^
0-20
o-ii
0-22
0-12
015
Cy
horizontal
(metre)V^
1-67
0-35
0-89
0-66
4-26^
0-30
0-40
0-97
0-28
0-58
089
1-40
0-68
026
1-49
1-90
165
170 1-51
1-97 0-88*
175 1-64
1-86 174
1-92 —
1-80
212
I 99
1-66
171
1-98
1-94
* abnormal values.
Comparison of Theories of W. Schmidt ant) Sutton
According to Schmidt's theory, a^ = sAt/p, so, because t = x/u, we
have log a = Mog X + i log {ikjpu). If this relation holds true in field
tests, plotting experimental data for log a against log x should give a line
55

7/30/2019 Microbiology of at 00 Greg
http://slidepdf.com/reader/full/microbiology-of-at-00-greg 82/286
THE MICROBIOLOGY OF THE ATMOSPHERE
l-O
0-8
E
en/O ^
02
o"-^
(a) Graph of log a against log x.
0-4 Ob 0-8
log T sees
{b) Graph of log a against log t.
Fig. 7.
—Test of agreement of W. Schmidt's and Sutton's diffusion theories withexperiments using Lycopodiiim spores liberated over grass field at Imperial College Field
Station, Ascot, Berks. (Gregory, Longhurst & Sreeramulu, unpublished)
56

7/30/2019 Microbiology of at 00 Greg
http://slidepdf.com/reader/full/microbiology-of-at-00-greg 83/286
HORIZONTAL DIFFUSION
of slope tan-1 1, that is 26°34'. However, according to Sutton's theory
(T^ = |Cx™, therefore
log cr
= — log X + ^ log (iO)2
If this holds true, plotting the observed values of log a against log x
111
should give a line of slope tan-^ — . For values of Sutton's m between 1-75
and 2-0, the line should slope at an angle between 40° 36' and 45°.
Field tests with Lycopodium spores liberated over short grass by
Gregory, Longhurst & Sreeramulu {impublished) allow a direct comparison
to be made of the theories of Schmidt and Sutton. Spore-cloud concen-
trations were measured near ground-level at distances up to 10 metres
simultaneously at 24 points. Results plotted in Fig. 7^ show the lines
sloping at angles varying between 40° and 46°. This is incompatible with
Schmidt's theory which requires a slope of 26°34'. Furthermore, if log
CT is plotted against log t (calculated from the distance and mean wind
speed) according to Schmidt's theory a should be the same after a giventime whatever the wind speed, but this is not so (Fig. ']b). On Sutton's
theory at a given distance log a varies only over a comparatively narrow
range of values depending on the parameter m. The results of these
experiments are compatible with Sutton's theory which requires a slope
of 40°36' for m = 1-75, and 45°o' for m = 2-0.
In biological applications we are usually interested in the relation
between diffusion and distance rather than between diffusion and time.
As we often lack measurements of the variable wind velocities in whichdispersion has occurred, Schmidt's theory would be inconvenient to
handle. On Schmidt's theory a varies with time, on Sutton's o- varies
with distance travelled. Sutton's theory not only fits experimental results
well, but is also convenient because it does not require a knowledge of
wind speed.
57

7/30/2019 Microbiology of at 00 Greg
http://slidepdf.com/reader/full/microbiology-of-at-00-greg 84/286
VI
DEPOSITION PROCESSES
We have now considered airborne micro-organisms as diffusing clouds.
Before we can discuss processes by which they are deposited in the com-
plex outdoor environment, we must deal with deposition processes under
simplified, ideal conditions. The word 'deposition' is used in a general
sense to include all processes by which airborne particles are transferred
from aerial suspension to the surface of a liquid or solid. One form of
deposition, the impaction of droplets or particles on surfaces, has been
extensively studied both theoretically and in wind-tunnel experiments.
It is highly relevant to the problems of spore deposition in nature and of
sampling techniques which form the topics of Chapters VII andVIII.
1^ • 1^^u
> X %
Fig. 8.—Diagram showing relation between concentration (x = number of spores per unit
volume); wind-speed = u; area dose (A.D. = number of spores passing through frame of unit
area); and trap dose (T.D. = number of spores deposited on unit area of surface).
The relation between concentration of the spore-cloud, x, and deposi-
tion on the surface (T.D. = trap dose) over which the spore-cloud travels,
is illustrated in Fig. 8, together with the concept of 'area dose' (A.D. =
the number of particles flowing through an imaginary frame of unit
area cross-section at right-angles to the direction of the wind). Concen-
tration of the cloud (x= number of spores per cubic metre) is the more
fundamental measurement, and the one of greatest interest to the allergist,
whose patients inhale volumes of air. The trap dose, which measures
deposition on a surface, is of more interest to plant pathologists, plant
breeders, and pollen analysts. The area dose is a useful concept in passing
from the one measurement to the other. For a given concentration of
particles per unit volume of air, the area dose must increase with wind-
speed, but whether the trap dose will also be affected is a matter for
58

7/30/2019 Microbiology of at 00 Greg
http://slidepdf.com/reader/full/microbiology-of-at-00-greg 85/286
DEPOSITION PROCESSES
experimental investigation. With a continuous source emitting during a
limited time, the area dose will be the same as if the same total quantity of
particles, Q_05 had been liberated in a number of successive instantaneous
puffs arriving in a series of greatly fluctuating concentrations.
We can conveniently express the percentage efficiency of a trapping
surface as
^ Trap dose per sq. cm.E = T
—^-^1 ^ ^ X 100.
Area dose per sq. cm.
This convention expresses the efficiency with which a surface clears the
spore-cloud to a height of one centimetre above the surface. Deposition
on a surface takes place in several ways, including impaction and sedi-
mentation, for sedimentation seldom acts alone.
Mechanism of Impaction
When a bluff object such as a cylinder is placed in wind, the oncoming
air-stream has to flow around the obstruction, but airborne particles w^ill
be carried some distance towards it by their own momentum before they
are in turn deflected by the wind flowing around the obstacle (Fig. 9).
Pig. g.—Streamlines of air and particle trajectories around a cylindrical obstruction
(vertical cylinder seen in plan). E = streamlines carrying spores towards cylinder; d = diameter
of cylinder; arrows on left show direction of wind of velocity = u.
If all those particles were impacted whose trajectories in the free wind-
stream would have passed through the obstruction, impaction efficiency
would be 100 per cent, but apparently in practice it never is. The distance
travelled by the particle towards the cylinder before being deflected by the
air streamlines flowing around the cylinder is related to both the momen-
tum of the particle and the size of the object disturbing the air-flow.
Another effect, collection by direct interception, becomes important when
the diameter of the particle is an appreciable fraction of the diameter of
59

7/30/2019 Microbiology of at 00 Greg
http://slidepdf.com/reader/full/microbiology-of-at-00-greg 86/286
THE MICROBIOLOGY OF THE ATMOSPHERE
the cylinder. With low wind-velocities and with particles smaller than
spores, Brownian diffusion may play a major role in deposition.
Fig. 10.—Observed relation between E per cent and k = Vsu/^dg. Solid lines from
Gregory & Stedman (1953). Broken lines = values for spheres, strips and cylinders as
predicted by Langmuir & Blodgett (1949), for <p = 10^. (Reproduced by permission from
the Annals uf Applied Biology.)
The general principles of impaction have been made clear by Sell
(193 1) in connection with dust filtration. From aerodynamical considera-
tions Sell postulated that the efficiency of impaction, E, is related to a
non-dimensional constant, which may be written in a form convenient
to us as
k = VgU/idg,
where: v^ == speed of fall of particle in still air; u = speed of wind;
d = diameter of cylinder, strip, etc.; and g = acceleration due to gravity.
Sell derived the relation between E and k by observing the trajectories
of uniform droplets of Indian ink on paper bisecting a vertical cylinder
in a small wind-tunnel. It is not clear from Sell's paper what range of
conditions he tested.
60

7/30/2019 Microbiology of at 00 Greg
http://slidepdf.com/reader/full/microbiology-of-at-00-greg 87/286
DEPOSITION PROCESSES
Efficiency of impaction on spheres, cylinders, and strips has attracted
two distinct t}'pes of investigators—theoretical and experimental. There
have been large discrepancies between the conclusions of different
theoretical workers and again between wind-tunnel studies, but in more
recent papers substantial agreement is evident between theory and experi-
ment. Deposition on cyhnders has been studied by: Sell (1931), Glauert
(1946), Langmuir & Blodgett (1949), Johnstone et al (1949), Chen (1955),
Wong et al. (1956), La Mer& Hochberg (1949), and Landahl & Herrmann
( 1 949). Deposition ofcloud droplets on rotating multicylinders was studied,
both theoretically and in flight, by Brun et al. (1955). A theory of particle
deposition on cylinders, showing reasonably good agreement with the
observed data of Gregory (1951) and of Ranz & Wong (1952), has been
developed by C. N. Davies & Peetz (1956). Deposition mechanisms other
than impaction still await a coherent theory, and we must rely on experi-
mental values. (Fig. 10.)
WIND-TUNNEL STLTDY OF IMPACTION
The following account is based on work with a small, low-speed wind-
tunnel built at Rothamsted Experimental Station in 1949 (Gregory, 1951
Gregory & Stedman, 1953) and includes some hitherto unpublished data.
• Fig. II.—Diagram showing small wind-tunnel used in deposition study at Rothamsted
Experimental Station, elevation view.
1-4, 'Perspex' working sections; b, bell-shaped intake; c, contraction to smooth flow;
e, expansion and conversion from square to circular cross-section; h, paper-honeycomb
straightener; m, motor; p, propeller; s, spore input; t, removable constriction to generate
turbulence when required; x, trapping position.
The wind-tunnel consists of a horizontal square duct (Fig. 11). The
two ends of the tunnel project throughthe end walls of a small building
which forms a laboratory traversed by the eight-feet-long working section
of the tunnel. The tunnel uses outdoor air which is passed through once
only and not re-circulated. A four-bladed wooden propeller absorbing
0-56 horsepower at 2,850 r.p.m. in the exit draws air down the tunnel.
An expansion section converts the 29 cm.-square working section to the
46 cm.-circular diameter at the fan. The flared intake-end is of 51 cm.-
square cross-section, contracts to a bell shape, and contains a paper honey-
comb 'straightener' to remove eddies and produce streamlined flow;
but if turbulent flow is needed a constriction is inserted in the first part
of the working section (indicated by dotted lines at t in Fig. 11).
61

7/30/2019 Microbiology of at 00 Greg
http://slidepdf.com/reader/full/microbiology-of-at-00-greg 88/286
THE MICROBIOLOGY OF THE ATMOSPHERE
Spores under test are injected or otherwise liberated, usually on the
tunnel axis near the constriction. Spore trapping equipment, plants, etc.,
can be inserted farther downwind through removable panels in the walls
of the working section. Wind-speeds of from 0-5 to nearly 10 metres
per second are obtained by changing pulleys on the belt drive between the
constant-speed electric motor and the fan, and by inserting screens across
the tunnel to increase its resistance. The lower wind-speeds are best
obtained by increasing the resistance of the tunnel, rather than by slowing
the fan, because outdoor wind movement disturbs the flow less when the
tunnel resistance is high than when it is low.
Most tests of spore dispersal or deposition in the wind-tunnel involve
knowledge of the time-mean spore concentration of the air. The Cascade
Impactor (K. R. May, 1945; see also Chapter VIII), operated isokineti-
cally (i.e. with the orifice facing the wind and with suction adjusted to
draw air in through the orifice at the same speed as the wind) is taken as
standard to estimate the mean number of particles per cubic metre of air
during the period of the experiment. With this information, and knowing
the wind-speed, we can calculate the area dose (A.D. = x^t). The trap-
ping efficiency of any surface exposed to the spore-cloud in the wind-
tunnel can then be determined by estimating the number collected per
square centimetre of trap surface, and expressing it as per cent of the area
dose.
Liberation of one million Lycopodium* spores at a point on the central
axis of the tunnel produced a conical cloud. At a sampling point on the
central axis of the tunnel, 1-4 metres downwind, the area dose was about
4,500 spores per sq. cm. under turbulent condition at wind-speeds of
from 5-75 to 9*7 metre per sec. Under streamline conditions the dispersal
cone was visibly narrower and the area dose nearly double at these wind-
speeds. At i-i metre per sec, however, streamline conditions gave a much
lower area dose because the cloud was displaced downwards under
gravity. On the whole, efficiency of impaction was not much affected by
whether the flow was turbulent or streamlined.
IMPACTION ON CYLINDERS
The efficiency of impaction on vertical sticky cylinders is increased by
(i) increasing wind-speed; (2) increasing the mass of the particle (by
increase in size or density); and (3) decreasing the diameter of the cylinder
(except that large particles, such as Lycopodium spores, tend to blow off
narrow cylinders at high wind-speeds, whereas small spores, such as those
of Ustilago perennans, do not). As will be shown later, similar relations
hold for impaction on surfaces of other shapes, such as spheres, disks,
* Spores of Lycopodium clavatiim are convenient for experimental work. They can
be bought easily; they separate readily from one another when blown into the air.
They are not smooth spheres, but their mean diameter is about 32 /x, density 1-175,
and terminal velocity estimated as 1-76 to 2-14 cm. per sec; the number per gram is
9-39 to 9-4 X 10'.
62

7/30/2019 Microbiology of at 00 Greg
http://slidepdf.com/reader/full/microbiology-of-at-00-greg 89/286
DEPOSITION PROCESSES
Strips (ribbon) and—in the field—leaves, stems, and stigmas. The value
for E depends also on the shape. The order of decreasing efficiency is
probably: spheres, disks, cylinders, and strips (other conditions being
equal, including radius or half-width).
Wind-tunnel results confirm the conclusion of C. N. Davies &
Peetz (1956), that under extreme conditions efficiency of impaction can be
zero; for example the very small spores of the puff'ball, Lycoperdoti
(Calvatiii) giganteum, were not impacted undex any of the conditions
tested. The slightly larger spores of the smut fungus, Ustilago perennans,
however, showed appreciable efficiencies—but probably because they
often travel through the air in clumps which effectively behave as heavier
particles than their component single spores.
The deposit is not uniform over the cylinder, but is densest on the
part of the circumference projecting farthest forward into the wind; this
is the so-called 'stagnation line'. The density ofthe deposit falls off"towards
the sides of the cylinder, and there is a spore-free zone on the shoulders
where the air-flow is more or less tangential to the surface. Usually there
is no deposit at the back or downwind side of the cylinder, but with
LyCOpodium spores (32 /x diameter) a narrow line of deposit has been
observed down the back of cylinders of less than o-i cm. diameter at
wind-speeds of i metre per sec. or less. Deposit on the side opposite to the
oncoming wind is negligible or zero under most conditions tested. The
angle subtended by the deposit on the upwind side was less than 180° in
both turbulent and streamline air. Other things being equal, the angle
subtended at the centre of the cylinder by the deposit was increased by
increasing the wind-speed and by decreasing the cylinder diameter
increasing efficiency of the whole cylinder evidently runs parallel with
increase in the angle subtended by the deposit. The low efficiency of wide
cylinders and slow winds shows both as a narrower trace, and thinner
deposit per unit area.
The decrease of efficiency with increasing cylinder size was first
noticed in field tests. Per unit length, a large cylinder 12 cm. in diameter
may collect no more pollen grains or spores than a cylinder i cm. in
diameter, and per unit area of surface it may collect many fewer
(Gregory,195 1).
IMPACTION ON A ROTATING STICKY CYLINDER
Rotating the cylinder at a peripheral speed comparable with the wind-
speed would be expected to reduce the thickness of the boundary layer
on the surface, to induce the well-known Magnus effect, and to produce a
local rotation of air round the cylinder itself. It was not obvious whether
these eflfects would alter impaction efficiency.*
* This experiment was suggested by Mr. J. R. D. Francis, of the Civil Engineering
Department, Imperial College of Science and Technology. I am indebted to him for
advice and the loan of equipment for the tests, the results of which have not been
published hitherto.
63
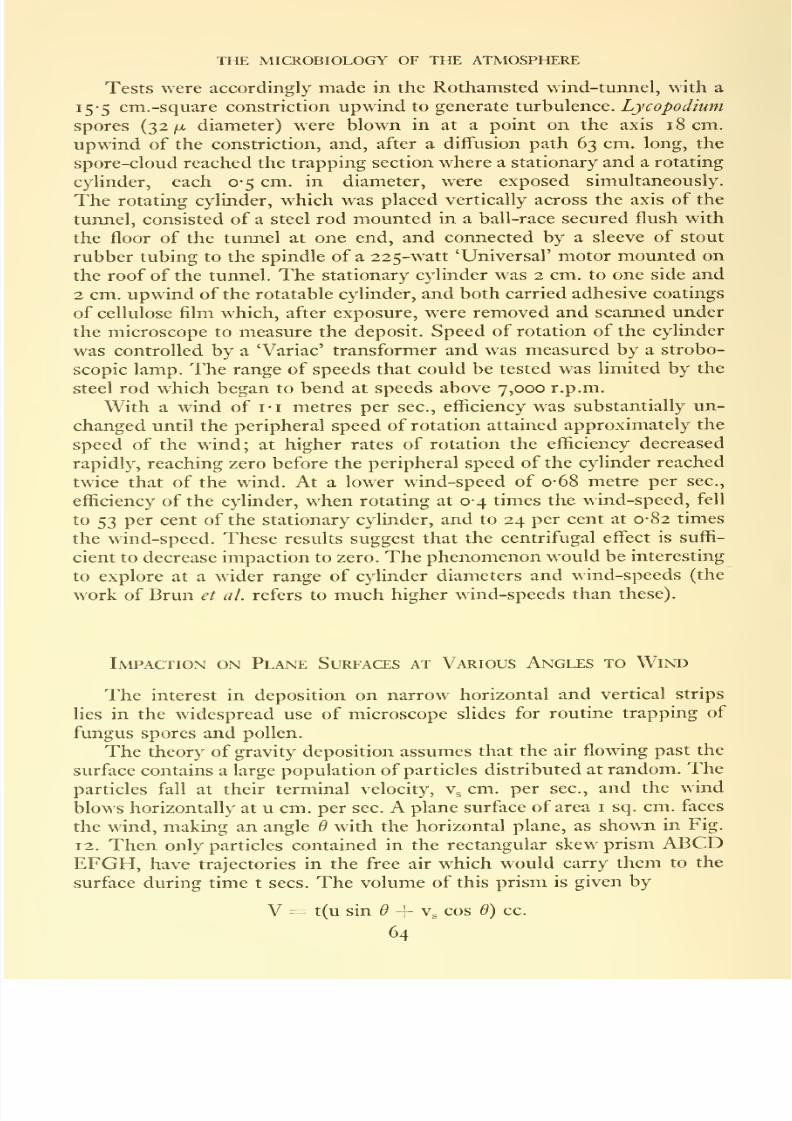
7/30/2019 Microbiology of at 00 Greg
http://slidepdf.com/reader/full/microbiology-of-at-00-greg 90/286
THE MICROBIOLOGY OF THE ATMOSPHERE
Tests were accordingly made in the Rothamsted wind-tunnel, with a
15-5 cm.-square constriction upwind to generate turbulence. Lycopodium
spores (32 ju- diameter) were blown in at a point on the axis 18 cm.
upwind of the constriction, and, after a diffusion path 63 cm. long, the
spore-cloud reached the trapping section where a stationary and a rotating
cylinder, each 0-5 cm. in diameter, were exposed simultaneously.
The rotating cylinder, which was placed vertically across the axis of the
tunnel, consisted of a steel rod mounted in a ball-race secured flush with
the floor of the tunnel at one end, and connected by a sleeve of stout
rubber tubing to the spindle of a 225-watt 'Universal' motor mounted on
the roof of the tunnel. The stationary cylinder was 2 cm. to one side and
2 cm. upwind of the rotatable cylinder, and both carried adhesive coatings
of cellulose film which, after exposure, were removed and scanned under
the microscope to measure the deposit. Speed of rotation of the cylinder
was controlled by a 'Variac' transformer and was measured by a strobo-
scopic lamp. The range of speeds that could be tested w as limited by the
steel rod which began to bend at speeds above 7,000 r.p.m.
With a wind of i-i metres per sec, efficiency was substantially un-
changed until the peripheral speed of rotation attained approximately the
speed of the wind; at higher rates of rotation the efficiency decreased
rapidly, reaching zero before the peripheral speed of the cylinder reached
twice that of the wind. At a lower wind-speed of o-68 metre per sec,
efficiency of the cylinder, when rotating at 0-4 times the wind-speed, fell
to 53 per cent of the stationary cylinder, and to 24 per cent at 0-82 times
the wind-speed. These results suggest that the centrifugal effect is suffi-
cient to decrease impaction to zero. The phenomenon would be interesting
to explore at a wider range of cylinder diameters and wind-speeds (the
work of Brun et al. refers to much higher wind-speeds than these).
Impaction on Plane Surfaces at Various Angles to Wind
The interest in deposition on narrow horizontal and vertical strips
lies in the widespread use of microscope slides for routine trapping of
fungus spores and pollen.
The theory of gravity deposition assumes that the air flowing past the
surface contains a large population of particles distributed at random. The
particles fall at their terminal velocity, v^ cm. per sec, and the wind
blows horizontally at u cm. per sec. A plane surface of area i sq. cm. faces
the wind, making an angle d with the horizontal plane, as shown in Fig.
12. Then only particles contained in the rectangular skew prism ABCD
EFGH, have trajectories in the free air which would carry them to the
surface during time t sees. The volume of this prism is given by
V = t(u sin d + V, cos 9) cc.
64

7/30/2019 Microbiology of at 00 Greg
http://slidepdf.com/reader/full/microbiology-of-at-00-greg 91/286
DEPOSITION PROCESSES
If ^ = 90°, then Vs cos ^ = o, and hence the number of particles with
trajectories cutting a vertical surface should be independent of the ter-
minal velocity of the particles but will depend on the wind-run. (Deposi-
tion will in practice be reduced below this value because the air-stream
is deflected by the surface itself, and efficiency of collection depends on u
(Langmuir & Blodgett, 1949; Gregory, 195 1).)
D>
F

7/30/2019 Microbiology of at 00 Greg
http://slidepdf.com/reader/full/microbiology-of-at-00-greg 92/286
£%
100
Presentation angle
,o -,50 30^
Fig. 13.—Efficiency of deposition of Lycopodium spores on zones across glass
microscope slide at presentation angles from (left side of left-hand figure) to 90(right side of right-hand figure) degrees as observed in wind-tunnel experiments.
F% = efficiency as percentage area dose; A, B, C, D, E = successive half-centimetre
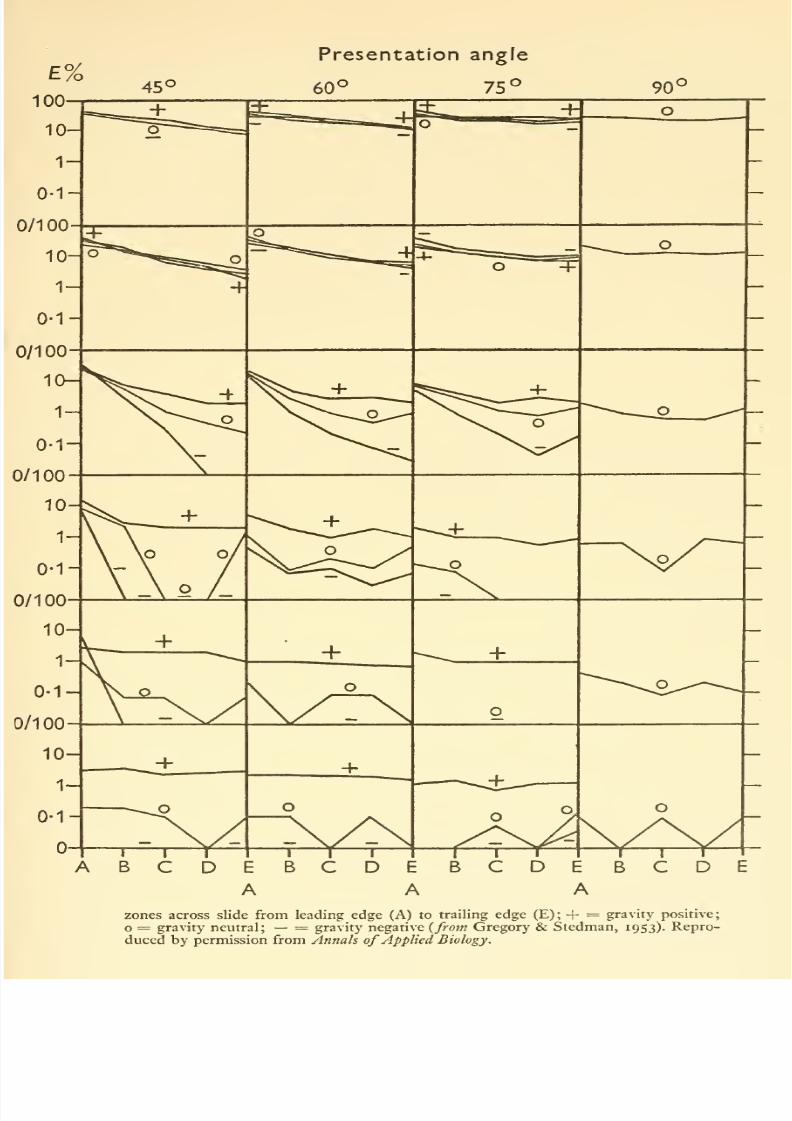
7/30/2019 Microbiology of at 00 Greg
http://slidepdf.com/reader/full/microbiology-of-at-00-greg 93/286
£%45°
Presentation angle
60° 75°
zones across slide from leading edge (A) to trailing edge (E); + = gravity positive;
o = gravity neutral; — = gravity negative {from Gregory & Stedman, 1953). Repro-
duced by permission from Annals ofApplied Biology.

7/30/2019 Microbiology of at 00 Greg
http://slidepdf.com/reader/full/microbiology-of-at-00-greg 94/286
THE MICROBIOLOGY OF THE ATMOSPHERE
edge; and 90° at right-angles to the wind. (Presentation angle so defined
differs from the aeronautical 'angle of incidence' in which at 45°, for
example, the leading edge is higher than the trailing edge.)
The effect of gravity was studied in two sets of experiments. In oneset, with the long axis of the slide vertical (parallel with the z-axis) and the
surface making various angles with the x, z-plane, the effect of gravity on
deposition must be neutral. In the other set, with the long axis of the
slide horizontal (parallel with the y-axis) and the surface making various
angles with the x, y-plane, the effect of gravity must be positive at angles
from 0° up to less than 90°, neutral at 90°, and negative at angles greater
than 90° and up to 180° (gravity condition denoted by g+, go, and g_,
respectively). Angles greater than 180° represent the back of the slide.
Preliminary tests showed that trapping efficiency varied in different
parts of the slide. Accordingly the slide was divided into five |-cm. zones,
denoted : A, B, C, D, and E, respectively, from the leading to the trailing
edge (Fig. 13).
Results of the main series of tests are plotted in Fig. 13, where the
efficiency of deposition expected on the gravity theory at 0° for each wind-
speed, taking Vs for Lycopodium as 1-76 cm. per sec, is indicated by dotted
lines. The observed values below E = o-i per cent are unreliable, but
are given to show the trend. Values below E = o-oi per cent, including
zero, are all plotted as o-oi per cent as they cannot reasonably be dis-
tinguished with the data available.
The curves obtained probably result from the interaction of several
deposition mechanisms: sedimentation, impaction, turbulence, and edge
effects. In certain sets of conditions, one or other of the mechanisms can
be found acting singly; but for the most part deposition is interpreted as
resulting from the simultaneous action of several mechanisms.
DEPOSITION ON HORIZONTAL SLIDES
(i) Deposition by sedimentation^ under the influence of gravity alone,
is seen on the upper surface of a horizontal slide at the lowest wind-speed
tested (conditions denoted by: 0°, 0-5 metres per sec, g+). Here deposition
over the slide as a whole was very close to the expected value predicted
by the gravity theory (E = Vs/u X 100 = 1*76/50 X 100 = 3-5 per
cent), but even at this low wind-speed the bluff edge of the slide, 1-3 mm.
thick, caused some edge shadow, shown as a reduced deposition just
behind the leading (upwind) edge. That deposition was solely caused by
gravity is shown by the absence of deposit on the underside of the hori-
zontal slide, and on either side of a vertical slide held parallel with the
wind (0°, 05 metres per sec, g_, and go).
At the wind-speeds more usual outdoors of between i-o and 2-0
metres per sec, a surprising effect developed in these wind-tunnel
experiments. With gravity positive, the bluffedge of the slide produced an
edge shadow deflecting a large proportion of the approaching spores;
68

7/30/2019 Microbiology of at 00 Greg
http://slidepdf.com/reader/full/microbiology-of-at-00-greg 95/286
DEPOSITION PROCESSES
at I • I metres per sec. the part of the surface behind the leading edge was
almost free from deposit, and efficiency reached about 50 per cent of the
expected value only on the rearmost zone. At 1-7 metres per sec. efficiency
was almost zero over the whole slide. With gravity neutral or negative,
efficiencies were also almost zero.
(ii) Turbulent deposition. As the wind-speed was raised still further, the
efficiency of the horizontal slide recovered ; but deposition cannot have
been due to gravity sedimentation, because at 9-5 metres per sec. the
amount deposited was almost the same on the under-side (g_) as on the
upper-side (g^) of a horizontal slide, and also on the two sides of a vertical
slide held parallel with the wind (go). At this speed turbulent deposition
is seen in its almost pure condition. As indicated below, there is some
evidence that this deposition may result from turbulence generated by
the bluff edge of the slide itself.
At 0° (horizontal slide) and higher wind-speeds, although deposition
was turbulent, gTaviry appeared to interact with the process in some way
that is at present obscure. With gravity neutral (go) and wind-speeds of
57 and 9-5 metres per sec, deposition was higher at the leading and trailing
edges than in the middle of the slide. With gravity negative (g_) at 9-5
metre per sec, however, the leading edge showed an anomaly, having a
deposit 8 to 10 times that found with gravity positive. With gravity
negative at 57 and 3-2 metres per sec, deposition behind the leading edge
was negligible.
DEPOSITION OF Lycopodium spores on inclined plane surfaces
Deposition on a horizontal microscope slide is best regarded as a
special case of deposition on an inclined plane with the presentation angle
0°. A number of possible angles ranging from 0°, through 90° (vertical
slide) to 180°, were tested in the turbulent wind-tunnel, and results are
also sho\Mi on Fig. 13.
(i) Impaction. Deposition by impaction should be zero at 0°, but it
would be expected to occur to some extent at all other presentation angles,
as at these angles the surface subtends the oncoming air-stream. With the
slide vertical (90°), the gravity effect should be neutral, and at low wind-
speeds of 0-5 to I- 1 metres per sec. the slide would not be expected to
generate turbulence. Deposition under these conditions should be due to
impaction only. In the tests, as wind-speed was increased (90°, 17 to
9-5 metres per sec), deposition increased over the whole surface and was
more uniformly distributed; but even at the highest speed tested the
deposit at the margin exceeded that at the middle. In this respect im-
paction on a plane surface contrasts strikingly with that on cylinders,
where the centre of the trace is always denser than the edges.
(ii) Edge drift. The effect of the bluff edge of the slide in 'shading' the
leading edge has been referred to above. Behind the edge shadow, a
region of greater deposition caused by an edge drift might be expected.
69

7/30/2019 Microbiology of at 00 Greg
http://slidepdf.com/reader/full/microbiology-of-at-00-greg 96/286
THE MICROBIOLOGY OF THE ATMOSPHERE
Fig. 13 shows that at 0° this edge drift fell behind the trailing edge, but
that when the shde was inclined at 15° or 30° to the wind, the edge drift
impacted on the slide. This is shown by the deposit on the leading edge
which greatly exceeded the expected value over the range 15° to 60°,
1-7 to 9-5 metres per sec.
(iii) Mixed ejfects. Over most of the range of zones, presentation angles
and wind-speeds, the deposition was from a mixture of two or more
mechanisms whose relative importance can be roughly assessed from the
empirical results shown in Fig. 13.
90'-'
Presentation angle
135° '\l-1m./sec.
Fig. 14.—Mean efficiency of deposition of Lycopodium spores on glass microscope
slide (all zones) at presentation angles of o° to i8o°. E = efficiency as percentage area dose
(Gregory & Stedman, 1953). Reproduced by permission from Annals ofApplied Biology.
MEAN DEPOSIT ON INCLINED SLIDES
In the foregoing paragraphs, efficiencies of various arrangements of
a microscope slide, acting under different conditions as a spore trap, have
been measured and interpreted in terms of different deposition mechan-
isms acting on different surface zones of the slide. In practice, when
scanning a slide (or Petri dish trap), we usually need a mean value of
efficiency for the whole sampling area. Mean efficiencies for a microscope
slide with its long axis parallel to the y-axis, orientated at different presen-
tation angles to the x, y-plane (i.e. g+, or g_), are given in Fig. 14. They
are taken from the same results as were used in the preceding figure. Eachpoint of Fig. 14 represents values obtained in from one to eight experi-
ments.
70

7/30/2019 Microbiology of at 00 Greg
http://slidepdf.com/reader/full/microbiology-of-at-00-greg 97/286
DEPOSITION PROCESSES
The values used for Fig. 14 were obtained with highly turbulent
wind. Partially streamlining the flow, by removing the turbulence-generat-
ing obstruction from the tunnel, had little effect on the deposit—except
with presentation angles between 0° and 10°, and with wind-speeds below
5 metres per sec, when efficiency of deposition was reduced, being least
with the horizontal slide (0°).
Efficiency of deposition on the back of the microscope slide was usually
less than i per cent.
Decreasing the width of the slide from the customary 2-5 to a mere
0-5 cm., increased efficiency most at the lowest wind-speeds. This narrow
trap was most efficient at 5-5 metres per sec. and 90° presentation angle
(vertical), and a fall in efficiency at 9-5 metres per sec. and 90° was com-parable with the anomalous reduction in efficiency with very narrow
cylinders at higher wind-speeds (Gregory, 1951).
TABLE IX
EFFICIENCY (E %) OF DEPOSITION ON INCLINED SLIDES IN TURBULENT
wiNTD-TUNNEL (Gregory & Stedman, unpublished)
Presentation
7/30/2019 Microbiology of at 00 Greg
http://slidepdf.com/reader/full/microbiology-of-at-00-greg 98/286
THE MICROBIOLOGY OF THE ATMOSPHERE
may be said that impaction efficiency on a microscope slide held at right-
angles to the wind is low, but might be as high as 25 per cent with grass
pollen or rust uredospores in winds of 9 metres per sec.
EFFECT OF THICKNESS OF SLIDE
Deposition on a horizontal or inclined surface is evidently complex
and may be disturbed by edge shadowing. Tests were therefore made with
both thicker and thinner slides, and with thick plates, 10 cm. wide,
having a double-bevelled edge.
With a horizontal plate 6-4 mm. thick, the edge-effect was present,
and at medium wind-speeds edge-shadow became pronounced. At i-i
metres per sec. nearly the whole surface was in the shadow of the leading
edge, and at 3-2 and 5-5 metres per sec. there was almost no deposit on the
slide. At 9*5 metres per sec, however, there was some turbulent deposition
on both upper and lower surfaces, both in the turbulent and streamlined
wind-tunnel.
When the leading edge of the plate, 6-4 mm. thick, was sharpened with
a double bevel to form a 45° edge facing the wind (as used by Landahl
& Herrmann, 1949), a very different effect was observed. In a wind of 0-5
metres per sec. there was a very even deposit over the whole upper
surface, but at i • i metres per sec. an edge-shadow developed and spread
across the whole surface as the wind-speed increased, until at 5-7 metre
per sec. deposition was negligible. There was no recovery by turbulent
deposition at higher wind-speeds, and at 9-5 metres per sec. the thick,
bevelled trap under-estimated spore concentration by a factor of 200
times.
Thin horizontal surfaces, on the contrary, gave efficiencies much
nearer to the expected values for gravity sedimentation. However, edge-
shadow and turbulent deposition occurred—even with an edge o-oi6 cm.
thick (a microscope cover-glass). A double-edged 'wafer' safety razor-
blade gave uniform deposits on the upper surface, which were close to
expected values—except at 9-5 metres per sec, where the deposit was
three times that expected.
ORIENTATION OF SPORES
Lycopodiuni spores showed different orientations in different parts of
the deposit. Gregory (1951) stated that, on the stagnation zone upwind of
a vertical cylinder, the spores lie with the rounded distal surface uppermost,
and that spores settling in air under the influence of gravity come to rest
in the same position. Further observation shows that this contention was
incorrect, and that in the stagnation zone or its equivalent the spore lies
with the rounded distal surface touching the sticky cylinder. Evidently the
spore becomes orientated with the pointtrailing
asit
moves through theair. Orientation with the point upwind is therefore characteristic of
Lycopodiuni in the stagnation zone.
72

7/30/2019 Microbiology of at 00 Greg
http://slidepdf.com/reader/full/microbiology-of-at-00-greg 99/286
DEPOSITION PROCESSES
Microscopic observation of deposits showed that, as was expected,
when the glass slide was horizontal the stagnation zone was on the edge,
and when the slide was vertical this zone was in the middle of the slide.
At intermediate presentation angles, seen most clearly at angles near 90°,
the stagnation zone shifted, at 115° occupying zone B, and reaching zone
A at about 120° at the higher wind-speeds. At lower wind-speeds, orien-
tation was less definite.
Deposition on 9 cm. Diameter Petri Dish
The Petri dishtrap,
extensively usedin aerobiological
mouldsurveys,
was tested horizontally after pouring with 1 5 cc. of 2 per cent water agar
(tests showed that deposition and retention on this medium were similar
to those on glycerine jelly). Mean deposition efficiencies (per cent A.D.)
for I cm. square zones on the agar surface are given by Gregory & Sted-
man (1953). At all wind-speeds, narrow edge drifts occurred behind the
rim of the leading edge and in front of the rim of the trailing edge.
Efficiency at 0-5 metres per sec. was low, but at i-i and 1-7 metres per sec.
efficiency was high, apparently because of the large contribution to the
total made by the front and back edge drifts. At 3-2 metres per sec. and
above, efficiency fell off substantially below expectation—apparently
because the sampling surface was almost entirely shadowed by the i cm.
high rim of the dish. Efficiencies were somewhat higher at 9-5 metres
per sec.
Effects produced by the rim of the Petri dish were nearly eliminated
by placing the dish at the bottom of a metal cylinder 13 cm. deep and
11-5 cm. in diameter, sunk below a horizontal flat surface consisting of a
square cardboard platform cutting the central axis of the wind-tunnel.
The cardboard fitted flush with the mouth of the cylinder and extended
1 1 cm. up- and downwind.
The Petri dish was also tested in a vertical position. At 9-4 and 5-5
metres per sec, the deposit was four times as great in the central zone of
2*5 cm. radius as it was in the peripheral centimetre around the rim. At,
and below, 3-2 metres per sec. the difference was reversed, with nearly
75 per cent more spores just insids the rim of the dish than elsewhere.
Retention and Blow-off From Clean Surfaces
Experiments showed that there is no appreciable loss of Lycopodium
spores from the deposit on the surface of a slide with a sticky coating of
glycerine jelly at any of the wind-speeds tested. Blow-off from a non-
sticky glass surface, however, depended on the wind-speed and the angleof incidence of the wind. Clean microscope slides were placed in a spore-
cloud at 0-5 metres per sec. to obtain a deposit, and were then placed
73

7/30/2019 Microbiology of at 00 Greg
http://slidepdf.com/reader/full/microbiology-of-at-00-greg 100/286
THE MICROBIOLOGY OF THE ATMOSPHERE
successively in winds of increasing speeds. Tests were made at angles of
0°, 45°, and 90°. The percentage of the original deposit that was retained
after i minute at each wind-speed was estimated by counting. At the
highest wind-speed, 9-5 metres per sec,slight traces of grease
onthe
slide greatly increased retention when the slide was horizontal, and,
unless the surface was carefully cleaned before use, erratic results were
obtained under these conditions.
With the slide vertical (90°), blow-off was nearly linear with wind-
speed, 98 per cent being retained at i-i metres per sec, and 60 per cent
at 9-5 metres per sec. Blow-off was least at 45°, and at this angle retention
was 100 per cent at wind-speeds up to 5-5 metres per sec, and 95 per cent
was retained even at 9-5 metres per sec. By contrast, blow-off was greatest
with the surface horizontal (0°), when 77 per cent was retained at 1-7
metres per sec, and only 26 per cent at 9-5 metres per sec. These results
illustrate the way the laminar boundary layer acts as a dust trap (p. 25),
but the actual values probably have little application to plant surfaces.
Deposition and Retention on Potato and Bean Leaves
The tests described in the preceding sections were all on artificial
surfaces, approaching ideal conditions, and gave information on principles
of particle deposition from air. This is useful in devising apparatus for
sampling airborne particles. We now need to ask how relevant this work
is to spore deposition on plant surfaces, especially on leaves which, though
rough, are not particularly sticky, and which flap in the wind.
To imitate natural conditions, shoots of potato {Solanimi tuberosum)
with rough leaves, and broad bean {Vicia faha) with smooth leaves, were
placed in the turbulent wind-tunnel and exposed to clouds ofLycopodium
spores in the usual manner. The petiole of the leaf was clamped and the
leaflets allowed to flap freely, trailing the leaf-tip downwind. After ex-
posure, the leaf surfaces were examined under the microscope and the
deposit w^as counted on zones across the tip, middle, and base of the
lamina (upper and lower surfaces), the deposition efficiency being calcu-
lated (Table X).
Considerable differences from deposition on a rigid, sticky horizontal
slide are apparent. Turbulent deposition either fliiled to develop at the
higher wind-speeds, or the spores were shaken off again in the wind.
Deposit on the undersides of the leaves was small at all wind-speeds, but
on the upper side it was up to 5 per cent of area dose at winds of 0-5
to i-o metres per sec—both on potato leaves and on the still smoother
broad-bean leaves. At low wind-speeds the deposit w^as similar to that
expected from sedimentation under the influence of gravity; but potato
leaves had more spores at the base, and broad-bean leaflets had more at
the tip.
74

7/30/2019 Microbiology of at 00 Greg
http://slidepdf.com/reader/full/microbiology-of-at-00-greg 101/286
DEPOSITION PROCESSES
TABLE X
EFFICIENCY (E %) OF DEPOSITION OF LycopodiwH SPORES ON UPPER AND
LOWER SURFACES OF POTATO AND BROAD-BEAN LEAFLETS IN TURBULENT
WIND-TUNNEL (Gregory & Stedman, unpublished)
Wind velocity (metres/sec.)
Part of leaf

7/30/2019 Microbiology of at 00 Greg
http://slidepdf.com/reader/full/microbiology-of-at-00-greg 102/286
H
^OODSHOLE,MASS.^
VII
NATURAL DEPOSITION
Having become airborne and been transported by the wind, the spore
must quit the turbulent layers ofthe atmosphere and re-cross the boundarylayer before coming to rest in the still layer of air on a solid or liquid
surface, which may or may not prove favourable to growth. Some char-
acters of spores seem to have been evolved in response to problems of
take-off, while others may well have been evolved as adaptations for
deposition.
Little was known about deposition processes until the development of
wind-tunnel techniques—originally for research in aerodynamics
made it possible to experiment on the behaviour of spores in controlled
winds in the laboratory. The principal methods of spore deposition
in nature can now be tentatively suggested: impaction, sedimentation,
boundary-layer exchange, turbulent deposition, rain-washing, and electro-
static deposition.
Measurement of Deposition
The relation between x, the cloud concentration, and 'd', the surface
deposition, has been little studied, although it is a relation of considerable
biological importance—for instance in pollination, and in epidemics of
plant diseases and their control by protectant dusts and sprays. With wind
flowing across a smooth surface, it would be possible to calculate deposition
directly from a knowledge of concentration, wind-speed, and terminal
velocity. However, it is not clear what factors dominate the situation under
the complex conditions obtaining in nature, and so the problem must be
approached experimentally. With some insight, obtained from Chapter
VI, into deposition under relatively simple conditions in a wind-tunnel,
we can better understand the complex factors of deposition in nature.
In wind-tunnel studies, and in calibrating spore-traps, it is convenient to
use percentage efficiency of deposition, E = (Trap dose/Area dose)
X 100.
For field conditions, two expressions have been used for deposition
on the ground. The 'deposition coefficient', p = d/n (where 'd' = num-
ber of spores deposited per sq. cm. of surface, and 'n' = number sus-
pended per cc. of air), measures the thickness of the slice of cloud cleared
while travelling over unit length of ground surface (Gregory, 1945).
76

7/30/2019 Microbiology of at 00 Greg
http://slidepdf.com/reader/full/microbiology-of-at-00-greg 103/286
NATURAL DEPOSITION
Under a given set of conditions, p is assumed to depend only on concentra-
tion, though we do not yet know how it is affected by wind-speed, tur-
bulence and other factors. The 'velocity of deposition', introduced by
Chamberlain (1956), was defined as
amount deposited per sq. cm. of surface per second
^volumetric concentration per cc. above surface
If p is assumed to be independent of wind-speed, it will be apparent
that, in our notation,
P = Vg/u.
MEASUREMENT OF DEPOSITION COEFFICIENT, 'p'.
The first attempt to evaluate p by Gregory (1945) was based on experi-
ments by Stepanov (1935), whose results were tested against Sutton's
(1932) eddy-diffusion theory.
Sutton's formulae had been developed for calculating the concentra-
tion ofa cloud of particles whose deposition was negligible—the number of
particles in the cloud, Q^q, remaining constant throughout the diffusion.
In our problem, although the effect of gravity on dispersion has been
neglected, the quantity of spores remaining in suspension is steadily
diminishing owing to a relatively large deposition from that part of the
cloud which is in contact with the ground, so that Q^^, the total quantity
remaining in the cloud when its centre has moved to a distance x, is less
than the original Q^q. It has been showTi* that Q^x"^ill decrease exponenti-
ally with increasing distance, according to the equation
:
,(l-*m)
Clx=Q.oexp.2px*
Virr) C(I - |m)_
Values of Q^^ ^^d d for two values of the parameter m have been
calculated, and it is now possible to test the theory against Stepanov's
results. In each of his experiments the total number of spores liberated
differed, so that the data had first to be put on a comparable basis by
equating the mean deposition, d, at 5 metres, to 100 per cent, and then
expressing the deposition observed at greater distances by relative
percentages. The logarithms of the observed relative depositions were
plotted against the logarithms of the distances in centimetres. The ex-
pected depositions when p = 0-05, 0-025, and zero, respectively, were also
plotted, and the line calculated for p = 0-05 was seen to approach most
clearly to the observed values (Gregory, 1945). A deposition coefficient of
p = 0-05 means that, in travelling across i sq. cm. of surface, the entire
cloud would deposit a quantity of spores approximately equivalent to
the number contained in a slice half-a-millimetre thick through the
axial plane of the cloud. This value of p was estimated from experiments
in winds of about i metre per sec.
* By Margaret F. Gregory {see Appendix in Gregory, 1945).
77
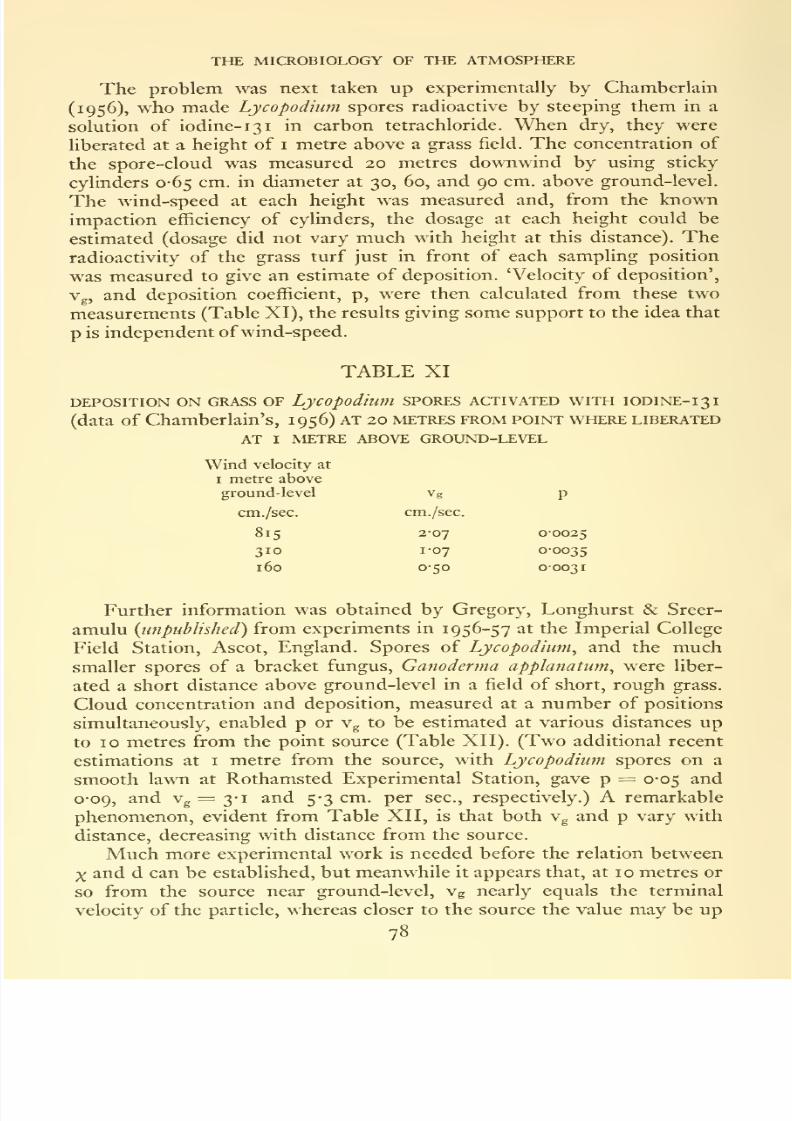
7/30/2019 Microbiology of at 00 Greg
http://slidepdf.com/reader/full/microbiology-of-at-00-greg 104/286
THE MICROBIOLOGY OF THE ATMOSPHERE
The problem was next taken up experimentally by Chamberlain
(1956), who made Lycopodhim spores radioactive by steeping them in a
solution of iodine-131 in carbon tetrachloride. When dry, they were
liberated at a height of i metre above a grass field. The concentration of
the spore-cloud was measured 20 metres downwind by using sticky
cylinders 0-65 cm. in diameter at 30, 60, and 90 cm, above ground-level.
The wind-speed at each height was measured and, from the known
impaction efficiency of cylinders, the dosage at each height could be
estimated (dosage did not vary much with height at this distance). The
radioactivity of the grass turf just in front of each sampling position
was measured to give an estimate of deposition. 'Velocity of deposition',
Vg, and deposition coefficient, p, were then calculated from these two
measurements (Table XI), the results giving some support to the idea that
p is independent of wind-speed.
TABLE XI
DEPOSITION ON GRASS OF LyCOpodiuTll SPORES ACTIVATED WITH IODINE-131
(data of Chamberlain's, 1956) AT 20 metres from point where liberated
AT I metre above GROUND-LEVEL
Wind velocity at
I metre above

7/30/2019 Microbiology of at 00 Greg
http://slidepdf.com/reader/full/microbiology-of-at-00-greg 105/286
NATURAL DEPOSITION
TABLE XII
DEPOSITION OF SPORES ON GROUND, FROM SIMULTANEOUS MEASUREMENTS
OF
X
AND d BY VISUAL COUNTS UNDER MICROSCOPE.
(Gregory, Longhurst & Sreeramulu, unpublished)
Distance from source
Meanwind- 2-5 m. S'O m. lo-om. 20-0 m.
speed p Vg p vg p Vg p Vf
Height of
liberation
Lycopodium spores
i-o metre 1-98
0-83
0-62
0-40
0-25 metre 1-28
i-io
1-09
Mean:
Ganoderma spores
0-25 metre 1-70
0-91
076o-6i
Mean:
o-oi
0-02
0-44
0-05
0-07
0-13
0-12
0-022
0-015
0-014
0-017
cm. /sec.
2-3
1-2
17-6
6-9
7-2
1378-16
1-97
I-I3
0-83
1-31
0-02
0-05
0-09
0-05
0-03
O-OI
0-04
0-042
1-5 m.
0-006
0-006
o-oio
0-007
cm./sec.
3-6
3-8
5-5
2-1
4-4
1-5
4-5
3-64
0-56
0-43
0-61
0-S3
cm./sec.
0-02
0-06
0-050-02
0-02
0-02
0-02
0-029
2-5 m.
0-003
0-005
0-003
0-006
0-004
3-4
5-1
2-9
i-o
2-7
1-7
1-8
2-8
0-44
0-46
0-24
0-34
0-37
0-03
0-03
5-0 m.
0-0008
0-004
o-ooi
0-005
0-003
cm./sec.
1-7
1-7
0-14
0-34
0-08
0-29
0-21
Summary
Lycopodium
c. 32 \x. dia.
va = 1-76 cm./sec.
Ganoderma
<r. 10 X 6 /x
vi = o-i8 cm./sec.
Mean of all values
P Vg
0-057
0-007
4-35
0-56
Mean at selected distance
Vg
2-7 at 10 metresP
0-03
0-004 0-37 at 5 metres
to 5 times as great. (On theoretical grounds, Schrodter (1954, i960)deduced that the 'probable final velocity' of a spore is halfxht terminal
velocit}'.) For a deposition theory based on sedimentation under the
influence of gravity, it seems reasonable to accept observed terminal
velocities of the particles as measuring their velocity towards the ground
but for a ground-level source, allowance will have to be made for excep-
tionally large deposition during the first few metres of travel. Data are
not sufficiently extensive to bar the use of the coefficient of deposition,
p, which assumes that, for a particle of given size, the deposition dependson the distance travelled, rather than on the time taken to travel that
distance. If p turns out to be independent of wind-speed, the parameters
p and Vg would stand contrasted in a manner recalling the different
treatments of a by Schmidt and Sutton (Chapter V).
Ground deposition conforms better to a sedimentation theory than
does deposition on the horizontal microscope slide in the wind-tunnel
recorded in Chapter VI. For comparison with ground deposition. Table
XIII shows wind-tunnel values, calculated in terms of p and Vg, for
deposition on a horizontal slide.
79
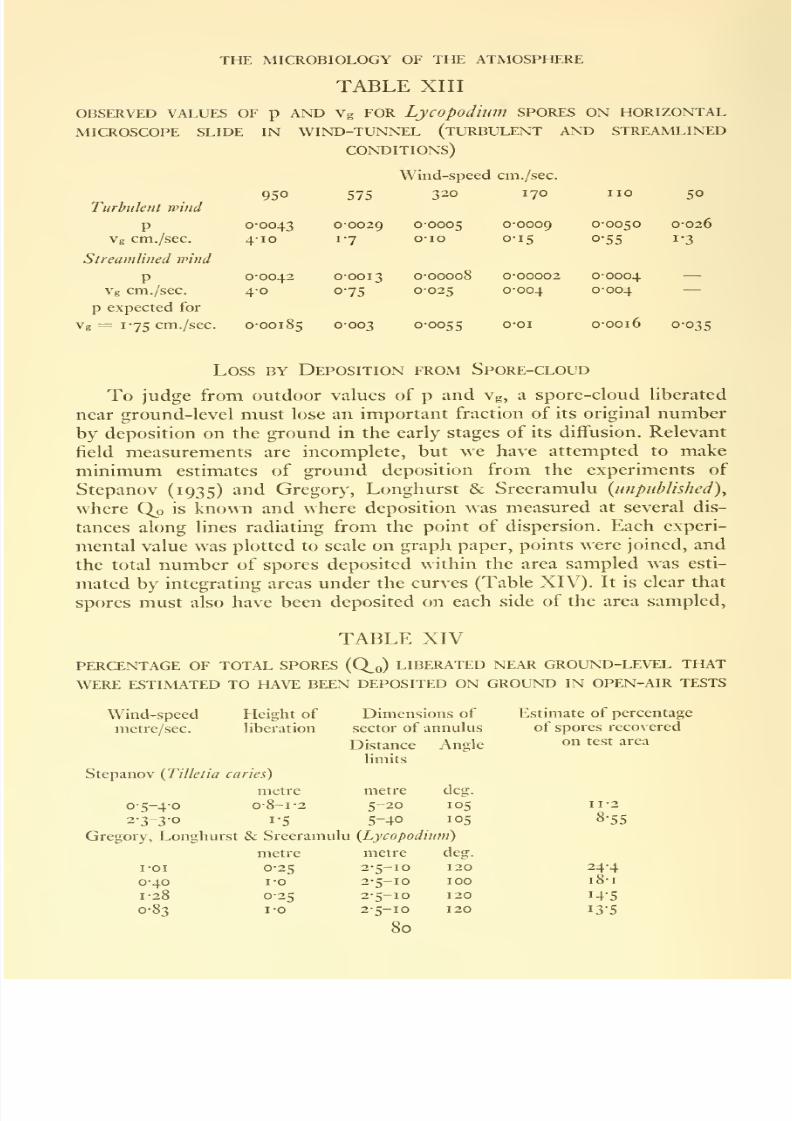
7/30/2019 Microbiology of at 00 Greg
http://slidepdf.com/reader/full/microbiology-of-at-00-greg 106/286
THE MICROBIOLOGY OF THE ATMOSPHERE
TABLE XIII
OBSERVED VALUES OF p AND Vg FOR Lycopodmil SPORES ON HORIZONTAL
microscope slide in wind-tunnel (turbulent and streamlined
conditions)
Wind-speed cm./sec.
950 575 320 170 50
Turbulent wind

7/30/2019 Microbiology of at 00 Greg
http://slidepdf.com/reader/full/microbiology-of-at-00-greg 107/286
NATURAL DEPOSITION
and the values are therefore underestimates; they were made without
extrapolation, except that, where the number of radii on each side of the
axis of dispersion was unequal, a symmetrical dispersion was assumed.
With liberation at 0-25 m. above ground-level, from 14to
24 per cent ofthe spores liberated were deposited within 10 metres' radius in winds of
little over i m. per sec.
Deposition Mechanisms Outdoors
boundary-layer exchange
Observations on deposition out-of-doors are still meagre, but values
for Vg obtained withplant spores of two widely different sizes and fall
velocities, Lycopodium clavatum (1-75 cm. per sec.) and Ganodenna
applanatum (o-i8 cm. per sec), suggest the following picture of deposition.
Deposition on the ground tends to remove spores from the base of the
cloud. The concentration of the cloud near ground-level is then restored
by diffusion—either horizontal diffusion from a near-by source, or down-
ward vertical diffusion from a reservoir of particles overhead, when the
atmosphere itself is acting as a source. Diffusion thus brings particles
do\NTi to the boundary layer, and here they settle-out mainly undergravity. This is why, when Vg is estimated from x as measured just above
ground-level, it numerically approaches the Stokesian terminal velocity.
This process which has been called 'boundary layer exchange', continually
replenishes the ground layer of still air in which even minute spores can
sediment-out.
The demarcation between the laminar surface layer and the turbulent
wind-stream is not sharp. From time to time, spore-bearing eddies break
into the laminar layer which is being cleared by sedimentation, removingspore-free air and leaving, in exchange, small volumes of spore-laden
air. These spores sediment at terminal velocit}' under the influence of
gravity and are soon out of reach of further eddies. In boundary-layer
exchange, turbulence has a great effect in bringing spores down to the
layer where they can slowly sediment under the influence of gravity.
sedimentation
As we have seen, the effect of gravity is usually negligible on vertical
distribution in the atmosphere. Still air, as T\Tidall (1881) found long
ago, soon becomes purified because microbes settle out from it under
gravity'—a process which we call sedimentation. Out-of-doors the air
is almost never still—except within about a millimetre of the surface.
In the turbulent air-layer above the ground, the effects of gravity are
slight and difficult to demonstrate; but Rempe (1937) demonstrated
gravitational effects with tree pollen near Gottingen {see above^ p. 21).
Under stable conditions on clear nights, when air at ground-level is
cooled by radiation, the laminar layer may extend to a height of several
F 81

7/30/2019 Microbiology of at 00 Greg
http://slidepdf.com/reader/full/microbiology-of-at-00-greg 108/286
THE MICROBIOLOGY OF THE ATMOSPHERE
metres. This zone may be nearly cleared of pollen by sedimentation,
while above it a much larger spore and pollen concentration may be
retained in the turbulent layer.
Sedimentation,we may therefore suppose,
is
only noticeable in thelaminar layer which normally extends only a few millimetres above the
surface but, under exceptional conditions at night, may reach several
metres. Wind-tunnel experiments confirm that the effect of sedimentation
is slight at wind-speeds of 2 m. per sec. and upwards.
IMPACTION
When a small surface, such as that of a leaf or twig, projects into the
wind, spores may be deposited by impaction on its windward side. Wind-tunnel experiments confirm that impaction is inefficient when small
spores approach large obstructions at low wind-speeds. Conversely,
impaction is more efficient when large spores are blown towards small
objects at high wind-speeds. So it seems that large spores, in addition
to carrying a bigger food reserve, have the advantage of a favourable size
for impaction on surfaces. Dry-spored, airborne leaf-pathogens usually
have comparatively large spores (e.g. uredospores, aecidiospores, Phyto-
phthora^ Helmifithosporium^ etc.).
On the other hand, dry-spored soil inhabitants are characterized by
small spores, unsuitable for impaction (e.g. Penicillium and Aspergillus).
Among vegetation, where the wind-speed normally reaches an upper
limit of about 2 metres per sec, spores of Lycoperdon perlatum 4-5 /x in
diameter would not be impacted at all, even on objects as narrow as
I mm. ; and it can be calculated that spores of this size would require a
wind of about 25 metres per sec. to be impacted with only 10 per cent
efficiency on a blade of grass. Evidently we must look to processes other
than impaction to deposit minute spores such as those of puffballs, earth-
stars, Ustilago^ and the common moulds. The loose smuts of cereals,
Ustilago spp., with spores in the 7-9 n range, would not be impacted
efficiently on leaves and stems ; but on narrow surfaces such as glumes and
stigmas of grasses, they would be expected to reach an efficiency as high
as 50-75 per cent.
Agaricus {Psalliota) campestris has spores of about 7 X 6 |U, which
should be near the low^er limit of size for impaction on grass leaves and
stems, at the limiting wind-speed in closed vegetation of about 2 metres
per sec. Uredospores o^ Puccinia graminis and conidia oi Erysiphe graminis
would impact on a leaf of wheat with efficiences near 40-60 per cent.
Botrytis polyblastis^ a leaf pathogen of Narcissus, with spores up to 90 fji
diameter, comes into the same group of pathogens that are relatively
efficiently impacted on leaves and stems.
The difficult problem of impaction on objects as wide as the trunk of
a tree seems to have been solved by some of the lichens. Pertusaria
pertusa, as I have myself observed, can shoot single ascospores, measuring
82

7/30/2019 Microbiology of at 00 Greg
http://slidepdf.com/reader/full/microbiology-of-at-00-greg 109/286
NATURAL DEPOSITION
some 1 50 X 50 /x, to a record horizontal distance of 40 mm. Extrapolation
from wind-tunnel data suggests that, once launched into a wind of only
2 metres per sec, these giant spores (nearly the largest in the fungi)
would impact on a tree-trunk of 8 inches diameter with about 50 per centefficiency.
Although a high impaction efficiency may be necessary for fungi
which attack leaves and stems, it may be positively disadvantageous for
spores produced among dense vegetation. Johnstone et al. (1949) point
out that the ability of an airborne particle to penetrate close vegetation is
the inverse of its impaction efficiency. In close vegetation a high impaction
efficiency would reduce the chances of a spore getting very far from its
point of liberation. It is possible that the 10 /x-diameter spore represents a
working compromise between the conflicting requirements of dispersal
and deposition, evolved under the normal range of winds encountered
among vegetation. The large-spored leaf- and stem-pathogens appear to
be specialized impactors^ while the minute-spored puffballs and moulds
appear to be specialized penetrators—perhaps normally deposited by
processes other than Impaction.
TURBULENTDEPOSITION
Turbulent deposition has been observed in the wind-tunnel and on
artificial spore-traps in the open air. Spore-laden air flowing over hori-
zontal surfaces will deposit spores at rates much greater than those
calculated for sedimentation under the influence of gravity. In the wind-
tunnel turbulent deposition increases with increasing wind-speed and, at
5 to 10 metres per sec, deposition may be as great on the underside of a
horizontal surface as it is on the upper-side—an effect which clearly
cannot be caused either by impaction or by sedimentation under gravity.
The effect has been noted on pollen traps by Durham (1944, p. 233), who
found the catch on the lower surface of a horizontal slide to be as high as
50 per cent of the upper surface. Rishbeth (1959) found that spores of
Fomes annosiis and Peniophora gigantea can be deposited on the under-
surface of pine stem sections exposed a few^ metres above ground-level.
Turbulent deposition in the open air is also illustrated by experiments
with Lycopodiwn spores liberated just above short grass at Rothamsted
Experimental Station (Table XV). Deposition was recorded on the upper
and lower surfaces of horizontal traps held clear of supports on long pins
projecting from a wire frame. Catches shown in Table XV are for traps
at the same level as the spores were liberated (h + 0), and at 25 cm. above
this level (h + 25), in a downwind direction. The dimensions of the traps
were 18 X 18 X 4 mm. in the x, y, and z directions, respectively.
The greater deposit on the undersurfaces of traps at 25 cm. above the
level of emission, together with the unexpectedly large deposition on
ground near the source as shown in Table XII, is evidence of factors near
the source of a diffusing cloud which still remain to be elucidated.
83

7/30/2019 Microbiology of at 00 Greg
http://slidepdf.com/reader/full/microbiology-of-at-00-greg 110/286
THE MICROBIOLOGY OF THE ATMOSPHERE
TABLE XV
NUMBER OF Lycopodiwil SPORES DEPOSITED ON UPPER AND LOWER SURFACES
OF HORIZONTAL TRAPS, Qp = 10^ SPORES LIBERATED NEAR GROUND-LEVEL
(Gregory, unpublished)
7/30/2019 Microbiology of at 00 Greg
http://slidepdf.com/reader/full/microbiology-of-at-00-greg 111/286
NATURAL DEPOSITION
at a height of i-o to i-6 metres above ground-level, from 93 to 99 per cent
of the spores carried a positive charge. He concluded that this interesting
phenomenon might aid adhesion of spores to healthy pine-needles on the
tree.
In the normal, fine-weather electrical field of i volt per cm. over a
flat surface with the Earth negatively charged, a Ganoderma spore would
gain a negligible addition of 0-05 per cent to its terminal velocity. Ranz
& Johnstone (1952) have shown that aerosol particles 0-5 /x in diameter
could easily carry charges by which their deposition or suspension would
be controlled by the Earth's field rather than by gravity. Whether such
comparatively large particles as fungus spores or pollen grains are repelled
from the ground or, alternatively, attracted to projecting surfaces such as
leaves and tree tops, is as little known as are the causes of changes in the
Earth's field itself. Clearly this phenomenon is worth further investigation.
MINOR DEPOSITION MECHANISMS
It is also known that small particles tend to move down a temperature
gradient (Cawood, 1936; Watson, 1936), and that forces exist which cause
particles, at least up to 2 ju. in diameter, to be repelled by a hot surface
and attracted by a cold one. Smoke particles and Lycopodium spores are
also known to move aw^ay from light in the phenomenon of 'photophor-
esis' (Whytlaw-Gray & Patterson, 1932).
RAIN-WASHING ('Scrubbing', 'rain-out', 'wash-out')
Natural raindrops vary in size up to a maximum diameter of about
5 mm., above which they become unstable and break up during fall into
two smaller drops. They have terminal velocities of fall varying from 2
to 9 metres per sec. (Best, 1950; see also Gunn & Kinzer, 1949).
The pick-up of small spheres in the path of falling raindrops was
studied theoretically by Langmuir (1948) in connection with artificial
rain-making in Hawaii. To judge from Langmuir's figures, the minute
spores of Lycoperdon and of the soil-inhabiting Penicillia w ould fail to be
collected at all by drops much below i mm. in diameter, and efficiency
of collection would rise to a maximum of about 15per cent with droplets
about 2 mm. in diameter, decreasing again with still larger drops.
Basidiospores of Agaricus {PsaUiota) campestris should begin to be col-
lected by raindrops over 0-2 mm. in diameter, reach a maximum of 30
per cent efficiency with raindrops of 2-0 mm. in diameter, and decrease
slightly with drops of larger diameters. Spores of TiUetia caries^ Pucchiia
uredospores, and conidia of Erysiphe graminis, could be collected by any
possible raindrop, and collection would reach a maximum of about 80
per cent efficiency with drops 2-8 mm. in diameter.The optimum size of spore for deposition in rain varies with the size
of the prevalent raindrops. As we have seen, spores o( Lycoperdon perlatimi
85

7/30/2019 Microbiology of at 00 Greg
http://slidepdf.com/reader/full/microbiology-of-at-00-greg 112/286
THE MICROBIOLOGY OF THE ATMOSPHERE
would not be collected by drops less than i mm. in diameter, and I have
shown that drops of less than this diameter do not operate the bellows
mechanism of this species (cf. p. 60, and Gregory, 1949). According to
Langmuir, collection efficiency is at a maximum with drops ofabout 2 mm.
No of
drops
5000
IPOO
500-
Diameter of drops (mm)
Fig. 15.—Number of raindrops of various diameters passing per second through i sq.
metre (horizontal), with rainfall of intensities varying from 0-5 to 25 mm./hour. (Smoothed
curves from data of Best, 1950).
in diameter for all spore sizes, and is then about 25 per cent for spores 4/x
in diameter, and 80 to 90 per cent for spores 20 to 30 ju. in diameter.
Nothing is known of the pick-up of non-spherical spores and how
properties other than size or terminal velocity affect collection by rain-
drops. The spores of Ustilago perennans, although not easily wetted by
water, are evidently readily collected by rain. The work of Burges (1950)
86

7/30/2019 Microbiology of at 00 Greg
http://slidepdf.com/reader/full/microbiology-of-at-00-greg 113/286
NATURAL DEPOSITION
suggests that, when non-wettable spores reach the ground, they remain
in the upper layers of the soil. For the leaf- and stem-parasites, removal
from the air by rain is possibly unfavourable, while for small-spored soil
inhabitants as well as for smuts and other fungi that infect seedlings, it
may be the normal method whereby they come to ground.
lOO 500 ipOO
Diameter of drops p
5000
Fig. 1 6.
—Collection efficiencies of spores of diameters
4to
40/x by raindrops
of diameters 0-03 to 5-0 mm. (Smooth curves drawn through values computed by
Langmuir, 1948.)
Figs. 15 and i6, compiled from the data of Best (1950) and others,
show the proportion of raindrops of various sizes occurring in natural
rainfall, and the collection efficiencies of such drops (E per cent) as given
by Langmuir (1948).
Mostrelevant to
our problemis the theoretical study
byChamberlain
(1956), who used Best's (1950) results to calculate that, if other causes of
diminution of the spore-cloud concentration are neglected, rainfall at the
87

7/30/2019 Microbiology of at 00 Greg
http://slidepdf.com/reader/full/microbiology-of-at-00-greg 114/286
THE MICROBIOLOGY OF THE ATMOSPHERE
rate of i mm. per hour would deplete an aerosol of Lycopodium spores
according to the equation
X(t)= Xoexp. (-3-3 X lo-h).
This implies that after one hour the concentration will be reduced to
one third of its initial value. Chamberlain applies the concept of Vg to
rain wash-out and shows that, the greater the height of the spore-cloud
through which rain falls, the greater the rate of wash-out. The study was
continued experimentally at Harwell by F. G. May (1958), who found
good agreement with Chamberlain's theoretical values when tested with
Lycopodium spores marked with iodine-131. When testing thundery
showers, May also obtained good agreement with values calculated by
Langmuir (1948) and by Mason (1957)—but the predominantly smaller
and more variable droplets of frontal rain removed particles faster than
had been predicted by theory. McCully et al. (1956) reported highly
efficient removal of fluorescent dusts by rain from the air in both labora-
tory and field tests.
May (1958) points out that, in addition to removal by impaction,
raindrops can act as electrostatic collectors by means of two effects—
•
the coulombic attraction between oppositely-charged spores and rain-
drops, and by induced attraction. He estimated that capture by coulombic
attraction in thunder rain might equal capture by induced attraction, and
that both together could amount to 20 per cent of the total wash-out.
On the other hand. May suggests that for frontal rain coulombic collec-
tion can be neglected.
Relative Importance of Deposition Mechanisms
With Qp spores liberated into the air from a source, the number of
spores remaining in suspension will be reduced during travel in the wind
by the action of various deposition processes and, at a distance x from
the source, the number remaining in suspension will be Q^^ (Chapter
XIII).
The relative importance of the deposition processes can now be seen
to differ in different positions. Close to a source liberating spores near
ground-level, the mechanisms of impaction and boundary-layer exchange
will be the dominant fiictors in depleting the cloud. Near to the source,
rain-wash will have a relatively slight effect, because the height and breadth
of the cloud are small. But, as the cloud diffuses to its maximum height,
rain will have an increasingly large effect. With the still smaller particles
of radioactive dust, pushed into the stratosphere by megaton bombs and
falling back into the troposphere, rain-wash appears to be the most
important mechanism of removal. The level of strontium-90 in soil at
Antofagasta, Chile, in rain-free desert, is only i per cent of that general
for places in the same latitude with normal rainfall (Libby, 1956).

7/30/2019 Microbiology of at 00 Greg
http://slidepdf.com/reader/full/microbiology-of-at-00-greg 115/286
NATURAL DEPOSITION
Measurement of deposits on leaves in the field are few, but Rishbeth
(1959) has used surface microflora of conifer needles and leaves of birch,
etc., as a measure of infection-potential of forest contamination with
spores of Fomes annosus and Peniophora gigantea. Studies on the rate at
which spores accumulate and disappear in East Anglia, showed that there
was no continued increase, and that the rate of deposition was roughly
equivalent to the rate of disappearance.
Rain-washing of air, when it occurs, rapidly ends the process of spore
dispersal, and seems to be effective with small spores which are deposited
only slowly and ineffectively by other processes.
89

7/30/2019 Microbiology of at 00 Greg
http://slidepdf.com/reader/full/microbiology-of-at-00-greg 116/286
VIII
AIR SAMPLING TECHNIQUE
Knowledge of the air-spora has depended on developing sound tech-
niques for air sampHng. Smoke and many industrial dusts can be studied
satisfactorily with the ultra-microscope {see Green & Lane, 1957, p. 218),
but direct microscopic examination of spores suspended in air is scarcely
ever practicable. All convenient methods depend on apparatus to remove
the spores to a surface where they can be examined—either directly under
the microscope or after growth in culture.
Early methods of air sampling were summarized by Cunningham
(1873). Developments during the next seventy years were reviewed by the
Committee on Apparatus in Aerobiology of the National Research Council,
Washington, D.C. (1941), and again by duBuy et al. (1945) of the United
States Public Health Service. Now that deposition efficiencies are better
understood, sampling methods can be reviewed once more.
The various sampling techniques that are now possible have different
advantages and limitations. The following questions have to be answered
before a technique is chosen for a particular job. Is an assessment of the
total air-spora wanted, or is the study concerned only with a few groups or
a single species .f' Is a continuous day-and-night record needed, or will
short and regular or occasional samples suffice ? If changes in the air-spora
are being studied, what time-intervals are necessary: would a 24-hour
mean suffice, or must an accuracy of i i hour be attained, or again, is an
instantaneous cut-off needed to give a time-discrimination of minutes or
seconds ? The size of the sample must be decided upon, and the choice
made between the volumetric or deposition methods. Allergists are
normally interested in the number of particles (dead or alive) in a given
volume of air, whereas plant pathologists and plant breeders are more
interested in the deposition of viable spores or pollen grains.
Spore trapping requires apparatus, and many questions have to be
asked about this. What are its capital and running costs ? (It is uneconomic
to use the time of a trained scientist with a good microscope on inefficient
sampling methods.) Does it need a power supply ? Must it be portable }
Is it to be operated by a skilled staff or must it be robust and foolproof.''
Does its efficiency vary with wind-speed ?
When the spore has been caught it has to be identified
—but is this
to be done visually or by cultural methods ? Visual methods (using various
forms of microscopy) should give the complete picture of the air-spora
90

7/30/2019 Microbiology of at 00 Greg
http://slidepdf.com/reader/full/microbiology-of-at-00-greg 117/286
AIR SAMPLING TECHNIQUE
with spore-aggregates as well as inorganic particles, whereas cultural
methods allow the most accurate taxonomic determinations—but they
will only show viable micro-organisms that can grow on the media chosen.
Visual pollen identification can be carried to species level in many genera
but whereas spores of a few pathogenic fungi can be recognized with
certainty, the identification of spores and cells of bacteria, actinomycetes,
and most of the smaller fungi, is tentative in the extreme (see Appendix I,
p. 207).
To economize description in the following account, the various kinds
of apparatus for sampling the air-spora are grouped according to the
physical processes by which they remove particles from the air and deposit
them on surfaces for examination. Many of the techniques can be adapted
to give either a deposit for visual examination under the microscope or
cultures on artificial media.
Gravity Sedimentation Methods
sedimentation from still air
A simple box, developed by Alvarez & Castro (1952) for the study of
airborne fungi, had two hinged sides and a covered tray at the bottom for
inserting a microscope slide or Petri dish. To take an air sample, the two
hinged sides were raised horizontally and wind was allowed to blow
through the box. Closing the hinged sides trapped a box-full of air and
the entrapped spores then sedimented under gravity.
In theory the result is not affected by wind velocity or particle size.
Sampling is discontinuous, only a small volume of air being sampled at a
time, and there will be losses on the walls and roof of the box due to
convection and diffusion {see Tyndall, 1881 ; Green & Lane, 1957, p. 229).
SEDIMENTATION FROM WIND
The method of examining the deposits on a freely exposed, horizontal
surface such as a glass microscope slide was used by Pouchet in his
controversy with Pasteur, but can be traced back to van Leeuwenhoek.
(i). The 'gravity slide'' has been the routine method for investigating
the pollen and spore content of the air since the early days of hay-fever
studies. Scheppegrell (1922) used ordinary 76 X 25 mm. microscope
slides exposed without protection from rain. Most workers, however, e.g.
Blackley (1873), Wodehouse (1945), Durham (1946), Hyde & Williams
(1950), and Hyre (1950), have exposed the slides horizontally, with the
sticky slide facing upwards in some form of shelter—open to the wind but
giving protection from rain. The adhesive coating of the slide is usually
glycerine jelly or petroleum jelly. A slide is commonly exposed for a period
of 24 hours, and slides are changed daily throughout a season.
The gravity slide is cheap, simple, and operates continuously, but
has serious defects as a quantitative method of air sampling out-of-doors,
91

7/30/2019 Microbiology of at 00 Greg
http://slidepdf.com/reader/full/microbiology-of-at-00-greg 118/286
THE MICROBIOLOGY OF THE ATMOSPHERE
giving a highly distorted picture of the air-spora because it preferentially
selects the larger particles. Terminal velocity increases as the square of the
spore's radius (Chapter II), and terminal velocities are such that under
ideal conditions, while for example a slide is receiving the puffball spores
in a layer of air 0-5 mm. thick, it also receives rust uredospores from a
column 10 mm. thick, and grass pollen from a layer 50 mm. thick. Avolume of air containing puffball spores and grass pollen in equal con-
centration would be recorded by the gravity slide as having 100 times
as many grass pollen grains as puffball spores. To correct this distortion
Scheppegrell (1922) tried to calculate the volumetric concentration from
gravity-slide deposits using a formula based on particle diameter^ which
was later corrected by Cocke (1937) to particle radius.
Because of edge effects and turbulent deposition at high wind-speeds
(Chapter VI), the gravity-slide catch is very difficult to interpret; but in
spite of these defects it has been widely used and has contributed much
of our still meagre knowledge of the air-spora.
(ii) The gravity Petri dish. A few workers have exposed Petri dishes
horizontally in outside air, to provide pollen deposits for visual examination
(Hesselman, 191 9; Ludi & Vareschi, 1936).
More commonly, Petri dishes of sterile media are exposed in the open
air for periods of from i to 10 minutes to investigate the cultivable bac-
terial or mould flora of the atmosphere. (Some workers expose empty
sterile dishes and pour the medium on returning to the laboratory.)
Indoors, the method is subject only to distortion owing to the sedimenta-
tion rate. Out-of-doors, however, the method is also subject to aerody-
namic effects from the edge of the dish—unless the dish is sunk below
a plane surface (p. 73). For sampling out-of-doors the method has been
used in tests by: P. F. Frankland & Hart (1887), Saito (1904, 1908, 1922),
ZoBell & Mathews (1936), Dye & Vernon (1952), Menna (1955), Richards
(1954, 1954^, 1954/'), Werff (1958), and many others.
Apart from convenience and economy, the method is valued for the
precision with which organisms can be identified in resulting cultures.
Its defects are: sensitivity to particle size, wind-speed, and aerodynamic
effects (p. 73); also the small volume of air sampled intermittently.
Continuous sampling is
impracticable and diurnal changes of the air-spora are not revealed. Its restriction to viable and cultivable particles
may be developed with advantage to a high degree of selectivity when
sampling is aimed at a limited group of organisms. With pleomorphic
fungi, positive growth in culture may still leave the origin in some doubt;
a Phojna or a Fusarium culture might have arisen either from a
conidium or an ascospore—a detail which it is sometimes important to
resolve.
(iii) Conicalfunnels have been exposed for trapping conidia of downymildew of the vine {Plasmopara viticola) by Savulescu (1941), for fore-
casting mildew outbreaks in Rumania.
92

7/30/2019 Microbiology of at 00 Greg
http://slidepdf.com/reader/full/microbiology-of-at-00-greg 119/286
AIR SAMPLING TECHNIQUE
SEDIMENTATION FROM ARTIFICIALLY MOVING AIR
Hesse's method of sedimentation in long horizontal tubes has been
described in Chapter I. Cocke (1938) used the same principle for visual
microscopic examination of airborne pollen. A small chamber was lined
top and bottom with eight glass slides, leaving a passage of only 1-2 mm.
between floor and roof. With 1-4 cu. metres of air per 24 hours drawn
between the slides, Cocke reported good agreement with the gravity slides
exposed simultaneously out-of-doors.
Similar in principle are the funnel device (Hollaender & Dalla Valle,
1939), in which air enters the stem of an inverted conical funnel suspended
3 mm. above a Petri dish of medium, and the bottle device of Scharf (in
duBuy et al., 1945), in which air plays from the end of a tube onto the
surface of a culture medium in a horizontal medical-flat bottle. As the
volume of air sampled in a given time is often inconveniently small, and
they are not easily made quantitative, none of these methods has passed
into routine use.
Intrtial Methods
In the 'inertial methods' the particles may be retained on filters, on
flat surfaces, or in liquids. The air may operate by being drawTi through a
jet or tube, or by being spun to produce centrifugal separation; or, al-
ternatively, the apparatus may move the trap surface through the air as
in the whirling arm devices, or in sampling from aircraft. The grouping
adopted below is convenient rather than fundamental.
impaction using wind movement
(i) Vertical and inclined sticky microscope slides have been used for
catching pollen in hay-fever research and spores in cereal rust studies.
Blackley (1873) exposed four slides at a time, facing different points of the
compass; but commonly a single slide is exposed for 24 hours in a pivoted
vane shelter which swings to face the wind—cf. Craigie (1945), Clark
(1951), and Mehta (1952). Slides were fixed in trees, in positions compar-
able with leaves, in order to trap spores oi Hemileia vastatrix, a rust fungus
devastating coffee, in Ceylon by Ward (1882) and in India by Mayne(1932).
Various methods are used to test for the spore liberation period of a
green plant or fungus, but this is a different problem from air sampling
(Pettersson, 1940; Oort, 1952; Hopkins, 1959).
Vertical slide traps have been sent aloft fixed to kites, first apparently
by Blackley (1873). ^ variety of such devices were used by Mehta (1933,
1940, 1952) in his extensive studies of rust dissemination in India. During
1930-32 he used free hydrogen balloons to carry vertical slides, the cylinder
containing the slide being opened and closed again by burning fuses after
93

7/30/2019 Microbiology of at 00 Greg
http://slidepdf.com/reader/full/microbiology-of-at-00-greg 120/286
THE MICROBIOLOGY OF THE ATMOSPHERE
about 5 minutes at the right akitude (Chatterjee, 193 1) ; but this method was
discontinued in favour of sticky sHdes attached to kites which could be
kept aloft in the wind for 2 or 3 hours. It is now obvious that when carried
by a free balloon (contrary to a kite or captive balloon), even if the slide
faced the wind, its trapping efficiency would be low as there would be
little or no movement of the slide relative to the air.
Sampling from aeroplanes in the early days was by sticky microscope
slide or Petri dish, exposed at right angles to the line of flight. The wooden
paddle and bottle devised by Stakman et al. (1923) was also used by
Mehta (1952) and others, and, at aircraft speeds, should be a reasonably
efficient collector except for the smallest spores. Newman (1948) claimed
an increase in efficiency by placing a leading wire in front of the slide,
to break the stagnation zone when sampling from aircraft.
(ii) Vertical cylinder. A removable sticky coating applied to a vertical
cylinder was apparently first used by Rempe (1937) for studying airborne
pollen at Gottingen. To measure pollen 'drift', cellulose film coated with
petroleum jelly was wrapped around the surface of small brass tubes,
14 mm. wide by 45 mm. long. These tubes were hung vertically from
trees or on stakes at the required height. Rempe compared pollen 'drift'
with pollen 'deposition' (which he measured on horizontal slides i cm.
above the ground), and found that drift was usually greater than deposition.
At 100 metres horizontal distance from a CoryIns bush, and at a height
of 3 metres, the drift was 25 times as great as the ground deposition. Day
and night values for a whole month were obtained on the level roof of the
Gottingen Botanical Institute. The vertical sticky cylinder (0-5 cm. in
diameter) has also been used by Turner (1956) for field studies on cereal
powdery mildew {Erysiphe graminis).
The lower limit of cylinder diameter, and at the same time the maxi-
mum efficiency, is probably reached in the glass fibres of Kordyum &Bobchenko (1959), and in the 'flag sampler' of Harrington et al. (1959).
This latter consists of a miniature wind-vane of cellulose tape folded over
a pin which rotates in a low-friction bearing.
Sticky-surface traps have usually been scanned visually but they can
be used to provide cultures. Thus Martin (1943) showed that spores can
be picked off an exposed slide by Hanna's (1928) wet-needle method.
Sticky gravity slides, vertical slides, and cylinders, are all convenient
and cheap. Their defects are: (i) theoretically a zero catch oflarge particles
in still air and of small fungus spores even at ordinary wind-speeds ; and
(2) very great changes of efficiency with wind-speed {see Fig. 10).
Landahl & Herrmann (1949) claimed that the amount of aerosol
'deposited on a vertical slide does not change much if it is oriented at
various angles within 30° of the wind'. Our results indicate that with
Lycopodium spores this is true only at w'ind-speeds of about 5 metres per
sec. Rotating the slide from 90° to 60° increases the efficiency by 10
94

7/30/2019 Microbiology of at 00 Greg
http://slidepdf.com/reader/full/microbiology-of-at-00-greg 121/286
AIR SAMPLING TECHNIQUE
times at I- 1 and 075 metres per sec., and by about 5 times at 3-2 metres
per sec, whereas at 9-5 metres per sec. the efficiency is decreased by one
quarter.
The use of the 7-6 X 2-5 cm. microscope sHde at angles intermediatebetween 0° and 90° would increase trapping efficiency at the wind-speeds
normally experienced in the open air near the ground. Hyre (1950)
observed that a slide with a presentation angle of 45°, exposed in the
field, caught more sporangia of Pseudoperonospora cubensis than either
a vertical or a horizontal slide at wind-speeds of up to 2-4 metres per sec.
a result easily explicable from wind-tunnel work (cf. Fig. 14). It ought to
be possible to orientate a slide at 5° to the oncoming wind which should
give an efficiency varying only between o-6 and 1-4 per cent over the
range of i to 10 metres per sec; or at 10°, when its efficiency would vary
between 1-5 and 4-5 per cent over the same range of wind-speeds. An
alternative approach would be to make the slide tilt, according to the
wind's force, over the range ofangles 10° to 30° as the wind-speed decreases
from 10 to I metres per sec.—over which range it would have a nearly
constant efficiency of 4 per cent M'ith Lycopodium.
The vertical 7-6 X 2-5 cm. slide, widely used for research in plant
patholog}'', is an impactor trap ; it suffers from the defects of being rela-
tively inefficient as an impactor at low wind-speeds and of being highly
sensitive to changes in wind-speed. To avoid wrong conclusions and to
be able to translate deposit into time-mean concentration, it is necessary
to know the wind-speed under which deposition took place and to make
the necessary correction. This may be illustrated by considering the
deposit received from a cloud containing 10,000 Lycopodium spores per
cubic metre, using wind-tunnel data for two wind-speeds. At i-o metres
per sec. impaction at 5 per cent efficiency would deposit about 20 spores
per sq. cm. per hour. With an increase in the wind-speed to 9-4 metres
per sec, the deposit would increase to about 9,000 spores per sq. cm.
per hour—a 450 times increase in deposit without change in the number
of spores per cubic metre of air. A further source of error is that at low
wind-speeds the efficiency is low, and as the catch is therefore small it
has to be multiplied by a large factor, and the error of estimation becomes
great.
(iii). Aeroconiscopes^ used first by medical workers and later by plant
pathologists, are now mainly of historical interest. They seem first to
have been used by Salisbury (1866) in the Mississippi Valley, but were
developed more fully by Maddox (1870, 1871) and Airy (1874) in England,
and by Cunningham (1873) in India (Chapter I).
Aeroconiscopes of the Maddox and Cunningham t}'pe (Fig. 2)
have been used in plant pathological investigations by Christoff (1934)
in Bulgaria, and by A. A. Shitikova-Russakova {see Stepanov, 1935) in
* The word 'aeroscope' has been used with some ambiguity, referring either to
this type of instrument or to bubblers of the type described by Rettger (cf. p. 97).
95

7/30/2019 Microbiology of at 00 Greg
http://slidepdf.com/reader/full/microbiology-of-at-00-greg 122/286
THE MICROBIOLOGY OF THE ATMOSPHERE
Russia. Such wind-operated aeroconiscopes or aeroscopes* are essentially
qualitative and there is no information on their efficiency. Finding an
organism means that it was certainly present in the air, but gives no
informationabout its numbers.
Whenwind-speed is low, failure to find
an organism does not necessarily mean that it was not present.
FORCED AIR-FLOW IMPACTORS
Samplers through which air is drawn by pumps, fans, or aspirators,
can be made relatively independent of changes in wind-speed and differ-
ences in particle size, and they can accordingly give a volumetric reading
under field conditions.
For sampling clouds of inorganic particles, which are often presentin high concentration in closed spaces, various forms of koniometer have
been developed (e.g. the Kotze koniometer, the Owen jet dust-counter,
and the Aitken nucleus counter). None of these is well suited to the
requirements of aerobiology; because of the small volume of air sampled,
they are suitable only for high concentrations, and their aerodynamic
features make isokinetic operation impossible (also, aggregates are shat-
tered by a high speed of impact). Their efficiency has been tested by
C. N. Davies et al. (195 1), and their advantages and drawbacks are well
summarized by Green & Lane (1957). As was emphasized by K. R. May
(1945), a true sample of moving air 'is only obtained by isokinetic samp-
ling, that is, when the sampling tube, with a feathered leading edge,
faces upstream with suction applied at such a rate that the air velocities
in the tube and main airstream are equal'. Many of the devices extensively
used in biological work are satisfactory for sampling bacterial aerosols
consisting of single bacterial cells or mould spores in still air, but fall
far short of the ideal isokinetic sampling when used for bacteria carried
on 'rafts', and larger fungus spores or pollen grains in moving air.
The main errors in impactor traps operated by suction are: (i) col-
lection errors due to failure of the spore to enter the orifice (these errors
may be reduced by isokinetic sampling with the orifice facing the wind,
see Watson, 1954); and (2) retention errors due to failure to deposit spores
in the correct place, either because they are lost on the walls of the trap
or because they pass through the trap. Splash-borne spores, travelling
mostly in droplets of 1 50-600 ^i diameter, are not yet satisfactorily collected
by any existing equipment.
(i). Sieving filters. Drawing air through a filter with pores too small
for the organisms under investigation to pass through, is a simple tech-
nique which is, however, relatively little used as it is difficult to get a
sufficiently high rate of air-flow through small pores. Filter-paper
has been used by Frey & Keitt (1925) for Ventiiria spores, by Chamberlain
(1956) in wind-tunnel tests with Lycopodimn., by Gordon & Cupp (1953)
for Histoplasnia, and for pollen collection on Atlantic liners by Erdtman
(1937). Membrane or 'Multipore' filters of re-precipitated cellulose can
96

7/30/2019 Microbiology of at 00 Greg
http://slidepdf.com/reader/full/microbiology-of-at-00-greg 123/286
Rosebury-Henderson Capillary Impinger in operation, with air entering first through
a May & Druett Pre-impinger. (Inset shows the capillary in still conditions.)
Plate4

7/30/2019 Microbiology of at 00 Greg
http://slidepdf.com/reader/full/microbiology-of-at-00-greg 124/286

7/30/2019 Microbiology of at 00 Greg
http://slidepdf.com/reader/full/microbiology-of-at-00-greg 125/286
AIR SAMPLING TECHNIQUE
now be bought with pores from o-8 to 50 ju- in diameter which allow
flow-rates adequate for some air sampling (First & Silverman, 1953;
Goetz, 1953; Haas, 1956). After exposure these membranes can be placed
directly on the surface of solid media in a Petri dish to allow growth onthe membrane ; or they can be shaken in water and the suspension plated
out; or the membrane can be mounted as a transparency and examined
directly under the microscope.
(ii). Impaction filters differ from sieving filters in consisting of a deep
layer of fibres or granules separated by relatively wide air-spaces. Air-
borne particles are subjected to repeated encounters and are impacted
in the foremost layers of the filter substance. Pasteur's air filter {see p. 5)
was packed with a nitrocellulose plug which, after sampling, was dis-
solved in an alcohol-ether mixture and the particles were examined
microscopically. As this treatment killed the trapped organisms, P. F.
Frankland (1887) substituted powdered glass which was washed, diluted,
and plated out after exposure. Because of the difficulty of washing organ-
isms off a solid filter, many workers have preferred a completely soluble
filter medium such as sodium sulphate (Miquel, 1890). Duller & Lowe
(191 1) substituted a plug of powdered sugar; Richards (1955) introduced
the sodium alginate-wool filter, and others have used ammonium alginate
(Hammond, 1958), which is soluble in water, or calcium alginate, which
is soluble in Ringer's solution or in sodium hexametaphosphate.
For many years the standard technique for trapping airborne microbes
was that of Petri (1888) or modifications of it (e.g. Weinzerl & Fos, 1910).
Air was drawn through a sterilized tube 9 cm. long and i-6 cm. wide, con-
taining two columns of sand separated by wire gauze. These two sand
filters were plated-out separately, the rear portion acting as a control.
Equipment for exposing a set of five such tubes from aircraft during
flight is described by Overeem (1936).
A simplified, wind-operated filtration method has been developed by
Rishbeth (1958, 1959) to study fungus pathogens of coniferous forests.
Butter-muslin squares (20-cm. sides), dry-sterilized in paper envelopes
at ioo°C., are put on a wire frame exposed either at right-angles to the
wind (with the frame clipped to a stick, commonly at 2 metres above
ground-level) or mounted on a moving vehicle. Exposures may last from
minutes to hours; when they have been completed, a lo-cm. square of
muslin is cut out, shaken in water, and the suspension plated out. 'Plating'
on freshly-cut slices of pine trunks gives a sensitive and extremely
selective method of detecting spores of two species of fungi, Fomes
annosus and Peniophora gigantea.
(iii) Liquid scrubbing devices remove particles suspended in air, as it
bubbles through a liquid, by various combinations of impaction, sedi-
mentation, and diffusion. A simple 'aeroscope' bubbler devised by Rettger
(1910), consisting of an inlet tube ending in a submerged perforated
bulb, appears to be the prototype of a practicable method. Another
G 97

7/30/2019 Microbiology of at 00 Greg
http://slidepdf.com/reader/full/microbiology-of-at-00-greg 126/286
THE MICROBIOLOGY OF THE ATMOSPHERE
simple form is described by Gilbert (1950). Improved forms of bubbler
have been described by Wheeler et al. (i 941), by Moulton et a I. (1943) who
added an atomizer stage before the bubbler, and by duBuy et al. (1945).
(iv) The Rosebury-Henderson capillary impinger (Plate 4) differs
somewhat in principle from the bubblers. A small flask carries a wide
inlet tube, and the inner end of the tube is fused to a short length of
capillary tubing which dips at least 5 mm. below the liquid but remains
at least 4 mm. above the bottom. The diameter of the capillary tubing
acts as a limiting orifice, controlling the air-flow rate under suction (for
example at 2-3 litres per min., or even up to 20 litres per min.) (Rosebury,
1947). This impinger has been tested and found to have a high retention-
efficiency in work on experimental airborne infection of animals. If used
to sample clouds containing large particles, however, substantial wall-loss
may occur at the bend of the inlet tube. This can be prevented by adding
a pre-impinger, originally devised by K. R. May & Druett (1953) to
collect particles over 8 /x in diameter.
(v) Centrifugal samplers. Centrifugal impaction is used in the Wells
(1933) air centrifuge, in which 30 to 50 litres per min. of air are drawn
through an agar-lined glass cylinder rotating at 3,500 to 4,000 r.p.m.
this makes the air rotate and throws all suspended particles onto the
wall of the cylinder by centrifugal force. After exposure the cylinder is
incubated, and colonies developing on the agar-coated walls give a direct
volumetric reading of the organisms present—so far as these are cultivable
on the medium used. This apparatus has been used very extensively
for routine bacterial sampling (e.g. Pincus & Stern, 1937; Wells, 1955).
Its disadvantages include the difficulty of examining the catch inside the
curved tube, and a deposition efficiency falling from 100 per cent with
2-3 fji particles to 50 per cent with 0-77 /x particles (Phelps & Buchbinder,
1 941). Wells has also illustrated a model of the air centrifuge for collecting
pollen for microscopic identification {see Committee on Apparatus in
Aerobiology, 1941).
A more elaborate development is the 'conifuge', designed for micro-
scopic study of size-distribution of particulate clouds (Sawyer & Walton,
1950; Green & Lane, 1957). It appears to be ideal for comparing terminal
velocities of spherical with irregularly-shapedparticles,
but has thedisadvantage that it samples only 25 cc. of air per minute.
Different in appearance, but essentially similar in principle, are the
cyclone dust-collectors extensively used in industry for removing dust
from air, and which have the advantage of allowing a large through-put
with small pressure-drop. Small cyclone dust-collectors have been used
by Tervet (1950), Tervet & Cherry (1950), and Ogawa & English (1955),
to collect large quantities of rust spores for inoculation experiments, and
we have found them satisfactory for the much smaller spores of Ustilago.
(For the design of cyclone dust-collectors, see C. N. Davies, 1952).
(vi) hipaction samplers. Tmpactor' samplers use suction from a pump
98

7/30/2019 Microbiology of at 00 Greg
http://slidepdf.com/reader/full/microbiology-of-at-00-greg 127/286
AIR SAMPLING TECHNIQUE
to accelerate air through an orifice to a speed at which deposition effi-
ciency becomes high (80-100 percent) and airborne particles are deposited
on a solid surface.* The protot^'pes of these are^ series for the study of
industrial dusts and atmospheric nuclei, such as the Owen jet dust-
counter, the Aitken nuclei counter, and various forms of koniometer
{see p. 96). These instruments are not very suitable for microbial work,
but Durham (1947) found such a pump effective for spot samples of
pollen clouds in high concentration. Power-driven prototypes for aero-
biological study include the impactor of Hawes et al. (1942).
(vii) The slit sampler (Bourdillon et al, 1941) was designed primarily
for indoor studies with bacteria. A stream of air is dra^^TL through a
narrow slit placed just above the surface of sterile medium in a slowly
rotating Petri dish. Particles, spores, etc., are impacted on the medium
and, after a few minutes' running time, the Petri dish is removed and incu-
bated so that colonies may develop and be counted. The 'duplex radial-
jet air sampler' of Luckiesh et al. (1949) is similar in principle and allows
sterilization by autoclaving. Retention in the slit sampler is good; identi-
fication is made in culture; the apparatus is suited for occasional or
regular 'spot' samples, but not for continuous use. It is best used indoors
as it is not suitable for isokinetic sampling, and collection errors would be
high when sampling large particles in a wind.
(viii) The Cascade Impactor (K. R. May, 1945) is a highly efficient
suction trap. Used isokinetically, it serves as the standard of reference
against which other devices may be calibrated. The Cascade Impactor
consists of a folded tube through which the air to be sampled is drawn
by suction. During its passage, the air is accelerated through a series of
four progressively narrower jets, and airborne particles are impacted on
sticky slides placed close behind the jets. The first jet (the intake orifice)
faces the wind. In the original model, at the sampling rate of 17-5 litres
per min., the speeds through the four jets are: 2-2, 10-2, 20-4, and 34
metres per sec, permitting 50 per cent of the particles whose diameters
are 12 ^, 4 ju., 2 /x, and i-i /x to penetrate the respective jets. Later models
give good retention down to 0-5 ju..
The Cascade Impactor thus fractionates the catch into four sizes and
it avoids breaking up clumps. It is ideal for short sampling periods, but
if used for sampling the air-spora out-of-doors in summer in England the
trace becomes dense after an hour or two. A model of the Cascade Im-
pactor with moving slides was developed by K. R. May (1956) to over-
come this kind of difficulty and to give time-discrimination. A five-stage
Cascade Impactor has been designed by Wilcox (1953).
(ix) The automatic volumetric spore-trap (Hirst, 1952) is a power-driven
trap designed for operating continuously in the field (Fig. 17). It consists
essentially of a single impactor slit (actually this has the same dimensions
* Impaction and impingement are nearly synonymous. In the context of air samp-
ling, devices putting particles into a liquid are distinguished as 'impingers',
99

7/30/2019 Microbiology of at 00 Greg
http://slidepdf.com/reader/full/microbiology-of-at-00-greg 128/286
THE MICROBIOLOGY OF THE ATMOSPHERE
W ^ ^
C'J-----1'^
I
2
IMPACTOR
UNIT
Automatic Volumetric
Spore Trop
Fig. 17.—Diagram of the Hirst automatic volumetric suction-trap: i, eleva-
tion facing wind; 2, plan of section through orifice; 3, elevation in side view;
C, clockwork drive for raising slide; O, orifice facing wind, with slide in holder
moving up past orifice; V, to vacuum pump. (Wind vane and cap to protect orifice
from rain are not shown.) (Illustration by permission of J. M. Hirst.)
as the second jet of the Cascade Impactor), behind which is placed a
sticky microscope shde movingat 2
mm.per hour. In the course of twenty-
four hours a trace is deposited in a band 48 mm. long. This can be scanned
under the microscope longitudinally to obtain a daily mean, or it can be
100

7/30/2019 Microbiology of at 00 Greg
http://slidepdf.com/reader/full/microbiology-of-at-00-greg 129/286
AIR SAMPLING TECHNIQUE
scanned transversely at intervals of 4 mm. to get a reading corresponding
to every two hours throughout the day and night.
The Hirst trap is ideal for survey work, and it is a useful compromise
over many conflicting requirements. It is power-driven; sampling is
approximately isokinetic; identification is visual under the microscope,
and time-discrimination is obtained to i i hour or better. The advan-
tages of the Hirst trap are its robustness, simplicity, and continuous
operation with a few minutes attention every 24 hours. Its disadvantages
are capital cost, power requirement, and its unsuitability both for identi-
fication in culture and for trapping splash-dispersed spores. Pady (1959)
has described a modified Hirst trap with intermittent hourly movement
replacing continuous movement of the slide. Panzer et al. (1957) devised
a battery-driven spore collector for continuous operation, but its descrip-
tion suggests that its collection and retention efficiencies are probably
small.
Scanning slides under the microscope is tedious unless the deposit
is dense. Hirst (1959) reports a comparison of mean density of spore
deposit on horizontal slides, vertical cylinders, and Hirst trap slides
(Table XVI), exposed for four summer months in the open air. Small
spores, which almost entirely escape the vertical cylinder and horizontal
slide, are caught in rewarding numbers in the Hirst trap deposits.
TABLE XVI
AVERAGE DENSITY OF SPORE DEPOSIT FROM THREE TYPES OF TRAP 2 m.
ABOVE GROUND, HARPENDEN, ENGLAND, JUNE TO SEPTEMBER 1951.
(Hirst, 1959)
Spores per sq. cm. Ratio

7/30/2019 Microbiology of at 00 Greg
http://slidepdf.com/reader/full/microbiology-of-at-00-greg 130/286
THE MICROBIOLOGY OF THE ATMOSPHERE
are cheapness and portability; time-discrimination is accurate to seconds
if desired; it is suitable for work in the less accessible places and for short-
time samples (5-10 min.). However, it is fatiguing to use, and being
unsuitable for continuous operation, it cannot conveniently be used to
STAGE NO.
JET SIZE
JET VELOCITY
STAGE 1
0.0465" DIA.
3.54 FT/SEC
STAGE 2
0.0360" DIA.
5.89 FT/SEC
STAGE 3
0.0280" DIA.
9.74 FT/SEC
STAGE 4
0.0210" DIA.
17.31 FT/SEC
STAGE 5
0.0135" DIA.
41.92 FT/SEC
STAGE 6
0.0100" DIA.
76.40 FT/SEC
^^-^^^^^-^-^^^-^W^/////////>>^^
Fig. 18.—Diagram of six-stage Andersen sampler. (Reproduced by permission of Dr.
Ariel A. Andersen from the journal ofBacteriology, 76, 1958.)
trace diurnal or weather effects on the air-spora. Brook (1959) has devel-
oped essentially similar equipment for sampling the air-spora of pastures
in New Zealand.
A desirable development of both the Hirst trap and the Portable trap
would be versions which presented the catch in a form suitable for culture
as an alternative to visual microscopic identification.
(xi) The Andersen Sampler can be regarded as a development of the
so-called 'sieve device' of duBuy & Crisp (1944). In principle this sampler
102

7/30/2019 Microbiology of at 00 Greg
http://slidepdf.com/reader/full/microbiology-of-at-00-greg 131/286
AIR SAMPLING TECHNIQUE
(Andersen, 1958) resembles the Cascade Impactor; after entering a
circular orifice, air is drawn in succession through a series of six circular
plates, each perforated with 400 holes through which spores are impacted
directly on to sterile medium in Petri dishes (Fig. 18). Succeeding plates
in the series have progressively smaller holes; the largest particles are
deposited in the first dish and the smallest in the last; different media can
be used for the different size-fractions. Air is sampled at the rate of 28-3
litres per min.; wall losses are claimed to be negligible, and retention
is said to be 100 per cent, even for single bacterial cells.
In our work the Andersen sampler has proved very convenient and
has given good results with bacteria, actinomycetes and moulds, though
for particles larger than about 8-10 /x the addition of some form of pre-
impinger seems desirable for avoiding losses on the front of the first plate.
Reference should be made here to the use of the animal lung as a
sampling device. Lurie & Way (1957) injected macerated lung tissue
of various animals intrapcritoneally into mice, from whose livers and
spleens two dermatophytes {Trichophyton mentagrophytes and Microsporon
gypsemn) were subsequently isolated in culture.
(xii) Whirling arm. The principle of moving an object through air on
a rotating arm has been developed in aerodynamics laboratories as an
alternative to the wind-tunnel. As a device for air sampling it has been
developed in the United States—beginning w ith the 'airw hip' of Durham
(1947), who used a 36 in. aluminium rod to swing a forward-facing, sticky
glass slide in a circle at 100 r.p.m. Near a stand of flowering ragweed
{Ambrosia spp.), Durham recorded a maximum pollen concentration of
about 10 million per cubic metre of air.
A high-speed whirling arm trap was developed by Perkins (1957) as
the so-called 'Rotorod sampler'. It has been used in plant pathological
studies by Asai (i960), and has been somewhat modified by Harrington
et a I. (1959). The Rotorod sampler consists of a length of i/i6th in.-square
cross-section brass rod, bent to form a vertical U-shaped collector with
arms 6 cm. high, 8 cm. apart, and fixed to the shaft of a miniature electric
motor running at 2,520 r.p.m. over the range 9 to 15 volts from dry
batteries. The sticky arms effectively sample air at 120 litres per min.
Rotating at a peripheral speed of about 10 metres per sec, high collecting
efficiency would be expected for pollens and spores down to about 12 ju.
diameter; for smaller spores, efficiency would fall below 50 per cent. This
sampler has proved reliable in use, light in weight, and self-contained; the
batteries are cheap, and will run continuously for two or three days.
ADHESIVES
The choice of adhesives for samplers is limited. Petroleum jelly and
glycerine jelly have many advantages. Glycerine jelly has the best optical
properties for visual examination, but it is hygroscopic and dissolves in
damp weather. Petroleum jelly (e.g. 'Vaseline') is reliable for coating
103

7/30/2019 Microbiology of at 00 Greg
http://slidepdf.com/reader/full/microbiology-of-at-00-greg 132/286
THE MICROBIOLOGY OF THE ATMOSPHERE
Hirst trap slides, but addition of paraffin wax (i2| per cent) is often
necessary to harden it. The coating must be kept as soft as possible, how-
ever, and for extremes of temperature Pady & Kelly (1949) introduced
silicone grease for coating trap surfaces. When spores have to be picked
off and transferred to culture media, pectin jelly is recommended by
Prof. A.J.
P. Oort (personal communication).
Thermal Precipitation
A hot body placed in a dust-laden atmosphere produces a dust-free
space around itself (Watson, 1936). This well-known phenomenon has
been used in the thermal precipitator, in which a dust-laden airstream
flows slowly past a wire heated electrically to ioo°C. above the ambient
temperature, depositing dust particles on glass slips for examination.
It has been little used for aerobiological work, but is highly efficient for
sub-microscopic particles and larger ones up to 5 /x diameter. It is most
suitable for use when the particles are in high concentrations, as the
volume of air sampled is only about 7 cc. per min. (see Green & Lane,
1957)-
Electrostatic Precipitation
The movement of charged particles in an electrical field is widely
used in industry to extract dust from air because the pressure drop im-
posed by the requisite apparatus is small, even w ith high rates of air-flow.
Berry (194 1) realized that an efficient sampling method could be developed
on this principle, and the General Electric electrostatic air-sampler was
devised by Luckiesh et al. (1946). Petri dishes of culture medium are
placed on flat metal plates (electrodes) which are oppositely charged to
7,000 volts from a half-wave rectifier. Air enters through the apex of a
fairly flat inverted metal cone extending to near the edge of each dish,
and each cone carries a charge opposite to that of the electrode under its
dish. A small pump draws air at 14 litres per min. over each dish, and
particles move in the electrostatic field and are deposited on the agar
surface.
When Escherichia coli in aqueous suspension was atomized into a
room, the dish on the positive electrode collected nearly ten times as many
cells as that on the negative. With naturally-occurring airborne bacteria,
30 per cent more were deposited over the negative electrode. Presumably
each dish collects a proportion of the uncharged particles by gravity and
impaction, as well as collecting the charged particles moving towards it.
The positions and dimensions of the upper electrodes have been decided
by empirical tests and may need modifying for mould spores and pollen.
For naturally airborne bacteria the concentration, based on the sum of thecounts on the two dishes, was from 2 to 3 per cent higher than simul-
taneous tests with the 'duplex radial-jet air sampler'. How far particles
104
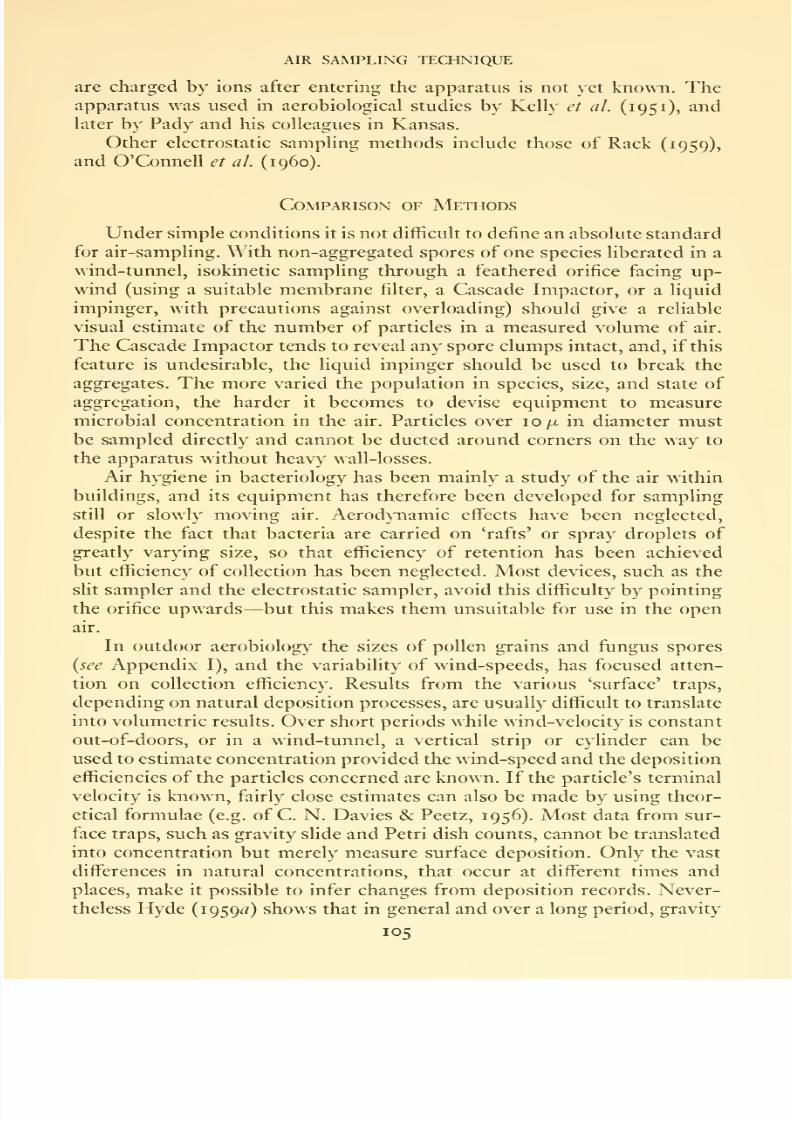
7/30/2019 Microbiology of at 00 Greg
http://slidepdf.com/reader/full/microbiology-of-at-00-greg 133/286
AIR SAMPLING TECHNIQUE
are charged by ions after entering the apparatus is not yet known. The
apparatus was used in aerobiological studies by Kelly et al. (1951), and
later by Pady and his colleagues in Kansas.
Other electrostatic sampling methods include those of Rack (1959),
and O'Connell et al. (i960).
Comparison of Methods
Under simple conditions it is not difficult to define an absolute standard
for air-sampling. With non-aggregated spores of one species liberated in a
wind-tunnel, isokinetic sampling through a feathered orifice facing up-
wind (using a suitable membrane filter, a Cascade Impactor, or a liquid
impinger, with precautions against overloading) should give a reliable
visual estimate of the number of particles in a measured volume of air.
The Cascade Impactor tends to reveal any spore clumps intact, and, if this
feature is undesirable, the liquid inpinger should be used to break the
aggregates. The more varied the population in species, size, and state of
aggregation, the harder it becomes to devise equipment to measure
microbial concentration in the air. Particles over lOju, in diameter must
be sampled directly and cannot be ducted around corners on the way to
the apparatus without heavy wall-losses.
Air hygiene in bacteriology has been mainly a study of the air within
buildings, and its equipment has therefore been developed for sampling
still or slowly moving air. Aerodynamic effects have been neglected,
despite the fact that bacteria are carried on 'rafts' or spray droplets of
greatly varying size, so that efficiency of retention has been achieved
but efficiency of collection has been neglected. Most devices, such as the
slit sampler and the electrostatic sampler, avoid this difficulty by pointing
the orifice upwards—but this makes them unsuitable for use in the open
air.
In outdoor aerobiology the sizes of pollen grains and fungus spores
{see Appendix I), and the variability of wind-speeds, has focused atten-
tion on collection efficiency. Results from the various 'surface' traps,
depending on natural deposition processes, are usually difficult to translate
into volumetric results. Over short periods while wind-velocity is constant
out-of-doors, or in a wind-tunnel, a vertical strip or cylinder can be
used to estimate concentration provided the wind-speed and the deposition
efficiencies of the particles concerned are known. If the particle's terminal
velocity is known, fairly close estimates can also be made by using theor-
etical formulae (e.g. of C. N. Davies & Peetz, 1956). Most data from sur-
face traps, such as gravity slide and Petri dish counts, cannot be translated
into concentration but merely measure surface deposition. Only the vast
diffisrences in natural concentrations, that occur at different times and
places, make it possible to infer changes from deposition records. Never-
theless Hyde (1959^) shows that in general and over a long period, gravity
105
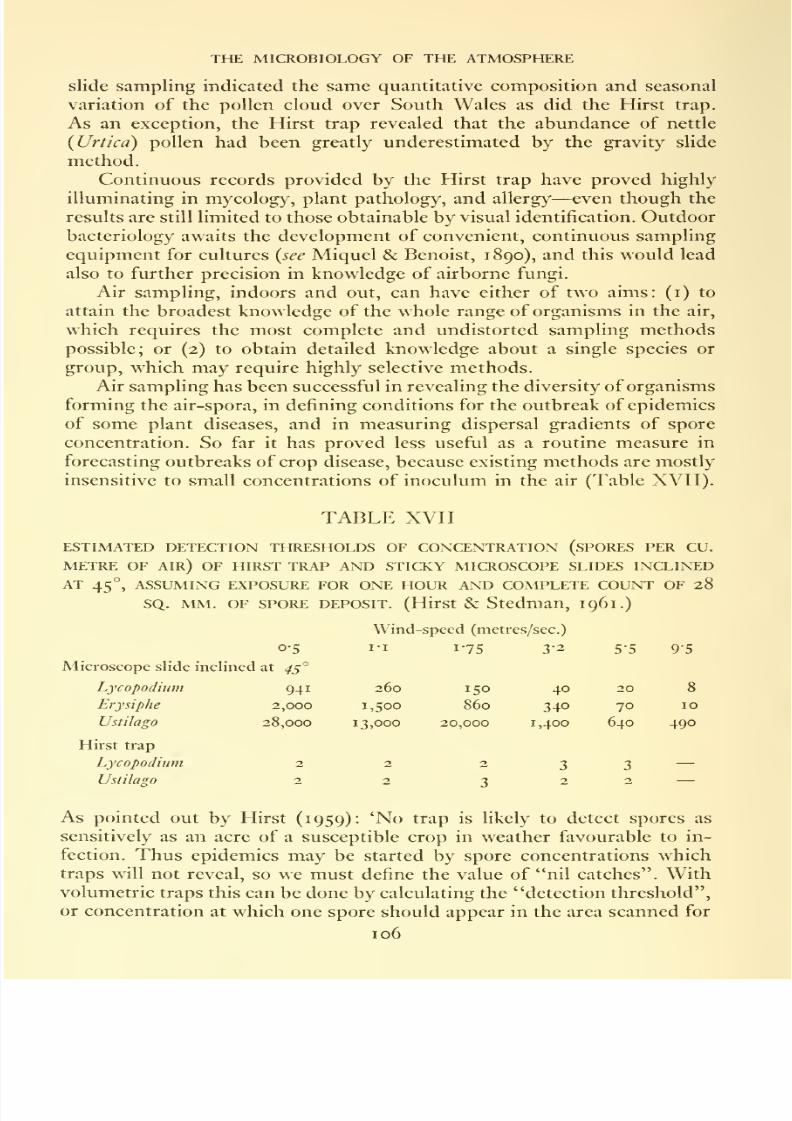
7/30/2019 Microbiology of at 00 Greg
http://slidepdf.com/reader/full/microbiology-of-at-00-greg 134/286
THE MICROBIOLOGY OF THE ATMOSPHERE
slide sampling indicated the same quantitative composition and seasonal
variation of the pollen cloud over South Wales as did the Hirst trap.
As an exception, the Hirst trap revealed that the abundance of nettle
{Urtica) pollen had been greatly underestimated by the gravity slide
method.
Continuous records provided by the Hirst trap have proved highly
illuminating in mycology, plant pathology, and allergy—even though the
results are still limited to those obtainable by visual identification. Outdoor
bacteriology awaits the development of convenient, continuous sampling
equipment for cultures {see Miquel & Benoist, 1890), and this would lead
also to further precision in knowledge of airborne fungi.
Air sampling, indoors and out, can have either of two aims: (i) to
attain the broadest knowledge of the whole range of organisms in the air,
which requires the most complete and undistorted sampling methods
possible; or (2) to obtain detailed knowledge about a single species or
group, which may require highly selective methods.
Air sampling has been successful in revealing the diversity of organisms
forming the air-spora, in defining conditions for the outbreak of epidemics
of some plant diseases, and in measuring dispersal gradients of spore
concentration. So far it has proved less useful as a routine measure in
forecasting outbreaks of crop disease, because existing methods are mostly
insensitive to small concentrations of inoculum in the air (Table XVII).
TABLE XVII
ESTIMATED DETECTION THRESHOLDS OF CONCENTRATION (SPORES PER CU.
METRE OF air) OF HIRST TRAP AND STICKY MICROSCOPE SLIDES INCLINTID
AT 45°, ASSUMING EXPOSURE FOR ONE HOUR AND COMPLETE COUNT OF 28SQ. MM. OF SPORE DEPOSIT. (Hirst & Stcdman, 1961.)
Wind-speed (metres/sec.)
05 i-i 175 3-2 55 95
Microscope slide inclined at 4^°
Lycopodium 941
Erysiphe 2,000
Ustilago 28,000
Hirst trap
Lycopodium 2
Ustilago 2
As pointed out by Hirst (1959): 'No trap is Hkely to detect spores as
sensitively as an acre of a susceptible crop in weather favourable to in-
fection. Thus epidemics may be started by spore concentrations which
traps will not reveal, so we must define the value of "nil catches". With
volumetric traps this can be done by calculating the "detection threshold",
or concentration at which one spore should appear in the area scanned for
106
260

7/30/2019 Microbiology of at 00 Greg
http://slidepdf.com/reader/full/microbiology-of-at-00-greg 135/286
AIR SAMPLING TECHNIQUE
each sample. In our routine scanning of hourly samples from the Hirst
trap the detection theshold is less than lo spores per cubic metre of air.
This high value explains why spore traps are of little practical use in
forecasting epidemics of potato blight which start from minute local
sources, but are valuable for apple scab or black rust, with which initial
spore concentrations may be high because of the sudden liberation of
accumulated spores or the arrival of a spore-laden air-mass.'
Before using an air sampler, its performance should be explored
experimentally. Consistency of performance alone is an unsatisfactory
criterion, because a trap may be consistently misleading.
107

7/30/2019 Microbiology of at 00 Greg
http://slidepdf.com/reader/full/microbiology-of-at-00-greg 136/286
IX
THE AIR-SPORA NEAR THE EARTH'S SURFACE
Ultimately we hope to attain an undistorted picture of the ambient
outdoor air-spora. All air-sampling methods are more or less selective.
This chapter deals with the concentrations of microbes in suspension in
air near the ground—that is, within the laminar and turbulent boundary
layers ordinarily inhabited by man, animals, and plants. The account is
based on the limited amount of information obtained by volumetric
air sampling with reasonably efficient apparatus. No attempt will be made
to summarize the extensive results from gravity-slide and Petri dish
traps, as these are already covered by excellent summaries by Feinberg
et al. (1946), Maunsell (1954), Werff (1958), and others, though theresults of long-term sampling with such surface traps will be drawn
upon for supplementary information when required.
Composition of the Air-Spora
Some 1,200 species ofbacteria and actinomycetes are recognized. Other
spore-producing plants include perhaps 40,000 species of fungi, numerous
mosses, liverworts, ferns and their 'allies', and more than 100,000 species
of pollen-producing flowering plants of which about 10 per cent are
wind-pollinated. (Of the Protozoa able to enter the air-spora, our informa-
tion is very meagre and unsystematic.)
A taxonomist, having in mind the twenty-five volumes of Saccardo's
Sylloge Fungoriim or the many volumes and supplements of Index
Kewensis, may wonder what useful statements can possibly be made about
the air-spora where most of the fungus or other plant bodies whose
characters could aid identification are lacking. Fortunately, as a cursory
microscopic examination of the deposit from an impactor trap shows,
the potentially airborne organisms are not all equally common in the air.
One sample is normally dominated by one or two types of spore, with
several other types in fair abundance and many more encountered in
ones and twos only. The frequency distribution of individuals of different
species in an air-spora resembles the series of the logarithmic and log-
normal types discussed by Fisher etal.
(1943), and by Williams (1947,i960). Investigation will doubtless show that different air-sporas have
different 'diversities'.
108

7/30/2019 Microbiology of at 00 Greg
http://slidepdf.com/reader/full/microbiology-of-at-00-greg 137/286
THE AIR-SPORA NEAR THE EARTH'S SURFACE
In practice the problem of recording an air-spora requires the recogni-
tion of a number of categories for the organisms most commonly present
in the sample, including a miscellaneous group, which may ultimately
contain from lo to15
per cent of the total. Pollens of flowering plants can
often be identified to the species level, and so can a few fungal spores
especially of the Urcdineae and some other plant pathogens (Appendix I,
p. 207). In samples of the outdoor air, bacteria can seldom even be
recognized visually as such, let alone identified, and the only sampling
devices suitable for their study involve making cultures. In practice the
categories adopted are of varying degrees of arbitrariness, and the names
are applied to them for convenience of reference ; but the different cate-
gories behave so differently thatit
would be intolerableto
have no way ofreferring to them.
Taxonomic Groups Needing Study in the Air-Spora
We now have some knowledge ofthe occurrence of bacteria, fungi, and
pollens as components of the outdoor air-spora, but there are some groups
whose presence is obvious enough yet about which we have scarcely any
quantitative information. Thus I know of no systematic records havingbeen kept to assess the concentration of actinomycetes, and of moss and
liverwort spores, in the atmosphere.
(i) Protozoa. For these we have the estimate by Miquel (1883) of an
average of o-i to 0-2 airborne protozoan 'eggs' per cubic metre at the
Observatoire Montsouris, Paris. Using a Pasteur-type filter, Puschkarew
(191 3) sampled air near ground-level on the right bank of the Neckar
downstream from Heidelberg. In forty-nine tests, on different occasions
and at different times of the day, his catch works out at an average of 2-5
protozoan cysts per cubic metre of air. His cultures included species of
Amoeba, Bodo, Monas, Calpoda, etc. Curiously enough, he concluded
that this concentration was too small to account for the observed almost
world-wide uniformity of species of freshwater protozoa, and that other
dispersal routes must be important (as no doubt they are). This study
awaits convenient techniques.
(ii) Algae. Microscopic terrestrial and freshwater algae occur in the
air, but have been little studied. A few samples were taken on the roof
of buildings at Leiden by Overeem (1937), using the 'standard aeroscope'
and Rettger bubbler. At least forty algae were obtained from a total of
20 cubic metres of air, including: Chlorococctwi, Chlorella, Pleurococcus,
Stkhococcus, and Navicula.
The occurrence of blue-green algae resembling species of Gloeocapsa
or other members of the Chroococcaceae was recorded by Gregory et
al (1955) from continuous sampling with a Hirst trap at Thorney Island
in Chichester Harbour, England, from 30 June to 13 July, 1954. Concen-
trations averaged 1 10 colonies per cubic metre of air (averaging 8 cells per
109

7/30/2019 Microbiology of at 00 Greg
http://slidepdf.com/reader/full/microbiology-of-at-00-greg 138/286
THE MICROBIOLOGY OF THE ATMOSPHERE
colony). Diurnal periodicity showed maximum numbers near midnight
(210 colonies per cubic metre) and a minimum in the morning (30 col-
onies). Similar, but fewer, colonies were found regularly in London and
Rothamsted. They show^ed no pronounced seasonal trend, according to
Hamilton (1959), who also reported the rare occurrence of diatoms and
desmids. Evidently microscopic algae are widely prevalent in the at-
mosphere in numbers varying from a few to a few hundred per cubic
metre, and occasionally they may be heavily deposited on the ground
(D.S.I.R., 1931).
(iii) Ferns. For ferns the reports are few. At Rothamsted—with no
large areas of bracken within several kilometres, and only small quantities
within I km.—spores of the Pteridimn type occurred frequently in warm,dry weather from late July to mid September. They averaged 4 per cubic
metre, with a maximum concentration of 36 per cubic metre (Gregory &
Hirst, 1957; Hamilton, 1959).
Miquel's Work on Bacteria and Moulds
Recognizing the paucity of information on airborne microbes, Pierre
Miquel made daily counts in Paris during the last quarter of the nineteenth
century (cf. p. 9). Miquel's 'contribution to the microscopic flora of the
air' is probably the most sustained series of volumetric measurements
of the microbial population of the outdoor air ever attempted. Daily
observations in the Pare Montsouris, about 5 km. south of the centre of
Paris, served him as a standard for comparison with the polluted air in
the densely populated city. The bacteria of the outdoor air were classified
in the following percentages as: Micrococcus 66, Bacillus 25, Bacterium 6,
Vibrio 1-2.
Miquel (1899) shows a seasonal variation in total bacterial and mouldconcentrations (Table XVIH). Most of the samples were taken with a
form of the Pasteur trap {see p. 5), using a sterile plug of powdered an-
hydrous sodium sulphate as a filter. This was dissolved after exposure
and inoculated to flasks of filtered saline beef extract. At the Pare Mont-
souris, bacteria were nearly three times as numerous in summer as in
winter, but moulds fluctuated rather less. Near the Hotel de Ville in the
centre of Paris, bacteria showed a similar seasonal variation but were 2|
times as many as in the Pare; moulds were 10 times as numerous but
showed little seasonal variation. At first Miquel argued that, as only
one-tenth could have been blown in from the country to the centre of the
city, the rest must have come from houses. But after the year 1881 he
noted a steady annual decline and he attributed this to improved street
cleaning and washing to lay dust which, we may suppose, consisted
largely of soil enriched with horse droppings. Data are also given for a
narrow, unhygienic street, and for one of the main sewers of Paris. The
air of sewers was no more highly contaminated than the outside air, and
was often surprisingly pure (Chapter XH).
no

7/30/2019 Microbiology of at 00 Greg
http://slidepdf.com/reader/full/microbiology-of-at-00-greg 139/286
THE AIR-SPORA NEAR THE EARTH S SURFACE
TABLE XVIII
MEANS OF MONTHLY MEAN NUMBERS OF BACTERIA AND MOULDS PER CUBIC
METRE OF OUTDOOR AIR IN PARIS (Miquel, 1 899), IN CULTURE IN NEUTRAL
BEEF BROTH

7/30/2019 Microbiology of at 00 Greg
http://slidepdf.com/reader/full/microbiology-of-at-00-greg 140/286
THE MICROBIOLOGY OF THE ATMOSPHERE
weather coloured spores abounded. Re-invasion of the air after rain was
mostly by colourless organisms, which Miquel diagnosed, probably
incorrectly, as immature spores. Rain and warmth increased the atmos-
pheric fungus sporecontent,
thoughthis might decrease during high
winds because their extra lifting power did not compensate for their power
of desiccation and, hence, killing.
DIURNAL PERIODICITY
(i) Diurnal periodicity in numbers ofbacteria outdoors could be studied
only on selected days of the year because, by Miquel's methods, for
hourly studies from 600 to 700 culture flasks had to be handled in one
day. The fullest data are probably those of 1884, which showedcontinual
change from hour to hour ofthe day in relation to changes in meteorological
factors that have not yet been unravelled.
NOON
Fig. 19.—Diurnal periodicity of total numbers of bacteria in air at the Observatoire
Montsouris, Paris, based on hourly readings between March 1882 and September 1884
(Miquel, 1886).
Bacterial numbers showed diurnal periodicities differing between
Montsouris and the centre of Paris. At Montsouris there were two daily
maxima at o8-oo hours and 20-00 hours, and two minima at 02-00 hours and
14-00 hours, respectively (Fig. 19). In the centre of Paris, however, there
tended to be a single maximum at 14-00 hours and a minimum at 02-00
hours during most of the year, but in autumn the double peaks tended to
occur in central Paris as at Montsouris.
This diurnal variation was shown to hold irrespective of wind direc-
tion—an effect that was possibly in part attributable to mechanical causes
such as traffic and the sweeping of streets. Furthermore the peaks occurred
112

7/30/2019 Microbiology of at 00 Greg
http://slidepdf.com/reader/full/microbiology-of-at-00-greg 141/286
THE AIR-SPORA NEAR THE EARTH's SURFACE
also in rainy weather so long as not more than 2-3 mm. of rain fell in 24
hours. Miquel also showed that the outside changes soon penetrated
into the rooms of buildings unless they were exceptionally well sealed.
(ii) Diurnal periodicityof ttwuld spore numbers resembled that of
bacteria. Trapping by impaction on a moving slide which gave him hourly
readings, Miquel found that moulds had two maxima at o8-oo and 20-00
hours. These maxima were independent of wind velocity and fluctuated
much more than did bacterial counts. Miquel then tried 15-minute
sampling periods and discovered the important principle that hourly
values are merely a smoothing of still more rapid fluctuations; he says
(transl.) 'what I wish to establish by all these examples is the variability
of the nature of the organisms living in the atmosphere'.
RELATIVE NUMBERS OF BACTERIA AND MOULDS
Miquel had started with the aim of describing the cryptogamic flora
of the atmosphere, and in the earlier years of his work he reported much
larger numbers of moulds than bacteria.
In 1879 Miquel was assessing mould spores visually by a continuously
operated, aspirated aeroscope at 2 metres above ground-level at the centreof a lawn in the Pare. He caught microbes at 100 times the rate of the non-
aspirated aeroscopes ofMaddox and Cunningham, and he concluded that
less than 10 per cent of the organism seen visually would grow in culture.
The numbers of germs (principally mould spores as showTi by his draw-
ings) in the air at the Pare Montsouris during continuous sampling in 1878
averaged 28,500 per cubic metre. In rainy periods in June they rose to
100,000 or even 200,000 per cubic metre. In winter the numbers were as
low as 1,000 per cubic metre during snow, though they might be 14,000 per
cubic metre when the wind came from over the centre of Paris. Numbers
increased again in spring ; they remained high in summer and diminished
again in autumn.
By the 1890's Miquel had lost interest in airborne moulds, and for
sampling air he constantly recommends the use of sugar-free media which
discourage moulds but enhance bacterial counts. Henceforth the mould
counts which he reported fell to the level of the bacteria and, by deliber-
ately using a selective medium, he could forget the rich fungus spora that
had embarrassed him in the earlier years. The values already given (Table
XVIII) are for media which favour bacteria but repress moulds, and are
certainly underestimates for the latter.
Knowledge of the broad features of the bacterial flora of the outdoor
air near the ground remains to this day substantially as Miquel left it at
the beginning of this century. Further, comparable measurements in this
century include those by: Forbes (1924), Wells & Wells (1936), Buch-
binder et al. (1945), and Colebrook & Cawston (1948). On the whole the
topic has been neglected and, significantly, the American Association for
H 113
7/30/2019 Microbiology of at 00 Greg
http://slidepdf.com/reader/full/microbiology-of-at-00-greg 142/286
THE MICROBIOLOGY OF THE ATMOSPHERE
the Advancement of Science's book on ^Aerobiology^ (Moulton, 1942) has
no chapter on bacteria in outdoor air over land.
Recent Study of Fungi and Pollen
The pollen and fungus components of the outdoor air-spora have
attracted much attention in this century, and the development and ex-
tensive use of volumetric sampling equipment for the purpose has been
highly illuminating. Quantitative visual counting of spores from 3 /x in
diameter and upwards, confirms Miquel's impression of recurrent 'tides'
of spore concentration ; but different groups of organisms are now known
to have separate 'tidal waves', and the concentration and composition ofthe air-spora varies enormously with place, season, time of day, weather,
and human activity.
THE AIR-SPORA AT 2 METRES ABOVE GROUND-LEVEL
Continuous records in a mixed agricultural environment were obtained
during the summer of 1952 by Gregory & Hirst (1957), using the Hirst
automatic volumetric spore-trap. The mean spore concentration at 2
metres above the ground over the period i June to 25 October was 12,500
spores per cubic metre. These were grouped visually into twenty-five
categories. The commonest spore-type was Chidosporiimi (probably mainly
C. herbarum)^ which accounted for 47 per cent of the total. The second
commonest were classified as hyaline basidiospores and made up 31 per
cent of the season's catch; most of these were probably spores of species
of Sporobolomyces, with Tilletiopsis adding another 0-56 per cent. Coloured
basidiospores of mushrooms and toadstools (agarics, boleti, and bracket
fungi) amounted to 3-3 per cent of the season's total. Pollen made up i
per cent of the total. Conidia of pow^dery mildews (Erysiphaceae), 'brand
spores' of Ustilago species, and conidia ofAltemaria, amounted to between
I and 2 per cent each. Ten other recognizable categories contributed
between 0-03 and 0-5 per cent each. All other particles recognizable as
spores of micro-organisms were put in the 'unclassified' category, totalling
8 per cent of the season's catch, and included many organisms which,
although abundant in soils, form only an insignificant fraction of the
summer outdoor air-spora (for example, PeniciUiimi, Aspergillus, and
various Mucoraceae). Bacteria and actinomycetes are not revealed by this
trap method, which is efficient only for particles over 3 /^ in diameter.
In Britain the attempts to get a relatively undistorted picture of the
outdoor air-spora have demonstrated beyond doubt that Cladosporium
and Sporobolomyces predominate, followed by the hyaline and coloured
basidiospores of the mushrooms and toadstools. Fewer in number, but not
necessarily less in total volume, are the pollens, Alternaria, ascospores,
and the large-spored plant-pathogenic fungi. Under ordinary conditions,
splash-borne types seem not to amount to more than a few per cent of the
114

7/30/2019 Microbiology of at 00 Greg
http://slidepdf.com/reader/full/microbiology-of-at-00-greg 143/286
THE AIR-SPORA NEAR THE EARTHS SURFACE
total alr-spora. Many other t^'pes are also found, but they are infrequent,
except in special localities or under special circumstances.
The importance of basidiospores from mushrooms, toadstools, bracket
fungi, and especially mirror-yeasts, as components of the air-spora,
is a recent discovery (Gregory & Hirst, 1952, 1957). It is remarkable
that even the existence of the Sporobolomycetes was unrecognized until
1930. Basidiospores are not efficiently caught by surface traps, and con-
firmation of their numbers (which were doubted at first) has been slow
in forthcoming. However, Hyde & Adams (i960) report that at Cardiff,
over the whole year of 1958, the basidiospore types collectively amounted
to 1,059 ou'^ of the average fungus spore content of 2,164 P^r cubic metre
of air. Furthermore, estimating volume instead of number, they showed
that basidiospores came second only to grass pollen. Daily estimates with
a slit sampler for one year at Manhattan, Kansas, gave the numbers of
basidiospores as 24-3 per cent of all spores caught—second only to
Cladosporium (Kramer et al.^ ig^ga).
THE AIR-SPORA AT OTHER HEIGHTS NEAR THE GROUNT)
In general the spore concentration increases at positions nearer the
ground than the standard sampling height of 2 metres, and decreases at
greater heights. Using a Hirst trap at 24 metres in a lattice tower at
Rothamsted, the average spore concentration was 81-5 per cent of that
at 2 metres, though some spores characteristic of the night air-spora
were actually commoner at the higher level (Gregory & Hirst, 1957).
Tests at heights below 2 metres with a portable suction trap in the
New Forest, England, showed a general decrease with height (Table XIX).
The difference was greatest at night, when the total spore concentrations
were lowest. By way of exception, Cladosporium numbers were reversed
at I3'00 hours: this is taken to mean that sources of Cladosporium were
not present close to the trap and that the air nearest the ground \^•as being
depleted of this organism in passage over the Earth's surface.
TABLE XIX
TOTAL NUMBER OF POLLEN GRAINS AND SPORES PER CUBIC METRE IN OAK-
BIRCH WOOD, NEW FOREST, ENGLAND, 23 JULY 1 953 (Gregory, 1 954).
Height above ground-level
7 cm. 30 cm. 120 cm.
05-00 hours G.M.T. 20,600 19,000 7^250
13-00 hours G.M.T. 31,300 24,200 20,300
In his studies of the 'phyllosphere' of cereal leaves, Last (1955)
sampled air among wheat plants at 11, 46, and 80 cm. above ground-level
and found 237,000, 170,000, and 41,000 spores of Sporobolomyces per
cubic metre, respectively.
115

7/30/2019 Microbiology of at 00 Greg
http://slidepdf.com/reader/full/microbiology-of-at-00-greg 144/286
THE MICROBIOLOGY OF THE ATMOSPHERE
The air-spora at greater heights than in these examples is deak with in
Chapter X.
TABLE XX
DIURNAL PERIODICITY IN THE AIR-SPORA ON LAND (APPROXIMATE TIME OF
MAXIMUM CONCENTRATION IN THE LOWER ATMOSPHERE AS RECORDED BY
VOLUMETRIC SAMPLERS)
Organism

7/30/2019 Microbiology of at 00 Greg
http://slidepdf.com/reader/full/microbiology-of-at-00-greg 145/286

7/30/2019 Microbiology of at 00 Greg
http://slidepdf.com/reader/full/microbiology-of-at-00-greg 146/286
Pollen [L]
THE MICROBIOLOGY OF THE ATMOSPHERE
Alternaria
9 ^Cladosporiuw
^
--0--

7/30/2019 Microbiology of at 00 Greg
http://slidepdf.com/reader/full/microbiology-of-at-00-greg 147/286
THE AIR-SPORA NEAR THE EARTHS SURFACE
(iv) The afternoon pattern develops from noon to i6-oo hours and
contains the majority of the day-time spore forms, notably: Cladosporium,
Alternaria^ conidia of Erysiphe, many other Fungi Imperfecti, uredospores
of rusts, and brand spores of smuts.(v) The evening pattern. The early part of the evening, from lyoo
to 21-00 hours, forms another interlude with few well-defined maxima,
until the nocturnal spora starts at about 22-00 hours, lasting until dawn.
All these diurnal periodicities are based on mean records for a number
of days. Weather on a particular day may disturb the normal rhythm
:
for example, Sporobolomyces may persist to 10-00 hours or later; anthesis
of grasses may be suppressed in dull weather, when pollen concentration
may remain low. In the dry season in Nigeria, certain typically afternoon
types may occur in the forenoon (Cammack, 1955). One other feature is
shown by many organisms, namely, the rise from a low value to the
maximum is often steep, whereas the fall is relatively slow; with others,
such as Sporobolomyces., the reverse is often true.
Panzer et al. (1957) refer Leptosphaeria, Epicoccimi., Piricularia.,
Chidosporiimi, Diplodia, and Ophiobolus, to the 'night spora' with maxima
between 18-00 and 09-00 hours, and Nigrospora, Penicillium, Alternaria,
Curvularia, and Tricoconis to the day spora, with maxima between o8-oo
and 17-00 hours. Some discrepancies with findings in Britain, such as the
occurrence of Chidosporium and Epicoccum at night, suggest that local
conditions favouring a high concentration in air may be found by day in
one climate and at night in another climate.
The causes of these diurnal fluctuations are complex. Hirst suggests
that those spores which are commonest in the forenoon depend on hygro-
scopic changes during drying to liberate their spores ; commonest in the
afternoon are often those pollens and spores which are passively dispersed
by shaking and wind erosion from dry surfaces, and conditions favour
their liberation in the afternoon. Some nocturnal forms, such as Sporo-
bolomyces., Tilletiopsis, and some ascospores, depend on dew\ High night-
concentrations need not always be interpreted as resulting from an increased
number of spores being discharged at this time. We do not yet know
whether the basidiospore diurnal rhythm (Fig. 20) reflects a diurnal
spore-production rhythm, or whether spore emission is relatively constant
during the 24 hours, being diluted through the considerable height of the
turbulent boundary layer by day, but remaining concentrated near the
ground during the night—when eflfects of frictional and thermal turbulence
are usually small.
SEASONAL CHANGES
Seasons aflfect the air-spora profoundly. Cladosporium and Alternaria
show pronounced seasonal periodicity, as of course do the pollens and
spores of mosses, pteridophytes, and plant-pathogenic fungi. On the
other hand PenicilUum may show little seasonal change, whilst in cities
119
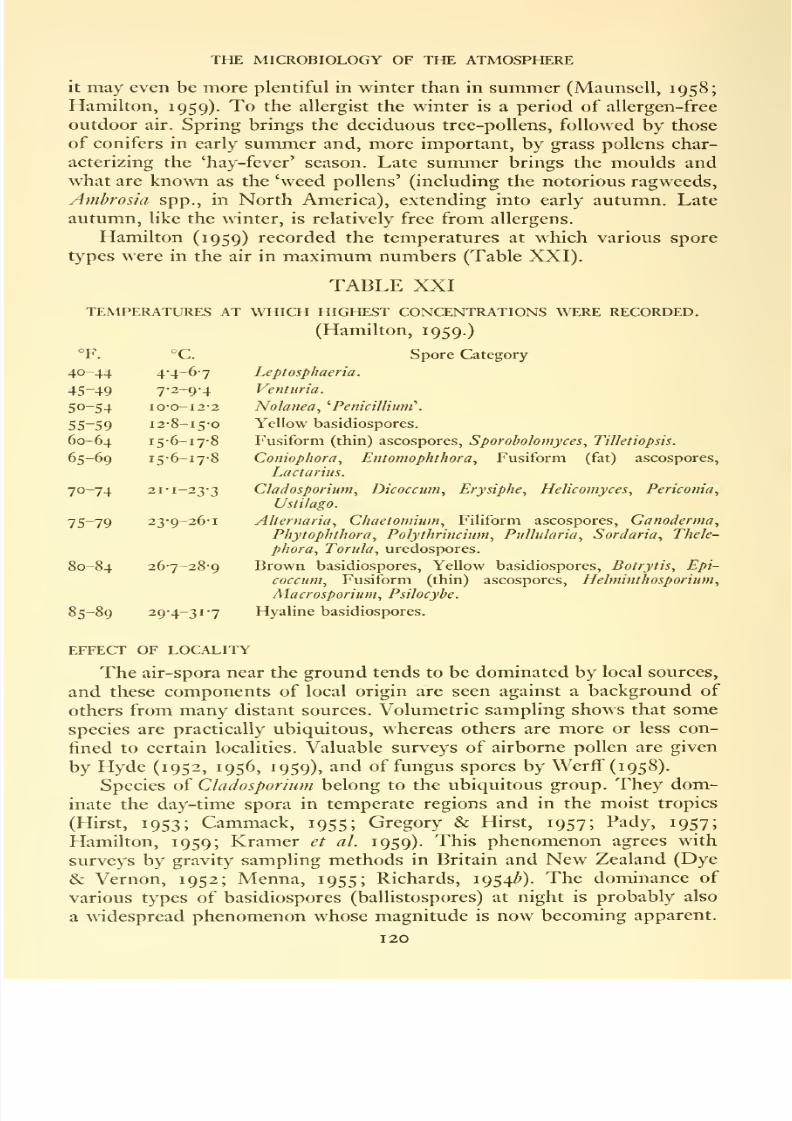
7/30/2019 Microbiology of at 00 Greg
http://slidepdf.com/reader/full/microbiology-of-at-00-greg 148/286
°F.

7/30/2019 Microbiology of at 00 Greg
http://slidepdf.com/reader/full/microbiology-of-at-00-greg 149/286
THE AIR-SPORA NEAR THE EARTH S SURFACE
At Rothamsted, Gregory & Hirst (1952) found that between early August
and late September the concentration of coloured basidiospores seldom
fell below 1,000 per cubic metre. From June to October, 1952, coloured
basidiospores formed 3-3 per cent and hyaline basidiospores 46-5 per centof the total air-spora in the size-range above about 4^, and their
abundance at Rothamsted in 1954 was confirmed by Hamilton (1959).
It soon became clear that the hyaline basidiospores were mostly from
colonies of Sporobolomyces occurring on leaves, and that their abundance
varied greatly in different places. Last (1955), when sampling air within
a stand of wheat, found large differences in concentration of Sporobolo-
myces between manured and unmanured plots in the same field (Broad-
balk field, Rothamsted). The highest concentration of sporobolomycetespores so far reported (up to i million per cubic metre) was found near
Chichester Harbour, England (Gregory & Sreeramulu, 1958).
CLADOSPORIUM
100
RELATIVE
NOS.
50
ROTHAMSTED
G-~0---0- LONDON
01 15 2 3 HRS. 6.M.T.
Fig. 21.—Diurnal periodicity of Cladosporium at London (South Kensington) and Harpen-
den (Rothamsted), based on Hirst trap catches from May to September, 1954. (Reproduced by
permission of Elizabeth D. Hamilton from Acta Allergologica, 1959.)
In any one place it is difficult to disentangle the respective contributions
of local and distant sources. It might be expected that spore concentrations
would be lower in a city than in the near-by countryside. This was indeed
found by Hamilton (1959), who compared continuous records from two
Hirst traps, one at Rothamsted (2 metres above ground) and the other
in London (16 metres above ground on a roof in South Kensington). The
counts of total pollen were higher in London because of a large excess of
Platamis (plane) pollen, but grass pollen grains were 50 per cent more
numerous in the country. Fungus spores outnumbered pollen grains by
121

7/30/2019 Microbiology of at 00 Greg
http://slidepdf.com/reader/full/microbiology-of-at-00-greg 150/286
THE MICROBIOLOGY OF THE ATMOSPHERE
75 to I, and although counts in London were less than half those at
Rothamsted, they still averaged 6,500 per cubic metre during the 1954
season. With some species, diurnal changes in concentration tended to be
less pronounced in London than in the country (Fig 21); this may per-
haps have indicated that spores of the species trapped in London came
mostly from distant sources.
Results of extensive surveys on a roof at Manhattan, Kansas, are based
on daily sampling at approximately 09-00 local time. A Pady-Rittis slit
sampler was used for visual identification and the G. E. Electrostatic
sampler for making cultures on Rose-Bengal agar. The maximum numbers
of fungus spores recorded at one time was 100,000 per cubic metre in
visual traps and 20,000 per cubic metre in culture (Pady, 1957; Rogerson,
1958; Kramer et a I. 1959). The main constituents were identified as
follows
:

7/30/2019 Microbiology of at 00 Greg
http://slidepdf.com/reader/full/microbiology-of-at-00-greg 151/286
THE AIR-SPORA NEAR THE EARTH S SURFACE
ejected. Spores of Ophiobolus graminis, the wheat take-all pathogen, do
not occur in the air during dry weather, but they reached a concentration
of 3,700 per cubic metre in air over wheat stubble within 2 hours of the
fall of 1-3 mm. of rain; a few ascospores were liberated by as little as
0-25 mm. of rain (Gregory & Stedman, 1958). Ascospores of some species
are evidently discharged when the ground is wet with dew, and these
types appear as part of the nocturnal air-spora.
Little is known yet about the composition of the damp-air spora, or
about the occurrence of spores taking-off in rain-splash, and their study
awaits improved technique.
Hamilton (1957) studied correlations at two centres (London and
Rothamsted) between spore concentration of twent\'-eight visual types
and the weather. Her main positive findings are as follows. Rainfall had
no effect on the atmospheric concentrations of hyaline basidiospores
(including those of Nolanea, Lactarius^ Tilktiopsis^ and possibly Sporo-
bolomyces). The concentrations of pollen and of most t}'pes of spore
decreased with rain, but all ascospore types and Helicomyces increased
with rain. In half of the types studied, concentrations were significantly
increased by increases in temperature, dew-point, or relative humidity.
The only significant decreases were in grass pollen (and possibly Ustilago
spores) with increased relative humidity, and in Nolanea with increased
dew-point. Sunshine had no significant effect except for positive corre-
lation with Ustilago and algal groups i^Gloeocapsa'). Increased wind
significantly decreased the concentration of Alternaria, some basidio-
spores (including Ganoderma, Tilletiopsis, and Sporobolomyces)^ Botrytis,
Cladosporium, Entomophthora, PuHularia, uredospores, insect fragments,
and Urtica pollen. By contrast, plant hairs and algal groups (^Gloeocapsa^)
were increased by increasing wind-speed—possibly because both are re-
leased by friction. Gustiness was associated with increases in Alternaria^
filiform ascospores, and Ustilago.
Conidia of Cladosporium., one of the best studied of the spore t}''pes,
show an interesting anomaly in relation to weather. Hamilton (1959)
found an appreciable decrease in their number during the hours when rain
was falling, but Ainsworth (1952), Hirst (1953), and Gregory (1954)
demonstrated a transient increase in concentration of Cladosporium spores
when rain started to fall. So far this phenomenon remains unexplained.
BIOTIC FACTORS
Human activity can also play a part in affecting atmospheric spore
concentration. Mowing and tedding of grass can produce a great and
immediate local increase in Cladosporium and Epicoccum spores, and
(with an apparent delay of 2 hours) of grass pollen (Sreeramulu, 1958).
Threshing of grain produces a local spore source (Heald & George, 191 8).
The role of overhead irrigation must not be overlooked, and spraying
123

7/30/2019 Microbiology of at 00 Greg
http://slidepdf.com/reader/full/microbiology-of-at-00-greg 152/286
THE MICROBIOLOGY OF THE ATMOSPHERE
with insecticides and fungicides has been claimed to spread some fungal
diseases.
Marine Air
The oceans, forming three-quarters of the Earth's surface, act as a
vast source, putting a mainly bacterial microbial population into the
atmosphere. Compared with air over land, the concentration in surface
layers over sea is usually very small. Processes by which marine organisms
become airborne include : spray droplets from the breaking of waves on
shore or at sea; foam blown off white-caps; and bursting of bubbles
produced by white-caps, rain or snow (Blanchard & Woodcock, 1957).
These processes, however, also facilitate removal of suspended particles
from sea-air by the large liquid surface whose relatively constant tem-
perature determines continued up-and-down movement in the lower
layers of air.
Much of the older work is reviewed, and new data added, by ZoBell
(1946). A critical appraisal of the whole subject of aerobiology comes from
Jacobs (1951), who calculated, on the basis of salt-concentration of the
air and the bacterial concentration of sea water (which seldom exceeds
500 per cc), that the number of marine bacteria in air near the sea surface
averages about 5 per cubic metre.
The microbial exploration of marine air was pioneered by Miquel
(1885, 1886) with the help of a sea captain, Mons. Moreau, during seven
voyages. For visual examination of crytogamic spores, an aspirator was
worked by suction provided by an engine condenser—an arrangement
which sampled 700 litres per 24 hours. Bacteria were estimated by drawing
air through glass-wool plugs in tubes at the rate 1,000 litres per 24
hours, washing the plugs, and inoculating aliquots into flasks of liquid
beef extract. A total of 113 cubic metres sampled in the seven voyages
averaged i bacterium per cubic metre, or o-6 per cubic metre if samples
taken within 100 km. of land were excluded.
Visual counts over the ocean usually showed a few hundred cryto-
gamic spores and many pollen grains per cubic metre (i/30th of the
number usual on land), but on one occasion a total of 3,700 per cubic
metre were found at a distance of 30 km. from land in a wind off the coast
of Senegambia; this comprised a spora very different from that found by
Miquel in Paris. Near to continents the winds coming from land always
brought impure air, but the sea rapidly purified it and so a broad stretch
of water provides an effective obstacle to the spread of contagious epi-
demic diseases. In normal weather, bacteria from sea water were not put
into the air, but in rough weather Miquel found that the sea air contained
a few marine bacteria.
The air in a ship's saloon always contained incomparably more
microbes than sea air, but its purity increased rapidly in the early days
of the voyage until it reached an equilibrium between purification by
124

7/30/2019 Microbiology of at 00 Greg
http://slidepdf.com/reader/full/microbiology-of-at-00-greg 153/286
THE AIR-SPORA NEAR THE EARTH S SURFACE
ventilation and contamination by vital activity on board—at a level of
perhaps i per cent of that in dwellings in Paris. Nevertheless, Miquel
concluded, a ship travels in an atmosphere of self-contamination with
bacteria, moulds, and starch grains.On a voyage to the Caribbean, B. Fischer (1886) found very few
terrestrial microbes in ocean air—except near major land-masses, where
large numbers of bacteria appeared, apparently derived from the soil.
Flemming (1908) sampled air on a voyage from Hamburg to Rio de
Janeiro and Santos. Of his numerous 20-litre samples taken more than
200 km. from land, two-thirds were sterile—but even at this distance he
averaged thirty-four viable spores per cubic metre. These were mostly
of moulds and yeasts, though bacteria increased in proportion nearer to
land.
Although over the sea the air is extremely pure in comparison with air
over land, most investigators on board ship have found bacteria, yeasts
and mould spores wherever tests have been made. Bisby (1935) exposed
Petri dishes on a voyage from Montreal to England and isolated bacteria,
Botrytis cinerea^ and Phoma hibernka, all near the coast of Ireland.
The microbes of marine air have been studied at the Scripps Insti-
tution of Oceanography, California, by ZoBell & Mathews (1936) andZoBell (1942). They claimed that less than 5 per cent of bacteria in sea
water will grow in freshwater nutrient media, and a still smaller percen-
tage of freshwater bacteria will grow on sea-water media. Petri dishes
of nutrient media made up with distilled water (FW) or sea water (SW)
were exposed horizontally at distances of up to 1,600 metres inland from a
sea wall during a sea breeze of 5-8 m.p.h. (2-6 metres per sec). The
^SW count decreased and the 'FW count increased with the distance
inland, the 'SW'/'FW ratio decreasing steadily from 10-20 at the sea
wall, to i-o at 400 metres, and 0-5 at 1,600 metres inland. The number of
mould spores usuallv increased with increasing distance from the sea.
In a land breeze, littoral spray puts into the air salt-water bacteria
which can be detected at up to 8 km. out to sea, after which the ratio
'SW'/'FW goes down to i-o owing to the predominance of terrestrial
bacteria in the air for distances of 160 km. out to sea in fine weather.
Exceptionally at 880 metres height on Mt. Woodson, 32 km. inland, plates
exposed in a sea breeze following rain gave a ratio of 'SW/'FW = 2-06,
which was interpreted as indicating a predominance of marine bacteria
in the air in a region where soil bacteria normally predominate. It has
been calculated that an average of 127 cubic miles of sea water is put
into the Earth's atmosphere each year in the form of splash droplets,
and this would provide an average of only about one marine bacterium
per square centimetre of the Earth's surface per year—a small quantity
compared with the deposition rate from the land air-spora (ZoBell, 1942).
Although all workers agree that marine air contains extremely few
bacteria, ZoBell points out that the use of sea-water media might be
125

7/30/2019 Microbiology of at 00 Greg
http://slidepdf.com/reader/full/microbiology-of-at-00-greg 154/286
THE MICROBIOLOGY OF THE ATMOSPHERE
expected to increase the counts of earlier worliers by from lo to 20 times.
On these media gram-negative bacilH predominate, there are few cocci,
no vibrio or spirilla forms, and fewer than half were spore-formers. A pink
yeast has been reported from ocean air by several workers. This spora
contrasts strongly with the gram-positive rods, spore-formers, cocci,
Bacillaceae, and Micrococcaceae which, with mould spores, are normally
abundant in air over land (ZoBell, 1942).
Rittenberg (1939) sampled in (presumably horizontal) Petri dishes
at 21 metres above the deck of the vessel E. W. Scripps off the Pacific
Coast of California. Contrasts between sea-water and fresh-water media
were not so clear as in previous tests, and the numbers varied widely at
different stations; but, on the average, moulds decreased in numbers with
increasing distance from land (Table XXII).
TABLE XXII
NUMBERS OF MICROBES AND DISTANCE FROM LAND. SUMMARY OF 25 PETRI
DISH EXPOSURES AT 21 METRES ABOVE DECK (Rittenberg, 1 939).
Distance Average number of colonies per hour of
from land exposure (on 4 Petri dishes of each inoculum).
km. Sea-water Medium Tap-water Medium
Bacteria Bacteria
(and yeasts) Moulds (and yeasts) Moulds
0-20 45 115 20 200
20-300 48 79 13 69
300-800 71 20 39 36
Detailed examination of 100 bacterial and yeast cultures taken at
random by Rittenberg showed that 32 per cent were yeasts, 30 per cent
cocci, 15 per cent gram-negative rods, and the remaining 23 per cent
gram-positive spore-forming rods. They included: Bacillus subtilis^
B. flavus^ B. megatherium^ B. mjcoides, B. tufnescens, B. cohaerens, B.
laterosporus, Flavobacterium aquatilis^ Achromobacter liquifaciens^ Staphylo-
coccus aureus, S. albus, S. citreus, Micrococcus Jlavus, M. candidus, and
Sarcina jlava* One hundred mould cultures included: Cladosporium
(Hormodendrum), 22 per cent; Penicillium, 18 per cent; Alternaria—Macrosporium—Stetuphylium, 11 per cent; Cephalosporium, 7 per cent.
Others identified included : Plenozythia, Catenularia, Spicaria or Paecilo-
myces, and Trichoderma. To avoid the usual embarrassment of the micro-
biologist, all sampling in free air seems to have been done with sugar-free
media; otherwise, moulds might have been many times more abundant.
Rittenberg points out that this marine airborne flora is unlike that of sea
water itself, but resembles the air-spora over land.
* But additional information by ZoBell (1942) indicates that these identifiable
species were all from fresh-water plates.
126

7/30/2019 Microbiology of at 00 Greg
http://slidepdf.com/reader/full/microbiology-of-at-00-greg 155/286
THE AIR-SPORA NEAR THE EARTH S SURFACE
Although the air-spora over the sea is clearly largely of land origin,
Petri dish sedimentation tests are difficult to interpret and cultural and
volumetric work is needed on the contribution from the ocean itself
both in the zone of littoral influence studied by ZoBell, and far from shore.
The mode by which the ocean purifies the air flowing over it, and the fate
of airborne spores trapped by the ocean, are still obscure.
Earlier workers, including Miquel and B. Fischer, found marine air
almost free from pollen, but this freedom is now seen to be only relative.
Erdtman (1937) operated a vacuum-cleaner filter trap at the masthead of
the M.S. Drottningholm during a voyage from Gothenburg to New York
extending from 29 May to 7 June, 1937. Compared with the average of
180 pollen grains per cubic metre recorded during spring at Vasteras
(no km. west of Stockholm), he found only o-i8 per cubic metre in the
North Sea, and 0-007 P^^ cubic metre in mid-ocean, with an increase
again on approaching North America. Temporary higher concentrations
('pollen rains') occurred three times: oi Pinus (0-13 per cubic metre) in
the North Sea; of Almis viridis (0*045 P^^ cubic metre) and Cyperaceae
(o-oo6 per cubic metre) at a distance of 250 to 600 km. off" Newfoundland;
and of combined grasses, Plantago^ and Rumex (totalling o-i per cubic
metre) at 220 to 300 km. from Nova Scotia and Massachusetts. During
strong western and north western winds, about mid way between
Iceland and Ireland, Erdtman caught tree pollens {Alnus, Betula^ Coryliis^
Jiiniperus, Myricci^ Picea, Pinus, Popiilus, Qiiercus^ Salix, Tilia, Ulmus)
and herb pollens (Chenopodiaceae, Cruciferae, Cyperaceae, Ericaceae,
Gramineae, Plantago^ Umbelliferae, and Urtica)^ as well as spores of
Dryopteris and Lycopodium clavatiim.
Erdtman's volumetric sampling firmly establishes the occurrence of
pollen in small but measurable concentration near the surface of the sea
right across the Atlantic, and there is no reason to doubt that the land air-
spora extends to all parts of the globe. Confirmatory evidence comes from
Transatlantic sampling by Dyakowska (1947) and Polunin (cf. 1955).
Bishop Rock Lighthouse stands on a low rock at the southwestern
extremity of the Scilly Isles, which are a group of small, rocky islands
with few trees (mainly Ulmus and Pinus). Gravit}-' slide sampling on the
lighthouse platform 38 metres above sea-level (Hyde,1956)
showed mainly
pollen of Betula^ Qiiercus, and Fraxinus, with some Phtus. The total tree-
pollen deposit was quite large (2,800 per sq. cm. per year, compared with
2,000 at Aberdeen and Brecknock Beacons, and 10,000 at Cambridge).
The proportion of tree pollen of Bishop Rock was 27 per cent, and this is
t}''pical of country areas in Britain (in to\Mis it may reach 50 per cent).
It is remarkable that the greatest deposition of grass pollen recorded
for any centre in Britain during Hyde's gravit}^ slide survey was 1,679
grainsper 5 sq. cm. at Bishop Rock on 29 June 1953. Whether
this
resulted from high concentration, or from high efficiency of turbulent
deposition in strong winds, is not yet clear.
127

7/30/2019 Microbiology of at 00 Greg
http://slidepdf.com/reader/full/microbiology-of-at-00-greg 156/286
THE MICROBIOLOGY OF THE ATMOSPHERE
Sreeramulu (1958^) used a Hirst trap at 70 ft. above sea-level on a
voyage in the Mediterranean in October and November, 1956. At 5
to 50 miles from land he found an average of 56-4 fungus spores and i-6
pollen grains per cubic metre. In Malta Harbour the concentrations v^ere
121 and 1 2 per cubic metre, respectively. At sea, Cladosporiumpredominated
with 16 spores per cubic metre, followed by smuts with 5 per cubic metre,
and coloured basidiospores with 7 per cubic metre. Also of interest was
the occurrence ofspores oiHelminthosporium^ Alternaria, Torula herbarum^
Nigrospora^ Curvularia, and Epicoccum^ as well as hyphal fragments.
Pollen in marine air must come from land plants; the mould spora is
more characteristic of above-ground sources than of the soil; the bacteria,
however, may well come largely from sea water and soil.
The Air of Polar Regions
The air of polar regions seems to be still purer than that over the sea.
Levin (1899), who aspirated air through powdered-sugar filters, obtained
only three bacterial colonies and a few moulds in a total of 20 cubic metres
of air sampled at various points in Spitsbergen (Svalbard).
During 2 years on an island near Graham Land, Antarctica, Ekelof
(1907) exposed Petri dishes at intervals; 40 per cent of them grew bacteria,
which he thought came from the soil. On the average, one colony arose
per 2-hours exposure.
Pirie (191 2) exposed Petri dishes in the 'crow's nest' of the Scotia
in the Weddell Sea, Antarctica, during the summer of 1903, for as long as
20 hours, and also on a glacier at Scotia Bay during winter; they all
remained sterile. E. Hesse (191 4) exposed Petri dishes while at sea south
of Spitsbergen and also found the air to be almost sterile.
Darling & Siple (1941) exposed jars and dishes of media in remote
places in Marie Byrd Land, Antarctica, and from their isolations identi-
fied: Achromobacter delicatulum^ A. liquidum^ Bacillus albolactis, B.fusi-
fonnis, B. mesentericus, B. subtilis, and B. tumescens. They concluded that,
although some bacteria had been brought to Antarctica by man and
migrating animals, the vast majority must have come as atmospheric
dust in subsiding air.
Recent work in the Arctic has demonstrated a fair range but sparse
'population' of microbes to be present in the air in summer near ground-
and sea-level in various parts of those vast regions. Polunin (1954, 1955)
organized the exposure of sticky slides at several points ranging eastwards
from Point Barrow, Alaska, to Spitsbergen, in 1950, and found a consider-
able variety of pollen grains and 'probable moss spores' at each station.
Remarkably enough the pollen grains caught most plentifully through most
of that
summerin Spitsbergen were of Pinus
—several hundreds of kilo-
metres from their nearest possible source. In 1954 Polunin (1955^?) was
responsible for the exposure of sticky slides (cf. Polunin, i960) off the
128
7/30/2019 Microbiology of at 00 Greg
http://slidepdf.com/reader/full/microbiology-of-at-00-greg 157/286
THE AIR-SPORA NEAR THE EARTHS SURFACE
north coast of Ellesmere Island and, in 1955, for the exposure of sticky
shdes (Barghoorn, i960) and Petri dishes of nutrient media (Polunin
et al. i960; Prince & Bakanauskas, i960) on Ice-Island T-3 when it was
floatingin
the NorthPolar
Basinat
about 83°N. Hereagain the air-spora
was found to be very sparse compared with middle latitudes, but it
included pollen grains which, in some instances, were indicative of long-
range transportation (cf. Barghoorn, i960, p. 91, despite p. 88). From the
T-3 exposures a small number of slow-growing fungus isolates (all
identified as PeniciUiiim viridicatum) and more of Actinomycetes were
obtained, but none of bacteria.
The Origin of the Air-Spora
There is no reason to doubt the conclusion of Miquel and of Proctor
(1935) that most bacteria of the air originate from the soil, or from the
oceans (ZoBell, 1946). But it is doubtful whether the soil makes any sub-
stantial contribution to the fungus spore content of the atmosphere, as has
been argued by some writers. It seems more likely that this air-spora is
derived predominantly either from moulds, plant parasites, and other
fungi growing on vegetation, or from surface-growing fungi equippedwith explosive mechanisms which project their spores into the freely-
moving turbulent air layer. In the soil, bacteria, Penicillia, and Aspergilli
predominate; but Cladosporium predominates in the air, seconded by
basidiospores. Similarity between the soil- and air-sporas results mainly
from the soil being the ultimate 'sink' to which most of the spores of the
air are destined.
Much of the air-spora comes from wild vegetation. Industry pollutes
the atmosphere mainly with inorganic particles and gases. It is not
generally appreciated, however, that agricultural practices may pollute
the air with plant pathogens and with respiratory allergens on a large scale.
Even such small operations as mowing grass may cause a local increase
in the Cladosporium content of the air by a factor of 20 times, as I have
found in recent tests (and cf. Sreeramulu, 1958).
For microbes to get into the air in the high concentrations observed
at peak seasons, a take-off mechanism is necessary. However, the most
unlikely organisms occasionally get into the air. Siang (1949) isolated one
colony of the aquatic phycomycete, Hypochytrium catenoides, from air on a
roof at McGill University, Montreal, Canada. Probably almost every kind
of microbe would be found if sampling were continued long enough.
From recent work on the air-spora near the ground, we learn that its
composition and concentration often fluctuate enormously—sometimes
w ithin quite short time-intervals. The significance of this for plant path-
ology and plant breeding is obvious. Some constituents, such as the grass
pollens, are important in respiratory allergy (the volume of air inhaled by
the human lung is of the order of i cubic metre per hour). In the course
I 129

7/30/2019 Microbiology of at 00 Greg
http://slidepdf.com/reader/full/microbiology-of-at-00-greg 158/286
THE MICROBIOLOGY OF THE ATMOSPHERE
of 24 hours we inhale perhaps 50 micrograms of a mixture of microbes.
Ahhough some constituents of this mixture are harmful to allergic
subjects, this dose might also bring in useful quantities of active organic
compounds. Chauvin & Lavie (1956) found antibiotics in Salix and maizepollen, and their presence in fungus spores, too, would not be surprising
{see Whinfield, 1947). We may wonder whether the reputed beneficial
effects of country air for human health are attributable not only to its
freedom from smoke and fumes, but also to positive gains from the air-
spora.
Finally, to balance loss with gain, as the Earth's surface is the ultimate
receptacle of almost all spores liberated, it can be estimated that the soil
must receive a dose of fertilizer from the air-spora equivalent to perhaps2 kg. of nitrogen per acre per annum—an amount that is negligible on
fertile land, but enough to aid plants colonizing barren places.
130
7/30/2019 Microbiology of at 00 Greg
http://slidepdf.com/reader/full/microbiology-of-at-00-greg 159/286
WoodsHOLEMass.*
X
THE UPPER-AIR SPORA
The air-spora near the ground is dominated by fluctuations in its im-
mediate local sources. In the upper air, however, the effects of local sources
are smoothed out and attention can be focussed on organisms under-
going long-distance transport. Concentrations in the upper air are sparse,
the necessity of keeping samples free from contamination is paramount,
and sterile technique for enumerating the microscopically small particles
becomes exacting when they are exceedingly dilute.
Vertical Diffusion
Whereas spores and pollen grains are heavier than air, and tend to fall
under the influence of gravity, atmospheric turbulence and convection
tend to work in the opposite direction. As a result, the atmosphere is in a
sense a spore suspension that generally decreases in concentration from
ground-level up to the base of the stratosphere. Eddy diffusion will bring
spores to the top of the outer frictional turbulence layer: above this,
convection will operate and, in the upper part of the troposphere, we
would expect to find mostly components of the day-time spora. When it
first became possible to explore the air overhead, it was a matter of surprise
to find how far up microbes could go. As methods have been developed
for exploring greater and greater heights, we can begin to form a picture
of the changes in concentration with height and of the circulation of spores
of micro-organisms over the surface of the globe.
Evidence that concentration decreases with increasing height comes
from two distinct sources of information which have often been confused
:
(i) observations at a standard height above local ground-level at a chain
of stations differing widely in altitude above sea-level; and (2) observations
at widely different altitudes above local ground-level at a single station.
GROUND STATIONS AT DIFFERENT ALTITUDES AB0\T: SEA-LEVEL
Observ-ations in this category are extremely fragmentary and have the
flavour of holiday tasks on fine days in summer. Samples at various
altitudes are taken at successive times as the climber reaches a suitable
station—as in Pasteur'svisit
tothe
Merde Glace, where the relative
purity of mountain air was convincingly demonstrated {see p. 4). Using a
volumetric method, Miquel (1884, p. 524) confirmed this conclusion.
131

7/30/2019 Microbiology of at 00 Greg
http://slidepdf.com/reader/full/microbiology-of-at-00-greg 160/286
THE MICROBIOLOGY OF THE ATMOSPHERE
In July and August, while bacterial concentrations of 55,000 per cubic
metre were current in the air of the Rue de Rivoli in Paris, and 7,600 per
cubic metre in the Pare Montsouris, Miquel found only eight bacteria
(and numerous moulds) per cubic metre at a height of i metre above the
surface of a field at Lake Thun (570 m. above sea-level), and none at
stations between 2,000 metres altitude and the summit of the Eiger at
nearly 4,000 metres. Miquel attributed this purity to the effect of reduced
atmospheric pressure doubling the volume of air and diluting its dust
load, to the rarefied air less easily holding particles in suspension, and to
the absence of local sources of contamination—especially in the regions
of perpetual snow. In similar volumetric data from the Dauphine Alps
recorded by Bonnier et al. (191 1), bacteria decreased with height more
rapidly than moulds.
No one has yet compared concentrations at different heights above
ground-level over plateaux with those over mountains, or over flat and
convex surfaces at the same altitude.
The purity of the air in regions of perpetual snow is understandable,
but it is surprising that air at one or two metres above ground-level in
mountain valleys should also contain so few microbes. Geiger (1950)
envisages mountain slopes as covered with a skin of air having the usual
characteristics of air near the ground but easily removed by wind and
convection—except where protected by vegetation. Convex surfaces
generally have a more extreme climate than flat surfaces, and concave
surfaces are still more equable.
THE ROLE OF TURBULENCE
The role of turbulence in diffusing spore-clouds vertically was first
emphasized by Schmidt (191 8, 1925), although the theory was developed
for heat transfer by Taylor (191 5) with information derived from tem-
perature records over the Great Banks of Newfoundland. Schmidt
argued that, when a stable state of diffusion by eddies has been reached,
the number of particles falling under the influence of gravity across any
horizontal boundary is compensated for by the number of particles
moved upwards by diffusion, and so the concentration of particles in the
air should decrease exponentially with increasing height according to the
equation
VsZ
X = Xo exp. - -j-
where xo = concentration at height z = 0,
Vs = terminal velocity of fall,
A = Schmidt's 'Austausch' or intermixing coefficient which is
assumed to be invariable with height.
The total spore content of the column of air standing above i sq. cm.
132

7/30/2019 Microbiology of at 00 Greg
http://slidepdf.com/reader/full/microbiology-of-at-00-greg 161/286
THE UPPER-AIR SPORA
would be A =^ xo^l'^s- Concentrations should give a straight line when
plotted against the logarithm of the height.
The method of approach to the problem suffers from two defects in
practice. The coefficient for diffusion (Schmidt's 'A' or Taylor's 'K') is
not invariable with height, and it is doubtful whether a steady state is
ever reached with the great diurnal changes occurring when the source
consists of living organisms.
C. G. Johnson & Penman (195 1) supposed that the vertical distribu-
tion of aphids at any one time is determined by the net effect of upward
transport by turbulence and downward transport by the combined action
of gravity and biological impulse—the mean clearance rate. If x is the
concentration at height z, and co is the 'mean clearance rate', they deduced
that a graph of log x against log z should yield a straight line.
Attempts have been made to fit empirical curves to observational data
on vertical gradients. Wolfenbarger (1946, 1959) used regression equa-
tions of the t}'pe: Y = a + b log x + c/x. C. G. Johnson (1957) fitted
records of insect-trap catches with: f(z) = C(z + Ze)""^, where f(z) is
concentration at height z, C is a scale factor depending on population
size, A is an index of the diffusion process and the profile, and Ze is a
parameter whose significance probably depends on the rate of exchange
of insects between the air and the ground.
Particles entering the air near ground-level become mixed throughout
the layer of frictional turbulence so long as the wind blows. Convection
provides a local intermittent mechanism which distributes spores from
the ground layer throughout the troposphere. Observed vertical concen-
tration gradients sometimes fit theoretical lines quite adequately, and they
may well describe long-term averages. But theoretical treatments of this
problem are often unsatisfactory, especially in failing to predict concen-
trations in the first few hundred feet.
The ideal situation is seldom realized, because conditions change too
rapidly for a stable state to be attained. Wind velocity increases with
height, and layers of air at different heights in a vertical column at any
one time will previously have been over different places at different times.
The thickness of the turbulent layer of air is always changing. Biological
factors in a diurnal cycle put vastly differing numbers of organisms into
the air at different times, and vertical concentration is continually building-
up or decaying. Temperature inversions will affect vertical diffusion;
according to Jacobs (195 1), 'The presence of a stable layer at the surface
will prevent or retard the introduction of surface organisms into the upper
atmosphere but will, at the same time, maintain higher concentrations of
organisms in the surface layers ; the presence of a discontinuity surface
in the upper air will limit vertical transport in either direction, resulting
inthe
concentration oforganisms above
or below such a surface'. Con-
centration will often start to decrease from the active surface of a crop
and not from true ground-level.
133

7/30/2019 Microbiology of at 00 Greg
http://slidepdf.com/reader/full/microbiology-of-at-00-greg 162/286
the microbiology of the atmosphere
Early Studies of the Upper Air
Measurements of microbial concentrations at heights above ground-
level were first attempted from towers and tall buildings by Miquel
(1883), Carnelley et al. (1887), and, more recently, by Kelly and others
(cf, p. 143). Miquel found that the bacterial content of the air at the level
of the Lanterne of the Pantheon in Paris was only i/20th of that in the
street below.
Probing upwards into the atmosphere for microscopic life started
dramatically when the Manchester physician Blackley (1873) used two
kites in series to lift sticky microscope slides to a height of 300 metres
and caught from 15 to 20 times as much pollen as on slides similarly
orientated at 1-4 metres above the ground. Kites were also successfully
used in India by Mehta (1952) to catch spores of the cereal rusts, Puccinia
graminis, P. triticina^ and P. glumarum^ and small balloons were used for
the same purpose by Chatterjee (1931).
SAMPLING from BALLOONS
Cristiani (1893) obtained bacteria and a few moulds by volumetric
sampling from a balloon at up to 1,300 metres above Geneva (at a total
of 1,700 metres above sea-level). He was obviously puzzled by his results,
which he regarded as inconclusive, and he attributed most of his catch to
contamination from the surface of the balloon and its rigging—remaining
convinced that the upper air is extremely pure.
The credit for first demonstrating the existence of a microbial popula-
tion in the upper air should probably go to the mycologist Harz(1904),
who sampled during a balloon ascent over southern Bavaria on a sunny
morning in March. At altitudes of between 1,500 and 2,300 metres he
aspirated air through a Miquel-type filter ofpowdered sodium sulphate by
suction obtained with a horse's stomach-pump; culturing the catch in
nutrient gelatine, he found a few moulds, and bacterial concentrations
ranging from 179,000 to 2,870,000 per cubic metre. At 1,800 to 2,000
metres there was a zone with 16 times the concentration at 1,500 metres
and5
times that at2,300 metres. These phenomenally large bacterial
concentrations were associated with a large temperature lapse and strong
convection from hot dry soil. Moulds were identified as: PenicilUum
glaucum, P. cinereum, P. atro-viride^ Sporidesjiiium sp., Acreinonimn alter-
7tans, Mucor racemosus, M. mucedo^ Oospora ochracea, 0. ferruginea,
Perkonia arta^ Hormodendrum {Cladosporium) penicillioides, Arthrococciis
lactis, Aspergillus niger, and a sterile mycelium.
During ascents from Berlin with both captive and free balloons,
Flemming (1908) used trapping methods similar to those of Harz. Hefound viable microbes up to 4,000 metres, averaging 370 per cubic
metre above 500 metres, and 12,900 per cubic metre lower down. Sterile
134

7/30/2019 Microbiology of at 00 Greg
http://slidepdf.com/reader/full/microbiology-of-at-00-greg 163/286
THE UPPER-AIR SPORA
samples were rare. Concentrations were not uniform but increased strik-
ingly at the level of the cloud base. Species identified included : Alicro-
coccus radicatus, M. albus, M. Jiubilus, M. aerogenes, Bacillus ubiquitus,
B. aurescens, B. aureo-Jlavus, B. terrestris, B. aerophilus, B. submesenter-
oides, B. mycoides, and PeniciUium crustaceum—all spore-formers. Above
2,500 altitude he found Bacillus terrestris, B. aerophilus, and Sarcina lutea,
and, at 4,000 metres. Micrococcus citreus, M. luteus, and PeniciUium
crustaceum. Flemming commented on the frequency of pigment-formers
among the bacteria and yeasts of the upper air.
From catches made during balloon flights over southern Germany,
Hahn (1909) concluded that, on the average, bacterial and dust counts run
parallel with each other and decrease with height because of sedimentation.
He claimed that the air above a certain height was germ-free, and that this
zone was lower in winter than in summer.
THE STRATOSPHERE
We would expect the stratosphere to be almost devoid of organic
particles, because of the apparent inadequacy of mechanisms able to carry
them above the top of the troposphere. At great heights the intensity of
radiation would be unfavourable to survival. However, well-documented
evidence is worth more than theory and, for the present, we must admit
that we know nothing of the possibilities of life in the stratosphere.
The only attempt to sample the stratosphere known to me was made
with a balloon. Rogers & Meier (1936, 1936^) devised a sampler to be
opened and closed by an aneroid between 21,000 and 11,000 metres
during the descent of the Balloon 'Explorer H'. They obtained five
bacterial cultures, all of which were different species of Bacillus., and five
fungi {Rhizopus sp., Aspergillus fiiger, A.fumigatus, PeniciUium cychpium,
and Macrosporiutn tenuis);in all, these were equivalent to approximately
0-14 viable organisms per cubic metre.
SAMPLING FROM AEROPLANES
Exploration for microbes in the upper air from aeroplanes was started
in 1921 when Stakman et al. (igi^) exposed Vaseline-coated slides over the
Mississippi Valley to trap cereal rust spores. Flights from Texas as far
north as Minnesota and at altitudes up to 3,300 metres yielded numerous
pollen grains and fungus spores, among which Alternaria (often in chains)
were most numerous, followed by Puccinia, Helminthosporium, Clado-
sporium^ Cephalothecium., Ustilago^ Tilletia^ and Scolecotrichum. Among
rust spores the uredo forms predominated, but some teleutospores and
aecidiospores were also caught. Spores became relatively scarce at alti-
tudes above 3,000 metres. At 5,400 metres (the highest altitude tested),
two uredospores of Puccinia triticina were caught. Alternaria from alti-
tudes of 1,000 to 3,000 metres germinated readily, as also did uredospores
from 2,300 metres.
135

7/30/2019 Microbiology of at 00 Greg
http://slidepdf.com/reader/full/microbiology-of-at-00-greg 164/286
THE MICROBIOLOGY OF THE ATMOSPHERE
In the Slimmer and autumn of 1923, Mischustin (1926) exposed Petri
dishes of nutrient agar in flights from Moscow. On rather slender evi-
dence obtained from tests in a wind-tunnel, he concluded that he was
sampling 20 litres of air per minute—probably a large underestimate. The
plane was first flown above the layer to be sampled to free it from ground
dust, and then lowered to the required height. At 500 metres the num-
bers of bacteria increased in windy weather to 7,000 or 8,000 per cubic
metre, from Mischustin's normal of 2,000 to 3,000 at this altitude.
Micrococcus and Sarcina decreased greatly in calm weather, but the
number of bacterial rods and of moulds increased. At 1,000-2,000 metres,
numbers were small. The proportion ofspore-forming bacteria, ofmoulds,
and ofactinomycetes, was greatest at the greater heights. The concentration
oforganisms over the city of Moscow at 2,000 metres included an average
of 650 bacteria per cubic metre, and was from four to five times as great
as that over the surrounding countryside.
Pollen was found at up to 5,800 metres over the Mississippi, with the
greatest concentrations often at from 300 to 1,100 metres (Scheppegrell,
1924, 1925). Craigie & Popp (1928) caught wheat-rust spores at up to
3,000 metres over the Canadian prairies.
In flights from Cambridge, England, Weston (1929) found that fungi
and bacteria were abundant up to 3,000 metres, but relatively scarce
above this altitude. Air within clouds tended to contain more bacteria
and fungi than did air above or below clouds—a phenomenon noted by
other workers, including Heise & Heise (1948).
On flights up to 2,200 metres over the arid lands of southern Arizona,
Browne (1930) isolated 'white and grey' bacterial colonies, Aspergillus,
Penicillium., Alternaria, and yeasts; but no spores of wheat rusts wereobserved on slide spore-traps. Cotter (1931) studied dispersal of wheat
rust in flights near Lake Michigan, trapping on oiled microscope slides.
Uredospores were not more numerous during rain than in fine weather;
fewer were caught over Lake Michigan than over near-by land, and more
were caught over areas abounding in barberry (the alternate host of the
parasite). MacQuiddy (1935) exposed Petri dishes and slides in flights
up to 2,100 metres over Omaha, Nebraska. Pollen was abundant up to
900 metres, and bacteria and mould spores began to decrease between
1,200 and 1,500 metres. MacLachlan (1935) made flights in early May
over Massachusetts, to trace spores of the juniper rust {Gymnosporangium
biseptatum). Petri dishes exposed over the side of the 'plane for i minute
gave viable spores up to 600 metres (the maximum height tested),
although numbers and viability decreased steadily with height.
(i) Aerobiological work of F. C. Meier. Fred C. Meier of the United
States Department of Agriculture planned an extensive investigation
of the upper-air spora. Unfortunately, when only preliminary abstracts
of his work had been published, he was lost on a flight over the Pacific
Ocean (Haskell & Barss, 1939).
136

7/30/2019 Microbiology of at 00 Greg
http://slidepdf.com/reader/full/microbiology-of-at-00-greg 165/286
THE UPPER-AIR SPORA
Sticky slides were exposed by Colonel Charles A. Lindbergh in special
containers at about i,ooo metres altitude during a flight between Maine
and Denmark. Material trapped over Davis Strait and East Greenland
included algae, fragments of insects' wings, diatoms, and possibly sponge
spicules, volcanic ash, and glass. Fungus spores were tentatively identified
as belonging to: Macrosporium^ Cladosporium, Leptosphaeria^ Myco-
sp/iaerella, Trichotlieciiim^ Helicosporium, Uromyces, Camarosporium, and
VentKria. Some of these were abundant over Maine and Labrador but
diminished over Davis Strait, the ice-cap of Greenland, and Denmark
Strait (Meier, 1935, 1935^7).
Flights over the United States at from 150 metres to 5,500 metres
showed a varied spore 'population' which usually decreased in both
numbers and varietN'' above 2,400 metres. \'iable spores of Pestahzzia
were caught above Washington at 5,500 metres on 22 March 1932. Other
genera recognized included: Acremonklla, Alternaria (Macrosporium),
Aspergillus, ChaeTomium, Cladosporium, Coniothyriimi, Dejnatium, Epi-
coccuniy Fumago, Fusarium, Helniinthosporium, Penicillium, Sclerotinia,
StachybotrySy Stemphylium, and Trichoderma (Meier et al, 1933)-
After flights over the Caribbean Sea, Meier (1936) came to feel that
trade-winds might be important in disseminating microbes. Viable spores
were found at 800 to 1,200 km. from land; but after rain squalls, Petri
dishes sometimes remained sterile after exposure at 60-240 m. altitude a
few kilometres to the leeward of islands—so demonstrating that showers
remove spores from surface winds.
Sugar-beet pollen was trapped on agar plates during flights over a
small sugar-beet seed-growing area of 900 acres in New Mexico. Viable
beet pollen,
mixedwith pine pollen
andfungus spores, occurred up to
1,500 metres, which was the greatest height tested and the level of the
dust horizon (Meier & Artschwager, 1938).
(ii) Vertical gradients. During an epidemic of wheat rust in Manitoba
in July and August 1930, Peturson (1931) trapped spores at different
altitudes in eight aeroplane ascents. The average numbers of spores
caught per square inch of trap surface (presumably with comparable
exposure times) were: 305 metres, 10,050 spores; 1,520 metres, 1,180
spores; 3,050 metres, 28 spores; and 4,260 metres, 11 spores. By substi-
tution in Schmidt's equation {see p. 132) we find A = 5-8 X lo"*, if
Vs = I cm. per sec.
Hubert (1932) trapped spores during two flights at the time of an
epidemic of yellow rust of wheat at Halle in Germany. During the second
flight, for which data are more extensive, the numbers of spores trapped
per square centimetre per minute of exposure at various heights were
30 metres and less, 1,418 spores; 400 metres, 683 spores; 600 metres,
336 spores; and 800 metres, 82 spores. Substitution in Schmidt's equation
gives A = 1-5 X 10^.
Similar values for A were indicated when tree pollen was trapped over
137

7/30/2019 Microbiology of at 00 Greg
http://slidepdf.com/reader/full/microbiology-of-at-00-greg 166/286
THE MICROBIOLOGY OF THE ATMOSPHERE
German forests in spring during a series of aeroplane flights by day and
by night (Rempe, 1937). In general, with light to moderate windy weather
and with cumulus clouds at about 2,000 metres, the pollen concentration
decreased only slightly up to 1,000 metres, and the maximum number of
grains might occur as high as 200 or even 500 metres. This was regarded
as a sign of a complete inversion of air masses. A similar distribution also
occurred under high pressure conditions without clouds but with strong-
thermal turbulence. By way of contrast, conditions associated with a
stratified cloud-layer and high wind velocities showed a marked decrease
of pollen with height.
In night flights, the maximum number of grains was often reached at a
height of about 200 metres, i.e. above the temperature inversion which
often develops at night. At night the numbers trapped usually decreased
with increasing height much more than by day. The total numbers trapped
at all heights were also fewer by night than by day. From Rempe's data
the mean numbers of pollen grains trapped per 1-275 ^^- ^^i. of trap
surface per 20 minutes for all flights which extended up to 1,500 metres
were
:
Altitude (metres):
10-40 200 500 1,000 1,500
Day flights 904 849 852 581 267
Night flights 577 560 283 85 45
These records include pollen grains of various species; but, taking
Vs = 3 cm. per sec. as a moderate value for the speed of fall of pollen
grains, it can be shown that, for altitudes above the zone affected by
strong thermal turbulence and temperature inversions, Schmidt's in-
terchange coefficient A = 2-6 X 10^ for day flights, and r6 x 10^ for
night flights. This provides further evidence of the appropriateness of
considering the spore or pollen cloud as a suspension in air. Although at
heights of about 1,000 metres and upwards the average distribution
agreed well with that expected from terminal velocity balanced by eddy
diflfusion, near ground-level the suspension tended to become more
uniform than predicted, owing to the intermittent stirring of the lower
layers by strong mechanical and diurnal thermal turbulence.
(iii)
Sampling the upper air over the United States. In the upperconvective layer. Walker (1935) exposed Petri dishes of blood agar and,
after sampling an estimated 2,400 cubic metres of air, he concluded
that the atmosphere in that layer was sterile (two cultures of Staphylo-
coccus aureus were reasonably enough ignored as contaminants). However,
Proctor & Parker (1942) suggested that Walker's agar surfaces may have
been frozen and non-adhesive, because their own researches at the
Massachusetts Institute of Technology showed that the upper air over the
United States was far from sterile.
In trapping from aeroplanes. Proctor & Parker used filters of lens
paper supported on wire gauze in brass tubes connected with the free
138

7/30/2019 Microbiology of at 00 Greg
http://slidepdf.com/reader/full/microbiology-of-at-00-greg 167/286
THE UPPER-AIR SPORA
air and sampling about 28 litres per minute. The catches were examined
both microscopically and by culturing. Bacteria averaged 12 per cubic
metre on all flights, and 9 per cubic metre at 6,100 metres or higher.
There was sometimes evidence of a zone of greater concentration at a
height of several thousand metres. Moulds were usually less numerous
than bacteria, but the nutrient agar on which filter washings were plated
was recognized as unfavourable to mould growth. Bacteria were mostly
spore-formers and those identified included species of Bacillus, Achro-
mobacter, and Micrococcus. Among moulds, Aspergillus and Penicillium
predominated, occurring with some other Fungi Imperfecti including
Cladosporium {Hormodcndrum) and Fusarium, as well as Mucoraceae,
Actinomycetes and, occasionally, yeasts. Pollen was found on only three
flights (Proctor, 1934, 1935).
The highest mould count obtained in the M.I.T, studies occurred at
an altitude of 200 to 300 metres in May over a wooded area, where 22
bacteria and 260 moulds per cubic metre were recorded. Particularly
large counts of bacteria and moulds occurred during a dust storm which
apparently came from Nebraska and South Dakota—the same dust-
storm during which Soule(1934)
recorded mass invasion of his labora-
tories in Michigan by Bacillus megatherium. During this dust-storm, at an
altitude of 1,500-3,300 metres over the Boston area, bacteria totalled
140, moulds 44, and dust particles 2,800, per cubic metre, respectively.
However, during the whole survey, dust particles were over 100 times as
numerous as viable microbes—suggesting that much ofthe dust came from
industry and combustion rather than from the soil (Proctor & Parker,
^938)- ...etri
dishes of nutrient agar w ere exposed during flights at from 300to 3,250 metres over Nashville, Tennessee, during winter by Wolf (1934).
On this medium bacteria outnumbered moulds, the bacilli contributing
37-7 per cent, non-spore-forming rods 24-6 per cent, and cocci the
remaining 37-7 per cent, of the total bacterial count. The bacteria were
very similar to those found by Proctor (though with a smaller percentage
of spore-formers) and further study supports the general conclusion
that aerial bacteria are of types commonly found in soil and water, are
generally unable to ferment common sugars with the production of gas,
and are unable to produce indole.
From these flights by Wolf, Actinomyces griseolus was isolated twice,
at 700 and 1,400 metres, and A. phaeochromogenus once, at 620 metres. Apink yeast was found at 1,750 and 3,050 metres. Fungi isolated, with their
percentage frequencies, included: Fusarium, 29; Alternaria, 22; Clado-
sporium {Hor?nodejidru?ii), 20; Verticillium, 5; Aspergillus, 3; Penicillium,
1-6; and among others w^ere Acladium, Brachysporium, Cephalothecium,
Chaetomium, Hebninthosporium, Macrosporium, Mucor, Oospora, Pleno-
zythia, and Scopulariopsis. The large numbers of Fusarium spores and
small numbers of Aspergillus and Penicillium spores are remarkable.
139
7/30/2019 Microbiology of at 00 Greg
http://slidepdf.com/reader/full/microbiology-of-at-00-greg 168/286
THE MICROBIOLOGY OF THE ATMOSPHERE
The average of all samples gave a concentration of 7-5 cultivable organisms
per cubic metre and varied from none at 850 metres altitude in De-
cember to a maximum of 42 per cubic metre at 460 metres in October.
In general the concentration decreased with increasing height, but on
25 January there was a zone of high concentration at 900 to 1,200 metres
altitude.
SPORES OF GREEN PLANTS IN THE LOWER TROPOSPHERE
Using a glass-wool filtration apparatus, Overeem (1936, 1937)
sampled from aircraft over the Netherlands on six occasions extending
from July to October at heights of 100, 500, 1,000 and 2,000 metres.
Filter washings were inoculated to Pringsheim's culture solution for
green plants and kept in the light. From a total of about 28 cubic metres
of air she obtained the following cultures. Algae: Chlorococcum sp., 9;
Phormidium luridum var. nigrescens, Chlorella vulgaris^ Pleurococcus
vulgaris^ and Stichococcus bacilhiris, 3 each; Aphanocapsa sp., 2; Actin-
astrum sp., Stichococcus jninor^ and Hormidium fiaccidum^ i each. Moss:
Funaria hygrometrica^ 2 (from 500 and 1,000 metres). Fern: i (unidenti-
fied, from 500 metres). Total numbers at the various altitudes were in
the ratios 5 : 10 : 3 : 3 at 100, 500, 1,000 and 2,000 metres, respectively.
This work is of particular interest as one of the few demonstrations that
spores of green plants invade the troposphere in fiiir numbers and variety.
McGiLL University Studies
FLIGHTS OVER THE ARCTIC
Extensive exploration of the upper air by aeroplane was initiated by
Polunin at McGill University, Montreal, in 1947, and continued until
1 95 1 with the co-operation of the Royal Canadian Air Force and the
United States Air Force. Flights during 1947-49 ^^'^^^ primarily directed
to the study of arctic conditions.
In the summer of 1947 flights w^ere over the Northwest Territories
northwards to Cape Bathurst, then north-east from Cambridge Bay to
Victoria Island to beyond the region of the north magnetic pole and back,
and finally south-west from Cambridge Bay to Yellowknife and to Ed-
monton,Alberta. Petri dishes
with nutrient medium, andalso sticky
slides, were exposed from his planes by hand, mostly at about 1,500
metres altitude (Polunin et a I., 1947, 1948). There were small but meas-
urable concentrations of fungus spores, and the composition of the air-
spora appeared to depend on the origin and sometimes on the trajectory
of the air mass rather than upon the locality of sampling (Polunin, 1951,
1951a, and cf. 1954). The bacteria were identified as: gram-positive rods,
about 40 per cent (two thirds of which morphologically resembled
Corynebacterium), Micrococcus (23 per cent), Achromobacter or Flavo-bacterium (17 per cent), spore-formers (4 per cent), and Sarcina (3 per
cent). Fungi identified in culture included Cladosporium (over 40 per cent
140

7/30/2019 Microbiology of at 00 Greg
http://slidepdf.com/reader/full/microbiology-of-at-00-greg 169/286
THE UPPER-AIR SPORA
of the total), Sporormia^Pulhdaria, VerticiUium, Penicilliuni, yeasts, Phyllo-
sticta, Leptosphaeria, Alternaria, Stemphylium, Chaetomium, Pestallozia,
and Streptomjces {?-a.Ay et al., 1948; Pady, 1951; Polunin, 1951, i95irt).
The sticky slides exposed during flights over the Northwest Terri-
tories showed small concentrations ofangiosperm and g^'mnosperm pollen,
spores of pteridophytes and bryophytes, Alternaria, and Helniinthosporiutn
sativum, totalling about i per cubic metre. Uredospores of the cereal
rusts Piiccinia graminis and P. glumarum occurred in small numbers
(except in the most northerly flight, though a few were found north of
the Arctic Circle); their concentration rose to about 12 per cubic metre
over northern Alberta, w here there was also a smut concentration of about
6 per cubic metre (Pady et al, 1950; Polunin, 195 1«).
In further flights over the Arctic the McGill workers attempted more
elaborate sampling methods to eliminate possible contamination from
within the aircraft, which could have increased the counts in the first
two or three exposures of the earlier flights. In September 1948, Polunin
flew over the Geographical North Pole in a B-29 aircraft fitted with a
breech loading tube to hold a Petri dish projecting 30 cm. forward of the
nose. Before exposure the interior of the Petri dish was coated with a
silicone grease; and after returning to base, the dish was poured with
molten agar and incubated.
Immediately over the North Pole in late summer at 920 metres neither
bacteria nor fungi were caught. However, at greater heights over the Pole
and at other high latitudes, some Petri dishes caught nothing, while others,
exposed at altitudes up to 6,770 metres, grew a few colonies of bacteria or
moulds; no Actinomycetes were found (Polunin, 1951; Polunin & Kelly,
1952). Thus microbes appear to be present, though irregularly distri-
buted, even over the Poles.
During a flight over the Geographical North Pole under winter con-
ditions in March 1949, the McGill workers used three kinds of samplers:
(i) siHconed slides exposed in the tube forward of the nose of the
plane; (2) an electrostatic sampler installed in a box through which a slow
stream of air was passed ; and (3) a filter tube packed with glass-wool and
lens-paper. The electrostatic sampler and filters indicated a viable
concentration of 26 bacteria
+yeasts and i-6 fungi per cubic metre in
some ver}' high latitudes. The authors concluded that the air over the
Pole and its environs is nearly sterile and that it is of very mixed origin.
Here again there was evidence that the origin of an air-mass is more im-
portant than the localit}' ofsampling (Polunin, 195 1, 195 1«, 1954; Polunin
& Kelly, 1952).
The results of further arctic and sub-arctic flights are reported in
detail by Pady & Kelly (1953) and Pady & Kapica (1953). On one from
Winnipeg via Churchill to Baker Lake in the Northwest Territories at an
altitude of about 1,000 metres, using the G.E. Electrostatic sampler,
cultures averaged: bacteria 10, and fungi 25, per cubic metre. Bacteria
141

7/30/2019 Microbiology of at 00 Greg
http://slidepdf.com/reader/full/microbiology-of-at-00-greg 170/286
THE MICROBIOLOGY OF THE ATMOSPHERE
were predominantly cocci and spore-formers (though in a local flight
over Churchill gram-positive pleomorphic rods predominated). Fungi
were mainly Cladosporium and Alternaria, but included Penicillium^
Papularia^ and Stemphylium.
In the summer of 1950, northern air was sampled daily by McGill
workers for 21 days with the G.E. Electrostatic sampler and the slit
sampler on a roof 17 metres above ground at Churchill near the tree-line
on Hudson Bay. This survey formed the standard of reference for two
flights to Resolute Bay, Cornwallis Island, some 1,600 km. to the north,
on 1-3 August 1950, at an altitude of around 3,000 metres. At Churchill
the catch consisted of: gram-positive pleomorphic rods (46 per cent),
gram-negative rods (20 per cent), spore-forming rods (18 per cent), and
cocci (15 per cent). In the two flights to Resolute Bay in the Arctic during
this period, 51 per cent of the bacteria caught were spore-forming rods
(Pady & Kelly, 1953). Fungi were assessed both in culture, and visually
on silicone-coated slides: the numbers per cubic metre, with the visual
counts in parenthesis, were: Cladosporium, 17 (132), with its maximum
in an air mass of tropical origin; Alternaria, 0-7 (2-1); Stemphylium, i-i
(i-8); rusts (9-2); smuts (Ustilago) (86); yeasts, 3-5 (304); and Penicillium,
2-1. Of the fungus cultures, 57 per cent were non-sporulating. In addition,
Fusarium was reported as common on slides but rare in culture, and
Septoria was sometimes abundant on slides. An interesting list of fungi
which were caught only infrequently includes: Pullularia, Actinomycetes,
Botrytis, Aspergillus, Verticillium, several ascomycetes, and a single culture
of Cunninghamella—one of the rare isolations of a mucoraceous fungus
from the upper air. In addition there were numerous moss spores and pollen
grains, which together averaged 20 per cubic metre (Pady& Kapica, 1953).
On the flights to Resolute Bay at 3,000 metres, the fungi were
essentially the same as at ground-level at Churchill; but they were in
much lower concentrations averaging 12 per cubic metre (125 per cubic
metre if determined visually) and were principally yeasts, Cladosporium,
and Ustilago. Pollen grains averaged 16 per cubic metre; and in warm air
on the southern part of the flight moss spores averaged 47 per cubic
metre. It was thought that the southern parts of these flights lay through
an old continental tropical air mass,which had moved
into the Arctic
where most of the spores had died; north of this was cold polar air
containing very few spores. The general conclusion reached was that
the air-spora over the Arctic comes mainly from the agricultural regions
of the south (Pady & Kelly 1953; Pady & Kapica, 1953). However, the
larger numbers caught at ground-level at Churchill, and the numerous
moss spores, suggest that the tundra also made an important contribution.
MICROBIOLOGY OF AIR MASSES OVER NORTHERN CANADA
The earlier McGill studies suggested that, in the upper air above the
level of pronounced concentration gradients, microbial concentration
142

7/30/2019 Microbiology of at 00 Greg
http://slidepdf.com/reader/full/microbiology-of-at-00-greg 171/286
THE UPPER-AIR SPORA
depends mainly on the history of the air mass. This was clearly shown in a
series often flights over northern Canada (Kelly & Pady, 1953; Pady &Kapica, 1953) between September 1948 and August 1949. The history
of air masses encountered during sampling and the positions of fronts
were correlated with the results of sampling. The electrostatic sampler,
loaded alternately with Petri dishes and siliconed slides, gave the most
consistent results. (However, as sampling was non-isokinetic, pollen and
large spores may have been underestimated.)
On these flights bacteria varied in concentration less than fungi. At
the end of December many samples were blank and the air was almost
sterile. Fungi were much more plentiful in June, July, and August, than
in the rest of the year, but bacteria were most numerous in spring andautumn. Kelly and Pady suggest, reasonably enough, that the bacteria come
mainly from soil which is exposed and cultivated in spring and autumn,
giving the opportunity for wind erosion; but their suggestion that the
fungi also come from soil seems to be contradicted by the predominance
of fungi in summer, and all evidence points to the fungi coming mainly
from vegetation and debris above ground-level. All the bacteria isolated
and examined in detail were regarded as typical soil forms; they were
classified as : aerobic spore-formers (37-9 per cent of the total recorded
catch), gram-positive pleomorphic rods (23-8 per cent). Micrococcus
(i8-8 per cent), gram-negative rods {Flavobacterium^ Achromobacter^ or
Pseudomonas, 4-8 per cent), and Sarcina (4-6 per cent).
Fungi obtained in culture were : Cladosporium (73 per cent), Alternaria
(7 per cent), PenicilUum (2-9 per cent), Streptomyces (2-9 per cent),
Stemphylium (1-5 per cent), Aspergillus (0-7 per cent), yeasts (0-7 per cent),
and other fungi (11 per cent). Many more fungi could be counted visually
on silicone-coated slides than could be grown in culture—an effect
which was exaggerated by the numerous smut spores that were obtained
in one flight over the prairies in October 1948, which yielded: smut
spores 52-4 per cent, Cladosporium 32-4 per cent, Alternaria 3-3 per cent,
Helminthosporium 0-3 per cent, and rusts o-i per cent.
AIR MASSES OVER MONTREAL
In a further survey of microbes associated with different air masses, the
McGill workers used the electrostatic sampler and the slit sampler between
10-00 and 13-00 hours on 1 13 days between September 1950 and December
1951, at the top of a building high in Montreal (Kelly & Pady, 1954;
Pady & Kapica, 1956). Ten t^'pes of air mass were recognized, classified
on the basis of exposure to agricultural land ; but as most examples of any
one type occurred at one time of the year, the effects of differences in
origin of the air mass may be confounded with seasonal effects. Further,
at the altitude of 130 metres, sampling at midday is likely to be done in the
frictional turbulence layer and to be dominated by local ground sources
143

7/30/2019 Microbiology of at 00 Greg
http://slidepdf.com/reader/full/microbiology-of-at-00-greg 172/286
THE MICROBIOLOGY OF THE ATMOSPHERE
which are themselves affected by the temperature and humidity of the air
mass.
This survey is therefore perhaps best regarded as a valuable contri-
bution to knowledge of the local air-spora near the ground; judging from
knowledge about the upper-air, the amount contributed by the air mass
is likely to have been small. Cladosporium and yeasts were the chief
constituents of all the air masses (even of fresh polar air), and on our
interpretation the abundance of PenkilUum is not surprising for samples
taken in a large city. Alternaria and Fusarium were commoner in tropical
air. Smut spores occurred in all air masses and at all seasons. Basidiospores
of agarics were suspected but not positively identified. Fungi were most
numerous in July and August, when 625 cultivable (8,610 visible) spores
were recorded per cubic metre, and least numerous from December to
February, when 36 (28) were recorded per cubic metre. Bacteria were
present in greatest numbers in polar air during spring and autumn,
rising from fewer than 70 per cubic metre during March to 710 per cubic
metre in June, then decreasing to the end of August and rising to a second
maximum during November. In air of maritime origin the trend was
irregular.
AIR MASSES OVER THE NORTH ATLANTIC OCEAN
In two flights from Montreal to London, England, at altitudes ranging
between 2,700 and 3,000 metres, the McGill workers were able to study
the relation between microbial concentration and air mass (Pady & Kelly,
1954; Pady & Kapica, 1955). Over the ocean polar air had generally
fewer bacteria and fungi than tropical air (Table XXIII).
Over Quebec Province, in one air mass which was classified by
meteorologists as of polar origin, and which gave few bacteria or fungi in
culture, very many fungus spores \^'ere caught on a silicone-coated slide
in the slit sampler. The authors interpreted this as evidence of a load of
non-viable organisms which could only have originated in the tropics, and
suggested that the air had been carried into the Arctic, thence eastwards,
and finally southwards, during which passage most of the suspended
micro-organisms lost their viability. However, another explanation seems
possible on careful examination of the data. The visible total on the
silicone-coated slides, amounting to 18,700 per cubic metre, was made up
largely of yeasts (9,900 per cubic metre) and yellow-brown spores (7,500
per cubic metre). As 'about 50 per cent of the latter had an apiculus and
were considered to be basidiospores', the other 50 per cent were probably
also basidiospores lying in the alternative position (in which the apiculus
would be invisible). The flight may well have been through one or more
thermals arising from coniferous forests of Labrador and QuebecProvince,
by which a polar air mass was becoming charged with the air-spora of
the ground layer.
144

7/30/2019 Microbiology of at 00 Greg
http://slidepdf.com/reader/full/microbiology-of-at-00-greg 173/286
THE UPPER-AIR SPORA
TABLE XXIII
ANALYSIS OF PADY & KELLY's (1954) DATA ON TWO RETURN FLIGHTS
OVER THE NORTH ATLANTIC, SHOWING CONCENTRATIONS PER CUBIC METRE
OVER LAND, AND MEAN CONCENTRATION OF BACTERIA ANT) FUNGI IN AIR-
MASSES 0\TR OCEAN
Bacteria Fungi
Air mass

7/30/2019 Microbiology of at 00 Greg
http://slidepdf.com/reader/full/microbiology-of-at-00-greg 174/286
THE MICROBIOLOGY OF THE ATMOSPHERE
VERTICAL GRADIENT OVER THE OCEAN
The McGill workers showed conclusively that the upper air contains
an appreciable spore-load in all the places which they examined. Even in
the high-arctic winter, the evidence proves that samples of a few cubic
metres of air may or may not be sterile. Cladosporium appears to dominate
the upper-air spora, often together with many yeasts and bacteria. Pos-
sibly the purest air is to be found near sea-level in mid-ocean. The few
observations suggest that samples taken on board ship are collected in a
purified layer of the atmosphere, and that higher up over the ocean surface
the spore concentration is greater than at sea-level. The troposphere is
always more or less contaminated with micro-organisms. From Erdtman's(1937) results a ship in the North Atlantic in spring would be in a region
of about one pollen grain per 100 cubic metres, whereas Pady & Kapica
(1955), at 3,000 metres over the same ocean, recorded up to 25 pollen
grains (with moss spores) per single cubic metre.
On a flight from New Zealand to Australia, at about 1,000 metres
above the Tasman Sea, Newman (1948) exposed sticky slides behind a
leading wire in the hope of improving the trapping efficiency by breaking
the stagnant layer. At a position 1,100 km. off Australia, he estimatedpollen grains at 0-73 per cubic metre, and fungus spores at 0-70 per cubic
metre; at 340 km. from Australia he found pollen to be 8-75 and fungus
spores 1 6-8 per cubic metre—which is about 100 times as numerous as the
concentration of pollen grains and fern spores at ship's mast-level on
the North Atlantic crossing recorded by Erdtman (cf. p. 127). Newman's
values for fungus spores are somewhat similar to those of the McGill
University workers for the upper air over the Atlantic. It seems likely
that Erdtman's samples, taken on board ship, were from a zone of surface
air which had been largely cleaned by rain-wash, sedimentation, and
contact with the ocean, and only partially replenished from the stock in
the air mass overhead, where aircraft samples were taken.
Summary
Knowledge of upper-air microbiologyis
based onoccasional samples
and is affected by place, season, weather, air mass, and so on. There are
no continuous records; but there are some hints that a 'biological zone'
occurs at middle height, which can probably be explained in terms of
temperature inversions, air masses, and precipitation.
Molisch (1920) introduced the concept o^ aeroplankton to denote the
microbial complex referred to in this book as the air-spora. It has been
argued that the word 'plankton' suggests organisms based on the air
during at least a vigorous phase of growth, whereas the air-spora is onlyairborne temporarily, even though adapted to wind transport as a means of
dissemination. Clearly this argument is valid for pollens and plant spores;
146
7/30/2019 Microbiology of at 00 Greg
http://slidepdf.com/reader/full/microbiology-of-at-00-greg 175/286
THE UPPER-AIR SPORA
but Is there, in addition, a vegetative air-inhabiting plankton ? We can-
not yet give this apparently improbable hypothesis a decisively nega-
tive answer. Evidence in favour of it has been stated by R. C. McLean
(1935, 1943), who wTote:
'
"Dust to dust" seems to be the only cycle
envisaged. Yet the experiments of Trillat and others show at least the
possibility that the air may be a vegetative habitat and the large pro-
portion of non-spore-formers present . . . needs more than a conven-
tional explanation.' Proctor & Parker (1942) noted that one third of the
bacteria collected from the upper air could grow at o°C., and survive 48
hours exposure at — 26°C.
If there is a truly indigenous aeroplankton, its habitat must be exacting
in the extreme, and tolerable only by specialized bacteria, yeasts, or act-
inomycetes. Frequent drying must reduce the population to inactivit}%
though metabolism could be resumed in a cloud of water droplets when
gaseous nitrogen and carbon compounds could be absorbed and used. In
constant danger of being removed from the air by rain or snow or by
contact with the ground, the risk of removal would be increased by any
attempt to parasitize organic particles brought up by convection from
below. However, radioactive dust can persist for several weeks in the
troposphere, and this is a long period on a microbial time-scale. The aerial
environment is not obviously beyond the range of exploitation by micro-
organisms, for the rate of loss by death or deposition might not be greater
than for bacteria in the sea, and there would be freedom from predators.
If anywhere, such an aeroplankton might be expected to ride clouds on
the ascending side of a tropical convection 'cell' over the Equator.
Although the origin of the upper-air spora from the soil has been
assumed by most investigators, the circumstantial evidence suggests a
wider range of sources. The bacteria are probably mainly soil forms with
a small proportion from sea water. But hyphal fragments, especially
conidiophores of Alternaria and Cladosporium, which are commonly
reported from the upper-air (Pady & Kapica, 1953, p. 321), evidently
come from the ground vegetation-layer rather than from the soil. The
numerous yeasts, coloured basidiospores of toadstools, and smut spores,
evidently originate above the soil surface. It is hard to believe that wind
could burrow into soil, picking out the few spores of Cladosporium and
Alternaria, yet leaving behind most of the far more numerous PcnicilUimi,
Trichoderma, Aspergillus and Mucoraceae spores—not to mention clay
particles
147

7/30/2019 Microbiology of at 00 Greg
http://slidepdf.com/reader/full/microbiology-of-at-00-greg 176/286
XI
DEPOSITION IN RAIN, SNOW, AND HAIL
Airborne microbes can be deposited direct or they may be washed out
of the air in raindrops, hailstones, or snow-flakes. Trillat & Fouassier
(19 14), from their laboratory experiments with artificial fogs condensing
on a suspension of pathogenic bacteria in small vessels, thought that air-
borne microbes act as condensation nuclei. Condensation nuclei are now
thought to be small hygroscopic particles, and it seems more likely that
droplets already formed collect spores by impaction {see Chapter VII).
McCully et al. (1956) estimate that, over all land areas of the globe, from
35 to 50 per cent of the total atmospheric dust load is washed out each
day. Here we will consider the results of rainwash in nature and the spore
content of precipitation water.
Over the last 300 years about a score of people are known to have sought
microbes in precipitation water. Collecting the sample has some pitfalls,
however; the vessel must obviously be clean, but the danger of contamina-
tion by rain-splashed soil has not always been anticipated though, with
current knowledge of the magnitude of splash and its part in soil erosion,
the danger is now clear (Laws, 1940). Much of the early work summarized
below, however,is clearly trustworthy.
Animalcules in rain-water deHghted Leeuwenhoek (1676, in Dobell,
1932). Rain was collected in a clean porcelain dish set on a wooden tub
to avoid earth being splashed by rain. Minute organisms were searched
for in vain until after the rain-water had stood for some days, by which time
it would also have been contaminated by dry deposition—so we do not
know whether or not Leeuwenhoek found microbes of precipitation water.
Rain
The only systematic study of precipitation micribiology comes from
Miquel (1884, p. 597; 1886, p. 530) at the Pare Montsouris, Paris. Miquel
caught his rain in a metal funnel fixed at 1.7 metres above ground-level
on a pillar, well away from trees and buildings. Rain falling into the funnel
was collected in a platinum crucible with a cover, both funnel and crucible
having been heated to redness just before sampling. The sample was then
sown, drop by drop, in 50 to 100 flasks of beef broth. Miquel also designed
apparatus which placed raindrops on a moving band of nutritive paper.
After 6 days' incubation, the paper was dried and kept as a record of
148

7/30/2019 Microbiology of at 00 Greg
http://slidepdf.com/reader/full/microbiology-of-at-00-greg 177/286
DEPOSITION IN RAIN, SNOW, AND HAIL
bacterial and mould colonies. The largest catches of bacteria occurred In
the warmer months, when numbers varied from o-ooo8 to 8-3 per ml.,
with a general mean of 4-3 per ml., but these figures excluded the first
rain after several dry days when 200 bacteria per ml. might be recorded.
During prolonged rainfall the numbers fluctuated instead of contin-
uing to diminish, suggesting to Miquel that the rain clouds themselves
had a characteristic bacterial content, with the percentage composition of:
Micrococcus (60), Bacillus (25), and Bacterium (15). Moulds fluctuated
in the same manner as bacteria and averaged 4 per ml. Miquel estimated
the annual precipitation of bacteria and moulds at Montsouris at over
4 million per square metre—a figure that was obviously too low as he
excluded the contribution of the first rain after dry days.
The pharmaceutical use of rain-water induced Lindner (1899),
in Germany, to collect 28 samples of rain in a clean porcelain dish on a
bleaching ground near his house. Samples were then added to sterile
hay-infusions, albumen, milk, or blood serum. His liquid cultures gave
a regular succession of bacteria, flagellates, and monads, in the first
day or two and, later on, stalked Vorticella-like ciliates, Paramaecium,
Stylonychia, and Volvox. Once he got two amoeboid forms, but never
gregarines or coccidiens. Lack of precautions against splash-contamina-
tion appears to leave the interpretation of his data in doubt.
In this century various workers have cultured microbes from rain.
Minervini (1900) collected numerous rain samples on board ship in the
North Atlantic. Bacteria were abundant, half the samples yielded pink
yeasts, and a quarter of them Penicillium. He also obtained Aspergillus
glaucus, A. niger, Monilia Candida^ and many other moulds. Busse (1926)
recorded pine pollen in rain.
Rain-water collected over the ocean at considerable distances off" shore
by ZoBell (1946, p. 179) averaged i to 10 bacteria per ml, with few or no
mould fungi. Rain-water collected on land at the Scripps Institution of
Oceanography, California, contained from 10 to 150 microbes per ml.
As usual, the highest counts were obtained during the first rain and were
associated with a predominance of mould spores.
Protozoa in rain were studied at Heidelberg by Puschkarew (1913),
whocollected ten samples of rain-water in a sterile funnel, and added
nutrient solutions. At the start of rain he found large numbers of fungi
and bacteria, and the numerous protozoa included a new species.
Amoeba polyphagus^ with species of Bodo^ Manas, Calpoda, and other
genera.
Twice in the month of November, rain was collected in sterile flasks
on a roof at Leiden by Overeem (1937) and inoculated into flasks of a
nutrient medium favourable to growth of green plants in light. In a total
of 221 cc. of rain-water she obtained thefollowing cultures. Algae:
Stichococcus minor (8), S. bacillaris (5), Chlorococcum sp. (7), Pleurococcus
vulgaris (4), Chlorella vulgaris (2), Hormidium flaccidum (2), and Navicula
149
7/30/2019 Microbiology of at 00 Greg
http://slidepdf.com/reader/full/microbiology-of-at-00-greg 178/286
THE MICROBIOLOGY OF THE ATMOSPHERE
minuscuhi (i). Myxomycete : Physarum nutans (i). Moss: Brachythechim
rutcibulum (i).
Another worker who made a re\^ arding study of autotrophic plants in
rain-water was Pettersson (1940), working at the Zoological Station at
Tviirminne, Finland, in the summer of 1936. Glass funnels (176 sq. cm.
in area) were lined with filter-paper, sterilized and taken, covered, to the
trapping site. After exposure, the filter-paper was sprayed with a nutrient
solution, and the funnel was covered with a glass lid and left to stand in a
light place for a few days. Developing organisms were picked off and
transferred to new culture vessels to continue their growth.
The originality of the method lies in the medium being unfavourable
for the development of bacteria and fungi because the cellulose of the
filter-paper was the only carbon source provided. Pettersson, like Over-
eem, was therefore able to explore a novel part of the air-spora. Snow-traps
were also used, consisting of shallow glass dishes 15-20 cm. in diameter,
with a thick bed of blotting paper and an upper layer of filter-paper.
These two methods gave an unexpectedly rich harvest. A sample of snow
taken at Pikis (Piikio) from the start of snowfall on i March 1936, gave
thirt)'-six lichen thallus fragments and a moss gemma. On the next day,
2 hours after the start of another snowfall, a sample corresponding to
625 ml. of water yielded nineteen lichens and two Chlorococcum colonies.
A third sample of 805 ml. of water, taken 4I hours later, yielded six
lichens, and three mosses which were identified after 6 months' growth as
Brachythecium velutiniun^ Hypnum cupressiforme, and Pylaisia polyantha
{see also Pettersson, 1936).
Pettersson's rain-trap yielded a wealth ofinformation from the fourteen
samples investigated, for details of which the original paper must be
consulted. The interest was taxonomic and qualitative rather than
quantitative. For the early samples the funnel was placed on a low rock,
2-5 metres above sea-level, on open grassy soil. Some of the organisms
caught may possibly have come by splash from the ground, but not many
can have done so because the largest catch of mosses belonged to a
genus hitherto unrecorded in Finland {see Chapter XIV). The precaution
of raising the funnel on a wooden base i metre high was adopted in later
tests.
In a total of 1,373 ^- of rain collected, Pettersson obtained 1,200
conifer pollen grains, 300 liverwort spores (all of Marchantia polymorpha
except for one of Metzgeria), Myxomycete spores {Stemonitis fusca three
times and Arcyria denndata), and numerous algae. Blue-green algae were
scarce, being represented only by Nostoc commune and Gloeocapsa sp. in
separate samples. Green algae were abundant in almost every sample,
those identified including: Chlamydomonas nivalis^ Chlorella vulgaris,
Chlorococcum humicolum, Cystococcus pseudostichococcus, Prasiola stipitata,
Roya sp., and Tetraedron punctulatum. Some of these, the author suggests,
may have originated from lichen soredia. Lichen spores and soredia were
150

7/30/2019 Microbiology of at 00 Greg
http://slidepdf.com/reader/full/microbiology-of-at-00-greg 179/286
DEPOSITION IN RAIN, SNOW, AND HAIL
not the main source of lichens in the traps, for the hchcns mostly originated
as thallus fragments and were evidently of fairly local origin.
The 2,000 moss plants cultured from the spores caught in Pettersson's
traps included specimens of: Aloina brevirostris, A. rigida^ Amblystegiumserpens^ Brachythecium velutiniwi, Bryum spp., B, argentemn, B. pa liens,
Ceratodon piirpureus, Funaria hygrometrica, Leptobryum pyriforme, Mnio-
bryum carnemn, Pohlia cnida, P. nutans, and Pylaisia polyantha.
Observations on micro-organisms in rain were made at Rothamsted
Experimental Station in 195 1 by Gregory, Hirst, and Last {see Hirst, 1959)
while they were comparing various spore-trapping techniques. Two
conical glass funnels 20 cm. in diameter were exposed on a wooden
structure at a height of 2 metres above ground-level. One funnel was open
to rain (rain-trap), while the other (dry-trap) was protected by a flat
asbestos-cement disk held 25 cm. above the mouth of the funnel—to keep
off rain but still allow^ dry deposition. Washings from both funnels were
collected daily and the fungus spores separated by sedimentation onto a
glass cover-slip. On dry days the fully exposed rain-trap consistently
caught fewer microbes than the dry-trap ; but, as might be expected, this
was reversed during rain—especially in the first rain after dry weather
(Table XXIV).
TABLE XXIV
GEOMETRIC MEANS OF RATIOS OF CATCHES BY R.AIN-TRAP TO DRY-TRAP, 2
METRES ABOVE GROUND, ROTHAMSTED, JUNT-SEPTEMBER 1951 (HirSt, 1959).

7/30/2019 Microbiology of at 00 Greg
http://slidepdf.com/reader/full/microbiology-of-at-00-greg 180/286
THE MICROBIOLOGY OF THE ATMOSPHERE
readily as spores already there when rain starts to fall, so that concen-
trations of airborne spores measured during rain represent, not the total
released, but the excess of those released over those removed. Rain-
scrubbing seems an ideal method of deposition for air-dispersed soil
fungi. For foliage pathogens its biological significance is far from clear.
Many spores may be lost in "run-off" unless they can attach themselves
to the leaf surface or penetrate into crevices they would be unlikely to
reach when deposited from dry air.'
TABLE XXV
SPORES BROUGHT DOWN BY THUNDERRAIN TERMINATING 7-DAY DRY SPELL,
ROTHAMSTED, 22 JULY 1 95 1 (Gregory, Hirst & Last, unpublished).
Number of spores per ml. of rain
in I St 0-95 mm. in succeeding 375 mm."

7/30/2019 Microbiology of at 00 Greg
http://slidepdf.com/reader/full/microbiology-of-at-00-greg 181/286
DEPOSITION IN RAIN, SNOW, AND HAIL
basin : 'elaborate precautions having been taken to prevent contamination,
the thawed-out samples showed under a cover-slip cocci, motile bacilli,
and, invariably, zoogloea masses of bacteria in moderate numbers.
Diplococci, and occasionally cocci, were observed to be invested by a
pale capsule. ... A glucose agar slope culture of falling snow showed a
few small greyish colonies.'
Atkinson isolated a motile bacterium believed to have been carried
to the Antarctic by upper-air currents and brought do\Mi by the snow
(Scott, 1913). Most of the arctic and antarctic snow samples were taken
from fallen snow, and organisms could therefore possibly have reached
the snow by a process of dry deposition (e.g. Salimovskaja-Rodina, 1936;
Darling & Siple, 1941) and are considered in Chapter IX.
Hail
Large numbers of microbes were recorded by Bujwid (1888), who
collected hailstones in Warsaw in the month of May, washed them in
sterile water, and, plating out the melt-water, found 21,000 bacteria per
ml. They included Bacillus fluorescens liquefackns, B.f. ptitridus, and
B. janthinus. From these numbers Bujwid concluded that surface waters
must have been carried aloft and frozen.
During a hailstorm in St. Petersburg, windows were broken by hail-
stones the size of walnuts. Foutin (1889) washed some of these and, on
plating-out the melt-water, obtained 628-729 bacteria per ml., but no
fungi or yeasts.
In July storms at Guelph, Ontario, Harrison (1898) collected hail-
stones, washed them in i in 500 mercuric chloride solution and, after
rinsing, plated-out the melt-water. One storm gave 955 colonies per stone,
of mixed bacteria and moulds, including ''Penicillhim glaucum\ Miicor
sp., Aspergillus sp.. Bacillus fluorescens liquefaciens^ B.f. non-liquefaciens,
and Proteus vulgaris. A later storm averaged 1,125 colonies per ml. but
these included fewer moulds than the first. Harrison concluded that the
bacteria must have come from surface water, but that the moulds were
picked up from the air. Belli (1901) obtained 140 organisms per ml. of
hail melt-water, of which eight were Aspergillus or Penicillium and the
remainder bacteria. Hail has also been sampled by Dubois (191 8).
The organisms in precipitation water remain almost unstudied. The
little we know from existing records is tantalizing. Precipitation water is
non-sterile, whether on land, over the oceans, or about the poles. A wide
variety of organisms has been recovered from such waters—including
bacteria, fungi (moulds, yeasts, and plant pathogens), algae, liverworts,
mosses, pollens, and protozoa. Microbes are found in rain, hail, and snow,
when collected as it falls—before the possibility of ground contamination.
The highest counts are recorded from hail and, at present, these are
153

7/30/2019 Microbiology of at 00 Greg
http://slidepdf.com/reader/full/microbiology-of-at-00-greg 182/286
THE MICROBIOLOGY OF THE ATMOSPHERE
perhaps the most reliable records—because hailstones can be surfiice-
sterilized. The first rain after a dry spell is heavily contaminated and,
even during prolonged wet weather, the spore numbers in rain remain
substantial.
A spore liberated near ground-level has a high probability of being
deposited dry; but wash-out by rain, hail, or snow, probably mosj: often
terminates the journey of spores reaching the tail-end of the dispersal
gradient. Microbial sampling of precipitation is still in the naive stage.
Methods have not been tested, and we still do not know how a collecting
vessel should be placed to avoid contamination from soil and vegetation.
Conceivably, spores may undergo re-concentration ^^ithin a cloud.
Rising convection bubbles may bring new spores to the top of the cloud,
where they can be collected and washed down in raindrops to the base
of the cloud. Here the drops might evaporate, allowing the spores to be
carried up again—perhaps eventually to be brought down to earth in
hailstones. The abundance of microbes in hail, and the reports of a
'biological zone' at several thousand metres, supports the suggestion that
convective clouds may be spore-concentrators.
Exploration of organisms in precipitation needs an experimental study
of methods of sampling from ground, ships, and aircraft. Systematic
sampling could then be attempted with some prospect of learning what
part such precipitation plays in terrestrial microbial circulation.
154

7/30/2019 Microbiology of at 00 Greg
http://slidepdf.com/reader/full/microbiology-of-at-00-greg 183/286
XII
THE AIR-SPORA OF ENCLOSED SPACES
A SMALL but important fraction of the atmosphere is walled-in and pro-
vides microbes with an environment different from the outdoor world.Indoor air-hygiene is an aspect of medical science with a voluminous
literature which can be approached through such works as: Aerobiology
(Moulton, 1942), Studies in Air Hygiene (Bourdillon et ciL, 1948), Airborne
Contagion and Air Hygiene (Wells, 1955), and Mould Fungi and Bronchial
Asthma (Werff, 1958). The brief treatment given here of 'intra-mural
aerobiology' presents an ecological instead of a medical viewpoint.
Outdoor air moves as wind flowing bodily over surfaces, and a point
near the ground is immersed in a continually flowing stream of fresh air.
Rooms, on the other hand, are ventilated, and fresh air is assumed to mix
thoroughly with the existing air instead of displacing it bodily. By one
'air-change' ('ventilation turn-over') is meant the introduction of a
volume of fresh air equal to the volume of the room; an equal volume of
mixed stale and fresh air is displaced during the process, leaving a mixture
of stale and fresh air in the room. Unless continually renewed, any micro-
bial concentration in the air of an enclosed space will tend to diminish
with time as a result of ventilation and deposition. Concentration of viable
organisms will also decrease with time—following the natural death-rate,
or because of any disinfection that may have been applied.
Die-away of Concentration
Die-away of concentration is a phenomenon seen most clearly under
intra-mural conditions, because out-of-doors a concentration is carried
away bodily by wind. So farit
has not beenfeasible to trace concentration
changes out-of-doors in one air mass during its travels.
Decrease of concentration with time is caused by: (i) exchange with
outside air (i.e. ventilation); (2) deposition on walls, ceiling, and floor,
by various processes including sedimentation; and (3) reduction in the
viable count through death. Ventilation does not immediately sweep away
the whole microbial load, but progressively dilutes it exponentially.
Then 'n' air changes will reduce concentration in the ratio: i/e". Decreases
in concentration due to deposition, death, or disinfection, may also follow
a logarithmic law, and these can then be expressed in units of equivalent
ventilation turn-overs for ease of comparison.
155
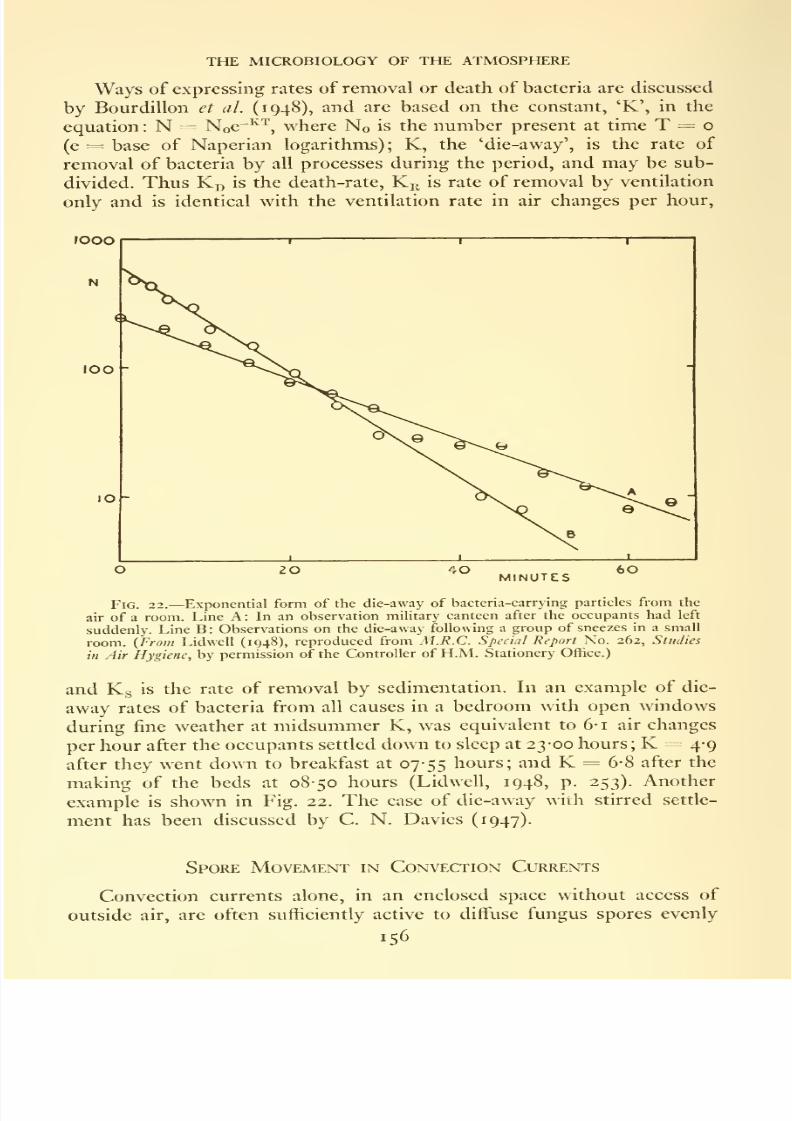
7/30/2019 Microbiology of at 00 Greg
http://slidepdf.com/reader/full/microbiology-of-at-00-greg 184/286
THE MICROBIOLOGY OF THE ATMOSPHERE
Ways of expressing rates of removal or death of bacteria are discussed
by Bourdillon et al. (1948), and are based on the constant, 'K', in the
equation : N = NoC"^'^^', where No is the number present at time T =(e = base of Naperian logarithms) ; K, the 'die-away', is the rate of
removal of bacteria by all processes during the period, and may be sub-
divided. Thus Ki) is the death-rate, K^ is rate of removal by ventilation
only and is identical with the ventilation rate in air changes per hour,
rooo
100 -
MINUTES
Fig. 22.—Exponential form of the die-away of bacteria-carrying particles from the
air of a room. Line A: In an observation military canteen after the occupants had left
suddenly. Line B : Observations on the die-away following a group of sneezes in a small
room. (From Lidwell (1948), reproduced from M.R.C. Special Report No. 262, Studies
in Air Hygiene, by permission of the Controller of H.M. Stationery Office.)
and Kj.. is the rate of removal by sedimentation. In an example of die-
away rates of bacteria from all causes in a bedroom with open windows
during fine weather at midsummer K, was equivalent to 6- 1 air changes
per hour after the occupants settled down to sleep at 23-00 hours; K = 4-9
after they went down to breakfast at 07-55 hours; and K = 6-8 after the
making of the beds at 08-50 hours (Lidwell, 1948, p. 253). Another
example is shown in Fig. 22. The case of die-away with stirred settle-
ment has been discussed by C. N. Davics (1947).
Spore Movement in Convection Currents
Convection currents alone, in an enclosed space without access of
outside air, are often sufficiently active to diffuse fungus spores evenly
156

7/30/2019 Microbiology of at 00 Greg
http://slidepdf.com/reader/full/microbiology-of-at-00-greg 185/286
THE AIR-SPORA OF ENCLOSED SPACES
through the whole volume of air. With fruit-bodies of basidiomycetes
enclosed in chambers, Falck (1904) found that vertical tiers of horizontal
paper shelves became covered with spore deposit in a remarkably
uniform manner. By contrast, suspending the pileus of an agaric in a
small glass vessel often resulted in 'curious and fantastically' irregular
spore deposits on a piece of paper placed underneath. These were inter-
preted by Buller (1909) as due to the convection currents in the vessel
being of a velocity comparable with the terminal velocit}' of the spores.
The heat from a lamp was sufficient to alter a previously established
convection system.
WARMER AIR
OUTSIDE
COLDER AIR
OUTSIDE
7 //////// y^
Fig. 23.—Diagram showing changes of circulation in a room
according to relative temperature of walls and of inside air.
Even without any ventilation, air circulates in a room because of thermal
convection. Heating of air by rock surfaces in a mine may result in a
flow along an adit and up a shaft. Heating of glasshouses in sunlight also
leads to strong convection currents.
Within a building the temperature of the air may be less changeable
than that outside, and this may lead to characteristic air-movement
patterns. Warmer walls will generate an up draught, colder walls a down
draught—each being balanced by opposite currents in the centre of the
room (Fig. 23) and often moving fast enough to counteract sedimentation
under the influence of gravity. Circulation of air within a house is complex,
but there is evidence of a fairly rapid exchange of air and of its suspended
spores throughout a house. C. M. Christensen (1950) experimented with
spores of Hormodendriim resimie, a mould that is peculiar for its ability
to grow on a coal-tar creosote medium, and therefore suitable for use as a
'marker' spore in dispersal experiments. Spores were liberated in a room
on the lowest floor of a house while all doors to the central hall-way were
left open. Within a few minutes, spores were found deposited on Petri
dishes in rooms communicating with the hall-way, but situated one, two
and three storeys higher.
157

7/30/2019 Microbiology of at 00 Greg
http://slidepdf.com/reader/full/microbiology-of-at-00-greg 186/286
the microbiology of the atmosphere
Intra-mural Sources
Microbes in indoor air may come from the outdoor air-spora by
ventilation, or they may originate within the enclosure—in which case
they are probably limited in variety but may occur in high concentration.
Defective timber attacked by fungi may be an important source of
spores in dwelling houses. A. W. Frankland & Hay (1951) showed that
some asthmatics are sensitive to the spores of the dry-rot fungus {Merulius
lacrymans)^ and spore concentrations ranging from 1,630 to 360,000 spores
per cubic metre have been recorded in buildings with active fructifications
of this fungus (Gregory et al^ 1953). Timber in mines is particularly
liable to fungal decay and may also have superficial moulds growing on it.
Extensive growth of Sporotrichum beurmanni (the pathogen of humansporotrichosis) was found on fresh timber of mines in Transvaal by Brown
et al. (1947). The fungus was isolated from the air, and ventilating currents
of I metre per sec. could detach spores from wood provided its moisture
content was less than 80 per cent.
Processes by which infectious diseases are transmitted through the
air have been matters of vigorous controversy in medicine, and the answers
given have influenced social habits and prophylactic measures. Cornet
(1889) held that pulmonary tuberculosis is normally acquired by inhaling
dust of dried sputum, but Fliigge (1897) believed that infection was from
germs expelled from the mouth and nose when coughing. G. S. Wilson
& Miles (1955) conclude that both processes occur, dust infection being
commoner in drier countries whereas droplet infection is the rule in
moister climates and in crowded places.
Air exhaled from the lungs in normal breathing is optically clean and
almost sterile; but in coughing and sneezing, large numbers of droplets
of mucus and saliva are propelled with explosive violence into the
atmosphere.
Jennison (1942) obtained photographic evidence of 20,000 droplets
being put into the air from a single sneeze. The largest number observed
was 40,000, and a weak, stifled sneeze gave only 4,600 droplets. A cough
produced a few hundred droplets and the enunciation of consonants was
also productive. Sneeze droplets, ranging in diameter from a lower limit
of 5-10 /Lt, and with 20-40 per cent smaller than 50 /x, could evaporate
instantaneously to 'droplet nuclei'.
The concept of droplet nuclei, developed by Wells (e.g. 1955), has
proved fruitful. 'Droplet nuclei' are the particles formed from the smallest
droplets, which evaporate before falling to the ground and so remain sus-
pended in air. They consist of the solid residue of the evaporated droplet,
together with any bacteria or virus particles, and may be coated with semi-
dried-up mucus which tends to preserve activity and viability. Few
droplets are actually propelled more than 2 or3
ft. ; but, when evaporated,
the resulting droplet nuclei, with any bacterial cells or virus particles,
would remain in suspension almost indefinitely. The droplet nuclei have
158

7/30/2019 Microbiology of at 00 Greg
http://slidepdf.com/reader/full/microbiology-of-at-00-greg 187/286
THE AIR-SPORA OF ENCLOSED SPACES
no trajectory but move with the slightest air currents, and are emitted
in large numbers. Thus akhough most airborne bacteria seem to be carried
on rafts of dust particles which settle rapidly, they appear to be relatively
innocuous saprophytes; the pathogens are present only in special en-
vironments, being carried in much smaller and more insidious droplet
nuclei which are small enough to be capable of entering, and being
retained by, the alveoli of the lungs.
The Air of Different Environments
dwellinghouses
In spite of ventilation, Penicillium dominates the air inside most
houses, in contrast to Cladosporium outside, and bacteria tend to be more
abundant indoors in winter than in summer.
Microbial concentration indoors varies greatly with mechanical and
human activity. Carnelley et al. (1887), using Hesse's tubes in schools and
mills in Dundee, Scotland, observed that, in densely-populated rooms,
stirring up dust increased the total air-load and increased the ratio of
bacteria to moulds. When air in rooms is left undisturbed the bacteria
(or particles to which they are attached) settle out rapidly, but the moulds
do so much more slowly.
Maunsell (1954, 1954'^') used the slit sampler in bedrooms and found
that shaking beds, brushing carpets, and any building repairs, increased
the mould-spore content of the air up to 17 times, but that it rapidly
returned to normal when activity ceased.
Other studies of the air of dwelling houses are discussed by Miquel
(1879, 1883), Rostrup (1909), Winslow & Browne (1914), Flensborg
& Samsoe-Jensen (1948), Nilsby (1949), Wallace et al. (1950), and
Swaebly & Christensen (1952), among others.
Tests with the portable volumetric spore-trap (Gregory, unpublished)
show that the airborne dust in inhabited rooms is commonly dominated
by what appear to be fragments of human skin in the form of minute,
flattened scales from the stratum corneum of the epidermis. Concen-
trations of several thousand of these potential bacterial 'rafts' per cubic
metre are common indoors, and 390,000 per cubic metre have been noted
after bed-making. These epidermal scales probably carry a large propor-
tion of the airborne bacteria of indoor air.
HOSPITALS
In studies of hospital air over a period of 15 months, Miquel (1883)
found a mean value of 11,100 bacteria per cubic metre in the crowded
wards of the Hopital La Pitie, Paris, the counts varying from 5,100 in
June to 23,100 in December. The general improvement in hospital
hygiene since that time is illustrated for example by Colebrook & Cawston
159

7/30/2019 Microbiology of at 00 Greg
http://slidepdf.com/reader/full/microbiology-of-at-00-greg 188/286
THE MICROBIOLOGY OF THE ATMOSPHERE
(1948) for a Birmingham hospital, where they found from 210 bacteria and
moulds per cubic metre under quiet conditions, to 2,800 per cubic metre
with bed-making in progress (one very high count of 22,000 per cubic
metre, including many moulds, was obtained with the ward windowsclosed).
Recommendations for the maximum tolerable number of particles
carrying bacteria in operating theatres are 700 per cubic metre for minor
operations, and down to 70 or even 15 per cubic metre for dressing burns
and for operations on the central nervous system (Bourdillon et al.,
1948/'; and see Bourdillon & Colebrook, 1946).
FACTORIES AND WORKSHOPS, SCHOOLS, PUBLIC BUILDINGS
Anthrax is one of the few bacterial diseases which is clearly spread by
airborne dust to workers who handle wool and hair contaminated by
infected animals. Inhalation of airborne spores of Bacillus anthracis
sometimes produces fatal infection of the lung.
Bacterial counts in a variety of English factories and offices were
reported on by Bourdillon et al. [i^^^a).
SUBWAYS, MINES, AND CAVES
London's underground railways have been investigated by Andrewes
(1902) and by Forbes (1924), and the New York Subway by Soper (1908).
Studies in caves are few, but include those by Lurie & Way (1957)
and by Mason-Williams & Benson-Evans (1958).
SEWERS
Miquel (1880), in Paris, gave special attention to the sewer in the Rue
de Rivoli near its junction with the large collector of the Boulevard
Sebastopol. He found a steady load of from 800 to 900 bacteria per cubic
metre. Pollens were absent, and cryptogamic spores were only | to j
as numerous as in outdoor air at the same time. The contamination of the
air in the near-by Rue de Rivoli was lower in winter but higher in summer
than it was in the sewer.
Comparable results were reported from London in sewers under the
Palace of Westminster (Carnelley & Haldane, 1887).
AIR-SPORA OF FARM BUILDINGS
High microbial concentrations often occur in farm buildings, such as
cowsheds, where hay is being fed to animals, or in barns where thrashing
or cleaning is in progress. Inhalation may produce symptoms of the still-
little-understood farmer's lung and thrasher's lung, as well as various
diseases of farm animals. Milk also needs protection from contamination
by barn air {see Ruehle, 191 5; Ruehle & Kulp, 191 5).
160

7/30/2019 Microbiology of at 00 Greg
http://slidepdf.com/reader/full/microbiology-of-at-00-greg 189/286
THE AIR-SPORA OF ENCLOSED SPACES
AIR-SPORA OF GLASSHOUSES
The air of glasshouses has received Httle attention, in spite of the fact
that workers and crop plants in it may be exposed to high concentrations
of micro-organisms. Glasshouses may act as important spore emitters bymeans of convection through open ventilators (Hirst, 1959).
SHIPS
Air in holds and living quarters on board ship was studied early by
Miquel (1886). A modern study of air in ships—including submarines,
which are relatively clean—is reported on by Ellis & Raymond (1948).
161

7/30/2019 Microbiology of at 00 Greg
http://slidepdf.com/reader/full/microbiology-of-at-00-greg 190/286
XIII
DEPOSITION GRADIENTS AND ISOLATION
Chapter V described efforts to formulate changes in concentration of the
spore-cloud while it diffuses and travels downwind. We must now discuss
the more complex phenomenon of deposition gradients—the decrease in
number of spores deposited with increasing distance from the source.
The infection of a plant by an airborne spore is itself a complex process
of which physical transport is an important part. Infection may fail at any
one of a chain of stages; and, for a deeper understanding of the whole
process, it is necessary to understand the parts. Spore diffusion and
deposition are stages selected for special attention in this chapter.
It is impossible to predict, from knowledge of the characteristics of
spore deposition gradients, how many infections will be acquired by a
plant at a given distance from a source of known strength, because con-
ditions may be unsuitable for infection; but there is a possibility of being
able to predict an upper limit, and to use this knowledge in choosing safe
isolation distances. This chapter deals with gradients measured up to
distances ranging from a few metres to a few kilometres from the source
long-distance dispersal is discussed in Chapter XIV. The discussion
assumes the simplified conditions described on page 47; but, even so,
deposition and infection gradients have complications.
Factors Complicating Infection Gradients
(i) Deposition coefficient. With sources at or near ground-level, the
diffusing cloud of spores, unlike a gas or smoke, is robbed by heavy
deposition close to the source. Concentration and area-dose at a point
downwind therefore depend on two factors—the diffusion history and the
deposition history which the relevant part of the cloud has experienced.
In view of the evidence given in Chapter VI I, velocity of deposition
can provisionally be taken as proportional to terminal velocity, and the
importance of deposition will increase with spore size.
(ii) Viability. It is assumed, in the absence of experimental evidence
to the contrary, that viability is not affecting gradients over the short
distances discussed here, though the future may show this assumption
to be an over-simplification (p. 190).
(iii) Available sites. Deposition gradients do not necessarily give rise
to observable infection gradients. For instance, a fruit-body ofGanodernm
162

7/30/2019 Microbiology of at 00 Greg
http://slidepdf.com/reader/full/microbiology-of-at-00-greg 191/286
DEPOSITION GRADIENTS AND ISOLATION
applanatum will emit spores continuously and copiously for months, and
the spores will be diffused and deposited; yet the occurrence ofGanoderma
fruit-bodies remains erratic throughout a forest, their occurrence being
limited by what may be expressed in the ignorance-blanketing phrase'availability of sites'. An infection gradient can only develop when sites
such as trap surfaces, nutrient medium, susceptible host-plants, ripe
stigmas, or burnt soil, are freely available. The deposition gradient is a
regular phenomenon: an infection gradient follows when the deposition
gradient is superimposed on unoccupied sites. Ecologically, an infection
gradient is a stage in succession, not a characteristic of a balanced state.
(iv) Multiple infections. As long as the number of available sites is
large, the slope of the infection gradient will be parallel to that of the
deposition gradient. But as soon as available sites begin to be used up, the
infection gradient will be flattened, the flattening beginning nearest
the source, and the relation between the two gradients under simple
conditions is given by the multiple-infection transformation (Gregory,
'948)-
When disease incidence is recorded as the number or percentage of
plants attacked, irrespective of whether the plant has one or many lesions,
aphid punctures, etc., the percentage will have to be suitably transformed
before the formula for deposition can be applied.
The need for the transformation may be illustrated by considering a
hypothetical example of lOO potato plants, uniformly susceptible and
exposed to infection by Phytophthora infestans from a distant source.
The first spore that causes an infection must obviously infect i per cent
of the plants. A second infecting spore, so long as it falls at random
among the lOO plants, will have one chance in loo of alighting on the
one plant already infected, instead of infecting a second plant. As the
percentage of infected plants increases, the probability that each additional
infection falls on a plant already infected (thus producing no increase in
the percentage of plants infected) increases greatly. When 99 per cent of
the plants are infected, another infection will have only one chance in 100
of falling on the single remaining healthy plant. Different parts of the
percentage range, therefore, correspond to very different spore densities
per unit area, and the transformation can be neglected only in the lower-
percentage categories.
Thompson (1924) applied the Poisson distribution to the problem of
multiple infection and showed that ifN = number of hosts available, and
y = average number ofhosts infected after the deposition at random among
the hosts of x parasites, then
y = N (i - e-'^/^),
Table XXVI gives x calculated for values of y varying from i to 99-9
per cent; it shows that whereas only one infection is required to bring
about an increase from i to 2 per cent, the increase from 98 to 99 per cent
163

7/30/2019 Microbiology of at 00 Greg
http://slidepdf.com/reader/full/microbiology-of-at-00-greg 192/286
THE MICROBIOLOGY OF THE ATMOSPHERE
requires sixty-nine infections (that is, 460 minus 391 according to the
table).
TABLE XXVI
MULTIPLE-

7/30/2019 Microbiology of at 00 Greg
http://slidepdf.com/reader/full/microbiology-of-at-00-greg 193/286
DEPOSITION GRADIENTS ANT) ISOLATION
between individuals ('under-dispersion' as understood by ecologists),
and K will then be less than unity. Aggregation ('over-dispersion'), on
the other hand, leads to K being greater than unit}". Aggregation may be
due to such causes as local spread of infection, progeny remaining near
parent, or to local differences in susceptibiHt}'. Plank (1946) has given a
useful test for detecting aggregation in the field.
(v) Infection efficiency. Gradients may be observed either by directly
counting the numbers of spores deposited on equal areas at different
distances, or by counting some consequent effect such as colonies, leaf-
spots, or diseased plants. Usually these gradients will be the same when
numbers are plotted against distance, but the infection gradient will be
much lower than the deposition gradient. Even with a nearly loo-per-cent
viable spore suspension, the general experience in inoculation tests with
plant pathogens is that only a small proportion of the spores deposited
will give rise to a lesion—even when conditions for infection are as favour-
able as possible ; in unfavourable conditions the formation of lesions falls
to zero. The proportion of spores successfully infecting is termed 'infec-
tion efficiency' by Gaumann (1950, p. 1 57), and values recorded by various
workers under highly favourable experimental conditions include:
Phytophthora infestans 6-5 per cent, Alternaria solani 17 per cent, and
Septoria lycopersici 0-2 per cent (all on tomato leaves, cf. McCallan &Wellman, 1943); Botrytis sp. on Viciafaba 5 per cent (F. T. Last, un-
published); Peronosporu tabacina approximately i per cent (Waggoner &
Taylor, 1958).
Rust fungi show relatively higher efficiencies. Thus Petersen (1959)
observed penetration by 30 per cent of uredospores of Puccinia graminis
tritici
on wheat leaves; but,at
the highconcentrations tested, over 100
uredospores were required to produce one sporulating uredosorus {see
Durrell & Parker, 1920). \\'ith the same fungus, Rowell & Olien (1957)
obtained as many as eleven uredosori per 100 spores applied. McCallan
(1944) evidently obtained about 10 per cent efficiency from uredospores
of Puccinia antirrhini. R. H. Cammack (personal communication) ob-
tained 15 to 23 per cent efficiency when inoculating Puccinia polysora to
susceptible maize.
Considering its importance in plant patholog}', it is remarkablehow little attention has been given to infection efficiency. Its value must
vary with dispersal conditions, but commonly the height of the infection-
gradient curve above the x-axis will be only about one-hundredth that of
the deposition curve, though the slopes of the two curves would be similar.
(vi) Secondary spread. From turbulence theory we can predict only
primary dispersal gradients. As Waggoner (1952) points out: 'Because
proximity of a source is relatively more important than strength of the
source, spatial distribution of diseased plants becomes more uniform as
secondary infection progresses.' The infection gradient will therefore be
flattened if observed long enough after deposition for secondary spread
165

7/30/2019 Microbiology of at 00 Greg
http://slidepdf.com/reader/full/microbiology-of-at-00-greg 194/286
THE MICROBIOLOGY OF THE ATMOSPHERE
to occur around the primary lesions. Examples of this effect are found in
Pape & Rademacher (1934), Zogg (1949, Figs. 10 and 11), Waggoner
(1952, Fig. 2), and Cammack (1958).
(vii) Sampling. At low levels of infection, the size of samples must be
increased, as otherwise the sampling error becomes large {see Finney,
1947)-
Empirical Methods
As noted in Chapter V, gradients can be represented by either an
empirical or a theoretical model. In the empirical method we make the
curve to fit the data, but in the theoretical method we test the fit of the
data to the curve.
Frampton et al. (1942) concluded that incidence of some insect-
transmitted virus diseases decreased logarithmically with distance.
Zentmeyer et al. (1944) studied the spread of the Dutch elm-disease
pathogen, CeratostomeUa tilmi, which is transmitted from tree to tree by
the elm-bark beetle, Scolytus niulthtriatus. Their data, to distances
of about 84 metres, indicated that the probability of infection decreased
with the logarithm of the distance. Most subsequent curve-fittersagree
that such decrease is logarithmic.
Wolfenbarger (1946, 1959; see also Wadley & Wolfenbarger, 1944),
in valuable surveys of literature on the dispersal of bacteria, spores, seeds,
pollen, and insects, concluded that the observed data could be fitted by
one of the two following equations
:
E = a + b (log x), or
E = a + b (logx)
+ c(i/x),
where E = the expected value, x = distance from source, and a, b,
and c are parameters derived from the observed data. Values of the para-
meters a, b, and c, obtained by Wolfenbarger, showed enormous variation
between the numerous sets of published results, and it is not possible to
make any kind of generalization using this method, or to use the para-
meters, as given, to predict gradients.
E. E. Wilson & Baker (1946, 1946^^) made field observations in
California on the dispersion pattern of apricot brown-rot {Sclcrotmia laxa
on Primus armeniaca), and they also liberated Lycopodium spores experi-
mentally. They fitted the following equations to their data
:
(i) y = loo/x^ for the gradient of aerial spore concentration (con-
centration at distance X2 and at subsequent distances being expressed as
a percentage of the concentration at x^).
(2) y = 100 (i + a)2/(x + a)^, for the gradient of infection by
airborne spores, where a is a parameter for the experiment.
Dispersal by insect vectors is usually fitted by a logarithmic expression.
Bateman (1947^) found that the proportion (F) of contamination of
166

7/30/2019 Microbiology of at 00 Greg
http://slidepdf.com/reader/full/microbiology-of-at-00-greg 195/286
DEPOSITION GRADIENTS AND ISOLATION
seed crops by insect cross-pollination at distance (D) was fitted by the
expressions
:
F = ye-'^^s or
D '
where y = contamination at zero distance, and k expresses the rate of
decrease of contamination with distance.
Gregory & Read (1949) concluded that data for insect-borne viruses
could be fitted well by the empirical expression
log I = a + bx,
where I = number of infective punctures at a distance x from the source
after a given time, and a and b are constants for any one given set of
field conditions.
With the empiricalmethod an equation canusuallybeobtained,contain-
ing at most three parameters, which gives a good fit to any particular set of
data. However, it is not easy to compare the results obtained by different
workers. The empirical method is difficult to use because point, strip,
and area sources are not distinguished, the multiple-infection transforma-
tion has not been applied even w^hen appropriate, and the parameters as
calculated from the data correspond to no obvious natural phenomena;
they may even conceal different units of measurement varying from centi-
metres to nautical miles! Progress with the empirical method requires
attention to these matters and, especially, the adoption of a standard
metric unit of distance.
Diffusion and Deposition Theories
The more difficult, but potentially more useful, theoretical approach
is derived from the diffusion phenomena described in Chapter V.
w. Schmidt's theory
Schmidt (19 18, 19 19) used his diffusion theory to calculate Q_x/Q^o>
the fraction of the eddy-diffusing spore-cloud which remained in the air
at distance x. To do this he assumed that any part of the cloud whose
diffusion path would have brought it down to ground-level, would have
been removed from the cloud by deposition. He represented the terminal
velocity of the particle as equivalent in effect to tilting the ground, and he
gives a table from which the 'dispersal limit' under average conditions of
wind-speed and turbulence could be read for particles with different
terminal velocities. Dispersal hmit (V) was defined as the distance
exceeded by only i per cent of the particles liberated.
Schmidt's theory was developed further by Rombakis (1947), who
brought the fall velocity of the particles into the differential equation and
167
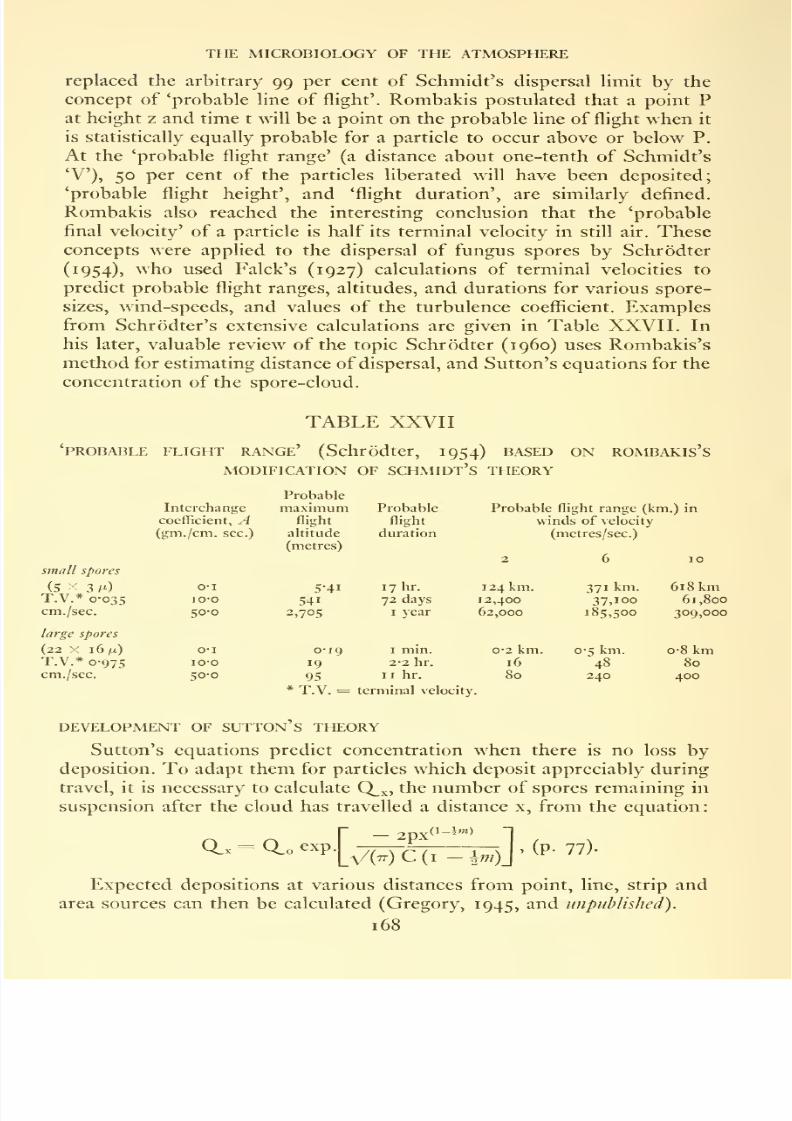
7/30/2019 Microbiology of at 00 Greg
http://slidepdf.com/reader/full/microbiology-of-at-00-greg 196/286
THE MICROBIOLOGY OF THE ATMOSPHERE
replaced the arbitrary 99 per cent of Schmidt's dispersal Kmit by the
concept of 'probable line of flight'. Rombakis postulated that a point P
at height z and time t will be a point on the probable line of flight when it
is statistically equally probable for a particle to occur above or below P.
At the 'probable flight range' (a distance about one-tenth of Schmidt's
'V'), 50 per cent of the particles liberated will have been deposited;
'probable flight height', and 'flight duration', are similarly defined.
Rombakis also reached the interesting conclusion that the 'probable
final velocity' of a particle is half its terminal velocity in still air. These
concepts were applied to the dispersal of fungus spores by Schrodter
(1954), who used Falck's (1927) calculations of terminal velocities to
predict probable flight ranges, altitudes, and durations for various spore-sizes, wind-speeds, and values of the turbulence coefficient. Examples
from Schrodter's extensive calculations are given in Table XXVII. In
his later, valuable review of the topic Schrodter (i960) uses Rombakis's
method for estimating distance of dispersal, and Sutton's equations for the
concentration of the spore-cloud.
TABLE XXVII
'probable flight range' (Schrodter, 1954) based on rombakis's
MODIFICATION OF SCHMIDT's THEORY

7/30/2019 Microbiology of at 00 Greg
http://slidepdf.com/reader/full/microbiology-of-at-00-greg 197/286
DEPOSITION GRADIENTS AND ISOLATION
(i) Point source. D, the /c/^z/ number of spores deposited on an anniilus
I cm. wide at a distance x from a point source, is given by
:
Vin) Cx-"'
(ii) And d, the mean number of spores deposited per square centimetre
on an annulus i cm. wide at a distance x from a point source, is given by:
277tCx*(-+^*
(iii) And d„., the number of spores deposited per square centimetre
at a distance x do\Miwind from a point source, is given by:
_ p2Q^x
" ttCV"'
(iv) Line source, d,,,., the number of spores deposited per square
centimetre at a distance x downw ind from a line source, is given by
:
. _ P2Q.X
d... = ,. !^:t^^—.x'-'"'"*aw
W
V(^)Cx^'"
di.v is thus numerically equal to D.
(v) Strip source, d^.^, the number of spores deposited per square
centimetre at a distance x do\Miwind from a strip source of width w, is
given by integration as
:
P4ax
\/{tt)C (2 — w)
Gregory (1945, p. 69) gave a set of calculated values for D, d, d,,. and
di„., assuming Q^o = io^°, p = 0-05, C ~ o-6 (cm.)% ;;/ = 1-75 and 1-24.
With further knowledge of these parameters, revised calculations are now
given (pp. 1 7 1-6).
Meanwhile, in a series of papers on pollen contamination of seed
crops, Bateman (1947, 1947':?, 1947'^) gave many examples of dispersal
gradients, adopting and simplifying the Gregory formulae and using a
regression method for testing the adequacy of the diffusion theories of
W. Schmidt and of Bosanquet & Pearson (1936). Bateman's method also
makes it possible to estimate p/C and Q_„, provided all measurements are
expressed in the same units. Regression tests showed that pollen dispersal
was best fitted by the 1945 formulae of Gregory, but the data were inade-
quate for choosing between the values 1-76 and 1-24 for the parameter
m of Sutton's equations.
Combining field inoculation studies with eddy-diffusion models,
Waggoner (1952) made an important contribution by adapting the for-
mulae: (i) to allow for non-isotropic turbulence; and (2) to incorporate
169

7/30/2019 Microbiology of at 00 Greg
http://slidepdf.com/reader/full/microbiology-of-at-00-greg 198/286
THE MICROBIOLOGY OF THE ATMOSPHERE
the ratio of spores deposited to percentage leaves (or leaflets) diseased.
Waggoner used the findings of E. E. Wilson & Baker (1946) and of Scrase
(1930), to put the variance of concentration of vertical distribution (ct^^)
as equal to4/9
of the variances inthe x and y planes. This led to the
formula (in our symbols)
:
X = -^^^exp.[-x-(r2 + 9z2/4)],
where r^ = x^ + y^-
From observed gradients of late-blight [Phytophthora infestans)
around artificially inoculated potato plants in the field, Waggoner took k
as the ratio of spores depositedper
square centimetre tothe proportion
of leaflets diseased, and estimated the parameters p (deposition rate) and
Qp/k from the equation
^ o-i35p(Qp/k)/ ^ o u
where D = proportion of leaflets diseased. (In Waggoner's tests,
D was comparatively small and did not need the multiple-infection
transformation.)
In his experimental potato plots in Iowa in 1949 and 1950, respectively,
Waggoner found p = o- 12 and 0-15, and Qp/k = 18 X 10'' and 7-8 X 10^.
Subsequently for Perojiospora tabacma Qo was estimated at approximately
10^ spores per sq. cm. of lesion per day (Waggoner & Taylor, 1958).
For assessing concentrations of radioactive clouds, Chamberlain
(1956, pp. 20-27) at Harwell developed expressions combining the eddy-
diffusion equations (of Sutton, 1947) and the allowance for loss by deposi-
tion (of Gregory, 1945). Chamberlain also modified the equations to allowfor elevation of the source above ground-level, illustrating the fact that
elevating the source greatly reduces the loss by deposition.
Re-calculation of the Deposition Gradient
With new information and further development of the statistical
theory, deposition gradients can now be calculated for a wider range of
conditions than was possible earlier. The values worked out here are
offered as giving a useful indication of trends, but much further work still
remains to be done.
Chamberlain's modifications have been adopted, in preference to
Waggoner's, because the latter uses the parameter k, which can vary over a
wide range down to zero—depending as it does on leaflet size in a particular
crop, and on how favourable conditions were for infection.
Two sets of graphs are provided. Fig. 24 gives Q_x for m ~ i"]Si
C — 0-6 (metres)^, and a variety of heights and distances from the source.*
* The parameter 'C is now given in units of (metres)*, in place of (cm.)* used in
Gregory, 1945.
170

7/30/2019 Microbiology of at 00 Greg
http://slidepdf.com/reader/full/microbiology-of-at-00-greg 199/286
DEPOSITION GRADIENTS AND ISOLATION
Another set, Figs. 25-27, gives values of D, d, d,,., dj,,,, and d^^ on a
logarithmic scale for sources of various geometrical form, assuming no
loss from the cloud by deposition. To predict a gradient, the deposition
values are first read-off for various distances from the appropriate
line on Figs. 25 to 27, and allowance can then be made for loss from the
cloud at each distance by reading-off Q^^ as a fraction of Q^„ in Fig. 24.
X metres
100 1.000 loooo 1000,00
Fig. 24.—Fraction of spore-cloud remaining airborne (allowing for loss of spores from
spore-cloud by deposition to ground), expressed as Q.x/Q.o- Calculated from Chamberlain(1956): for ?n = 1-75; Cz = 0-21 (metres)J; height of source above ground, h = o-o, o-i, i,
10, and ICO metres; distances from source, x = i metre to 100 km.
CALCULATION OF Q_x
Except in experimental spore-liberation tests, the quantity liberated,
Q_o, is usually unknown. However, cloud concentration and deposition
are proportional to Qp so, although the height of the gradient line will
depend on the source-strength, its slope will be unaffected by the value of
Elevation of source has been allowed for by using the equation number
52 of Chamberlain (1956), to calculate values of Q^^ for heights h = o,
o-i, I, 10 and 100 metres.
Fig. 24 shows that elevating the source decreases deposition on
ground near the source, and in using Figs. 25-27 for elevated sources
it is important to neglect those parts of the curves before deposition
starts. This decreased deposition near an elevated source was confirmed
experimentally by Colwell (1951), who liberated P-32 radioactive Phius
pollen at 3-5 metres above ground-level into a wind averaging 8-i metres
171
7/30/2019 Microbiology of at 00 Greg
http://slidepdf.com/reader/full/microbiology-of-at-00-greg 200/286
THE MICROBIOLOGY OF THE ATMOSPHERE
per sec. Colwell sampled simultaneously with vacuum cleaners and Petri
dishes on the ground, and estimated the number of pollen grains with the
help of a Geiger-Miiller counter. Maximum deposition in this experiment
was obtained at 5-8 metres horizontal distance from the source.
For Sutton's parameters, the values adopted here are
:
Cx = Cy = 0-21 (metres)^, Q = 0-12 (metres)*, and m = 1-75.
As a measure of deposition, p has been chosen in preference to Chamber-
lain's Vg/u, because the wind-speed under which deposition occurred is
usually not known in the open air. However, the curves, which are calcu-
lated for p = 0-05, o-oi, and o-ooi in Figs. 25, 26, and 27, respectively,
can be used with Chamberlain's velocity of deposition if the wind-speed
is known, because provisionally it is taken that p = Vg/u.
More field experiments are needed before we can decide whether
deposition over rough ground depends on time or on distance—a contrast
analagous to the rival diffusion theories of W. Schmidt and Sutton. From
Chapter VII it seems that p depends on the terminal velocity of the par-
ticle, and numerically it has a value of about one-fiftieth to one-hundredth
of the terminal velocit)' expressed in centimetres per second. No allowance
has been made in these calculations for the hitherto unexplained larger
values of p which have been observed within a few metres of a source
near ground-level.
Some plant pathogens have large, readily-impacting spores. When
liberated at, or near, ground-level, although a small proportion may travel
vast distances, most of these spores probably do not move very far from
the source. Fig. 24 suggests that for 'impactor' spores with a deposition
coefficient of p==
0-05, and liberated at 10 cm. above ground-level,
94 per cent would be deposited within 100 metres of the source.* But
'penetrators', with p = o-ooi, would be deposited only to the extent of
6 per cent within 100 metres under similar conditions.
In spite of neglecting terminal velocity during the diffusion process
a feature criticized by Schrodter(i96o)—this method predicts a much more
rapid loss of material from the cloud than does Rombakis's method:
perhaps because the ground-level concentration of the cloud is restored
by downward diffusion much more efficiently than by sedimentation.On our theory, 50 per cent of large spores liberated at 10 cm. above
ground would be deposited within 10 metres, but, according to
Schrodter's calculations, this fraction would travel at least 200 metres
(Table XXVII). Such rapid decrease in the value of Q^^ near a ground
source emitting large spores is supported by experimental evidence which
has already been summarized in Table XIV (Chapter VII). Yet some
* My mistake (Gregory, 1952; see correction, 1958) in stating that 99-9 per cent of
those liberated at ground-level would be deposited within 100 metres, was due to
misreading Qo = 10'^ as 10^" in my own table (Gregory, 1945, Table 21)—not to the
misunderstanding suggested by Schrodter (i960, p. 178).
172

7/30/2019 Microbiology of at 00 Greg
http://slidepdf.com/reader/full/microbiology-of-at-00-greg 201/286
o
DEPOSITION GRADIENTS AND ISOLATION
lO lOO I.OQO lO.OOO
Distance in metres
Figs. 25 to 27.
—Dilution of spore-cloud
by eddydiffusion.
Calculated for ;h = 1-75(also m = 1-24 and 2-0), expressed as logarithms of: d, dw, diw, D (and also for daw with
width of 100 metres).
Fig. 25.—Deposition coefficient, p = 0-05.

7/30/2019 Microbiology of at 00 Greg
http://slidepdf.com/reader/full/microbiology-of-at-00-greg 202/286
THE MICROBIOLOGY OF THE ATMOSPHERE
lO lOO I.OOO lO.OOO
D=d Iw
OO IpOO lO.OOO
J L
Distance in metres
Fig. 26.—Deposition coefficient, p = o-oi.
174

7/30/2019 Microbiology of at 00 Greg
http://slidepdf.com/reader/full/microbiology-of-at-00-greg 203/286
o
o
o _
(D J
tXO
O
DEPOSITION GRADIENTS AND ISOLATION
lO lOO I.OOO lO.OOO1

7/30/2019 Microbiology of at 00 Greg
http://slidepdf.com/reader/full/microbiology-of-at-00-greg 204/286
THE MICROBIOLOGY OF THE ATMOSPHERE
workers have considered that these large estimates for deposition near the
source are incompatible with the facts about dispersal in the upper-air,
and over long distances, which are discussed in Chapters X and XIV.
This dilemma is considered further below (pp. i8o and 197).
The effect of values of m lower than 1-75 is to increase deposition
near the source and to decrease it at greater distances. With liberation at
ground-level, the distance at which deposition per unit area is equal with
either m = 1-75 or 1-24, lies between x = 10 and x = 100 metres. For
other heights of liberation above ground-level, calculations are not yet
complete.
Application of Gradients
The results given graphically in Figs. 24 to 27 can be used in various
ways, some of which are illustrated in the following examples.
(i) Deposition at a point downwind. Assuming that a million uredo-
spores are liberated at a point one metre above ground-level under
standard atmospheric conditions, what number would be deposited per
square centimetre of ground at a point 100 metres downwind? ChooseFig. 25, because p = 0-05 is the relevant coefficient of deposition for
uredospores (rather than Figs. 26 and 27, which refer to smaller spores).
Choose the group of three lines marked 'd,,.' (deposition per square
centimetre downwind of a point source). Choose the middle of these three
lines, as m = 1-75 under standard conditions. Read-off the value of
'logarithm (deposit -^ Qp)' for the distance of 100 metres. This value
is approximately = ^-4. As in this example Qp = lo*', log Qp = 6-o, so
we now have log d^^ = 6-o + 5-2, therefore log d^^ = 1-4, and d,,, = 25
spores per square centimetre.
But this calculation assumes no depletion of the cloud, and deposition
must now^ be allowed for by replacing Q^^ by Q^^- From Fig. 24, choose the
group of curves marked p = 0-05 and, as the height of liberation is i
metre, choose the line for h = i, and read off the value for Q^x/Q_o ^t 100
metres. This value is approximately 0-25, indicating that only about a
quarter of the spores liberated are still in suspension at the distance of
100 metres from the source. We therefore have the value of the corrected
d^ = 0-25 X 25 = 6. The answer to the problem is that we predict a
deposit of six uredospores per square centimetre under the conditions
postulated.
(ii) Fitting theoretical curve to observed data can best be illustrated by a
published example that gives actual distances and percentages of leaves
infected. Relative distances are useless because the slope of the gradient-
line is characteristic of an absolute distance, and also with relative
percentages we cannot apply the multiple-infection transformation if the
data require it.
176

7/30/2019 Microbiology of at 00 Greg
http://slidepdf.com/reader/full/microbiology-of-at-00-greg 205/286
DEPOSITION GRADIENTS AND ISOLATION
Waggoner (1952) gives two sets of data on the spread of potato late-
blight {Phytophthora infestans) at Clear Lake, Iowa. 'Point source' foci
were established in field plots by artificial inoculation. Hollow curves
were plotted, showing the proportion of leaflets diseased at various dis-
tances from the source on the ninth day after inoculation in 1949 and
the eighteenth day in 1950. Reading-off observed values from Waggoner's
graphs gives the values for 1949 and 1950 as plotted in Fig. 28; these
agree well with the slope of the predicted gradient (d) for dispersal from a
point source. (The highest incidence was between 7 and 8 per cent, so the
multiple-infection transformation is unnecessary.)
^Q.
- 3
- 4
10
- 5
1000
source
100
metres from
Fig. 28.—Infection gradients of potato late-blight {Phytophthora infestans) observed by
Waggoner (1952) at Clear Lake, Iowa, in 1949 and 1950; compared with d = theoretical line for
deposition downwind from a point source, assuming m = 1-75, Cy = od (metres)i, p = 0-05,
and allowing for Q_x.
(iii) Fixing limits for isolation. The formula for d (average deposition
at distance x in all directions around a point source) may be chosen when
spread of a disease within a field, or gene dispersal, is being considered.
For safe decision on isolating a healthy crop from contamination, the use
of dw may be preferable as it predicts maximum concentration do\\Tiwind.
Suppose we wish to estimate the upper limit of the percentage of
those plants infected with Ustilago tritici to be expected at 50 metres
distance from a lo-metre-square plot ofsmutted wheat acting as a source
knowing from past local experience that seed saved from the source plot
M 177

7/30/2019 Microbiology of at 00 Greg
http://slidepdf.com/reader/full/microbiology-of-at-00-greg 206/286
THE MICROBIOLOGY OF THE ATMOSPHERE
itself is likely to produce only 5 per cent of diseased plants. We choose the
curve for deposition downwind of an area source, with liberation height
h=i metre, under standard conditions (w = 1-75), and p = o-i.
Assume that infection at i metre distant is also 5 per cent. From Fig. 24we find that Q_x is o-88 Q^„ at 50 metres distance, and from Fig. 26, d^
at 50 metres is only about 28 per cent, of the value at i metre. The
expected maximum level of infection at 50 metres is therefore 28/100
X 0-88 X 5 per cent = 0-12 per cent. Under similar conditions, Oort
(1940) recorded about half this decrease at 50 metres. At i km. down-
wind of a ID X 10 metre plot, it would be more appropriate to adopt
the curve for a point source and estimate the level at 1-5 X 10"^^ per cent.
(iv) Relative contributions of near and distant sources. A susceptible
plant in a field is often exposed simultaneously to infection from near-by
and distant sources. The problem arises as to the relative importance of a
few diseased plants within the crop as compared with possible massive
sources of infection in neighbouring fields. Quantitative answers have to
be guessed to set limits of tolerance for issue of health certificates, and the
data from gradients can be used to improve such guesses.
A simple case would be to inquire how many diseased plants at 1,000
metres distance would give the same amount of deposition as that on a
plot of 100 metres radius with a single diseased plant at its centre, assuming
that distribution by wind is uniform in all directions. From Fig. 25,
over the range x = to x = 1,000 metres (for m = i*75, p = 0-05, and
h = o-i metre), the total deposition is Q^^ — Q^^ (for x = 100 metres)
= 1-0 0^0 — o-o6 0^0 = 0-94 Q_o. From Fig. 27, the average deposition
from one plant at a distance x = 1,000 metres is 4 x io~^^ Q_o spores per
sq. cm. The circle of radius 100 metres around the single plant contains
3-14 X 10^ sq. cm., so a plant at 1,000 metres contributes: (4 x 10^^Q^„)
X (3-14 X 10^) = 12-5 X 10^ Q_o spores. The number of plants i km.
away required to equal the contribution of one plant within the 100 metre
radius circular plot is therefore approximately:
0-94 Q_o/i2-5 X 10^ Q^o =- 7,500 plants.
Characteristics of Gradients*
Some observed gradients fall off much more steeply than the line
calculated for m = 1-75. For example, the only gradients recorded for
aecidiospores oi Puccinia graminis (A. G. Johnson & Dickson, 1919; and
Lambert, 1929) follow closely the expected gradient for a strip source
with m = 1-24, suggesting that these spores are dispersed when tur-
bulence is small. Data on potato late-blight {Phytophthora infestans)
contributed by Limassct (1939) and Bonde & Schultz (1943), and for
Peronospora destructor on onions by Newhall (1938), also suggest dis-
persal under low-turbulence conditions.
* Other properties of gradients are discussed by Plank (1960).
178

7/30/2019 Microbiology of at 00 Greg
http://slidepdf.com/reader/full/microbiology-of-at-00-greg 207/286
DEPOSITION GRADIENTS AND ISOLATION
Further study will show whether certain groups of fungi are usually
dispersed only under low-turbulence conditions. If it is confirmed that
they are, a much smaller isolation distance could safely be permitted
between disease sources and healthy crops than is permissible with patho-
gens that are dispersed in normally turbulent air, because with a small
degree of turbulence the contaminated area is narrower and more intense.
Meanwhile it is safer for isolation purposes to choose for prediction the
line from the appropriate set which has been calculated for normal
turbulence, m = i-JS-
The rapid decrease in deposition with increasing distance from the
source helps to explain the observations of Schmitt et al. (1959), who
showed that many smallrust infection foci distributed
over a wheatfield
are more destructive to the crop than the same number gathered together
at a single focus.
The fact that the slope of the curve is a characteristic of a particular
distance can be used in the field to locate an unknown source. If lesions
(or spores) are uniformly scattered over an area, we can assume that the
source is so distant that the place of observation is on the tail of one (or
many) dispersal gradients. Where counts increase rapidly, there is
evidence that a source is being approached. Stakman & Hamilton (1939)located a large rust-infected barberry bush in western Minnesota, by
first identifying unusual rust races in the vicinit}' and then tracing the
telial stage of the rust on grasses leading up to the bush.
Topographical Modification of Gradients
Diflfusion has been treated so far under nearly ideal conditions, but
the literature contains information on the effects of topographical features
which modify the gradient.
Pollen of wind-pollinated plants is distributed in typical gradients, as
shown, for example, by Roemer (1932), Jensen & B^gh (1942), Jones &Newell (1946), and Bateman (1947a). During strong winds in open fields,
Jensen & B(/gh's catches of pollens of rye, ryegrass, cocksfoot, timothy,
sugar-beet and mangold, on sticky microscope slides, showed a steady
decrease with distance up to i ,200 metres from the source field. But they
found that hedgerows and plantations protected ryegrass, cocksfoot, and
mangolds, in proportion to the height of the obstacle. In tests near to
the source, a protection corresponding to an isolation distance of about
200 metres of open ground was obtained behind hedges, even so far
do\Miwind as 5 to 10 times their height (cf. Rider, 1952; Schrodter, 1952;
U.S. Weather Bureau, 1955; Cabom, 1957).
Gene Dispersion
The physical mechanisms of wind dispersal have a bearing on popu-
lation genetics. Theories of gene dispersion in populations at first assumed
179

7/30/2019 Microbiology of at 00 Greg
http://slidepdf.com/reader/full/microbiology-of-at-00-greg 208/286
THE MICROBIOLOGY OF THE ATMOSPHERE
that there is a random scatter around the source. In such a distribution
the gradient in any direction would have the form ofone-half of the normal
frequency curve. S. Wright (1943, 1946) studied genetic effects of isolation
distance, and his methods were applied by J. W. Wright (1953)to compare
dispersion distances of pollens of various forest trees with a view to
delimiting a 'neighbourhood' for race formation. Simple sticky-slide
traps were exposed at various distances around isolated trees, and pollen
counts were used to find the standard deviation of the scatter. Observed
values for the standard deviation were as follows: ash, 17-46 metres;
Douglas-fir, 18 metres; poplar and elm, 300 metres or more; spruce, 40
metres; Atlas cedar, 73 metres; Lebanon cedar, 43 metres; and pinyon
(pine), 17 metres. Dispersal data were well fitted by the Gregory formulae,
but not by theories which assume that the trajectory of each grain can
be calculated from the rate and distance of fall, and the wind velocity.
Bateman (1950) questioned whether gene dispersal is statistically
'normal', and showed by his regression method that many observed
distributions—including those of fungus spores, passively borne insects,
pollen, and wind-dispersed seeds—were highly leptokurtic, i.e. the peak
and tails of the distribution are exaggerated at the expense of the shoulders.
Compared with a normal frequency distribution having the same standard
deviation ('same over-all degree of inbreeding'), the leptokurtosis charac-
teristic of passive airborne dispersal produces more breeding between
close relatives and simultaneously more breeding between distant relatives
(see also Parker-Rhodes, 195 1).
180

7/30/2019 Microbiology of at 00 Greg
http://slidepdf.com/reader/full/microbiology-of-at-00-greg 209/286
XIV
LONG-DISTANCE DISPERSAL
Dispersal of microbes over long distances is an ever-present, world-wide
phenomenon. Its experimental study is almost non-existent; but there is
circumstantial and observational evidence of its magnitude, some of which
has been reviewed by J. J.Christensen (1942).
CONTROXTRSY ON THE IMPORTANCE OF THE AIR-SPORA
The discovery of air dispersal in any group of plants has usually been
followed by controversy between opposing specialists, some maximizing
and some minimizing the significance of the phenomenon. Exaggeration is
dangerous, and the object of this book is to present evidence from which
balanced conclusions can be derived.
Views current on air hygiene affect the design and planning of hospitals.
The air dispersal of human pathogens was confidently accepted in the
golden age of bacteriology, but was gradually discounted after the experi-
ments of Fliigge which focused attention on the limited scatter of drop-
lets from the mouth and nose (cf. Chapter XII). The balance has now been
restoredby Wells (1955) and others who have
stressed the floatabilit}' of
'droplet nuclei'.
In plant patholog}' the two schools of thought have been prominent
simultaneously. Butler (191 7) held that spores of plant pathogens could
be transported for short distances by air or by rain-splash, but claimed
that 'the distance to which spores may be carried in the air has often been
exaggerated in the past, and is much less than might be expected'. The
discontinuous spread of plant pathogens, he considered, was likely to
occur on seeds, plants, and horticultural produce; but 'infection by sporescarried through the air from remote centres is not a contingency which
needs to be taken seriously into account'. Naumov (1934) held that human
activity accounted for most long-distance transport of fungus pathogens
and that, in the absence of host plants, fungi were dispersed with extreme
slowness. Endothia parasitica in North America could not cross, in a
period of 1 years, a 45-60 km.-wide tract that was free from chestnut
trees; the spread of a disease of palm trees was estimated at only 4-5 km.
per annum.The literature contains many instances of fungus pathogens failing to
infect hosts at distances of a few metres (e.g. H. W. Long, 1914), or to
181
7/30/2019 Microbiology of at 00 Greg
http://slidepdf.com/reader/full/microbiology-of-at-00-greg 210/286
THE MICROBIOLOGY OF THE ATMOSPHERE
colonize apparently favourable environments. Not all of these necessarily
represent the failure of transport : genetic differences in host populations,
or the pre-establishment of competitors, may explain many puzzling
failures.
Diverse views have also been held about Bryophytes and Pterido-
phytes; however, most authors accept the possibility of their dispersal
over great distances, although the minimizing view has been held by some
{see Pettersson, 1940, p. 22).
Probably these differences in viewpoint will be resolved by quanti-
tative studies. The maximizing view, if held too strongly, may lead to
fatalism and to the neglect of local hygiene and of reasonable precautions
when transporting plants from place to place. However, evidence presented
in earlier chapters stresses the overriding importance of local sources.
The minimizing view, if applied to certain diseases, may lead to over-
reliance on local hygiene and neglect of protection by chemical and genetic
measures. It may also increase the danger of introduction of a vigorous
organism by neglect of quarantine precautions.
Long-distance dispersal will be discussed under two headings: (i)
diffusion theories extrapolating from short-range experiments; and (2)
observations on distant dispersal of inorganic and radioactive particles, of
rust fungi, and of other micro-organisms. The problem is complicated by
the curvature of air-mass trajectories, by the possibility that spores are
re-concentrated within cumulus and other clouds, by unpredictable
removal in precipitation, and by loss of viability.
Theoretical Discussion
Presumably the tropopause limits the vertical expansion of the spore-
cloud, and an extensive temperature inversion at a lower level may have
the same effect. After the spore-cloud has travelled perhaps 20 km. or
less, diffusion will become two-dimensional, and concentration may be
expected to decrease more slowly with increasing distance than it would
when the spore-cloud was nearer the source, where its diffusion was three-
dimensional. In the limiting case of a land-mass acting as a long strip or
area source, the decrease of concentration at 20 km. or more out to sea
can be expected to depend only on depletion of Q^^ (the fraction of the
cloud remaining in suspension).
Sutton's theory appears satisfactorily to describe dispersal of microbes
in air up to the limit of distance studied experimentally, but there is
some doubt about its use for distances greater than i km. or heights
above 30 metres. This is emphasized by Pasquill (1956), who dispersed
fluorescent dusts and sampled, both on the ground and by aeroplanes,
at distances of up to 64 km. and at heights of up to 1220 metres. In thesetests the height of the cloud was much less than the width : the width
did not increase uniformly with distance and the angle subtended at the
182
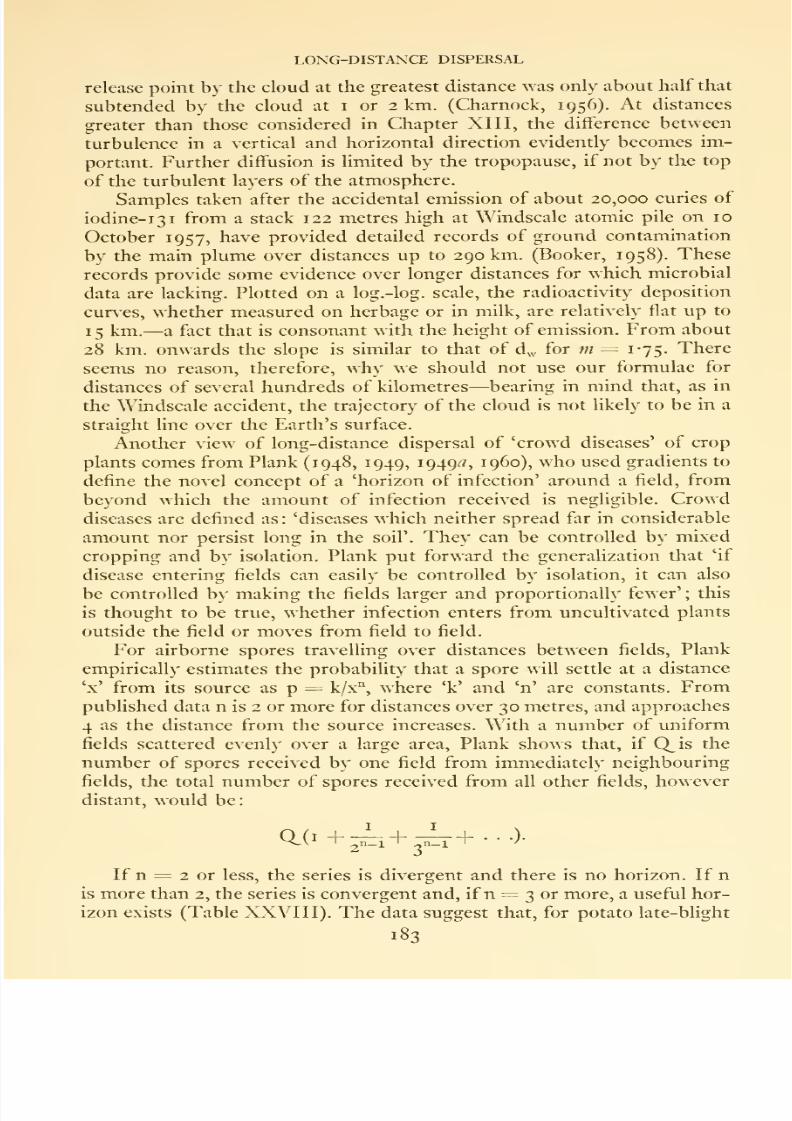
7/30/2019 Microbiology of at 00 Greg
http://slidepdf.com/reader/full/microbiology-of-at-00-greg 211/286
LONG-DISTANCE DISPERSAL
release point by the cloud at the greatest distance was only about half that
subtended by the cloud at i or 2 km. (Charnock, 1956). At distances
greater than those considered in Chapter XIII, the difference between
turbulence in a vertical and horizontal direction evidently becomes im-portant. Further diffusion is limited by the tropopause, if not by the top
of the turbulent layers of the atmosphere.
Samples taken after the accidental emission of about 20,000 curies of
iodine-131 from a stack 122 metres high at Windscale atomic pile on 10
October 1957, have provided detailed records of ground contamination
by the main plume over distances up to 290 km. (Booker, 1958). These
records provide some evidence over longer distances for which microbial
data are lacking. Plotted on a log.-log. scale, the radioactivity'- deposition
curves, whether measured on herbage or in milk, are relatively flat up to
15 km.—a fact that is consonant with the height of emission. From about
28 km. onwards the slope is similar to that of d„. for m = 1-75. There
seems no reason, therefore, why we should not use our formulae for
distances of several hundreds of kilometres—bearing in mind that, as in
the Windscale accident, the trajectory of the cloud is not likely to be in a
straight line over the Earth's surface.
Another view of long-distance dispersal of 'crowd diseases' of crop
plants comes from Plank (1948, 1949, i949(^i', i960), who used gradients to
define the novel concept of a 'horizon of infection' around a field, from
beyond which the amount of infection received is negligible. Crowd
diseases are defined as : 'diseases which neither spread far in considerable
amount nor persist long in the soil'. They can be controlled by mixed
cropping and by isolation. Plank put forward the generalization that 'if
disease entering fields can easily be controlled by isolation, it can also
be controlled by making the fields larger and proportionally fewer' ; this
is thought to be true, \\hether infection enters from uncultivated plants
outside the field or moves from field to field.
For airborne spores travelling over distances between fields, Plank
empirically estimates the probability' that a spore will settle at a distance
'x' from its source as p = k/x", where 'k' and 'n' are constants. From
published data n is 2 or more for distances over 30 metres, and approaches
4 as the distance from the source increases. With a number of uniform
fields scattered evenly over a large area. Plank sho^^s that, if Q^is the
number of spores received by one field from immediately neighbouring
fields, the total number of spores received from all other fields, however
distant, would be
:
If n = 2 or less, the series is divergent and there is no horizon. If n
is more than 2, the series is convergent and, if n = 3 or more, a useful hor-
izon exists (Table XXVIII). The data suggest that, for potato late-blight
183

7/30/2019 Microbiology of at 00 Greg
http://slidepdf.com/reader/full/microbiology-of-at-00-greg 212/286
THE MICROBIOLOGY OF THE ATMOSPHERE
{Phytophthora infestans) and onion downy mildew {Peronospora destructor)^
n approaches 4. If n is small, local hygiene will soon be defeated by the
flow of infection from outside; but if n = 3 or more, 'a considerable
reduction of infection should be possible by a group ofneighbours withoutit being neutralized almost immediately from elsewhere'.
TABLE XXVIII
EFFECT OF GRADIENT ON DISTANCE OF HORIZON OF INFECTION

7/30/2019 Microbiology of at 00 Greg
http://slidepdf.com/reader/full/microbiology-of-at-00-greg 213/286
LONG-DISTANCE DISPERSAL
plants. Moreover, none of these lichens inhabited rocks : all were epiphytes
which probably arrived on driftwood. Evidently lichens are poorly
equipped for wind transport in comparison with Myxomycetes, which were
represented by twenty-eight species (7 per cent of the world's list). Onlytwo rusts were recorded (0-02 per cent of those known), but these obligate
parasites must needs wait for their flowering-plant hosts.
QUANTITATIVE STUDIES
Ample qualitative evidence exists of mass transport of microbes by
wind over large distances, but there are few quantitative data. The work
of Zogg (1949) on one of the maize rusts in the Upper Rhine Valley is of
exceptional interest, both for the distance studied and for the complex
topography of the area.
In that part of Switzerland, Pticcinia sorghi overwinters in its aecidial
stage on the wild Oxalis stricta^ which grows in the level area where the
Rhine flows into Lake Constance. In early summer, near-by maize
becomes infected and a uredospore focus is established from which the
fungus is spread by wind up the narrow Rhine Valley. At various dates
in the 1945 and 1947 seasons, Zogg measured the incidence of infection
for 66 km. (up as far as Chur). Three striking facts about the gradients
observed are: (i) the general decrease in the number of uredosori per
plant with increasing distance from the source; (2) the flattening of the
gradient as a result of secondary spread later in the season; and (3) the
great irregularity of the gradient, because the incidence of the rust de-
creased locally wherever the valley widens, and increased again where it
narrows : a feature which Zogg attributes, no doubt rightly, to the nozzle
eflfect of the valley increasing spore concentration, though other ecocH-
matic factors may play a part. In the terminology adopted in the present
book, both area dose (A.D.) and efficiency of deposition (E) would be
increased where the valley narrows.
The diffusion theory developed in Chapter XIII referred to dispersal
over a level plain, and these modifications, imposed on a spore-cloud by
dispersal up an alpine valley, are therefore particularly interesting. In
comparison with the distance travelled, the focus of infection near Lake
Constance w^ould appear as a point source, though some flattening of
the gradient would be expected near the source. As the winds blow charac-
teristically up or down the valley, it seems appropriate to consider d,^
(deposition downwind of source). Plotting Zogg's data on a log.-log.
scale, we find that the linear regression (calculated as log. y = 5-356
— I -8 1 8 log. x) is compatible for the slope of d.^ as predicted by our theory
(Chapter XIII). We take this to indicate that in the valley diffusion by
atmospheric turbulence proceeds much as elsewhere, but that deposition is
subject to pronounced fluctuations associated with the width of the valley.
Observations over similar distances above the sea come from Hessel-
man (1919), who traced the transport of tree pollens from the Scandinavian
185

7/30/2019 Microbiology of at 00 Greg
http://slidepdf.com/reader/full/microbiology-of-at-00-greg 214/286
THE MICROBIOLOGY OF THE ATMOSPHERE
forests across the Gulf of Bothnia. Pollen was trapped in open Petri
dishes on two lightships, 'Vastra Banken' and 'Finngrundct', situated
respectively 30 and 55 km. from land, from 16 May to 25 June 1918
(Table XXIX).
TABLE XXIX
POLLEN TRAPPED ON LIGHTSHIPS IN GULF OF BOTHNIA, 1 6 MAY TO 25 JUNE
191 8 (Hesselman, 1919)
No. of grains per sq. cm.
ollen type

7/30/2019 Microbiology of at 00 Greg
http://slidepdf.com/reader/full/microbiology-of-at-00-greg 215/286
LONG-DISTANCE DISPERSAL
to that of Persson. Yet Pettersson found that Aloina spores were being
deposited in rain to the number of ten thousand per square metre and,
akhough their origin is unkno\\Ti, they must clearly have travelled a very
long way.
As an example of the diffusion of components of the air-spora over
long distances, we have quantitative information about the deposition of
uredospores of stem rust of wheat {Puccinia graminis tritici) contributed
by Stakman & Hamilton (1939). In the early summer of 1938 they studied
the deposition of uredospores of this pathogen at various points to the
north of ripening winter-wheat fields in the southern United States, which
were acting as a vast source of uredospores. At this time of year it could
be assumed that spores were not being produced locally in the spring-
wheat area in the northern United States, but that infection would follow
the arrival of the spore-cloud borne on southerly winds. Table XXX,
compiled from Stakman & Hamilton's data, indicates the amount of
deposition first in the source area and then at various points farther north.
TABLE XXX
STAKMAN & Hamilton's (1939) data for long-distance dissemination
OF Puccinia graminis (deposition on ground, 24-25 May 1938)
Place

7/30/2019 Microbiology of at 00 Greg
http://slidepdf.com/reader/full/microbiology-of-at-00-greg 216/286
THE MICROBIOLOGY OF THE ATMOSPHERE
from spore-trapping, field records of outbreaks, geographical distribution
of the physiological races, and meteorological data, has recently been
summarized by Stakman & Harrar (1957, pp. 221-32). To simpUfy a
complex story, Puccinia graminis and P. rubigo-vera {= P. triticina), for
various reasons, do not survive the cold winters of the northern part of
the continent or the hot and dry summers of the southern parts. Spring-
sown wheat in the northern United States and Canada receives rust-spore
showers annually from rusted autumn-sown wheat in Mexico and Texas.
In some years it comes by a succession of short jumps, with intervening
stops for local multiplication, whereas in other years infection spreads
suddenly from the south—for distances of a thousand or more kilometres
when atmospheric pressure distribution produces suitable winds. Simi-
larly, winter-wheat in the south becomes infected during the autumn by
spore-showers from the north. Large-scale movement east and west across
the North American Continent is relatively infrequent. Yellow rust of
wheat {Puccinia ghwiariim) seems to be spread only much more locally
than P. graminis or P. rubigo-vera—perhaps because its uredospores are
more easily killed by exposure.
Asomewhat similar annual flow of airborne cereal-rust spores has
been demonstrated in other parts of the world. For example, India has an
annual flow from the hills to the plains: Mehta (1940, 1952) found that no
local sources of rust infection survived the long hot summers of the Indian
plains, yet rusts on wheat and barley caused heavy annual loss there. The
explanation lies in the over-summering of rusts on cereal crops and self-
sown plants at 2,000 or more metres in the hills, whence inoculum is
carried by winds to start infection foci here and there on the plains in
early winter. Upper-air currents and katabatic winds both play a part in
the dissemination. The early dissemination of rust from inoculum coming
from central Nepal and the Nilgiris and Palni Hills to the Indo-Gangetic
plain, is the cause of annual devestating outbreaks.
Russian work, mainly by L. F. Rusakov and A. A. Shitikova-Russa-
kova (summarized by Chester, 1946), suggested transport of rust uredo-
spores over hundreds of kilometres from the west across the Sea of Azov,
and also from Manchuria up the Amur Valley in Eastern Siberia. On the
other hand, the Irkutsk wheat-growing area west of Lake Baikal seems,
for practical purposes, to be isolated from the rest of the world by deserts,
mountains, and tundra. Puccinia graminis does not occur in the Irkutsk
region, and P. rubigo-vera survives because it can form aecidia on Isopy-
rumfumarioides, a common weed of arable land which serves as an alternate
host. The wheat-growing areas of Australia and the Argentine also seem
to be autonomous to the extent that airborne spores from outside do not
affect either the annual rust epidemic cycles or the population of rust races
present. Chester (1946, p. 164) concludes: Tn Australia and Argentina,
as in the Lake Baikal region of Siberia, we evidently have regions which
are so separated from other wheat areas by natural barriers, mountains,

7/30/2019 Microbiology of at 00 Greg
http://slidepdf.com/reader/full/microbiology-of-at-00-greg 217/286
LONG-DISTANCE DISPERSAL
oceans, deserts, and vast distances, that for all practical purposes they can
be considered as totally isolated from the rest of the world, insofar as the
introduction of wind-borne rust is concerned.'
For the cereal rusts we thus have a picture of free interchange ofuredospores over long distances, sometimes in the form of an annual
immigration or even a return trip each year ; but isolation of several thou-
sand kilometres limits this dispersal process. No other kind of microbe has
been so fully traced in its atmospheric dispersal as have the cereal rusts.
Rust uredospores are relatively large, and we would expect some smaller-
spored organisms to be at least as well equipped for long-distance dis-
persal—e.g. the coloured spores of agarics and myxomycetes.
The width of the Atlantic Ocean, combined with the prevailing windpattern in tropical latitudes, has formed a natural barrier to one of the
maize rusts. From 1879 onwards (Cummins, 1941), Puccinia polysora has
been collected on Zea mays and Tripsacian in the eastern and southern
United States, in Central America, and in the Caribbean Islands; in 1940
Stakman found it on maize in Peru. In 1949 the fungus suddenly appeared
in Africa, causing a widespread and severe disease on maize in Sierre
Leone, spreading rapidly, and reaching most other parts of West Africa
by 1 951; Congo, and East Africa from the Sudan to Tanganyika, were
invaded in 1952; Southern Rhodesia, Portuguese South Africa, Mada-
gascar, Mauritius, and Reunion all in 1953 ; and then the islands ofAgalega
and Rodriguez in 1955. Simultaneously another focus developed in
Malaya in 1950, reaching Siam, the Phillipines, and Christmas Island in
the Indian Ocean in 1956 (Wood & Lipscomb, 1956; Cammack, 1958).
Evidently, until about 1949, the fungus lived quietly on tolerant American
varieties of maize, isolated from vast areas of highly susceptible maize in
Africa by the 5,600 km. of the Atlantic Ocean which, with its trade-winds,
formed an impassable barrier.
Cammack (1959) considered possible modes of immigration of Puc-
cinia polysora into Africa and rejected wind transport in favour of intro-
duction by aircraft on seed-corn or corn-on-the-cob, much of which was
flown to West Africa from America during the last world war and post-
war years. Once the parasite was established in Africa, the natural barriers
there were evidently insufficient to stop its spread by wind over the whole
continent, so that it reached Madagascar in only four years.
Airborne pathogens present serious disease-control problems which
are quite unlike those of such soil-bome diseases as potato wart. Other
examples where a plant pathogen has spread rapidly after introduction by
man into an isolated area include: potato late-blight {Phytophthora
infestans)^ which was introduced into Europe in the 1840's, and to Australia
and South Africa in 1909; hollyhock rust [Puccinia malvacearum), which
spread over western and central Europe between 1 869 and 1 874 (Gaumann,
1950, p. 141); and antirrhinum rust (P. rt;z//rr^/;//), which recently spread
over New Zealand (Close, 1958).
189

7/30/2019 Microbiology of at 00 Greg
http://slidepdf.com/reader/full/microbiology-of-at-00-greg 218/286
THE MICROBIOLOGY OF THE ATMOSPHERE
For the extreme limit of dispersal we have as yet no direct quantitative
microbial evidence, but recent nuclear test explosions throw light on the
problem (Libby, 1956; Stewart & Crooks, 1958). Clouds of radioactive
dust, thrown up from bombs of less than one megaton, rise to 10-12 km.,
but tend to stay in the troposphere without penetrating to the stratosphere.
In the troposphere the dust-cloud, consisting of particles mostly less than
I ft in equivalent diameter, diffuses vertically and horizontally as it travels
eastwards on the prevailing winds oftemperate latitudes. The cloud circles
the Earth every 4 or 5 weeks, but most of the particles are removed
from the atmosphere in a month or two. A region of stable air over the
tropics acts as a barrier to its spread between the northern and southern
hemispheres.A thermonuclear bomb of the megaton range, exploded near the
ground, puts a large proportion of its sub-microscopic dust into the
stratosphere, where it behaves quite differently from the radioactive dust
in the troposphere. The cloud spreads uniformly over all latitudes and is
removed much more slowly, depletion to 50 per cent of the original
quantity being variously estimated as taking from 5 to 10 years. Dust from
successive tests thus accumulates in the stratosphere. As no natural
mechanism has been suggested which would convey micro-organisms into
the stratosphere on a similar scale, the results of thermonuclear tests are of
less immediate interest to aerobiology than are tests of lower power or
so-called 'normal bombs'.
Possibly a hint at the ultimate horizontal dispersal-limit of micro-
organisms in air is to be found in a study of the geographical distribution
of species. In a world survey of the fungus, Schizophyllum commune^ the
numerous incompatibilit}'' factors appeared to be randomly distributed
(Raper et al., 1958), though the same may not be true oiCoprinus. On the
whole, fungi are believed to show a wider natural geographical distribution
than flowering plants. Europe and North America share more species of
H^menomycetes (mushrooms, toadstools, and their allies) than of flowering
plants. The species of fungi in the tropics and the south-temperate regions
differ considerably from those of the north-temperate regions (Bisby,
1943). Many saprophytic species of fungi, especially soil moulds, tend to
be cosmopolitan. How far wind has operated in their transport, and how
far other means, especially man, are responsible for the world-distribution
of these micro-organisms, is unknown; but the limits of the rust fungi give
us some evidence.
Viability
Although, under ideal conditions, dispersal of airborne microbes is a
limitless process, phenomena discussed in this chapter indicate that
practical limits exist. One factor or another may reduce to negligible
proportions the amount of inoculum transmitted between distant places.
190
7/30/2019 Microbiology of at 00 Greg
http://slidepdf.com/reader/full/microbiology-of-at-00-greg 219/286
LONG-DISTANCE DISPERSAL
The source of supply at the place of origin may be too weak or, because
of dilution and deposition, the spore-cloud may arrive at a concentration
below the threshold for detection. Or again, when the spore-cloud arrives,
few of the spores may be viable, or perhaps all may be dead.
The dispersion equations given in Chapter XIII ignored the death-
rate of spores in transit, and treated merely their diffusion as particles
regardless of whether they were living or dead. The justification for this
is that the physical processes controlling dispersal likewise fail to dis-
criminate between living and dead spores. Further, although a plant
pathologist or plant breeder is concerned only with living cells, to an
allergist a spore or pollen grain is equally significant whether alive or dead.
None of the gradients measured so far contains any hint that loss of
viability is affecting the dispersal process: it may very well do so, but the
distances covered in any quantitative study are still too short, and our
methods too coarse, to allow us to detect a decrease in viability along a
gradient. Yet, over longer distances, loss of viability may well dominate
the gradient. Some organisms may lose viability while travelling quite
short distances in air; but this effect has apparently not yet been disen-
tangled from effects of changes in concentration caused by diffusion and
deposition.
Uredospores of some cereal rusts as, for example, Piiccinia graminis
and P. rubigo-vera, can evidently remain viable after travelling many
hundreds of kilometres and reaching the top of the troposphere, though
we suspect that others, such as those of P. glumarum and P. polysora, are
less robust. Aecidiospores of rusts in general are believed to travel shorter
distances in the viable state, and the basidiospores (sporidia) of the white-
pine blister-rust {Cronartium ribicola) may well have their viable range
restricted to a few hundred metres. Intensive study of this phenomenon
in the open air is needed before we can know the quantitative significance
of death for the dispersal gradient.
PHYSIOLOGICAL STUDIES OF VIABILITY
The immense literature on microbial survival and death-rates throws
much light on factors influencing percentage viability in a population,
under almost all imaginable conditions—except during suspension in air.
Of changes in the viability of organisms during air-dispersal we have only
circumstantial evidence, except for bacteria which are small enough to
allow their longevity to be studied while suspended as aerosols in the ro-
tating steel drum devised by Goldberg et al. (1958). Using this method,
Webb (1959, 1959^) concluded that bacterial cells suspended in air die
as a direct result of loss of bonded water from their protein. Loss of via-
bility takes place in two stages : a rapid killing in the first second of time,
followed by a slow death-rate which might be delayed by some bacterio-
static substances whose presence might actually increase survival.
191

7/30/2019 Microbiology of at 00 Greg
http://slidepdf.com/reader/full/microbiology-of-at-00-greg 220/286
THE MICROBIOLOGY OF THE ATMOSPHERE
The death-rate of a microbial pure culture normally proceeds expon-
entially with time, the same fraction of surviving individuals dying in
each successive equal time-interval—a process analogous to radioactive
decay. But natural populations are often heterogeneous, and these mixtures
of individuals or species with different propensities for hfe may deviate
from the exponential die-away curve. Measurements of survival-time are
often expressed as the time taken for most or all of the organisms to die
under a particular set of conditions. Yarwood & Sylvester (1959) rightly
point out that this limit is difficult to measure accurately, and that a more
useful concept is the half-life of a population (as already used for decay of
radioactivity). Apart from being easier to measure accurately than the
end-point, the half-life is more logical than an arbitrarily selected value
such as 90 per cent or 99 per cent death of the population, because it is
the time at which all the individuals in a population which were alive
at the start have an equal chance of being alive or dead. As an example,
Yarwood & Sylvester give the half-life of basidiospores of Cronartium
ribicola as 5 hours. It is not always easy to determine the status of a par-
ticular spore or cell. If it can be grown it is clearly viable, but failure to
grow may merely reflect failure to provide suitable conditions.
Standard texts on microbial physiology deal with the effects of external
conditions on the longevity of micro-organisms. Most of the experimental
work is in the laboratory, with organisms in a liquid or at a solid/gas
interface, and it is evident that the main factors of the aerial environment
which affect survival (not always in the direction expected) are : humidity,
temperature, and the visible or ultra-violet radiation. For instance, in
laboratory tests, Whisler (1940) found the common airborne Sarcina
lutea to be one hundred times more resistant to ultra-violet radiation than
was the intestinal Escherichia coli.
At first sight, conditions in the atmosphere might appear to be very
unfavourable for the survival of isolated microbial cells (or even of resting
spores) which, because of their minute size, have a high surface/volume
ratio giving great exposure to external conditions. Endospores of bacteria
are highly resistant to unfavourable environments; but this is not true
of all plant spores, many of which are more delicate structures than the
parent.
Desiccation is a hazard already mentioned; it is greatest in day-time
and in air-layers near the ground. At higher altitudes, and throughout
the atmosphere at night, conditions are less favourable for evaporation,
and spores may even be found germinating in clouds—a phenomenon
occasionally reported for the uredospores of rust fungi. We are still not
clear how to relate meteorological observations to conditions for viability.
Evaporation in still air is a function of the absolute dr^Tiess of the air,
but in moving air evaporation may be more nearly related to relativehumidity. Possibly it is best to regard an airborne spore as 'still' in relation
to the air in which it is suspended. A complicating factor is that, because of
192

7/30/2019 Microbiology of at 00 Greg
http://slidepdf.com/reader/full/microbiology-of-at-00-greg 221/286
LONG-DISTANCE DISPERSAL
heat radiation, a spore is seldom at the same temperature as the air in
which it is suspended; though, because of its small heat-capacity, the
difference is not likely to be great. Improvements in the technique of
freeze-drying show that damage to organisms is greatly affected by the
temperature and speed at which they are desiccated. Repeated wetting
and drying often lowers viability.
As physiological experiments show, many of the regular components
of the air-spora are resistant to desiccation. Less hardy organisms are
probably better able to survive when they are high above the Earth's
surface. Most micro-organisms will survive in a resting condition longer
at the temperatures found in the upper air than they will at ground-level;
temperatures in the atmosphere are preservative rather than lethal for
most of the air-spora {see Meier, 1936^).
Radiation is a much more serious hazard, and on this there is a rapidly
increasing literature. The most quickly lethal radiations in the atmosphere
are in the ultra-violet region, and these are largely absorbed by the air
before they reach the ground. Ascent to the upper air therefore brings
the risk of greatly increased dosage of ultra-violet radiation—except in
the shelter of clouds. Pigmented spores, and bacteria carried on larger
rafts, may also be effectively screened from radiation. The interactions of
humidity, temperature, and radiation are not well known, and it may be
that low temperature and desiccation partly protect a spore against
radiation damage. In addition, when a spore returns to ground-level, the
recently studied phenomenon of photo-reactivation by visible light of
organisms which have been exposed to ultra-violet, may perhaps reduce
the damaging effects of radiation received at high altitudes. Photo-reacti-
vation is defined by Jagger (1958) as: 'the reversal with near-ultraviolet
or visible light of ultraviolet radiation damage to a biological structure.'
Visible light reverses lethal effects of ultra-violet radiation in many
microbes—including bacteria and actinomycetes, fungi and yeasts, and
also protozoa—but the survivors of high-altitude passage may be expected
to show an increased mutation rate on their return to Earth.
The suitability of the atmosphere for the survival of 'aerial-plankton'
is summed up by Gislen (1948) as follows: 'While the lower cloudy air-
strata—let us say under 3,000 to 4,000 metres—form a suitable medium
for the transport of micro-organisms, the higher layers are very inhospit-
able to them, not so much because of the low temperature, drought and
barometric pressure, as because of destructive radiation.'
N 193

7/30/2019 Microbiology of at 00 Greg
http://slidepdf.com/reader/full/microbiology-of-at-00-greg 222/286
XV
AEROBIOLOGY
The literature of aerobiology is scattered, but extensive reference lists
are given in the following works: Cunningham (1873), Heald (1913),
Gardner (191 8), Sernander (1927), Stepanov (1935), Rempe (1937),
Pettersson (1940), Craigie (1941), Moulton (1942), duBuy et al. (1945),
Gregory (1945), Stakman & Christensen (1946), Wolfenbarger (1946,
1959), Jacobs (1951), Maunsell (1954), Wells (1955), Werff (1958), and
Hirst (1959).
It now remains to review the conclusions of each of the preceding
chapters in the light of the whole, to consider their implications, and to
attempt asynthesis.
The Phenomena
Airborne microbes, whether carried singly, in groups, or on 'rafts',
are heavier than air. In still air they fall under the influence of gravity,
with constant terminal velocities ranging from 0-05 to 150 cm. per sec,
according to their size and density. This falling would lead to their sedi-
mentation out of the air if other forces did not oppose gravity. Two atmos-
pheric processes tend to prevent sedimentation through the quiet bound-
ary layer : turbulent diffusion in wind carries the spore-cloud horizontally,
at the same time diffusing it both horizontally and vertically;
and thermal convection can carry a spore-cloud to great heights in
the troposphere. Modes by which spores cross the boundary layer
of air near the Earth's surface and reach the turbulent wind layer, are
therefore of prime importance in the dispersal of microbes. Energy for
'take-off' may be supplied by the organism itself or may come from external
sources supported by a wide variety of mechanisms, such as wind or rain-
splash, and factors controlling the take-off mechanism also control the
occurrence of spores in the air. The more an organism is specialized
towards one dispersal route, the more unfit it becomes for dispersal by
another route. For many purposes, knowledge of the 'take-off' mechanism
is important.
Rain-splash dispersal results in a local scatter because the larger splash
droplets, which are less easily carried by the wind, pick up more spores
than do smaller droplets.
Frictional turbulence will diffuse the spore-cloud to the top of the
194

7/30/2019 Microbiology of at 00 Greg
http://slidepdf.com/reader/full/microbiology-of-at-00-greg 223/286
AEROBIOLOGY
dust horizon—convection will take it higher. The concentration of spore-
clouds approximates to the expected logarithmic decrease with height,
but equilibrium is never reached in the atmosphere. Often there is a zone
of increased concentration at an altitude of two or three thousand metres.
Dilution of the spore-cloud as it travels horizontally downwind is the
result of eddy diffusion. Of the various meteorologists and physicists who
have formulated eddy diffusion, O. G. Sutton has provided the most use-
ful method. Experimental values obtained in microbiological work for the
parameters in Sutton's diffusion equations are useful in predicting spore
concentrations at various distances from the source. We await still better
methods; but they may be long in coming, for the problem appears to be
particularly intractable.
Concentration of the spore-cloud decreases not only by diffusion but
also because particles are lost by various deposition processes—of which
impaction, turbulent deposition, and sedimentation under the influence
of gravity, are the most important. Wind speed, the area and orientation
of the surface, and the size of the particle, all have great effects on im-
paction efficiency, both in the wind-tunnel and out-of-doors.
Deposition from the atmosphere under natural conditions outdoors
has been studied experimentally. Under uniform conditions, particle size
has an important effect on the amount deposited from a spore-cloud of
given concentration at ground-level. When liberation is near ground-level,
loss by deposition is great. We cannot yet choose between two theories
of deposition to the ground, one of which depends on the wind-speed and
the other on the distance traversed by the cloud. Near the source, unex-
plained high deposition values have been observed. Elevating the point
of liberation reduces the amount of deposition near the source. Topo-
graphical features which affect wind-speed also affect the number ofspores
deposited, and may play a part in development of a plant disease epidemic
—complicated by the fact that they may simultaneously modify the
ecoclimate in a direction favouring or inhibiting infection.
Estimation of the microbial content of the air is particularly difficult
because, although microscopic, the particles are often large enough to
demand attention to the aerod}Tiamic design of the sampling equipment.
Choice of the correct sampling equipment must be determined by the
range of organisms to be sampled. Throughout this book emphasis has
been placed on methods, because methods commonly determine results.
Single bacterial cells in aerosols are small enough to be handled in the
manner of a gas, without regard to their inertia; but larger organisms
(and bacteria on 'rafts') impact on surfaces, stick on corners, slip out of
streamlines, and settle under the influence of gravity. These aerodynamic
effects must be allowed for in the design of apparatus for reasonably
accurate sampling.
The basic study of the air-spora must be by visual methods under the
microscope. Crude as visual identification is, it is based on the only common
195

7/30/2019 Microbiology of at 00 Greg
http://slidepdf.com/reader/full/microbiology-of-at-00-greg 224/286
THE MICROBIOLOGY OF THE ATMOSPHERE
property shared by all airborne microbes—visibility—and no other method
can reveal the whole range of the air-spora and disclose what numbers
and kinds are in the air awaiting identification. More precise methods can
then be applied to the study of smaller groups.
The air-spora is very imperfectly explored, but sampling has already
shown that bacteria, algae, yeasts, spores of fungi, mosses and ferns,
pollens, and protozoa, commonly occur in the air. The air-spora near the
ground is extremely variable, both from time to time and from place to
place. It changes with season, and with weather—the concentration of
constituent types often changing several thousand-fold in the course of an
hour or two. It changes regularly in composition and concentration
throughout the day and night. Visual methods indicate that fungus spores
are normally in the majority over other components of the air-spora
probably outnumbering bacteria. However, we lack methods for the
complete enumeration of the bacteria in outdoor air, and improved tech-
niques may reveal the presence of far more bacteria than we can recognize
at present.
We now know that basidiospores (ballistospores) form an important
part of the air-spora, often carrying electrical charges, and probably out-
numbering even Cladosporiiwi (which is the dominant mould almost
everywhere). The tardy recognition of the abundance of basidiospores is
partly explained by their inefficient collection by standard samphng
methods, and partly by the unfamiliarity of many microbiologists with the
spores of the higher fungi (cf. Plate 6). Damp night air has its character-
istic spora, but at dawn the night-spora disappears suddenly; where it
goes we do not know. Rain removes the dry-air spora and substitutes a
different one.
Vegetation is the main source of the air-spora, but most bacteria come
from blown soil or splashed water. The source of the yeasts, which are
sometimes recorded in large numbers, is still obscure—unless they prove
to be Sporobolomycetes. Air near the ground at times contains from tens
of thousands to hundreds of thousands of micro-organisms per cubic
metre. The air-spora near the ground is commonly dominated by con-
tributions from local and intermediate sources; but local effects are
smoothed out at high altitudes, over the oceans, and in polar regions.
Spore concentration over the land usually decreases with altitude,
though not always regularly. Often a large proportion of the air-spora
must occur at altitudes higher than lo metres. Far out at sea, a few metres
above sea-level, the microbial content of the air is usually small ; but, at an
altitude of a few thousand metres over the ocean, the air often contains a
few bacteria and from tens to hundreds of fungus spores per cubic metre.
Current information suggests that, over the oceans, concentrations are
greater in theupper
air
thannear sea-level. Clearing the lowest zone of
the atmosphere from microbes is most evident over the ocean. For above
land the spore-cloud near the ground is not only fed from above by
196

7/30/2019 Microbiology of at 00 Greg
http://slidepdf.com/reader/full/microbiology-of-at-00-greg 225/286
AEROBIOLOGY
diffusion and, to a minor extent, by gravity, but it may also be fed from
below, from new sources of soil and vegetation. Even over the Arctic in
winter, the air is only relatively sterile; samples of a few cubic metres may
or may not contain viable spores. Wind transport of microbes is a process
that is evidently going on continuously on a w^orld-wide scale.
Many unsolved problems remain. Is there a biotic zone at the height
ofa few^ thousand metres ? Or is the lower air cleared by rain, with microbes
re-concentrating transiently at the base of a cloud ? Is there a true aerial
plankton in the sense of a population permanently living and reproducing
at great heights, as suggested by R. C. McLean (1935, 1943) ? This would
seem improbable—unless a microbial population is permanently balanced
over tropical regions by rising air-currents and descending cloud droplets.
Do air masses retain a characteristic polar or tropical spora, or do they
rapidly receive and give up the spora of the land over w hich they pass ?
Sooner or later, if they have not been already deposited by other
means, airborne microbes are removed from the atmosphere by collection
in rain, snow\ or hail. If the carrying droplet later evaporates below the
cloud base, there could possibly be an actual local increase in concentra-
tion high above ground. Rain, hail, and snow bring down a large microbial
flora and are factors making for non-uniform deposition, in contrast with
the more uniform diffusion which results from turbulence.
Spores deposited on the ground, or on vegetation near to a source,
show a pronounced gradient (following the concentration gradient of the
wind-blown spore-cloud). This can be estimated by making assumptions
based on observed data, and can be used in predicting the danger of
contamination by foreign pollens, plant pathogens, and so on. In practice
the ideal gradient is often modified by topography—sometimes a decreased
wind velocity decreases spore deposition.
In the past it may have been too easily assumed that the dispersion of
an organism around its origin is like a normal frequency distribution. This
may be true when dispersion is due to motile surface animals, actively
flying insects, and possibly even rain-splash. But wind-dispersal is not
'normal' (in a statistical sense) around the point of origin; by contrast,
it is a hollow curve. This throws light on a paradoxical situation: in the
wind-dispersal of microbes liberated near ground-level, the gradient near
the source is very steep, and relatively short isolation-distances give good
protection. Pollens and plant pathogens with large dry spores liberated at
ground-level may have 90 per cent of their spores deposited within about
100 metres—or perhaps more than 90 per cent if allowance is made for
the unexplained large values of p observed within a metre or two of a
ground source. Yet spores can travel immense distances, and spores
found over the ocean clearly represent the tails of the distributions of all
the sources on the up-wind continent. The equation for Q^^. has thecurious property that the farther a spore has travelled, and the longer it
has survived deposition, the farther it is likely to travel.
197

7/30/2019 Microbiology of at 00 Greg
http://slidepdf.com/reader/full/microbiology-of-at-00-greg 226/286
THE MICROBIOLOGY OF THE ATMOSPHERE
Although most spores are deposited near their source, some are
readily transported to great distances. Transport over long distances
plays a regular role in some crop disease epidemics, and presumably in
the movement of many other organisms. Mountain ranges, oceans, and
deserts, may all be effective barriers to dispersal. Although conditions in
the upper air, especially in cloud, may not be unfavourable for survival,
loss of viability rather than failure of the transport mechanism limits the
colonization range of many organisms. Enhanced variability may be
expected among microbes that survive exposure to ultra-violet radiation.
Because of the overwhelming importance of unsuspected near-by
sources, it is often difficult to be sure that an organism observed has come
from a great distance.
Implications of Aerobiology
BIOLOGICAL warfare
It seems that microbiological weapons have not been used on any large
scale by man against man. The example of myxomatosis in rabbits should
convince sceptics of what might happen when all conditions are suitable
for epidemic spread. Thetopic is
shroudedin official secrecy, but the
little information already released suggests that, if deliberate dissemination
of pathogens (or toxins) were ever attempted, contamination of the air
might be one of the dangers to be anticipated. Rosebury et al. (1947),
from their comprehensive analysis of the principles of bacterial warfare,
consider that the airborne group of pathogens contains the most important
infective agents for war use {see also Rosebury, 1947, 1949)- The published
studies on air-sampling equipment and epidemiology that come from
official defence laboratories are small compensation for this threat by manto his own health and agriculture.
ISOLATION, QUARANTINE, AND GEOGRAPHICAL DISTRIBUTION
The prodigious reproductive powers of microbes always excites
comment and is particularly remarkable in the matter of the number of
spores produced by fungi. The wastage of spores must be enormous.
The w^orld is more or less fully populated with fungi and, within reason-
able geographic and climatic bounds, a fresh substratum will rapidly
select its normal flora from the ample supply of suitable spores brought
to it. In crop pathology we study a system that is temporarily unbalanced
by human activities—large, reasonably pure stands of susceptible, 'arti-
ficial' crop-plants which are renewed at regular intervals, are especially
subject to attacks by parasites. Dispersal gradients become obvious under
these conditions, and our isolation and quarantine methods can play a
major role in limiting the development of a fungus flora on a crop.
Willis (1940) claims that 'nothing in the distribution of plants wouldlead anyone to suppose that the "mechanisms for dispersal" have pro-
duced for the plants that possess them any wider dispersal than usual'.
198

7/30/2019 Microbiology of at 00 Greg
http://slidepdf.com/reader/full/microbiology-of-at-00-greg 227/286
AEROBIOLOGY
In the unbalanced condition necessary to agriculture, this claim obviously
fails; it is comparatively easy to limit the dispersal of Sclerotium cepi-
vorum and Synchytrium endobioticum w^hich have poor dispersal mechan-
isms, difficult with Phytophthora infestans, and impossible with Pitccinia
triticina whose dispersal mechanism is excellent. Willis's claim refers to
floras which man has not greatly disturbed, and, it seems, mainly to
higher plants.
The rules of M. W. Beijerinck and L. G. M. Baas Becking, as given by
Overeem (1937), state that 'as far as microbes are concerned; ""Everythhig
is everywhere^'' and, from this "everything", ''''the milieu selects^' '. This is
an exaggeration, a microbiological half-truth that is useful as a corrective
to narrow parochialism ; but, if it were universally true, aerobiology' would
not be interesting. For example the rubber-tree is attacked by two serious
pathogens, Oidium heveae and DothideUa ulei, which fortunately are at
present limited in their distribution, the former to Asia and the latter to
the Americas.
Many saprophytic microbes have a world-wide distribution, and the
soil bacteria and moulds tend to be similar on all continents. Floras of
different areas are remarkably uniform in their coprophilous fungi, and
in their green and blue-green algae—a testimony to the effectiveness of
various dispersal processes where similar environments, existing over
long periods, have given time for equilibrium to be established. With
local disturbances from time to time, sites become available in the midst
of a population of organisms in apparent equilibrium. Man is the most
active disturber of this equilibrium, and human activity therefore fre-
quently operates in the border-line region of a microbial concentration
gradient. In this region we can attempt to interfere ^^ith the dispersal
process.
Normally in a field-population, multiplication and elimination are
going on simultaneously. Altering the balance between these two pro-
cesses may sometimes lead to the disappearance of an organism or a dis-
ease. Isolation is one of the methods of doing this. Isolation of allergic
patients from allergens out-of-doors may need greater distances, because
the threshold may be so low that one pollen grain is enough to provoke an
attack. Isolation and quarantine in medicine scarcely falls within the pro-
vince of this book; intra-mural aerobiology is mainly the concern of
hygiene and public-health workers. But the use of distance to control
cross-pollination and plant diseases out-of-doors is obviously relevant.
Where the geographical distribution of a pathogen is more restricted
than that of its host crop, the existence of natural barriers, for practical
purposes uncrossable by airborne plant pathogens, makes control of some
crop diseases by official action a feasible procedure.
Where natural wind-transport fails, other methods may dominatedispersal. With freshwater and soil micro-organisms, transport by birds
may be important. But of all animals, man is the most dangerous, because
199

7/30/2019 Microbiology of at 00 Greg
http://slidepdf.com/reader/full/microbiology-of-at-00-greg 228/286
THE MICROBIOLOGY OF THE ATMOSPHERE
his Opportunities for carrying exotic microbes are greatest. The major
portion of the load carried across international boundaries by the world's
highly organized transport system consists of unprocessed plant material.
There are two dangers to be guarded against in this connection. An
important crop disease may be excluded from a country where the patho-
gen does not occur by: (i) prohibiting imports of possible host plants;
(2) inspection in the country of origin or on arrival; and (3) disinfection
(supplemented by local eradication measures should the pathogen gain a
temporary hold). The more insidious danger, however, is in an organism
which has settled do^\n in its original home as an insignificant parasite
on a host with which it is in balanced relationship, suddenly being trans-
ported to a new country and finding a highly susceptible host-crop where
it can cause devastating losses—e.g. Puccinia polysora on African maize
(cf. p. 189), and Endothia parasitica^ a trivial parasite on oriental chestnuts,
but devastating when introduced into the United States of America from
Asia (McCubbin, 1944^, 1954).
MEDICAL MYCOLOGY AND ALLERGY
The winds, which had been suspected from antiquity of bearing
epidemic diseases, have been gradually exonerated so far as the major
human and animal epidemics are concerned. Malaria and yellow fever
come through the air, but only by the activity of their insect vectors. The
old scourges of cities are now known to be spread by vectors, water, milk,
or contact, and are no longer attributed to the winds. Air is not entirely
blameless, however. Droplets expelled from the mouth and nose spread
disease in confined places; wind carries pollens and other allergens; and
some of the less well-known fungus diseases of man, such as coccidioido-mycosis and histoplasmosis, are clearly airborne (Rooks, 1954; Hoggan
et al. 1956; Furcolow & Horr, 1956; and Fiese, 1958). Air emerges as one
of the major routes for transport of micro-organisms, pollens, and many
crop pathogens.
Outdoor airborne allergens appear to originate from vegetation above
ground, but not significantly from the soil (though the allergenic possi-
bilities of various soils themselves would be well worth testing). To a large
extent, therefore, their origin is an agricultural problem, aggravated byour need to cultivate plants in pure stands. Fortunately, the interests
of farmers and allergic patients are to some extent identical. The farmer,
unless he is a seed grower, does not require his grass to scatter protein-
rich pollens uselessly, and the development of non-flowering strains of
grasses (from seed raised in other countries where conditions such as
length of day permit flowering) is beginning to attract the attention of
farmers and seed-merchants alike (Peterson et al.^ 1958); nor does the
farmer want his wheat-straw weakened by Alternaria or Cladosporium.
Improved methods of measuring the spore concentrations of the air
are enabling us to bring many organisms forward for test as potential
200

7/30/2019 Microbiology of at 00 Greg
http://slidepdf.com/reader/full/microbiology-of-at-00-greg 229/286
AEROBIOLOGY
allergens, and may throw light on the causes of some of the seasonal
asthmas—especially those of late summer whose etiology is unknown
(Maunsell, 1958). The purest air appears to be just above the ocean,
though life on board ship has its own allergic hazards.
PALYNOLOGY
Pollen statistics, pollen analysis and, more recently, palynology, are
various names given to a group of studies including investigation on the
ecolog)', vegetation, and pre-history of the Quaternary Period by examina-
tion of the pollens preserved in peat and other deposits. Palynologists
have contributed considerably to the development of aerobiology, andare well aware of the complications of wind-borne pollens from distant
sources (e.g. Buell, 1947). The problem is one of sampling in a given
locality, so as to eliminate uneven distribution from the dominating in-
fluence of one near-by source.
We still need to know how the total deposit at one point is made up of
the few local distributions plus the tails of the distributions of many
distant sources. Furthermore, we must expect that sometimes an active
re-concentration in a cloud may reverse the diffusion process, and maylead to the kind of incident \^hich Pettersson recorded with a heavy
shower of Aloina spores. How far re-concentration in the air needs to be
taken into account, and how far surface obstacles may lead to local deposi-
tion, is a matter for studv.
Spores and pollen preserved in glacial ice in mountainous and polar
regions offer scope for investigation that is still almost unexplored (cf.
Vareschi, 1942).
EVOLUTION
It seems that in each locality or habitat, mutation and recombination
are apt to act, through selection, to evolve special local divergent popula-
tions. But, simultaneously, dispersal mechanisms tend to counteract
this process by encouraging outbreeding and so increasing uniformity.
How the two processes balance is a genetical problem depending on
external factors and on the breeding systems involved. Aerobiolog}' con-tributes quantitative information on the size of the breeding group, which
must be determined partly by the characteristics of the dispersal gradient.
Wind-borne genes are not distributed 'normally' (in a statistical sense)
around their point of origin but in a characteristic hollow curve, which
has the interesting property of involving greater frequencies near the
source and at great distances (at the expense of intermediate distances)
than if the genes followed the normal frequency distribution.
Over the greater part of the Earth's land surface the ecologically
dominant flowering plants and conifers belong to wind-pollinated (anemo-
philous) species. Temperate and tropical grasslands, coniferous forests
201

7/30/2019 Microbiology of at 00 Greg
http://slidepdf.com/reader/full/microbiology-of-at-00-greg 230/286
THE MICROBIOLOGY OF THE ATMOSPHERE
and deciduous forests, and some semi-desert lands, are dominated by
species which reach up to shed pollen into the turbulent boundary layer.
Tropical rain forest, on the other hand, is dominated by insect-pollinated
plants. Probably the number of anemophilous individuals is many times
greater than the number of entomophilous individuals in the world, yet
only about one-tenth of the species of flowering plants are anemophilous.
By contrast, tropical rain forest is noted for its extraordinary number and
diversity ofspecies offlowering plants. Perhaps it is because ofmeteorolog-
ical factors such as rain or the difficulty of access for turbulent wind that
these plants are mostly insect-pollinated, and clearly the two phenomena
are inextricably linked. The wider possibilities of gene dissemination in
wind-pollinated plants has tended towards relative uniformity over wide
areas, while the statistically more 'normal' and localized character of
insect polhnation has favoured specialization and speciation.
The role of air-dispersal is evidently two-fold. Its role in leading to
colonization is clear enough with seed plants and many micro-organ-
isms, and the estabhshment of infection is an example of this process in
pathogens.
A second important role, obvious enough in wind-pollinated flowering
plants but curiously overlooked in microbes, is that of gene transmission.
In the fungi this process is probably a major function of spore dispersal
(Gregory, 1952). So far as well-established fungi are concerned, the im-
mense output of spores probably does little to promote the extension of
the range. When some accidental or cyclic effect offers a suitable environ-
ment within the range, the area involved rapidly becomes colonized and
the average number of mycelia of the species is at least maintained. From
this we need not necessarily deduce, as has beenusual hitherto, that all
the rest of the spores are functionless. The higher fungi possess one charac-
teristic that is unmatched in other organisms—their ability to form
vegetative hyphal fusions which lead to a mixing of cytoplasm and nuclei
from spores of different origin—and it is tempting to speculate, as Tran-
seau (1949) did with Coprinus variegatus, that far more spores germinate
and fuse with an already-established mycelium than ever themselves
succeed in establishing a new mycelium.
The work of H. M. Hansen & Smith (1932), on heterocaryosis, showsthat wild mycelia may contain genetically different nuclei. Some of these
may be due to mutations in mycelia derived from a single nucleus, but ex-
perimental evidence shows that hcterocaryons can also be produced by
artificial mixing of suitable, genetically different myceHa, and it seems
highly probable that this mixing process also occurs in nature. The value
to a species of storing an adequate supply of mutant genes to be drawn
upon in future, and so giving plasticity under varying conditions, has been
stressed by workers on fungus genetics, including Craigie (1942) and
Whitehouse (1949).
Our speculation would suggest that spore dispersal of the higher fungi
202
7/30/2019 Microbiology of at 00 Greg
http://slidepdf.com/reader/full/microbiology-of-at-00-greg 231/286
AEROBIOLOGY
has one other function besides those of increasing the range and colonizing
new substrata within the range—that of dispersing genes and transmitting
novelties, arising from mutation and recombination, between one estab-
lished m5'celium and another. The shift of sexual reproduction from the
sedentary spores of the Phycomycetes, which lack hyphal fusions, to the
dispersal-spore form in the Ascomycetes and Basidiomycetes, may be a
phase in the evolution of this habit. On this hypothesis, a perennial my-
celium would be the locus of activity and multiplication of individual
nuclei—some perhaps descended from the original spore-colonizer, others
descended from outside immigrant sources. The mycelium would remain,
whereas nuclei would come and go. The established mycelium would
resemble a city rather than an individual. Thus, besides their function as
colonizers, spores may perhaps act as a sort of unreliable air-mail service,
transmitting genes between established mycelia.
Dispersal spores of some fungi such as the Gasteromycetes are difficult
to germinate. If we reject, as first choice, the hypothesis that they are
functioniess, we must suppose that there exist special conditions under
which germination occurs naturally. The experiments of Ferguson (1902),
who discovered that mushroom spores would germinate readily when in
contact with living hyphae of the same species, are suggestive in this con-
nection. Other examples are kno^\Tl of spores that are stimulated to germi-
nate by hyphae of the same species, an instance being the spermatia (pycnio-
spores) of Puccinia helianthi (Craigie, 1933). Experiment may show that
this phenomenon of gene interchange plays a bigger part than we have
hitherto considered possible. If this speculation is justified, the produc-
tion and dissemination of novelty must be a major activity of the
fungi.Ascospores and basidiospores are the spore forms most likely to con-
tain genetic novelty, and they are most commonly dispersed by wind to
potentially new environments. The conidia, which are ordinarily dis-
persed by wind, splash, or insects, were well named 'repeating spores' in
the older literature, functioning as they did for exploitation of the same
environment as the parent. However, G. Pontecorvo's discovery of para-
sexual re-combination shows that genetic novelty can also arise from
conidial forms in several ways.
BEYOND THE ATMOSPHERE
Aerobiological technique has much to contribute to research beyond
the Earth's atmosphere.
To counter the idea that living organisms evolved from non-living
matter on this planet, Arrhenius (1908) put forward the hypothesis that
space is permeated by spores. On this hypothesis, spores might be carried
to great heights—for example in the Earth's stratosphere by volcanic
activity—and then driven off into space by electrical repulsion. If this
203

7/30/2019 Microbiology of at 00 Greg
http://slidepdf.com/reader/full/microbiology-of-at-00-greg 232/286
THE MICROBIOLOGY OF THE ATMOSPHERE
were so, a planet might leave a trail of dust in space, and large particles
might move in the sun's gravitational field; but the smallest iDacterial
spores (o-2 [x) would move away from the sun with high velocities under
radiation pressure, even crossing interstellar space and entering planetary
atmospheres. Arrhenius's hypothesis now appears improbable. Conditions
in space seem inimical to the survival of a spore (Oparin, 1957); and our
increasing knowledge, as we probe beyond the confines of our atmosphere,
of the intense radiation to which a nucleo-protein would there be exposed,
raises serious doubts about this speculation. However, this negative
conclusion should not prevent us from making attempts to sample Space
for microbes in the wake of this planet—an experiment which seems
already within reach of an artificial satellite. Knowledge so gained could be
used for sampling in outer space near other planets, to discover whether
there is a microbiology of Space.
The techniques of aerobiology would probably not solve the novel
problems that would arise in sampling in Space, but present knowledge
will need thorough exploitation when we begin to probe the atmospheres
of other planets. Many problems will arise, such as: (i) the necessity of
studying any atmospheric spore-flora of another planet; (2) the moral
obligation to avoid contaminating its atmosphere; and (3) the practical
necessity to avoid contaminating our own atmosphere with completely
unknown organisms which might be carried on a returning space-vehicle.
We must explore any atmospheric spora of other planets less inefficiently
than we have done our own, and for this much developmental work re-
mains to be done.
FUTURE STUDY OF OUR ATMOSPHERE
Our knowledge ofthe terrestrial air-spora is fragmentary in the extreme.
The air has never been systematically explored simultaneously in different
parts of the world by comparable methods. There is a heap of accumulated
data, from which Chapters IX to XII attempt to sort out a few principles.
Here and there are intriguing suggestions of phenomena; but many of the
data are uninterpretable, and we need a fresh study of aerobiology as
part of a vast terrestrial process.
Before starting, aims must be clearly defined, and the needs of three
separate analyses formulated—concentration in air, concentration in
precipitation, and surface deposition. Methods must then be worked out,
based on visual examination of the whole air-spora, and supplemented by
cultural and other methods for the taxonomically diverse components.
Equipment must be tested and calibrated in wind-tunnels and in the open
air, including sampling during flight at high altitudes.
When methods have been developed, international co-operation willbe necessary to organize a chain of routine sampling stations and to co-
ordinate programmes. Routine sampling stations should cover a wide
204

7/30/2019 Microbiology of at 00 Greg
http://slidepdf.com/reader/full/microbiology-of-at-00-greg 233/286
AEROBIOLOGY
variety of climates, of topographic, altitudinal, and ecological environ-
ments, and also the special interests of cities, agriculture, and medicine.
An international aerobiological research institute is needed, with labora-
tories in temperate and arctic regions and, above all, in the tropics andon remote oceanic islands, about which we know least.
After exploring the stratosphere, we shall then be better able to tackle
outer Space. Time is short; before we know where we are, we shall have
the Moon at our doorstep and Mars and Venus on our hands.
205

7/30/2019 Microbiology of at 00 Greg
http://slidepdf.com/reader/full/microbiology-of-at-00-greg 234/286

7/30/2019 Microbiology of at 00 Greg
http://slidepdf.com/reader/full/microbiology-of-at-00-greg 235/286
APPENDIX I
VISUAL IDENTIFICATION
Pollen identification and description can be carried to considerable
detail, and the beginner who is faced with the problem of visual identifica-
tion of the catch on a series of trap slides can get help from books, in-
cluding the two volumes by Erdtman (1952, 1957) and the one by Hyde
& Adams (1958), as well as from the journal, Pollen et Spores^ published
in Paris. For many other groups of organisms little help can be had from
books, and in any laboratory doing visual scanning of slides it is essential
to get together a reference collection of slides in the standard mountant
adopted, and prepared from reliably identified specimens from the field.
(Fungus spores from cultures are often abnormal and unlike the forms
which occur on spore-traps.)Plates 5, 6, and 7 illustrate some t^'pical plant spores etc. at the uniform
magnification of i ,000 diameters to help the beginner, who may have been
confused by many published illustrations which tend to portray plant
spores at various and often widely different magnifications. These
paintings, by Maureen E. Bunce, attempt to depict the object as it appears
under the microscope—with a minimum of interpretation. As far as
possible they are from collected specimens and are mounted unstained in
glycerine jelly. Protozoa have been omitted.
Key to Source
c. from culture //. from hay
s. from field specimen /. from Hirst-trap slide
207

7/30/2019 Microbiology of at 00 Greg
http://slidepdf.com/reader/full/microbiology-of-at-00-greg 236/286
APPENDIX I
Plate 5
Spores of Phycomycetes, Ascomycctes, and I''ungi Imperfecti.
9.
10,
II.
12.
13-
H-
15-
16.
17-
18.
19.
20.
21.
22.
23-
24.
25-
26.
27.
Entomophthora mtiscae, conidium, 5.
Peronospora parasitica^ sporangium, s.
Mucor spinosus, sporangiospores, c.
Absidia corymbifera, sporangiospores,
c.
Absidia ramosa, sporangiospores, c.
Unknown ascospore, /.
Tubercularia vulgaris (= conidium of
Ncctria ciniiabariiia), s.
Nectria cinnabarina, ascospore, .v.
Unknown ascospore, t.
Unknown ascospore, t.
Claviceps purpurea, ascospore, s.
Ophiobolus graminis, ascospore, s.
Helvetia crispa, ascospore, s.
Humaria gratiulata, ascospore, 5.
Pyronema cotijlueiis, ascospore, 5.
Bulgaria inquinaus, ascospore, s.
Xylaria polymorpha,ascospore, s.
Hypoxylon coccineum, ascospore, s.
Hypoxylon multiforme, ascospore, s.
Cliaetomium imiicum, ascospore, c.
Chaetomium globosum, ascospore, c.
Venturia inaequalis: (a) conidium;
{b) ascospore, s.
Rosellinia aquila, ascospore, s.
Sordaria fimicola, ascospore, c.
Daldinia coucentrica, ascospore, s.
Pleospora herbarum, ascospore, s.
Melanospora zamiae, ascospore, s.
28. 'Hyaline rods', t.
29. Polythrincium trifolii, conidia: (a) /;
(b) s.
30. Botrytis sp., conidium, c.
31. Trichothecium roseum, conidium, c.
32. Aspergillus fumigatus, conidia, c.
33. Aspergillus glaucus (series), conidia, c.
34. Aspergillus niger, conidia, c.
35. Aspergillus nidulans: (a) ascospore, c.;
{b) 'Hiille' cell, c.
36. Petiicillium chrysogenum, conidia, c.
37. Penicillium digitatum, conidia, c.
38. Penicillium cychpium, conidia, c.
39. Erysiphe (graminis?), conidium, /.
40. Helicomyces sp., conidium, /.
41. Diatrype stigma, conidia, s.
42. Epicoccum sp., conidium, t.
43. Papularia arundinis, conidia: {a) face
view,c.\
(b)
edgeview, c.
44. Monotospora lanuginosa, conidium, //.
45. Torula herbarum, conidium, /.
46. Bispora monilioides, conidium, s.
47. Stemphylium sp., conidium, c.
48. Alternaria sp., conidium, t.
49. Sporidesmium bakeri (Pithomyces
chartarum), conidium, c.
50. Helminthosporium sp., conidium, /.
51. Cladosporium sp., conidia, t.
52. Streptomyces sp., spores, //.
53. Tetraploa aristata, conidium, s.
208

7/30/2019 Microbiology of at 00 Greg
http://slidepdf.com/reader/full/microbiology-of-at-00-greg 237/286
x^^

7/30/2019 Microbiology of at 00 Greg
http://slidepdf.com/reader/full/microbiology-of-at-00-greg 238/286
THE MICROBIOLOGY OF THE ATMOSPHERE
Plate 6
Spores of Basidiomycetes, Myxomycetes, Pteridophytes, Bryophytes, etc.
10.
II.
12.
13-
14-
15-
i6.
17-
19.
20.
21.
22.
23-
24.
25-
26.
27-
28.
Patins torulosHS, basidiospore, s. 29
Collybia maculata, basidiospore, s.
Triclwlomopsis {Tricholoma) rutilatis, 30,
basidiospore, s. 31,
Russnla nigricans^ basidiospore, s. 32,
Riissula vesca, basidiospore, s. 33.
Lactarius bleniiius, basidiospore, s. 34,
Lactarius rufus, basidiospore, s. 35.
Amanita {Amanitopsis) fiilva, basidio-spore, s. 36.
PJioliota {Naucoria) inyosotis^ basidio- 37.
spore, s. 38.
Bolbitiiis vitelliinis, basidiospore, s. 39.
Hygrophoriis niveus, basidiospore, s. 40.
Armillaria mellea^ basidiospore, s. 41.
Amanita rubescens, basidiospore, s.
Inocybe geophylla, basidiospore, s. 42.
Nolanea staiirospora, basidiospore, s. 43.
Cortitiarius ehitior, basidiospore, s. 44.
Lacrymaria {Hypholoma) velntina,
basidiospore, s. 45.
Coprinus atramentarius, basidiospores
{a) profile; (/') face view, s. 46.
Hypholomafascici/lare, basidiospore, 5. 47.
Psatliyrella {Hypholoma) hydiophih., 48.
basidiospore, s.
Entoloma rhodopolium. basidiospore, s. 49.
Fistiiliiia hepatica, basidiospore, s. 50.
Tilletiopsis sp., basidiospores, t. • 5i-
Sporobolomyces sp., basidiospores, c. 52.
Panaeolina (Psilocybe) foenisecii, 53.
basidiospore, s. 54.
Panaeolus sphinctrini/s, basidiospore, s. 55.
Phaeokpiota (Pholiota) spectabilis, 56.
basidiospore, s. 57.
Pholiota sqiiarrosa, basidiospore, s. 58.
Merulius lacrymans, basidiospore, s.
(small form)
Stropharia aeruginosa, basidiospore, s.
Crepidotus mollis, basidiospore, s.
Fomes annosus, basidiospore, s.
Stereiim purpureum, basidiospores, s.
Thelephora terrestris, basidiospore, s.
Ganoderma applanatum, basidiospore,
5.
Boletus chrysenteron, basidiospore, s.
Boletus elegans, basidiospore, s.
Boletus scaber, basidiospore, s.
Ustilago avenae, smut spore, s.
Triphragmium ulmariae, uredospore, s.
Melampsoridium betulinum, uredo-
spore, s.
Tilletia caries, smut spore, s.
Tilletia hold, smut spore, s.
Puccinia graminis: (a) teleutospore, 5;
(b) uredospore, s.
Badhamia utricularis, myxomycete
spore, s.
Fuligo septica, myxomycete spore, s.
Leocarpusfragilis, myxomycete spore, s.
Reticularia lycoperdon, myxomycete
spore, 5.
Urocystis agropyri, smut spore, s.
Dryopteris filix-mas, fern spore, s.
Pteridium aquilinum, fern spore, s.
Phyllitis scolopendrium, fern spore, s.
Selaginella pulcherrima, spore, s.
Funaria hygrometrica, moss spore, s.
Barbula fallax, moss spore, 5.
Lycopodimii, club-moss spore, s.
Gloeocapsa sp., algal group, /.
Cladonia sp., lichen soredium, s.
210

7/30/2019 Microbiology of at 00 Greg
http://slidepdf.com/reader/full/microbiology-of-at-00-greg 239/286
(' 6
53
54
56 57
55^-
58 mPlate 6
Spores of Basidiomycetes, Myxomycetes, Pteridophytes, Bryophytes, etc.

7/30/2019 Microbiology of at 00 Greg
http://slidepdf.com/reader/full/microbiology-of-at-00-greg 240/286
APPENDIX I
Plate 7
Pollen grains and miscellaneous particles.
1. Phleum pratense, grass pollen, s.
2. 'Fly-ash' spheres, t.
3. Taxus buccala, yew pollen, s.
4. 'Cenosphere', /.
5. Insect scale, /.
6. Betula verrucosa, birch pollen, s.
7. Coryhis avellana, hazel pollen, s.
8. Piniis sylvestris, pine pollen, s.
9. Acer pseiidoplatanus, sycamore pollen, s.
10. Qiiercus robur, oak pollen, s.
1 1
.
Fagus sylvatica, beech pollen, s.
12. Castanea saliva, sweet chestnut pollen, s.
13. Ulmus sp., elm pollen, i.
14. iSa/z^f caprea, willow pollen, s.
15. Platanus sp., plane pollen, 5.
16. Tilia sp., lime pollen, s.
17. Urlica dioica, nettle pollen, 5.
18. Chenopodium album, fat-hen pollen, s.
19. Artemisia vulgaris, mugwort pollen, 5.
20. Solidago sp., golden-rod pollen, 5.
21. Anthriscus sylvestris, cow-parsley pollen, 5.
22. Calluna vulgaris, ling (heather) pollen, s.
23 Rumex acetosa, sorrel pollen, s.
24. Thaliclrum sp., rue pollen, 5.
25. Plantago sp., plantain pollen, s.
212
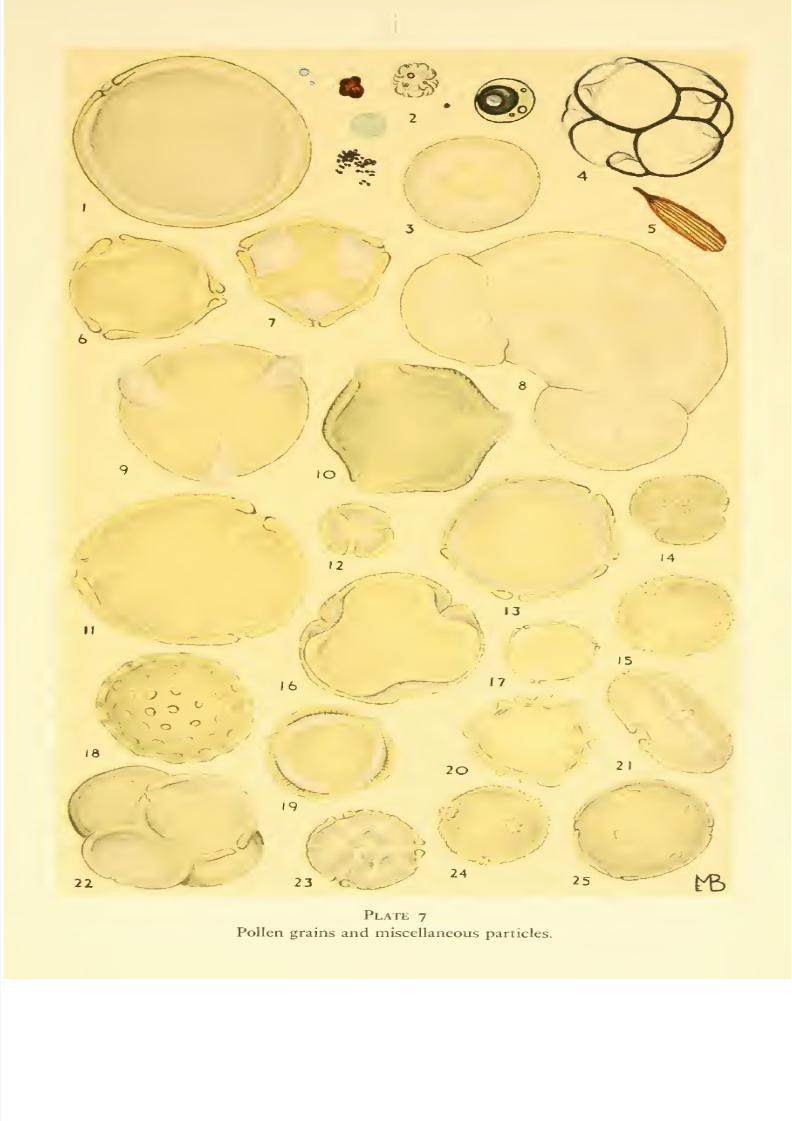
7/30/2019 Microbiology of at 00 Greg
http://slidepdf.com/reader/full/microbiology-of-at-00-greg 241/286
12
^> J14
^'™^
18
22
16 \>
I 1
^=5^;'7
a<r-

7/30/2019 Microbiology of at 00 Greg
http://slidepdf.com/reader/full/microbiology-of-at-00-greg 242/286

7/30/2019 Microbiology of at 00 Greg
http://slidepdf.com/reader/full/microbiology-of-at-00-greg 243/286
APPENDIX II
CONVERSION FACTORS
I dram (dr.)
I ounce (oz.)
I pound (lb.)
I stone (st.)
I quarter (qr.)
I hundredweight (cwt.)
I (long) ton
1 milligram (mg.)
I gram (gm.)
I kilogram (kg.)
I tonne
ME.^SURES OF WEIGHT—Avoirdupois to Metric
I poundI cental
I (short) ton
loo kilograms (kg.)
I tonne
27-343 grams1 6 drams1 6 ounces
14 pounds
2 stones
4 quarters
20 hundredweight
Metric to Avoirdupois
1,000 grams
1,000 kilograms
1-772 grams
28-3 grams
0-454 kilogram
6-350 kilograms
12-701 kilograms50-802 kilograms
I -106 tonnes
0-015 grain
0-564 dram2-205 pounds0-984 ton
American Weights to Metric
100 pounds20 centals
453-592 grams
45-359 kilograms
0-907 tonne
Metric to American Weishts
I quintal
1,000 kilograms
2-205 centals
1-102 (short) tons
I inch (in.)
I foot (ft.)
I yard (yd.)
I mile
I micron {/j)
I millimetre (mm.)
I centimetre (cm.)I decimetre (dm.)
1 metre (m.)
I kilometre (km.)
I square inch (sq. in.)
I square foot (sq. ft.)
I square yard (sq. yd.
I acre
I square mile
I square millimetre (sq. mm.)1 square centimetre (sq. cm.)
I square metre (sq. m.)
I hectare (ha.)
I square kilometre (sq. km.)
MEASURES OF t.EKGTH—British to Metric
25-400 millimetres
12 inches 30-480 centimetres
3 feet 0-914 metre
1,760 yards 1-609 kilometres
Metric to British
1/1,000 mm.

7/30/2019 Microbiology of at 00 Greg
http://slidepdf.com/reader/full/microbiology-of-at-00-greg 244/286
THE MICROBIOLOGY OF THE ATMOSPHERE
MEASURES OF CAPACITY— (6as£(/ on i Imperial gallon = 4-546 litres)
I American gallon—3-785 litres
I litre—1,000 cc.
British to Metric Metric to British
I pint (pt.)—0-368 litre i millimetre (ml. = cc.)—0-061 cu. in
I quart (qt.)—-2 pints—1-13 litres i centilitre (cl.)
— 10 ml.—o-6io cu. in.
I gallon (gal.)—4 quarts—4-546 litres i litre (1.)— 100 cl.—1-760 pints
Temperature
0° Centigrade (= Celsius)= 32° Fahrenheit
The following formulae connect the two major thermometric scales :
Fahrenheit to Centigrade : °C = 5/9 (°F — 32)
Centigrade to Fahrenheit : °F = (9/5 °C) + 32
Additional Conversion Factors for this Book
Volumes
I cubic metre = 1000 litres = i million cu. centimetres
= 35"3 cubic feetI cubic foot = 28-32 litres
Velocity
I metre per second = 2-24 miles per hour= 197 feet per minute
I foot per second = 0-305 metres per second
= 0-68 miles per hour
I mile per hour = 0-447 metres per second
= 1-1465 feet per second
Calculation of area dose
velocity of wind volume through i cm.- wind run
I metre/sec. 8-64 cu. m. 86-4 km./day
0-116 metres/sec. i-o cu. m. lo-o km./day
Altitude above ground
1000 metres = 32S1 feet
1000 feet = 304-8 metres
216

7/30/2019 Microbiology of at 00 Greg
http://slidepdf.com/reader/full/microbiology-of-at-00-greg 245/286
BIBLIOGRAPHY
AiNSWORTH, G. C. (1952). The incidence of air-borne Cladospormm spores in the
London region, y. Gen. Microbiol.., 7, 358-61.
Airy, H. (1874). Microscopic examination of air. Nature., Land., 9, 439-40.
Alvarez, J. C. & Castro, J. F. (1952). Quantitative studies of air-borne fungi of
Havana in each of the twenty-four hours of the day. J. Allergy, 23, 259-64.
Andersen, A. A. (1958). New sampler for the collection, sizing, and enumeration of
viable airborne particles, jf. Bad., 76, 471-84.
Andrewes, F. W. (1902). Examination of the atmosphere of the Central London
Railway, in London County Council, Report to the Parliamentary Committee, No.
615, 21 pp.
Appert, N. (1810). Uart de comerver pendant plusieurs annees toutes les substances
animales et vegetales. Paris, 116 pp.
Arrhenius, S. (1908). Worlds in the Making: the Evolution of the Universe. (Trans.
H. Borns.) Harper, London, 230 pp.
AsAi, G. N. (i960). Intra- and inter-regional movement of uredospores of black stem
rust in the upper Mississippi Valley. Phytopathology,50, 535-41.
Barghoorn, E. S. (i960). Palynological studies of organic sediments and of coated
slides. Scientific Studies on Fletcher^s Ice Island, T-^, 1952-1955, Vol. Ill (Geo-
physics Research Papers No. 63, Geophysics Research Directorate, Air Force
Cambridge Research Center, Air Research and Development Command, United
States Air Force, Bedford, Massachusetts), pp. 86-91.
Bassi, a. (1835 [1958]). Del mal del segno. (Trans. P. J. Yarrow. Phytopath. Class.
No. 10, American Phytopathological Society), 49 pp.
Bateman, a. J. (1947). Contamination of seed crops. I: Insect pollination.J".
Genet.,
48, 257-75.
(1947^). Contamination of seed crops. II: Wind pollination. Heredity, i, 235-46.
(1947^). Contamination of seed crops. Ill: Relation with isolation distance.
Heredity, i, 303-36.
(1950). Is gene dispersal normal? Heredity, 4, 353-63.
Belasco, J. E. (1952). Characteristics of air masses over the British Isles. Geophys.
Mem., Lond., Vol. 11, No. 87, 34 pp.
Belli, C. M. (1901). Chemische, mikroskopische und bakteriologische Untersuchungen
iiber den Hagel. Hyg. Rdsch., 11, 1181-7.
Bergeron, T. (1944). On some meteorological conditions for the dissemination of
spores, pollen, etc., and a supposed w4nd transport of Aloina spores from theregion of Lower Yenisey to southwestern Finland in July 1936. Svensk. Bot.
Tidskr., 38, 269-92.
Berry, C. M. (1941). An electrostatic method for collecting bacteria from air. Publ.
Hlth. Rep., Wash., 56 (Pt. 2), 2044-51.
Best, A. C. (1950). The size distribution ofraindrops. Qttart.J. R. Met. Soc, 76, 16-36.
BiSBY, G. R. (1935). Are living spores to be found over the ocean ? Mycologia, 27, 84-5.
(1943)- Geographical distribution of fungi. Bot. Rev., 9, 466-82.
Blackley, C. H. (1873). Experimental researches on the causes and nature ofCatarrhus
Aestivus {Hay fever or hay asthma). Balliere, Tindall & Cox, London, 202 pp.
(Reprinted: Dawson, London, 1959.)
217

7/30/2019 Microbiology of at 00 Greg
http://slidepdf.com/reader/full/microbiology-of-at-00-greg 246/286
THE MICROBIOLOGY OF THE ATMOSPHERE
Blackman, G. E. (1942). Statistical and ecological studies in the distribution of species
in plant communities, i : Dispersion as a factor in the study of changes of plant
populations. Ann. Bot., Land., 6, 351-70.
Blanchard, D. C. & Woodcock, A. H. (1957). Bubble formation in the sea and its
meteorological significance. Telltis, 9, 145-58.
BoDMER, H. (1922). Uber den Windpollen. Natur 11. Tech. Zurich., 3, 66.
BoEDijN, K. B. (1940). The mycetozoa, fungi and lichens of the Krakatau group.
Bull.jfard. Bot. Biiitenz., Ill, 16, 358-429.
BoNDE, R. & ScHULTZ, E. S. (1943). Potato refuse piles as a factor in the dissemination
of late blight. Bull. Me. Agric. Exp. Sta., No. 416 {Amer. Potato J., 20, 1 12-18).
Bonnier, G., Matruchot, L. & Combs, R. (1911). Recherches sur la dissemination
des germes microscopiques dans I'atmosphere. C. R. Acad. Sci., Paris, 152,
652-9.
Booker, D. V. (1958). Physical measurements of activity in samples from Windscale.
Atomic Energy Research Establishment Rept. HP/R 2607, H.M.S.O., London,
16 pp.
Bosanquet, C. H. & Pearson, J. L. (1936). The spread of smoke and gases from
chimneys. Trans. Faraday Sac, 32, 1249-63.
Bourdillon, R. B. & CoLEBROOK, L. (1946). Air hygiene in dressing-rooms for burns
or major wounds. Lancet, 1946 (i), 561-5, 601-5.
LiDWELL, O. M. & Lovelock, J. E. (1948). Studies in air hygiene. Med. Res.
Council Special Rept. Series, No. 262, H.M.S.O., London, 356 pp.
•
LiDWELL, O. M., Lovelock, J. E. & Raymond, W. F. (1948a). Airborne bacteria
found in factories and other places : suggested limits of bacterial contamination.
In Bourdillon, Lidwell & Lovelock, 1948, 257-63.
LiDWELL, O. M. & Thomas, J. C. (1941). A slit sampler for collecting and
counting air-borne bacteria, y. Hyg., Camb., 41, 197-224.
McFarlan, a. M. & Thomas, J. C. (1948/;). Airborne bacteria in operating
theatres. In Bourdillon, Lidwell & Lovelock, 1948, 241-53.
Brodie H. J. (1951). The splash-cup dispersal mechanism in plants. Canad. J. Bot.,
29, 224-34.
(1957)-Raindrops as plant dispersal agents. Indiana Acad. Sci., 66,
65-73.& Gregory, P. H. (1953). The action of wind in the dispersal of spores from cup-
shaped plant structures. Canad. f. Bot., 31, 402-10.
Brook, P. J. (1959). A volumetric spore trap for sampling pastures. N.Z.J. Agric. Res.,
2, 690-3.
Brown, M., Weintroub, D. & Simpson, M. W. (1947). Timber as a source of sporo-
trichosis infection. In Sporotrichosis infection on mines of the Witwatersrand,
Transvaal Chamber of Mines, Johannesburg, pp. 5-33.
Browne, J. G. (1930). Living micro-organisms in the air of the arid southwest.
Science, 72, 322-3.
Brun, R. J., Lewis, W., Perkins, P.J. & Serafini, J. S. (1955). Impingement ofcloud
droplets on a cylinder and procedure for measuring liquid-water content and droplet
sizes in supercooled clouds by multirotating cylinder method. U.S. Nat. Adv. Comm.
Aeronautics, Report 1215(1), pp. 1-43.
Brunt, D. (1934). Physical and Dynamical Meteorology. Cambridge, England, 411 pp.
BucHBiNDER, L., SoLOWEY, M. & SoLOTOROVSKY, M. (1945). Comparative quantitative
studies of bacteria in air of enclosed places. Air pollution survey of New York
City. Part I. Report ofNew York City Air Pollution Survey Heat. Pip. Air Gondii.
(ASHVE Journal Section), 1945, 389-97.
BuELL, M. F. (1947). Mass dissemination of pine pollen. J. Elisha Mitchell Sci. Soc,
63, 163-7.
BujwiD, O. (1888). Die Bakterien in Hagelkornern. Zbl. Bakt., 3, 1-2.
218

7/30/2019 Microbiology of at 00 Greg
http://slidepdf.com/reader/full/microbiology-of-at-00-greg 247/286
BIBLIOGRAPHY
Duller, A. H. R. (1909-50). Researches on Fungi. Longmans, London, England, Vol.
1, 1909; Vol. II, 1922; Vol. Ill, 1924; Vol. IV, 1931; Vol. V, 1933; Vol. VI, 1934;
University of Toronto Press, Toronto, Vol. VII, 1950.
(1915)- Micheli and the discovery of reproduction in fungi. Trans. Roy. Soc. Can.
(Ser. 3), 9, Sect. IV, 1-25.
& Lout, C. W. (1911). Upon the number of micro-organisms in the air of Winni-
peg. Trans. Roy. Soc. Can. (Ser. 3), 4, Sect. IV, 41-58.
Bulloch, W. (1938). The History ofBacteriology. Clarendon Press, Oxford, 422 pp.
BuRGES, A. (1950). The downward movement of fungal spores in sandy soil. Trans.
Brit. Mycol. Soc, 33, 142-7.
BussE, J. (1926). KiefernpoUenflug und Fortsliche Saatgutanerkennung. Tharandt.
Forstl.Jb.,-]!, 22S-T,i.
Butler, E. J. (1917). The dissemination of parasitic fungi and international legislation.
Mem. Dept. Agric. India, Bot., 9, 1-73.
Caborn, J. M. (1957). Shelterbelts and Microclimates. Forestry Comm. Bull. No. 29,
Edinburgh, H.M.S.O., 135 pp.
Calder, K. L. (1952). Some recent British work on the problem of diffusion in the
lower atmosphere. Chapter 91 in Air Pollution (Edited by L. C. McCabe), Proc.
U.S. Tech. Conf on Air Pollution, pp. 787-93, New York.
Cammack, R. H. (1955). Seasonal changes in three common constituents of the air
spora of southern Nigeria. Nature, Land., 176, 1270-2.
(1958). Factors affecting infection gradients from a point source of Puccinia
polysora in a plot oi Zea mays. Ann. Appl. Biol., 46, 186-97.
(1959)- Studies on Puccinia polysora Underw. II : A consideration of the method of
introduction of P. polysora into Africa. Trans. Brit. Mycol. Soc, 42, 27-32.
Carnelley, T. & Haldane, J. S. (1887). The air of sewers. Proc Roy. Soc, 42, 501-22.
Haldane, J. S. & Anderson, A. M. (1887). The carbonic acid, organic matter and
micro-organisms in air, more especially in dwellings and schools. Phil. Trans., B,
178, 61-111.
Cawood, W. (1936). The movement of dust or smoke particles in a temperature
gradient. Trans. Faraday Soc, 32, 1068-73.
Chamberlain, A. C. (1956). Aspects oftravel and deposition ofaerosol and vapour clouds.
Atomic Energy Research Establishment Report, HP/R 1261, H.M.S.O., London,
35 PP-
Charnock, H. (1956). Turbulence in the atmosphere and in the ocean. Nature, Lond.,
^77, 13-15-
Chatterjee, G. (1931). A note on an apparatus for catching spores from the upper air.
Indian f. Agric. Sci., i, 306-8.
Chauvin, R. & Lavie, p. (1956). Recherches sur la substance antibiotique du pollen.
Ann. Inst. Pasteur, 90, 523-7.
Chen, C. Y. (1955). Filtration of aerosols by fibrous media. Cheni. Rev., 55, 595-623.
Chester, K.S.
(1946). Thetiature
andprevention
ofthe cereal rusts as
exemplifiedin the
leaf rust of wheat. Chronica Botanica, Waltham, Mass., 269 pp.
Christensen, C. M. (1950). Intramural dissemination of spores of Hormodendrum
resinae.J. Allergy, 21, 409-13.
Christensen,J. J. (1942). Long distance dissemination of plant pathogens. In Moulton,
1942, pp. 78-87-
Christoff, a. (1934). Sposobu za khvashchane na raznasyanite chrezii vetura spori.
Rev. Inst. Rech. Agron. Bulg., 6, 41-48.
Clarenburg, L. a. (i960). A study ofair pollution: diffusion and sampling. Proefschrift.
Schotanus & Jens, Utrecht, 89 pp.
Clark, H. E. (1951). An atmospheric pollen survey of four centres in the North Island,
New Zealand, 1949-50. N.Z.J. Sci. Tech. (B), 33, 73-91.
Close, R. (1958). Antirrhinum rust in New Zealand. N.Z.J. Agric, 97, 551-2.
219

7/30/2019 Microbiology of at 00 Greg
http://slidepdf.com/reader/full/microbiology-of-at-00-greg 248/286
THE MICROBIOLOGY OF THE ATMOSPHERE
Cocke, E. C. (1937). Calculating pollen concentration of the air. y. Allergy, 8, 601-6.
(1938). Method for determining pollen concentration of air. y. Allergy, 9, 458-63.
CoLEBROOK, L. & Cawston, W. C. (1948). Microbial content of the air on the roof of a
city hospital, at street level, and in the wards. In Bourdillon, LidweU & Lovelock,
1948, pp. 233-41.
CoLWELL, R. N. (1951). The use of radioactive isotopes in determining spore distri-
bution patterns. Anier. J. Bot., 38, 511-23.
Committee on Apparatus in Aerobiology. (1941). Techniques for appraising air-borne
populations of micro-organisms, pollen and insects. Phytopathology, 31, 201-25.
Cornet, G. (1889). Die Verbreitung der Tuberkelbacillen ausserhalb des Korpers.
Z. Hyg. InfektKr., 5, 191-331.
Cotter, R. U. (1931). Black stem rust spores combed from the air by fliers. Yearh.
Agric. U.S. Dep. Agric, 1931, 1 16-18.
Craigie, J. H. (1933). Union of pycniospores and haploid hyphae in Puccinia helianthi
Schw. Nature, Land., 131, 25.
(1941)- Aerial dissemination of plant pathogens. Proc. VI, Pacif. Sci. Congr. 1939,
4, 753-67-
(1942). Heterothallism in the rust fungi and its significance. Trans. Roy. Sac.
Can., (Ser. 3) Sect. V, 36, 19-40.
(1945)- Epidemiology of stem rust in Western Canada. Sci. Agric, 25, 285-401.
& Popp, W. (1928). Rust epidemiology. Canad. Dept. Agric. Expt. Farms, Rept.
of Dominion Botanist (1927), pp. 47-54.
Cristiani, H. (1893). Analyse bacteriologique de I'air des hauteurs, puise pendant un
voyage en ballon. Ann. Inst. Pasteur, 7, 665-71.
Cummins, G. B. (1941). Identity and distribution of the three rusts of corn. Phyto-
pathology, 31, 856-7.
Cunningham, D. D. (1873). Microscopic examinations of air. Government Printer,
Calcutta, 58 pp.
Darling, C. A. & Siple, P. A. (1941). Bacteria of Antarctica./ Bact., 42, 83-98.
Darwin, C. (1846). An account of the fine dust which often falls on vessels in the
Atlantic Ocean. Qjiart.J. Geol. Soc. Lond., 2, 26-30. (Reprinted in various editions
of Findlay's Memoir Descriptive of the North Atlantic Ocean; and Directory for
the North Atlantic Ocean.)
Davies, C. N. (1947). The sedimentation of small suspended particles. Trans. Instn.
Chem. Engrs. Lond., 25 (Suppl. Symposium on Particle Size Analysis, p. 25).
(1952). The separation of airborne dust and particles. Proc. Inst. Meek. Engrs.
Lond. B, I, 185-99.
Aylward, M. & Leacey, D. (1951). Impingement of dust from air jets. A.M.A.
Arch. Industr. Hyg., 4, 354-97.
& Peetz, C. V. (1956). Impingement of particles on a transverse cylinder. Proc.
Roy. Soc. A, 234, 269-95.
Davies, R. R. (1959). Detachment of conidia by cloud droplets. Nature, Lond., 183,
1695.
Dillon Weston, W. A. R. See Weston, W. A. R. Dillon.
Di Menna, M. E. See Menna, M. E. Di.
DoBBS, C. G. (1942). Spore dispersal in the Mucorales. Nature, Lond., 149, 583.
(1942a). On the primary dispersal and isolation of fungal spores. Nem PhytoL,
41, 63-9.
Dobell, C. (1932). Antony van Leeuwenhoek and his 'Little Animals'. Bale & Danielsson,
London, 435 pp.
Docters van Leeuwen, W. M. See Leeuwen, W. M. Docters van.
D.S.I.R. (193 1). The investigation of atmospheric pollution. i6th Report, 1930, p. 11.
Dubois, R. (19 18). Sur la presence d'organismes vivants dans les grelons. Ann. Soc.
Linn. Lyon (n.s.), 64, 45-51.
220

7/30/2019 Microbiology of at 00 Greg
http://slidepdf.com/reader/full/microbiology-of-at-00-greg 249/286
BIBLIOGRAPHY
DuBuY, H. G. & Crisp, L. R. (1944). A sieve device for sampling air-borne micro-
organisms. Piibl. Hlth. Rep., Wash., 59 (Pt. i) 829-32.
HoLLAENDER, A. & Lackey, M. D. (1945). A comparative sUidy of sampling
devices for air-borne micro-organisms. Piihl. Hlth. Rep., JVash., Siipp. 184, 40 pp.
DucHAiNE, J. (1959). Allergy of the upper respiratory tract. In Iiileniational Textbook
ofAUergy (edited by J.M. Jamar), Blackwell's, Oxford, pp. 154-95.
Durham, O. C. (1942). Air-borne fungus spores as allergens. /// Moulton, 1942, pp.
32-47-
•
(1943)- The volumetric incidence of atmospheric allergens. I: Specific gravity of
pollen grains.J'.
Allergy, 14, 455-61.
(1944)- The volumetric incidence of atmospheric allergens. II: Simultaneous
measurements by volumetric and gravity slide methods. Results with ragweed
pollen and Alternaria spores. _/• Allergy, 15, No. 3, 226-35.
(1946). The volumetric incidence of atmospheric allergens. IV: A proposedstandard method of gravity sampling, counting and volumetric interpolation of
results. J. Allergy, 17, 79-86.
(1947)- The volumetric incidence of atmospheric allergens. V: Spot testing in
the evaluation of species, y. Allergy, 18, 231-8.
Di'RRELL, L. W. & Parker, J. H. (1920). The comparative resistance of varieties of oats
to crown and stem rusts. Res. Bull. la. Agric. Exp. Sta., 62, 1-56.
Dyakowska, J. (1948). The pollen rain on the sea and on the coasts of Greenland.
Bull. Int. Acad. Cracovie (Acad. Pol. Sci.), Ser. B. Sci. Nat. (i) 1947, pp. 25-33.
Dye, M. H. & Vernon, T. R. (1952). Air-borne mould spores. N.Z. j. Sci. Tech.,
B, 34, 118-27.
Ehrenberg, C. G. (1849). Passatstaub und Blutregen. Kg. Akad. Wiss. Berlin, 192 pp.
(1872). Ubersicht der Seit 1847 fortgesetzten Untersuchungen iiber das von der
Atmosphare unsichtbar getragene reiche organische Leben. Abhandl. Kg. Akad.
Wiss. Berlin, Phys. Kl., 1871, pp. 1-150.
(1872^). Nachtrag zur Ubersicht der organischen Atmospharilien. Abhandl. Kg.
Akad. Wiss. Berlin, Phys. Kl., 1871, pp. 233-75.
Ekelof, E. (1907) Studien iiber den Bakteriengehalt der Luft und des Erdbodens der
antarktischen Gegenden, ausgefiihrt wahrend der schwedischen Siidpolar-
Expedition, 1901-1904. Z. Hyg. InfektKr., 56, 344-70.
Ellis, F. P. & Raymond, W. F. (1948). Air hygiene in H.M. ships under wartime
conditions. In Bourdillon, Lidwell & Lovelock, 1948, pp. 264-90.
Erdtman, G. (1937). Pollen grains recovered from the atmosphere over the Atlantic.
Acta Hort. Gothoburg., 12, 185-96.
(1943)- An introduction to pollen analysis. Chronica Botanica, Waltham, Mass.,
239 PP-
(1952). Pollen morphology and Plant Taxonomy. Angiosperms. (An Introduction to
Palynology, I). Almquist, Stockholm, 539 pp.
(1957). Pollen and spore morphology / Plant Taxonomy. Gymnosperms, Pteridophytes,Bryophytes. (An Introduction to Palynology, II). (Illustrations.) Almquist, Stock-
holm, 151 pp.
Faloc, R. (1904). Die Sporenverbreitung bei den Basidiomyceten. Beitr. Biol. Pfl.,
9, 1-82.
(1927). Uber die Grossen, Fallgeschwindigkeiten und Schwebewarte der Pilz-
sporen und ihre Gruppierung mit Bezug auf die zu ihrer Verbreitung notigen
Temperaturstromungs-Gcschwindigkeiten. Ber. Dtsch. Bot. Ges., 45, 262-81.
Feinberg, S. M., Durham, O. C. & Dragstedt, C. A. (1946). Allergy in Practice.
2nd edn. Yearbook Publishers, Chicago, pp. 216-84.
Ferguson, M. C. (1902). A preliminary study of the germination of the spores of
Agaricus campestris and other Basidiomycetous fungi. Bull. U.S. Bur. PI. Ind.
No. 16, 40 pp.
221

7/30/2019 Microbiology of at 00 Greg
http://slidepdf.com/reader/full/microbiology-of-at-00-greg 250/286
THE MICROBIOLOGY OF THE ATMOSPHERE
Fergusson, G. J. (1958). Reduction of atmospheric radiocarbon concentration by
fossil fuel carbon dioxide and the mean life of carbon dioxide in the atmosphere.
Proc. Roy. Soc, A, 243, 561-74.
FiESE, M. J. (1958). Coccidioidomycosis. Thomas, Springfield, Illinois, 253 pp.
Finney, D. J. (1947). Errors of estimation in inverse sampling. Nature, Loud., 160,
195-6.
First, M. W. & Silverman, L. (1953). Air sampling with membrane filters. Arch.
Indiistr. Hyg., 7, i-ii.
Fischer, B. (1886). Bacteriologische Untersuchungen auf einer Reise nach Westindien.
Z. Hyg. IfifektKr., i, 421-64.
Fischer, E. & Gaumann, E. (1929). Biologic der Pflanzenbeivohnenden parasitischen
Pilze. Fischer, Jena, 428 pp.
Fisher, R. A., Corbet, A. S. & Williams, C. B. (1943). The relation between the
numbers of species and the numbers of individuals in a random sample of ananimal population. J. Anim. Ecol., 12, 42-58.
Flemming (1908). Uber die Arten und die Verbreitung der lebensfahigen Mikro-
organismen in der Atmosphare. Z. Hyg. InfektKr., 58, 345-85.
Flensborg, E. W. & Samsoe-Jensen, T. (1948). Mold spore counts in outside air in
Copenhagen. Acta Allerg. Kb/i., i, 104-13.
Flugge, C. (1897). Ueber Luftinfektion. Z. Hyg. IiifektKr., 25, 179-224.
FoNTANA, F. (1767 [1932]). Observations on the rust of grain. Translation by P. P.
Pirone, Phytopath. Class., No. 2, Ithaca, N.Y., 1932, 40 pp.
Forbes,J.
Graham (1924). The atmosphere of the underground electric railways of
London. _/. Hyg., Caiiib., 22, 123-55.
FouTiN, W. M. (1889). Die Bakteriologische Untersuchungen von Hagel. (Cited from
Zbl. Bakt., 7, 372-4, 1890).
Fracker, S. B. & IBrischle, H. A. (1944). Measuring the local distribution of Ribes.
Ecology, 25, 283-303.
Frampton, v. L., Linn, M. B. & Hansing, E. D. (1942). The spread of virus diseases
of the yellows type under field conditions. Phytopathology, 32, 799-808.
Frankland, a. W. & Hay, M. J. (1951). Dry rot as a cause of allergic complaints.
Acta Allerg. Kbh., 4, 186-200.
FranTvLAND, p. F. (1886). The distribution of micro-organisms in air. Proc. Roy. Soc,
40, 509-26.
(1887). A new method for the quantitative estimation of the micro-organisms
present in the atmosphere. Phil. Trans., B, 178, 113-52.
& Hart, T. G. (1887). Further experiments on the distribution of micro-
organisms in air (by Hesse's method). Proc. Roy. Soc, 42, 267-82.
Frey, C. N. & Keitt, G. W. (1925). Studies of spore dissemination of Ventiiria
itiaeqnalis (Cke.) Wint. in relation to seasonal development of apple scab. J.
Agric. Res., 30, 529-40.
FuRCOLOW, M. L. & HoRR, W. H. (1956). Air and water in the natural history ofHistoplasma capsulatiun. In Proc. Conf. on Histoplasmosis. Publ. Hlth. Mono-
graph, 39. Publ. Hlth. Serv. Publ, Wash., No. 465, 282-8.
Gardner, M. W. (1918). Mode of dissemination of fungous and bacterial diseases of
plants. Rep. Mich. Acad. Sci., 20, 357-422.
Gaumann, E. (1950). Principles ofPlant Infection. Crosby Lockwood, London, 543 pp.
Gazert, H. (1912). Untersuchungen iiber Meeresbakterien und ihren Einfluss auf den
Stoffwechsel in Meere. Deutsche Sudpolar-Expedition, 1901-1903, 7 (3), 235-96.
Geiger, R. (1950). The Climate Near the Ground. Harvard Univ. Press, Cambridge,
Mass., 482 pp.
Gilbert, G. E. (1950). Volumetric and gravity slide tests for air-borne ragweed and
oak pollens at Columbus, Ohio. Ohio J. Sci., 50, 60-70.
GiSLEN, T. (1948). Aerial plankton and its conditions of life. Biol. Rev., 23, 109-26.
222

7/30/2019 Microbiology of at 00 Greg
http://slidepdf.com/reader/full/microbiology-of-at-00-greg 251/286
BIBLIOGRAPHY
Glauert, M. (1946). A method of constructing the paths of raindrops of different
diameters. Aeronautical Research Committee, Repts. & Mem., No. 2025, H.M.S.O.,
London, pp. 1-12.
Glynne, M. D.(1953).
Production of spores by Cercosporella herpotrichoicles. Trans.
Brit. Aiycol. Soc, 36, 46-51.
GoETZ, A. (1953). Application of molecular filter membranes to the analysis of aerosols.
Amer.jf. Piibl. HItli., 43, 150-9.
Goldberg, L. J., Watkins, H. M. S., Boerke, E. E. & Chatigny, M. A. (1958). The
use of a rotating drum for the study of aerosols over extended periods of time.
Amer. jf. Hyg., 68, 85-93.
Gordon, M. A. & Cupp, H. B. (1953). Detection oi Histoplasma capsulatiim and other
fungus spores in the environment by means of the membrane filter. Mycologia,
45, 241-52.
Graham Forbes, J. See Forbes, J. Graham.
Gray, R. Whytlaw-. See Whytlaw-Gray, R.
Green, H. L. & Lane, W. R. (1957). Particulate Clouds: Dusts, Smokes and Mists
Spon, London, 425 pp.
Gregory, P. H. (1945). The dispersion of air-borne spores. Trans. Brit. Mycol. Soc,
28, 26-72.
(1948). The multiple-infection transformation. Ann. Appl. Biol., 35, 412-17.
(1949). The operation of the puff-ball mechanism of Lycoperdon perlatum by
raindrops shown by ultra-high-speed Schlieren cinematography. Trans. Brit.
Mycol. Soc, 32, 11-15.
(1951)- Deposition of air-borne Lycopodiuni spores on cylinders. Ann. Appl. Biol.,
38, 357-76.
(1952). Fungus spores. Trans. Brit. Mycol. Soc, 35, 1-18.
(1954)- The construction and use of a portable volumetric spore trap. Trans.
Brit. Mycol. Soc, 37, 390-404.
(1957). Electrostatic charges on spores of fungi in air. Nature, Lond., 180, 330.
(1958). A correction. Trans. Brit. Mycol. Soc, 41, 202.
Guthrie, E. J. & Bunce, M. E. (1959). Experiments on splash dispersal of
fungus spores. J. Gen. Microbiol., 20, 328-54.
Hamilton, E. D. & Sreeramulu, T. (1955). Occurrence of the alga Gloeocaspa
in the air. Nature, Lond., 176, 1270.
& Hirst, J. M. (1952). Possible role of basidiospores as air-borne allergens.
Nature, Lond., 170, 414.
& Hirst, J. M. (1957). The summer air-spora at Rothamsted in 1952. jf. Gen.
Microbiol., 17, 135-52.
Hirst,J. M. & Last, F. T. (1953). Concentrations of basidiospores of the dry
rot fungus (Merulius lacrymans) in the air ofbuildings. Acta. Allerg. Kbit., 6, 1 68-74.
& Read, D. R. (1949). The spatial distribution of insect-borne plant-virus
diseases. Ann. Appl. Biol., 36, 475-82.
& Sreeramulu, T. (1958). Air spora of an Estuary. Trans. Brit. Mycol. Soc, 41,
145-56.
& Stedman, O. J. (1953). Deposition of air-borne Lycopodium spores on plane
surfaces. Ann. Appl. Biol., 40, 651-74.
& Stedman, O. J. (1958). Spore dispersal in Ophiobolus graminis and other fungi
of cereal foot rots. Trans. Brit. Mycol. Soc, 41, 449-56.
Gunn, R. & KiNZER, G. D. (1949). The terminal velocity of fall for water droplets in
stagnant air. _/. Met., 6, 243-8.
Haas, G.J. (1956). Use
of the
membranefilter in the
brewinglaboratory. Wallerstein
Labs. Commun., 19, 7-20.
Hafsten, U. (1951). A pollen-analytic investigation of two peat deposits from Tristan
da Cunha. Results Norweg. E.xped. T. da Cunha, 1937-1938, No. 22, 1-42.
223

7/30/2019 Microbiology of at 00 Greg
http://slidepdf.com/reader/full/microbiology-of-at-00-greg 252/286
THE MICROBIOLOGY OF THE ATMOSPHERE
Hahn, M. (1909). Die Bestimmung und metcorologische Verwertung der Kcimzahl
in den hohcren Luftschichten. Nach voni Luftballon aus angestellten Beobach-
tungen. ZM. Bakt., Abt. I, 51, 97-114.
Hamilton, E. D. (1957). A comparison of the pollen and fungus spore content of the
air in two localities as a contribution to the study of respiratory allergy. Pli.D.
Thesis, Univ. London.
(1959). Studies on the air-spora. Acta Allerg. Kbit.., 13, 143-75.
Hammond, E. C. (1958). Ammonium alginate wool as a filter for collecting micro-
organisms from large volumes of air.J".
Gen. Microbiol.., 19, 267-70.
Hanna, W. F. (1928). A simple apparatus for isolating single spores. Phytopathology.,
18, 1017-21.
Hansen, E. C. (1882). [Recherches sur les organismes qui, a differentes epoques de
Tannee, se trouvent dans Pair, a Carlsberg et aux Alentours, et qui peuvent se
developper dans le mout de biere.] Medd. Carlsberg Lab.., i, 185-208 and 381-454.
(In Danish, title given for TVench summary in C R. Lab. Carlsberg, i, 197-218.)
Hansen, H. M. & Smith, R. E. (1932). The mechanism of variation in imperfect
fungi: Botrytis cinerea. Phytopathology, 22, 953-64.
Harrington, J. B., Gill, G. C. & Warr, B. R. (1959). High efficiency pollen samplers
for use in clinical allergy. J. Allergy, 30, 357-75.
Harrison, F. C. (1898). Bacterial content of hailstones. Bot. Gaz., 26, 211-14.
Harz, C. O. (1904). Bakteriologische Untersuchungen der freien Atmosphare mittles
Luftballons ncbst Bemerkungen iiber den atmospharischen Staub. Jb. Dtsch.
LtiftschVerb., 1904, 147-70.
Haskell, R. J.& Barss, H. P. (1939). Fred Campbell Meier, 1893-1938. Phytopath-
ology, 29, 293-302.
Hawes, R. C, Small, W. S. & Miller, H. (1942). An apparatus for determining the
pollen content of the air and notes on pollen survey methods. J. Allergy, 13,
474-87.
Heald, F. D. (1913). The dissemination of fungi causing disease. Trans. Amer. Micr.
Sac, 32, 1-29.
& George, D. C. (1918). The wind dissemination of spores of bunt or stinking
smut of wheat. Bull. Wash. St. Agric. E.xp. Sta.. No. 151, 21 pp.
Heise, H. a. & Heise, E. R. (1948). The distribution of ragweed pollen and Alternaria
spores in the upper atmosphere. J. Allergy, 19, 403-7.
Hesse, E. (1914). Bakteriologische Untersuchungen auf einer Fahrt nach Island,
Spitzbergen und Norwegen im Juli 1913. Zbl. Bakt., Abt. I., 72, 454-77.
Hesse, W. (1884). Ueber quantitative Bestimmung der in der Luft enthalten Mikro-
organismen. Mitth. Kaiserl. Gesiindheitsanite, 2, 182-207.
(1888). Bemerkungen zur quantitative Bestimmung der Mikroorganismen in der
Luft. Z. Hyg. InfektKr., 4, 19-21.
Hesselman, H. (1919). [Uber die Verbreitungsfiihigkeit des Waldbaumpollens. In
Swedish, German summary.] Medd. Skogsforsoksanst. Stockh., 16, 27-60.
Hirst, J. M. (1952). An automatic volumetric spore trap. Ann. Appl. Biol, 39, 257-65.
—~- (1953)- Changes in atmospheric spore content: diurnal periodicity and the effects
of weather. Trans. Brit. Mycol. Soc, 36, 375-93.
(1959)- Spore liberation and dispersal. In Plant Pathology: Problems and Progress,
1908-1958 (edited by C. S. Holton). University of Wisconsin Press, Madison,
pp. 529-38.— & Stedman, O. J. (1961). The epidemiology of apple scab. I: Frequency of
airborne Ventiiria inacqualis spores in orchards. Ann. Appl. Biol, (in press).
Storey, I. F., Ward, W. C. & Wilcox, H. J. (1955)- The origin of apple scab
epidemics in the Wisbech area in 1953 and 1954. Plant Pathology, 4, 91-6.
HoGGAN, M. D., Ransom, J. P., Pappagianis, D., Danald, G. E. & Bell, A. D. (1956).
Isolation of Coccidioides immitis from the air. Stanf. Med. Bull., 14, 190.
224

7/30/2019 Microbiology of at 00 Greg
http://slidepdf.com/reader/full/microbiology-of-at-00-greg 253/286
BIBLIOGRAPHY
HoLLAENDER, A. & Dalla Valle, J. M. (1939). A simple device for sampling air-borne
bacteria. Piibl. Hlth. Rep. Wash., 54 (Pt.i), 574-7.
Hopkins, J. C. (1959). A spore trap of the 'Vaseline' slide type. Canad. J. Bot., 37,
1277-8.
HoRNE, A. S. (1935). On the numerical distribution of micro-organisms in the atmos-
phere. Proc. Roy. Soc, B, 117, 154-74.
Hi'BERT, K. (1932). Beobachtungen iiber die Verbreitung des Gelbrostes bei kiinst-
lichen Feldinfektionen. Fortschr. Landip., 7, 195-8.
Hyde, H. A. (1952). Grass pollen in Great Britain. Acta. Allerg. Kl>h., 5, 98-112.
(1956). Tree pollen in Great Britain. Acta Allerg. Kbit., 10, 244-45.
(1959)- Weed pollen in Great Britain. Acta Allerg. Kbh., 13, 186-209.
(i959ff). Volumetric counts of pollen grains at Cardiff, 1954-57. jf. Allergy, 30,
219-34.
& Adams, K. F. (1958). An Atlas ofairborne Pollen Grains. Macmillan, London,
112 pp.
& Adams, K. F. (i960). Airborne allergens at Cardiff, 1942-59. Acta Allerg. Kbh.,
Suppl. No. Vn, 159-69.
& Williams, D. A. (1945). Studies in atmospheric pollen. II: Diurnal variation
in the incidence of grass pollen. Neiv Phytol., 44, 83-94.
& Williams, D. A. (1950). Studies in atmospheric pollen. IV: Pollen deposition
in Great Britain in 1943. Part i. The influence of situation and weather. Neip
Phytol., 49, 398-406.
Hyre, R. a. (1950). Spore traps as an aid in forecasting several downy mildew typesof disease. PI. Dis. Reptr. Suppl., 190, 14-18.
Ingold, C. T. (1939). Spore discharge in land plants. Clarendon Press, Oxford, 178 pp.
(1953). Dispersal in Fungi. Clarendon Press, Oxford, 197 pp.
(1956). Cinematographic observations on spore and elater discharge in Lophocolea.
Trans. Brit. Bryol. Soc, 3, 121-3.
(1956^). The spore deposit oi Daldinia. Trans. Brit. Mycol. Soc, 39, 378-80.
(1957)- Spore liberation in higher fungi. Endeavour, 16, 78-83.
(i960). Dispersal by air and water—the take-off. Chapter 5, in Plant Pathology:
an Advanced Treatise, Vol. 3, edited by J. G. Horsfall & A. E. Dimond, Academic
Press, New York, pp. 137-68.
& Hadland, S. a. (1959). The ballistics of Sordaria. Nem PhytoL, 58,
46-57-
Jacobs, W. C. (1951). Aerobiology. In Compendium ofMeteorology, American Meteor-
ological Society, Boston, pp. 11 03- 11.
Jagger, J. (1958). Photoreactivation. Bact. Rev., 22, 99-142.
Janowski, Th. (1888). Ueber den Bakteriengehalt des Schnees. Zbl. Bakt., 4, 547-52.
Jennison, M. W. (1942). Atomizing of mouth and nose secretions into the air as re-
vealed by high-speed photography. In Moulton, 1942, pp. 106-28.
Jensen, I. & B^gh, H. (1942). Om Forhold der har Indflydelse paa Krydsningsfaren
hos vindestovende Kulturplanter. (With English summary.) Tidsskr. Planteavl.,
46, 238-66.
Johnson, A. G. & Dickson, J. G. (1919). Stem rust of grains and the barberry in
Wisconsin. Bull. Wis. Agric Exp. Sta., No. 304, 1-16.
Johnson, C. G. (1957). The distribution of insects in the air and the empirical relation
of density to height, f. Anim. Ecol., 26, 479-94.
& Penman, H. L. (195 1). Relationship of aphid density to altitude. Nature, Lond.,
168, 337.
Johnstone, H. F., Winsche, W. E. & Smith, L. W. (1949). The dispersion and deposi-
tion of aerosols. Chem. Rev., 44, 353-71.
Jones, M. D. & Newell, L. C. (1946). Pollination cycles and pollen dispersal in
relation to grass improvement. Res. Bull. Nebraska Agric. Exp. Sta., No. 148, 1-43.
225

7/30/2019 Microbiology of at 00 Greg
http://slidepdf.com/reader/full/microbiology-of-at-00-greg 254/286
THE MICROBIOLOGY OF THE ATMOSPHERE
Keitt, G. W. & Jones, L. K. (1926). Studies in the epidemiology and control of apple
scab. Wis. Agr. Exp. Sta. Res. Bull.., 73, 1-104.
Kelly, C. D. & Pady, S. M. (1953). Microbiological studies of air over some non-
arctic regions of Canada. Canad.J. Bot.., 31, 90-106.
& Pady, S. M. (1954). Microbiological studies of air masses over Montreal during
1950 and 1951. Canad.J. Bot.., 32, 591-600.
Pady, S. M. & Polunin, N. (1951). Aerobiological sampling methods from air-
craft. Canad.J. Bot.., 29, 206-14.
Kerner von Marilaun, a. See Marilaun, A. Kerner von.
Knoll, F. (1932). Uber die Fernverbreitung des Bliitenstaubes durch den Wind.
Forsch. Fortschr. dtsch. Wiss., 8, 301-2.
Knuth, p. (1906). Handbook of Flower Pollination. Translated byJ.
R. Ainsworth
Davis, Clarendon Press, Oxford, 3 vols.
KORDYUM, V. A. & Bobchenko, E. S. (1959). Air as a habitat for micro-organisms.Microbiology., 28, 215-19.
Kramer, C. L., Pady, S. M. & Rogerson, C. T. (1959). Kansas aeromycology. III.
Cladosporium. Trans. Kans. Acad. Sci., 62, 200-7.
Pady, S. M., Rogerson, C. T. & Omx, L. G. (i959«). Kansas aeromycology.
II: Material, methods and general results. Trans. Kans. Acad. Sci., 62, 184-99.
Kursanov, L. I. (1933). Mikologiya. Sel'khozgiz, Moscow. {Cited by Stepanov, 1935.)
Lambert, E. B. (1929). The relation of weather to the development of stem rust in the
Mississippi Valley. Phytopathology, 19, 1-71.
La Mer, V. K. & Hochberg, S. (1949). The laws of deposition and the effectiveness of
insecticidal aerosols. Chem. Rev.., 44, 341-52.
Landahl, H. D. & Herrmann, R. G. (1949). Sampling of liquid aerosols by wires,
cylinders, and slides, and the efficiency of impaction of the droplets. J. Colloid
Sci., 4, 103-36.
Langmuir, I. (1948). The production of rain by a chain reaction in cumulus clouds at
temperatures above freezing. J. Met., 5, 175-92.
& Blodgett, K. B. (1949). Mathematical investigation of water droplet trajec-
tories. Rep. General Electric Res. Lab., No. R.L. 225 (Dec. 1944-July 1945),
Schenectady, pp. 1-47.
Large, E. C. (1940). The Advance of the Fungi. Cape, London, 488 pp.
Last, F. T. (1955). Seasonal incidence of Sporobolomyces on cereal leaves. Trans. Brit.
Mycol. Soc, 38, 221-39.
Laws, J. O. (1940). Recent studies in raindrops and erosion. Agric. Engng., St. Joseph,
Michigan, 21, 431-3.
Leeuwen, W. M. Docters van (1936). Krakatau, 1883 to 1933. Ann. Jard. Bot.
Buitenz., 46-7, 1-506.
Levin (1899). Les microbes dans les regions arctiques. Ann. Inst. Pasteur, 13, 558-67.
LiBBY, W. F. (1956). Current research findings in radioactive fallout. Proc. Nat.
Acad. Sci., Wash.,42,
945-62.
Lidwell, O. M. (1948). Bacterial content of air in a dwelling house. In Bourdillon,
Lidwell & Lovelock, 1948, pp. 253-7.
Limasset, p. (1939). Recherches sur le Phytophthora infestans (Mont.) de Bary. Ann.
Epiphyt., 5, 21-39.
Lindner, G. (1899). Die Protozoenkeime im Regenwasser. Biol. Zbl., 19, 421-32.
Long, H. W. (1914). Influence of the host on the morphological characters of Puccinia
ellisiana and Pucctnia andropogonis. J. Agric. Res., 2, 303-19.
Long, W. H. & Ahmad, S. (1947). The genus Tylostoma in India. Farlowia, 3, 225-67.
LucKiESH, M., Taylor, A. H. & Holladay, L. L. (1946). Sampling devices for air-
borne bacteria. J. Bact., 52, 55-65.
Taylor, A. H. & Knowles, T. (1949). Sampling devices for determining the
bacterial content of air. Rev. Sci. Instrum., 20, 73-7.
226

7/30/2019 Microbiology of at 00 Greg
http://slidepdf.com/reader/full/microbiology-of-at-00-greg 255/286
BIBLIOGRAPHY
LuDi, W. & Vareschi, V. (1936). Die Verbreitung, das Bliihen und der Pollen-
niederschlag der Heufieberpflanzen im Hochtale von Davos. Ber. Geobot.
Forsch-Inst. Riibel, 1935, 47-112.
LuDLAM, F. H. & Scorer, R. S. (1953). Convection in the atmosphere. Quart. J. Roy.
Met. Soc, 79, 317-41.
LURIE, H. I. & Way, M. (1957). The isolation of dermatophytes from the atmosphere
of caves. Alycologia, 49, 178-80.
McCallan, S. E. a. (1944). Evaluating fungicides by means of greenhouse snapdragon
rust. Contr. Boyce Tlwmpson Inst., 13, 367-84.
& Wellman, R. H. (1943). A greenhouse method of evaluating fungicides by
means of tomato foliage diseases. Contr. Boyce Thompson Inst., 13, 93-134.
McCuBBiN, W. A. (1918). Dispersal distance of urediniospores of Cronartium ribicola
as indicated by their rate of fall in still air. Phytopathology, 8, 35-6.
——•
(1944). Relation of spore dimensions totheir
rate offall.
Phytopathology, 34,230-4.
(i944fl). Airborne spores and plant quarantines. Sci. Mo., New York, 59, 149-52.
(1954). The Plant Qiiarantine Problem. Munksgaard, Copenhagen, 255 pp.
McCuLLY, C. R., Fisher, M., Langer, G., Rosinski, J., Glaess, H. & Werle, D.
(1956). Scavenging action of rain on air-borne particulate matter. Industr. Engng.
Chem., 48, 1 5 12-6.
McLean, A. L. (19 18). Bacteria of ice and snow in Antarctica. Nature, Lond., 102,
35-9-
McLean, R. C. (1935). Bacteriology of the atmosphere. Nature, Lond., 136, 880.
(1943)- Microbiology of the air. Nature, Lond., 152, 258-9.
MacLachl.\n, J. D. (1935). The dispersal of viable basidiospores of the Gymno-
sporangium rusts, jf. Arnold Arbor., 16, 411-22.
MacQuiddy, E. L. (1935). Air studies at higher altitudes. J. Allergy, 6, 123-7.
Machta, L. (1959). Transport in the stratosphere and through the tropopause. In
Advances in Geophysics, Vol. 6: Atmospheric Diffusion and Air Pollution, pp.
273-86. Academic Press, New York, London.
Maddox, R. L. (1870). On an apparatus for collecting atmospheric particles. Monthly
Micros. jf.,T„ 286-90.
(1871). Observations on the use of the aeroconiscope, or air-dust collecting
apparatus. Monthly Micros. J., 5, 45-9.
Malik, M. M. S. & Batts, C. C. V. (i960). The determination of the reaction of
barley varieties to loose smut. Ann. Appl. Biol, 48, 39-50.
Marilaun, a. Kerner von (1895). The Natural History of Plants. Translated by
F. W. Oliver, 2 vols., Blackie, London, 983 pp.
Marshall Ward, H. See Ward, H. Marshall.
Martin, W. J. (1943). A simple technique for isolating spores of various fungi from
exposed slides in aerobiological work. Phytopathology, 33, 75-6.
Mason, B. J. (1957). The Physics of Clouds. Clarendon Press, Oxford, 481 pp.
Mason-Williams, A. & Benson-Evans, K. (1958). A preliminary investigation into
the bacterial and botanical flora of caves in South Wales. Cave Res. Gp. ofGt.
Britain, Pub. No. 8, pp. 1-70.
Maunsell, K. (1954). Respiratory allergy to fungus spores. Progr. Allergy, 4, 457-
520.
—— (i954fl). Concentration of airborne spores in dwellings under normal conditions
and under repair. Int. Arch. Allergy, Basel, 5, 373-6.
(1958). The seasonal variations of allergic bronchial asthma in relation to the
concentration of pollen and fungal spores in the air in 1954, 1955 and 1956. Acta
Allerg. Kbh., 12, 257-76.
May, F. G. (1958). The washout of Lycopodium spores by rain. Qiiart. J. Roy. Met.
Soc, 84, 451-8.
227

7/30/2019 Microbiology of at 00 Greg
http://slidepdf.com/reader/full/microbiology-of-at-00-greg 256/286
THE MICROBIOLOGY OF THE ATMOSPHERE
May, K. R. (1945). The cascade impactor: an instrument for sampling coarse aerosols.
J. Sci. Instrum., 22, 187-95.
(1956). A cascade impactor with moving slides. Arch. Indtistr. Hltli., 13, 481-8.
& Druett, H. a. (1953). The pre-impinger : a selective aerosol sampler. Brit. J.
Indtistr. Med., 10, 142-51.
Mayne, W. W. (1932). Annual report of the Coffee Scientific Officer, 1931-32. Bull.
Mysore Coffee Exp. Stat., 7, 1-32.
Mehta, K. C. (1933). Rusts of wheat and barley in India. A study of their annual
recurrence, life-histories and physiologic forms. Indian J. Agric. Sci., 3, 939-62.
(1940). Further studies on cereal rusts in India. Sci. Monogr. Conn. Agric. Res.
India, No. 14, pp. 1-224.
(1952). Further studies on cereal rusts in India, Part II. Sci. Monogr. Conn. Agric
Res. India, No. 18, pp. 1-368.
Meier, F. C. (1935). Collecting microorganisms from the Arctic atmosphere. Sci. Mo.,New York, 40, 5-20.
(i935«)- Microorganisms in the atmosphere of arctic regions. Phytopathology, 25,
27-
(1936). Collecting microorganisms from winds above the Caribbean Sea. Phyto-
pathology, 26, 102.
(i936rt). Effects of conditions in the stratosphere on spores of fungi. Nat. Geog.
Soc. Stratosphere Series, 2, 152-3.
& Artschwager, E. (1938). Airplane collections of sugar-beet pollen. Science, 88,
507-8.
Stevenson, J. A. & Charles, V. K. (1933). Spores in the upper air. Phytopath-
ology, 23, 23.
Menna, M. E. Di (1955). A quantitative study of air-borne fungus spores in Dunedin,
New Zealand. Trans. Brit. Mycol. Soc, 38, 119-29.
Mer, V. K. La. See La Mer, V.K.
Minervini, R. (1900). Einige baktcriologische Untersuchungen iiber Luft und Wasser
inmitten des Nord-Atlantischen Oceans. Z. Hyg. InfektKr., 35, 165-94.
MiQUEL, P. (1878-99). [Reports in] Annu. Ohs. Montsouris.
(1883). Les organismes vivantes de Vatmosphere. Gauthier-Villars, Paris, 310 pp.
& Benoist, L. (1890). De I'enregistrement des pousieres atmosphcriques brutes
et organisees. Annal. Micrographie, i, SJ2-g.
Mische'STIN, E. (1926). Zur Untersuchung der Mikroflora der hoheren Luftschichten.
Zbl. Bakt., II. Abt., 67, 347-51
MOLISCH, H. (1920). Biologic des atmosphiirischen Staubes (Aeroplankton). In
Popiildre biologische Vortrdge. Fischer, Jena, pp. 209-26.
Monteith, J. L. (i960). Micrometeorology in relation to plant and animal life. Proc.
Linn. Soc, Lond., 171, 71-82.
Moulton, S. (Editor) (1942). Aerobiology. Ainer. Assoc. Adv. Sci., Pub. No. 17,
Washington, 289 pp.Puck, T. T.& Lemon, H. M. (1943). An apparatus for determination of the
bacterial content of air. Science, 97, 51-2.
Nageli, C. von (1877). Die niederen Pilze. Oldcnbourg, Munich, 285 pp.
Naumov, N. a. (1934). Bolezni sadovykh i ovoshchnykh rastenii. Sel'khozgiz, Leningrad/
Moscow, 344 pp.
Newhall, a. G. (1938). The spread of onion mildew by wind-borne conidia of
Peronospora destructor. Phytopathology, 28, 257-69.
Newman, I. V. (1948). Aerobiology on commercial air routes. Nature, Lond., 161, 275-6.
NiLSBY, J. (1949). Allergy to moulds in Sweden. A botanical and clinical study. Acta
Allerg. Khh., 2, 57-90.
O'Connell, D. C, Wiggin, N. J. B. & Pike, G. F. (i960). New technique for the
collection and isolation of airborne microorganisms. Science, 131, 359-60.
228

7/30/2019 Microbiology of at 00 Greg
http://slidepdf.com/reader/full/microbiology-of-at-00-greg 257/286
BIBLIOGRAPHY
Ogawa, J. M. & English, H. (1955). The efficiency of a quantitative spore collector
using the cyclone method. Phytopathology^ 45, 239-40.
OoRT, A. J. P. (1940). De verspreiding van de sporen van tarvvestuifbrand {Ustilago
tritici) door de lucht. Tijdschr. PlZiekt., 46, 1-18.
(1952). Taksterfte bij Bramen: veroorzakt door Septocyta ramealis (Rab.)
Pat. Tijdschr. PlZiekt., 58, 247-50.
Oparin, a. I. (1957). The Origin ofLife on the Earth. [Tr. Ann Synge] Oliver & Boyd,
Edinburgh, 495 pp.
OvEREEM, M. A. van (1936). A Sampling apparatus for aeroplankton. Proc. Acad.
Sci. Anist., 39, 981-90.
•—— (1937). On green organisms occurring in the lower troposphere. Rec. Trav.
Bot. Neerl., 34, 388-442.
Pady, S. M. (1951). Fungi isolated from arctic air in 1947. Canad. f. Bot., 29, 46-56.
(1957). Quantitative studies of fungus spores in the air. Mycologia, 49, 339-53.(1959)- A continuous spore sampler. Phytopathology, 49, 757-60.
& Kapica, L. (1953). Air-borne fungi in the Arctic and other parts of Canada.
Canad. jf. Bot., 31, 309-23.
& Kapica, L. (1955). Fungi in air over the Atlantic Ocean. Mycologia, 47, 34-50.
& Kapica, L. (1956). Fungi in air masses over Montreal during 1950 and 1951.
Canad. J. Bot., 34, 1-15.
& Kelly, C. D. (1949). Use of silicones in aerobiology. Science, no, 187.
& Kelly, C. D. (1953). Studies on microorganisms in arctic air during 1949 and
1950. Canad. J. Bot., 31, 107-22.
& Kelly, C. D. (1954). Aerobiological studies of fungi and bacteria over the
Atlantic Ocean. Canad. J. Bot., 32, 202-12.
• Kelly, C. D. & Polunin, N. (1948). Arctic Aerobiology, II: Preliminary report
on fungi and bacteria isolated from the air in 1947. Nature, Lond., 162, 379-81.
Peturson, B. & Green, G. J. (1950). Arctic Aerobiology, III: The presence of
spores of cereal pathogens on slides exposed from aeroplanes in 1947. Phyto-
pathology, 40, 632-41.
Palm£n, E. (195 i). The role of atmospheric disturbances in the general circulation.
Qitart. f. R. Met. Sac, 77, 337-54.
Panzer, J. D., Tullis, E. C. & Arsdel, E. P. van (1957). A simple 24-hour slide spore
collector. Phytopathology, 47, 512-14.
Pape, H. & Rademacher, B. (1934). Erfahrungen iiber Befall und Schaden durch den
Getreidemehltau (Erysiphe graminis DC.) bei gleichzeitigen Anbau von Winter-
und Sommergerste. Angeiv. Bot., 16, 225-50.
Parker-Rhodes, A. F. (1951). The basidiomycetes of Skokholm Island. V: An ele-
mentary theory of anemophilous dissemination. New Phytoh, 50, 84-97.
Pasquill, F. (1956). Meteorological research at Porton. Nature, Lond., 177,
1148-50.
Pasteur, L. (1861). Memoire sur les corpuscles organises qui existent dans I'atmos-
phere. Examen de la doctrine des generations spontanees. Ann. Sci. Nat. (Zool.),
4^ ser., 16, 5-98.
Perkins, W. A. (1957). The rotorod sampler, 2nd Semiannual Rept. Aerosol Lab.,
Dept. Chemistry & Chem. Engng., Stanford Univ. CML., 186, 66 pp.
Persson, H. (1944). On some species ofAloina with special reference to their dispersal
by the wind. Svensk. Bot. Tidskr., 38, 260-8.
Petersen, L. J. (1959). Relations between inoculum density and infection of wheat by
uredospores of Puccinia graminis var. tritici. Phytopathology, 49, 607-14.
Peterson, M. L., Cooper, J. P. & Vose, P. B. (1958). Non-flowering strains of herbage
grasses. Nature, Land., 181, 591-4.
Petri, R. J. (1888). Eine neue Methode Bacterien und Pilzsporen in der Luft nachzu-
weisen und zu zahlen. Z. Hyg. InfektKr., 3, 1-145.
229

7/30/2019 Microbiology of at 00 Greg
http://slidepdf.com/reader/full/microbiology-of-at-00-greg 258/286
THE MICROBIOLOGY OF THE ATMOSPHERE
Pettersson, B. (1936). Experimentella iakttagelser over den anemochora diaspors-
pridningen och dess berocnde an de atmosfariska forhallandcna. Noriska {ig.
Skauditiaviska) Naturforskaniwtct i Hehingfors den 11-15 Aug. 1936, pp. 467-9.
(1940). Experinientelle Untersuchungen iiber die euanemochore Verbreitung der
Sporenpflanzen. Acta Bot. Fenn.^ 25, 1-103.
Peturson, B. (1931). Epidemiology of cereal rusts. Doin. Canada Dept. Agric. Div.
Bot., Kept. Dom. Botanist, 1930, 44-46.
Phelps, E. B. & Buchbinder, L. (1941). Studies on micro-organisms in simulated
room environments. L A study of the performance of the Wells air centrifuge and
of the settling rates of bacteria through the air.y. Bact., 42, 321-44.
PiNCUS, S. & Stern, A. C. (1937). A study of air pollution in New York City. Amer.
jf. Publ. Hlth., 27, 321-33.
Pirie, J. Harvey (1912). Notes on antarctic bacteriology. In Scottish National Antarctic
Expedition. Report on the Scientific Results of the Voyage of the S. Y. Scotia, Vol.
Ill, Botany, pp. 137-48.
Plank, J. E. van der (1946). A method for estimating the number of random groups
of adjacent diseased plants in a homogenous field. Trans. Roy. Soc. S. Afr., 31,
269-78.
(1948). The relation between the size of fields and the spread of plant diseases into
them. Pt. i: Crowd diseases. Emp. J. Exp. Agric, 16, 134-42.
(1949)- The relation between the size of fields and the spread of plant diseases
into them. Pt. 2: Diseases caused by fungi with air-borne spores; with a note on
horizons of infection. Emp.f. Exp. Agric, 17, 18-22.(i949fl). The relation between the size of fields and the spread of plant diseases
into them. Pt. 3: Examples and discussion. Emp.J. Exp. Agric, 17, 141-7.
(i960). Analysis of epidemics. Chapter 7, in Plant Pathology: an Advanced
Treatise, Vol. 3 (edited by J. G. Horsfall & A. E. Dimond), Academic Press, New
York, pp. 229-89.
PoHL, F. (1937). Die Pollenkorngewichte einiger windbliitiger Pflanzen und ihre
okologische Bedeutung. Beih. Bot. Zbl, Abt. A, 57, 112-72.
Polunin, N. (1951). Seeking airborne botanical particles about the North Poles.
Svensk. Bot. Tidskr.,
45,320-54.
(195 1 a). Arctic Aerobiology. Pollen grains and other spores observed on sticky
shdes exposed in 1947. Nature, Land., 168, 718-21.
(1954)- Progress in arctic aero-palynology. Huitieme Congres International de
Botaniqne, Paris 1954, Rapports et Communications aux Sections 2, 4, 5 et 6, pp.
279-81.
(1955). Arctic aeropalynology. Spora observed on sticky slides exposed in various
regions in 1950. Canad. jf. Bot., 33, 401-15.
(i955«). Botanical studies on ice-island T-t,. Final Report under Contract No.
AF19(604)- 1 144, Yale University and Air Force Cambridge Research Center,
54 PP-
(i960). Appendix 2: Details of aeropalynological collection. Scientific Studies on
Fletcher's Ice Island, T-2, igs2-igss. Vol. Ill (Geophysics Research Papers No.
63, Geophysics Research Directorate, Air Force Cambridge Research Center,
Air Research and Development Command, United States Air Force, Bedford,
Massachusetts), pp. 1 08-11.
& Kelly, C. D. (1952). Arctic aerobiology. Fungi and bacteria, etc., caught in the
air during flights over the geographical North Pole. Nature, Lond., 170, 314-16.
Pady, S. M. & Kelly, C. D. (1947). Arctic aerobiology. Nature, Lond., 160,
876-7.
Pady S. M. & Kelly, C. D. (1948). Aerobiological investigations in the Arctic
and Subarctic. Arctic, 1, 60-61.
230
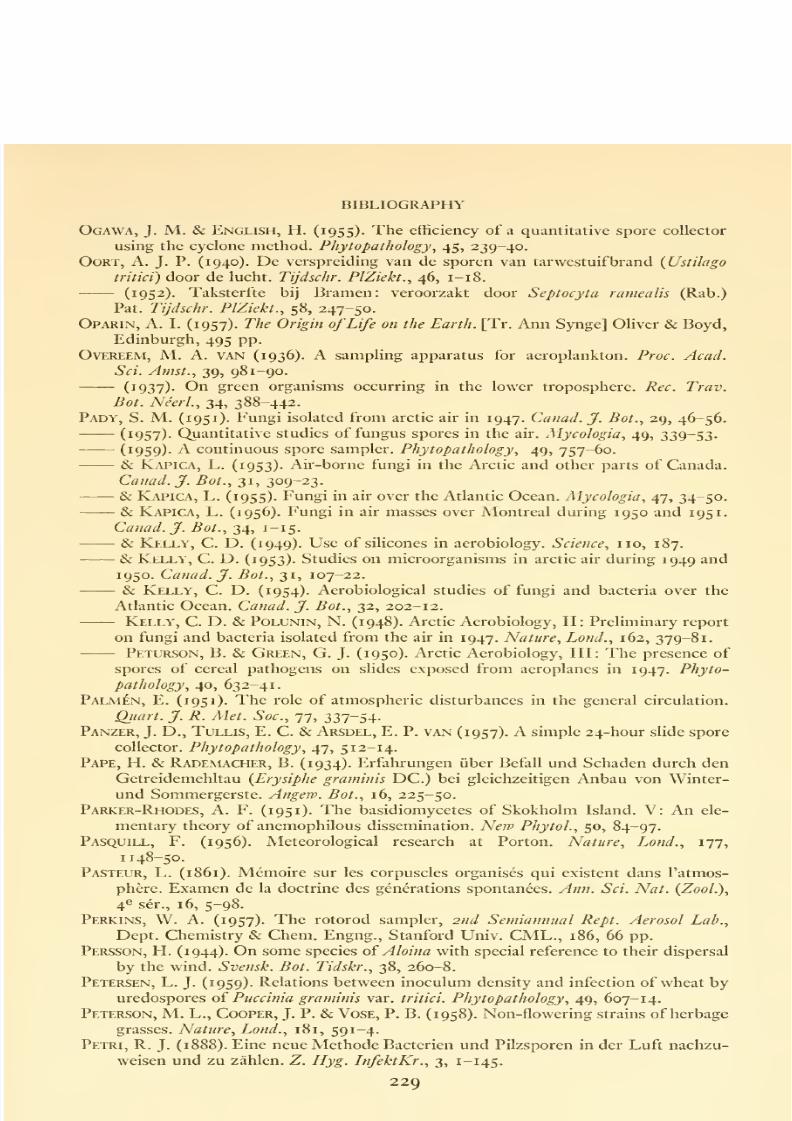
7/30/2019 Microbiology of at 00 Greg
http://slidepdf.com/reader/full/microbiology-of-at-00-greg 259/286
THE MICROBIOLOGY OF THE ATMOSPHERE
PoLUNiN, N., Prince, A. E.&Bakanauskas, S. (i960). Appendix 3 : Details of collecting
and processing living micro-organisms. Scientific Studies on Fletcher''s Ice Island,
T-Z-, ^9S^~^95Si ^ol. Ill (Geophysics Research Papers No. 63, Geophysics
Research Directorate, Air Force Cambridge Research Center, Air Research and
Development Command, United States Air Force, Bedford, Massachusetts),
pp. I 12-14.
Prince, A. E. & Bakanauskas, S. (i960). Airborne viable microorganism spores
collected near sea level. Scientific Studies on Fletcher's Ice Island, T-^, ig52-igs5.
Vol. Ill (Geophysics Research Papers No. 63, Geophysics Research Directorate,
Air Force Cambridge Research Center, Air Research and Development Command,
United States Air Force, Bedford, Massachusetts), pp. 92-4.
Proctor, B. E. (1934). The microbiology of the upper air, I. Proc. Amer. Acad. Arts.
Sci., 69, 315-40.
(1935). The microbiology of the upper air, II. jf. Bact., 30, 363-75.
Proctor, B. E. & Parker, B. W. (1938). The microbiology of the upper air, III.
Jf. Bact., 36, 175-86.
& Parker, B. W. (1942). Microorganisms in the upper air. In Moulton, 1942,
pp. 48-54.
PuscHKAREW, B. M. (1913). Uber die Verbreitung der Siisstrasserprotozoen durch die
Luft. Arch. Protistenk., 28, 323-62.
Rack, K. (1959). Untersuchungen iiber die elektrostatische Ladung der Lophodermium-
Sporen. Phytopath. Z., 35, 439-44.
Ramsbottom, J. (1934). L. G. Windt and heteroecism. Trans. Brit. Mycol. Soc, 19,
128-38.
Ranz, W. E. & Johnstone, H. F. (1952). Some aspects of the physical behaviour of
atmospheric aerosols. Proc. 2nd. Nat. Air Pollution Symposium, Pasadena, pp.
35-41-
& Wong, J. B. (1952). Impaction of dust and smoke particles. Indust. Engng.
Chem., 44, 1 37 1-8 1.
Raper, J.R., Krongelb, G. S. & Baxter, M. G. (1958). The number and distribution
of incompatibility factors in Schizophyllurn. Amer. Nat., 92, 221-32.
Rempe, H. (1937). Untersuchungen iiber die Verbreitung des Bliitenstaubes durch die
Luftstromungen. Planta, 27, 93-147.
Rettger, L. F. (1910). A new and improved method of enumerating air bacteria.
J. Med. Res., 22, 461-8.
Rhodes, A. F. Parker-. See Parker-Rhodes, A. F.
Richards, M. (1954). A census of mould spores in the air over Britain in 1952. Trans.
Brit. Mycol. Soc, 39, 431-41.
(1954a). Atmospheric mold spores in and out of doors, jf. Allergy, 25, 429-39.
(1954^). Seasonal periodicity in atmospheric mould spore concentrations. Acta
Allerg. Kbh., 7, 357-66.
(1955)- Awater-soluble filter for trapping airborne micro-organisms. Nature,
Lond., 176, 559.
Richardson, L. F. (1920). Some measurements of atmospheric turbulence. Phil.
Trans., A, 221, 1-28.
Rider, N. E. (1952). The effect of a hedge on the flow of air. Qjiart. jf. R. Met. Soc,
78, 97-101.
Ridley, H. N. (1930). The dispersal of plants throughout the World. Reeve, Ashford
(Kent), 744 pp.
Rishbeth, .1.(1958). Detection of viable air-borne spores in air. Nature, Lond., 181, 1549.
(1959). Dispersal of Fomes annosus Fr. and Peniophora gigantea (Fr.) Massee.
Trans. Brit. Mycol. Soc, 42, 243-60.
Rittenberg, S. C. (1939). Investigations on the microbiology of marine air. J. Mar.
Res., 2, 208-17.
P 231

7/30/2019 Microbiology of at 00 Greg
http://slidepdf.com/reader/full/microbiology-of-at-00-greg 260/286
THE MICROBIOLOGY OF THE ATMOSPHERE
RoEMER, T. (1932). Uber die Reichweite des Pollens beim Roggen. Z. Zucht., A. 17,
14-35-
Rogers, L. A. & Meier, F. C. (1936). An apparatus for collecting bacteria in the
stratosphere. ^. Bad., 31, 27.
& Meier, F. C. (1936^). The collection of micro-organisms above 36,000 feet.
Nat. Geog. Soc. Stratosphere Series, 2, 146-51.
RoGERSON, C. T. (1958). Kansas aeromycology. I: Comparison of media. Trans. Kans.
Acad. Sci., 61, 155-62.
RoMBAKis, S. (1947). Uber die Verbreitung von Pflanzensamen und Sporen durch
turbulente Luftstromungen. Z. Met., i, 359-63.
Rooks, R. (1954). Air-borne Histoplasma capsulatiim spores. Science, 119, 385-6.
RoSEBURY, T. (1947). Experimental air-honie infection. Williams & Wilkins, Baltimore,
222 pp.
(1949)-Peace or Pestilence: Biological
warfareand how to avoid it.
McGraw-Hill,New York, 218 pp.
Kabat, E. a. & BoLDT, M. H. (1947). Bacterial warfare (A critical analysis
of the available agents, their possible military applications, and the means for
protection against them), f. Immunol., 56, 7-96.
RosTRDP, (p. (1909). Nogle Undersf/gelser over Luftens Inhold af Svampekim. Bat.
Tidsskr., 29, 33-41.
RowELL, J. B. & Olien, C. R. (1957). Controlled inoculation of wheat seedlings with
urediospores of Puccinia graminis var. tritici. Phytopathology, 47, 650-5.
RuEHLE, G. L. A. (1915). Methods of bacterial analysis of air. y. Agric. Res., 4, 343-68.
& KuLP, W. L. (1915). Germ content of stable air and its effect upon the germ
content of milk. Bull. N.Y. St. Agric. Exp. Sta., No. 409, pp. 419-74.
Saito, K. (1904). Untersuchungen iiber die atmospharischen Pilzkeime. I: Mitt.
J. Coll. Sci. Tokyo, 18 (Art. 5), 58 pp. (1903-4).
(1908). Untersuchungen iiber die atmospharischen Pilzkeime. II: Mitt. J. Coll.
Sci. Tokyo, 23, 1-78.
(1922). Untersuchungen iiber die atmospharischen Pilzkeime. Ill: Mitt. Jap.
J. Bot., I, 1-54.
Salimovskaja-Rodina, a. G. (1936). [Uber die Mikroflora des farbigen Schnees—in
Russian, German summary.] Arch. Sci. Biol., Ser. 2-3, 43, 229-38.Salisbury,
J. H. (1866). On the cause of intermittent and remittent fevers, with inves-
tigations which tend to prove that these affections are caused by certain species of
Palmella. Amer. jf. Med. Sci., 51, 51-75.
Savulescu, T. (1941). Mana vitei de vie. Imprimeria Nationala, Bucharest, 214 pp.
Sawyer, K. F. & Walton, W. H. (1950). The 'Conifuge'—a size-separating sampling
device for airborne particles. J. Sci. Instrum., 11, 272-6.
Scheppegrell, W. (1922). Hayfever and asthma. Lea & Febiger, Philadelphia,
274 pp.
(1924). Airplane tests of hay fever pollen density in the upper air. Med. J. Rec,
119, 185-9.
(1925). Hay fever pollens in the upper air. Records established by airplane flights.
Med. f. Rec, 121, 660-3.
Schmidt, W. (191 8). Die Verbreitung von Samen und Bliitenstaub durch die Luft-
bewegung. Ost. Bot. Z., 67, 313-28.
(1919). Die Verbreitung von Friichten durch die Luftbewegung. Naturrvissen-
schaften, 7, 810-12.
(1925). Die Massenaustausch in frier Luft und verwandte Erscheinungen. Probl.
Kosm. Phys., 7, 1-118.
ScHMiTT, C. G., Kingsolver, C. H. & Underwood, J. F. (1959). Epidemiology of
stem rust of wheat. I: Wheat stem rust development from inoculation foci of
different concentration and spatial arrangement. PI. Dis. Reptr., 43, 601-6.
232

7/30/2019 Microbiology of at 00 Greg
http://slidepdf.com/reader/full/microbiology-of-at-00-greg 261/286
BIBLIOGRAPHY
ScHRODTER, H. (1952). Untersuchungen iiber die Wirkung einer Windschutzpflanzung
auf den Sporentlug und Auftreten der Alternaria-Sch\ya.rze an Kohlsamentragern.
AngeiP. Meteorol., i, 154-8.
(1954)- Die Bedeutung von Massenaustausch und Wind fiir die Verbreitung von
Pflanzenkrankheiten. Ein Beitxag zur Epidemiologic. NachrBl. Dtsch. PflSch-
Dienst., N.S. 8, 166-72.
(i960). Dispersal by air and water—the flight and landing. Chapter 6, in Plant
Pathology: an Advanced Treatise^ Vol. 3, edited by J. G. Horsfall & A.. E. Dimond,
Academic Press, New York, pp. 169-227.
Scorer, R. S. (1954). The nature ofconvection as revealed by soaring birds and dragon-
flies. Qiiart. J. R. Met. Soc, 80, 68-77.
Scott, R. F. (1913). Scott's Last Expedition. Smith Elder, London, Vol. I, p. 269.
ScRASE, F. J. (1930). Some characteristics of eddy motion in the atmosphere. Gt.
Brit. Met. Off. Geopbys. Mem.., 52, 3-16.
Sell, W. (1931). Staubausscheidung an einfachen Korpern und in Luftfiltern.
Forschungs. Ver. Dtsch. Ing., 347, 1-22.
Sernander, R. (1927). Zur Morphologic und Biologic der Diasporcn. Nova Acta Soc.
Sci. Upsal., Ser. 4, Extra vol. 1927, pp. 1-104.
Sew.\ll Wright. See Wright, S.
Sheldon, J. M. & Hewson, E. W. (1958). Atmospheric pollution by aeroallergens.
Prog. Rept. Engng. Res. Inst.., Ann Arbor, Michigan., No. 2, pp. 1-122.
Shitikova-Russakova, a. a. See Stepanov, K. M. (1935).
SiANG, W^an-nien. (1949). Are aquatic phycomycetes present in the air? Nature.,
Land., 164, loio-i.
Soper, G. a. (1908). The air and ventilation ofSiibivays. Wiley, New York, 244 pp.
Soule, M. H. (1934). A microorganism carried by the dust storm. Science, 80, 14-15.
Spector, W. S. (1956). Handbook of biological data. Saunders, Philadelphia, 584 pp.
Sreeramulu, T. (1958). Effect of mowing grass on the concentrations of certain con-
stituents of the air spora. Curr. Sci., 27, 61-3.
(1958a). Spore content of air over the Mediterranean Sea. jf. Indian Hot. Soc,
37, 220-8.
(1959)- The diurnal and seasonal periodicity of spores of certain plant pathogens
in the air. Trans. Brit. Mycol. Soc, 42, 177-84.
St.^kman, E. C. & Christensen, C. M. (1946). Aerobiology in relation to plant disease.
Bot. Rev., 12, 206-53.
& Hamilton, L. M. (1939). Stem rust in 1938. PI. Dis. Reptr., Siippl. 117, 69-83.
& H.'VRR.^r, J. G. (1957). Principles ofplant pathology. Ronald, New York, 581 pp.
Hentiy, a. W., Curran, G. C. & Christopher, W. N. (1923). Spores in the upper
air. f. Agric Res., 24, 599-606.
Stepanov, K. M. (1935). [Dissemination of infective diseases of plants by air currents
in Russian, English title.] Ball. PI. Prot. Leningr., Ser. 2, Phytopathology, No. 8,
1-68.
Stewart, N. G., & Crooks, R. N. (1958). Long-range travel of the radio-active cloud
from the accident at Windscale. Nature, Land., 182, 627-8.
Sutcliffe, R. C. (1940). Meteorology for aviators. H.M.S.O., London, 273 pp.
Sutton, O. G. (1932). A theory of eddy diffusion in the atmosphere. Proc Roy. Soc,
A, 135, 143-65-
(1947)- The theoretical distribution of airborne pollution from factory chimneys.
Qtiart. J. R. Met. Soc, 73, 426-36.
(1953). Micrometeorology. McGraw-Hill, London, 333 pp.
Swaebly, M. A. & Christensen, C. M. (1952). Molds in house dust, furniture stuffing,
and in the air within houses. 1. Allen^y, 23, 370-4.
Symons, G. J. (Editor) (1888). The eruption of Krakatoa and sid)sequent phenomena.
Rept. Krakatoa Comm. Roy, Soc. London, 494 pp.
233

7/30/2019 Microbiology of at 00 Greg
http://slidepdf.com/reader/full/microbiology-of-at-00-greg 262/286
THE MICROBIOLOGY OF THE ATMOSPHERE
Taylor, G. I. (191 5). Eddy motion in the atmosphere. Phil. Trans.., A, 215, 1-26.
Tervet, I. W. (1950). A technique for collecting dry spores from infected plants.
Phytopathology., 40, 874.
& Cherry, E. (1950). A simple device for collection of fungus spores. PI. Dis.
Reptr., 34, 238.
Thompson, W. R. (1924). La theorie mathematique de Taction des parasites ento-
mophages et le facteur du hasard. Ann. Fac. Sci. Marseille., 2^ Ser., 2, 69-89.
Transeau, E. N. (1949). Fruiting patterns oiCoprimis variegatm Peck. Amer. J. Bot.,
36, 596-602.
Treub, M. (1888). Notice sur la nouvelle flore de Krakatau. Ann. Jard. Bot. Btiitenz.,
1, 213-23-
Trillat, a. & FouASSiER, M. (1914). Action du refroidissemcnt sur les gouttelettes
microbiennes. C. R. Acad. Sci., Paris, 158, 1 441-4.
Turner, D. M. (1956). Studies on cereal mildew in Britain. Trans. Brit. Mycol. Soc,39. 495-506-
Tyndall, J. (1881). Essays on the floating-matter of the air in relation to putrefaction
and infection. Longmans, London, 338 pp.
Ukkelberg, H. G. (1933). The rate of fall of spores in relation to the epidemiology of
black stem rust. Bull. Torrey Bot. CI., 60, 211-28.
U.S. Weather Bureau. (1955). Meteorology and atomic energy. U.S. Atomic Energy
Commission, Washington, D.C., 169 pp.
VAN der Plank, J. E. See Plank, J. E. van der.
van der Werff, p.J. See Werff, P. J. van der.
van Leeuwen, W. M. Docters. See Leeuwen, W. M. Doctcrs van.
van Overeem, M. a. See Overeem, M. A. van.
Vareschi, V. (1942). Die poUenanalytische Untersuchung der Gletscherbewegung.
Veroff. geobot. Inst. Riihel., 19, 1-144.
VON Nageli, C. See Niigeli, C. von.
Wadley, F. M. & Wolfenbarger, D. O. (1944). Regression of insect density on
distance from center of dispersion as shown by a study of the smaller European
elm bark beetle, y. Agric. Res., 69, 299-308.
Waggoner, P. E. (1952). Distribution of potato late-blight around inoculum sources.
Phytopathology, 42, 323-8.
& Taylor, G S. (1958). Dissemination by atmospheric turbulence: spores of
Peronospora tabacina. Phytopathology, 48, 46-51.
Walker, G. (1935). Bacterial content of the air at high altitudes. Science, 82,
442-3-
Wallace, M. E., Weaver, R. H. & Scherago, M. (1950). A weekly mold survey of
air and dust in Lexington, Kentucky. A?in. Allergy, 8, 202-11 and 228.
Ward, H. Marshall (1882). Researches on the life-history of Hemileia vastatrix, the
fungus of 'coffee-leaf disease', y. Linn. Soc. (Bot.), 19, 299-335.
Watson, H. H.(1936).
The dust-free space surrounding hot bodies. Trans. Faraday
Soc, 32, 1073-81.
(1954). Errors due to anisokinetic sampling of aerosols. Amer. Ind. Hyg. Ass.
Qtiart., 15, 21-5.
Webb, S. J. (1959). Chloramphenicol and the survival of air-borne bacteria. Nature,
Lond., 183, 1072.
(i959«). Factors affecting the viability of air-borne bacteria, i : Bacteria aero-
solized from distilled water. Canad. J. Microbiol., 5, 649-69.
Webster, J- (1952). Spore projection in the hyphomycete Nigrospora sphaerica.
Nem Phytol., 51, 229-35.
Weinhold, a. R. (1955). Rate of fall of urediospores of Puccinia graminis tritici Eriks.
& Hen. as affected by humidity and temperature. Tech. Rept. Office of Naval
Research, ONR Contract No. N9onr. 82400, 104 pp.
234

7/30/2019 Microbiology of at 00 Greg
http://slidepdf.com/reader/full/microbiology-of-at-00-greg 263/286
BIBLIOGRAPHY
Weinzerl, J. & Fos, M. V. (1910). Bacteriological methods for air analysis. Amer.
jf.PuM.Hyg., 20, 633-8.
Wells, W. F. (1933). Apparatus for study of bacterial behavior of air. Amer. jf. Publ.
Hlth., 23, 58-99.
(1955)- Airborne contagion and air hygiene: An ecological study ofdroplet infections.
Harvard Univ. Press, Cambridge, Mass., 423 pp.
& Wells, M. W. (1936). Air-borne infection.J".
Amer. Med. Ass., 107, 1698-1703
and 1805-9.
Werff, p. J. VAN DER (1958). Moiild ftingi and bronchial asthma. I. Kroese, Leiden,
174 PP-
Weston, W. A. R. Dillon (1929). Observations on the bacterial and fungal flora of
the upper air. Trans. Brit. Mycol. Sac, 14, 111-17.
Wheeler, S. M., Foley, G. E. & Jones, T. D. (1941). A bubbler pump method for
quantitative estimations of bacteria in air. Science, 94, 445-6.
Whinfield, B. (1947) Studies in the physiology and morphology o( Penicilliiim nota turn.
i: Production of penicillin by germinating conidia. Ann. Bot., Lond., N.S. 11,
35-9-
Whisler, B. a. (1940). The efficacy of ultra-violet light in killing bacteria suspended
in air. Iowa St. Coll. jf. Sci., 14, 215-31.
Whitehouse, H. L. K. (1949). Heterothallism and sex in the fungi. Biol. Rev., 24,
411-47.
Whytlaw-Gray, R. & Patterson, H. S. (1932). Smoke: A Study of aerial disperse
systems. Arnold, London, 192 pp.
Wilcox, J. D. (1953). Design of a new five-stage cascade impactor. A.M.A. Arch.
Industr. Hyg. Occ. Med., 7, 376-82.
Williams, C. B. (1947). The logarithmic series and its application to biological prob-
lems, f. Ecology, 34, 253-72.
(i960). The range and pattern of insect abundance. Amer. Nat., 94, 137-51.
Williams, A. Mason-. See Mason-Williams, A.
Willis, J. C. (1940). The course of evolution. Cambridge Univ. Press, Cambridge,
England, 207 pp.
Wilson, E. E.&Baker, G. A. (1946). Some aspects of the aerial dissemination of spores
with special reference to conidia of Sclerotinia laxa.J.
Agric. Res.,72, 301-27.& Baker, G. A. (i946fl). Some features of the spread of plant diseases by air-borne
and insect-borne inoculum. Phytopathology, 36, 418-32.
Wilson, G. S. & Miles, A. A. (1955). Topley and Wilson's: Principles of bacteriology
and immunity, 4th edn. Arnold, London, pp. 1312 and 2002.
WiNDT, L. G. (1806). Der Berberitzenstrauch, ein Feind des Wintergetreides. Biickeburg
& Hanover. (Cited from Ramsbottom, 1934.)
WiNSLOW, C. E. A. & Browne, W. W. (1914). The microbic content of indoor and
outdoor air. Mon. Weath. Rev. Wash., 42, 452-3.
WODEHOUSE, R. p. (1945). Hayfever Plants. Chronica Botanica, Waltham, Mass.,
245 PP-
Wolf, F. T. (1943). The microbiology of the upper air. Bull. Torrey Bot. Club, 70, 1-14.
WoLFENBARGER, D. O. (1946). Dispersion of small organisms, distance dispersion
rates of bacteria, spores, seeds, pollen, and insects; incidence rates of diseases and
injuries. Amer. Midi. Nat., 35, 1-152.
(1959)- Dispersion of small organisms. Incidence of viruses and pollen; dispersion
of fungus spores and insects. Lloydia, 22, 1-106.
Wong, J. B., Ranz, W. E. & Johnstone, H. F. (1956). Collection efficiency of aerosol
particles and resistance to flow through fiber mats. J. Appl. Phys., 27, 161-9.
Wood, J. L, & Lipscomb, B. R. (1956). Spread of Piiccinia polysora with a bibliographyon the three rusts of Zea mays. U.S.D.A. Plant Dis. Epidemics and Identification
Sec, Special Pub. No. 9, pp. 1-59.
P* 235

7/30/2019 Microbiology of at 00 Greg
http://slidepdf.com/reader/full/microbiology-of-at-00-greg 264/286
THE MICROBIOLOGY OF THE ATMOSPHERE
WoRTHiNGTON, A. M. & CoLE, R. S. (1897). Impact with liquid surface studied by the
aid of instantaneous photography. Phil. Trans.., A. 189, 137-48.
Wright, J. W. (1953). Pollen dispersion studies: some practical applications, y. For..,
51, 114-18.
Wright, S. (1943). Isolation by distance. Genetics., 28, 114-38.-—— (1946). Isolation by distance under diverse systems of mating. Genetics., 31, 39-59.
Yarwood, C. E. (1952). Some water relations of Erysiphe polygoni conidin. Mycologia,
44, 506-22.
& Hazen, W. E. (1942). Vertical orientation of powdery mildew conidia during
fall. Science, 96, 316-17.
& Sylvester, E. S. (1959). The half-life concept of longevity of plant pathogens.
PL Dis. Reptr., 43, 125-8.
Yates, A. H. (1953). Atmospheric convection: the structure of thermals below cloud
base. Qiiart.
J.
R. Met. Soc,79,
420-4.
Zeleny, J. & McKeehan, L. W. (1910). Die Endgcschwindigkeit des Falles kleiner
Kugeln in Luft. P/iys. Z., 11, 78-93.
Zentme^tr, G. a., Wallace, P. P. & Horsfall, J. G. (1944). Distance as a dosage
factor in the spread of Dutch elm disease. Phytopathology, 34, 1025-33.
ZoBell, C. E. (1942). Microorganisms in Marine Air. //; Moulton, 1942, pp. 55-68.
(1946). Marine Microbiology. Chronica Botanica, Waltham, Mass., 240 pp.
& Mathews, H. M. (1936). A qualitative study of the botanical flora of sea and
land breezes. Proc. Nat. Acad. Sci., Wash., 22, 567-72.
ZoGG, H. (1949). Untersuchungen iiber die Epidemiologic des Maisrostes Puccinia
sorghi Schw. Phytopath. Z., 15, 143-92.
236

7/30/2019 Microbiology of at 00 Greg
http://slidepdf.com/reader/full/microbiology-of-at-00-greg 265/286
SUBJECT INDEX
Aberdeen, 127
Abies pectinata, 16
Absidia corymbifera, 208
— ramosa, 208
Acer pseudoplatanus, 212
Achromobacter, 126, 128, 140, 143
Acladium, 139
Acnida tamariscina, 16
Acremoniella, 137
Acremonitim, 134
Actinastriim, 140
Actinomyces griseolus, 139— phaeocronwgenus, 139
Actinomycetes, 33, 114, 129, 139, 141, 142
Adelie Land, Antarctica, 152
Adhesives for spore traps, 103
Aecidiospores, dispersal of, 37— impaction of, 82
Aerobiology, 194
Aeroconiscopes, 7-9, Fig. 2, 95Aeroplanes, sampling from, 20-21, 93-94,
135-46
Aeroplankton, 146, 147, 193, 197
Aeroscopes, 7, 95, 97, 109, 113
Aerosol viability tests, 191, 192, 198
Africa, invasion by Pitccinia polysora, 189
Agaricus, see ''Psalliota campestris'
Aggregation of spores in air, 154— of bacteria in air, 1
Agropyrtim, pollination of, 42
Agrostis, pollination of,42
Air centrifuge, 98
change indoors, 155, 156
— composition of, i
— hygiene, 155-61
masses, 29, 142-6
spora near the ground, 108-30
whip sampler, 103
Algae, dispersal mechanisms of, 38— in air, 109, 116, 123, 137, 140, 149, 150, 196
Alginate-wool filters, 97Allergic activity of pollen, etc., 21
Allergy, 11-12, 200, 201Alniis, 15, 16, 43, 127
Aloina brevirostris, 151, 186-7, 201
— rigida , 151, 186-7
AlopecuriiS, pollination of, 42
Alpine air, 4, 10, 131, 132
Alternaria, 17, loi, 114, 116, 118-20, 122,
123, 126, 128, 135-7, 130, 141-5, 147, 151,
152, 200, 208
— solani, 165
Altitude and microbial concentration, 13 1-3
Amanita rubescens, 17, 210
Amanitopsisy 16-17, 210
Amaranthaceae, 43
Amblystegium serpens, 151
Ambrosia bidentata, 16
— elatior, 16
— spp.,43, 103, 120
Amoeba, 109, 149— polyphagus, 149
Andersen sampler. Fig. 18, 102, 103
Andropogon, pollination of, 42
Anemophilous flowering plants, 39-43
Antarctica, 128, 152, 153
Anthoxanthiim, pollination of, 42
Anthrax, 160
Anthriscus sylvestris, 212
Antibiotics in pollen, 130
Aphanocapsa, 140
Aquatic Phycomycete in air, 129
Arctic air-spora, 128-9
Arcyria denudata, 150
Area dose (A.D.), 58, 59, 65
Area source, 48, 169, 173-5, 178
Arizona, 136
Armillaria mellea, 210
Arrhenatherum, pollination of, 41-42, Fig. 5
Artemisia, pollination of, 43, 117
— vulgaris, 212
Arthrococcus lactis, 134
Ascomycetes, spores of, PI. 5; see also genera
and species involved
— squirt-gun mechanism of, 36, 37
Ascospores, diurnal periodicity of, 116, 117,
119, 120— in air, 114, 116-23
Ash, see Fraxinus
Aspergillus, 82, 114, 122, 129, 134-7, I39>
142, 143, 147, 149, 153, 208
— fumigatus, 135, 208
— glaucus, 149— nidulans, 208
— niger, 135, 149, 208
Asymmetrical spores, rate of fall of, 15, 18, 19
Atlantic Ocean, the air-spora of, 10, 13, 124,
125, 127, 137, 144, 145, 149
— voyages, 10, 13, 124, 125, 127Atmosphere, layers of, 22-29, F'?- 3-
Atmospheric circulation, 29
Atomiser-bubbler, 98
Automatic volumetric spore-trap, 99-101,
Fis;. 17
Availability of sites, 162, 163
Avena, pollination of, 42
Axes of co-ordinate system, 47
Bacillus, no, 149
— aerophilus, 135
— albolactis, 128
237

7/30/2019 Microbiology of at 00 Greg
http://slidepdf.com/reader/full/microbiology-of-at-00-greg 266/286
THE MICROBIOLOGY OF THE ATMOSPHERE
Bacillus, anthracis, i6o
— aureo/lavus, 135— aurescens, 135— {cereiis) Jiiycoides, 126, 135— cohaerens, 126
— fluorescens litjiiefaciens, 153— fluorescens non-liqi(efaciens, 153• -fluorescens pulruhis, 153
— fusiformis, 128
— janthinus, 153
— laterosporus (?), 126
— megatherium, 126, 139— guietus, 135— sp., in stratosphere, 135— sp., in upper air, 139— submesentericus, 135— subtilis, 126, 128
— terrestris, 135— tumescens, 126, 128
Bacteria in air, diurnal periodicity of, 10, 112,
113, 116, 117
— effect of rain on, iii
— in marine air, 125, 126
— in snow, 153
— sampling of, 91, 104
— take-off mechanisms of, 33, 129, 143, 158
— upper air, 134-47
Bacteriology, development of, 6-7
Bacterium, no, 149
Badhamia ntricularis, 210
Baker Lake, Canada, 141
Ballistospores, 38, 117, 120, 196
Balloons, sampling from, 93, 134, 135
Baltic Sea, tree pollen over, 185-6
Barberry, 46, 136
Barbula fallax, 210
Bartsia, pollination of, 42
Basidiobolus, 37Basidiomycetes, spores of, PI. 6; see also
genera and species involved
Basidiospore discharge, 37Basidiospores, diurnal periodicity of, etc.,
117-20
— in air, 84, 1 14-17, 1 19-23, 144, 158, 196
Bathurst, Cape, Canada, 140
Bavaria, 134
Beagle, Darwin's voyage in, 13
Bean leaves, spore deposition on, 74Bellows mechanism of Gasteromycetes, 35, 86
Berberis, 46, 136
Berlin, 134
Beta, pollination of, 43
Betula, 15-16, 20-21, 43, 117, 127, 186, 212Biological warfare, 198
— zone in upper air, 146, 147, 154, 197
Biotic factors, effect on the air-spora, 123
Birch, see Betula
Bispora monilioides, 208
Blowing-away of spores, 34-35, 73-74
Blue-green algae, 184
Bodo, 109, 149
Bolbitius vitellinus, 210
Boletus badius, 17
— chrysenteron, 210
— felleus, 17, 210
— scaber, 210
Bothnia, Gidf of, 186
Botrytis, 34, 35, 116, 120, 123, 142, 145, 165,
208
— cinerea at sea, 125
— polyblastis, 82
Bottle-device air sampler, 93
Boundary layer exchange deposition, 81Bouteloua, pollination, 42
Bovista plumbea, 17, 19, 52-55
Brachypodium, pollination of, 42
Brachysporium, 139
Brachythecium rutabulum, 150
— velutinmn, 150, 151
Bracken, see Pteridium
Brecknock Beacons, Wales, 127
Briza, poUination of, 42
Broad-bean leaves, deposition on, 74Bromus, pollination of, 42
Broussonetia, pollination of, 43
Brownian diffusion, 60
Bryophytes, 36, 39, 128, 140, 142, 150, 151,
182, 184, 186
— spores of, PI. 6 ; see also genera and species
involved
Bryum, 151
— argenteum, 151
— pollens, 1 5
Bubbler samplers, 96-97, 109
Buchloe, pollination of, 43
Bulgaria inquinans, 208
Buxus, poUination of, 43
Calamagrostis, pollination of, 42
Calcutta, 7
Calluna, 42, 212
Calpoda, 109, 149
Calvatia gigantea, 31, 63, 71
Camarosporium, 137
Cambridge, England, 127, 136
— Bay, Canada, 140
Canada, 140-6Canadian Prairies, 137
Cannabis, pollination of, 43
Capillary impinger, 98, PI. 4
Cardiff, 115
Caribbean Sea, 125, 137
Carpinus, 16, 20
Cascade impactor, 62, 99
Castanea, 43, 212
Casuarina, pollination of, 43
Catenularia, 126
Catkins, 43
Caves, microbes in air of, 160
Cedar, Atlas, 180
— Lebanon, 180
Centrifugal samplers, 98
Cephalosporium, 126
Ceplialothecium, 135, 139
Ceratodon purpureiis, 151
Ceratostomclla ulmi, 166
Cercospora, 122
Cercosporella herpotrichoides, 35
Chaetomium, 12, 37, 120, 137, 139, 141, 208
Chenopodiaceae, 43, 117, 127
Chenopodium, 43, 212
Chichester Harbour, 109, 121
Chlamydomonas nivalis, 38, 150
238

7/30/2019 Microbiology of at 00 Greg
http://slidepdf.com/reader/full/microbiology-of-at-00-greg 267/286
SUBJECT INDEX
Chlorella, log, 140, 149
Clilorococcuin, 109, 140, 149, 150
— humicoliiin, 140, 150
Churchill, Canada, 141, 142
Circulation of the atmosphere, 29
— patterns indoors, 157, Fig. 23
Cladonia, 210
— podetia as wind cups, 35
Cladosporium, 35, loi, 1 14-16, 118-23, 128,
129, 134-5, 137. I3Q, 142, 147, 151-2, 159,
196, 200, 208
Claviceps purpurea^ 208
Clouds, atmospheric, effect on air-spora, 136,
i54> 192, 193, 197
— ot micro-organisms, 20, 45
Coccidioidomycosis, 200
Coefficients of deposition, p, Vg, 76-80
— of diffusion, 49Collection errors in sampling, 96
Colletotrichum lini, 37
Collybia maculata, 210
Compositae, 43, 117
Composition of the air-spora, 108, 195-6
Concentration, measurement of, 58
Condensation nuclei, 148
Conical-funnel samplers, 92
Conifer pollen in air, 1^0; sec also genera and
species involved
Conifuge,98Coniophora, 116, 120
Coniothyrium, 137
Continuous sources, 47, 51
Convection in atmosphere, 18, 21, 23, 27-29,
33,34, 134, 138, 147, 154, 156, 157, 161, 195
Convective layer. Fig. 3, 27, 138
Coprinus atravientariiis, 210— coma tus, 17
— variegatus, 202
— plicatilis, 17
Cordyceps, 18, 19
Cortaderia, poUination of, 42Cortinariiis elatior, 210
Corylus, 15, 16, 43, 94, 117, 127, 212
Corynebacterium ( ?), 140
Crepidotus mollis, 210
Cronartium rihicola, 191, 192
Crowd disease, 183
Cruciferae, 127
Cunninghamella, 34, 35, 142
Cupressus, 41
Ciirvularia, 119, 128
Cyanophyceae, 184
Cyclone dust collectors, 98Cylinders, efficiency of impaction on, 62-64
Cynosiinis, pollination of, 42
Cyperaceae, 41, 127
Cystococciis pseiidostichococcus, 150
Dactylis, 15, 16, 42
Diihlinia concentiica, 208
Death of cells in air, 191-3— rates, 191
Deflation, 34, 35
Deinatiiim, 137
Denmark, 137
Densities of pollen and spores, 15
Deposition coefficients, p, Vg, 76-80
— oi Lycopodiitm spores. Fig. 13, 68, Fig. 14
— to ground, 170-2
— gradients, 162-79
— of spores on leaves, 74, 75
— on cyhnders, 62-64— processes, 58, 81-89
Deschampsia, pollination of, 42
Desiccation and viability, 191, 192
Desmids, noDetection thresholds in sampling, 106
Diatoms, noDiatrype stigma, 208
Dicoccum, 120
Die-away of concentration, 155, 156, Fig. 22
Diffusion models, 47, Fig. 6
Diplodia, 119
Discomycete type of spore hbcration, 37
Discontinuous spread of plant diseases, 181
Dispersal gradients, 45-57, 162-80
Dispersion of spores in air, 45-57, 167-76
Distribution of microbes by air, 13
Diurnal periodicity, 10, 112, Fig. 19, 1 16-19,
Figs. 20, 21
Dothidella iilei, 199
Douglas-fir, 180
Drop excretion mechanism, 70
Droplet infection, 158
— nuclei,158
Dryopteris, 210
— spores over Atlantic Ocean, 127
Dry-rot fungus, 158
Dundee, 159
Duplex, radial jet sampler, 99
Dust-devils, 25, 33•— from sputum, 158
— horizon, 27
— spores in, 4— trapped in laminar air layer, 24
Dutch elm disease, 166
Dwelhng houses, air-spora of, 159
Eco-climate of boundary layer air, 25-27
Eddy diffusion, 47-51, 167-76, Figs. 25,
26, 27
Edge drift, 69, 70
— effects in deposition, 68-73
Efficiency of trapping, 59, 95, 96
Ejection distances of f'ungus spores, 56
Electrical charges on spores, 84, 85
Electrostatic deposition of spores, 84, 85, 104
— precipitator, 104
Elevation of source, effect of, 171-6
EHmination, 199
EUesmere Island, 129
Elymus, pollination of, 42
Empirical formulation of gradients, 46, 166,
167
Enclosed spaces, the air-spora of, 155-61
Endothia parasitica, 181, 200
Entoloma, 210
Entomophilous flowering plants, 39, 40, 42
Entomopbthora, 116, 120, 123
— muscae, 37, 208
Epicocctim, 116, 119, 120, 123, 128, 137
Epichloe, 18
239
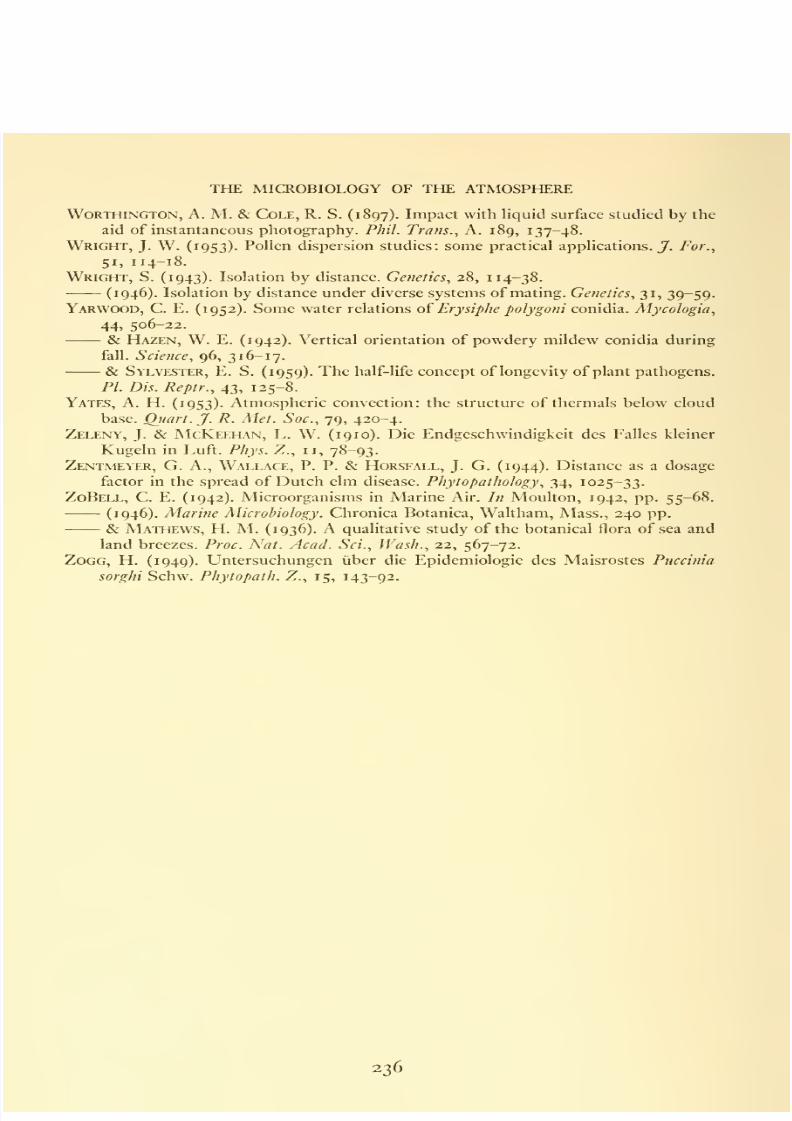
7/30/2019 Microbiology of at 00 Greg
http://slidepdf.com/reader/full/microbiology-of-at-00-greg 268/286
THE MICROBIOLOGY OF THE ATMOSPHERE
Erica, pollination of, 42
Ericaceae, pollen over the Atlantic, 127
Erysiphales type of spore liberation, 37
Erysiphe, loi, 106, 116, 118-20, 122, 152
— granmis, 17, 19, 71, 82, 85, 94, 208
— polygoni, 16
Escherichia coli, 104, 192
Evolution, 201-3
Experiments on spore diffusion, 52-57
Factories, the air-spora of, 160
Fagus sylvatica, 15, 16, 20, 43, 212
False oat-grass, see Arrhenatherum
Farm buildings, the air-spora of, 160
Favus, 6
Fern spores in upper air, no, 140, 146
Ferns, spore dispersal of, 39
Festiica, pollination of, 42
Filter samplers. Fig. i, 96, 97
Finland, 150, 186
Fistulina hepatica, 210
Flag sampler, 96
Flattening of gradients by secondary infec-
tion, 165
Flavobacteriiim, 126, 140, 142
— aquatilis, 126
Fluorescent dusts experimentally dispersed,
182Forties annosus, 89, 97, 210
Food preservation by heat, 3
Fraxinus, 43, 117, 127, 180
— americana, 16
Freezing, effect on viability, 192, 193
Frictional turbulence, 23, 25-27, 194
Fnillania, hygroscopic elaters of, 39
Fuligo septica, 210
Fumago, 137
Fimaria hygrometrica, 140, 151, 210
Fungi Imperfect!, spores of, PI. 5; see also
genera and species involvedFusarium, 34, 35, 92, 122, 137, 139, 142, 144,
145— culmortim, 35
Galera tenera, 17
Ganoderma applanatum, 78, 81, 84, 85, 116,
120, 123, 162, 163, 210
Gasteromycetes, bellows mechanism of, 35
Geaster, bellows mechanism of, 35
Gene dispersion and transmission, 167, 169-
80, 197, 203
Geoglossum, 18
Geographical distribution of microbes, 13,
181, 182, 184, 189, 198-200
Geometrical dispersion theories, 46
Germ theory of disease, 6
Glaciers, spores and pollen in, 201
Glass fibre sampler, 94Glasshouses, 161
Globularia, pollination of, 43
Gloeocapsa, 109, 116, 123, 150, 210
Glycerine jelly as mountant, 103
Gottingen, 20, 81, 138
Graham Land, Antarctica, 128
Gramineae, polUnation in, 41
Grass pollen, 42, 74, 117, 127
Gravity deposition, 64, 65, Fig. 12, 68, 76-82,
91-93— sedimentation trapping, 12, 91-93
— shedding of spores, 34
Green-plant spores in upper air, 140Greenland, 137, 186
Ground deposition hypotheses, 76-80
Guelph, Ontario, 153
Gymnosporangitim biseptatuw, 136
Gyiieriutii, pollination of, 42
Hail, microbes in, 153, 154
Half-life of a microbe population, 192
Halle, Germany, 137
Hayfever, 12
Hazel, see Corylus
Heat generated by fungi, 21
Heidelberg, Germany, 149
Height, change of air-spora with, 132-3
Helicomyces, 120, 123, 208
Helicosporium, 137
Helminthosporiiim, 82, 116, 120, 128, 135, 137,
139, 141, i43>2o8
— sativum, 17, 34, 35, 141
Helvella crispa, 208
Hemileia vastatrix, 93
Hesse's method, 10,93
Hippopha'e, pollination of, 43
Hirst spore trap, 99-101, Fig. 17
Histoplaswa, 96, 200
Holcus, pollination of, 42
Holland, 108, 140
Hordeiim, pollination of, 42
Horizons of infection, 183, 184
Horizontal surface, deposition on, 68-72
Hormidium flaccidum, 140, 149
Hortnodendrmn, 126, 134, 139 (and seeClado-
sporium)
— resinae, 157Hornbeam, see Carpinus
Hospitals, the air-spora of, 159, 160
HUlnaria gramdata, 208
Humtdus, pollination of, 43
Hygrophorus tiiveus, 210
Hygroscopic movements in dispersal, 34, 36,
39^41,43
Hyphal fragments in air, 128
Hypholoma fasciadare, 2 1
— hydrophila, 210
— velutina, 210
Hypnum ciipressiforme, 150
Hypochytriiim catenoides in air, 129
HypoxyIon coccineiim, 208
— midtifonne, 208
Ice, spores and pollen in, 201
Identification of the air-spora, 91, 108, 109,
207, Pis. 5, 6, 7
Impaction, 59-69, 82, 83, 93-103
— filters, 97— samplers, 93-103
Impactors, spores as, 82, 83
Imperial College of Science & Technology
240

7/30/2019 Microbiology of at 00 Greg
http://slidepdf.com/reader/full/microbiology-of-at-00-greg 269/286
SUBJECT INDEX
Inclined slides, deposition on, 64-68, 70-72,
93India, rust migration in, 188
Indoor air-spora,, 155-61
Inertial samplers, 93-103
Infection efficiency, 165
— gradients, 162-80, Fig. 28
Infusoria in air, 9, 109
— in rain, 149
Inocybe geophylla, 210
Insect pollination, 32, 39, 40
Insects, spore dispersal by, 34
Instantaneous sources, 47, 51
International standard atmosphere, 22
Intramural air-spora, 155-61
Inverse square and cube theories, 46
Iowa, 170
Irkutsk, 188
Irrigation, possible effects of, 123
Isokinetic sampling, 62, 96
Isolation, 177, 189, 198-200
hopyruiii fumarioides, 188
Iva xanthifolia, 16
jftiglivis iii'^ra, 6
— pollination of, 43
Juncaceae, pollination of, 41
yuiiipcnis, 15, 41, 127Jura Mountains, 4
Kaiser Wilhelm II Land, 152
Kansas, 120
Katabatic air flow, 28
Kites, sampling with, 12, 134
Koeleria^ poUination of, 42
Koniometers, 96, 99
Krakatoa, recolonization of, 184, 185
Labrador, 144, 145
Lacrymaria veliitina, 210
Lactarius, 120, 123, 210
Laminar boundary layer. Fig. 3, 23, 24
Larix decidua, 16
— polonica, 16
Lathraea, pollination of, 42
Leiden, 108, 140
Leocarpusfragilis, 210
Leningrad, 52, 253
Leptobrytim pyrifonne, 151
Leplnsphaeria, 119, 120, 137, 141
Liberation of spores, 31-44, 194
Lichen fragments in snow, 150
Lichens, dispersal of, 38— in rain, 150, 151
— on Krakatoa, 184, 185
Lime, linden, see Tilia
Line source, 47, 51
Liquid scrubber samplers, 97, 98
Littoral spray, 125
Liverwort sporangia, dispersal from, 39
Local eddy layer, 25
Logarithmic and log-normal series, 108
London, air sampling in, 11, no, 121-3, 160
Long-distance dispersal, 181-93
Lophodcrmiiiiii, charge on spores of, 84
Loss of spores from spore-cloud, 80, 81
Lungs of animals as air samplers, 103
Lycoperdoti, 16, 17, 35, 63, 71, 82, 85
LycopodiuDi, 15, 16, 35, 54-57, 62, 63, 66 -75,
78-81, 83-85, 88, 94-96, 106, 210
— spore orientation, 72
— spore properties, 62
— spores over the Atlantic, 127
McGill University, 129, 140-6
Macrosporiwn, 120, 126, 137, 139
— tenuis, 135
Magnetic Pole, North, 140
Maize, 137— pollen, 130
— rust in Africa, 189
—• rust in Upper Rhine Valley, 185
Malta, 128
Manhattan, Kansas, 120
Manitoba, 137
Marasmitts oreades, 17
Marchantia polyworpha, 150, 186
Marie Byrd Land, 128
Marine air-spora, 124-8
Massachusetts, 138, 139
Mechanical turbulence, 25, 26
Mechanisms of deposition, 59-61
Mediterranean voyages, 10,128
Aielampsoridiiim, 210
Melanospora zamiac, 208
Melica, poUination of, 42
Membrane filters, 96, 97
Mer de Glace, 4, 13
Mercitrialis, pollination of, 43
Meritlius lacrymans, 158, 210
Metzgeria, 150, 186
Michigan, Lake, 136
Microbial clouds, 45
Micrococcus, no, 136, 139, 140, 143, 145
— aerogenes, 135— albus, 135
— Candidas, 126
— citreiis, 135— flavus, 126
— lutei's, 135
— nubilus, 135
Microsporium gypsetim, 103
Mines, the air-spora of, 158, 160
Mist droplets, picking up of spores by, 35
Mniobrywn carneitni, 151
Molinia, poUination of, 42
Manas, 109, 149
Monilia Candida, 149
— sitophila, 17, 34, 35
Monotospora lanuginosa, 208
Montreal, 125, 129, 140-6
Montsouris, 8-10, 1 10-13, 148
Morus, pollination of, 43
Moscow, 136
Moss gemmae in snow, 150
— spores in air, 128, 140, 142, 150, 151
— spores in rain, 150, 151
— sporangia, dispersal from, 39
Moulds in air, diurnal periodicity of, 10, 113,
116
— effect of rain on, in, 122, 123
241
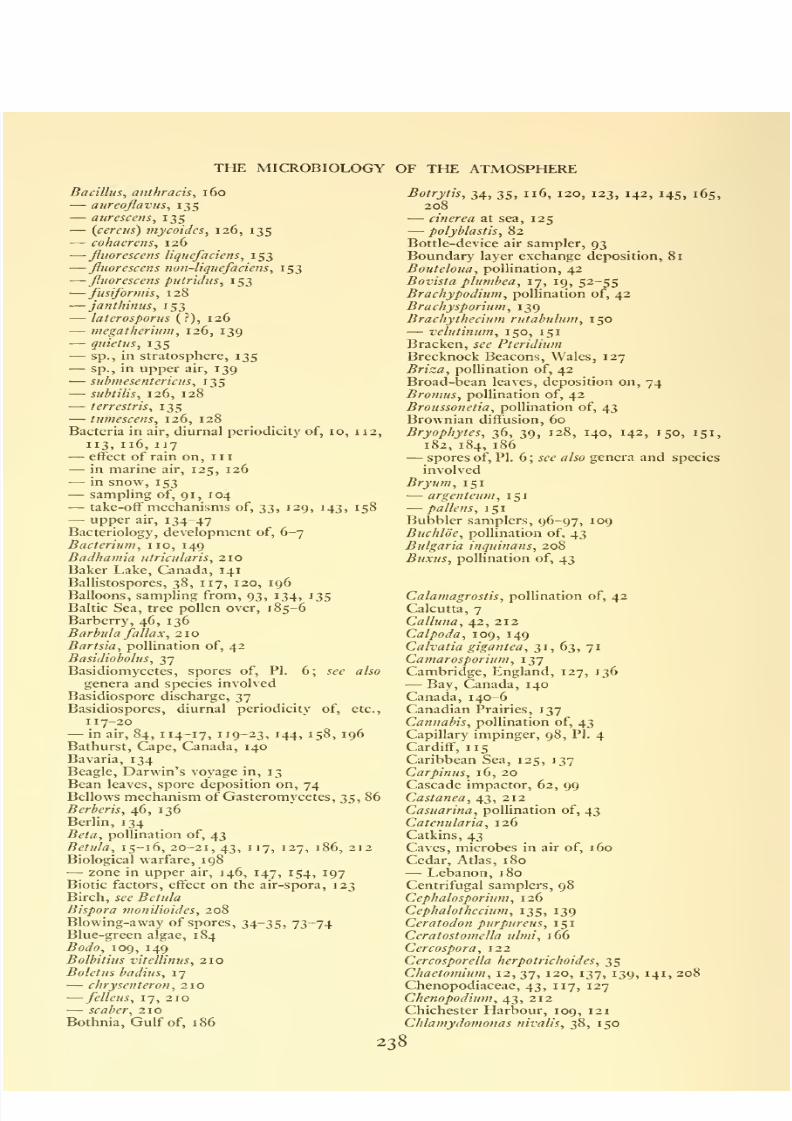
7/30/2019 Microbiology of at 00 Greg
http://slidepdf.com/reader/full/microbiology-of-at-00-greg 270/286
THE MICROBIOLOGY OF THE ATMOSPHERE
Mountains, the air-spora of, 131, 132
Mowing grass, 123
Mucor, 139, 153— mucedo, 134— racemosus, 134
— spinosus, 208
Mucoraceae, 114, 139, 142, 145
Multiple infection transformation, 163-5
Muscardine of silkworms, 6
Muslin samplers, 97Mycosphaerella, 137
Myriangium type of spore liberation, 37Myrica., 127
Alyrothamnus, pollination of, 43Myxomycetes, 33-35, 150, 185
— spores of. Pi. 6 ; see also genera and species
involved
Nardus, pollination of, 42
Nashville, Tennessee, 139
Naucoria {Pholiota) t?iyusotis, 210
Navicula, 109, 149
Nectria cinnabarina, 208
Netherlands, 108, 140
New Mexico, 137— York, 160
— Zealand, 120
Nidulariaceae, splash-cups of, 36Nigeria, 119
Night radiation to sky, 27, 28
Nigrospora, 37, 119, 128
— sphaerica, 116
Nolanea, 120, 123, 210
Non-isotropic turbulence, 43, 169
Non-random distribution of spores, 164
North America, rust migration in, 187, 188
— Pole, sampling over, 140, 141
— West Territory, Canada, 140-3
Nostoc commune, 150
Nothofagus pollen in Tristan da Cunha, 186
Nuclear explosions, dust from, 190
Oak, see Qjicrcus
Observatoire Montsouris, Paris, 8-10, iio-
13, 148
Ocean voyages, sampling on, 124-8
Oceanic air-spora, 10, 13, 124-8, 144-6
Oiditim heveae, 199
Onion downy mildew ; see Pcronospora
destructor
Oospora, 139— ferrugiuea, in upper air, 134— ochracea in upper air, 134
Ophiolwlus, 18, 119, 123, 208
Orientation of spores, 19, 72
Origin of the air-spora, 129, 130, 139, 144, 146
147, 196, 197
Outer frictional turbulence layer, 23, Fig. 3,
27
Over-dispersion, 165
Oxalis stricta, 185
Pacific coast, 125, 126
Paecilumyces (?), 126
Palmella, 7
Palynology, 201
Panacolina {Psilocybe) foenisecii, 210
Panaeolus sphinctrinus, 210
Panicum, pollination of, 42
Papularia, 142, 145, 208
Paramaecimn, 149
Parietaria, pollination of, 43Paris, air sampling in, 8-10, 1 10-13, 148
Pasteur's filter sampler, 4, 5, 97Paxillus ini'olutus, 17
Penetrators, spores as, 82, 83
Peuiclllium, 12, 82, 85, 114, 116, 119, 120,
122, 126, 134, 136, 137, 139, 141-5, 149,
153, 159,208
— atro-viride, 134
— crustaceum, 135— cyclopium, 135— glaucum, 139— viridicatum, 129
Peniophora gigantea, 83, 89, 97Periconia, 116, 120, 134
Peronospora destructor, 16, 178, 184
— parasitica, 208
— tabacina, 116, 165, 170
Pertusaria, ascospore discharge, 82
Pcstalozzia, 137, 141
Petri dish, spore deposition on, 73, 92
Petri's air sampling method, 97Petroleum jelly adhesive, 103
Phaeohulgaria inquinans, 208
Phaeokpiota spectabilis, 210
Phlcum, 16, 42, 212
Pholiota, 210
— myosotis, 210
Phoma, 92
— hibcrnica, 125
Pohlia cruda, 151
— nutans, 151
Phormidium luridum nigresccns, 140
Photophoresis, 85
Photoreactivation, 193
Phycomycetes, spores of, PI. 5 ; see also genera
and species involved
Pliyllitis, 210
Phyllosphere, 115
Phyllosticta, 141
Phillyrea, 43
Physarum nutans, 150
Phytophtlwra, 82, 120
— infestans, 35, 116, 118, 163, 165, 170, 177,
178, 184, 189, 199Picea, 15, 16, 127, 180, 186
Pick-up of spores by mist droplets, 35Piedmont silk industry, 6
Pikis, Finland, 150
Pilobolus, 37
Pine, see Pinus
Pink yeasts in air, 126, 139, 149
Pinus, pollen, 15, 16, 40, 43, 117, 127, 128,
149, 171, 180, 186, 212
Piricularia, 116, 119
Pitliomyces chartarum, 208
Plane, see PlatanusPlantago, 43, 117, 127, 212
Plantain, see Plantago
Plasmopara viticola, 92
242
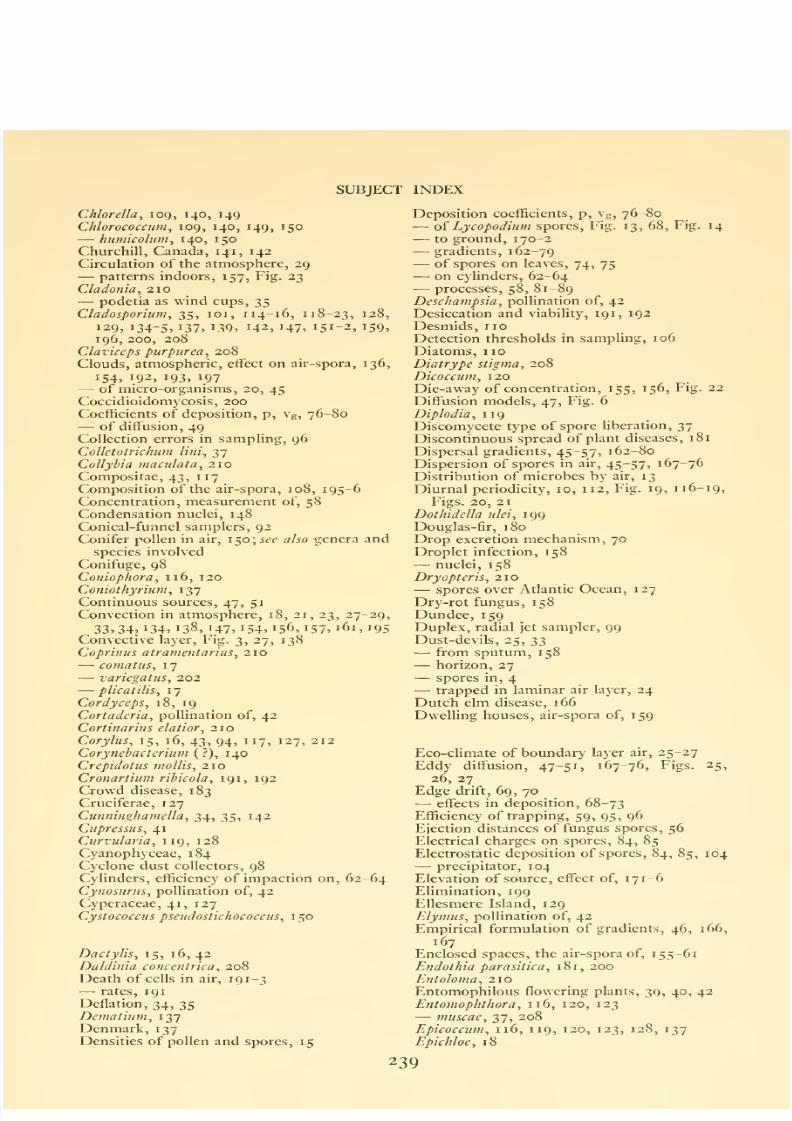
7/30/2019 Microbiology of at 00 Greg
http://slidepdf.com/reader/full/microbiology-of-at-00-greg 271/286
SUBJECT INDEX
Platanus, 43, 117, 121, 212
Plcnozytliia, 126, 139
Pleospora herbaruin, 208
Pleurococcus, 109, 140, 149
Pintens cervinus, 17
Poa, pollination of, 42
Point source, 47, 48, 51, 169, 177
Polar air, the spora of, 128, 129, 140, 141
Pollen, comparison of traps for, loi
— densities of, 16
— discovery of function of, 2
— grains, PI. 7; see also genera and species
involved
— in marine air, 214
— in rain, 149, 151, 152
— in upper air, 134-47, I53, I54
— output, 31
— transport by wind, 2
— vertical gradients of, 131-3, 146
Pollination mechanisms, 39-43
Polyhedral viruses in air, 33
Polyporus conchatus, 36
— squamosus, 17, 21
Polylrichum, 15, 16
Polythrincium trifolii, 116, 118, 120, 208
Populiis, 43, 127, 180
Portable volumetric spore-trap, loi, 102
Potamogeton, pollination of, 42
Potato, late-blight of, see Phytophthora infestam— leaves, spore deposition on, 74, 75
Poterium, poUination of, 43
Prasiola stipitata, 150
Precipitation water, microbes in, 148-59
Pre-impinger, 98, PI. 4Presentation of spores, 34Probable flight concept, 168
Proteus vulgaris, 153
Protozoa in air, 9, 13, 108, 109
— in rain-water, 148, 149
Prunus armeniaca, 166
^Psalliota campestris', 17, 82, 84, 85Psathyrella hydrophila, 210
Pseudomonas, 143
Pseudoperonospora cuhensis, 95Psilocyhe, 120, 210
Pteridiuin, no, 210
Pteridophyte sling dispersal mechanism, 39•— spores in air, no, 146, 182, 184
Pteridophytes, spores of, PL 6; see also genera
and species involved
Public buildings, air-spora, of 158-60
Puccinia, 135
— antirrhini, 165, 189
— coronata, 17
— coronifera, 17, 35— glumarum, 134, 137, 141, 191
— graminis, 16-18, 31, 82, 85, 134, 141, 152,
165, 178, 187, 188, 191, 210
— helianthi, 203
— malvacearum, 189
polysora, 116, 165, 189, 191, 200
— pringsheimia, 35— riibigo-vera, 191
— sorghi, 185
— triticina, 35, 134, 135, 188, 199
Puffballs, spore output of, 31
Puffing of discomycetes, 37
Pullularia, 116, 120, 123, 141, 142, 145
Pyronema conjlucns, 208
Pylaisia polyantba, 150, 151
Pyrenomycete type of spore liberation, 37
Quantity liberated, Q_o, 47, 167-70
Quarantines, 182, 198-200
Qiiebec Province, 143-7
Qjiercus, 16, 43, 117, 127, 212
Radioactive Lycopodium spores, experiments
with, 78, 88
— wash-out, 88
Rain deposition, 148-52
— effect on air-spora, 122, 123
washing, 10, 85-89, 122, 148-54
Raindrops, efficiencv as spore collectors, etc.,
85-88, Figs. 15,16
Rain-splash dispersal, 35-36, 194
Random deposition of spores, 164
— distribution of microbes in air, 20, 45
Re-concentration ofspores within clouds, 154,
197
Regression equations for gradients, 169
Resolute Bay, Canada, 142
Retention errors in samphng, 96
— of spores on surfaces, 73-75Reticularia, 33, 210
Reynolds number, 26
Rhine Valley, dispersal of maize rust in, 185
Rhizopus in stratosphere, 135
Rhododendron, pollination of, 42
Ringworm, 6
Rosellinia aquila, 208
Rotating cylinders, deposition on, 61, 63, 64
Rothamsted Experimental Station, sampling
at, 106, 114-23, 151, 152
Rotorod sampler, 103
Rough surfaces of ground, etc., 25, 26— surfaces of pollen and spores, 19
Rounding-off dispersal mechanisms, 37
Roya, 150
Rumex, 43, 117, 127, 212
Russia, migration of rusts in, 188
Russula emetica, 17
•— nigricans, 210
— vesca, 210
Rust fungi, dispersal of, 185, 187; sec also
the species involved
— fungi, vertical gradients of, 137
St. Petersburg, 153
Salix, 43, 127, 130, 212
Salsola pestifer, 16, 43
Salt-water media for bacteria, 125-7
Samphng errors in trapping, 95, 96
— techniques, choice of, 90
Sangiiisorha, pollination of, 43
Sarcina, 136, 140, 143, 145
— flava, 126
•— lutea, resistance to ultra-violet radiation,
192
Schizophyllum commune, 190
Scilly Isles, 127
243

7/30/2019 Microbiology of at 00 Greg
http://slidepdf.com/reader/full/microbiology-of-at-00-greg 272/286
THE MICROBIOLOGY OF THE ATMOSPHERE
S2, 91,92
Sclerochloa, pollination of, 42
Sclerotinia, 137— laxa, 165
Scleratium cepivonim, 199
Scolccotrichtim,
135Scolytiis iiiiiltislriciliis, 165
Scopulariopsis, 139
Scripps Institution of Oceanography, 125,
149
Scrubber samplers, 97, 98
Scrubbing by rain, 85-89
Secale, 16, 42
Secondary infection, flattening of gradients
by, 165, 166
Sedimentation, 19-21, 65-73,
Se/aginel/a, 210
Septoria, 142— lycopersici, 165
Setaria, pollination of, 42
Settling of dust indoors, 159, 160
Sewers, air of, 160
Shelter, effect on gradient, 179
Ships, the air-spora of, 161
Siberia, rust spore migration in, 188
Sieving filters, 96
Silicone adhesives, 104
Sites, availability of, 162, 163
Six-stage sampler, Fig. 18, 102-3
SUde traps, 93-95Sling dispersal mechanism of Ptcridophytes,
39Slit sampler, 99Smooth surfaces, 25, 26
Smuts, loi, 122
Sneeze droplets, 158
Snow, microbes in, 150, 152, 153
Solanum tiiherosum, deposition on leaves of,
74 ; see also Potato
Soliilago, 212
Sordaria, 120, 208
Soredia of lichens, 38, 150, 151
Sorghum, pollination of, 42
Sources of the air-spora, 129, 130, 139, 144,
146, 147, 196, 197
Space exploration, 204, 205
Sparganhan, pollination of, 42
Sphagnum, air-gun mechanism of, 39Spicaria (?), 126
Spitsbergen, 128, 186
Splash-cup mechanism, 36— dispersal, 35, 36, Fig. 4.
Spontaneous generation, 2-5Spore deposition, 42, 62-64, 74 89, 170-80
— orientation, 19, 72— output, 31
— presentation, 34— trapping techniques, 90-107
Spores as 'impactors', 82, 83— as 'penetrators', 82, 83— shed by gravity, 34— shed by convection, 34Sporidesmium, 134— Imkeri, 208
Sporolwlomyces, 1 14, 115, 117, 1 19-21, 123, 210Sporobolymycetes, 33, 38, 115, 196
Sporormia, 141, 145
Sporotrichum beiirmanni, 158
Spraying, possible effects on the the air-
spora, 123, 124
Spruce pollen in Greenland, 183
Squirt-gun mechanism of ascus, 36, 37
Squirting mechanisms in dispersal, 37Stachyhotrys, 137
Stagnation line in impaction, 63
Standard deviation of spore-cloud, 49Staphylococcus albus, 126
— aureus, 138
— citreus, 126
Starch grains in air, 19
Stemonitis, 33— fusea, 150
Stemphylium, 116, 126, 137, 141-3, 145, 208
Stereum purpureum, 210
Stichococcus, 109— bacillaris, 140, 149— minor, 140, 149
Still air, 14
Stokes's law, 14, 15, 18, 19
Stratosphere, 23, Fig. 3, 29, 135
Streptomyces, 141, 143, 208
Stropharia aeruginosa, 210
Slylonychia, 149
Subways, the air of, 160
Sugar-beet pollen, 137
Sunshine, effect on the air-spora, 123
Synchytrium endobioticum, 199
T-3 Ice-Island, 129
Take-off mechanisms, 31, 32, 43, 44, 194
Tasman Sea, 146
Taxus, 15, 41, 212
Temperature, effect on the air-spora, 120, 123
— inversion, 24, 27, 28
— lapse rate, 24
Terminal velocity of fall, 14-19, 194
Tetraedron punctulalum,150Tctraploa aristata, 208
Thalictrum, 43, 212
Thelephora, 120, 210
Thermal deposition, 85
— precipitator, 104
Thermals, 28, 29
Thermonuclear explosions, dust from, 190
Thickness of edge, effect of, 72
Thrashing operations, effect on air-spora, 123
Thresholds for detection, 106
Thrush, 6
Thuja, 41Tilia, 16, 43, 117, 127, 212
Tilletia, 17, 52-55, 80, 85, 135, 196, 210
— caries {tritici), 52-55, 80, 85, 210
Tilletiopsis, 114, 116, 117, 119, 120, 123, 210
Topographical effect on gradients, 179
Torula herbarum, 116, 120, 128, 208
Transvaal Mines, 158
Trap dose (T.D.), 58, 59
Trapping efficiency, 59, 60, 68, 71, 75Trichia, 34Trichoderma, 126, 137, 147
Tricholoma rulilans, 210
Tricholomopsis rutilans, 210
Trichophyton mentagrophytes, 103
Trichothecium, 137, 208
244

7/30/2019 Microbiology of at 00 Greg
http://slidepdf.com/reader/full/microbiology-of-at-00-greg 273/286
SUBJECT INDEX
Tricoconis, 119
Trigloclun, pollination of, 42
Triphragmium ulmariae, 210
Tripsacum, 189
Trisettini, pollination of, 42
Tristan da Cunha, 186
Triticum, pollination of, 42
Tropopause, 23, Fig. 3, 24-29
Troposphere, 23, 24-29
Tuhercularia vulgaris, 208
Turbulence, 25-27, 47-50
Turbulent boundary layer, Fig. 3, 23, 25, 26
— deposition, 68, 72, 83, 84
Turgid cells, discharge by rounding-off, 37Tvarminne, Finland, 150
Tylostonia, bellows mechanism of, 35
Typha angustifolia, 15
— latifolia, 15
Typhaceae, pollination in, 41
Ulmiis glabra, 16
— pollen, 43, 127, 180, 212
Ultra-microscope, 90
violet radiation, 192, 193
Umbelliferae, pollen of, 127, 212
Under-dispersion, 165
Underground railways, 160
Upper-air sampling, 93, 94air spora, 134-47
Uredospores, 72, 82, 118-20, 123
Urocystis agropyri, 210
Uromyces, 137— phaseoli, 16
Urtica dioica, 212
— pollination of, 43, 106, 117, 123, 127
U.S.S.R., migration of rusts in, 188
Ustilago, 35, 82, loi, 106, 114, 116, 118, 120,
123, 135, 142, 151, 152, 210
— nuda, 152
— perennans, impaction efficiency, 62, 63, 71,86
— tritici, 17, 177— zeae, 17
Ventilation turn-over, 155, 156
Venturia, 96, 120, 122, 137
Vertical concentration gradient, 131-3, 137,
138.
— cylinder sampler, 94
— slides, impaction on, 64-72
Verticillium, 139, 141, 142
— albo-atrum, 35
Viabilitv of spores in the atmosphere, 190-3,
198
Vibrio, noViciafaba, 74, 75, 165
Viruses and air dispersal, 33, 158
Visual identification, 207, Pis. 5, 6, 7
Volvox, 149
Vorticella-Uke ciliates, 149
Warsaw, 153
Washington, D.C., 137
Water needed for active dispersal, 36
Weather, effect on the air-spora, 120, 122,
123
Weddell Sea, 128
Weed pollens, periodicity of, 117
WhirHng arm samplers, 103
White-pine blister-rust, see Croiiartiiini ribicola
Width of trace on cylinders, 63
Wind-cups, 35— pollination, 2, 34, 40
tunnel studies of deposition, etc., 61-65,
Fig. II
Windscale accident, 183
Winnipeg, 141
Workshops, the air-spora of. t6o
XantIlium commune, 16
Xylaria polymorpha, 208
Yeasts in air, 112, 126, 136, 139, 141, 142, 145— in rain, 149
— take-off mechanisms of, 3'!
Valley, effect of width on rust incidence, 185
Velocity of deposition, Vg, 77
Zea mays, 16, 42, 130, 1S9
245

7/30/2019 Microbiology of at 00 Greg
http://slidepdf.com/reader/full/microbiology-of-at-00-greg 274/286
AUTHOR INDEX
Adams, K. F., 115, 207. See Hyde, H. A., 225
Ahmad, S., 35. See Long, W. H., 226
Ainsworth, G. C, 123, 217
Airy, H., 95, 217
Alvarez, J. C, 91, 217
Andersen, A. A., 102, 103, 217
Anderson, A.M., 134, 159. See Carnelly, T.,
et al., 219
Andrewes, F. W., 160, 217
Appert, N., 3, 217
Aristotle, 2, 3
Arsdei, E. P. van, loi, 117, 119. See Panzer,
J. D., et al., 229
Artschwager, E., 137. See Meier, F. C, 228
Arrhenius, S., 203, 204, 217
Asai, G. N., 103, 152, 217
Atkinson, E. L., 153
Aylward, M., 96. See Davies, C. N., et al.,
220
Baas Becking, L. G. M., 199
Bakanauskas, S., 129. See Prince, A. E., 231
Baker, G. A., 54, 55, 166, 170. See Wilson,
E. E., 235
Barghoorn, E. S., 129, 217
Barss, H. P., 136. See Haskell, R. J., 224
Bassi, A., 6, 217
Bateman, A. J., 166, 169, 179, 180, 217
Batts, C. C. v., 132. See Malik, M. M. S., 227
Baxter, M. G., 190. See Rapcr, J. R., et al.,
231
Becking, L. G. M. B. See Baas Becking,
L. G. M.Beijerinck, M. W., 7, 199
Belasco, J. E., 30, 217
Bell, A. D., 200. See Hoggan, M. D., et al,
224
Belli, C. M., 153, 217.
Benoist, L., 106. See Miqucl, P., 228
Benson-Evans, K., 160. See Mason-Williams,
A., 227
Bergeron, T., 186, 217
Berry, C. M., 10:;, 217
Best, A. C, 85-87, 217
Bisby, G. R., 125, 190, 217
Blackley, C. H., 12, 46, 91, 93, 134, 217Blackman, G. E., 164, 218
Blanchard, D. C, 124, 218
Blodgett, K. B., 60, 61, 65. See Langmuir, I.,
226
Bobchenko, E. S., 94. See Kordyum, V. A.,
226
Bodmer, H., 17, 218Boedijn, K. 13., 184,218
Boerke, E. E., 191. Sec Goldberg, L. J., ct al.
B^gh, H., 179. See Jensen, I., 225
Boldt, M. H., 198. See Rosebury, T., et al.,
232
Bonde, R., 178, 218
Bonnier, G., 132, 218
Booker, D. V., 183, 218
Bosanquet, C. H., 169, 218Bourdillon, R. B., 33, 99, 155, 156, 160, 218
Brischle, H. A., 164. See Fracker, S. B., 222
Brodie, H. J., 35, 36, 218
Brook, P. J., 104, 218
Brown, M., 158, 218
Browne, J. G., 136, 218
Browne, W. W., 159. See Winslow, C. E. A.,
235
Brun, R. J., 61,64, 218
Brunt, D., 47, 218
Buchbinder, L., 98, 113, 218. And see Phelps,
E. B., 230Buell, M. F., 201, 218
Bujwid, O., 153, 218
Buller, A. H. R., 2, 11, 16-19, 21, 31, 34, 84,
97, 157, 219
Bulloch, W., 3, 6, 219
Bunce, M. E., 35, 207. See Gregory, P. H.,
et al., 223
Burges, A., 86, 219
Basse, J., 149, 219
Butler, E. J., 181, 219
Caborn, J. M., 179, 219
Calder, K. L., 51, 219
Cammack, R. H., 1 17, 1 19, 120, 165, 166, 189
219
Carnelley, T., 134, 159, 160, 219
Castro, J. F., 91, See Alvarez,J. C, 217
Cawood, W., 85, 219
Cawston, W. C, 113, 159. See Colebrook, L.
,
220
Chamberlain, A. C, 77, 78, 87, 88, 96, 170-2,
219Charles, V. K., 137. See Meier, F. C, et a I
.
228
Charnock, H., 183, 219
Chatigny, M. A., 191. See Goldberg, L. J.
et al., 223
Chatterjee, G., 94, 134, 219
Chauvin, R., 130, 219
Chen, C. Y., 61, 219
Cherry, E., 98. See Tervet, I. W., 234
Chester, K. S., 188, 219
Christensen, C. M., 157, 159, 194, 219. And
see Stakman, E. C., 233: atid see Swaebly,M. A., 233
Christensen, J. J., 17, 31, 181, 219
Christoff, A., 95, 219
246

7/30/2019 Microbiology of at 00 Greg
http://slidepdf.com/reader/full/microbiology-of-at-00-greg 275/286
AUTHOR INDEX
Christopher, W. N., 135. See Stakman, E. C,etal., 232
Clarenburg, L. A., 51, 219
Clark, H. E., 93, 219
Close, R., 189, 219
Cocke, E. C, 92, 93, 220
Cole, R. S., PI. 3. See Worthington, A. M.,
236
Colebrook, L., 113, 159, 160, 220
Colwell, R. N., 171, 172, 220
Combs, R., 132. See Bonnier, G., et al., 218
Committee for Apparatus in Aerobiology, 90,
98, 220
Cooper, J. P., 200. See Peterson, M. L., et al.,
229
Corbet, A. S., 108. See Fisher, R. A., et al.,
222
Cordus,v., 2
Cornet, G., 158, 220
Cotter, R. U., 136, 220
Craigie, J. H., 93, 136, 194, 202, 203, 220
Crisp, L. R., 102. See duBuy, H. G., 221
Cristiani, H., 134., 220
CrooLs, R. N., 190. See Stewart, N. G., 233
Cummins, G. B., 189, 220
Cunningham, D. D., 7, 9, 90, 96, 113, 194, 220
Curran, G. C, 135. See Stakman, E. C, et al.,
233
Cupp, H. B., 96. See Gordon, M. A., 223
Dalla Valle, J. M., 93. See Hollaender, A., 225
Danald,G. E.,200. 5"^^ Hoggan, M. D.,etal.,
224
Darling, C. A., 128, 153, 220
Darwin, C, 13, 220
Davies, C. N., 61, 63, 96, 98, 105, 156, 220
Davies, R. R., 35, 220
de Freudenrich, M. See Freudenrich, M. de
Dickson, J. G., 178. See Johnson, A. G., 225
Dillon Weston, W. A. R. See Weston, W. A. R.
Dillon
Di Menna, M. E. See Menna, M. E. Di
Dimond, A. E., 225, 230, 233
Dobbs, C. G., 34, 220
Dobell, C, 2, 148, 220
Docters van Leeuwen, W. M. See Leeuwen,
W. M. Docters van
Dragstedt, C. A., 108. See Feinberg, S. M.,
et al., 221
Druett, H. A., 98. See May, K. R., 228
D. S. I. R., no, 220
Dubois, R., 153, 220
duBuy, H. G., 90, 93, 98, 102, 194, 221
Duchaine, J., 221
Dumas, J. B. A., 8
Durham, O. C, 12, 16, 83, 91, 99, 103, 108,
221. And see Feinberg, S. M., et a I., 221
Durrell, L. W., 165, 221
Dyakowska,J., 17, 127, 186, 221
Dye, M. H., 92, 120, 221
Ehrenberg, C. G., 13, 221
Ekelof, E., 128, 221
Ellis, F. P., 161, 221
English, H., 98. See Ogawa, J. M., 229
Erdtman,G., 17,31,41,96, 127, 146,221, 249
Evans, K. Benson-. See Benson-Evans, K.
Eyles, E. D., 36
Falck, R., 18, 21, 157, 168, 221
Feinberg, S. M., 108, 221
Ferguson, M. C, 203, 221
Fergusson, G. J., 48, 222
Fiese, M. J., 200, 222
Finney, D. J., 166, 222
First, M. W., 97, 222
Fischer, B., 125, 127, 222
Fischer, E., 46, 222
Fischer, M., 88, 148. See McCully, C. R., et
al., 227
Fisher, R. A., 45, 108, 222
Flemming,125, 134, 135,
222
Flensborg, E. W., 159, 222
Fliigge, C., 158, 181, 222
Foley, G. E., 98. See Wheeler, S. M., et al.,
235
Forbes, J.Graham, 113, 160, 222
Fos, M. v., 97. See Weinzerl, J., 235
Fontana, F., 6, 222
Fouassier, M., 148. See Trillat, A., 234
Foutin, W. M., 153, 222
Fracker, S. B., 164, 222
Frampton, V. L., 166, 222
Freudenrich, M. de, 9Francis, J. R. D., 63
Frankland, A. W., 158, 222
Frankland, P. F., 11, 92, 97, 222
Frey, C. N., 96, 222
Furcolow, M. L., 200, 222
Gardner, M. W., 194, 222
Gaumann, E., 46, 165, 189, 222. Am! see
Fischer, E., 222
Gay-Lussac, L. J., 3
Gazert, H., 152, 222Geiger, R., 22, 28, 132, 222
Geoffrey, E. F., 2
George, D. C, 123. See Heald, F. D., 224
Gilbert, G. E., 97, 222
Gill, G. C, 94, 103. See Harrington, J. B., et
al., 224
Gislen, T., 193, 222
Glaes, H., 88, 148. See McCully, C. R., et al.,
227
Glauert, M., 61, 223
Glynne, M. D., 35, 223
Goetz, A., 97, 223
Goldberg, L. J., 191, 223
Gordon, M. A., 96, 223
Graham Forbes, J. See Forbes, J. Graham
Gray, R. Whytlaw-. See Whytlaw-Gray, R.
Green, G. J., 141. See Pady, S. M., et al,
229
Green, H. L., 51, 90, 91, 96, 98, 104, 223
Gregory, M. F., 77
Gregory, P. H., 35, 53, 55-57, 60, 61, 63, 65,
66, 70-73, 75-80, 84, 86, loi, 109, no,
114, 115, 117,120, 121, 123, 151, 152, 158,
159, 163, 166, 168-70, 172, 180, 194, 202,
223. And see 'Brodk,'li. J., 218
247

7/30/2019 Microbiology of at 00 Greg
http://slidepdf.com/reader/full/microbiology-of-at-00-greg 276/286
THE MICROBIOLOGY OF THE ATMOSPHERE
Grew, N., 2
Gruby, D., 6
Guthrie, E. J., 35. See Gregory, P. H., et al.,
223
Gunn, R., 85, 223
Haas, G. J., 97, 223
Hadland, S. A., 37. See Ingold, C. T., 225
Hafsten, U., 186, 223
Hahn, M., 135, 224
Haldane, J. S., 134, 159, 160. See Carnelley,
T., 219
Hamilton, E. D., 109, no, 117, 120, 121, 123,
224. And see Gregory, P. H., et al., 223
Hamilton, L. M., 179, 187. And see Stakman,
E. C, 233
Hammond, E. C, 97, 224
Hanna, W. F., 94, 224
Hansen, E. C, 46, 224
Hansen, G. H. A., 7
Hansen, H. M., 202, 224
Hansing, E. D., 166. See Frampton, V. L.,
et al. , 222
Harrar, J. G., 188. See Stakman, E. C, 233
Harrington, J. B., 94, 103, 224
Harrison, F. C, 153, 224
Hart,T. G., 11,92. ^ff Frankland, P. F., 222
Harz, C. O., 134, 224Haskell, R. J., 136, 224
Hawes, R. C., 99, 224
Hay, M. J., 158. See Frankland, A. W., 222
Hazen, W. E., 17, 19. See Yarwood, C. E.,
236
Heald, F. D., 123, 194, 224
Heise, E. R., 136, 224
Heise, H. A., 136, 224
Henderson, D. W., 98
Henry, A. W., 135. See Stakman, E. C, et a I.,
233
Herrmann, R. G., 61, 72, 94. See Landahl,H. D., 226
Hesse, E., 128, 224
Hesse, W., 9-11, 19, 224
Hesselman, H., 92, 185, 186, 224
Hewson, E. W., 51. See Sheldon, J. M., 233
Hippocrates, i
Hirst, J. M., 29, 34, 99-102, 106-7, 1 10. 1 14)
115, 117-23, 151, 152, 158, 161, 194, 224.
And see Gregory, P. H., 223
Hochberg, S., 61. See La Mer, V. K., 226
Hoggan, M. D., 200, 224
Holladay, L. L., 178. See Luckiesh, M., et al.,
226
HoUaender, A., 90, 93, 98, 194, 225. And see
duBuy, H. G., et al., 221.
Holton, C. S., 224
Hopkins, J. C, 93, 225
Home, A. S., 20, 45, 225
Horr, W. H., 200. See Furcolow, M. L., 222
Horsfall,J. G., 166, 225, 230, 233. See
Zcntmeyer, G. A., et al., 236
Hubert, K., 137, 225
Hyde, H. A., 42, 91, 105, 115, 120, 127, 195,
225
Hyre, R. A., 91, 95, 225
Ingold, C. T., 32, 34, 37, 39, 84, 225
Ivanovski, D., 7
Jacobs, W. C, 124, 133, 194, 225
Jagger, S., 193, 225
Jamar, J. M., 221
Janowski, T., 152, 225
Jennison, M. W., 158, 225
Jensen, J., 179, 225
Jensen, T. Samsoe-. See Samsoe-Jensen, T.
Johnson, A. G., 178, 225
Johnson, C. G., 133, 225
Johnstone, H. F., 83, 85, 225. And see Ranz,
W. E., 231; and see Wong, J. B., et al., 235
Jones, L. K., 122. See Keitt, G. W., 226
Jones, M. D., 42, 179, 225
Jones, T. D., 98. See Wheeler, S. M., et al.,
235
Kabat, E. A., 198. See Rosebury, T., et al.,
232
Kapica, L., 141-4, 146, 147. See Pady, S. M.,
229
Karman, T. von, 51
Keitt, G. W., 96, 122, 226. And see Frey, C. N.
222
Kelly, C. D., 104, 105, 134, 140-5, 226. And
see Pady, S. M., 229; and see Polunin, N.,230
Kerner von Marilaun, A. See Marilaun,
Kerner von
Kingsolver, C. H., 179. See Schmitt, C. G.,
et al., 232
Kinzer, G. D., 85. See Gunn, R., 223
Kitsato, S., 7
Knight, T. A., 2
Knoll, F., 17, 226
Knowles, T., 99, 104. See Luckiesh, M., et al.,
226
Knuth, P., 71, 226Koch, L., 7, 10
Koelreuter, J. G., 2
Kordyum, V. A., 94, 226
Kramer, C. L., 115, 120, 122, 226
Krongelb, G. S., 190. See Raper, J. R., et al.,
231
Kulp, W. L., 160. See Ruehle, G. L. A., 232
Kursanov, L. I., 46, 226
Lackey, M. D., 90, 93, 98, 194. See duBuy,
H. G., et al., 221
Lambert, E. R., 178, 226
La Mer, V. K., 61, 226
Landahl, H. D., 61, 72, 94, 226
Lane, W. R., 51, 90, 91, 96, 98, 104. See
Green, H. L., 223
Langer, G., 88, 148. See McCully, C. R., et
al., 227
Langmuir, I., 60, 61, 65, 85-88, 226
Large, E. C, 6, 226
Last, F. T., 115, 121, 151, 152, 158, 165, 226.
And see Gregory, P. H., et al., 223
Laws, J. O., 148, 226
Lavie, P., 130. See Chauvin, R., 219
Leacey, D., 165. See Davies, C. N., et al., 220
248

7/30/2019 Microbiology of at 00 Greg
http://slidepdf.com/reader/full/microbiology-of-at-00-greg 277/286
AUTHOR INDEX
Leeuwen, W. M. Docters van, 184, 226
Leeuwenhoek, A. van, 2, 3, 91, 148
Lemon, H. M., 98. See Moulton, S., et al.,
228
Levin, 128, 226
Lewis, W., 61, 63. See Brun, R.J.,
et al., 218
Libby, W. F., 88, 190, 226
Lidvvell, O. M., 99, 155, 156, 160, 226. And
see Bourdillon, R. B., et al., 218
Limasset, P., 178, 226
Lindbergh, C. A., 137
Lindner, G., 149, 226
Linn, M. B., 283. See Frampton, V. L., et al.,
222
Lipscomb, B. R., 189. See Wood, J. L., 235
Lister, J., 20
Loeffler, F., 7
Long, H. W., 181, 226Long, W. H., 35, 226
Longhurst, T., 55-57, 78-80
Lovelock, J. E., 155, 156, 160. See Bourdillon,
R. E.,etal.,2i%
Lowe, C. W., II, 97. 6'tvBuller, A. H. R., 219
Luckiesh, M., 99, 104, 226
Lucretius, i, 12
Ludi, W., 92, 227
Ludlam, F. H., 28, 227
Lurie, H. I., 103, 160, 227
Lussac, L. J. Gay-. See Gay-Lussac, L. J.
McCabe, L. C, 219
McCallan, S. E. A., 165, 227
McCubbin, W. A., 17, 18, 200, 227
McCully, C. R., 88, 148, 228
McFarlan, A. M., 160. See Bourdillon, R. B.
et al., 218
McKeehan, L. W., 15-17. SeeZi[tny, J., 236
MacLachlan, J. D., 136, 227
McLean, A. L., 152, 153, 228
McLean, R. C, 147, 197, 228
MacQuiddy, E. L., 136, 227
Machta, L., 29, 227
Maddox, R. L., 7, 9, 95, 113, 227
Malik, M. M. S., 152, 227
Marilaun, A. Kerner von, 41, 42, 227
MarshaU Ward, H. See Ward, H. Marshall
Martin, W. J., 94, 227
Mason, B. J., 27, 88, 227
Mason-Williams, A., 160, 227
Mathews, H. M., 92, 125. See ZoBell, C. E.,
236
Matruchot, L., 132. See Bonnier, G., et al.,
218
Maunsell, K., 108, 120, 159, 194, 201, 227
May, F. G., 88, 227
May, K. R., 62, 96, 98, 99, 227
Mayne, W. W., 93, 227
Mehta, K. C, 93, 94, 134, 188, 228
Meier, F. C, 135-7, 193, 228. .4thhee Rogers,
L. A., 232
Menna, M. E. Di, 92, 120, 228
Mer, V. K. La. See La Mer, V. K.
Micheli, P. A., 2
Miles, A. A., 158. See Wilson, G. S., 235Miller, H., 99. See Hawes, R. C, et al., 224
Minervini, R., 149, 228
Miquel, P., 8-10, 96, 106, 109-14, 117, 124,
125, 127, 129, 131, 132, 134, 148, 149, 159-
61, 228
Mischustin, E., 136, 228
Molisch, H., 146, 228
Monteith,J.
L., 25, 228
Moreau, M., 10, 124
Moulton, S., 98, 114, 155, 194, 228
Nageli, C. von, 46, 228
Naumov, N. A., 181, 228
Needham, J. T., 3
Neisser, A., 7
Newell, L. C, 42, 179. See]onts, M. D., 225
Newhall, A. G., 178, 228
Newman, L V., 94, 146, 228
Nicolaier, A., 7Nilsby, J., 159, 228
Nitimargi, N. W., 45
O'Connell, D. C, 105, 228
Ogawa, J. M., 98, 229
Olien, C. R., 165. See Rowell, J. B., 232
Oliver, F. W., See Marilaun, A. K. von
Oort, A. J. P., 93, 104, 178, 229
Oparin, A. L, 3, 204, 229
Ouye, L. G., 115. See Kramer, C. L., et al.,
226Overeen, M. M. van, 97, 109, 140, 149, 150,
199,229
Pady, S. M., loi, 104, 105, 115, 120, 122, 140-
7, 229. And see Kelly, C. D., 226; and see
Kramer, C. L., 226; and see Polunin, N.,
230
Palmen, E., 29, 229
Panzer, J. D., loi, 117, 119, 229
Pappagianis, D., 200. See Hoggan, M. D., 224
Pape, H., 166, 229
Parker, B. W., 138, 139, 147. See Proctor,
B. E., 231
Parker, J. H., 165. See Durrell, L. W., 221
Parker-Rhodes, A. F., 180, 229
Pasquill, F., 182, 229
Pasteur, L., 3-7, 12, 20, 45, 91, 97, 131, 229
Patterson, H. S., 85. See Whytlaw-Gray, R.,
235
Pearson, J. L., 169. 5'fe Bosanquet, C. H., 218
Peetz, C. v., 61, 63, 105. See Davies, C. N.,
220
Penman, H. L., 133. 5'e'f Johnson, C. G., 225
Perkins, P.J., 61, 63. See Brun, R.J., et al., 218
Perkins, W. A., 103, 229
Persson, H., 186, 187, 229
Petersen, L. J., 165, 229
Peterson, M. L., 200, 229
Petri, R. J., 97, 229
Pettersson, B., 38, 39, 93, 150, 152, 182, 186,
187, 194, 201, 230
Peturson, B., 137, 141, 230. And see Pady,
S. M., et a I., 229
Phelps, E. B., 98, 230Pike, G. F., 10=;. See O'Connell, D. C, et al..
249

7/30/2019 Microbiology of at 00 Greg
http://slidepdf.com/reader/full/microbiology-of-at-00-greg 278/286
THE MICROBIOLOGY OF THE ATMOSPHERE
Pincus, S., 98, 230
Pirie, J. H., 128, 230
Pirone, P. P. See Fontana, F., 222
Plank, J. E. van der, 165, 178, 183, 184, 230
Pohl, F., 15, 31, 230
Polunin, N., 105, 127, 128, 129, 140, 141, 186,230. And see Kelly, C. D., et al., 226; and
see Pady, S. M., et al., 229
Pontecorvo, G., 203
Popp, W., 136. See Craigie, J. H., 220
Porta, J. B., 2
Pouchet, F. A., 3, 4, 91
Priestley, J., 3
Prince, A. E., 129. See Polunin, N., et al., 231
Proctor, B. E., 129, 138, 139, 147, 231
Puck, T. T., 98. See Moulton, S., et al., 228
Puschkarew, B. M., 109, 149, 231
Rack, K., 84, 105, 231
Rademacher, B., 166. See Pape, H., 229
Ramsbottom, J., 77, 231
Ransom, J. P., 200. See Hoggan, M. D., et
al., 224
Ranz, W. E., 85, 115, 231. And see Wong,
J. B., et al., 235
Raper, J. R., 190, 231
Raymond, W. F., 160, 161. See Bourdillon,
R. B., et al., 218; and see Ellis, F. P., 221
Read, D. R., 166. See Gregory, P. H., 223
Rempe, H., 17, 20, 21, 81, 94, 138, 194, 231
Rettger, L. F., 95, 97, 109, 231
Reynolds, O., 26
Rhodes, A. F. Parker-. See Parker-Rhodes,
A. F.
Richards, M., 92, 97, 120, 231
Richardson, L. F., 49, 54, 231
Rider, N. E., 179, 231
Ridley, H. N., 184, 231
Rishbeth, J., 83, 89, 97, 231
Rittenberg, S. C, 126, 231
Robin, C, 6
Rodina, A. G. Salimovskaja-. See Salimov-
skaja-Rodina, A. G.
Roemer, T., 179, 232
Rogers, L. A., 135, 232
Rogerson, C. T., 115, 120, 122, 232. And see
Kramer, C. L., et al., 226
Rombakis, S., 166, 168, 172, 232
Rooks, R., 200, 232
Rosebury, T., 98, 198, 232
Rosinski, M., 88, 148. See McCully, C. R., et
al., 228Rffctrup, O., 159, 232
Rowell, J. B., 165, 232
Ruehle, G. L. A., 160, 232
Rusakov, L. F., 188
Russakova, A. A. Shitikova-. See Shitikova-
Russakova, A. A.
Saccardo, P. A., 108
Saito, K., II, 92, 232
Salimovskaja-Rodina, A. G., 153, 232
Salisbury, J. H., 7, 95, 232Samsoe-Jensen,T., 159.5^^ Flensborg, E.W.,
Savulescu, T., 92, 232
Sawyer, K. F., 98, 232
Scharf, J. M., 93
Scheppegrell, W., 91, 92, 136, 232
Scherago, M., 159. See Wallace, M. E., et al.,
234Schmidt, W., 49, 56, 57, 79, 132, 133, 138,
167-9, 172, 232
Schmitt, C. G., 179, 232
Schrodter, H., 79, 168, 172, 179, 233
Schoenauer, M., 28
Schultz, E. S., 178. See Bonde, R., 218
Scorer, R. S., 28, 29, 233. And see Ludlam,
F. H., 227
Scott, R. F., 153, 233
Scrase, F. J., 170, 233
Sell, W., 60, 61, 233
Serafini, J. S., 61, 63. See Brun, R. J., et al.,
218
Sernander, R., 194, 233
Sewall Wright, See Wright, S.
Sheldon, J. M., 51, 233
Shitikova-Russakova, A. A., 95, 188, 233
Siang, W., 129, 233
Silverman, L., 97. See First, M. W., 222
Simpson, M. W., 158. See Brown, M., et al.,
218
Siple, P. A., 128, 153. See Darling, C. A., 220
Small, W. S.,gg. SeeH!iyjes,R.C., et al., 224
Smith, L. W., 61, 83. See Johnstone, H. F.,
et al., 225
Smith, R. E., 202. See Hansen, H. M., 224
Solowey, M., 113. See Buchbinder, L., et al.,
218
Soper, G. A., 160, 233
Soiotorovsky, M., 113. See Buchbinder, L.,
et al., 218
Soule, M. H., 139, 233
Spallanzani, L., 3
Spector, W. S., 36, 233
Sprengel, C. K., 2
Sreeramulu, T., 55-57, 78-80, 109, 117, 121,
123, 127, 129,233. And see Gregory, P. H.,
et al., 223
Stakman, E. C, 94, 135, 179, 187, 188, 189,
194, 233Stedman, O. J., 60, 61, 65, 66, 70, 71, 73, 75,
117, 123. See Gregory, P. H., 223; and
see Hirst, J. M., 224
Stepanov, K. M., 17, 34, 35, 52-55, 77, 80, 95,
106, 194,233
Stern, A. C., 98. See Pincus, S., 230
Stevenson, J. A., 137. See Meier, F. C, et al.,
227
Stewart, N. G., 190, 233
Stokes, G. G., 14, 15, 18, 19
Storey, I. F., 122. See Hirst, J. M., et al., 224
Sutcliffe, R. C, 22, 233
Sutton, O. G., 22, 49-51, 55, 56, 57, 77, 79,
168-70, 172, 195, 233
Swaebly, M. A., 159, 233
Sylvester, E. S., 192. See Yarwood, C. E., 236
Symons, G. J., 184, 233
Taylor, A. H., 99, 104. See Luckiesh, M., et
al., 226
250

7/30/2019 Microbiology of at 00 Greg
http://slidepdf.com/reader/full/microbiology-of-at-00-greg 279/286
AUTHOR INDEX
Taylor, G. I., 49, 132, 133, 234
Taylor, G. S., 117, 165, 170. See Waggoner,
P. E., 234
Tervet, I. W., 98, 234
Theophrastus, 2.
Thomas, J. C.,99, 160. 5^^ Bourdillon,R. B.,
et al., 218
Thompson, W. R., 163, 234
Transeau, E. N., 202, 234
Treub, M., 184, 234
Trillat, A., 147, 148, 234
Tullis,E. C, loi, 117, 119. ^ff Panzer, J. D.,
et al., 229
Turner, D. M., 94, 234
Tyndall, J., 20, 45, 81, 91, 234
Ukkelberg, H. G., 17, 234
Underwood, J. F., 179, See Schmitt, C. G.
232
U.S. Weather Bureau, 22, 179, 234
Valle, J. M. Dalla. See Dalla Valle, J. M.
van Arsdel, E. P. See Arsdel, E. P. van
van der Plank, J. E. See Plank, J. E. van der
van der Werff, P. J. See Werff, P. J. van der
van Leeuwen, W. M. Docters. See Leeuwen,
W. M. Docters vanvan Leeuwenhoek, A. See Leeuwenhoek, A.
van
van Overeem, M. M. See Overeem, M. M.
van
Vareschi, V., 92, 201, 234
Vernon, T. R., 92, 120. See Dye, M. H., 221
von Karman, T. See Karman, T. von
von Marilaun, K. See Marilaun, A. K. von
von Nageli, C. See Nageli, C. von
Vose, P. B., 200. See Peterson, M. L., et a I.,
229
Wadley, F. M., 166, 234
Waggoner, P. E., 117, 165-6, 169, 170, 177,234
Walker, G., 138, 234
Wallace, M. E., 159, 234
Wallace, P. P., 166. See Zentmeyer, G. A., et
al., 236
Walton, W. H., 98. See Sawyer, K. F., 232
Ward, H. Marshall, 93, 234
Ward, W. C, 122. 5'^f Hirst, J. M., et al., 224
Warr, B. R.,94,
103. See Harrington,J.
B.,
et al., 224
Watkins, H. M., 191. See Goldberg, L. J., et
al., 223
Watson, H. H., 85, 96, 104, 234
Way, M., 103, 160. See Lurie, H. J., 227
Weaver, R. H., 159. See Wallace, M. E., et al.,
234
Webb, S. J., 191, 234
Webster, J., 37, 234
Weinhold, A. R., 16-18, 234
Weintroub, D. J., 158, See Brown, M., et al.,
218
Weinzerl, J., 97, 235
Wellman, R. H., 165. See McCallan, S. E. A.,
227
Wells, M. W., 113. See Wells, W. F., 235
Wells, W. F.,32,98, 113, 155, 158, 181, 194,
235
Werff, P. J. van der, 92, 108, 120, 155, 194, 235Werle, D., 88, 148. See McCully, C. R., et al.,
228
Weston, W. A. R. Dillon, 136, 235
Wheeler, S. M., 98, 235
Whinfield, B., 130,235Whisler, B. A., 192, 235
Whitehouse, H. L. K., 202, 235
Whytlaw-Gray, R., 85, 235
Wiggin, N. J. B., 105. See O'Connell, D. C,et al., 228
Wilcox, H. J., 122. J'f^Hirst, J. M., et al., 224
Wilcox, J. D., 99, 235
Williams, C. B., 108, 235. And see Fisher,
R. A., et al., 222
Williams, D. A., 42, 91. See Hyde, H. A., 225
Williams, A. Mason-. See Mason-Williams
,
A.Willis,
J. C, 198, 199, 235
Wilson, E. E., 54, 55, 166, 170, 235
Wilson, G. S., 158, 235
Winsche, W. E., 61, 83, ^Sff Johnstone, H. F.,
et al., 225
Windt, L. G., 45
Winslow, C. E. A., 159, 235
Wodehouse, R. P., 41, 91, 235
Wolf, F. T., 139, 235
Wolfenbarger, D. O., 133, 166, 194, 235. And
see Wadley, F. M., 234
Wong, J. B., 61, 235. And see Ranz, W. E.,
231
Wood, J. L., 189, 235
Woodcock, A. H., 124. See Blanchard, D. C,218
Worthington, A. M., PI. 3, 236
Wright,]. W., 180,236
Wright, S., 180, 236
Yarwood, C. E., 16, 17, 19, 191, 236
Yates, A. H., 28, 236
Yersin, A., 7
Zeleny, J., 15-17, 236
Zentmeyer, G. A., 166, 236
ZoBell, C. E., 92, 124-7, 129, 149, 236
Zogg, H., 166, 185, 236
251

7/30/2019 Microbiology of at 00 Greg
http://slidepdf.com/reader/full/microbiology-of-at-00-greg 280/286
WORLD CROPS BOOKS
Man lives on plant crops, which give him his food and other wherewithal of
life. Consequently their study is of vital significance and absorbing interest—to
the student and research scientist, to the adviser and consultant, to the large-
scale cultivator and producer and to the processer and enlightened user. The
World Crops series is designed to fill a widely-felt need for general books on
individual crops or groups of crops of world importance. Each subject is tackled
on the broadest possible basis in a single volume along the three main lines of
Botany, Cultivation and Utilization, and each volume is fully documented and
profusely illustrated.
World Crops Bookswill include:
Alfalfa .
Barley
Brassicas
Coconuts
Coffee
Cucurbits .
Eucalyptus .
Flax and LinseedHops
Jute .
Mango
Mushrooms and Truffles
Onions and their allies
Peanuts
Pineapple .
Rubber
Rye .
Sweet Potatoes .
Taros and their allies
Tomatoes .
Tropical Cash Crops
Vegetable Fibres .
Wheat
L. J.Bolton
E. Aberg
C. Banga and M. Nieuwhof
V. W. D. Pieris
F. L. Wellman
T. W. Whitaker and G. N. Davies
A. R. Penfold and J. L. Willis
G. O.Searle
A. H. Burgess
B. C. Kundu
L. B. Singh
R. Singer
H. A. Jones and L. K. Mann
P. A. Oram
J.L. Collins
L. G. Polhamus
A. Melderis
J.B. Edmond
R. Cooper
J. P. Hudson
R.J.
Mcllroy
R. H. Kirby
R. F. Peterson
FURTHER TITLES INCLUDE:
Carrots, Dates, Lettuces, Maize, Potatoes, Strawberries, Tobacco, Tung,
and Vegetable Insecticides.

7/30/2019 Microbiology of at 00 Greg
http://slidepdf.com/reader/full/microbiology-of-at-00-greg 281/286

7/30/2019 Microbiology of at 00 Greg
http://slidepdf.com/reader/full/microbiology-of-at-00-greg 282/286
7/30/2019 Microbiology of at 00 Greg
http://slidepdf.com/reader/full/microbiology-of-at-00-greg 283/286

7/30/2019 Microbiology of at 00 Greg
http://slidepdf.com/reader/full/microbiology-of-at-00-greg 284/286

7/30/2019 Microbiology of at 00 Greg
http://slidepdf.com/reader/full/microbiology-of-at-00-greg 285/286

7/30/2019 Microbiology of at 00 Greg
http://slidepdf.com/reader/full/microbiology-of-at-00-greg 286/286