Embed Size (px)
Citation preview

University of South Carolina University of South Carolina
Scholar Commons Scholar Commons
Theses and Dissertations
Spring 2020
Microbiome Targeted Therapies in Gulf War Illness Microbiome Targeted Therapies in Gulf War Illness
Diana Agnes Kimono
Follow this and additional works at: https://scholarcommons.sc.edu/etd
Part of the Environmental Health Commons
Recommended Citation Recommended Citation Kimono, D. A.(2020). Microbiome Targeted Therapies in Gulf War Illness. (Doctoral dissertation). Retrieved from https://scholarcommons.sc.edu/etd/5812
This Open Access Dissertation is brought to you by Scholar Commons. It has been accepted for inclusion in Theses and Dissertations by an authorized administrator of Scholar Commons. For more information, please contact [email protected].

MICROBIOME TARGETED THERAPIES IN GULF WAR ILLNESS
by
Diana Agnes Kimono
Bachelor of Science Nelson Mandela University, 2010
Master of Science
Nelson Mandela University, 2013
Submitted in Partial Fulfillment of the Requirements
For the Degree of Doctor of Philosophy in
Environmental Health Sciences
Arnold School of Public health
University of South Carolina
2020
Accepted by:
Saurabh Chatterjee, Major Professor
Geoff Scott, Committee Member
Dwayne Porter, Committee Member
Stephen Lasley, Committee Member
Cheryl L. Addy, Vice Provost and Dean of the Graduate School

ii
© Copyright by Diana Agnes Kimono, 2020 All Rights Reserved.

iii
DEDICATION
To my beloved parents, Mrs. Rachel Wamburu and Mr. Perez Wamburu. And to my
amazing husband William Akoto. Without you, I do not think I could have achieved this.

iv
ACKNOWLEDGEMENTS
I would like to offer my sincere gratitude to my supervisor, Dr. Saurabh Chatterjee
for his steadfast support and advisement. I would also like to thank my PhD committee
members: Dr. Geoff I. Scott, Dr. Dwayne Porter and Dr. Stephen Lasley, for their valuable
insights and support in my work.
My lab mates Dr. Muayad Albadrani and Dr. Sutapa Sarkar for being more than
just workmates but a much-needed support system and family. I would also like to thank
my colleagues Dr. Ratanesh Seth, Mr. Dipro Bose, Dr. Ayan Mondal, and Punnag Saha for
helping me in the laboratory.
Am grateful to my husband who has been my rock when this journey was difficult
and loved me unconditionally through it all. To my son Liam, his love is a soothing balm.
To my mom, dad and siblings who have celebrated all my achievements regardless of their
size, and always wished me the best. And finally, to my friends, who know my journey and
kept reminding me to march forward to the goal. Thank you.
v
ABSTRACT
Gulf war illness (GWI) is a chronic multisymptomatic disorder affecting about
30% of veterans of the 1990-1991 Persian Gulf war. Affected veterans complain of chronic
symptoms which begun during or shortly after the war and persist 30 years later. This
dissertation is a report of three studies which use a murine model to investigate the
microbiome as a therapeutic target in GWI. Mice were exposed to pesticides and the
prophylactic drug pyridostigmine bromide (PB) and studied these chemical’s impact on the
microbiome in both an acute and persistence model of GWI.
The first study looks at the effect of altered microbiome on metabolism and
proposes short chain fatty acids as a therapy for GWI. Results show that mice exposed to
GWI showed toll like receptor activation, inflammation and metabolic reprogramming in
the liver. These symptoms were alleviated with sodium butyrate, a short chain fatty acid.
The second study looked at the effect of altered microbiome on the enteric nervous system
and proposes the use of SsnB a TLR4 antagonist in combination with sodium butyrate as
a possible therapy. Results show that mice which were treated with GW chemicals had
reactive enteric glia which produced reactive oxygen species and proinflammatory
cytokines, thereby modulating the expression of tight junction proteins in the intestine.
Further, administration of SsnB and butyrate led improved EGC states and therefore
improving tight junction protein integrity. The third study looks at the altered microbiome
vi
in the persistence of GWI neurological symptoms. Results show that mice exposed to GW
chemicals presented with decreased relative abundance of Akkermansia muciniphila, a
probiotic bacterium associated with good health, and this correlated with HMGB1 levels,
neuroinflammation and neurotrophins level such as BDNF which are key players in
maintaining neurological health

vii
TABLE OF CONTENTS
DEDICATION ................................................................................................................... iii
ACKNOWLEDGEMENTS ............................................................................................... iv
ABSTRACT .........................................................................................................................v
LIST OF TABLES ........................................................................................................... viii
LIST OF FIGURES ........................................................................................................... ix
CHAPTER 1: INTRODUCTION ........................................................................................1 CHAPTER 2: INCREASED BUTYRATE PRIMING IN THE GUT STALLS MICROBIOME ASSOCIATED GASTRO-INFLAMMATION AND HEPATIC METABOLIC REPROGRAMMING IN A MOUSE MODEL OF GULF WAR ILLNESS..............................................................................................................................6 CHAPTER 3: DYSBIOSIS-ASSOCIATED ENTERIC GLIAL CELL IMMUNE ACTIVATION AND REDOX IMBALANCE MODULATE TIGHT JUNCTION PROTEIN EXPRESSION IN GULF WAR ILLNESS PATHOLOGY ............................41 CHAPTER 4: HOST AKKERMANSIA MUCINIPHILA ABUNDANCE CORRELATES WITH GULF WAR ILLNESS SYMPTOM PERSISTENCE VIA NLRP3 MEDIATED NEUROINFLAMMATION AND DECREASED BRAIN DERIVED NEUROTROPHIC FACTOR ............................................................................................................................89 CHAPTER 5: CONCLUSION ........................................................................................120
REFERENCES ................................................................................................................123
APPENDIX A: PERMISSION TO REPRINT CHAPTERS ..........................................138

viii
LIST OF TABLES
Table 2.1 Real time PCR primer sequences.......................................................................17
Table 3.1. Rat Primer sequences ........................................................................................53
Table 4.1 Primer sequences ...............................................................................................98

ix
LIST OF FIGURES
Figure 1.1 Summary of all three projects discussed ........................................................5
Figure 2.1. Gut microbiome alteration in mice model of Gulf War Illness (GWI) .......33
Figure 2.2. Change in gut microbiome in GWI alter niacin receptor (GPR109A) and tight junction proteins in the intestine.............................................................................34
Figure 2.3. Sodium butyrate priming in a rodent model of GWI attenuates TLR4 activation in the small intestine ......................................................................................35
Figure 2.4. Sodium butyrate priming in a rodent model of GWI improves proinflammatory phenotype in small intestine mediated by the TLR4 pathway ............36
Figure 2.5. Sodium butyrate treatment in GWI improves circulatory DAMPs .............37
Figure 2.6. Sodium butyrate treatment in a rodent model of GWI attenuates TLR4 activation in Liver ...........................................................................................................38
Figure 2.7. TLR4 activation is associated with metabolic changes and inflammatory response in the liver but the phenotypic liver injury is predominantly absent ...............39
Figure 2.8. TLR4 drives the metabolic alterations in GW-chemical exposed liver ......40
Figure 3.1. Altered microbiome associated increase PAMPS and DAMPS ..................71
Figure 3.2. Altered microbiome induced change in EGC phenotype to a reactive phenotype ........................................................................................................................72
Figure 3.3. Expression of Toll-like receptors in small intestine and EGC ....................73
Figure 3.4. Expression of S100B and RAGE in the small intestine ..............................74
Figure 3.5. Formation of S100B/RAGE complex in small intestine .............................75
Figure 3.6. Activation of NOS-2 in small intestine .......................................................76
Figure 3.7: Exposure to DAMPS and PAMPS cause activation of TLR4 in EGC .......77
Figure 3.8. EGC exposed to LPS or HMGB-1 change to a reactive phenotype ............78
Figure 3.9. Activation of inducible nitric oxide synthase by LPS or HMGB-1 ............79

x
Figure 3.10. NADPH oxidase 2 and peroxynitrite mediated oxidative stress in vivo ...80
Figure 3.11. NADPH oxidase 2 activation in rat EGC ..................................................81
Figure 3.12. Peroxynitrite formation in EGC ................................................................82
Figure 3.13. ROS mediated activation of NLRP-3 inflammasome and inflammation in EGC ...............................................................................................................................83
Figure 3.14. DNA fragmentation of rat EGC ................................................................84
Figure 3.15. Expression of claudin 2, occludin and aquaporin 3 in mouse small intestine ...........................................................................................................................85
Figure 3.16. Protein expression of aquaporin 3, claudin 2 and occludin in intestinal epithelial cells .................................................................................................................86
Figure 4.1. Exposure to GW chemicals results in decreased relative abundance of Akkermensia muciniphila and chronic high levels of circulatory HMGB1 ..................112
Figure 4.2. Exposure to GW chemicals is associated with altered claudin 5 levels in the frontal cortex .................................................................................................................113
Figure 4.3. Activation of Macrophages and associated HMGB1/RAGE complex formation .......................................................................................................................114
Figure 4.4. Increased ROS is associated with NLRP3 inflammasome activation .......115
Figure 4.5. GW chemical exposure is associated with chronic neuroinflammation and decreased Brain derived neurotrophic factor (BDNF) levels in Frontal cortex ............116
Figure 4.6. Decreased relative abundance of Akkermansia muciniphila correlates with IL-1β and BDNF levels in the frontal cortex ................................................................117
Figure 4.7. Deletion of NLRP3 is associated with decreased neuroinflammation and lower BDNF levels .......................................................................................................118
Figure 4.8. Serum Endotoxin levels in GW chemical treated mice (GWP) compared to the vehicle control (CONT) only treated mice .............................................................119

1
CHAPTER 1
INTRODUCTION
Gulf war illness is a chronic multisymptomatic disorder affecting about
30% of veterans of the 1990-1991 Persian Gulf war (1)(2) (3). Affected veterans complain
of acute and chronic symptoms which begun during or shortly after the war and still persist
30 years later (1)(3)(2)(4). These symptoms include fatigue, muscle pain, cognitive
problems, insomnia, rushes, gastrointestinal problems etc. Gulf war illness has particularly
been a challenge because although veterans complain of the above symptom, there is no
significant clinical pathology that can be medically detected (4). For many years, this
challenge resulted in the disorder being dismissed as post-traumatic stress disorder (PTSD)
or other psychological problems that the veterans may have developed due to the war
(1)(2). However, in the last 15 years, epidemiological studies have established a compelling
link between GWI with environmental and chemical exposures that occurred shortly before
(in preparation for the war) or during the war. These exposures include vaccines, desert
storm dust, depleted uranium, combustion products from oil wells, pesticides and
prophylactic drugs(5).
Currently, research is focused on understanding the mechanisms that drive this
disorder by studying veteran cohorts, using animal models and invitro work. Other studies

2
are also aiming to determine possible therapies to relieve affected veterans of these
discomforts (6).
To date, our lab research on GWI focusses on the role of the microbiome in GWI.
The microbiome consists of all the microorganisms in the gastrointestinal tract (7). The gut
is populated by billions of microorganisms which exist in symbiotic and commensal
relations with their host. These can be bacteria, viruses, fungi, protozoans etc. These
microorganism populations affect the health and influence disease states of their host
(8)(9)(10)(11). Although the mechanisms by which they influence health are not fully
understood, it is now known that these microorganisms act through. Enabling digestion of
complex foods eg xyloglucans to release nutrients eg short chain fatty acids (12) anti-
inflammatory substances, manufacture of vitamins (13) etc. They also produce and
consume signaling molecules which can be detected by the brain eg neurotransmitters such
as gama amino butyric acid (GABA), dopamine, serotonin etc which are important in
neurological health (14). For example, the study by Vogt et al found elevated levels of the
gut microbiota metabolite trimethylamine N oxide in cerebral spinal fluid of AD patients
(15), which is a known risk factor for the disease. Another study found that key metabolites
had been altered (amino acids and fatty acids) significantly in IBS patients stools and this
correlated with the observed dysbiosis (16). With this critical role of the microbiome in
health and chronic disease, we investigated its role in driving and influencing GWI
pathology.
This dissertation is a report of three studies which use a murine model to
investigate the microbiome as a therapeutic target in GWI. We exposed mice to pesticides
and the prophylactic drug pyridostigmine bromide (PB) and studied these chemical’s

3
impact on the microbiome. Although animal models of GWI still remain imperfect, this
model is generally accepted because it is known that GW veterans were exposed to a wide
range of pesticides eg permethrin, deet etc. These chemicals were applied to the veteran’s
uniforms and tents and skin to protect them from insects while in the war.
Permethrin, which we use in our study is a pyrethroid which acts on the central
nervous system as a neurotoxin by disrupting sodium channels in neurons of insects
resulting in paralysis. In small quantities, it is not significantly toxic to humans and larger
animals, however, to insects it is lethal since they are unable to metabolize this chemical
quickly. We also used a pyridostigmine bromide (PB) an investigational product (at that
time) which was supplied as prophylactic drug to GW warriors to protect them from the
harmful effects of nerve agents eg sarin gas. About 250, 000 personnel reported having
used the drug in the GW at a dosage of 30 mg per 8 hours. However, there was some
variation because the drug was self-administered, and some people could have consumed
more or less than required. It is a reversible inhibitor of acetylcholinesterase (AchE), an
enzyme which is targeted by nerve agents which irreversibly bind AchE (17).
Generally, we hypothesized that exposure to GW chemicals led to altered
microbiome alterations which fuels inflammation in the gut and other organs. This is
through the release of Damage associated molecular patterns (DAMPs) and pathogen
associated molecular patterns (PAMPs) which escape the gastrointestinal tract and leak out
into the circulation through compromised gut barrier integrity.
The first study looks at the effect of an altered microbiome on metabolism and also
proposes short chain fatty acids as a therapy for GWI. We found that mice exposed to GWI

4
showed toll like receptor activation, inflammation and metabolic reprogramming in the
liver. These symptoms were alleviated with sodium butyrate which acted through its
receptor (18).
The second study looked at the effect of the altered microbiome on the enteric
nervous system (ENS) and proposes the use of sparstolonin B (SsnB) a TLR4 antagonist
in combination with sodium butyrate as a possible therapy. We found that mice which were
treated with GW chemicals had reactive enteric glia which produced reactive oxygen
species (ROS) and proinflammatory cytokines, thereby modulating the expression of tight
junction proteins and aquaporins in the small intestine. In our previous studies we had
found that poor gut integrity was an important symptom in GWI and is the likely portal for
immunostimulatory particles to reach other distant organ beyond the gut. We also found
that administration of SsnB and butyrate led improved EGC states and therefore improving
tight junction protein integrity (19).
The third study looks at the altered microbiome in the persistence of GWI
symptoms. Using a persistence model of GWI, we found that mice exposed to GW
chemicals presented with decreased relative abundance of Akkermansia muciniphila, a
probiotic bacterium associated with good health, and this correlated with HMGB1 levels,
neuroinflammation and neurotrophins level such as BDNF which are key players in
maintaining neurological health. Figure 1 is a graphical summary of these three studies.

5
Figure 1.1. Summary of all three projects discussed. Exposure to GW chemicals results in microbiome alterations (dysbiosis) with increased DAMPs and PAMPS, inflammation and a leaky gut (leaky gut is shown by dotted red line). DAMPs eg HMGB1 and PAMPs eg LPS cross into the blood stream reaching distant organs such as the liver and the brain. This drives inflammation and associated symptoms such as carbohydrate and fat metabolic reprograming in liver, decrease in neurotrophin levels e,g brain derived neurotrophic factor (BDNF) in the brain. Brown boxes represent organs/systems on which research was focused, blue boxes list pathological markers and findings of studies white boxes represent conclusions and our thoughts for future studies. Abbreviations used GW (Gulf war), PB
(pyridostigmine bromide), DAMPs (Damage associated molecular patterns) PAMPs
(Pathogen associated molecular patterns), LPS (lipopolysaccharides), HMGB1 (High
mobility group box 1 protein), ROS (reactive oxygen species), GI (gastrointestinal), CNS
(central nervous system), BBB (blood brain barrier), BDNF (Brain derived neurotrophic
factor)
6
CHAPTER 2
INCREASED BUTYRATE PRIMING IN THE GUT STALLS MICROBIOME
ASSOCIATED-GASTROINTESTINAL INFLAMMATION AND HEPATIC
METABOLIC REPROGRAMMING IN A MOUSE MODEL OF GULF WAR
ILLNESS1
1 Seth, R. K#., Kimono, D#., Alhasson, F., Sarkar, S., Albadrani, M., Lasley, S. K.,
Horner, R., Janulewicz, P., Nagarkatti, M., Nagarkatti, P., Sullivan, K., & Chatterjee, S.
(2018). Increased butyrate priming in the gut stalls microbiome associated
gastrointestinal inflammation and hepatic metabolic reprogramming in a mouse model of
Gulf War Illness. Toxicology and applied pharmacology, 350, 64–77.
https://doi.org/10.1016/j.taap.2018.05.006 # authors contributed equally
Reprinted here with permission of publisher

7
Running Title: Butyrate priming and metabolic reprogramming in GWI
Key words: Permethrin, Pyridostigmine bromide, Gut dysbiosis, TLR4, Claudin-2, Cytokines
Author for correspondence:
*Dr. Saurabh Chatterjee, Ph.D. Environmental Health and Disease Laboratory, NIEHS
Center for Oceans and Human Health on Climate Change Interactions, Department of
Environmental Health Sciences, University of South Carolina, Columbia 29208 USA.
Email: [email protected]; Tel: 803-777-8120; Fax: 803-777-3391
Grant support
This work was supported by a pilot funding received from the Gulf War Illness Research
Consortium to Saurabh Chatterjee (Parent DOD grant # W81XWH-13-2-0072, PI: Dr.
Kimberly Sullivan) and P01AT003961 (Project 4) to Saurabh Chatterjee, P01AT003961,
P20GM103641, R01AT006888, R01ES019313, R01MH094755 and VA Merit
Award BX001357 to Mitzi Nagarkatti and Prakash S. Nagarkatti.

8
ABSTRACT
Most of the associated pathologies in Gulf War Illness (GWI) have been ascribed
to chemical and pharmaceutical exposures during the war. Since an increased number of
veterans complain of gastrointestinal (GI), neuroinflammatory and metabolic
complications as they age and there are limited options for a cure, the present study was
focused to assess the role of butyrate, a short chain fatty acid for attenuating GWI-
associated GI and metabolic complications. Results in a GWI-mouse model of permethrin
and pyridostigmine bromide (PB) exposure showed that oral butyrate restored gut
homeostasis and increased GPR109A receptor copies in the small intestine (SI). Claudin-
2, a protein shown to be upregulated in conditions of leaky gut was significantly decreased
following butyrate administration. Butyrate decreased TLR4 and TLR5 expressions in the
liver concomitant to a decrease in TLR4 activation. GW-chemical exposure showed no
clinical signs of liver disease but a significant alteration of metabolic markers such as
SREBP1c, PPAR-α, and PFK was evident. Liver markers for lipogenesis and carbohydrate
metabolism that were significantly upregulated following GW chemical exposure were
attenuated by butyrate priming in vivo and in human primary hepatocytes. Further, Glucose
transporter Glut-4 that was shown to be elevated following liver complications were
significantly decreased in these mice after butyrate administration. Finally, use of TLR4
KO mice completely attenuated the liver metabolic changes suggesting the central role of
these receptors in the GWI pathology. In conclusion, we report a butyrate specific
mechanistic approach to identify and treat increased metabolic abnormalities in GWI
veterans with systemic inflammation, chronic fatigue, GI disturbances, metabolic
complications and weight gain.

9
2.1. INTRODUCTION
Gulf War Illness (GWI) has been characterized as a chronic multi-symptom illness
with pathology that includes neuronal inflammation leading to cognitive deficiencies,
chronic fatigue, joint and muscle pain and gastrointestinal complications (3)(20). GWI
research has identified toxicant chemical exposures in the war theater including sarin nerve
gas, pyridostigmine bromide (PB) anti-nerve gas pills, insecticides and insect repellents, to
be prime reasons for most symptoms reported by the veterans (3). A study of military
pesticide applicators from the GW recently reported increased cognitive decrements in
attention, memory and information processing speed in veterans with combined exposures
to PB, pesticides and insect repellents (21). Animal models of GWI have also shown
chronic impairment in learning and memory, fatigue and gastrointestinal dysfunction when
exposed to GW-relevant chemicals including PB, pesticides and the insect repellent
permethrin (22)(23). GWI has emerged as a primarily neuroimmune disorder with greater
inflammatory effects noted when GW-relevant toxicants were combined with
corticosterone in animal models to mimic the physical and mental stressors of war
deployment (24). However the basis of gastrointestinal complications and parallel
networks for neuronal complications have remained largely elusive (25) (26)(25). Though
the larger epidemiological studies list GI complications as a major health problem in only
a subset of GW veterans, there are hardly any reports that show hepatic metabolic
disturbances as a widely reported symptom (3);(27). This may be due to the silent nature
of the presentation of these symptoms and unknown links to a wider systemic complication
in GW veterans following sedentary lifestyles/physical disabilities/diet/aging over a longer
period of time (28). However, with increased incidences of obesity and persistence of
10
symptoms in GW-veterans and the US population in general, the causes, outcomes, and
extent of metabolic disturbances can no longer be ignored. The long-ranging implications
of such silent changes in the GI tract and the liver following chemical exposure form the
basis of the present study.
We have shown recently the unambiguous role of the gut microbiome in causing
neuronal inflammation largely due to gut leaching and systemic endotoxemia (29). The
altered gut bacterial signature obtained following Gulf War chemical exposure caused a
TLR4-linked inflammatory surge in the GI tract and could be traced in the frontal cortex
(29). The observations reported paved the way for newer investigations into wider systemic
inflammatory complications in extraneuronal organs that might not have a clear phenotype
yet may be a basis for multisymptomatic illness as described in GWI.
GWI is also characterized by the presence of chronic fatigue. Most classifications
in the past have listed chronic fatigue as one of the most widely reported symptom burdens
in GW veterans (20)(30) . Interestingly, changes in the microbiome of affected patients
with chronic fatigue syndrome/fibromyalgia have been strongly associated with the causes
of this illness (31)(32). Chronic fatigue is also strongly linked to widescale changes both
in the gut bacteria and the systemic metabolism with the latter believed to have roots in the
liver though skeletal muscles also play a major role (33). Persistent alteration of liver
metabolism following changes in gut microbiome and its subsequent effects on systemic
metabolism may affect the development of chronic fatigue via the altered availability of
NADPH, ATP, and cofactors for various biochemical pathways (33).

11
Most chronic liver diseases like fatty liver disease and biliary fibrosis are silent in
a presentation at the clinic and remain asymptomatic until it reaches an irreversible stage.
Nonalcoholic fatty liver disease or cholestatic liver disease have chronic fatigue as one of
the symptoms (34). The fatigue associated with these silent liver complications have been
assigned to lipotoxicity, insulin and leptin resistance, endocrinopathies and metabolic
syndrome (35). Interestingly, we have shown that environmental chemicals alter liver
metabolism by increasing glucose transporters in the liver fibroblasts, elevating
expressions of PPAR-α, PFK and decreasing PPAR-γ levels with a concomitant rise in
leptin (36). These changes in the liver have been associated with an altered microbiome
following consumption of a diet rich in high fat and low fiber for a long period of time at
least in the murine models (37)(38).
With strong emphasis on the altered microbiome being associated with pathologies
of inflammatory bowel disease, chronic liver disease, chronic fatigue syndrome and
neuronal complications (all have an inflammatory component) via the gut-brain axis, it is
important that studies be focused on bacterial metabolites within the gut that might be
linked to some or all the pathways that link these systemic complications. Interestingly,
GWI patients present significant symptoms that resemble some or all these in the clinics.
Thus bacterial metabolites like butyric acid, propionic acid and acetate need to be
considered as molecules of interest in treating multiple symptoms of GWI since these
molecules have shown promising results in the clinic to cure IBD and dysbiosis related
complications (39) (40)(41). Further, Butyrate-producing bacteria such as Roseburia
species supplementation rescued patients from IBD (41). Butyrate, in particular, is a short
chain fatty acid (SCFA) that primarily interacts with the GPR109A and is an

12
immunosuppressant widely known to increase T-regulatory cells in the intestine and a
prominent HDAC1 inhibitor (42)(43).
The present study tests the hypothesis that GW chemical exposure causes a
decrease in butyrate-producing bacteria and concomitant butyrate priming in the gut
through oral supplementation attenuates GI inflammation, gut leaching and metabolic
abnormalities in the liver and higher systemic leptin levels. The study uses state of the art
genomic approaches and an oral priming by butyrate for elucidating genus-specific changes
in gut bacteria, and human hepatocytes treated with an insect repellent permethrin, (used
in Gulf War theater) for mechanistic investigations.
2.2. MATERIALS AND METHODS
2.2.1. Materials
Pyridostigmine bromide (PB), Permethrin (Per), Lipopolysaccharides (LPS),
Corticosterone and Sodium butyrate (NaBT) were purchased from Sigma-Aldrich (St.
Louis, MO). Anti-claudin-2, anti-occludin, anti-TLR4, anti-flotillin, anti-HMGBl, anti-
Leptin and anti-IL1β primary antibodies were purchased from Abeam (Cambridge, MA).
Anti-TLR5 primary antibody was purchased from Santacruz Biotechnology (Dallas, TX).
Species-specific biotinylated conjugated secondary antibodies and Streptavidin-HRP
(Vectastain Elite ABC kit) were purchased from Vector Laboratories (Burlingame, CA).
Fluorescence-conjugated (Alexa Fluor) secondary antibodies, ProLong Gold antifade
mounting media with DAPI were purchased from Thermofisher Scientific (Grand Island,
NY) and all other chemicals which were used in this project purchased from sigma only if
otherwise specified. Paraffin-embedding of tissue sections on slides were done by AML

13
laboratories (Baltimore, MD). Microbiome analysis was done by Second Genome, the
microbiome company (San Francisco, CA).
2.2.2. Animals
Adult wild-type male (C57BL/6J mice) and adult mice that contained the disrupted
TLR4 gene (TLR4 KO) (B6·B10ScN-Tlr4lps-del / JthJ) were purchased from the Jackson
Laboratories (Bar Harbor, ME). Mice were implemented in accordance with NIH guideline
for human care and use of laboratory animals and local IACUC standards. All procedures
were approved by The University of South Carolina at Columbia, SC. Mice were housed
individually and fed with chow diet at 22–24 °C with a 12-h light/ 12-h dark cycle. All
mice were sacrificed after animal experiments had been completed. Right after anesthesia,
blood from the mice was drawn using cardiac puncture, in order to preserve serum for the
experiments. The mice liver was collected for further experiments immediately after
terminal euthanasia. Fecal pellets and luminal contents were collected from the animals,
followed by dissection of the small intestine. The tissues were fixed using 10% neutral
buffered formalin. Distal segments of small intestines were used for the staining and
visualizations.
2.2.3. Rodent model of Gulf War Illness (GWI)
Mice were exposed to Gulf War chemicals based on established rodent models of
Gulf War Illness with some modifications (25)(44). The treated wild-type mice group
(GWI) and treated TLR4 KO mice group (TLR4 KO) were dosed triweekly for one week
with PB (2 mg/kg) and Permethrin (200 mg/kg) via the oral route. After completion of
PB/Permethrin dosages, mice were administered corticosterone intraperitoneally (i.p.) with

14
a dose of 100 μg/mice/day for 5 days of the week for one week. The dose of corticosterone
was selected from the study which exposed mice to 200mg/L of corticosterone through
drinking water. The i.p. dose of corticosterone had similar immunosuppression as
examined by low splenic T cell proliferation (data not shown). The vehicle control group
(Veh) of mice received saline injections and vehicle for oral gavage in the same paradigm.
Another group of wild-type mice was exposed with PB, Permethrin and corticosterone
similar to GWI group of mice and co-exposed with sodium butyrate (GWI + NaBT) 10
mg/kg via the oral route.
2.2.4. Microbiome analysis
Fecal pellets and luminal contents were collected from the animals of each group
after sacrifice and then sent to Second Genome and School of Medicine, the University of
South Carolina for microbiome analysis. The second Genome performed nucleic acid
isolation with the MoBio PowerMag Microbiome kit (Carlsbad, CA) according to
manufacturer’s guidelines and optimized for high-throughput processing V3-V4
sequencing and bioinformatic analysis.
2.2.5. Cell culture
Freshly isolated primary human hepatocytes were obtained from Liver Tissue Cell
Distribution System, University of Minnesota, Minneapolis, MN. Plated hepatocytes were
maintained in DMEM media supplemented with 10% FBS until treated. Cells were then
serum starved in DMEM supplemented with 1.5% FBS for 8h and exposed to vehicle
control and chemicals. Cells were then treated with vehicle (Veh Cont), LPS (1 μM), LPS

15
+ NaBT (LPS 1 μM and Sodium Butyrate 0.2mg/mL) for 24 h. After experiment cells were
harvested for mRNA extraction and gene expression analysis.
2.2.6. Laboratory methods
Immunohistochemistry
The distal part of small intestine was collected from mice and fixed in 10% neutral
buffered formalin. The fixed tissues swiss rolled, paraffin embedded and cut in 5 μM thick
section. These sections were subjected to deparaffinization using a standard protocol.
Epitope retrieval solution and steamer (IHC-Word, Woodstock, MD) were used for epitope
retrieval for deparaffinized sections. 3% H2O2 was used for the recommended time to block
the endogenous peroxidase. After serum blocking, the tissue was incubated overnight at
4.0 °C with primary antibody IL1β. Species-specific biotinylated conjugated secondary
antibodies and streptavidin conjugated with HRP were used to implement antigen-specific
immunohistochemistry. 3,3′-Diaminobenzidine (DAB) (Sigma Aldrich, St Louis, MD) was
used as a chromogenic substrate. Mayer’s Hematoxylin solution (Sigma Aldrich) was used
as a counterstain. Sections were washed between the steps using phosphate buffered saline
1×. Finally, stained sections were mounted with Simpo-mount (GBI laboratories, Mukilteo,
WA). Tissue sections were observed using Olympus BX51 microscope (Olympus,
America). Cellsens software from Olympus America (Center Valley, PA) was used for
morphometric analysis of images.
Immunofluorescence staining
Paraffin-embedded distal part of the small intestine or liver sections were
deparaffinized using a standard protocol. Epitope retrieval solution and steamer were used

16
for epitope retrieval of sections. Primary antibodies such as anti-Claudin-2, anti-Occludin,
anti-GPR109A, anti-TLR4, anti-Flotillin, and anti-TLR5 were used at the recommended
dilution. Species-specific secondary antibodies conjugated with Alexa Fluor (633-red and
488-green) were used at advised dilution. In the end, the stained sections were mounted
using Prolong gold antifade reagent with DAPI. Sections were observed under-Olympus
fluorescence microscope using 20×, 40× or 60× objective lenses.
Real-time quantitative PCR
mRNA expression in small intestine, liver, and human primary hepatocytes was
examined by quantitative real-time PCR analysis. Total RNA was isolated from each 25
mg liver tissue or 15 mg small intestine tissue or 1 × 10⁶ primary human hepatocytes cell
by homogenization in TRIzol reagent (Invitrogen, Carlsbad, CA) according to the
manufacturer’s instructions and purified with the use of RNeasy mini kit columns (Qiagen,
Valencia, CA). cDNA was synthesized from purified RNA (1μg) using iScript cDNA
synthesis kit (Bio-rad, Hercules, CA) following the manufacturer’s standard protocol.
Real-time qPCR (qRTPCR) was performed with the gene-specific primers using
SsoAdvanced SYBR Green Supermix and CFX96 thermal cycler (Bio-rad, Hercules, CA).
Threshold Cycle (Ct) values for the selected genes were normalized against respective
samples internal control (18S). Each reaction was carried out in triplicates for each gene
and for each sample. The relative fold change was calculated by the 2-ΔΔCt method. The
sequences for the primers used for Real-time PCR are provided in Table 1

17
Table 2.1. Real-time PCR primer sequences.
Genea Primer sequence (5′ to 3′ orientation)
MM_IL-1β Sense: CCTCGGCCAAGACAGGTCGC Antisense: TGCCCATCAGAGGCAAGGAGGA
MM_MCP-1 Sense: CACAGTTGCCGGCTGGAGCAT Antisense: GTAGCAGCAGGTGAGTGGGGC
MM_TNF-α Sense: CAACGCCCTCCTGGCCAACG Antisense: TCGGGGCAGCCTTGTCCCTT
MM_SREBP1c Sense: GGAACAGACACTGGCCGA Antisense: AAGTCACTGTCTTGGTTGTTGAT
MM_PPAR-α Sense: AGACCTTCGGCAGCTGGTCAC Antisense: GTGGCAACGGCCTGCCATCT
MM_PPAR-γ Sense: TTCGCTGATGCACTGCCTAT Antisense: GGAATGCGAGTGGTCTTCCA
MM_GLUT-1 Sense: CCTGTCTCTTCCTACCCAACC Antisense: GCAGGAGTGTCCGTGTCTTC
MM_GLUT-4 Sense: CACCGGCAGCCTCTTATCAT Antisense: CACCGAGACCAACGTGAAGA
MM_PFK Sense: GCCGTGAAACTCCGAGGAA Antisense: GTTGCTCTTGACAATCTTCTCATCAG
Hs_SREBP1c Sense: CATGGATTGCACTTTCGAA Antisense: GGCCAGGGAAGTCACTGTCTT
Hs_PPAR-γ Sense: GGCTTCATGACAAGGGAGTTTC Antisense: AACTCAAACTTGGGCTCCATAAAG
aMM: Mouse specific primers, Hs: Human specific primers.
Elisa
Serum Leptin and serum HMGB1 was estimated using ELISA kits from Abclonal
Biotechnologies (Woburn, MA) following manufacturer protocol. Serum IL1β was
estimated using an ELISA kit from ProteinTech (Rosemont, IL) following manufacturer
protocol.

18
Serum biochemistry tests
Biochemical analysis of mouse serum was done for ALT, urea Nitrogen, creatinine,
cholesterol, triglycerides and glucose from the University of Georgia college of veterinary
medicine.
2.2.7. Statistical analysis
Prior to initiation of the study, we conducted calculations for each experimental
condition with appropriate preliminary data to confirm that the sample number is sufficient
to achieve a minimum statistical power of 0.80 at an alpha of 0.05. All in vivo and in vitro
experiments were repeated three times with 3 mice per group (N = 3; data from each group
of three mice were pooled). Student’s t-test was used to compare means between two
groups at the termination of treatment. A one-way ANOVA was applied as needed, to
evaluate differences among treatment groups followed by the Bonferroni post-hoc
correction for intergroup comparisons.
2.3. RESULTS
2.3.1. Butyrate production is key to gut health in GW-chemical exposure and microbial
dysbiosis
We have shown previously that GW chemical exposure caused a significant
alteration in microbial population when compared to untreated controls with significant
increases in Firmicutes-Bacteriodetes ratio, a trend that is uniformly observed in IBD,
neuroinflammation and metabolic syndrome. The changes were consistent with the
neuroinflammatory phenotype in the mouse model of GWI. On in-depth analysis of the
microbial data, we found that GW-chemical exposed group showed a marked decrease in
19
Lactobacillus, and Bifidobacterium sp., the genus being responsible for producing the short
chain fatty acid butyrate. Interestingly butyrate has been shown to attenuate IBD and resists
proinflammatory changes in the small intestine (Fig. 1A) (p < 0.05). The two genus showed
a > 5 fold (log scale) decrease in abundance (Fig. 1A). Butyrate priming through oral
gavage and its presence during exposure significantly elevated the levels of
Bifidobacterium, butyrogenic bacteria Roseburia sp. and Lactobacillus (i, ii and iii) (Fig.
1B) (p < 0.05) when compared to GWI alone with the first two genera showing an increase
up to > 60% when compared to GWI. The percentages noted in the figure are compared to
the overall abundance of all genus detected in the metagenomic analysis. The comparisons
between GWI and GWI + NaBT groups were done using GWI as the base line. Such a
comparison showed a > 60% increase of these genus in GWI + NaBT group when
compared to GWI alone (Fig. 1B). The observations in Fig. 1A led to the rationale for using
Butyrate as a viable molecule for attenuating microbiome-associated inflammatory
phenotype and the subsequent changes observed in the GWI model. Butyrate exerts its
actions via binding to the niacin receptor. GPR109A has been recently discovered to bind
butyrate and stimulate the activation of Treg cells thus suppressing TH17 mediated
proinflammatory events (43). Our results showed that there is a significant decrease in the
protein levels of GPR109A in GW-chemical exposed group when compared to untreated
controls (Fig. 2A and D) (p < 0.05). Butyrate presence in the intestine via feeding GW-
exposed mice through an oral gavage significantly increased GPR109A protein levels in
the villi regions when compared to GWI-group (Fig. 2A and D) (p < 0.05) suggesting that
butyrate presence resisted the decrease in GPR109A protein levels thus helping butyrate to

20
exert its actions in the dysbiosis-affected small intestine and restore gut-epithelial cell
integrity and metabolic homeostasis.
2.3.2. Butyrate priming through oral route restores tight junction protein levels
The epithelial tight junction determines the paracellular water and ion movement
in the intestine and also prevents uptake of larger molecules, including antigens, in an
uncontrolled manner where Claudin-2 and Occludin play a major role and are perceived as
a marker for leaky gut (45). Our results from immunofluorescence microscopy for the
immunoreactivity of Claudin-2 showed a significant increase in GW-chemical exposed
group when compared to untreated controls (Fig. 2B and E) (p < 0.05), thus confirming
our previously reported data. Butyrate presence in GW-chemical exposed group showed a
significant decrease in that group when compared to GW-chemical exposed group alone
suggesting a parallel role of butyrate in Claudin-2 protein levels in the small intestine (Fig.
2B and E) (p < 0.05). The results also showed that butyrate priming nearly restored the
Claudin-2 levels to untreated controls (Fig. 2B). Similarly, the protein level of another tight
junction protein Occludin was significantly decreased in GW-chemical exposed groups
(Fig. 2C and F) and sodium butyrate treatment significantly restored the levels of Occludin
in the intestine. The results suggested that Butyrate may have a previously unconfirmed
role in modulating Claudin-2 and Occludin proteins in the small intestine though ILlOA-
dependent repression of Claudin-2 has been shown (46)

21
2.3.3. Butyrate priming in the intestine attenuates proinflammatory phenotype in the
intestine via a decrease in TLR4 activation
Since gut leaching was predominant in GWI mouse model and resulted in
endotoxemia, we studied whether butyrate priming helped in attenuating the
proinflammatory microenvironment in the small intestine (29). Results showed that
butyrate administration through an oral route decreased TLR4 colocalization (as shown by
white circles), a hallmark of its activation in GW-chemical exposed group when compared
to GW-group alone (Fig. 3A and B) (p < 0.05). Notably, the results also confirmed our
earlier observations of an increased TLR4 trafficking to lipid rafts in GW chemical exposed
group when compared to untreated controls (Fig. 3A and B) (p < 0.05). TLR4 activation
was followed by increased IL-1β protein levels in the villi regions but not in crypts of GW
chemical exposed group when compared to untreated controls (Fig. 4A and B) (p < 0.05).
Also, butyrate priming significantly decreased the IL-1β levels in the same regions when
compared to GW-Chemical exposed group (Fig. 4A and B). Gene expressions of IL-1β,
monocyte chemoattractant MCP-1 and TNF-α were significantly decreased in Butyrate
administered group when compared to GW-chemical exposed group (Fig. 4C) (p < 0.05).
Interestingly, serum IL-1β significantly increased in GW-chemical exposed groups (66.71
± 1.98pg/mL) as compared to vehicle control group (39.95 ± 1.8pg/mL) (Fig. 4D).
However, Butyrate exposure to the GW-Chemical exposed mice showed a significant
decrease in the serum IL-1β (34.56 ± 1.26pg/mL) (Fig.4D). The results suggested that
butyrate presence helped attenuate intestinal inflammation primarily from a TLR4 pathway
however it could not rule out other parallel inflammatory pathways in the gut such as
histone deacetylases.

22
Similar to pathogen-associated molecular patterns (PAMPs), that can trigger a
proinflammatory response, sterile inflammation can be triggered by endogenous molecules
from a necrotic or damaged cell that can activate several proinflammatory pathways
including TLR4 (47). Such endogenous molecules are collectively called Damage-
associated molecular patterns or DAMPs. We have shown previously that HMGB1 and
leptin can be released from several organ systems and can trigger a proinflammatory
cascade (48)(49)(50). We quantified the released HMGB1 and leptin in mouse serum using
competitive ELISA techniques. Result showed that GW-chemical exposed groups had
significantly higher levels of HMGB1 and leptin in the serum when compared to untreated
controls (Fig. 5A and B) (p < 0.05). Butyrate priming significantly decreased the level of
HMGB1 while a decrease in leptin levels was not significant when compared to GW-
chemical exposed group (Fig. 5A and B) (p < 0.05). The results suggested that circulatory
DAMPs can be soluble mediators of ectopic inflammatory events distant to the small
intestine while butyrate priming may attenuate such effects and help identify therapeutic
targets in the systemic inflammatory phenotype seen in GWI.
2.3.4. Increased TLR activation in the liver is attenuated by butyrate priming in the
intestine
TLR activation is observed in organ systems following gut dysbiosis (51)(52).
TLRs especially TLR4, TLR2, and TLR5 have been shown to increase tissue inflammation
(52). Interestingly, TLR-induced metabolic deregulation is increasingly seen as an
important event in metabolic syndrome (53). Our results showed that GW chemical
exposed group showed a significantly increased TLR4 activation (trafficking to lipid rafts)
in the liver especially in the sinusoidal cells (white circles) (Fig. 6A and B). TLR4

23
trafficking significantly decreased in butyrate administered group when compared to GW-
chemical exposed group (Fig. 6A and B). Interestingly, butyrate administration markedly
increased TLR4 protein (red) levels in the liver but could not be observed in the rafts of
the membrane (yellow), a sign that TLR4 protein was increased but the activation was
attenuated by butyrate administration (Fig. 6A). TLR5 a protein that is activated the
following binding with flagellin also increased in the liver of GW exposed mice but was
significantly decreased in the butyrate administered group (Fig. 6C and D). The results
suggested that increased circulatory levels of DAMPs or a leaky gut-associated flagellin
might have resulted in activation of TLR4 and TLR5 in the liver of GW chemical exposed
group but was blocked by the presence of butyrate.
2.3.5. TLR4 activation is associated with metabolic changes and inflammatory
response in the liver but the phenotypic liver injury is predominantly absent
The liver is the principal organ for gluconeogenesis, lipogenesis and cholesterol
metabolism (54). Recent studies have put a great deal of emphasis on liver metabolic
reprogramming in conditions of metabolic syndrome that include hepatic expression of
lipid and glucose metabolism markers, hepatic insulin and leptin resistance (36)(55).
Interestingly, the fatty liver disease is associated with a long-term metabolic alteration
(often years to manifest) and inflammatory response in the liver till the disease phenotype
surfaces and is rightly called a silent disease (56). We studied both the changes in hepatic
metabolic markers and the inflammatory response arising from a TLR4 activation
following GW-chemical exposure and microbial dysbiosis to ensure whether we can detect
early responses in the liver that can manifest into liver disease years later. Results showed
that hepatic SREBP1c, a molecule predominantly responsible for lipogenesis was

24
upregulated following GW-chemical exposure when compared to untreated controls (Fig.
7A) (p < 0.05) (57). Butyrate administration significantly decreased SREBP1c gene
expression in the hepatic lobule when compared to GW-chemical exposed group (Fig. 7A)
(p < 0.05). PPAR-α is a transcription factor and a major regulator of lipid metabolism in
the liver (58). PPAR-α is activated under conditions of energy deprivation and is necessary
for the process of ketogenesis (58). PPAR-α was significantly upregulated in the GW-
chemical exposed group when compared to untreated controls while butyrate
administration significantly decreased and restored the PPAR-α levels when compared to
GW-chemical exposed group (Fig. 7A) (p < 0.05). PPAR-γ is an important player in liver
fat metabolism and is known to be increased in benign steatosis but is significantly down-
regulated in models of liver injury (36). Our results showed that PPAR-γ was significantly
decreased in GW chemical exposed group when compared to untreated controls and
butyrate priming reversed this downregulation when compared to GW-chemical exposed
group (Fig. 7A) (p < 0.05). The results were in agreement with our previous studies in a
liver metabolic disease that had similar decreases in PPAR-γ (36).
We have shown previously that liver metabolic disorders triggered by
environmental contaminants can increase the expression of Phosphofructokinase (PFK)
(36). PFK, a rate-limiting enzyme in the glycolytic pathway was significantly upregulated
in GW chemical exposed group when compared to untreated controls while butyrate
administration significantly restored the PFK levels (Fig. 7A) (p < 0.05). Hepatic class I
glucose transporters (GLUT) have limited role in the liver but recent studies show their
importance in hepatic disease states (59). We and others have shown that GLUT-1 and
GLUT-4 are regulated by leptin and purinergic signaling and they are upregulated in fatty

25
liver disease primarily in hepatic stellate cells (50)(60). Our results show that both GLUT-
1 and GLUT-4 were upregulated in the GW chemical exposed groups when compared to
untreated controls however butyrate administration significantly decreased the GLUT-1
and GLUT-4 levels when compared to GW-chemical exposed groups (Fig. 7A) (p < 0.05).
Further, to investigate the role of GW-Chemical exposure in exacerbating the inflammatory
response in liver, hepatic mRNA expression profiles of interleukin (IL)-lp, monocyte
chemotactic protein 1 (MCP-1), tumor necrosis factor (TNF)-α and Kupffer cell activation
marker CD68 were analyzed. Results indicated that there was a significant increase in the
mRNA expression profiles of IL-1β, MCP-1, TNF-α and CD68 in GW Chemical exposed
mice livers compared with vehicle treated mice livers (Fig. 7B) (p < 0.05). Interestingly,
mice groups co-exposed with GW chemicals and sodium butyrate showed significantly
decreased level of IL-1β, MCP-1, and CD68 but not TNF-α. The results suggested a similar
role of higher leptin and/or heightened inflammation in causing the increase but remained
to be seen whether it was cell or organ specific.
The liver has multiple cell types and includes cells of epithelial, endothelial,
fibroblast and macrophage lineages. They perform multiple functions including metabolic,
cellular defense and wound healing. The liver lobule comprises of 90% hepatocytes which
are epithelial in origin and is a center for most of the metabolic functions. We used human
primary hepatocytes, primed with lipopolysaccharide (LPS) (concentrations found in our
previous study (29) to study the effects of metabolic dysregulation if any due to GW-
chemical exposure. Results showed that LPS primed hepatocytes showed a significant
increase in lipogenesis mediator SREBP1c while butyrate co-exposure decreased these
levels (Fig. 7C) (p < 0.05). Similar to our in vivo data, LPS primed hepatocytes showed a

26
significant increase in PPAR-γ gene expression when co-exposed to butyrate while LPS
only or untreated controls showed no change in the PPAR-γ levels (Fig. 7C) (p < 0.05).
Hematoxylin and Eosin stains of liver tissue sections obtained from GW-chemical
exposed group showed no signs of lipid accumulation or macrophage infiltration or
Mallory body formation signifying the absence of advanced stage inflammatory foci or
liver disease (Fig. 7D). Though histopathology of the liver section from each mice group
clearly showed that there was no sign of liver damage or development of Nonalcoholic
steatohepatitis, we resorted to clinical chemistry analysis for more detailed outcomes. To
confirm such observations, we performed clinical chemistry analysis of mouse serum
samples for ALT, BUN, creatinine, total cholesterol, triglyceride and serum glucose. The
clinical chemistry data showed (Table 2) that there was no significant difference in serum
ALT (showed a marked increase in GWI group but was not significant between groups),
BUN, creatinine and total cholesterol upon GW Chemical exposure as compared to vehicle
control group. However, co-exposure with sodium butyrate decreased the levels of ALT,
BUN but not the total cholesterol (Table 2). The triglyceride levels were significantly
increased in GWI chemical exposed mice groups as compared to untreated control groups,
while co-exposure with sodium butyrate caused the triglyceride level to be decreased
significantly when compared to GWI group (p < 0.05) suggesting a slow but incremental
risk of fatty liver in the future (Table 2). The glucose levels showed no significant
difference between groups (data not shown).

27
3.6. TLR4 drives the metabolic alterations in GW-chemical exposed liver
TLR4 induced downstream proinflammatory signaling has been found to aid in
insulin resistance (61). Prolonged insulin resistance has been shown to cause metabolic
disturbances in the liver, skeletal muscle and adipose tissue (53). Since microbiome
associated gut leaching and systemic endotoxemia were reported in the mouse model of
GWI and the present study found metabolic changes in the liver, we studied the direct role
of TLR4 in causing the metabolic changes. The results showed that TLR4 knockout (TLR4
KO) mice had decreased TLR5 expression in the liver when compared to GW-chemical
exposed group (Fig. 8A and B) (p < 0.05). TLR4 KO mice had significantly decreased
expression of Class I glucose transporter GLUT-4, PFK, PPAR-α, and lipogenesis mediator
SREBP1c when compared to GW-chemical exposed group while GLUT-1 showed no
change in the expression suggesting GLUT-1 might not be regulated by TLR4 (Fig. 8C) (p
< 0.05). The results suggested that TLR4 activation following systemic endotoxemia might
be responsible for the ectopic metabolic alterations in the liver but is unable to present any
significant changes in liver disease phenotype. The results also are in agreement with
epidemiological studies where veterans deployed in GW don’t report liver abnormalities
in the clinics based on the typical symptoms.
2.4 DISCUSSION
Epidemiological studies have shown a strong correlation between GW toxicant
exposures and cognitive/neurological complications but there are also reports of chronic
fatigue, gastrointestinal disturbances and occasional cases of metabolic syndrome (3) . Our
study shows that microbial dysbiosis owing to GW-chemical exposure causes a significant

28
decrease in healthy gut bacteria like Bifidobacterium and Lactobacillus (62). Interestingly,
they are a class of bacteria that generate butyrate in the gut (62). Recent studies have shown
a beneficial effect of butyrate in preclinical studies involving colitis and IBD (39) The
above results prompted us to use sodium butyrate administration through an oral route as
a priming agent throughout the chemical exposure time so that a restored butyrate in the
gut could prevent and prime the gut against the dysbiosis, inflammatory leaching, and
generation of systemic mediators in the small intestine. Results also showed the role of
butyrate in increasing the levels of the butyrogenic bacteria, increasing the expression of
butyrate receptor GPR109A, decreasing Claudin- 2 and decreasing TLR4 activation. We
have shown recently that GW chemical exposure causes gut dysbiosis, the disintegration
of gut membrane causing leaching and systemic endotoxemia (29) that eventually led to
TLR4 activation.
We also showed a causal role of dysbiosis to the neuroinflammation in frontal
cortex thus raising a possibility of the existence of a “Gut-Brain-Axis” in GWI similar to
other pathological conditions (29). This axis may act in parallel to some of the direct toxic
effects of GW chemical exposures on the brain tissue (63)(44). Sodium Butyrate priming,
as shown in our data might reverse the pathology associated with GW chemical exposure
since it restored gut health, reversed gut barrier integrity and decreased SI inflammation
(decreased IL-1β) while increasing the possibility of increased butyrate binding to
GPR109A due to higher availability of this receptor in SI. Notably, butyrate priming also
decreased the release of HMGB1 and leptin though slightly in circulation albeit from the
intestinal epithelial cells but other sources like liver cannot be ruled out. The source might
be the damaged epithelial cells in the small intestine since the potential generation of free

29
radical species has been shown before and oxidative stress in the intestinal epithelial cells
and macrophages could release HMGB1 (64).
On the other hand, HMGB1 release due to gut integrity changes also causes
oxidative stress and cell necrosis as have been reported in other studies (64). Though leptin
is primarily released from adipocytes and liver, chemical/food-induced leptin release have
been shown in the gut and has been traced in duodenal juice (65)(66). Thus, our finding of
increased leptin in circulation following GW chemical exposure might be a result of the
leaky gut or liver though the exact source remains to be determined at this time. The release
of both leptin and HMGB1 and its modulation by butyrate priming in the gut points to the
intestine as a source of these inflammatory mediators along with endotoxin and has
tremendous implication determining ectopic/endocrine pathology of GWI.
In spite of well-coordinated symptom reporting in GWI about chronic fatigue in
most of the studies, the causes of such chronic fatigue have been limited to abnormalities
in neurological pathways or mitochondrial dysfunction without an organ-specific
definition (67). Presence of symptoms related to metabolic syndrome or liver diseases is
rare (68). Interestingly, fatigue is also associated with metabolic syndrome and various
liver diseases (69)(70)(71). Though we hardly see literature reporting liver abnormalities
in GWI, asymptomatic metabolic abnormalities in the liver (as evident in silent liver
diseases like NAFLD), can contribute to chronic fatigue. These facts mentioned above led
us to examine the liver pathology likely affected by higher circulatory mediators like
endotoxin, leptin, and HMGB1. Owing to the tremendous role of the liver in carbohydrate
metabolism, we focused on the role of circulatory HMGB1 and leptin on (a) hepatic TLR4
activation and (b) alterations in both lipid and carbohydrate metabolism.

30
Our results showed a significant increase in TLR4 trafficking to the lipid rafts, a
hallmark of activation of the TLR4 pathway in the liver following exposure to GW-
chemicals. Also, there was a subsequent increase in TLR5 levels in the liver with both
TLR4 activation and TLR5 levels showing decreases after butyrate priming. These results
assume huge significance since TLR4 activation has been found to cause insulin resistance,
uptake of free fatty acids for triglyceride production in macrophages and sterol biosynthesis
(72)(53). On the other hand, stearic acid has been shown to promote TLR4 mediated
inflammation (73) (74). Our results of increased expression of genes such as SREBP1c and
PPAR-α which play a major role in liver lipogenesis (cholesterol biosynthesis and import)
might be the result of the increased TLR4 activation and the subsequent cascade of events
that alter liver metabolism following GW-chemical exposure. Interestingly, both SREBP1c
and LXRs control lipid metabolism and it remains to be seen whether an increase in
SREBP1c in the GW-chemical exposed liver was an adaptive way to suppress a chronic
TLR4 activation thus mounting an anti-inflammatory response as is seen in some studies
(75)(76). There are numerous reports which find increased glucose metabolism following
NF-kB activity which is downstream of TLR4 activation (77).
Our results of increased expression of phosphofructokinase, a rate-limiting enzyme
for glycolysis show that a TLR4 mediated mechanism might play a role in driving a
glycolytic pathway in the liver. Notably, isolated hepatocytes when stimulated with TLR4
ligand LPS or GW-chemical Permethrin did not show an increase in PFK but exhibited a
3-fold increase in SREBP1c over vehicle control suggesting that hepatocytes along with
macrophages may be targets of TLR4 activation thus playing a vital role in the
reprogramming of lipid metabolism. Further, Class I glucose transporters GLUT-1 and

31
GLUT-4 was elevated in the GW-chemical exposed liver. The result assumes significance
since inflammation in the liver has been shown to increase glucose uptake in hepatic
stellate cells in a mouse model of fatty liver disease (50). Our results of decreased
inflammation and subsequent metabolic disturbances in the liver following butyrate
priming may shed some light on the inhibitory role of butyrate on histone deacetylase
activity (78). Butyrate is a known HDAC inhibitor (78).
Studies show that butyrate can act as an HDAC inhibitor and decrease NFκβ
activity. We found a decrease in NFxβ activity following butyrate administration but was
found to be insignificant (data not shown). Also, butyrate can act independently of TL4
activation by inhibiting HDACs (79). Future studies should target the extensive role of
butyrate in HDAC inhibiton in Gulf War Illness that may be independent of TLR4
activation. Importantly, the results of altered expressions of the metabolic genes failed to
induce any histological changes that support inflammatory or metabolic liver disease
following GW-chemical exposure. This is of high significance since liver diseases take
years to manifest and most remain asymptomatic (silent) thus evading most clinical
observations. It remains to be seen whether the unavailability of reports related to liver
complications in GWI is due to the silent nature of the manifestations that are only limited
to changes in the expressions of metabolic genes and would perhaps take years to show
any phenotypic disease. Finally, our studies with TLR4 gene-deficient mice exposed to
GW chemicals reversed the levels of TLR5 and expressions for SREBP1c, PPAR-α, PFK
and GLUT-4 emphasizing the fact that TLR4 activation was indeed responsible for the
metabolic reprogramming in the liver. Further, the reversal of TLR4-inducible systemic

32
release of DAMPS and metabolic changes in the liver bodes well for a potential use of this
compound for a gut-targeted therapy in GWI veterans.
In summary, we show that GW-chemical exposure in mice and subsequent systemic
inflammation following a dysbiosis in the gut could cause significant changes in the way
the liver metabolizes lipid and carbohydrate with no detectable pathology while butyrate
resists those changes. The study will help us advance our efforts to scrutinize clinical
symptom reporting in the liver and re-evaluate the way we approach the therapeutic aspect
of GWI by targeting multiple physiological pathways. Uses of short-chain fatty acids or
probiotics can help in such pursuits.
Acknowledgement
The authors gratefully acknowledge the technical services of Benny Davidson at
the IRF, University of South Carolina School of Medicine and AML Labs (Baltimore MD),
and University of Georgia college of veterinary medicine for support in clinical blood
chemistry test. We also thank the Instrumentation resource facility (IRF) at the University
of South Carolina for equipment usage and consulting services.

33
Figure 2.1. Gut microbiome alteration in mice model of Gulf War Illness (GWI). A. The proportional abundance of microbial genera: Graphical representation of the most abundant taxa of bacteria at the genus level. Groups compared are gulf war illness group (wild-type mice exposed to gulf war chemicals) (GWI, n = 3) and control group fed with vehicle (Veh, n = 3) (p-value: < 0.05). B. Percentage abundance of gut bacteria Bifidobacterium (i), Roseburia (ii), and Lactobacillus (iii) in a group of mice co-exposed with Gulf war chemicals and Sodium butyrate (GWI + NaBT, n = 3) as compared with GWI mice (n = 3) (p-value: < 0.05).

34
Figure 2.2. Change in gut microbiome in GWI alter niacin receptor (GPR109A) and
tight junction proteins in the intestine. A. The expression pattern of butyrate and niacin receptor GPR109A was assessed by immunofluorescence microscopy. The representative images showed immunoreactivity of GPR109A in the distal part of the small intestine of veh control group of mice (veh, n = 3), gulf war illness group of mice (GWI, n = 3) and a group of mice co-exposed with GWI and sodium butyrate (GWI + NaBT, n = 3). B and C. The expression pattern of Claudin-2 and Occludin (tight junction proteins) was assessed by immunofluorescence microscopy. Tissue levels of Claudin-2 (B) and Occludin (C) in Vehicle control group of mice (Veh, n = 3), gulf war chemical treated group of mice (GWI, n = 3) and a group of mice co-exposed with GWI and sodium butyrate (GWI + NaBT, n = 3) was assessed by immunofluorescent microscopy after labeling the protein with the red fluorescent secondary antibody and counterstained with DAPI (blue). D–F. The bar diagram shows the quantitative morphometric analysis of fluorescence intensities of GPR109A (D), Claudin-2 (E), and Occludin (F) immunoreactivity in the region of interest (ROI) in the small intestine. *(p < 0.05).

35
Figure 2.3. Sodium butyrate priming in a rodent model of GWI attenuates TLR4
activation in the small intestine. A. Immunofluorescence microscopy of small intestine showing TLR4 (red) trafficking to the lipid rafts (green) of the small intestine tissue, an essential process for TLR4 activation causing a co-localization of TLR4 in flotillin-rich rafts (yellow). Representative images of TLR4-flotillin co-localization in the small intestine of vehicle control group of mice (Veh, n = 3), gulf war chemical treated group of mice (GWI, n = 3) and a group of mice co-exposed with GWI and sodium butyrate (GWI + NaBT, n = 3) shown by white circles covering the yellow spots created by an overlay of red (TLR4) and green (Flotillin). Images were taken at higher magnification (40× oil). B. Graphical representation of the quantitative morphometric analysis of colocalization events in the region of interest (ROI) in the small intestine. Images for analysis were randomly chosen in different microscopic fields. Data is represented as Mean ± SEM and *(p < 0.05). (For interpretation of the references to colour in this figure legend, the reader is referred to the web version of this article.

36
Figure 2.4. Sodium butyrate priming in a rodent model of GWI improves
proinflammatory phenotype in small intestine mediated by the TLR4 pathway. A. Small intestine tissue slices were probed for IL-1β immunoreactivity in vehicle control group of mice (Veh, n = 3), gulf war chemical treated group of mice (GWI, n = 3) and a group of mice co-exposed with GWI and sodium butyrate (GWI + NaBT, n = 3) using immunohistochemistry. Specific immunoreactivity to IL-1β is evident by dark brown spots. B. Graphical representation of morphometric analysis of the IL-1β immunoreactivity in tissue slices. Data normalized against vehicle control (veh) *(p < 0.05). C. Quantitative real-time PCR (qRTPCR) analysis of inflammatory markers in the small intestine. mRNA expression of IL-1β, MCP-1, and TNF-α was analyzed in the samples of vehicle control group of mice (Veh, n = 3), gulf war chemical treated group of mice (GWI, n = 3) and a group of mice co-exposed with GWI and sodium butyrate (GWI + NaBT, n = 3). Normalized mRNA expression is represented as a fold change of vehicle control (veh) on Y-axis. Data points represented with Mean ± SEM *(p < 0.05). D. Graphical representation of serum IL-1β in pg/mL of the samples of vehicle control group of mice (Veh, n = 3), gulf war chemical treated group of mice (GWI, n = 3) and a group of mice co-exposed with GWI and sodium butyrate (GWI + NaBT, n = 3)

37
Figure 2.5. Sodium butyrate treatment in GWI improves circulatory DAMPs. Similar to the pathogen-associated molecular pattern (PAMPs), the endogenous molecules called damage-associated molecular patterns or DAMPs (such as HMGB1) are linked with proinflammatory responses in distal organs. A. Western blot analysis of serum high mobility group box 1 protein (HMGB1) and serum adipokine leptin from samples of vehicle control group of mice (Veh, n = 3), gulf war chemical treated group of mice (GWI, n = 3) and a group of mice co-exposed with GWI and sodium butyrate (GWI + NaBT, n = 3). Ponceau S staining was done to see the equal loading of serum proteins and used for normalization of protein expression. B–C. Graphical representation of morphometric analysis of HMGB1 and leptin western blot bands. The data was normalized to a total serum protein (Ponceau S). Y-axis depicts the HMGBl/Ponceau S ratio (B) and leptin/Ponceau S ratio (C) from Veh, GWI and GWI + NaBT groups. *p < 0.05 is considered statistically significant. D-E. Graphical representation of serum HMGB1 (D) and serum leptin (E) in ng/mL of the samples of vehicle control group of mice (Veh, n = 3), gulf war chemical treated group of mice (GWI, n = 3) and a group of mice co-exposed with GWI and sodium butyrate (GWI + NaBT, n = 3).

38
Figure 2.6. Sodium butyrate treatment in a rodent model of GWI attenuates TLR4
activation in Liver. A. Immunofluorescence microscopy of liver slices showing TLR4 (red) trafficking to the lipid rafts (green), an essential process for TLR4 activation causing a co-localization of TLR4 in flotillin-rich rafts (yellow). Representative images of TLR4-flotillin co-localization in the liver of vehicle control group of mice (Veh, n = 3), gulf war chemical treated group of mice (GWI, n = 3) and a group of mice co-exposed with GWI and sodium butyrate (GWI + NaBT, n = 3) shown by white circles covering the yellow spots created by an overlay of red (TLR4) and green (Flotillin). Images were taken at higher magnification (60× oil). B. Graphical representation of the quantitative morphometric analysis of colocalization events in the liver. Images for morphometric analysis were randomly chosen in different microscopic fields. Data is represented as Mean ± SEM *(p < 0.05). C. Tissue levels of TLR5 immunoreactivity in vehicle control group of mice (Veh, n = 3), gulf war chemical treated group of mice (GWI, n = 3) and a group of mice co-exposed with GWI and sodium butyrate (GWI + NaBT, n = 3) mouse liver samples as observed by immunofluorescent microscopy after labeling the TLR5 protein with the green fluorescent secondary antibody and counterstained by DAPI (blue). D. The bar diagram shows the quantitative morphometric analysis of fluorescence intensities of TLR5 immunoreactivity in the liver tissue. Images for morphometric analysis of TLR5 were randomly chosen in different microscopic fields. Data is represented as Mean ± SEM *(p < 0.05)

39
Figure 2.7. TLR4 activation is associated with metabolic changes and inflammatory
response in the liver but the phenotypic liver injury is predominantly absent. A. Quantitative real-time PCR (qRTPCR) analysis principle carbohydrate metabolic markers (PFK, GLUT-1, and GLUT-4) and fat metabolic markers (SREBP1c, PPAR-α, and PPAR-γ) in the liver tissue. mRNA expression of SREBP1c, PPAR-α, PPAR-γ and PFK, GLUT-1, GLUT-4 and B. mRNA expression analysis of inflammatory marker IL-1β, MCP-1, TNF-α, and Kupffer cell activation marker CD68 were analyzed in the liver sample of vehicle control group of mice (Veh, n = 3), gulf war chemical treated group of mice (GWI, n = 3) and a group of mice co-exposed with GWI and sodium butyrate (GWI + NaBT, n = 3). Normalized mRNA expression is represented as a fold change of Vehicle control (veh) on Y-axis. Data points represented with Mean ± SEM *(p < 0.05). C. mRNA expression of SREBP1c, PPAR-γ were analyzed in the primary human hepatocytes cells treated with lipopolysaccharide (LPS) and Co-treated with LPS and sodium butyrate (LPS + NaBT). Normalized mRNA expression is represented as a fold change of Vehicle control (Veh Cont) on Y-axis. Data points represented with Mean ± SEM *(p < 0.05). D. Representative Hematoxylin and Eosin stained (H&E) images of liver sections showed liver pathophysiology of vehicle control group of mice (Veh, n = 3), gulf war chemical treated a group of mice (GWI, n = 3). Images were taken at 10× magnification.

40
Figure 2.8. TLR4 drives the metabolic alterations in GW-chemical exposed liver. A. Tissue levels of TLR5 in Gulf War chemical treated a group of wild-type mice (GWI, n = 3) and a group of TLR4 knockout mice (TLR4 KO, n = 3). Mouse liver samples as observed by immunofluorescence microscopy after labeling the TLR5 protein with green fluorescent secondary antibody and nuclear counterstaining by DAPI (blue). Images were taken at 60× (oil) magnification. B. The bar diagram showed the quantitative morphometric analysis of fluorescence intensities of TLR5 immunoreactivity in the liver tissue. *(p < 0.05). C. mRNA expression analysis of principle carbohydrate metabolic markers (PFK, GLUT-1, and GLUT-4) and fat metabolic markers (SREBP1c, PPAR-α) in the liver tissue of vehicle, GWI and TLR4 KO mice. Normalized mRNA expression is represented as a fold change of vehicle control (veh) on Y-axis. Data points represented with Mean ± SEM *(p < 0.05).

41
CHAPTER 3
DYSBIOSIS-ASSOCIATED ENTERIC GLIAL CELL IMMUNE-ACTIVATION
AND REDOX IMBALANCE MODULATE TIGHT JUNCTION PROTEIN
EXPRESSION IN GULF WAR ILLNESS PATHOLOGY2
2 Kimono, D., Sarkar, S., Albadrani, M., Seth, R., Bose, D., Mondal, A., Li, Y., Kar, A.
N., Nagarkatti, M., Nagarkatti, P., Sullivan, K., Janulewicz, P., Lasley, S., Horner, R.,
Klimas, N., & Chatterjee, S. (2019). Dysbiosis-Associated Enteric Glial Cell Immune-
Activation and Redox Imbalance Modulate Tight Junction Protein Expression in Gulf
War Illness Pathology. Frontiers in physiology, 10, 1229.
https://doi.org/10.3389/fphys.2019.01229
Reprinted here with permission of publisher

42
Running Title: Reactive enteric glial cells contribute to GWI pathology
Key words: dysbiosis, peroxynitrite, Rage, S100B, nitric oxide, p47 phox, SsnB, Sodium
butyrate.
Author for correspondence:
*Dr. Saurabh Chatterjee, Ph.D. Environmental Health and Disease Laboratory, NIEHS
Center for Oceans and Human Health on Climate Change Interactions, Department of
Environmental Health Sciences, University of South Carolina, Columbia 29208 USA.
Email: [email protected]; Tel: 803-777-8120; Fax: 803-777-3391
Funding: Funding for this project was provided by DoD-IIRFA grant: W81XWH1810374
and VA Merit CX001923-01 awarded to Saurabh Chatterjee; W81XWH-16-1-0556 to Dr.
Stephen Lasley; W81XWH-13-2-0072 to Dr. Kim Sullivan; P01AT003961,
P20GM103641, R01AT006888, R01ES019313, R01MH094755 and VA Merit Award
BX001357 to Mitzi Nagarkatti and Prakash S. Nagarkatti.
"This material is based upon work supported (or supported in part) by the Department of Veterans Affairs,
Veterans Health Administration, Office of Research and Development vide grant no. CX001923-01" to Dr.
Saurabh Chatterjee. Dr. Chatterjee is a 5/8th employee with the US Department of Veterans
Affairs

43
ABSTRACT
About 14% of veterans who suffer from Gulf war illness (GWI) complain of some
form of gastrointestinal disorder but with no significant markers of clinical pathology. Our
previous studies have shown that exposure to GW chemicals resulted in altered
microbiome which was associated with damage associated molecular pattern (DAMP)
release followed by neuro and gastrointestinal inflammation with loss of gut barrier
integrity. Enteric glial cells (EGC) are emerging as important regulators of the
gastrointestinal tract and have been observed to change to a reactive phenotype in several
functional gastrointestinal disorders such as IBS and IBD. This study is aimed at
investigating the role of dysbiosis associated EGC immune-activation and redox instability
in contributing to observed gastrointestinal barrier integrity loss in GWI via altered tight
junction protein expression. Using a mouse model of GWI and in vitro studies with cultured
EGC and use of antibiotics to ensure gut decontamination we show that exposure to GW
chemicals caused dysbiosis associated change in EGCs. EGCs changed to a reactive
phenotype characterized by activation of TLR4-S100β/RAGE-iNOS pathway causing
release of nitric oxide and activation of NOX2 since gut sterility with antibiotics prevented
this change. The resulting peroxynitrite generation led to increased oxidative stress that
triggered inflammation as shown by increased NLRP-3 inflammasome activation and
increased cell death. Activated EGCs in vivo and in vitro were associated with decrease in
tight junction protein occludin and selective water channel aquaporin-3 with a concomitant
increase in Claudin-2. The tight junction protein levels were restored following a parallel
treatment of GWI mice with a TLR4 inhibitor SsnB and butyric acid that are known to
decrease the immunoactivation of enteric glial cells. Our study demonstrates that immune-

44
redox mechanisms in EGC are important players in the pathology in GWI and may be
possible therapeutic targets for improving outcomes in GWI symptom persistence.
3.1. INTRODUCTION
Gastrointestinal disturbances are one of the most commonly reported chronic
symptoms among veterans who returned from the Persian Gulf war of 1990–1991(3,80,81).
About 14% of veterans who suffer from Gulf War illness (GWI) complain of some form
of gastrointestinal (GI) problems such diarrhea, pain and gas etc. (80,81). According
to (30), the most commonly reported gastrointestinal issues reported among United States
and British Gulf war (GW) veterans were diarrhea, vomiting, and stomach problems. A
study by (80) showed veterans of the Persian GW presented with diarrhea and had rectal
hypersensitivity as did (82) who reported increased somatic hypersensitivity and pain
among some GW veterans with GI issues.
Although the veterans report these symptoms, the prospective study by(81) did not
find any significant clinical markers of disease pathology in blood or intestine tissue of
deployed participants. Similarly, one of our own studies which reported metabolic
reprogramming in liver as a result of leaky gut and endotoxemia did not find any
biochemical markers of liver damage or altered metabolism in a mouse model of GWI.
This was surprising because we had had previously shown that exposure to GW theater
chemicals resulted in an alteration of gut microbiome and concomitant TLR4 mediated
gastrointestinal and neuroinflammation with endotoxemia (29)(18). This elusive nature of

45
GWI is a strong reason for further studying underlying mechanisms of this condition in
order to obtain effective therapies.
Of emerging interest in inflammatory gastroenterology are enteric glial cells (EGC)
which reside in close proximity with the neurons of the enteric nervous system. These cells
are similar in structure and physiology to astrocytes of the brain but are not
excitable(83)(84). Initially, the principal function of EGC was thought to be providing
mechanical support to enteric neurons. However, recent studies have shown that these cells
play an important role in regulating the gastrointestinal microenvironment through several
mechanisms, which have been extensively reviewed (83)(85)(86). EGC were found to
significantly modulate gut homeostasis through release of growth factors (87) cytokines
and prostaglandins (87)(86) but may also play a pathogenic role by contributing to
nitrosative stress and proinflammatory cytokines when exposed to stressful or toxic stimuli
in the gut. Moreover, studies have found that EGC have the ability to “sense” a change in
microbiome from probiotic to pathogenic, possibly through toll like receptors (TLRs). A
study by (88), found that adhesive E. Coli seem to activate a TLR-S100β/RAGE-iNOS
signaling pathway in human EGC, while probiotic lactobacillus did not. Another study
found that when EGC were treated with lipopolysacharrides (LPS), there was activation of
TLRs with a release of S100B and nitric oxide (NO) (89). In this reactive state, EGC
produce proinflammatory cytokines and chemokines e.g., (IL-1β, TNF-α, MCP-1) and
release of inducible NO which may contribute to oxidative stress in the gut (86,87,90)(84).
In irritable bowel syndrome (IBS) and inflammatory bowel disease (IBD), it is well
known that an altered microbiome plays a significant role in the pathogenesis of the disease
(90). In IBS for example, patients were found to have a decrease in abundance of

46
Bifidobacteria and Lactobacillus but an increased prevalence of pathogenic species
like Escherichia spp., Shigellas, and several Clostridia(91). Furthermore, it has been
observed that metabolic diseases e.g., diabetes and obesity also present with increased ratio
of Firmicutes to Bacteriodetes (92,93). Studies concerning the mechanisms of these
gastrointestinal diseases have found that change of EGC phenotype from homeostatic to
pathogenic is a characteristic of these diseases (94–96). A study by Wang et al. reported a
significantly increased expression of glial fibrillary acidic protein (GFAP), Tyrosine
receptor kinase B and Substance P in the colon of IBS patients with a correlated increase
in intestinal inflammation(97). Other studies show that a loss in EGC resulted in poor
gastrointestinal health characterized by loss of gut barrier integrity (98).
Our previous research reported an altered microbiome in a murine model of GWI
with increase in Firmicutes over Bacteriodetes and a decrease in several butyrogenic
bacteria. This dysbiosis was accompanied by activation of TLR4, increased inflammation,
a leaky gut, endotoxemia with release of damage associated molecular patterns (DAMPS)
such as HMGB1 in gulf war chemical treated mice compared to controls (18,29,63).
Interestingly, a recent study by Hernandez et al., showed that exposure to pyridostigmine
bromide a known gulf war chemical exposure resulted in enteric neuronal and glial
reactivity and inflammation (99).
This current study investigates the contribution of EGC in observed inflammatory
phenotype which we and others have observed in GWI. We test the hypothesis that, the
altered microbiome which results in increased pathogen associated molecular patterns
(PAMPS) (e.g., LPS, flagellin and other immunostimulatory bacterial parts), leaky gut and
increase in circulatory DAMPS (e.g., HMGB-1) in GW-chemical (Permethrin and

47
pyridostigmine bromide) treated mice results in a reactive EGC phenotype compared to
mice treated with vehicle control treated mice and mice co-exposed with GW chemicals
and antibiotics. Through this reactive EGC phenotype intestinal cells such as enteric
neurons and epithelial cells might be further affected leading to a vicious cycle of
consistent proinflammatory state. This constant proinflammatory state of intestinal cells
might answer the persistence of gastrointestinal, systemic and neuro inflammation in gulf
war illness. The study uses a murine model of GWI and in vitro studies with EGCs and
intestinal epithelial cells to elucidate possible mechanisms to explain this observed
inflammation observed in GWI.
3.2. MATERIALS AND METHODS
Pyridostigmine bromide (PB), Permethrin (Per), Sodium Butyrate, Sparstolonin B
(SsnB), Corticosterone, Neomycin trisulfate hydrate, Enrofloxacin, Apocynin (APO),
Phenylboronic acid (FBA) were purchased from Sigma-Aldrich (St. Louis, MO, United
States). Lipopolysaccharides (LPS), LPS-RS (TLR4 inhibibitor) were purchased from
Cayman chemical company (Ann Arbor, MI, United States), Rat High mobility group box
1 protein (HMGB-1) Rat (rec) (His) was purchased from Chimirigen, Mediatech, Inc.
(Manassas, VA, United States), Anti-TLR4, anti-flotillin-1, anti-S100B, anti-GFAP, anti-
ASCII and anti-Caspase 1, anti-TLR5, anti-3NT, anti-GP91, anti-P47phox, anti-NOS 2,
anti-HMGB-1 and anti-aquaporin-3 primary antibodies were purchased from Santa Cruz
Biotechnology (Dallas, TX, United States), anti-claudin 2, anti-TLR2 and anti-occludin
were purchased from Abclonal Technology (Woburn, MA, United States) was while anti-
NLRP-3, anti-RAGE were purchased from Abcam (Cambridge, MA, United States).
Fluorescence-conjugated (Alexa Fluor) secondary antibodies, ProLong Gold antifade

48
mounting media with DAPI were purchased from Thermofisher Scientific (Grand Island,
NY, United States), Apoptosis ApopTag® Fluorecein in situ detection kit from Millipore
(Billerica, MA, United States), The Pierce LAL Chromogenic Endotoxin Quantification
Kit from Thermo Scientific (Waltham, MA, United States) and Griess reagent system from
Promega corporation (Madison, WI). All other chemicals which were used in this study
were purchased from Sigma unless otherwise specified. Paraffin-embedding of tissue
sections on slides were done by AML laboratories (Baltimore, MD, United States).
3.2.1. Animals
Adult wild-type male (C57BL/6J mice) were purchased from the Jackson
Laboratories (Bar Harbor, ME, United States). Mice were implemented in accordance with
NIH guideline for human care and use of laboratory animals and local IACUC standards.
All procedures were approved by The University of South Carolina at Columbia, SC,
United States. Mice were housed individually on 7090 Sani-Chip bedding from Teklad
(Madison, WI, United States) and fed with 8904 irradiated chow diet from Teklad
(Madison, WI, United States) at 22–24°C with a 12-h light/12-h dark cycle. All mice were
sacrificed after animal experiments had been completed. Immediately after terminal
anesthesia, mice’s small intestine was collected and dissected for further experiments,
while fecal pellets were collected from the colon and immediately stored in sterile
Eppendorf tubes for microbiome analysis. The tissues were fixed using 10% neutral
buffered formalin. Distal segments of small intestines were used for the staining and
visualizations.

49
3.2.2. Rodent Model of Gulf War Illness (GWI)
Mice were exposed to Gulf War chemicals based on established rodent models of
Gulf War Illness with some modifications (44,63). The treated wild-type mice group (GW)
were dosed tri-weekly for 1 week with PB (2mg/Kg) and Permethrin (200 mg/kg) by oral
gavage. After completion of PB and Permethrin dosages, mice were administered
corticosterone intraperitoneally (i.p.) with a dose of 100μg/mice/day for 5 days of the week
for 1 week to represent war stress. The dose of corticosterone was selected from the study
which exposed mice to 200 mg/L of corticosterone through drinking water. The i.p. dose
of corticosterone had similar immunosuppression as examined by low splenic T cell
proliferation (data not shown). The vehicle control group (CONT) of mice received saline
injections and vehicle for oral gavage (6% DMSO) in the same paradigm. Similarly,
another group of mice (GW + AB) were exposed to PB/Permethrin and corticosterone as
in above mentioned dosages along with antibiotics (Neomycin 45 mg/kg and Enrofloxacin
1mg/Kg) thrice per week for 2 weeks for intestinal decontamination and obtaining gut
sterility, while another group (AB) were exposed to antibiotics (Neomycin, 45 mg/kg and
Enrofloxacin 1 mg/Kg) for 2 weeks. A fifth group of mice was treated with PB/Permethrin
and corticosterone, but with Sodium butyrate (10 mg/Kg) and Sparstolonin B (SsnB) 3
mg/Kg (GW + SsnB + BT). We have shown before that SSnB is a potent TLR4 antagonist
and Butyrate decreases intestinal inflammation in GWI.

50
3.2.3. Cell Culture
Enteric Glial Cell Culture
Immortalized rat EGC were obtained from ATCC® (ATCCCRL-2690). Plated
EGC were maintained in DMEM media supplemented with 10% FBS until treated. Cells
were serum starved in DMEM supplemented with 1% FBS for 12 h and then exposed to
vehicle control and chemicals. Cells were then treated with vehicle control-PBS (VEH),
LPS (1 μg/mL), HMGB-1 (100 ng/mL), SsnB (10 μg/mL), Sodium butyrate (5 mM)and
inhibitors FBA (100 μM) and Apocynin (100 μM) with either HMGB-1, LPS or antibiotics
(neomycin and enrofloxacin cocktail) at different dilutions ranging from (1X to 1000X)
(see Supplementary Figures S2–S7) for 24 h. After which the experiment was terminated
and cells were harvested for mRNA extraction, gene expression analysis and protein
expression studies. Nitric oxide production was estimated from culture fluids by measuring
nitrite formation using the Griess assay.
Intestinal Epithelial Cell Culture
Immortalized rat intestinal epithelial cells (IEC-6) ATCC© CRL-1592, were
obtained from ATCC. The cells were maintained in DMEM media supplemented with 10%
FBS and 1x ITS until treated. Cells were serum starved in DMEM supplemented with 1%
FBS for 12 h and then primed with LPS (100 ng/mL) for 12 h. Cells were then treated with
culture fluids from EGC (above) for 24 h, then harvested for further analyses.
51
3.3.4. Microbiome Analysis
Microbiome was analyzed from fecal pellets and luminal contents collected from
animals after sacrifice and sent to Second Genome for 16S rRNA sequencing. Microbial
analyses were performed from isolated nucleic acids using the MoBio PowerMag
Microbiome kit (Carlsbad, CA, United States), according to manufacturer’s instructions.
The microbiome data is in NCBI EBI under the accession number PRJEB19474.
3.3.5. Laboratory Methods
Immunofluorescence Staining
Paraffin-embedded distal part of the small intestine sections were deparaffinized
using a standard protocol. Epitope retrieval solution and steamer were used for epitope
retrieval of sections. Primary antibodies such as anti- GFAP, anti-S100β, anti-NOS2, anti-
NLRP-3, anti-ASCII, anti-GP91, anti-P47phox anti-TLR4, anti-Flotillin, anti-aquaporin3
were used at the recommended dilution (1:200). Species-specific secondary antibodies
conjugated with Alexa Fluor (633-red and 488-green) were used at advised dilution
(1:300). Finally, the stained sections were mounted using Prolong gold anti-fade reagent
with DAPI. Sections were observed under–Olympus fluorescence microscope using 20X,
40X or 60X objective lenses, or under confocal microscopy using Leica SP-8 with LasX-
10 software at magnification of 63X.
Western Blot
Serum HMGB-1 levels were estimated from 35 μg of denatured mouse serum
protein, while TLR2, 4 and 5 were estimated from 25 μg of denatured small intestine tissue

52
by a Western Blot analysis following standard protocols. Briefly, serum was concentrated
and then diluted 1:5. Tissue protein or serum protein was then separated on a Novex 4–
12% bis-tris gradient gel and subjected to standard SDS-PAGE. The separated proteins
were then transferred to a nitrocellulose membrane by a Trans-Blot Turbo transfer system.
The membrane was then stained with Ponceau S, and then blocked with 5% BSA solution
for 1 h, then incubated with primary antibody overnight at 4°C. Species-specific anti-IgG
secondary antibody conjugated with HRP was used to tag primary antibody. ECL western
blotting substrate was used to develop the blot The blot was then imaged using G:Box
Chemi XX6 and subjected to densitometry analysis using Image J software.
Real-Time Quantitative PCR
Messenger RNA expression in small intestine and rat EGC was examined by
quantitative real-time PCR analysis. Total RNA was isolated from each 15 mg small
intestine tissue or 1 × 10⁶ EGC by homogenization in Trizol reagent (Invitrogen, Carlsbad,
CA, United States) according to the manufacturer’s instructions and purified with the use
of RNeasy mini kit columns (Qiagen, Valencia, CA, United States). cDNA was synthesized
from purified RNA (1 μg) using iScript cDNA synthesis kit (Bio-Rad, Hercules, CA,
United States) following the manufacturer’s standard protocol. Real-time qPCR (qRTPCR)
was performed with the gene-specific primers using SsoAdvanced SYBR Green Supermix
and CFX96 thermal cycler (Bio-Rad, Hercules, CA, United States). Threshold Cycle (Ct)
values for the selected genes were normalized against respective samples internal control
(18S). Each reaction was carried out in triplicates for each gene and for each sample. The
relative fold change was calculated by the 2-ΔΔCt method. The sequences for the primers
used for Real-time PCR are provided below in Table 1

53
TABLE 3.1. Rat primer sequences.
Rat_IL-1β Sense: CCTCGGCCAAGACAGGTCGC Antisense: TGCCCATCAGAGGCAAGGAGGA
Rat_NLRP-3 Sense: TGCATGCCGTATCTGGTTGT Antisense: ATGTCCTGAGCCATGGAAGC
Rat_TNF-α Sense: CAACGCCCTCCTGGCCAACG Antisense: TCGGGGCAGCCTTGTCCCTT
Rat_ASCII Sense: GGACAGTACCAGGCAGTTCG Antisense: GTCACCAAGTAGGGCTGTGT
Rat_Caspase 1 Sense: GACAGGTCCTGAGGCCAAAG Antisense: AAAAGTTCATCCAGCAATCCATTT
Rat_MCP 1 Sense: TAGCATCCACGTGCTGTCTC Antisense: CAGCCGACTCATTGGGATC
Rat_18S Sense: GGATCCATTGGAGGGCAAGT Antisense: ACGAGCTTTTTAACTGCAGCAA
Rat_NOS2 Sense: AGCAGAGTTGGTGCAGAAGC Antisense: GGGAATAGCACCTGGGTTTT
Rat_Claudin1 Sense: AGGTCTGGCGACATTAGTGG Antisense: CGTGGTGTTGGGTAAGAGGT
Rat-ZO-1 Sense: GGAAATGTGTAAATCACCTGGAAGA Antisense: CCAAAGAACAGAAGACCACCAAC
mm_18S Sense: TTCGAACGAACGTCTGCCCTATCAA Antisense: ATGGTAGGCACGGCGATA
mm_Claudin1 Sense: TTTCGCAAA GCACCGGGCATACA Antisense: GCCACTAATGTCGCCAGACCTGAAA
mm_ZO-1 Sense: CCACCTCTGTCCAGCTCTTC Antisense: CACCGGAGTGATGGTTTTCT
mm_TLR2 Sense: ACCAAGATCCAGAAGAGCCA Antisense: CATCACCCGGTCAGAAAACAA
mm-TLR4 Sense: GGAGTGCCCGCTTTCACCTC Antisense: ACCTTCCGGCTCTTGTGGAAGC
mm-TLR5 Sense: TGTAAAGTACTGGTGCCCGTGTGT Antisense: ACTGCGCAAACATTCTGCTGGC
mm-NOS-2 Sense: CGCTGGCTACCAGATGCCCG Antisense: GCCATAGCGGGCTTCCAGC
The primer sequences are given as 5′-3′ orientation; Sense: Forward primer. Antisense:
Reverse primer.

54
Endotoxin Level Detection by Litmus Amebocyte Lysate Assay
Bacterial endotoxins (EU/mL) were detected in mouse stool samples for mice
which were treated with vehicle control, gulf war chemicals, and mice co-exposed with
gulf war chemicals and antibiotics using the Pierce LAL Chromogenic Endotoxin
Quantification Kit according to the manufacturer’s instructions. Briefly, stool samples
were obtained from mice and equal weights were homogenized in endotoxin free water.
The supernatant was then collected, and heat inactivated at 70°C. This was then diluted
1:300 and endotoxins quantified.
Nitrite Estimation by Griess Assay
Nitric oxide release was estimated from the cell culture fluids by measuring nitrite
formation immediately after the experiment was terminated. Nitrite was measured using
the Griess reagent system from Promega corporation (Madison, WI, United States) and
experiments were performed according to manufacturer’s protocols.
Tunel Assay
DNA fragmentation was detected using the ApopTag® Fluorescein in situ detection
kit from Millipore (Billerica, MA, United States) by following the manufacturer’s standard
protocol.
3.2.4. Statistical Analysis
All in vivo experiments were repeated three times (N = 3) with at least 3 mice per
group (n = 9; data from each group of three mice were pooled). All in vitro and laboratory
analysis experiments were repeated at least three or four times. The statistical analysis was

55
carried out by analysis of variance (ANOVA) (see Supplementary Table S1 for F-statistics)
and a Turkey’s HSD test to determine specific group differences. Further we performed an
unpaired student t-test, using Graph pad prism software (GraphPad Software Inc., La Jolla,
CA, United States). For all analyses ∗P < 0.05 was considered statistically significant and
are marked as (∗).
3.3 RESULTS
3.3.1 Altered Microbiome Is Associated with Increase in PAMPs and DAMPs in Gulf
War Chemical Exposed Mice
Studies have shown an association between altered microbiome and increase in
endotoxin levels in serum or feces (18). In this study, using the LAL assay, we estimated
the endotoxin levels (PAMPS e.g., LPS) in the stools of mice which were treated with
GW chemicals in comparison with the controls and found that there was a significant
increase in endotoxin levels of mice treated with GW chemicals compared to the controls
(Figure 1A; P < 0.05). We further assessed the amount of HMGB-1 which was released
in the small intestine (Figures 1B,C) using immunofluorescence microscopy and in the
blood circulation (Figures 1D,E) using a western blot analysis for serum HMGB-1 levels
in the circulation. These high amounts of DAMPS and PAMPS in the body will reach the
EGC and cause persistent glial reactivity.

56
3.3.2. Altered Microbiome (Dysbiosis) Correlates with an increased expression of
GFAP while gut decontamination with antibiotics decreases GFAP in Intestinal enteric
glial cells
Enteric glial cells which are found in close proximity with enteric neurons are very
abundant in the lamina propria, mucosa and sub mucosal regions of the small intestine (83).
Using immunofluorescence microscopy, we found that there was a significant increase
(P < 0.05) in GFAP expression in the small intestine of mice treated with GW chemicals
(PB + BER) compared to the control group, and mice co-exposed to GW chemicals and
antibiotics (Figures 2A,B). The increased expression of this protein has been associated
with a reactive EGC phenotype in IBS and IBD (100); (87).
3.3.3. Altered Microbiome Correlates with a Reactive EGC Phenotype Through
Activation of Toll-Like Receptors While Gut Decontamination via Antibiotic Usage
Reversed Activation
Our previous studies showed that the altered microbiome was associated with an
activation of Toll like receptors such as TLR4 and TLR5 in GW chemical treated mice
(18). In this study we show that there was a significant increase mRNA (Figure 3A) and
protein expression (Figures 3B,E) levels of TLR 2, 4, and 5 in mice which were exposed
to gulf war chemicals (Permethrin and pyridostigmine bromide) compared to mice treated
with only vehicle control and mice co exposed with GW chemicals and antibiotics (P <
0.05). We further detected a significant increased expression of TLR4 on EGC
(TLR4/GFAP colocalizations) in GW chemical treated (GW) mice compared to Vehicle
(CONT) and mice co-exposed with GW chemicals and antibiotics (GW + AB) (P < 0.05)
(Figures 3C,D) by immunofluorescence microscopy.

57
3.3.4 Altered Microbiome Associated Increased Expression of S100B in Reactive EGC
Resulting in NOS-2 Expression While Antibiotic Usage for Depletion of Bacteria
Reversed Such Activation
Using immunofluorescence microscopy, we found that there was a significant
increase in the expression of S100B in GW chemical treated mice compared to mice treated
with vehicle control and mice which were co exposed with GW chemicals and antibiotics
(P < 0.05) (Figures 4A,C). We also found that there was a significant increase in RAGE
expression in GW chemical treated mice in EGC by co-staining RAGE and GFAP (P <
0.05) compared to vehicle control treated mice. However, this increase was not significant
for mice treated with both GW chemicals and antibiotics (Figures 4B,D).
We then studied the interaction between RAGE and S100B using
immunofluorescence microscopy assuming that a co-localization of these two proteins
would suggest complex formation and aid interaction. We showed that there was
significant increase (P < 0.05) in S100β/RAGE complex formation in GW chemical
exposed mice (GW) and mice treated with vehicle control (CONT) or mice co-exposed
with GW chemicals and antibiotics (GW + AB) (Figures 5A,B). In Figure 6A using
RTqPCR we found that there was a significant increase in mRNA expression of inducible
nitric oxide synthase in the small intestine of GW chemical treated mice and mice treated
with vehicle control and mice co exposed with antibiotics and gulf war chemicals (n =
9, p < 0.05). Further, we showed that there was a marked increase in inducible nitric oxide
synthase (NOS-2) expression in the intestine tissues of mice treated with GW chemicals
(GW) compared to mice treated with vehicle control (CONT) and mice co-exposed with
GW chemicals and antibiotics (GW + AB), although this increase was not significant (P =
0.075, and 0.11 respectively) (Figures 6B,C).

58
These results are evidence of activation of a TLR-S100β/RAGE-iNOS pathway in
association to an altered microbiome in vivo as suggested by a decrease of activation
following the use of antibiotics to ensure gut decontamination.
3.3.5. Exposure to PAMPS (e.g., Lipopolysaccharides) and DAMPS (e.g., HMGB-1)
Causes the Activation of TLR4-s100β/RAGE-NO Pathway in EGC
EGC can respond to an over balance in gut microorganisms by detecting PAMPS
on/from the pathogen these bacteria such as cell wall, nucleic acid, flagella etc and mount
an effective immune response through toll like receptors or NOD-like receptors (88).
Using immunofluorescence microscopy, we found that there was significant
increase in TLR4 expression when we treated rat EGC with LPS or HMGB-1 (Figures
7A,B, P < 0.05). We also found an increase in S100β/RAGE complex formation in LPS
and HMGB1 treated cells compared to cells treated with vehicle control (P < 0.05) (Figures
8A–C). However, the difference between expression of these receptors was not
significantly different between the cells treated with HMGB1 alone compared to those
treated with HMGB1 + LPS-RS to block the TLR4 receptor. This indicates that possibly,
DAMPS like HMGB1 can trigger inflammatory pathways in EGCs via several other
receptors apart from TLR4.
We further evaluated the activation of inducible nitric oxide synthase and release
of nitric oxide in the rat EGC treated with LPS or HMGB1 (Figures 9A–D). We used RT
q PCR to evaluate the expression of nitric oxide synthase in rat EGC (Figure 9A). Our
results showed a significant increase in the expression of iNOS in cells treated with LPS
or HMGB1 compared to vehicle control (P < 0.01). We also found that there was a

59
significant increase in the protein expression of NOS-2 in LPS and HMGB-1 treated cells
compared to cells treated with vehicle control only as evaluated by immunofluorescence
microscopy (Figures 9B,C) (n = 3, P < 0.05). Finally, we investigated whether there was a
release of nitric oxide by the cells (Figure 9D). We found that NO release was significantly
increased LPS (2.6 fold) (∗P < 0.05), but only a marked increase in cells treated with
HMGB1 (P = 0.07) compared to vehicle control treated cells. Together, these results
indicate the activation of a TLR-S100B/RAGE pathway that subsequently led to the
increased production of nitric oxide, especially in response to microbial PAMPS.
3.3.6. Activation of NOX-2 and Increased peroxynitrite formation in Rat EGC
Studies have showed that NADPH oxidases are activated in response to pathogenic
stimuli in human EGC (101). We found that treatment of EGC with LPS or HMGB1
significantly increased their expression of NOX-2 (Figures 11A–D) (P < 0.05). This
activation was observed by immunofluorescence microscopy by detecting co-localization
events (per 100 cells) between two key subunits of the NOX-2 enzyme complex. One in
the lipid membrane GP91phox (labeled with green secondary antibody) and P47phox
(labeled with red antibody). We found a significant increase in these co-localizations in
LPS or HMGB1 treated cells compared to vehicle control treated cells (VEH) and cells
treated with LPS/HMGB1 and Apocynin (LPS + APO) a NADPH inhibitor (Apocynin
blocks the transport of p47 phox to the membrane) (∗P < 0.05).
NOX-2 induced superoxide and nitric oxide react rapidly to form peroxynitrite, an
indicator of redox related formation of tyrosyl radical and subsequent formation of tyrosine
nitration We also observed that there was a significant increase in formation of
60
peroxynitrite (shown by increased 3- nitrotyrosine formation) in LPS or HMGB1 treated
EGC compared to Vehicle control (VEH) treated and LPS or HMGB1 and apocynin (LPS
+ APO) or (HMGB1 + APO) (Figures 12A–D) treated EGC (P < 0.05, n = 6).
3.3.7. Oxidative Stress Triggers Activation of NLRP-3 Inflammasome Which Results in
Increased Inflammation
Reactive oxygen species (ROS) can trigger activation of inflammasomes resulting
in caspase 1 mediated cleavage of Il-1β and IL-18 proinflamatory cytokines (102). Our
results (Figures 13A,B) showed significant increase in mRNA expression of NLRP-3,
Caspase-1, IL-1β and TNF-α in LPS treated EGC but not HMGB1 treated cells which only
showed an increase in TNF-α expression compared to the vehicle control (P > 0.05).
Treatment of EGC with LPS and apocynin (LPS + APO) and FBA (LPS + FBA)
significantly decreased the observed mRNA expression (P < 0.05).
We then investigated the protein expression of NLRP-3 and ASCII and adaptor
protein of NLRP-3 in rat EGC using immunofluorescence microscopy. We found that cells
treated with LPS but not HMGB1 treated cells showed a significant increase in NLRP-3
and ASCII complex formation compared to Vehicle control treated cells (VEH) indicating
activation of the NLRP-3 inflammasome, when EGC encounter PAMPS. We further found
that treatment of cells with LPS and FBA (LPS + FBA) showed a significant decrease in
NLRP-3 protein activation (P < 0.05), (Figures 13C–E) suggesting the role of NOX-2
derived peroxynitrite as a candidate for the inflammasome formation.

61
3.3.7. Increased DNA Fragmentation in Reactive Rat EGC Following Stimulation
With LPS and Its Dependence on NOX-2-Induced Oxidative Stress
Increased pathogenic stimuli were found to initiate apoptosis in EGC (101). We
also investigated the fate of these reactive EGCs when continually exposed to PAMPs or
DAMPs though a tunel assay to detect fragmented DNA.
We found that LPS or HMGB1 treated cells showed a significant increase in co-
localization events per 100 cells compared to cells treated with only vehicle control (P =
0.043) (Figures 14A–D). There was a significant decrease in tunel events when cells were
treated with LPS and Apocynin but not FBA. And when cells were treated with HMGB1
and apocynin or FBA, there where was no significant decrease in tunel events.
3.3.8. Reactive EGC Contribute to Inflammation and Intestinal Barrier Integrity in Small
Intestine: Gut Decontamination by Antibiotics and Blocking EGC Immune Activation Restores
Gut Barrier Protein Levels in GWI Mice
Cytokines, ROS and growth factors etc affect tight junction proteins, water
channels and processes such as differentiation, apoptosis etc. (86). In this study, we showed
that when LPS primed intestinal epithelial cells were treated with culture fluid from EGC,
there was a significant increase in mRNA expression of proinflammatory cytokines in IEC-
6 cells (Figure 14E) (P < 0.05). LPS primed IEC-6 cells which were treated with culture
fluids from EGC treated with LPS (LPS-SN) showed a significant increase in mRNA
expression of IL-1β, MCP1 and TNF-α when compared to the vehicle control (VEH) (P <
0.05). LPS primed cells treated with culture fluids from Vehicle control treated EGC
showed a significant decrease in MCP-1 expression (P < 0.05) and a marked decrease in

62
TNF-α but no significant decrease in IL-1β expression compared to the LPS primed IEC-
6 cells treated with culture fluids from LPS treated EGC.
To ensure that EGC immune activation via an altered microbiome plays a
significant role in gut barrier protein expression in the intestine, we studied the GW
chemical treated mice for their protein levels of aquaporin, a selective water channel,
occludin and claudin-2. Results showed that administration of antibiotics was associated
with significantly restored the levels of aquaporin 3 in the intestine of GWI-treated mice
when compared to GW-treatment (Figures 15A–C). Levels of occludin were also restored
when compared to controls but were significantly elevated when compared to GW-mice
only (Figures 15D–F). Claudin-2 levels have been found to be increased in association with
gut integrity loss. Our results showed that use of antibiotics significantly decreased the
levels of claudin-2 in antibiotic treated mice when compared to GWI-mice alone (Figures
15G–I).
To show that EGC immune activation as a result of TLR4 and specific
inflammation was responsible in part in causing differential expression of tight junction
proteins that may play a significant role in gut barrier protein integrity loss, we chose to
use two significant compounds that has been studied for their TLR-antagonism (SSnB) and
anti-inflammatory properties (Sodium Butyrate-BT) specifically in the intestine. Results
showed that a combined use of TLR4 antagonist and butyrate markedly increased
aquaporin levels (Figure 15A) in the small intestine when compared to GW-mice while
levels of Claudin-2 were significantly decreased in the small intestine following SSnB +
BT administration when compared to the same group (Figure 15D). Occludin which is
decreased in GW mice and plays a significant role in maintaining gut barrier integrity was

63
also restored to normal levels in the diseased mice following administration of SSnB + BT
(Figure 15G). The results suggested that blocking TLR4 and subsequent immunoactivation
that resulted in a reactive EGC phenotype in mice due to dysbiosis can be reversed by the
use of these antagonists. Also, the results show that reactive EGCs might have a significant
role in causing gut barrier dysfunction following activation via release of PAMPs and
DAMPs and can be a cause of symptom persistence in GWI.
3.3.9 Reactive EGC Modulate Tight Junction Proteins and Aquaporins in Intestinal
Epithelial Cells
We investigated the hypothesis that EGC which are exposed to DAMPS (e.g.,
HMGB-1) and PAMPS (e.g., LPS) modulate intestinal tight junction proteins and selective
water channels by treating LPS primed IEC-6 cells with culture fluids freshly collected
from EGC which have been treated with LPS (LPS-SN), HMGB1 (HMGB1-SN), vehicle
(VEH-SN), LPS + SsnB + Butyrate (LPS + SsnB + BT) or HMGB1 + SsnB + Butryate
(HMGB1 + SsnB + BT). Protein expression was studied by immunofluorescence
microscopy observed at a total magnification of 400X; scale 10 μm. We found that
expression of aquaporin-3 was significantly increased when IEC-6 cells were treated with
LPS-SN, while when they were treated withHMGB1-SN the expression was significantly
decreased compared to IEC 6 cells only treated with vehicle control (VEH) (n = 3, p <
0.05). IEC-6 cells treated which were treated with culture fluids from vehicle control
treated EGC (VEH-SN) showed only a slight increase in aquaporin-3 protein expression,
while IEC-6 cells treated with inhibitors SsnB and Butyrate together with LPS or HMGB1
restored expression of aquaporin 3 almost back to similar levels as IEC-6 cells treated with
vehicle control (VEH) (Figures 16A,B). Claudin 2 expression increased significantly when
64
IEC-6 cells were treated with culture fluids from EGC treated with LPS-SN (n = 3; p <
0.05), but only markedly, when with HMGB1 treated culture fluids (HMGB1-SN). And
when IEC-6 cells were treated with culture fluids for EGC treated with SsnB and butyrate
together with HMGB1 or LPS, claudin 2 levels were decreased similar to vehicle control
treated cells (VEH) (Figures 16C,D). Higher magnification (630X and scale bar 20 μm)
images taken under confocal microscopy are included to show the localization of this
protein in the membrane (Figure 17A). IEC-6 cells that were treated with culture fluids
from EGC treated with LPS (LPS-SN) or HMGB1(HMGB1-SN) showed a significant
decrease in occludin protein expression compared to vehicle control treated IEC-6 cells
(VEH) (Figures 16E,F). Treatment with culture fluids from EGC which had been treated
with LPS or HMGB1 together with inhibitors (SsnB and butyrate) showed a restoration in
occludin levels compared to the control (VEH), although the effect was stronger in IEC 6
cells treated with LPS + SsnB + BT compared to HMGB1 + SsnB + BT treated EGC
culture fluids. Higher magnification (630X and scale;20 μm) images taken under confocal
microscopy were used to show the localization of this protein in the membrane (Figures
17A,B). The tubulin staining used in occludin images to show the extent of occludin
traversing the tubulin outline thus signifying their apical membrane localization as widely
perceived (Shown by white arrows).
These results indicate that reactive EGC are strong players in modulating tight
junction protein expression through production of factors that may influence gut barrier
integrity.

65
3.4 DISCUSSION
Our results propose a possible molecular mechanism to explain the altered
microbiome associated inflammation in a cellular level and poor gastrointestinal health
which we observed in our studies on GWI (18,29). The results reported in this study are an
advancement to our previous reported work in Gulf War illness pathology. Since gut
sterility by antibiotics reversed immunopathology in GWI we used the same approach to
correlate the observed gut dysbiosis with EGC immunoactivity. We found a novel role of
altered microbiome in causing a reactive EGC phenotype characterized by activation of
toll-like receptors, RAGE/S100B and increased expression of nitric oxide synthase. This
pathway contributes to NADPH oxidase mediated generation of ROS which trigger
inflammation. The mechanism of NOX2 mediated inflammation is well accepted as we
and others have shown the role of peroxynitrite mediated inflammation in liver, kidney and
gastrointestinal disturbances (29). Further, we propose that this increased inflammation and
ROS may result in enteric gliopathy and a later episode of enteric neuropathy although this
needs to be investigated further and is a speculation at this point. With continued
production of proinflammatory cytokines and other destructive factors (e.g., ROS) by
reactive EGC, the entire or part of the epithelial barrier in the gut might lose its integrity.
This hypothesis is further strengthened by our results from the supposed blockage of TLR4
and inflammation by using SSnB and Butyrate (thus blocking EGC immune activation),
further exacerbating the observed gastrointestinal pathology in gulf war illness. This
explanation not only helps us understand the acute phase of gulf war associated
gastrointestinal inflammatory disorders, but also could explain why these symptoms may

66
persist for long since a vicious cycle might exist following a continuous assault on the
intestinal epithelial cells.
Enteric glial cells are important regulators of the gastrointestinal tract health. They
can influence the gut microenvironment both positively or negatively depending on
surrounding conditions (84,89). Remarkably they can respond to the presence of bacteria
pathogens through this TLR-RAGE/S100β-iNOS pathway. This is through the recognition
of bacterial parts such as cell wall, high bacterial populations, DNA etc via toll like
receptors. With an altered microbiome, there is proliferation of certain bacterial species at
the expense of others and this change upsets the natural healthy balance in microbiome.
This disruption happens due to several stressful stimuli e.g., infection, diet or exposure to
chemicals such as in the case of gulf war illness.
Our previous studies have clearly shown that exposure to GW chemicals indeed
results in altered microbiome (18,29). We found an increase in the
Firmicutes/Bacteriodetes ratio with significant increases in several Firmicutes genera in
gulf war chemical treated mice compared to the vehicle controls. Further we found an
associated loss in bacteria populations such as Bacteroides, Oscillibacter and
Ruminiclostridia. Increased abundance of Bacteroides for example are associated with
healthy gastrointestinal states (103), while Oscillibacter and Ruminiclostridia have also
been shown to be abundant in healthy controls in studies of Crohn’s disease. The decline
in beneficial microbiota may have allowed for the proliferation of several bacteria
populations at genus level, which usually exist in low percentages. There was a rise in
several Coriobacteria, Bacilli and Verrucomicrobia bacteria. These have all been
associated to increase in IBS and IBD (91). This upset balance of bacteria population
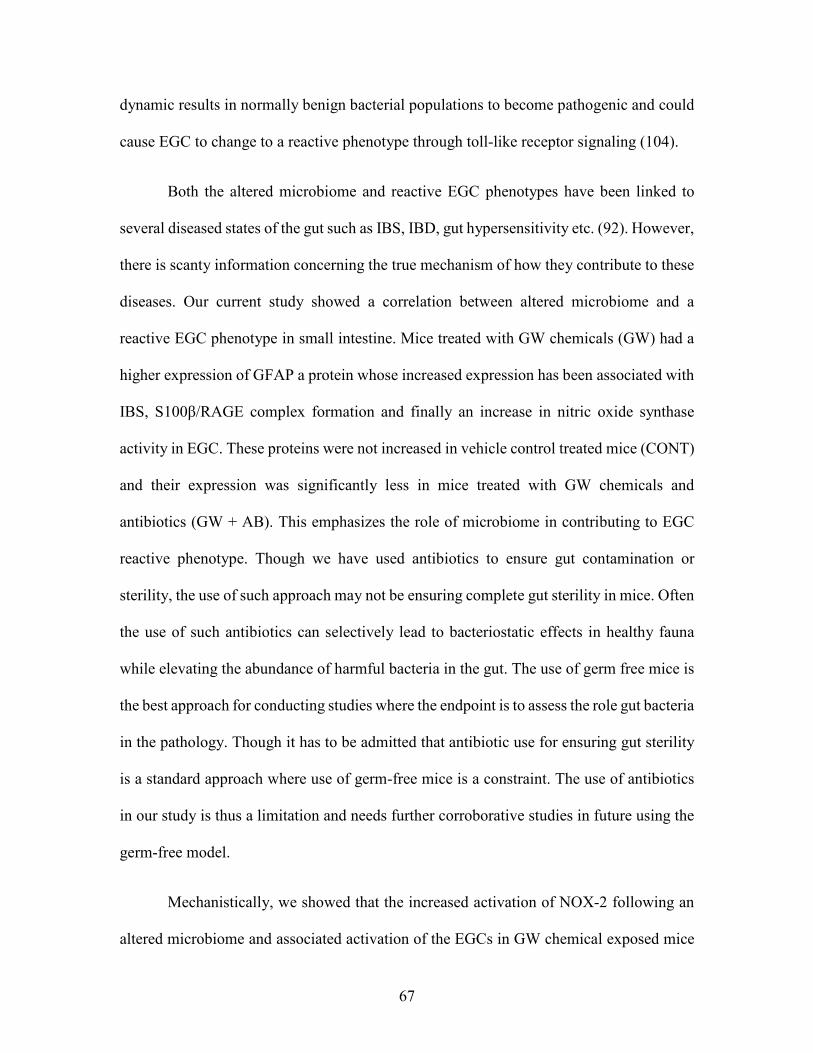
67
dynamic results in normally benign bacterial populations to become pathogenic and could
cause EGC to change to a reactive phenotype through toll-like receptor signaling (104).
Both the altered microbiome and reactive EGC phenotypes have been linked to
several diseased states of the gut such as IBS, IBD, gut hypersensitivity etc. (92). However,
there is scanty information concerning the true mechanism of how they contribute to these
diseases. Our current study showed a correlation between altered microbiome and a
reactive EGC phenotype in small intestine. Mice treated with GW chemicals (GW) had a
higher expression of GFAP a protein whose increased expression has been associated with
IBS, S100β/RAGE complex formation and finally an increase in nitric oxide synthase
activity in EGC. These proteins were not increased in vehicle control treated mice (CONT)
and their expression was significantly less in mice treated with GW chemicals and
antibiotics (GW + AB). This emphasizes the role of microbiome in contributing to EGC
reactive phenotype. Though we have used antibiotics to ensure gut contamination or
sterility, the use of such approach may not be ensuring complete gut sterility in mice. Often
the use of such antibiotics can selectively lead to bacteriostatic effects in healthy fauna
while elevating the abundance of harmful bacteria in the gut. The use of germ free mice is
the best approach for conducting studies where the endpoint is to assess the role gut bacteria
in the pathology. Though it has to be admitted that antibiotic use for ensuring gut sterility
is a standard approach where use of germ-free mice is a constraint. The use of antibiotics
in our study is thus a limitation and needs further corroborative studies in future using the
germ-free model.
Mechanistically, we showed that the increased activation of NOX-2 following an
altered microbiome and associated activation of the EGCs in GW chemical exposed mice

68
plays a significant role in contributing to the observed intestinal inflammatory phenotype.
NOX-2 in EGC and in adjacent intestinal cells, participates in oxidative stress which results
from the increase in nitric oxide production. We found that the generated ROS triggered
activation of the NLRP-3 inflammasome which further caused increase in inflammation
and programmed cell death as showed by increased DNA fragmentation (tunel assay) in
rat EGCs stimulated with LPS and/or HMGB1.
This increased inflammation and direct loss in enteric glia has been reported as in
Chron’s disease (84,94). The reactive inflammatory glial phenotype is detrimental to the
health of the gastrointestinal tract because it produces destructive factors which interact
with surrounding cells in the intestine e.g., intestinal epithelial cells, enteric neurons etc. In
our study we showed that when EGC conditioned media was applied to primed epithelial
cells, there was an increase in proinflammatory cytokine expression such as IL1β, MCP-1
and TNF-α which can be conducive to a leaky gut microenvironment. Furthermore, we
observed that a reactive EGC phenotype can also have detrimental effects on the EGCs as
shown by increased DNA fragmentation and cell death through the increased inflammation
and ROS generated. This ultimately may result in programmed cell death in glia by
pyroptosis or apoptosis as shown elsewhere (101). The general loss in enteric glia could
lead to suboptimal functioning of enteric neurons and even enteric neuropathy (105). This
mechanism could be a possible explanation for the symptoms of GWI which continue to
persist for 25 years though the present report does not study the role of an activated EGC
on intestinal neurons. However, the effect of the reactive EGCs on intestinal epithelial cell
barrier integrity can be profound as a blockade of the EGC activation mechanisms by SSnB
and butyrate prevented protein alterations in the tight junctions. The results are also
69
interesting since we observe a cyclical pattern of epithelial cell damage-activation of EGCs
and a link to altered expression of tight junction proteins such as claudin-1,2, occludin or
ZO-1 that may contribute to gut-leakiness, that eventually might fuel a continuous
persistence of inflammation in the local intestinal microenvironment.
3.5. CONCLUSION
We report that EGC are important players in GWI gastrointestinal disease
pathology and respond to the altered microbiome in the host gut by converting to a reactive
phenotype which greatly affects the healthy functioning of the gastrointestinal tract. This
reactive phenotype significantly contributes to oxidative stress which further triggers
inflammation, loss of gut barrier integrity and possibly death of enteric glia and enteric
neurons, although further investigations need to be carried out to confirm these neuronal
effects. Further, these findings provide insights into how a possible altered microbiome
may be contributing to the observed GWI intestinal epithelial cell inflammatory phenotype
by destabilizing the redox status of glial cells and adjacent epithelial cells via NOX-2
mediated peroxynitrite generation, inflammasome activation and release of pro
inflammatory cytokines. It has to be further realized that more concrete evidence will be
needed that involves germ free mice to conclude with certainty that microbiome alterations
definitely dictate the observed EGC effects and therefore remains a limitation in this study.
Antibiotic use for gut sterility should be overcome with more stringent
experimental designs such as germ-free mouse models and gnotobiotic mice. Nevertheless,
the present evidence will therefore be valuable to consider EGC nitric oxide production,

70
formation of peroxynitrite, a redox signaling intermediate and inflammation pathways as
therapeutic targets in gulf war illness.

71
Figure 3.1. Altered microbiome associated increase PAMPS and DAMPS
A and B. Stool endotoxin levels. Endotoxin levels in stool samples were determined by the LAL assay. Graph A show the levels of endotoxin in Endotoxin Units (Eu) in vehicle control (CONT, n=9) treated mice, gulf war chemical exposed mice (GW, n=9) and mice co-exposed with antibiotics (GW+AB, n=9) (*P<0.05). C. Expression of HMGB-1 in small intestine tissues. Expression of HMGB1 was assessed by immunofluorescence microscopy at (total Magnification 200X; scale bar 100 µm). Images show immunoreactivity in the distal part of the small intestine for vehicle control treated mice (CONT, n=9), GW chemical treated mice (GW, n=9) and mice co-exposed with gulf war chemicals and antibiotics (GW, n=9). C. Quantitative morphometric analysis of HMGB-1 immunoreactivity represented as arbitrary light units in the region of interest (%ROI) *P<0.05. D. Serum High mobility group box 1 (HMGB1) levels. Serum HMGB-1 levels were estimated by western blot analysis for mice treated with control (CONT, n=3), Gulf war chemical exposed mice (GW, n=5) and mice co-exposed to antibiotics and GW chemicals (GW+AB, n=3). Ponceau red staining was used for normalization of protein. E. Quantitative morphometric analysis of western blot bands normalized against total Ponceau. The Y axis shows HMGB-1/Ponceau S ratio. (*P<0.05).
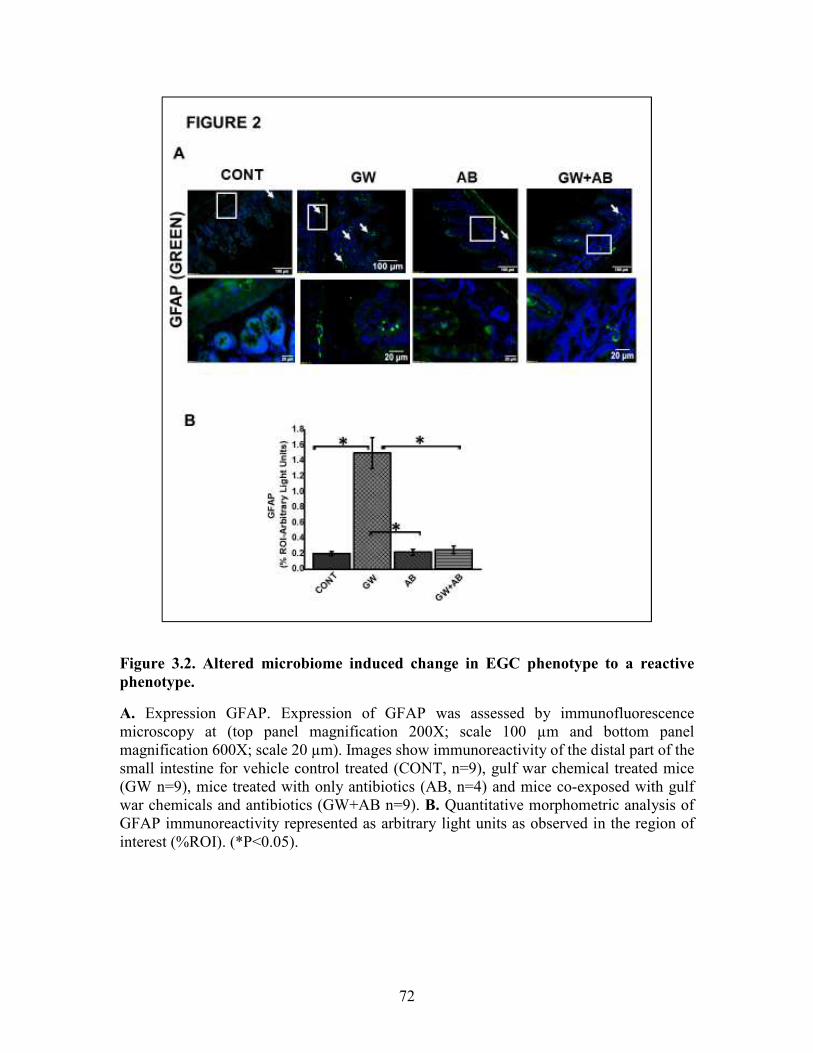
72
Figure 3.2. Altered microbiome induced change in EGC phenotype to a reactive
phenotype.
A. Expression GFAP. Expression of GFAP was assessed by immunofluorescence microscopy at (top panel magnification 200X; scale 100 µm and bottom panel magnification 600X; scale 20 µm). Images show immunoreactivity of the distal part of the small intestine for vehicle control treated (CONT, n=9), gulf war chemical treated mice (GW n=9), mice treated with only antibiotics (AB, n=4) and mice co-exposed with gulf war chemicals and antibiotics (GW+AB n=9). B. Quantitative morphometric analysis of GFAP immunoreactivity represented as arbitrary light units as observed in the region of interest (%ROI). (*P<0.05).
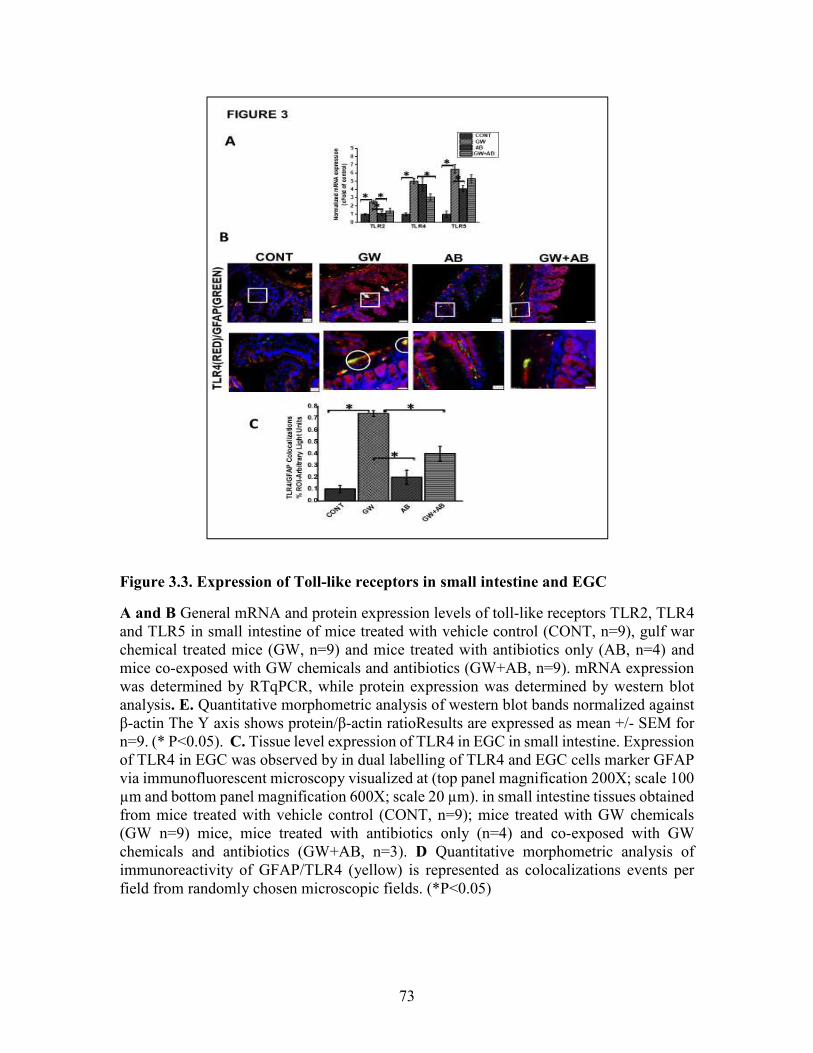
73
Figure 3.3. Expression of Toll-like receptors in small intestine and EGC
A and B General mRNA and protein expression levels of toll-like receptors TLR2, TLR4 and TLR5 in small intestine of mice treated with vehicle control (CONT, n=9), gulf war chemical treated mice (GW, n=9) and mice treated with antibiotics only (AB, n=4) and mice co-exposed with GW chemicals and antibiotics (GW+AB, n=9). mRNA expression was determined by RTqPCR, while protein expression was determined by western blot analysis. E. Quantitative morphometric analysis of western blot bands normalized against β-actin The Y axis shows protein/β-actin ratioResults are expressed as mean +/- SEM for n=9. (* P<0.05). C. Tissue level expression of TLR4 in EGC in small intestine. Expression of TLR4 in EGC was observed by in dual labelling of TLR4 and EGC cells marker GFAP via immunofluorescent microscopy visualized at (top panel magnification 200X; scale 100 µm and bottom panel magnification 600X; scale 20 µm). in small intestine tissues obtained from mice treated with vehicle control (CONT, n=9); mice treated with GW chemicals (GW n=9) mice, mice treated with antibiotics only (n=4) and co-exposed with GW chemicals and antibiotics (GW+AB, n=3). D Quantitative morphometric analysis of immunoreactivity of GFAP/TLR4 (yellow) is represented as colocalizations events per field from randomly chosen microscopic fields. (*P<0.05)

74
Figure 3.4. Expression of S100B and RAGE in the small intestine
A . Expression levels of S100B in EGC. Protein expression levels of S100B in EGC was determined by co-staining S100B with GFAP and assessed by immunofluorescence microscopy at (top panel magnification 200X; scale 100 µm and bottom panel magnification 600X; scale 20 µm). Images show immunoreactivity in distal part of the small intestine for vehicle control treated mice (CONT, n=9), gulf war chemical treated mice (GW, n=9) and gulf war chemical treated mice, mice treated with antibiotics only (AB, n=4) and mice co-exposed with antibiotics (GW+AB, n=9). C. Quantitative morphometric analysis of immunoreactivity of GFAP/S100B (yellow) is represented as colocalizations events per field from randomly chosen microscopic fields (% ROI). *(P<0.05). B. Expression of RAGE in EGC Protein expression levels of RAGE in EGC was determined by co-staining RAGE with GFAP and assessed by immunofluorescence microscopy at (top panel magnification 200X; scale 50 µm and bottom panel magnification 600X; scale 20 µm). . Images show immunoreactivity in distal part of the small intestine for vehicle control treated mice (CONT, n=9), gulf war chemical treated mice (GW, n=9) mice treated with antibiotics only (AB, n=4) and gulf war chemical treated mice co-exposed with antibiotics (GW+AB, n=3). D. Corresponding quantitative morphometric analysis of immunoreactivity of GFAP/RAGE (yellow) is represented as colocalizations events per field from randomly chosen microscopic fields (% ROI). *(P<0.05)

75
Figure 3.5. Formation of S100B/RAGE complex in small intestine
A. S100B(Green)/RAGE(Red) complex formation expression in EGC in small intestine tissues. Protein expression levels were assessed by immunofluorescence microscopy of tissues at (top panel magnification 200X; scale 50µm and bottom panel magnification 600X; scale 20 µm). Images show immunoreactivity the distal part of the small intestine for gulf war chemical treated mice (GW, n=9), vehicle control (CONT, n=9), mice treated with antibiotics only (n=4) and mice co-exposed GW chemicals and antibiotics (GW+AB, n=9). B. Quantitative morphometric analysis of immunoreactivity for S100B/RAGE is represented as colocalization events per field for randomly chosen fields (% ROI). (*P<0.05).

76
Figure 3.6. Activation of NOS-2 in small intestine.
A. NOS-2 mRNA expression in the small intestine of intestine of mice treated with vehicle control (CONT, n=9), gulf war chemical treated mice (GW, n=9), mice treated with antibiotics only (AB, n=4) and mice co-exposed with GW chemicals and antibiotics (GW+AB, n=9. *P<0.05) was determined by RTqPCR. B. Protein expression levels of NOS- 2 in enteric glial cells was determined by immunofluorescence microscopy of tissues and imaged at (top panel magnification 200X; scale 50µm and bottom panel magnification 600X; scale 20µm). C. Quantitative morphometric analysis of immunoreactivity for GFAP/NOS-2 represented as colocalization events per field for randomly chosen fields (% ROI)

77
Figure 3.7: Exposure to DAMPS and PAMPS cause activation of TLR4 in EGC
A. TLR4 activation in rat Enteric Glial Cells (EGC) (n=6). Colocalization of TLR4 and Flotillin in EGC treated with either vehicle control (VEH) or LPS, LPS+LPS-RS, HMGB-1 or HMGB1+LPS-RS determined by immunofluorescence microscopy at (magnification 400X; scale 50µm).B. Quantitative morphometric analysis of TLR4/Flotillin colocalizations between red and green immunoreactivity were determined for every 100 cells per field. Fields were chosen randomly, and colocalizations represented as immunoreactivity in the region of interest (%ROI). (*P<0.05)

78
Figure 3.8. EGC exposed to LPS or HMGB-1 change to a reactive phenotype
A. S100B/RAGE complex formation in rat Enteric Glial Cells (EGC) (n=6). Colocalization of S100β and RAGE in EGC treated with either vehicle control (VEH) or LPS, LPS+LPS-RS, HMGB1 or HMGB-1+HMGB-1+LPS-RS was determined by immunofluorescence microscopy at (total magnification 400X and scale 20 µm) B and C Quantitative morphometric analysis of S100B/RAGE complex formation. Colocalizations between red and green immunoreactivity were determined for every 100 cells per field for randomly chosen fields and represented as immunoreactivity in the region of interest (% ROI). (*P<0.05)
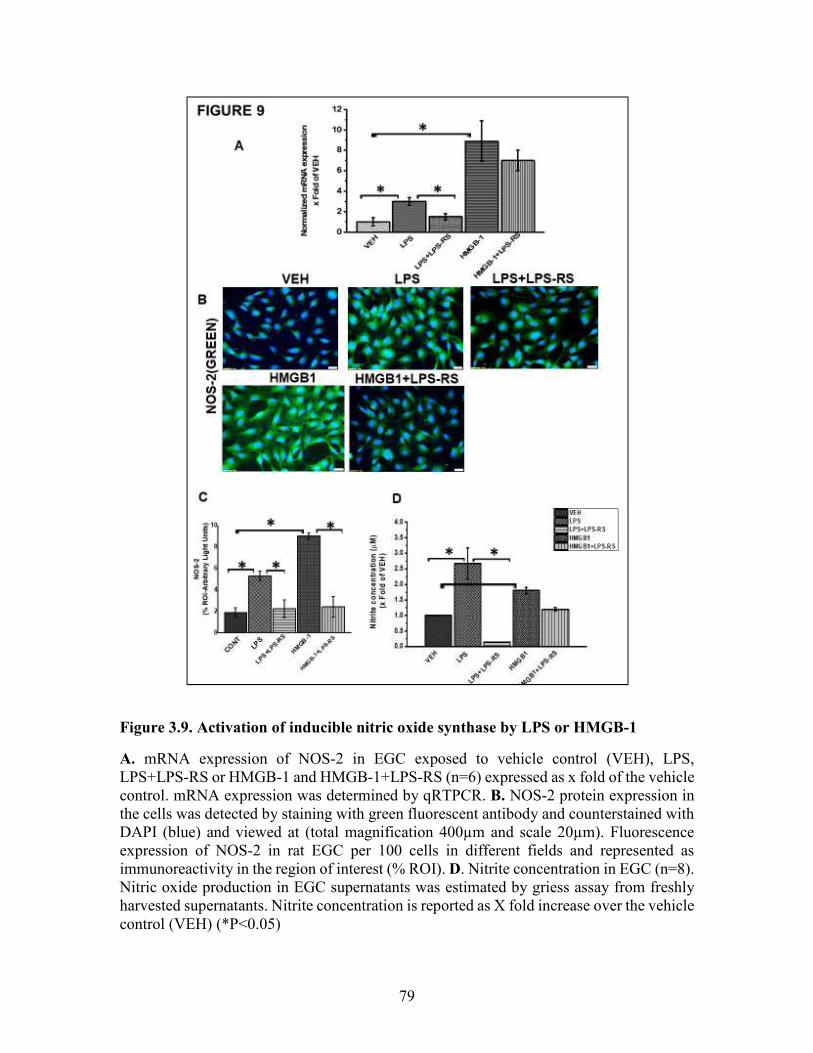
79
Figure 3.9. Activation of inducible nitric oxide synthase by LPS or HMGB-1
A. mRNA expression of NOS-2 in EGC exposed to vehicle control (VEH), LPS, LPS+LPS-RS or HMGB-1 and HMGB-1+LPS-RS (n=6) expressed as x fold of the vehicle control. mRNA expression was determined by qRTPCR. B. NOS-2 protein expression in the cells was detected by staining with green fluorescent antibody and counterstained with DAPI (blue) and viewed at (total magnification 400µm and scale 20µm). Fluorescence expression of NOS-2 in rat EGC per 100 cells in different fields and represented as immunoreactivity in the region of interest (% ROI). D. Nitrite concentration in EGC (n=8). Nitric oxide production in EGC supernatants was estimated by griess assay from freshly harvested supernatants. Nitrite concentration is reported as X fold increase over the vehicle control (VEH) (*P<0.05)
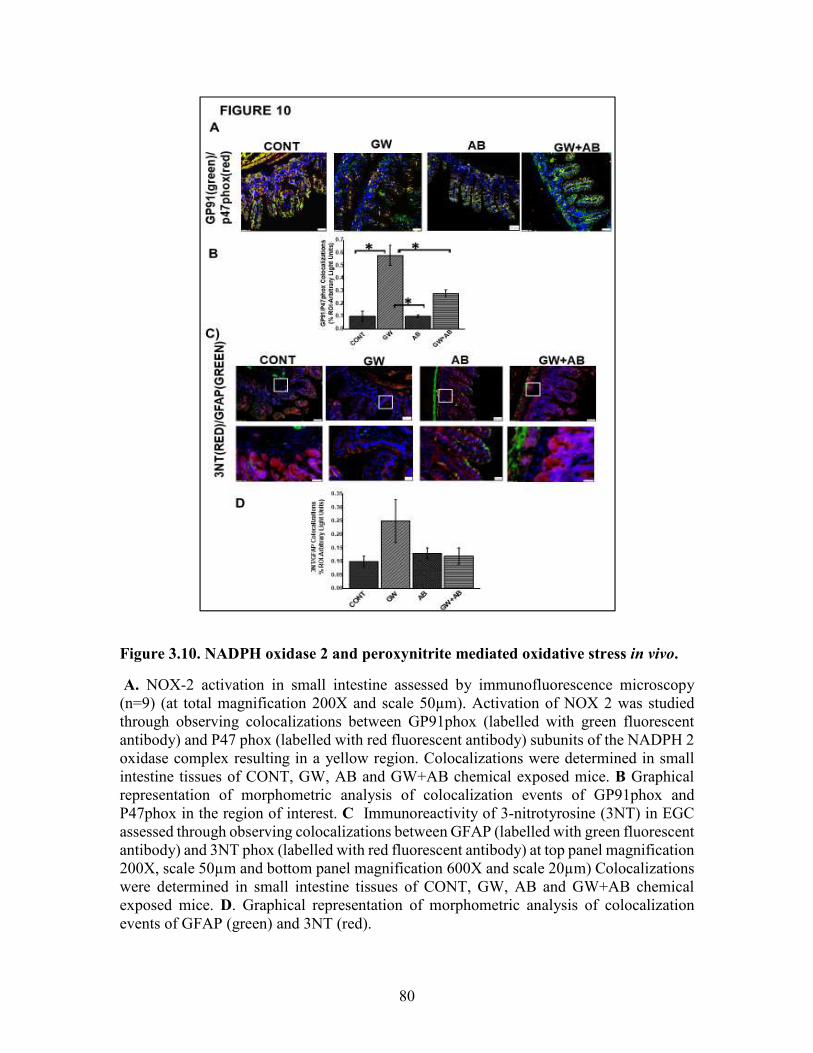
80
Figure 3.10. NADPH oxidase 2 and peroxynitrite mediated oxidative stress in vivo.
A. NOX-2 activation in small intestine assessed by immunofluorescence microscopy (n=9) (at total magnification 200X and scale 50µm). Activation of NOX 2 was studied through observing colocalizations between GP91phox (labelled with green fluorescent antibody) and P47 phox (labelled with red fluorescent antibody) subunits of the NADPH 2 oxidase complex resulting in a yellow region. Colocalizations were determined in small intestine tissues of CONT, GW, AB and GW+AB chemical exposed mice. B Graphical representation of morphometric analysis of colocalization events of GP91phox and P47phox in the region of interest. C Immunoreactivity of 3-nitrotyrosine (3NT) in EGC assessed through observing colocalizations between GFAP (labelled with green fluorescent antibody) and 3NT phox (labelled with red fluorescent antibody) at top panel magnification 200X, scale 50µm and bottom panel magnification 600X and scale 20µm) Colocalizations were determined in small intestine tissues of CONT, GW, AB and GW+AB chemical exposed mice. D. Graphical representation of morphometric analysis of colocalization events of GFAP (green) and 3NT (red).

81
Figure 3.11. NADPH oxidase 2 activation in rat EGC
A and B Activation of NOX-2 in rat EGC (n=6). Activation of NOX 2 was studied through observing colocalizations between GP91phox (labelled with green fluorescent antibody) and P47 phox (labelled with red fluorescent antibody) subunits of the NADPH 2 oxidase complex resulting in a yellow region. Colocalization (yellow) of GP91phox and P47phox was detected in vehicle VEH, LPS, LPS + apocynin (LPS+APO), HMGB-1, HMGB-1+APO treated cells at total magnification 400X; scale 20µm). C and D Morphometric analysis of GP91/p47phox colocalization events in rat EGC per 100 cells in different fields. (*P<0.05)
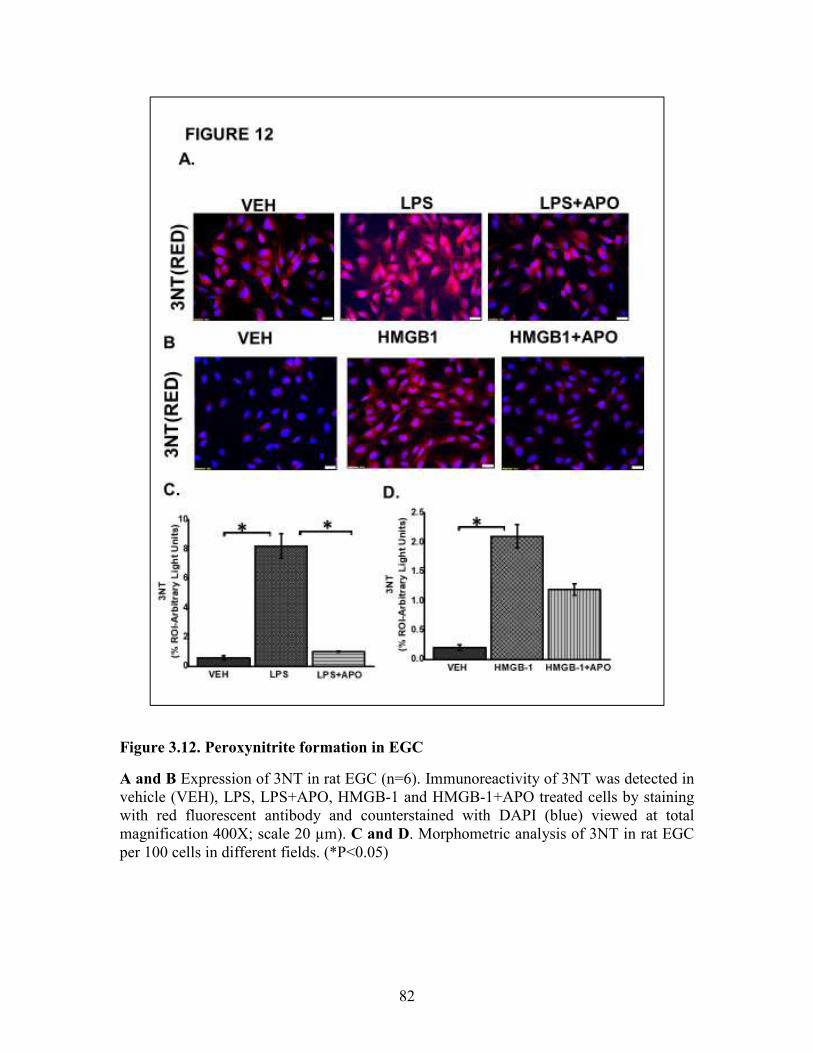
82
Figure 3.12. Peroxynitrite formation in EGC
A and B Expression of 3NT in rat EGC (n=6). Immunoreactivity of 3NT was detected in vehicle (VEH), LPS, LPS+APO, HMGB-1 and HMGB-1+APO treated cells by staining with red fluorescent antibody and counterstained with DAPI (blue) viewed at total magnification 400X; scale 20 µm). C and D. Morphometric analysis of 3NT in rat EGC per 100 cells in different fields. (*P<0.05)

83
Figure 3.13. ROS mediated activation of NLRP-3 inflammasome and inflammation
in EGC
A and B. Quantitative real time PCR (qRT-PCR) analysis of inflammasome and inflammation (n=6). mRNA expression of NLRP-3, caspase-1, IL-1β and TNF-α in rat EGC which were treated with vehicle (VEH), LPS+ apocynin (LPS+APO), LPS+ phenylboronic acid (LPS+FBA), HMGB-1, HMGB-1+APO. mRNA expression is represented as a fold change of the vehicle control. Data points are represented as mean ±SEM (n=3). (*P>0.05) C. NLRP-3/ASC2 protein expression in rat EGC assessed by immunofluorescence microscopy and viewed at total magnification 400X; scale 20µm). Colocalization events were determined for every 100 cells per field in cells treated with LPS, LPS+APO, LPS+FBA, HMGB-1, HMGB-1+APO, HMGB1+FBA. D and E. Quantitative morphometric analysis of fluorescence intensity of NLRP-3/ASC2. Fields for morphometric analysis were randomly selected from different fields per slide and represented as % region of interest (% ROI). (*P<0.05)

84
Figure 3.14. DNA fragmentation of rat EGC.
A and B Tunel assay showing DNA fragmentation (n=6). DNA fragmentation was determined by the Tunel assay in Vehicle (VEH), LPS, LPS+APO, LPS+FBA, HMGB-1, HMGB-1+APO, HMGB-1+FBA treated cells viewed at total magnification 400X; scale 10µm. C and D. Quantitative morphometric analysis of fluorescence expression of Tunel positive cells represented as Tunel events per field. (*P<0.05). E. Effect of EGC culture
fluids on LPS primed intestinal epithelial cells. mRNA expression of IL-1β, MCP-1 and TNF-α in IEC-6 cells which have been primed with LPS and treated with culture fluids from EGC treated with LPS and vehicle control (n=6) represented as x Fold of the vehicle control.

85
Figure 3.15. Expression of claudin 2, occludin and aquaporin 3 in mouse small
intestine.
A, C and F. Protein expression of occludin, claudin 2 and aquaporin 3 in mouse small intestine was determined by immunofluorescence microscopy and visualized at total 200X; scale 50µm in tissues obtained from mice treated with vehicle control (CONT, n=6); mice treated with GW chemicals (GW n=9) mice co-exposed with GW chemicals and antibiotics (GW+AB, n=9) and mice treated with GW chemicals, Sparstalonin B (SsnB) and Sodium butyrate (GW+SsnB+BT)(n=6) (A, D and G). Higher magnification images for GW chemical treated group (GW) focusing on the apical or apical-lateral membranes total magnification 600X; scale 20µm) (C, F, I). Quantitative morphometric analysis of immunoreactivity of occludin or aquaporin 3 is represented as % ROI. (*P<0.05). (B, E, H)

86
Figure 3. 16. Protein expression of aquaporin 3, claudin 2 and occludin in intestinal
epithelial cells.
A, C and E: Protein expression of aquaporin-3, claudin-2 and occludin in IEC 6 cells treated with culture fluids from Vehicle (VEH-SN), LPS (LPS-SN), HMGB1 (HMGB1-SN) and inhibitors SsnB and butyrate (LPS+SsnB+BT and HMGB1+SsnB+BT) treated EGC. The expression of these proteins was studied by immunofluorescence microscopy and viewed at 400X total magnification; scale 10µm. Yellow arrows indicate the localization of the proteins in the cell membrane. B, D and F: Quantitative morphometric analysis of immunoreactivity of aquaporin, claudin 2 and Occludin represented as % ROI (n=3, *P<0.05).

87
Data Availability Statement
The datasets generated for this study can be found in the Supplementary Material.
Ethics Statement
The animal study was reviewed and approved by the USC Institutional Research Board
(USC IACUC).
Author Contributions
SC and DK designed and performed the experiments. DK, SS, DB, RS, YL, AM,
MA, and AK performed the experiments. KS, PJ, and SL analyzed and interpreted the
data. PN and MN analyzed the data and edited the manuscript. NK, KS, and RH edited
the manuscript. SC and DK wrote the manuscript, edited and analyzed the data.
Conflict of Interest
The authors declare that the research was conducted in the absence of any
commercial or financial relationships that could be construed as a potential conflict of
interest. The reviewer GW and handling Editor declared their shared affiliation at the
time of the review.
Acknowledgments
We are deeply grateful to Benny Davidson (Instrument Resource Facility,
University of South Carolina School of Medicine) and AML Labs (Baltimore, MD,
United States) for providing technical and consultation services. We acknowledge the
technical expertise of Dr. Avik Mukherjee (Hunt Optics and Imaging Inc.) for his help

88
with imaging studies. We also highly appreciate Second Genome and the department
staff at the Pathology, Microbiology and Immunology, School of Medicine for their
excellent analysis of the microbiome.

89
CHAPTER 4
HOST AKKERMENSIA MUCINIPHILA ABUNDANCE CORRELATES WITH
GULF WAR ILLNESS SYMPTOM PERSISTENCE VIA NLRP3 MEDIATED
NEUROINFLAMMATION AND DECREASED BRAIN DERIVED
NEUROTROPHIC FACTOR3
3 Diana Kimono, Dipro Bose, Ayan Mondal, Ratanesh Seth, Punnag Saha, Patricia
Janulewicz, Kimberly Sulivan, Stephen Lasley, Ronnie Horner, Nancy Klimas, Saurabh
Chatterjee. Submitted to Brain Behavior and immunity 02/23/2020

90
Running title: Akkermensia muciniphila and GWI persistence
Author for correspondence:
*Dr. Saurabh Chatterjee, Ph.D. Environmental Health and Disease Laboratory, NIEHS
Center for Oceans and Human Health on Climate Change Interactions, Department of
Environmental Health Sciences, University of South Carolina, Columbia 29208 USA.
Email: [email protected]; Tel: 803-777-8120; Fax: 803-777-3391
Key words: dysbiosis; Akkermansia muciniphila; BDNF; RAGE; 3-nitrotyrosine;
peroxynitrite; inflammasomes; symptom persistence.

91
ABSTRACT
Neurological disorders are commonly reported among veterans who returned from
the Gulf war. Veterans who suffer from GWI, complain of continued symptom persistence
that include neurological disorders, muscle weakness, headaches and memory loss among
many others that developed during or shortly after the war. Our recent research showed
that chemical exposure associated microbial dysbiosis accompanied by a leaky gut
connected the pathologies in the intestine, liver and brain. However, the mechanisms that
caused the symptoms to persist even thirty years after the war remained elusive to
investigators. In this study, we used a persistence rodent model of GWI to investigate the
persistence of microbiome alterations, resultant chronic inflammation and its effect on
neurotrophic and synaptic plasticity marker BDNF. The results showed that exposure to
GW-chemicals (pesticides such as permethrin and prophylactic drugs e.g. pyridostigmine
bromide) resulted in persistent pathology characterized by low relative abundance of the
probiotic bacteria Akkermansia muciniphila in the gut, which correlated with high
circulatory HMGB1 levels, blood brain barrier dysfunction, neuro-inflammation and
lowered neurotrophin BDNF levels. Mechanistically, use of mice lacking the NLRP3 gene
had significantly decreased inflammation and a subsequent increase in BDNF in the frontal
cortex. This suggests that a persistently low species abundance of Akkermensia muciniphila
and associated chronic inflammation due to inflammasome activation might be playing a
significant role in contributing to persistent neurological problems in GWI. A therapeutic
approach with various small molecules that can target both the restoration of a healthy
microbiome and decreasing inflammasome activation might have better outcomes in
treating GWI symptom persistence.
92
4.1. INTRODUCTION
Neurological disorders are commonly reported among veterans who returned from
the gulf war (GW) of 1990-1991 (3,106),(107). Afflicted veterans complain of problems
including neuralgias, repeated seizures, migraine headaches, muscle weakness and
coordination, memory problems etc (107,108)(109). These issues occur in combination
with other gulf war illness (GWI) symptoms and their pathology is not very well
understood. Most veterans who suffer from GWI developed their symptoms during or
shortly after the war and these symptoms persist thirty years later. Although the causes of
these symptoms are difficult to pinpoint, epidemiological studies have established a
compelling link between these symptoms in different GW veteran cohorts and
environmental exposures which occurred during the war, or chemicals that were applied to
the warriors before or shortly after the war (110–112). Such exposures include desert storm
dust, depleted uranium, combustion byproducts from oil wells, possible chemical weapons,
pesticides, vaccines and prophylactic medicines such as pyridostigmine bromide etc
(113,114) (4).
In recent years, research has focused on studying symptoms as well as elucidating
mechanisms of these disorders, using human GW veteran cohorts as well as animal, and in
vitro studies. For example, Van Riper et al, reported widespread disruption in white matter
microstructure distribution across brain regions involved in processing and modulating
chronic pain (13). James et al found that there was a significant positive correlation
between C-reative protein (CRP), pain and neurocognitive mood in GW veterans. Another
study by Abou-Donia et al reported elevated autoantibodies to neurons and other brain cells
eg tau proteins, glial acidic fibilliary protein (GFAP) and myosin basic protein (MBP)

93
which indicate neuronal injury or gliosis in GW veterans (115). In other recent animal
studies, Zakirova et al found cognitive deficits in mice several weeks after treatment with
GW chemicals and these deficits were associated with increased astrogliosis and a
reduction in synaptophysin in mouse hippocampi and cerebral cortex (44). Further Madhu
et al., found that cognitive impairments which persisted 10 months post-exposure to GW
chemicals were associated increased density of activated microglia and astrocytes in rats
and inflammation with elevated levels of HMGB1 in cerebral cortex (116). These studies
provide evidence that exposure to GW chemicals plays a significant role in persistence of
neurological dysfunction. This may be generally through the disruption of neuronal
networks, reactive glia which fuel inflammation or poor neuronal growth and
neuroplasticity.
Many neurological disorders such as Parkinson’s disease (PD), Alzheimer’s disease
(AD), bipolar disorders, neuropathic pain etc (117)(118,119) (120,121) are associated with
decreased levels of neurotrophins or impairments in their signaling pathways (122)(22).
These disorders also commonly present with chronic neuroinflammation (123–125). Brain
derived neurotropic factor (BDNF) is the most prevalent neurotrophins in the brain and has
been very widely studied (122,126). It is produced by neurons and it plays important
functions in neuroplasticity, growth and survival of neurons (127). To date, our previous
research on GWI has largely focused on the possible role of an altered microbiome
(bacteriome and virome) in contributing to a persistent inflammatory phenotype as
observed in our studies (18,19,29,128).
We proposed that exposure to GW chemicals alters the microbiome which then
drives inflammation through production of immunostimulatory particles i.e. damage

94
associated molecular pattern (DAMPS) and pathogen associated molecular patterns
(PAMPS), these continuously fuel inflammation observed in different organ systems.
Although our results largely supported our speculations, we were still limited in knowing
whether the observed changes and mechanisms in microbiome and associated chronic
inflammation due to an altered microbiome indeed persisted. In this present study, we used
a persistence rodent model of GWI in which mice were first exposed to GW chemicals for
two weeks (war phase) and then left in their cages on a normal chow diet for 20 weeks
(post war phase). We then investigated the persistence of microbiome alterations, chronic
inflammation and its effect on neuronal health (BDNF levels). We further used a NLRP3
KO mouse to study its potential role in contributing to observed neuroinflammation.
4.2. MATERIALS AND METHODS
Materials
We purchased Pyridostigmine bromide (PB) and Permethrin from Sigma- Aldrich
(St. Louis, MO). Anti- BDNF, anti-RAGE, anti-claudin 5, anti-HMGB1, anti-IL-1β, anti-
ASC-2 were purchased from Sigma-Aldrich while anti-NLRP3, anti-3-nitrotyrosine, anti-
TMEM 119 primary antibodies were purchased from Abcam (Cambridge, MA). Species
specific biotinylated conjugated secondary antibodies and Streptavidin-HRP (Vectastain
Elite ABC kit) was purchased from Vector Laboratories (Burlingame, CA). Fluorescence
conjugated (Alexa fluor) secondary antibodies, ProLong Diamond antifade mounting
media with DAPI and Pierce LAL chromogenic endotoxin quantitation kit was bought
from Thermo Fisher Scientific (Waltham, MA). Unless otherwise specified, all other
chemicals used were purchased from Sigma. Paraffin-embedding of tissue and sectioning

95
were done by AML laboratories (Baltimore, MD) and at the Instrument Resources Facility,
University of South Carolina School of medicine (Columbia, SC). Microbiome analysis
was done by Cosmos ID (Rockville, MD).
4.2.1. Animal experiments
Adult (10 weeks old) wild type male (C57BL/6J mice) and NLRP3 deficient adult
(10 weeks) male (B6N.129-Nlrp3tm3Hhf/J) mice were purchased from the Jackson
Laboratories (Bar Harbor, ME). Mice experiments were implemented in accordance with
NIH guidelines for humane care and use of laboratory animals and local IACUC standards.
All procedures were approved by The University of South Carolina at Columbia, SC. Mice
were housed individually and fed on a chow diet at 22–24°C with a 12-h light/ 12-h dark
cycle. All mice were sacrificed after animal experiments had been completed. Right after
anesthesia, blood from the mice was drawn using cardiac puncture, to preserve serum for
further experimentation. Their brains were removed immediately, and frontal cortex
dissected out and were fixed using Bouin's fixative solution. We also collected the fecal
pellets and luminal contents for microbiome analysis.
Treatments and rodent model of Gulf war illness
Mice were exposed to GW chemicals (pyridostigmine bromide and permethrin)
based on established rodent models of GWI with some modifications (44,63,129). The
treated mice group (GWP) and NLRP3KO (GWP-NLR3KO) mice group were dosed
triweekly for two weeks with PB (2mg/kg) and permethrin (200 mg/kg) by oral gavage,
then mice were left in cages to feed on a normal chow diet for 20 weeks. The control group

96
(CONT) of mice received vehicle (6% DMSO in PBS) by oral gavage as in other
experiments above.
Microbiome analysis
Microbiome analysis was done by CosmosID (Rockville, MD, USA) from fecal
pellets and luminal contents which were collected from the animals of each group after
sacrifice. DNA isolation, sequencing and analysis of gut microbiome were performed
according to vendor optimized protocol. Briefly, DNA was isolated from fecal samples
using the ZymoBIOMICS Miniprep kit, following the manufacturer’s instructions. 16S
sequencing was carried out on the V3-V4 (341 nt–805 nt) region of the 16S rRNA gene
with a twostep PCR strategy. First, PCR was performed using 16S-optimized primer set to
amplify the V3–V4 regions of 16S rDNA within the metagenomic DNA. Then the PCR
products from the previous steps were mixed at equal proportions and used as templates in
the second step to produce Illumina dual-index libraries for sequencing, with both adapters
containing an 8-bp index allowing for multiplexing. The dual-indexed library amplification
products are purified using Ampure beads (Beckman Coulter). Library quantification was
performed using Qubit dsDNA HS assay (ThermoFisher) and qualified on a 2100
Bioanalyzer instrument (Agilent) to show a distribution with a peak in the expected range.
A final qPCR quantification was performed before loading onto a MiSeq (Illumina)
sequencer for PE250 (v2 chemistry). The sequences for each sample were then run on the
16S pipeline of the CosmosID GENIUS software, and results were analyzed.

97
4.2.2. LABORATORY METHODS
Immunohistochemistry
The fixed brain tissues were embedded in paraffin and sliced into 5 μM thick
sections. These sections were deparaffinized following optimized standard protocols.
Epitope retrieval solution and steamer (IHC-Word, Woodstock, MD) were used for epitope
retrieval for deparaffinized sections. 3% H2O2 was used for the recommended time to
block the endogenous peroxidase. After serum blocking, the primary antibodies were
applied at recommended and optimized concentrations. Species- specific biotinylated
conjugated secondary antibodies and streptavidin conjugated with HRP were used to
implement antigen specific immunohistochemistry. 3,3'-Diaminobenzidine (DAB) (Sigma
Aldrich, St Louis, MD) was used as a chromogenic substrate. Mayer's Hematoxylin
solution (Sigma Aldrich) was used as a counter stain. Sections were washed between steps
using phosphate buffered saline 1X. Finally, stained sections were mounted in Simpo-
mount (GBI laboratories, Mukilteo, WA). Tissue sections were observed using Olympus
BX63 microscope (Olympus, America). Cellsens software from Olympus America (Center
Valley, PA) was used for morphometric analysis of images. Immunofluorescence staining
Paraffin embedded sections were deparaffinized using standard protocol. Epitope retrieval
solution and steamer were used for epitope retrieval of sections. Primary antibodies were
used at recommended dilutions. Species specific secondary antibodies conjugated with
Alexa Fluor (633-red and 488-green) were used at advised dilution. In the end, the stained
sections were mounted using prolong diamond antifade reagent with DAPI. Sections were
observed under–Olympus florescence microscope BX63 using 20X, 40X, 60X objective
lens.

98
Real time Quantitative PCR
Total RNA was isolated from frontal cortex tissue homogenization in TRIzol
reagent (Invitrogen, Carlsbad, CA, USA) according to the manufacturer’s instructions and
purified with the use of RNeasy mini kit columns (Qiagen, Valencia, CA, USA). cDNA
was synthesized from purified RNA (1 µg) using iScript cDNA synthesis kit (Bio-rad,
Hercules, CA, USA) following the manufacturer’s standard protocol. Real-time qPCR
(qRTPCR) was performed with the gene-specific primers using Sso Advanced SYBR
Green Supermix and CFX96 thermal cycler (Bio-rad, Hercules, CA, USA). Threshold
cycle (Ct) values for the selected genes were normalized against respective samples
internal control 18S. Each reaction was carried out in triplicates for each gene and for each
sample. The relative fold-change was calculated by the 2−∆∆Ct method. The sequences for
the primers used for real-time PCR are provided in table 1.
Table 4.1: Primer sequences
mm Claudin 5 Sense: TTCGCCAACATTGTCGTCC
Antisense: TCTTCTTGTCGTAGTCGCCG
mm18S Sense: TTCGAACGAACGTCTGCCCTATCAA
Antisense: ATGGTAGGCACGGCGATA
Endotoxin level detection by Litmus Amebocyte Lysate assay
Serum bacterial endotoxin levels (EU/mL) were detected using the Pierce LAL
Chromogenic Endotoxin Quantification Kit (Waltham, MA) according to the

99
manufacturer’s instructions. Briefly, serum samples were obtained from mice and diluted
1:80 with endotoxin free water. The endotoxins were then quantified.
Western Blot analysis
30 mg of tissue from each brain tissue sample was immediately homogenized in
300 μl of RIPA buffer with protease and phosphatase inhibitors cocktail (Pierce, Rockford,
IL) using slow speed mechanical homogenizer. The homogenate was centrifuged, and the
supernatant was collected and saved for experimental use. 30 μg of denatured protein from
each sample was loaded per well of Novex 4–12% bis-tris gradient gel (Life technologies,
Carlsbad, CA) and subjected for standard SDS-PAGE. Separated protein bands were
transferred to nitrocellulose membrane using precut nitrocellulose/filter paper sandwiches
(Bio-Rad, Hercules, CA) and Trans–Blot Turbo transfer system (Bio-Rad) using 30
minutes transfer protocol. Further, blots were blocked with 3% bovine serum albumin
solution prepared in Tris-buffered saline with 0.05% tween-20 (TBS-T). Primary
antibodies were used at recommended dilutions in 1.5% blocking buffer and incubated
overnight at 4°C. Species-specific anti-IgG secondary antibody conjugated with HRP were
used at recommended dilutions in 1% blocking buffer and incubated for 2h at room
temperature. Pierce ECL Western Blotting substrate (Thermo Fisher Scientific Inc.,
Rockford, IL) was used in dark to develop the blot. Finally, the blot was imaged using
G:Box Chemi XX6 (Syngene imaging systems) and subjected to densitometry analysis
using Image J software.

100
4.2.3. Statistical analysis
We conducted calculations for each experimental condition prior to initiation of the
study, using preliminary data to confirm that the sample size was enough to achieve a
minimum statistical power of 0.80 at an alpha of 0.05. One-way analysis of variance
(ANOVA) was used with post-hoc comparisons among different exposure conditions or
treatments (e.g., least significant differences (LSD) and Bonferroni correction) to compare
means among multiple groups. Student’s t-tests was used to compare means between two
groups at the termination of treatment. Correlative associations were tested using Pearson’s
Rank Product moment coefficient analysis using Graph pad prism software (GraphPad
Software Inc., La Jolla, CA, United States)
4.3. RESULTS
4.3.1. Gulf war chemical exposure results in a decreased relative abundance of
Akkermansia muciniphila which negatively correlates with increased circulatory
HMGB1 levels.
Our previous studies have strongly suggested that exposure to GW chemicals alters
the microbiome and these alterations may contribute to persistence of GWI symptoms
through release of DAMPs and PAMPs (18,29,128). In this study we analyzed the
microbiome for alterations in specific bacterial species that have a pronounced role in
inflammation persistence in chronic diseases of the gut, metabolic reprogramming and
neuronal deficiencies. We analyzed 10 distinct bacterial species that had a fold change
difference in abundance and has been found to contribute to inflammation and metabolic
responses (Fig. 1A) We found that mice treated with GW chemicals (GWP) had
significantly lower abundance of A. muciniphila (significant), Bacteroides

101
Thetaiotomicron and Dorea Sp (not significant) when compared to mice treated with only
vehicle control (Figure 1A) (*P<0.05; n=6). Notably, A. muciniphila has been associated
with several health benefits (130,131) (38). Furthermore, we found that mice which were
treated with GW chemicals (GWP) had significantly higher HMGB1 levels in their serum
compared to mice treated with vehicle control only (CONT) *P<0.05, n=6 (Figure 1B and
C). We then carried out statistical analyses to determine whether the increased levels of
HMGB1 were related to the observed decreased relative abundance of A. muciniphila. In
Figure 1D, we found that there was a negative correlation between A. muciniphila
abundance and circulatory HMGB1 levels (Peason’s r = -0.50; R square COD=0.255).
4.3.2. Exposure to GW chemicals is associated with blood brain barrier tight junction
protein dysregulation and the changes persist 5 months after exposure
The study by Abou-Donia et al suggests the presence of a leaky BBB among
veterans who returned from the GW and this may be a portal for immunostimulatory
particles such as DAMPS and PAMPS to continuously fuel neuroinflammation (115). We
studied the mRNA and protein expression levels of claudin 5, the major tight junction
protein in the complex that makes up the BBB. We found that GWP mice also exhibited
significantly lower claudin 5 mRNA and protein levels compared to vehicle control treated
mice (CONT) P<0.05, n=6 (Figure 2 A, B and C). Further, we studied the levels of claudin
5 in the BBB by observing colocalizations between claudin 5 and CD31 a marker for
endothelial cells that make up the lining of the blood vessels (Figure 2 D and E). We found
that there was a significant decrease in the number of colocalizations (yellow spots)
constituting claudin 5 and CD31 in GWP mice compared to controls (CONT). This result
points to the fact that at least one major component of BBB integrity is repressed at the

102
protein level paving the way for possible dysfunctional BBB, and this may lead to the
passage of DAMPS such as HMGB1 leaking into the brain and triggering several immune
responses.
4.3.3. GW chemical exposure is associated with persistent activation of microglia via
the HMGB1-RAGE pathway resulting in increased reactive oxygen species and
triggering of the NLRP3 inflammasome.
Chronic neurological disorders such as AD and PD etc, are characterized by
activation of immune cells such as microglia, the resident macrophages of the brain (132).
These cells may be activated by the presence of pathogens or DAMPS such as HMGB1.
We studied the protein expression levels of activated microglia marker TMEM119. The
results showed that there was a significant increase in activated microglia in the frontal
cortex of mice treated with GW chemicals (GWP) compared to controls (CONT) (Figure
3 A and B) even after 5 months of exposure. Further, we found that there was evidence of
activated HMGB1-RAGE signaling as indicated by colocalization events. Figure 3 C, D
shows a high expression of RAGE protein levels and subsequent increased RAGEHMGB1
colocalizations in GWP mice compared to controls (Figure 3 E, F). RAGE is a receptor,
which binds several ligands including HMGB1. Interaction of HMGB1-RAGE can lead to
increased reactive oxygen species (ROS) generation eg peroxynitrite which reacts with
tyrosine in proteins to form the stable adduct 3 nitrotyrosine. In Figure 4A, we detected
significantly higher levels 3-nitrotyrosine (3NT) in GW chemical treated mice (GWP)
compared to vehicle control treated mice (CONT) Figure 4B and C; (*P<0.05; n=6). We
also found that mice exposed to GW chemicals had significantly higher inflammasome
activation compared to vehicle control treated mice (CONT) Figure 4D and E; (*P<0.05;
n=6). This activation was detected as yellow dots indicating a colocalization between the
103
NLRP3 protein complex (labelled with red antibody) and the adapter protein ASC2
(marked with green), which facilitate processing of proinflammatory cytokines from their
basal inactive to more active form via protein cleavage.
4.3.4. Exposure to GW chemicals is associated with a persistent increased
neuroinflammation and low levels of BDNF
Inflammasomes are large immune complexes found in several cell types and are
responsible for processing the inflammatory cytokines IL-1β and IL-18 by cleaving them
from their precursors (133). Uncontrolled activation of these complexes can lead to chronic
inflammation as has been found in cancer, diabetes and neurodegenerative disease
(51,134,135). In our study, we found that NLRP3 inflammasome activation were also
significantly associated with increased IL-1β protein levels in GWP mouse frontal cortex
when compared to mice treated with only vehicle control (CONT) (Figure 5A, B); *P<0.05;
n=6. Neurodegerative diseases are often characterized by neuroinflammation accompanied
by decreased levels of neurotrophins (119)(136). Similarly, in this study we observed that
mice which were treated with GW chemicals had significantly lower levels of the
neurotrophin BDNF when compared to mice treated with only vehicle control (CONT)
(Figure 5-F) *P<0.05; n=6.
4.4.5. Akkermensia muciniphila relative abundance correlates with BDNF levels and
persistent neuroinflammation
High abundance of A. muciniphila has been linked to decreased inflammation in
chronic diseases (137–139). To study whether the host bacteria’s abundance played a role
in affecting chronic inflammation and sustained BDNF levels in our model of GWI, we

104
carried out correlative analyses to determine whether there were statistically significant
relationships between the bacterial abundance, inflammation and BDNF levels. The results
showed that there was a significant positive correlation between BDNF levels and
abundance of A. muciniphila (Pearson’s r=0.83, R square (COD)=0.73; p=0.0024), and a
significant negative correlation with IL-1β protein levels (Pearsons r=-0.684; R square
(COD)=0.46; p=0.02) (Figure 6A and B). Shaded area represents 95% confidence bands.
4.4.6. Deletion of NLRP3 is protective against persistent neuroinflammation and is
associated with increase in BDNF levels
To study the role of NLRP3 in driving inflammation and lowering BDNF levels,
we treated mice lacking NLRP3 with GW chemicals and then subjected them to our
experimental conditions for 20 weeks or 5 months. We then studied the protein levels of
IL-1β and BDNF by western blot analysis and immunohistochemistry. Our results show
that there were significantly lower levels of IL-1β (Figure 7A, B), and increased BDNF
(Figure 7 CF) levels in the frontal cortex of NLRP3 KO mice treated with GW chemicals
(GWPNLR3KO), when compared to wild type mice treated with GW chemicals (GWP)
(*P<0.05; n=6).
4.5. DISCUSSION
In our previous studies, we reported that there was a general alteration in
microbiome accompanied by endotoxemia, a leaky gut, and inflammation in different
organs such as the small intestine, brain and liver (18,29,128). We found significant
increases in phyla Firmicutes and Tenericutes over Bacteriodetes in GW chemical exposed
mice when compared to controls (29). However, it was not clear whether these alterations

105
persisted over a longer period of lifespan or would eventually resolve over time through
repopulation and reconstitution of the host microbiome. We also were eager to study the
mechanisms that would connect the altered microbiome and the persistent inflammatory
changes in the intestine and the neural immune network. In this study, mice were exposed
to the GW chemicals and allowed to ad libitum diet and water for 5 months. This was to
simulate the period of exposure (war phase) and the post war period in GW veterans. We
found that exposure to GW-chemicals (pesticides such as permethrin and prophylactic
drugs eg pyridostigmine bromide) resulted in persistent pathology characterized by low
abundance of A. muciniphila, high circulatory HMGB1 levels, blood brain barrier
dysfunction, neuroinflammation and lowered neurotrophin BDNF levels.
We report that exposure to GW chemicals caused a decrease in A. muciniphila or
resulted in conditions that favor other bacteria populations repopulate over A. muciniphila
(Figure1A). A. muciniphila is a mucin degrading bacterium which exists as part of the
normal human gut flora and is abundant in healthy individuals (16,139–141). In recent
years the herein reported bacterium is emerging as an important probiotic which can be
consumed to improve health (142). This bacterium was found to improve ulcerative colitis
in mice (143) and restored colonic mucus layer thickness with decreased inflammation in
aging mice (144). In another study, the abundance of this bacterium inversely correlated
with inflammation and altered lipid metabolism in obese mice (142). Although the
mechanism by which A. muciniphila promotes these health benefits is not fully understood,
studies report that the bacterium strengthens gut barrier integrity through its association
with enterocytes and also produces high amounts of anti-inflammatory cytokine IL-8
(139,145). It is possible that the low levels of this bacterium in the gut compromised gut

106
barrier integrity, a condition that we have observed in our previous acute models of GWI
(146)(29). This condition of compromised gut barrier integrity has also been reported
among veterans who suffer from gastrointestinal problems in GWI (55). And yet another
study found that A. muciniphila treatment normalized diet-induced metabolic endotoxemia,
adiposity, and the adipose tissue marker CD11c in obese mice which otherwise had
increased inflammatory indicators in the intestine and aided in the metabolic disease
development (137).
Similarly, our studies of GWI mouse models have consistently found that altered
levels of tight junction proteins in the gut was associated with increase in endotoxins and
DAMPs such as HMGB1 and inflammation that was related to an alteration of gut
microbiome abundance (146)(18). Notably, mice in the present persistent model study that
were exposed to similar chemicals showed a slight increase in serum endotoxin levels (low
level endotoxemia consistent with an obesity phenotype) in GW chemical treated mice
when compared to vehicle control treated mice (Figure S1). In addition, a significant
increase in circulatory HMGB1 levels were observed in GW-chemical exposed mice which
negatively correlated with A. muciniphila relative abundance (Figure 1B, C and D)
suggesting that a sustained and consistent low inflammatory trigger was closely associated
with a persistent change in the microbiome and decreased A muciniphilia abundance in
these mice. Further, the persistence of systemic inflammatory indicators such as endotoxin
levels and serum HMGB1 for such a long period that failed to ease even 5 months after
exposure (equivalent to >20 human years) and its connection with an altered microbiome
triggered our interest to study their effects on neuronal structures and their networks.

107
Interestingly, before we could study the neuroinflammatory indicators for
persistence, we needed to assess the integrity of the blood brain barrier, a vital interface of
neuronal physiology and pathology. Results showed that expression of Claudin 5, a key
tight junction protein of the BBB in the brain was decreased in the frontal cortex of mice
treated with GW chemicals compared to controls (Figure 2A-E). This protein, together with
other tight junction proteins such as claudin 1, zona occludens, occludins etc make up tight
junctions in the BBB. The BBB is a selective barrier found at the interface of blood vessels
in the brain and brain tissue. It is made of a single cell layer of endothelial cells, astrocyte
and pericytes. Its unique properties allow it to tightly regulate the movement of particles
between the circulation and brain tissue (56) (57). Claudin 5 and other tight junction
proteins are found between adjacent endothelial cells of blood vessels and help to anchor
these cells to create a tightly regulated selective barrier which allows the passage of
particles between the blood and the brain(147). Low levels of this protein have been found
in neurodegenerative and neuronflammatory diseases such as AD, PD and schizophrenia
(148,149). We found decreased mRNA and protein levels of this this protein in GWP mice
compared to controls (Figure 1A-F). This provides strong evidence that at least one key
component of the BBB is dysregulated and this possibly compromised the barrier’s
integrity, likely caused by the serum mediators endotoxins and HMGB1 causing it to
become leaky though we have no direct evidence of such an event in an in vitro
experimental set up using BBB endothelial cells. We hypothesized that this leaky BBB
allowed the passage of unwanted particles such as DAMPs and PAMPS, HMGB1 as one
such example, which we found to be greatly increased in the serum. It is also worth noting
that even though serum endotoxin levels are not significantly higher in GWP mice

108
compared to controls, even low levels of endotoxins over a long time can be a toxic
stimulus to the body and may contribute to observed pathology(150), (62).
HMGB1 is a DAMP known to trigger proinflammatory pathways through toll like
receptors (TLRs) eg TLR4 and through the receptor for advanced glycation end products
(RAGE) (49,151). We found that there was increased activation of microglia in GWP mice
compared to controls (Figure 3A and B) with an increased expression of RAGE receptors
in the frontal cortex Figure 3 C,D. We also detected HMGB1/RAGE complex formation
using immunofluorescence microscopy, which may indicate activation of RAGE signaling
(Figure 3E and F). The activation of this pathway is known to result in transcription of
proinflammatory cytokines and generation of reactive oxygen species (ROS) (152) such as
nitric oxide. High levels of nitric oxide in the presence of superoxide could result in the
formation of peroxynitrite a potent ROS which attacks tyrosine to form 3 nitrotyrosine
denaturing them and rendering them dysfunctional. We found significantly higher levels
of ROS in our GWP mice compared to controls (Figure 4A and B). High amounts of ROS
are a known trigger of the NLRP3 inflammasome (102). Inflammasomes are large protein
complexes which are assembled in response to infections etc and are involved in processing
of proinflammatory cytokines such as IL-1β and IL-18. We found that mice treated with
GW chemicals had higher expression of NLRP3/ASC2 complex formation compared to
controls (Figure 4C and D). Although inflammasomes are triggered as a defense
mechanism, chronic activation of these complexes has been implicated in conditions
characterized by chronic low-grade inflammation such as diabetes, PD, ALS etc (153,154).
This activation of the NLRP3 inflammasomes was followed by increased IL-1β levels in
the brain (Figure 5A and B) which might contribute to the persistent neuroinflammation in

109
GWI. In neurological diseases, inflammation has been associated with poor neuronal
health, with fewer neurons, decreased neuronal plasticity and growth (155). This in part is
due to decreased levels of neurotrophins such as BDNF. BDNF is a neurotrophin produced
by neurons and is involved in neuronal growth, survival and plasticity (122). Studies by
Guan and Fang, and another by Lapchak suggests that increased IL-1β levels interfered
with BDNF synthesis (156), while Tong et al., showed that increased IL-1β interfered with
BDNF signaling through the PI3K/AKT pathway by preventing its activation of AKT. The
above mechanisms resulted in decreased growth and survival of neurons (157). In this
study, we report low levels of BDNF in the frontal cortex of mice which were treated with
GW chemicals compared to controls even 5 months post exposure (Figure 5C-F). We also
studied any correlations that BDNF, IL-1β with A. muciniphila relative abundance may
have to connect the intestinal, microbiome changes and neuronal levels of these mediators
referenced above. In Figures 6A and B, we show that A. muciphila relative abundance
correlated negatively with IL-1β levels and positively with BDNF levels. The above result
indicates that A. muciniphila relative abundance might have played a role in modulating
neuroinflammation and neurotrophin levels in GWI as has been the case in obesity and
other diseases described previously (46). This could be through the bacterium’s production
of anti-inflammatory compounds that counter inflammation or modulation of the intestinal
barrier integrity, although more studies need to be done to determine the exact mechanism.
Finally, to study the role of NLRP3 inflammasome in contributing to neuroinflammation
that persist for a prolonged period of time and its association with increased abundance of
A. muciniphila, we used a mouse model with the systemic knockout of NLRP3 gene (KO
mouse). The results found that deletion of this gene was associated with increased BDNF

110
levels and protected the mice from neuroinflammation (Figure 7A-F). Deleting NLRP3 is
protective through preventing inflammasome activation and subsequent processing of
proinflammatory cytokines and distinctly proves that the persistent inflammation in GWI
chemical exposed mice that had altered A. muciniphila abundance is due to NLRP3-
mediated inflammasome activation though there may be multiple molecular mediators for
triggering such an activation. Our current study identifies some of these mediators such as
gut derived endotoxins, HMGB1 or peroxynitrite to name a few but the molecular
mechanism of such a trigger remains speculative at this time.
In conclusion, we report that persistence of GWI symptoms is characterized by low
relative abundance of A. muciniphila and chronic high circulatory HMGB1 levels which
trigger NLRP3 mediated neuroinflammation and decreased levels of neurotrophins through
RAGE signaling. These findings not only provide insight into the mechanism of persistent
neurological disturbances in GWI but also provide possible therapeutic targets. Firstly, the
microbiome can be targeted through replacement or enhancing of A. muciniphila gut
bacterial populations and other significantly lowered probiotic bacteria, and secondly
through therapies that target RAGE signaling or NLRP3 inflammasomes to relieve
persistent inflammation and improve quality of life.
ACKNOWLEDGEMENTS
We are grateful to the Instrument Resource Facility (University of South Carolina
School of Medicine) and AML Labs (Baltimore MD) for providing excellent technical
services. We are also thankful to Cosmos ID (Microbial Genomic Platform, Rockville,
MD, USA) for their analysis of the bacteriome.

111
Funding.
Funding for this project was provided by DoD-IIRFA grant: W81XWH1810374
and VA merit award I01 CX001923-01 to Saurabh Chatterjee; W81XWH-16-1-0556 to
Dr. Stephen Lasley; W81XWH-13-2-0072 to Dr. Kim Sullivan.
“This material is based upon work supported (or supported in part) by the Department of
Veterans Affairs, Veterans Health Administration, Office of Research and Development
vide grant no. CX001923-01” to Saurabh Chatterjee. Chatterjee is a 5/8th employee with
the US Department of Veterans Affairs.
Conflict of interest
The authors declare no conflict of interest

112
Figure 4.1. Exposure to GW chemicals results in decreased relative abundance of
Akkermensia muciniphila and chronic high levels of circulatory HMGB1
A. Percentage abundance of gut bacteria species. Percentage abundance of 10 most abundant species in the gut bacteriome are represented comparing GW chemical treated groups (GWP) to vehicle control treated group groups (CONT). Data is represented as the mean of 6 mice per group. B. Relative abundance of A. muciniphila. Relative abundance was determined from duplicate fecal samples of six mice per group treated with GW chemicals (GWP) compared to mice treated with vehicle control only (CONT). Data is represented as Mean ±SEM. (*p<0.05; n=6). C. Serum HMGB1 levels. Western blot of HMGB1 levels in serum for mice treated with GW chemicals (GWP) compared to mice treated with vehicle control (CONT) only. Data is represented as Mean ±SEM. D.
Densitometry of HMGB1 immunoblots, normalized against ponceau red (*p<0.05; n=6). E. Relationship between A. muciniphila and circulatory HMGB1 levels. A correlative analysis was carried out to determine how A. muciniphila is related to serum HMGB1 levels. We found a negative correlation between A. muciniphila and serum HMGB1 levels (Peason’s r = -0.50; R square COD=0.255 shaded area represents 95% confidence bands).

113
Figure 4.2. Exposure to GW chemicals is associated with altered claudin 5 levels in
the frontal cortex
A. Claudin 5 mRNA levels in the frontal cortex: mRNA levels of claudin 5 as studied by RTqPCR show that mice exposed to GW chemicals (GWP) had significantly decreased claudin 5 mRNA levels compared to mice treated with vehicle control only (CONT). B. Claudin 5 levels in protein levels in frontal cortex. Western blot analysis of Claudin 5 protein levels in CONT and GWP treated mice. C. Morphometry analysis of claudin 5 immunoblots, normalized against β-actin (*p<0.05; n=6). Data is represented as Mean ±SEM. D. Representative immunofluorescence micrographs of the blood brain barrier showing colocalization of tight junction protein Claudin 5 (labelled in red) and endothelial cell marker CD31 (labelled in green) as yellow spots around a BBB (Magnification 60X and scale bar 10µm). Inset (Magnification (40X and scale bar 20 µm) shows the whole micrograph field, from which the main image was obtained. E. Quantitative morphometry analysis of colocalizations for every 100 cells, represented as % ROI (*p<0.05; n=6). Data is represented as Mean ±SEM.

114
Figure 4.3. Activation of Macrophages and associated HMGB1/RAGE complex
formation
A. TMEM119 immunoreactivity in frontal cortex. Representative immunohistochemistry micrographs of TMEM 119 reactivity in control (CONT) and GW chemical treated (GWP) mice (Magnification 40X and scale bar 50µm). B. Morphometric analysis (represented as % ROI) obtained from 10-15 images from different microscopy fields from each mouse sample. Data is represented as Mean ±SEM. (*p<0.05; n=6). C. Western blots of RAGE protein levels in the frontal cortex of GWP and CONT treated mice. D. Morphometry analysis of all immunoblots normalized against β-actin (n=5). (*p<0.05; n=6) Data is represented as Mean ±SEM. E. RAGE/HMGB1 complex formation. Immunofluorescence micrographs showing activation of NLRP3 inflammasome protein. HMGB1 (red) and RAGE (green) in GWP and CONT mice. Colocalizations are shown as yellow dots and marked with arrows in the micrographs (Magnification 40X and scale bar 20µm). F. Morphometric analysis (represented as % ROI) obtained from 6-8 images from different microscopy fields from each mouse sample. Data is represented as Mean ±SEM. (*p<0.05; n=6).

115
Figure 4.4. Increased ROS is associated with NLRP3 inflammasome activation
A. 3-nitrotyrosine immunoreactivity in frontal cortex. Representative immunohistochemistry micrographs of 3-nitrotyrosine reactivity in control (CONT) and GW chemical treated (GWP) mice (Magnification 40X and scale bar 50µm). B. Morphometric analysis (represented as % ROI) obtained from 10-15 images from different microscopy fields from each mouse sample. Data is represented as Mean ±SEM. (*p<0.05; n=6). C. Immunofluorescence micrographs showing activation of NLRP3 inflammasome protein. NLRP3 (red) and its ASC2 (green) in GWP and CONT mice. Colocalizations are shown as yellow dots and marked with arrows in the micrographs. Magnification 60X and scale bar 20µm. D. Morphometric analysis (represented as % ROI) obtained from 6-8 images from different microscopy fields from each mouse sample. Data is represented as Mean ±SEM. (*p<0.05; n=6).

116
Figure 4.5. GW chemical exposure is associated with chronic neuroinflammation and
decreased Brain derived neurotrophic factor (BDNF) levels in Frontal cortex.
A. Immunohistochemistry micrographs of frontal cortex tissues of GWP and CONT treated mice showing immunoreactivity of IL-1β (Magnification 20X and scale bar 50µm). B. Morphometric analysis (as % ROI) obtained from 10-15 images from different microscopic fields from each mouse sample. (*p<0.05; n=6). Data is represented as Mean ±SEM. C. BDNF immunoreactivity. Representative immunohistochemistry micrographs showing BDNF in frontal cortex tissues of GWP and CONT treated mice (Magnification 40X and scale bar 50µm). D. Morphometric analysis (represented as % ROI) obtained from 10-15 images from different microscopy fields from each mouse sample. E. Western blots of BDNF protein levels in the frontal cortex of GWP and CONT treated mice. F. Morphometry analysis of all immunoblots normalized against β-actin (n=5). (*p<0.05; n=6) Data is represented as Mean ±SEM.

117
Figure 4.6. Decreased relative abundance of Akkermansia muciniphila correlates with
IL-1β and BDNF levels in the frontal cortex.
A. Correlation between A. muciniphila and IL-1β levels in GW chemical (GWP) and vehicle control (CONT) treated mice We carried out a linear regression analysis to determine the relationship between IL-1β and A. muciniphila in GWP and CONT mice. There was a negative correlation between A. muciniphila and IL-1β in the FC (Pearson’s r=-0.68; R square (COD)=0.46 and p=0.02). B. Correlation between A. muciniphila and BDNF levels in GW chemical (GWP) and vehicle control (CONT) treated mice. We carried out a linear regression analysis to determine the relationship between BDNF and A.
muciniphila in GWP and CONT mice. There was a positive correlation between A.
muciniphila relative abundance and BDNF levels (Pearson’s r= 0.83, R square (COD)= 0.7 and p=0.0024)

118
Figure 4.7. Deletion of NLRP3 is associated with decreased neuroinflammation and
lower BDNF levels.
IL-1β immunoreactivity in frontal cortex. Representative immunohistochemistry micrographs showing IL-1β in frontal cortex tissues of GW chemical treated (GWP), GW chemical treated NLRP3KO (GWP-NLR3KO) and vehicle control (CONT) treated mice (Magnification 40X and scale bar 50µm). B. Morphometric analysis (represented as % ROI) obtained from 10-15 images from different microscopy fields from each mouse sample. Data is represented as Mean ±SEM. (*p<0.05; n=6). C. BDNF immunoreactivity in frontal cortex. Representative immunohistochemistry micrographs showing BDNF immunoreactivity in frontal cortex tissues of GW chemical treated (GWP), GW chemical treated NLRP3KO (GWP-NLR3KO) and vehicle control (CONT) treated mice (Magnification 40X and scale bar 50µm). D. Morphometric analysis (represented as % ROI) obtained from 10-15 images from different microscopy fields from each mouse sample. Data is represented as Mean ±SEM. (*p<0.05; n=6). E. Western blots of BDNF protein levels in the frontal cortex of GWP and CONT treated mice. F. Morphometry analysis of all immunoblots normalized against β-actin. Data is represented as Mean ±SEM. (*p<0.05; n=6).

119
Supplementary Figures
Figure 4.8. Serum endotoxin levels in GW chemical treated mice (GWP) compared to
the vehicle control (CONT) only treated mice.
Data is represented as Mean ±SEM. (*p<0.05; n=6, ns=not significant)

120
CHAPTER 5
CONCLUSION
Veterans who suffer from GWI report that their symptoms begun during, or shortly
after the war. Although it is difficult to trace back the exact causes, research agrees that
environmental exposures did in fact contribute significantly to causing the condition. It is
perplexing however that such a brief war (about 1 month of active combat) resulted in such
far reaching persistent health consequences.
This dissertation reports on three studies which look at at gulf war chemical
exposure-induced gut microbiome alterations as a significant driver of GWI pathology. We
further investigated possible microbiome targeted therapies to alleviate the symptoms of
GWI.
In these three studies, we hypothesized that exposure to GW-chemicals irreversibly
altered the microbiome, an important “organ” in modulating health. These alterations in
the microbiome resulted in an increase in immunostimulatory particles ie DAMPs and
PAMPs and dysfunctional tight junctions in the gut. These particle cross into the blood
circulation, affecting the enteric nervous system and distant organs such as the liver and
the brain.

121
In the enteric nervous system, we found that enteric glial cells became reactive in
response to an altered microbiome. These cells can detect an alteration in microbiome
through toll like receptors such as TLR4. These reactive glia produced large amounts of
reactive oxygen species and proinflammatory cytokines which modulate tight junction
proteins and aquaporins in the gut. The second study found an association between GW
chemical exposure and hepatic inflammation and lipid and glucose metabolic
reprogramming but with no significant clinical pathology. The third study found that there
were persistent alterations in microbiome at the species levels. Several important gut
bacteria were altered in the GW chemical exposed mice. However, this study focused on
Akkermasia muciniphila a known probiotic bacterium whose levels are usually high among
healthy individuals. We found that there was a lowered relative abundance of A.
muciniphila which correlated negatively with NLRP 3 mediated neuroinflammation and
positively with neurotrophin BDNF levels in the brain.
In these studies, we proposed the use of different kinds of therapies.
1. The use of natural therapies such as SsnB, a TLR4 antagonist polyphenol isolated from
a Chinese herb Scirpus yagara. Since we found that TLR4 plays a significant role in
triggering inflammation in GWI. 2. The use of probiotics eg butyrate which support gut
bacteria. We found that these short chain fatty acids play an important role in protecting
mice against GW chemical induced inflammation and metabolic reprogramming. 3.
Replacement of gut bacteria through consumption of depleted probiotic bacteria such as A.
muciniphila, which we found to correlated with neuroinflammation and loss of
neurotrophins such as BDNF which are important in neurological health. 4. Finally, the use
of innate immune system receptor antagonists such as TLR4, TLR5, NLRP3 and RAGE

122
can be explored further, since we found that these receptors played a role in promoting
GWI pathology. However, this method needs to be applied cautiously since the innate
immune system receptors are also critical to health, and long-term inhibition could worsen
pathology.
Although a lot of research still remains to be done, these three studies advance the
knowledge on GWI pathology, and inform us on how to consider similar conditions, where
the use of chemical combinations together with stress and other under lying conditions
could result in unexplainable syndromes such as GWI.

123
REFERENCES
1. Nettleman M. Gulf War Illness: Challenges Persist. Trans Am Clin Climatol Assoc. 2015;126:237–47.
2. Nettleton J a, Katz R. N-3 Long-Chain Polyunsaturated Fatty Acids in Type 2 Diabetes: a Review. J Am Diet Assoc. 2005 Mar;105(3):428–40.
3. White RF, Steele L, O’Callaghan JP, Sullivan K, Binns JH, Golomb BA, et al. Recent research on Gulf War illness and other health problems in veterans of the 1991 Gulf War: Effects of toxicant exposures during deployment. Cortex [Internet]. 2016;74:449–75. Available from: http://dx.doi.org/10.1016/j.cortex.2015.08.022
4. Mawson AR, Croft AM. Gulf war Illness: Unifying hypothesis for a continuing health problem. Int J Environ Res Public Health. 2019;16(1).
5. Steele L, Sastre A, Gerkovich MM, Cook MR. Complex factors in the etiology of Gulf War illness: Wartime exposures and risk factors in veteran subgroups. Environ Health Perspect. 2012;120(1):112–8.
6. Chester JE, Rowneki M, Van Doren W, Helmer DA. Progression of intervention-focused research for Gulf War illness. Mil Med Res. 2019;6(1):1–17.
7. Shreiner A, Kao JY, Young VB. The gut microbiome in health and in disease. Cur Opin Gastroenterol [Internet]. 2015;31(1):69–75. Available from: http://www.annualreviews.org/doi/10.1146/annurev-biophys-083012-130404%0Ahttp://dx.doi.org/10.1016/0092-8674(92)90611-F
8. Jiang H, Gao K. Effects of Lowering Temperature During Culture on the Production of Polyunsaturated Fatty Acids in the Marine Diatom Phaeodactylum Tricornutum (Bacillariophyceae)1. J Phycol. 2004 Jun 4;40(4):651–4.
9. Kowalski K, Mulak A. Brain-gut-microbiota axis in Alzheimer’s disease. J Neurogastroenterol Motil. 2019;25(1):48–60.
10. Upadhyaya S, Banerjee G. Type 2 diabetes and gut microbiome: At the intersection of known and unknown. Gut Microbes. 2015;6(2):85–92.
11. Davis CD. The Gut Microbiome and Its Role in Obesity. Nutr Today. 2016;51(4):167–74.

124
12. Belcheva A, Irrazabal T, Robertson SJ, Streutker C, Maughan H, Rubino S, et al. Gut microbial metabolism drives transformation of msh2-deficient colon epithelial cells. Cell [Internet]. 2014;158(2):288–99. Available from: http://dx.doi.org/10.1016/j.cell.2014.04.051
13. Patrick H. Degnan, Taga MET, Goodman AL. Vitamin B12 as a modulator of gut microbial ecology. Circulation. 2011;123(19):2145–56.
14. Strandwitz P. Neurotransmitter modulation by the gut microbiota. Brain Res. 2018;1693(5):128–33.
15. Vogt NM, Romano KA, Darst BF, Engelman CD, Johnson SC, Carlsson CM, et al. The gut microbiota-derived metabolite trimethylamine N-oxide is elevated in Alzheimer’s disease. Alzheimer’s Res Ther. 2018;10(1):1–8.
16. Zhu S, Liu S, Li H, Zhang Z, Zhang Q, Chen L, et al. Identification of Gut Microbiota and Metabolites Signature in Patients With Irritable Bowel Syndrome. Front Cell Infect Microbiol. 2019;9(October):1–12.
17. Golomb BA. Acetylcholinesterase inhibitors and Gulf War illnesses. Proc Natl Acad Sci U S A. 2008;105(11):4295–300.
18. Seth RK, Kimono D, Alhasson F, Sarkar S, Albadrani M, Lasley SK, et al. Increased butyrate priming in the gut stalls microbiome associated-gastrointestinal inflammation and hepatic metabolic reprogramming in a mouse model of Gulf War Illness. Toxicol Appl Pharmacol [Internet]. 2018 Jul 1 [cited 2019 Jan 4];350:64–77. Available from: https://www.sciencedirect.com/science/article/pii/S0041008X18302059?via%3Dihub
19. Kimono D, Sarkar S, Albadrani M, Seth R, Bose D, Mondal A, et al. Dysbiosis-associated enteric glial cell immune-activation and redox imbalance modulate tight junction protein expression in gulf war illness pathology. Front Physiol. 2019;10(OCT):1–24.
20. Birth P, Behrman PRE, Butler AS, Birth UP, Healthy A, Isbn O, et al. National Academy of Sciences. All rights reserved. Unless otherwise indicated, all materials in this PDF File are copyrighted by the National Academy of Sciences. Distribution, posting, or copying is strictly prohibited without written permiss. Vol. II, America. 2007. 790 p.
21. Sullivan K, Krengel M, Bradford W, Stone C, Thompson TA, Heeren T, et al. Neuropsychological functioning in military pesticide applicators from the Gulf War: Effects on information processing speed, attention and visual memory. Neurotoxicol Teratol [Internet]. 2018 Jan 1 [cited 2020 Mar 2];65:1–13. Available from: https://www.sciencedirect.com/science/article/pii/S0892036217300806?via%3Dihub

125
22. Abdullah L, Evans JE, Joshi U, Crynen G, Reed J, Mouzon B, et al. Translational potential of long-term decreases in mitochondrial lipids in a mouse model of Gulf War Illness. Toxicology. 2016;
23. Parihar VK, Hattiangady B, Shuai B, Shetty AK. Mood and memory deficits in a model of gulf war illness are linked with reduced neurogenesis, partial neuron loss, and mild inflammation in the hippocampus. Neuropsychopharmacology [Internet]. 2013;38(12):2348–62. Available from: http://dx.doi.org/10.1038/npp.2013.158
24. Koo B-B, Michalovicz LT, Calderazzo S, Kelly KA, Sullivan K, Killiany RJ, et al. Corticosterone potentiates DFP-induced neuroinflammation and affects high-order diffusion imaging in a rat model of Gulf War Illness. Brain Behav Immun [Internet]. 2018 Jan 1 [cited 2020 Mar 2];67:42–6. Available from: https://www.sciencedirect.com/science/article/pii/S0889159117303914?via%3Dihub
25. O’Callaghan JP, Michalovicz LT, Miller J V., Kelly KA. Advancing the Role of Neuroimmunity and Genetic Susceptibility in Gulf War Illness. EBioMedicine [Internet]. 2017;26:11–2. Available from: http://linkinghub.elsevier.com/retrieve/pii/S2352396417304644
26. Georgopoulos A. Brain Function in Gulf War Illness (GWI) and Associated Mental Health Comorbidities. J Neurol Neuromedicine. 2018;3(4):24–34.
27. Haley RW, Charuvastra E, Shell WE, Buhner DM, Marshall WW, Biggs MM, et al. Cholinergic autonomic dysfunction in veterans with gulf war illness: Confirmation in a population-based sample. JAMA Neurol. 2013;70(2):191–200.
28. Coughlin SS, Kang HK, Mahan CM. Selected Health Conditions Among Overweight, Obese, and Non-Obese Veterans of the 1991 Gulf War: Results from a Survey Conducted in 2003–2005. Open Epidemiol J. 2011;(135):140–6.
29. Alhasson F, Das S, Seth R, Dattaroy D, Chandrashekaran V, Ryan CN, et al. Altered gut microbiome in a mouse model of Gulf War Illness causes neuroinflammation and intestinal injury via leaky gut and TLR4 activation. Mukhopadhyay P, editor. PLoS One [Internet]. 2017 Mar 22 [cited 2019 Jan 4];12(3):e0172914. Available from: http://dx.plos.org/10.1371/journal.pone.0172914
30. Kendra L. Puig, Brianna M. Lutz, Siri A. Urquhart, Andrew A. Rebel, Xudong Zhou, Gunjan D. Manoch, MaryAnn Sens, Ashok K. Tutejac, Norman L. Foster and CKC. Overexpression of Mutant Amyloid-β Protein Precursor and Presenilin 1 modulates Enteric nervous system. J Alzheimers Dis. 2015;44(4):1263–78.
31. Nagy-Szakal D, Williams BL, Mishra N, Che X, Lee B, Bateman L, et al. Fecal metagenomic profiles in subgroups of patients with myalgic encephalomyelitis/chronic fatigue syndrome. Microbiome. 2017;5(1):44.

126
32. Giloteaux L, Goodrich JK, Walters WA, Levine SM, Ley RE, Hanson MR. Reduced diversity and altered composition of the gut microbiome in individuals with myalgic encephalomyelitis/chronic fatigue syndrome. Microbiome [Internet]. 2016;4:1–12. Available from: http://dx.doi.org/10.1186/s40168-016-0171-4
33. Naviaux RK, Naviaux JC, Li K, Bright AT, Alaynick WA, Wang L, et al. Metabolic features of chronic fatigue syndrome. Proc Natl Acad Sci U S A. 2016;113(37):E5472–80.
34. Schreuder TCHA, Verwer BJ, van Nieuwkerk CMJ, Mulder CJJ. Nonalcoholic fatty liver disease: An overview of current insights in pathogenesis, diagnosis and treatment. World J Gastroenterol. 2008;14(16):2474–86.
35. Kaltsas G, Vgontzas A, Chrousos G. Fatigue, Endocrinopathies, and Metabolic Disorders. PM R. 2010;2(5):393–8.
36. Seth RK, Kumar A, Das S, Kadiiska MB, Michelotti G, Diehl AM, et al. Environmental toxin-linked nonalcoholic steatohepatitis and hepatic metabolic reprogramming in obese mice. Toxicol Sci. 2013;134(2):291–303.
37. Chiu CC, Ching YH, Li YP, Liu JY, Huang Y Te, Huang YW, et al. Nonalcoholic fatty liver disease is exacerbated in high-fat diet-fed gnotobiotic mice by colonization with the gut microbiota from patients with nonalcoholic steatohepatitis. Nutrients. 2017;9(11).
38. Marra F, Svegliati-Baroni G. Lipotoxicity and the gut-liver axis in NASH pathogenesis. J Hepatol [Internet]. 2018 Feb 1 [cited 2020 Mar 2];68(2):280–95. Available from: https://www.sciencedirect.com/science/article/pii/S0168827817324376?via%3Dihub
39. Mingming Sun, Wei Wu, Zhanju Liu2 and YC. Microbiota metabolite short chain fatty acids, GCPR and inflammatory bowel diseases. J Gastroenterol. 2017;52(5):1–8.
40. Zhang M, Zhou Q, Dorfman RG, Huang X, Fan T, Zhang H, et al. Butyrate inhibits interleukin-17 and generates Tregs to ameliorate colorectal colitis in rats. BMC Gastroenterol [Internet]. 2016;16(1):1–9. Available from: http://dx.doi.org/10.1186/s12876-016-0500-x
41. Floris Imhann, Arnau Vich Vila, Marc Jan Bonder, Jingyuan Fu3, Dirk Gevers, Marijn C. Visschedijk, Lieke M. Spekhorst, Rudi Alberts, Lude Franke, Hendrik M. van Dullemen, Rinze W.F. Ter Steege, Curtis Huttenhower, Gerard Dijkstra, Ramnik J. Xavier, Eleono AZ, Weersma RK. The Interplay of Host Genetics and the Gut Microbiota Underlying the Onset and Clinical Presentation of Inflammatory Bowel Disease. Gut. 2018;67(1):108–19.

127
42. Sekhavat A, Sun JM, Davie JR. Competitive inhibition of histone deacetylase activity by trichostatin A and butyrate. Biochem Cell Biol. 2007;85(6):751–8.
43. Singh N, Gurav A, Sivaprakasam S, Brady E, Padia R, Shi H, et al. Activation of Gpr109a, receptor for niacin and the commensal metabolite butyrate, suppresses colonic inflammation and carcinogenesis. Immunity. 2014;40(1):128–39.
44. Zakirova Z, Tweed M, Crynen G, Reed J, Abdullah L, Nissanka N, et al. Gulf War agent exposure causes impairment of long-term memory formation and neuropathological changes in a mouse model of Gulf War Illness. PLoS One [Internet]. 2015;10(3):1–20. Available from: http://dx.doi.org/10.1371/journal.pone.0119579
45. Luettig J, Rosenthal R, Barmeyer C, Schulzke JD. Claudin-2 as a mediator of leaky gut barrier during intestinal inflammation. Tissue Barriers. 2015;3(1):1–2.
46. Leon Zheng, Caleb J. Kelly, Kayla D. Battista Rachel Schaefer, Jordi M. Lanis, Erica E. Alexeev, Ruth X. Wang, Joseph C. Onyiah, Douglas J. Kominsky S, Colgan P. Microbial-derived Butyrate Promotes Epithelial Barrier Function Through IL-10 Receptor-dependent Repression of Claudin-2. J Immunol. 2017;199(8):1976–2984.
47. Garcia-Martinez I, Shaker ME, Mehal WZ. Therapeutic Opportunities in Damage-Associated Molecular Pattern-Driven Metabolic Diseases. Antioxidants Redox Signal. 2015;23(17):1305–15.
48. Chatterjee S, Ganini D, Tokar EJ, Kumar A, Das S, Corbett J, et al. Leptin is key to peroxynitrite-mediated oxidative stress and Kupffer cell activation in experimental non-alcoholic steatohepatitis. J Hepatol [Internet]. 2013 Apr 1 [cited 2020 Mar 2];58(4):778–84. Available from: https://www.sciencedirect.com/science/article/pii/S0168827812009051?via%3Dihub
49. Chandrashekaran V, Seth RK, Dattaroy D, Alhasson F, Ziolenka J, Carson J, et al. HMGB1-RAGE pathway drives peroxynitrite signaling-induced IBD-like inflammation in murine nonalcoholic fatty liver disease. Redox Biol [Internet]. 2017 Oct 1 [cited 2020 Mar 2];13:8–19. Available from: https://www.sciencedirect.com/science/article/pii/S2213231717302744?via%3Dihub
50. Chandrashekaran V, Das S, Seth RK, Dattaroy D, Alhasson F, Michelotti G, et al. Purinergic receptor X7 mediates leptin induced GLUT4 function in stellate cells in nonalcoholic steatohepatitis. Biochim Biophys Acta - Mol Basis Dis [Internet]. 2016 Jan 1 [cited 2020 Mar 2];1862(1):32–45. Available from: https://www.sciencedirect.com/science/article/pii/S0925443915003099?via%3Dihub
128
51. Reichardt F, Chassaing B, Nezami BG, Li G, Tabatabavakili S, Mwangi S, et al. Western diet induces colonic nitrergic myenteric neuropathy and dysmotility in mice via saturated fatty acid- and lipopolysaccharide-induced TLR4 signalling. J Physiol. 2017;595(5):1831–46.
52. Henao-mejia J, Elinav E, Jin C, Hao L, Mehal WZ, Strowig T, et al. Inflammasome-mediated dysbiosis regulates progression of NAFLD and obesity. 2012;482(7384):6.
53. Boutagy NE, McMillan RP, Frisard MI, Hulver MW. Metabolic endotoxemia with obesity: Is it real and is it relevant? Biochimie [Internet]. 2016 May 1 [cited 2020 Mar 2];124:11–20. Available from: https://www.sciencedirect.com/science/article/pii/S0300908415001996?via%3Dihub
54. Bechmann LP, Hannivoort RA, Gerken G, Hotamisligil GS, Trauner M, Canbay A. The interaction of hepatic lipid and glucose metabolism in liver diseases. Journal of Hepatology. 2012.
55. James GO, Hocart CH, Hillier W, Chen H, Kordbacheh F, Price GD, et al. Fatty acid profiling of Chlamydomonas reinhardtii under nitrogen deprivation. Bioresour Technol. 2011 Feb;102(3):3343–51.
56. Doycheva I, Watt KD, Rifai G, Abou Mrad R, Lopez R, Zein NN, et al. Increasing Burden of Chronic Liver Disease Among Adolescents and Young Adults in the USA: A Silent Epidemic. Dig Dis Sci. 2017;62(5):1373–80.
57. Geidl-Flueck B, Gerber PA. Insights into the hexose liver metabolism—glucose versus fructose. Nutrients. 2017;9(9).
58. Badman MK, Pissios P, Kennedy AR, Koukos G, Flier JS, Maratos-Flier E. Hepatic Fibroblast Growth Factor 21 Is Regulated by PPARα and Is a Key Mediator of Hepatic Lipid Metabolism in Ketotic States. Cell Metab [Internet]. 2007 Jun 6 [cited 2020 Mar 2];5(6):426–37. Available from: https://www.sciencedirect.com/science/article/pii/S1550413107001295?via%3Dihub
59. Karim S, Adams DH, Lalor PF. Hepatic expression and cellular distribution of the glucose transporter family. World J Gastroenterol. 2012;18(46):6771–81.
60. Tang Y, Chen A. Curcumin prevents leptin raising glucose levels in hepatic stellate cells by blocking translocation of glucose transporter-4 and increasing glucokinase. Br J Pharmacol. 2010;161(5):1137–49.

129
61. Razolli DS, Moraes JC, Morari J, Moura RF, Vinolo MA, Velloso LA. TLR4 expression in bone marrow-derived cells is both necessary and sufficient to produce the Insulin resistance phenotype in diet-induced obesity. Endocrinology. 2015;156(1):103–13.
62. LeBlanc JG, Chain F, Martín R, Bermúdez-Humarán LG, Courau S, Langella P. Beneficial effects on host energy metabolism of short-chain fatty acids and vitamins produced by commensal and probiotic bacteria. Microb Cell Fact. 2017;16(1):1–10.
63. O’Callaghan JP, Kelly KA, Locker AR, Miller DB, Lasley SM. Corticosterone primes the neuroinflammatory response to DFP in mice: Potential animal model of Gulf War Illness. J Neurochem. 2015;133(5):708–21.
64. Sappington PL, Yang R, Yang H, Tracey KJ, Delude RL, Fink MP. HMGB1 B box increases the permeability of Caco-2 enterocytic monolayers and impairs intestinal barrier function in mice. Gastroenterology [Internet]. 2002 Sep 1 [cited 2020 Mar 2];123(3):790–802. Available from: https://www.sciencedirect.com/science/article/pii/S0016508502001701?via%3Dihub
65. Reglero G, Frial P, Cifuentes A, García-Risco MR, Jaime L, Marin FR, et al. Meat-based functional foods for dietary equilibrium omega-6/omega-3. Mol Nutr Food Res. 2008 Oct;52(10):1153–61.
66. Sobhani I, Vissuzaine C, Buyse M, Kermorgant S, Laigneau J-P, Henin D, et al. Leptin secretion and leptin receptor in human stomach. Gastroenterology. 2000;118(4):A34.
67. Koslik HJ, Hamilton G, Golomb BA. Mitochondrial dysfunction in Gulf War illness revealed by 31phosphorus magnetic resonance spectroscopy: A case-control study. PLoS One. 2014;9(3):1–6.
68. Kelsall HL, McKenzie DP, Sim MR, Leder K, Forbes AB, Dwyer T. Physical, psychological, and functional comorbidities of multisymptom Illness in Australian male veterans of the 1991 Gulf War. Am J Epidemiol. 2009;170(8):1048–56.
69. Carey EJ, Ali AH, Lindor KD. Primary biliary cirrhosis. Lancet [Internet]. 2015 Oct 17 [cited 2020 Mar 2];386(10003):1565–75. Available from: https://www.sciencedirect.com/science/article/pii/S0140673615001543?via%3Dihub
70. Sweet PH, Khoo T, Nguyen S. Nonalcoholic Fatty Liver Disease. Prim Care - Clin Off Pract [Internet]. 2017;44(4):599–607. Available from: https://doi.org/10.1016/j.pop.2017.07.003

130
71. Jensen Ø, Bernklev T, Jelsness-Jørgensen L-P. Fatigue in type 1 diabetes: A systematic review of Observational studies. Diabetes Res Clin Pract [Internet]. 2017 Jan 1 [cited 2020 Mar 2];123:63–74. Available from: https://www.sciencedirect.com/science/article/pii/S0168822716303631?via%3Dihub
72. Feingold KR, Shigenaga JK, Kazemi MR, McDonald CM, Patzek SM, Cross AS, et al. Mechanisms of triglyceride accumulation in activated macrophages. J Leukoc Biol. 2012;92(4):829–39.
73. Wang D, Sun C, Liu L, Sun X, Jin X, Song W, et al. Serum fatty acid profiles using GC-MS and multivariate statistical analysis : potential biomarkers of Alzheimer ’ s disease. NBA. 2010;2006:1–10.
74. Anderson EK, Hill AA, Hasty AH. Stearic acid accumulation in macrophages induces TLR4/2- independent inflammation leading to ER stress-mediated apoptosis. Arter Thromb Vasc Biol. 2012;32(7):1687–95.
75. Iizuka K, Horikawa Y. ChREBP: A glucose-activated transcription factor involved in the development of metabolic syndrome. Endocr J. 2008;55(4):617–24.
76. Oishi Y, Spann NJ, Link VM, Muse ED, Strid T, Edillor C, et al. SREBP1 Contributes to Resolution of Pro-inflammatory TLR4 Signaling by Reprogramming Fatty Acid Metabolism. Cell Metab [Internet]. 2017 Feb 7 [cited 2020 Mar 2];25(2):412–27. Available from: https://www.sciencedirect.com/science/article/pii/S1550413116305885?via%3Dihub
77. Mauro C, Leow SC, Anso E, Rocha S, Thotakura AK, Tornatore L, et al. NF-κB controls energy homeostasis and metabolic adaptation by upregulating mitochondrial respiration. Nat Cell Biol. 2011;13(10):1272–9.
78. Khan S, Jena G. Sodium butyrate, a HDAC inhibitor ameliorates eNOS, iNOS and TGF-β1-induced fibrogenesis, apoptosis and DNA damage in the kidney of juvenile diabetic rats. Food Chem Toxicol [Internet]. 2014 Nov 1 [cited 2020 Mar 2];73:127–39. Available from: https://www.sciencedirect.com/science/article/pii/S0278691514003822?via%3Dihub
79. Andrade-Tacca CA, Chang CC, Chen YH, Manh D Van, Chang CY. Esterification of jatropha oil by sequential ultrasonic irradiation with auto-induced temperature rise and dosing of methanol and sulfuric acid catalyst. J Taiwan Inst Chem Eng. 2014;45(4):1523–31.

131
80. Dunphy RC, Bridgewater L, Price DD, Robinson ME, Zeilman CJ, Verne GN. Visceral and cutaneous hypersensitivity in Persian Gulf war veterans with chronic gastrointestinal symptoms. Pain [Internet]. 2003 Mar 1 [cited 2019 Jan 4];102(1–2):79–85. Available from: https://www.sciencedirect.com/science/article/pii/S0304395902003421
81. Koch GTR, Koch CTR, Emory TS. Persian Gulf War Exposure. 2005;170(August):696–700.
82. Zhou Q, Verne ML, Zhang B, Verne GN. Evidence for somatic hypersensitivity in veterans with gulf war illness and gastrointestinal symptoms. Clin J Pain. 2018;34(10):944–9.
83. Bassotti G, Villanacci V, Fisogni S, Rossi E, Baronio P, Clerici C, et al. Enteric glial cells and their role in gastrointestinal motor abnormalities: Introducing the neuro-gliopathies. World J Gastroenterol. 2007;13(30):4035–41.
84. Ochoa-Cortes F, Turco F, Linan-Rico A, Soghomonyan S, Whitaker E, Wehner S, et al. Enteric Glial Cells: A New Frontier in Neurogastroenterology and Clinical Target for Inflammatory Bowel Diseases. Inflamm Bowel Dis. 2016;22(2):433–49.
85. Sharkey KA. Emerging roles for enteric glia in gastrointestinal disorders. J Clin Invest. 2015;125(3):918–25.
86. Yu YB, Li YQ. Enteric glial cells and their role in the intestinal epithelial barrier. World J Gastroenterol. 2014;20(32):11273–80.
87. Von Boyen GBT, Schulte N, Pflüger C, Spaniol U, Hartmann C, Steinkamp M. Distribution of enteric glia and GDNF during gut inflammation. BMC Gastroenterol [Internet]. 2011;11(1):3. Available from: http://www.biomedcentral.com/1471-230X/11/3
88. Turco F, Sarnelli G, Cirillo C, Palumbo I, De Giorgi F, D’Alessandro A, et al. Enteroglial-derived S100B protein integrates bacteria-induced Toll-like receptor signalling in human enteric glial cells. Gut. 2014;63(1):105–15.
89. Capoccia E, Cirillo C, Gigli S, Pesce M, D’Alessandro A, Cuomo R, et al. Enteric glia: A new player in inflammatory bowel diseases. Int J Immunopathol Pharmacol. 2015;28(4):443–51.
90. Menees S, Chey W. The gut microbiome and irritable bowel syndrome. F1000Research [Internet]. 2018;7(0):1029. Available from: https://f1000research.com/articles/7-1029/v1
91. Distrutti E, Monaldi L, Ricci P, Fiorucci S. Gut microbiota role in irritable bowel syndrome: New therapeutic strategies. World J Gastroenterol. 2016;22(7):2219–41.

132
92. Conlon MA, Bird AR. The impact of diet and lifestyle on gut microbiota and human health. Nutrients. 2015;7(1):17–44.
93. Ehman EC, Johnson GB, Villanueva-meyer JE, Cha S, Leynes AP, Eric P, et al. HHS Public Access. 2017;46(5):1247–62.
94. Cornet A, Savidge TC, Cabarrocas J, Deng W-L, Colombel J-F, Lassmann H, et al. Enterocolitis induced by autoimmune targeting of enteric glial cells: A possible mechanism in Crohn’s disease? Proc Natl Acad Sci [Internet]. 2001;98(23):13306–11. Available from: http://www.pnas.org/cgi/doi/10.1073/pnas.231474098
95. Liñán-Rico A, Turco F, Ochoa-Cortes F, Harzman A, Needleman BJ, Arsenescu R, et al. Molecular Signaling and Dysfunction of the Human Reactive Enteric Glial Cell Phenotype: Implications for GI Infection, IBD, POI, Neurological, Motility, and GI Disorders. Vol. 22, Inflammatory Bowel Diseases. 2016. 1812-1834 p.
96. Chen Y, Liu G, He F, Zhang L, Yang K, Yu H, et al. MicroRNA 375 modulates hyperglycemia-induced enteric glial cell apoptosis and Diabetes-induced gastrointestinal dysfunction by targeting Pdk1 and repressing PI3K/Akt pathway. Sci Rep [Internet]. 2018;8(1):1–10. Available from: http://dx.doi.org/10.1038/s41598-018-30714-0
97. Wang P, Du C, Chen FX, Li CQ, Yu YB, Han T, et al. BDNF contributes to IBS-like colonic hypersensitivity via activating the enteroglia-nerve unit. Sci Rep [Internet]. 2016;6(September 2015):1–15. Available from: http://dx.doi.org/10.1038/srep20320
98. Brown IAM, McClain JL, Watson RE, Patel BA, Gulbransen BD. Enteric Glia Mediate Neuron Death in Colitis Through Purinergic Pathways That Require Connexin-43 and Nitric Oxide. Cmgh [Internet]. 2016;2(1):77–91. Available from: http://dx.doi.org/10.1016/j.jcmgh.2015.08.007
99. Hernandez S, Fried DE, Grubišić V, McClain JL, Gulbransen BD. Gastrointestinal neuroimmune disruption in a mouse model of Gulf War illness. FASEB J. 2019;33(5):6168–84.
100. Akimoto H. The possible role of adhesion molecule, ??3 integrin, in the synthesis of intracrescentic extracellular matrix in accelerated anti-GBM nephritis. Japanese J Nephrol. 2000;42(1):1–10.
101. Macchioni L, Davidescu M, Fettucciari K, Petricciuolo M, Gatticchi L, Gioè D, et al. Enteric glial cells counteract Clostridium difficile Toxin B through a NADPH oxidase/ROS/JNK/caspase-3 axis, without involving mitochondrial pathways. Sci Rep. 2017;7(December 2016):1–11.
102. Abais JM, Xia M, Zhang Y, Boini KM, Li P-L. Redox Regulation of NLRP3 Inflammasomes: ROS as Trigger or Effector? Antioxid Redox Signal [Internet]. 2015;22(13):1111–29. Available from: http://online.liebertpub.com/doi/10.1089/ars.2014.5994

133
103. Johnson EL, Heaver SL, Walters WA, Ley RE. Microbiome and metabolic disease: revisiting the bacterial phylum Bacteroidetes. J Mol Med [Internet]. 2017;95(1). Available from: http://dx.doi.org/10.1007/s00109-016-1492-2
104. Zhang YJ, Li S, Gan RY, Zhou T, Xu DP, Li H Bin. Impacts of gut bacteria on human health and diseases. Int J Mol Sci. 2015;16(4):7493–519.
105. Bassotti G, Macchioni L, Corazzi L, Marconi P, Fettucciari K. Clostridium difficile-related postinfectious IBS: a case of enteroglial microbiological stalking and/or the solution of a conundrum? Cell Mol Life Sci [Internet]. 2018;75(7):1145–9. Available from: https://doi.org/10.1007/s00018-017-2736-1
106. Fukuda K, Nisenbaum R, Stewart G, Thompson WW, Robin L, Washko RM, et al. Chronic multisymptom illness affecting Air Force veterans of the Gulf War. J Am Med Assoc. 1998;280(11):981–8.
107. Rose MR, Brix KA. Neurological disorders in Gulf War veterans. Philos Trans R Soc B Biol Sci. 2006;361(1468):605–18.
108. Jeffrey MG, Krengel M, Kibler JL, Zundel C, Klimas NG, Sullivan K, et al. Neuropsychological findings in gulf war illness: A review. Front Psychol. 2019;10(SEP):1–23.
109. Brian E. Engdahl, Lisa M. James, Ryan D. Miller, Arthur C. Leuthold, Scott M. Lewis, Adam F. Carpenter APG. Brain function in Gulf war illness (GWI) and Associated Mental Health Comorbidities. J Neurol Neuromedicine. 2018;3(4):24–34.
110. Doebbeling BN, Clarke WR, Watson D, Torner JC, Woolson RF, Voelker MD, et al. Is there a Persian Gulf War syndrome? Evidence from a large population-based survey of veterans and nondeployed controls. Am J Med [Internet]. 2000 Jun 15 [cited 2020 Mar 4];108(9):695–704. Available from: https://www.sciencedirect.com/science/article/pii/S0002934300004058?via%3Dihub
111. Gray GC, Kaiser KS, Hawksworth AW, Hall FW, Barrett-Connor E. Increased postwar symptoms and psychological morbidity among U.S. Navy Gulf War veterans. Am J Trop Med Hyg. 1999;60(5):758–66.
112. Gulf P. Experience and Health. 2012;20892.
113. Golomb BA, Bloom FE, Bunker JA, Crawford F, Joel C. during deployment. 2016;449–75.
114. Joshi U, Pearson A, Evans JE, Langlois H, Saltiel N, Ojo J, et al. A permethrin metabolite is associated with adaptive immune responses in Gulf War Illness. Brain Behav Immun [Internet]. 2019 Oct 1 [cited 2020 Mar 4];81:545–59. Available from: https://www.sciencedirect.com/science/article/pii/S0889159119303290?via%3Dih

134
115. Abou-Donia MB, Conboy LA, Kokkotou E, Jacobson E, Elmasry EM, Elkafrawy P, et al. Screening for novel central nervous system biomarkers in veterans with Gulf War Illness. Neurotoxicol Teratol [Internet]. 2017 May 1 [cited 2020 Mar 4];61:36–46. Available from: https://www.sciencedirect.com/science/article/pii/S0892036217300508?via%3Dihub
116. Madhu LN, Attaluri S, Kodali M, Shuai B, Upadhya R, Gitai D, et al. Neuroinflammation in Gulf War Illness is linked with HMGB1 and complement activation, which can be discerned from brain-derived extracellular vesicles in the blood. Brain Behav Immun [Internet]. 2019;81(May):430–43. Available from: https://doi.org/10.1016/j.bbi.2019.06.040
117. Sampaio TB, Savall AS, Gutierrez MEZ, Pinton S. Neurotrophic factors in Alzheimer’s and parkinson’s diseases: Implications for pathogenesis and therapy. Neural Regen Res. 2017;12(4):549–57.
118. Khan N, Smith MT. Neurotrophins and neuropathic pain: Role in pathobiology. Molecules. 2015;20(6):10657–88.
119. Jiao SS, Shen LL, Zhu C, Bu XL, Liu YH, Liu CH, et al. Brain-derived neurotrophic factor protects against tau-related neurodegeneration of Alzheimer’s disease. Transl Psychiatry. 2016;6(10).
120. J. Allen S, J. Watson J, Dawbarn D. The Neurotrophins and Their Role in Alzheimers Disease. Curr Neuropharmacol. 2011;9(4):559–73.
121. Grande I, Fries GR, Kunz M, Kapczinski F. The role of BDNF as a mediator of neuroplasticity in bipolar disorder. Psychiatry Investig. 2010;7(4):243–50.
122. Lima Giacobbo B, Doorduin J, Klein HC, Dierckx RAJO, Bromberg E, de Vries EFJ. Brain-Derived Neurotrophic Factor in Brain Disorders: Focus on Neuroinflammation. Mol Neurobiol. 2019;56(5):3295–312.
123. Heneka MT, Carson MJ, Khoury J El, Gary E, Brosseron F, Feinstein DL, et al. HHS Public Access Neuroinflammation in Alzheimer ’ s Disease. Lancet Neurol. 2015;14(4):388–405.
124. Wang WF, Guo XX, Yang YS. Gastrointestinal problems in modern wars: Clinical features and possible mechanisms. Mil Med Res [Internet]. 2015;2(1):1–8. Available from: http://dx.doi.org/10.1186/s40779-015-0042-5
125. Lee Y, Lee S, Chang SC, Lee J. Significant roles of neuroinflammation in Parkinson’s disease: therapeutic targets for PD prevention. Arch Pharm Res [Internet]. 2019;42(5):416–25. Available from: https://doi.org/10.1007/s12272-019-01133-0

135
126. Miranda M, Morici JF, Zanoni MB, Bekinschtein P. Brain-Derived Neurotrophic Factor: A Key Molecule for Memory in the Healthy and the Pathological Brain. Front Cell Neurosci. 2019;13(August):1–25.
127. Bathina S, Das UN. Brain-derived neurotrophic factor and its clinical Implications. Arch Med Sci. 2015;11(6):1164–78.
128. Seth RK, Maqsood R, Mondal A, Bose D, Kimono D, Holland LA, et al. Gut DNA virome diversity and its association with host bacteria regulate inflammatory phenotype and neuronal immunotoxicity in experimental gulf war illness. Viruses. 2019;11(10):1–23.
129. Locker AR, Michalovicz LT, Kelly KA, Miller J V., Miller DB, O’Callaghan JP. Corticosterone primes the neuroinflammatory response to Gulf War Illness-relevant organophosphates independently of acetylcholinesterase inhibition. J Neurochem. 2017;142(3):444–55.
130. Dao MC, Everard A, Aron-Wisnewsky J, Sokolovska N, Prifti E, Verger EO, et al. Akkermansia muciniphila and improved metabolic health during a dietary intervention in obesity: Relationship with gut microbiome richness and ecology. Gut. 2016;65(3):426–36.
131. Ottman N, Geerlings SY, Aalvink S, de Vos WM, Belzer C. Action and function of Akkermansia muciniphila in microbiome ecology, health and disease. Best Pract Res Clin Gastroenterol [Internet]. 2017 Dec 1 [cited 2020 Mar 4];31(6):637–42. Available from: https://www.sciencedirect.com/science/article/pii/S1521691817301130
132. Andreasson KI, Bachstetter AD, Colonna M, Ginhoux F, Lamb B, Landreth G, et al. targeting innate immune systems in the Central Nervous System. 2017;138(5):653–93.
133. Latz E, Ts X, Stutz A. Display Settings : Activation and regulation of the inflammasomes . Nat Rev Immunol. 2013;13(6):1–30.
134. Sepehri Z, Kiani Z, Afshari M, Kohan F, Dalvand A, Ghavami S. Inflammasomes and type 2 diabetes: An updated systematic review. Immunol Lett [Internet]. 2017 Dec 1 [cited 2020 Mar 4];192:97–103. Available from: https://www.sciencedirect.com/science/article/pii/S0165247817305060?via%3Dihub
135. Lang Y, Chu F, Shen D, Zhang W, Zheng C, Zhu J, et al. Role of inflammasomes in neuroimmune and neurodegenerative diseases: A systematic review. Mediators Inflamm. 2018;2018.

136
136. Ng TKS, Ho CSH, Tam WWS, Kua EH, Ho RCM. Decreased serum brain-derived neurotrophic factor (BDNF) levels in patients with Alzheimer’s disease (AD): A systematic review and meta-analysis. Int J Mol Sci. 2019;20(2):1–26.
137. Everard A, Belzer C, Geurts L, Ouwerkerk JP, Druart C, Bindels LB, et al. Cross-talk between Akkermansia muciniphila and intestinal epithelium controls diet-induced obesity. Proc Natl Acad Sci U S A. 2013;110(22):9066–71.
138. Cani PD. Human gut microbiome: Hopes, threats and promises. Gut. 2018;67(9):1716–25.
139. Geerlings S, Kostopoulos I, de Vos W, Belzer C. Akkermansia muciniphila in the Human Gastrointestinal Tract: When, Where, and How? Microorganisms. 2018;6(3):75.
140. Lopez-Siles M, Enrich-Capó N, Aldeguer X, Sabat-Mir M, Duncan SH, Garcia-Gil LJ, et al. Alterations in the Abundance and Co-occurrence of Akkermansia muciniphila and Faecalibacterium prausnitzii in the Colonic Mucosa of Inflammatory Bowel Disease Subjects. Front Cell Infect Microbiol. 2018;8(SEP).
141. Cani PD, de Vos WM. Next-generation beneficial microbes: The case of
Akkermansia muciniphila. Front Microbiol. 2017;8(SEP):1–8.
142. Schneeberger M, Everard A, Gómez-Valadés AG, Matamoros S, Ramírez S, Delzenne NM, et al. Akkermansia muciniphila inversely correlates with the onset of inflammation, altered adipose tissue metabolism and metabolic disorders during obesity in mice. Sci Rep. 2015;5(October):1–14.
143. Bian X, Wu W, Yang L, Lv L, Wang Q, Li Y, et al. Administration of Akkermansia muciniphila Ameliorates Dextran Sulfate Sodium-Induced Ulcerative Colitis in Mice. Front Microbiol. 2019;10(October):1–18.
144. Van Der Lugt B, Van Beek AA, Aalvink S, Meijer B, Sovran B, Vermeij WP, et al. Akkermansia muciniphila ameliorates the age-related decline in colonic mucus thickness and attenuates immune activation in accelerated aging Ercc1 -/Δ7 mice. Immun Ageing. 2019;16(1):1–17.
145. Helio M, Reunanen A, Aromaa A, Knekt P, Montonen J, Ja R. Food consumption and the incidence of type II diabetes mellitus. Eur J Clin Nutr. 2005;441–8.
146. Kimono D, Sarkar S, Albadrani M, Seth R, Bose D, Mondal A, et al. Dysbiosis-Associated Enteric Glial Cell Immune-Activation and Redox Imbalance Modulate Tight Junction Protein Expression in Gulf War Illness Pathology. Front Physiol. 2019;10(October):1–24.

137
147. Greene C, Hanley N, Campbell M. Claudin-5: Gatekeeper of neurological function. Fluids Barriers CNS [Internet]. 2019;16(1):1–15. Available from: https://doi.org/10.1186/s12987-019-0123-z
148. Romanitan MO, Popescu BO, Spulber Ş, Bâjenaru O, Popescu LM, Winblad B, et al. Altered expression of claudin family proteins in Alzheimer’s disease and vascular dementia brains. J Cell Mol Med. 2010;14(5):1088–100.
149. Nishiura K, Ichikawa-Tomikawa N, Sugimoto K, Kunii Y, Kashiwagi K, Tanaka M, et al. PKA activation and endothelial claudin-5 breakdown in the schizophrenic prefrontal cortex. Oncotarget. 2017;8(55):93382–91.
150. Meessen ECE, Warmbrunn M V., Nieuwdorp M, Soeters MR. Human postprandial nutrient metabolism and low-grade inflammation: A narrative review. Nutrients. 2019;11(12):1–21.
151. Kokkola R, Andersson Å, Mullins G, Östberg T, Treutiger CJ, Arnold B, et al. RAGE is the major receptor for the proinflammatory activity of HMGB1 in rodent macrophages. Scand J Immunol. 2005;61(1):1–9.
152. Weber DJ, Allette YM, Wilkes DS, White FA. The HMGB1-RAGE Inflammatory Pathway: Implications for Brain Injury-Induced Pulmonary Dysfunction. Antioxidants Redox Signal. 2015;23(17):1316–28.
153. Ozaki E, Campbell M, Doyle SL. Targeting the NLRP3 inflammasome in chronic inflammatory diseases: Current perspectives. J Inflamm Res. 2015;8:15–27.
154. Davis BK, Wen H, Ting JP-Y. The Inflammasome NLRs in Immunity, Inflammation, and Associated Diseases Beckley. Annu Rev Immunol. 2011;29:707–35.
155. Xie ZM, Wang XM, Xu N, Wang J, Pan W, Tang XH, et al. Alterations in the inflammatory cytokines and brain-derived neurotrophic factor contribute to depression-like phenotype after spared nerve injury: Improvement by ketamine. Sci Rep. 2017;7(1):1–12.
156. Lapchak PA, Araujo DM, Hefti F. Systemic interleukin-1β decreases brain-derived neurotrophic factor messenger RNA expression in the rat hippocampal formation. Neuroscience [Internet]. 1993 Mar 1 [cited 2020 Mar 4];53(2):297–301. Available from: https://www.sciencedirect.com/science/article/pii/030645229390196M?via%3Dihub
157. Tong L, Balazs R, Soiampornkul R, Thangnipon W, Cotman CW. Interleukin-1β impairs brain derived neurotrophic factor-induced signal transduction. Neurobiol Aging [Internet]. 2008 Sep 1 [cited 2020 Mar 4];29(9):1380–93.

138
APPENDIX A
PERMISSION TO REPRINT CHAPTERS
Permission to reprint chapter 2

139
Permission to reprint chapter 3