Embed Size (px)
Citation preview

Microeconomics 2
John Hey

Questionnaire
I would be grateful if you would complete the Lecture Evaluation Questionnaire.

Chapter 16
• Empirical Analysis of Demand, Supply and Surpluses.
• Very important for those who want to be economists.
• Difficult because it requires some knowledge of econometrics.
• There will not be questions on the econometrics of this chapter in the exams.
• Note: the data is rather old. If you are keen, you could try and re-estimate using more up-to-date data.

Chapter 16
• We estimate the demand for food in the U.K. – using our theory.
• We estimate the supply of food in the U.K. – using our theory.
• We investigate the effect of the imposition of a tax in food on the price of food, the quantity bought and sold and on the surpluses (see chapter 27).
• Let us go to Maple. This PowerPoint file just contains a summary of notation and results.

YEAR NLI NALL RALL RFOD NFOD PALL PFOD PMAF PUW
1948 . 8417 142958 32737 2320 0.0589 0.0708 . .
1949 . 8771 145251 33977 2508 0.0604 0.0738 . .
1950 . 9257 149082 35572 2758 0.0621 0.0775 . .
1951 . 9998 147049 34938 3022 0.0680 0.0864 . .
1952 . 10526 147017 30760 2824 0.0716 0.0918 . .
1953 . 11226 153393 32533 3122 0.0732 0.0959 . .
1954 . 11906 159716 33210 3295 0.0745 0.0992 . .
1955 . 12832 166245 34385 3585 0.0772 0.1042 . .
1956 . 13494 167041 34941 3787 0.0808 0.1083 . .
1957 . 14227 170434 35466 3928 0.0834 0.1107 . .
1958 . 15013 175182 35893 4028 0.0856 0.1122 . .
1959 . 15802 182697 36580 4157 0.0864 0.1136 . .
1960 . 16573 189586 37366 4225 0.0874 0.1130 . .
1961 . 17422 193663 37985 4366 0.0899 0.1149 . .
1962 . 18438 197837 38366 4560 0.0931 0.1188 . .
1963 5.30 19565 206304 38568 4689 0.0948 0.1215 . .
1964 5.80 20868 212644 39041 4889 0.0981 0.1252 . .
1965 6.43 22151 215002 39016 5059 0.1030 0.1296 . .
1966 6.91 23391 218707 39445 5297 0.1069 0.1342 . .
1967 6.80 24579 223851 40094 5485 0.1098 0.1368 . .
1968 7.54 26451 230135 40303 5696 0.1149 0.1413 . .
1969 9.05 28054 231201 40418 6035 0.1213 0.1493 . .
1970 9.21 30547 237739 40824 6429 0.1284 0.1574 . .
1971 8.85 34250 245429 40861 7105 0.1395 0.1738 . .
1972 8.90 38780 261277 40789 7614 0.1484 0.1866 . .
1973 10.71 44360 275705 41770 8751 0.1608 0.2095 . .
1974 14.77 51126 271228 41038 10028 0.1884 0.2443 32.0 .
1975 14.39 62881 270421 41050 12313 0.2325 0.2999 35.3 .
1976 14.43 73060 271477 41484 14459 0.2691 0.3485 44.3 .
1977 12.73 83504 270434 41126 16596 0.3087 0.4035 50.5 .
1978 12.47 96368 284901 41879 18373 0.3382 0.4387 50.5 .
1979 12.99 114458 297453 42812 20988 0.3847 0.4902 59.0 43.4
1980 13.78 132663 297256 42866 23655 0.4462 0.5518 69.3 53.0
1981 14.74 147120 297237 42591 24946 0.4949 0.5857 78.5 58.2
1982 12.88 160997 299810 42694 26490 0.5369 0.6204 83.4 66.7
1983 10.80 176881 313648 43416 28061 0.5639 0.6463 88.1 67.7
1984 10.69 189244 319357 42676 29274 0.5925 0.6859 96.6 70.0
1985 10.62 206600 331404 43213 30657 0.6234 0.7094 96.6 74.0
1986 9.87 228848 353831 44572 32574 0.6467 0.7308 81.0 76.9
1987 9.47 251143 372601 45709 34402 0.6740 0.7523 82.6 78.6
1988 9.36 283425 400427 46745 36491 0.7078 0.7806 84.5 80.8
1989 9.58 310493 413498 47538 39143 0.7508 0.8234 89.1 84.8
1990 11.08 336492 415788 47055 41817 0.8092 0.8886 88.5 90.4
1991 9.92 357785 408309 47114 44044 0.8762 0.9348 86.6 94.8
1992 9.12 377147 410026 47664 45193 0.9198 0.9481 86.3 95.0
1993 7.87 399108 420081 48282 46334 0.9500 0.9596 90.2 94.8
1994 8.05 419262 431462 48931 47122 0.9717 0.9630 91.9 95.3
1995 8.26 438453 438453 49274 49274 1.0000 1.0000 100.0 100.0
1996 8.10 467841 454686 50931 52513 1.0289 1.0310 98.8 105.4
1997 7.09 498307 472701 51786 53188 1.0541 1.0270 90.6 109.2
1998 5.45 530851 491378 51627 53789 1.0803 1.0418 82.5 114.6
1999 4.70 564369 512864 52277 54862 1.1004 1.0494 83.7 115.0

RAW SERIES ABPB Household Expenditure:Total Household Final Consumption Expenditure: CP NALL ABPF Household Expenditure:Total Household Final Consumption Expenditure: KP95 RALL CCBMHousehold Expenditure: Household exp.on food: KP95 RFOD CCDWHousehold Expenditure: Household expenditure on food: Current price NFOD AJLX BGS : long-dated (20 years) : Par yield - per cent per annum NLI LNNK UWC : whole economy SA: Index 1995=100: UK PUW PLKW PPI: 6292000000: M & F purchased by manufacturing industry PMAF
DERIVED SERIES Price of Final Consumption Expenditure NALL/RALL PALL Price of Food Expenditure NFOD/RFOD PFOD Price of Non-Food Expenditure (NALL-NFOD)/(RALL-RFOD) QFOD
VALUES OF VARIABLES IN 1999 NALL 564369 PALL 1.10043 PMAF 83.7 NLI 4.7 PUW 115 PFOD 1.104945 RFOD 52277 QFOD 1.106
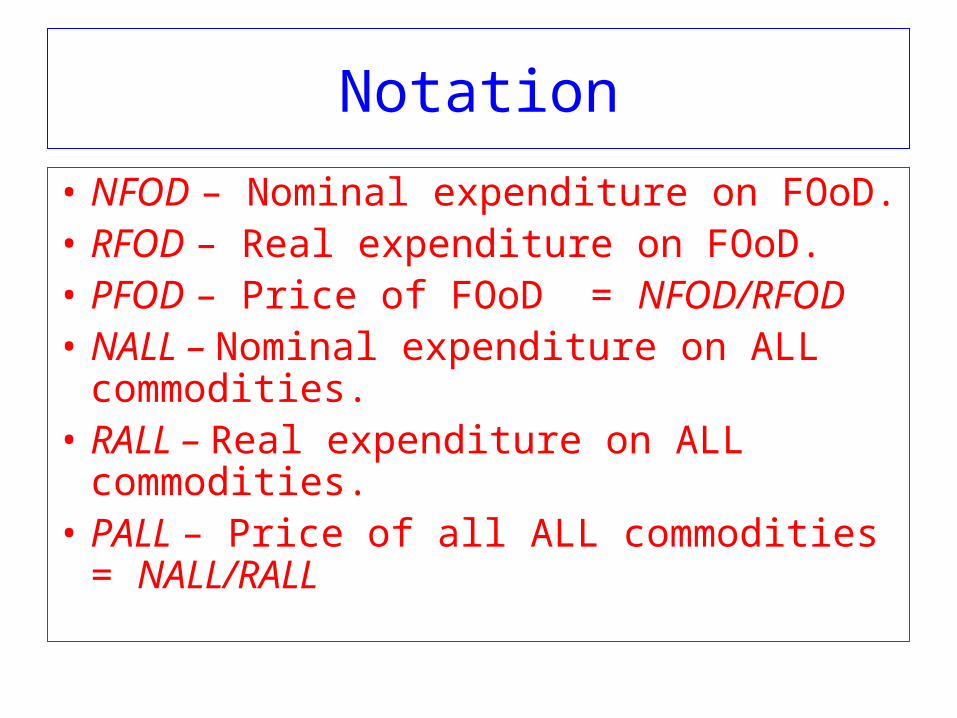
Notation
• NFOD – Nominal expenditure on FOoD.• RFOD – Real expenditure on FOoD.• PFOD – Price of FOoD = NFOD/RFOD• NALL – Nominal expenditure on ALL
commodities.• RALL – Real expenditure on ALL
commodities.• PALL – Price of all ALL commodities =
NALL/RALL

Chapter 16
• Demand• CD: q = ay/p • RFOD = 0.146 NALL/PFOD + u
• SG: q = s + a (y – ps – p2s2 )/p
• RFOD = 44491 + 0.065 NALL/PFOD - 23426 QFOD/PFOD + u (without a correction for simultaneous bias)
• RFOD = 41962 + 0.049 NALL/PFOD - 14210 QFOD/PFOD + u (with the correction)

Extra Notation
• Prices of the inputs....• PMAF – Price of materials and fuels.• NLI – Nominal Long term rate of Interest – Price
of capital.• PUW – (Price of) Unit Wages.
Chapter 16
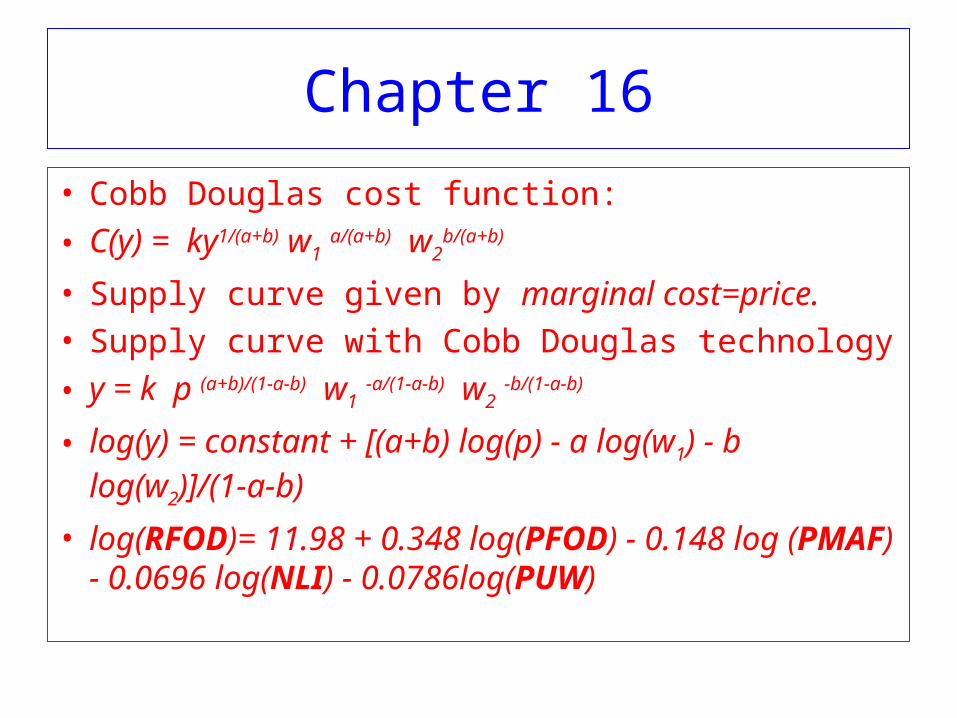
• Cobb Douglas cost function:
• C(y) = ky1/(a+b) w1 a/(a+b) w2b/(a+b)
• Supply curve given by marginal cost=price.• Supply curve with Cobb Douglas technology
• y = k p (a+b)/(1-a-b) w1 -a/(1-a-b) w2 -b/(1-a-b)
• log(y) = constant + [(a+b) log(p) - a log(w1) - b log(w2)]/(1-a-b)
• log(RFOD)= 11.98 + 0.348 log(PFOD) - 0.148 log (PMAF) - 0.0696 log(NLI) - 0.0786log(PUW)

Chapter 16
• The values of the variables in 1999:• NALL = 564368 PALL = 1.10043 PMAF =
83.7 NLI = 4.7 PUW = 115 QFOD =1.10621• If we substitute these values in the demand and
supply curves we get…• RFOD = 41962 + 0.049 NALL/PFOD - 14210 QFOD/PFOD
• log(RFOD)= 11.98 + 0.348 log(PFOD) - 0.148 log (PMAF) - 0.0696 log(NLI) - 0.0786log(PUW)
• ...and hence the following graph:


The Prices
• Without the tax:• Price = 1.076.• With the tax:• Price paid by the buyers = 1.160.• Price received by the sellers = 1.055.• Note: 1.055 + 10% = 1.160 – the tax.• The buyers pay 7.8% more.• The sellers receive 2.0% less.

The losses of surpluses
• Buyers: £4423m - assuming 55 million inhabitants - £80 per head.
• Sellers: £1106m.
• Total: £5529m.
• The government takes in taxes: £5488m.
• The net loss in surpluses as a result of the tax = £5529m - £5488m = £41m – around 75p per head.

Chapter 16
• Goodbye!