Embed Size (px)
Citation preview

Prediction of sessile drop evaporation considering surface wettability
Hyunsoo Song a, Yongku Lee b, Songwan Jin c, Ho-Young Kim a, Jung Yul Yoo a,⇑a School of Mechanical and Aerospace Engineering, Seoul National University, Gwanak-ro, Gwanak-gu, Seoul 151-744, Republic of Koreab Samsung Electronics Co. Ltd., 416 Maetan-dong, Suwon 443-742, Gyeonggi-do, Republic of Koreac Department of Mechanical Engineering, Korea Polytechnic University, 2121 Jeongwang-dong, Siheung 429-793, Gyeonggi-do, Republic of Korea
a r t i c l e i n f o
Article history:Received 24 March 2011Received in revised form 23 June 2011Accepted 20 July 2011Available online 22 August 2011
Keywords:EvaporationContact angleHydrophilicityHydrophobicitySuperhydrophobicity
a b s t r a c t
Previous studies suggest that most theoretical models for drop evaporation based on an ideally simplifieddomain in which evaporation occurs do not correlate well with experimental results. The present paperproposes a novel empirical model f(h) as a simple function of the contact angle h, which is to be used to pre-dict temporal evolution of a sessile water drop volume when the drop evaporates on surfaces of variouswettabilities widely adopted in microelectronic engineering. For hydrophilic and hydrophobic surfaces,the evolution of the drop volume during the evaporation process can be predicted more accurately by rep-resenting f(h) as an empirical linear function rather than by using previous theoretical models. Furthermore,the proposed model can account for the increased evaporation rate on smooth surfaces, thus providing awide applicability to various substrate surfaces. For cases involving a superhydrophobic surface, f(h) canbe represented by an empirical constant because the contact angle remains constant during evaporation,which is in excellent agreement with the experimental observation.
� 2011 Elsevier B.V. All rights reserved.
1. Introduction
Evaporating drops play an important role in microelectronicengineering in conjunction with inkjet printing technique [1,2],growth process of an array of semiconductor nanoparticles [3], andevaporation driven self-assembly (EDSA) system [4], as well as inbiotechnology related to DNA chip manufacturing [5–7], wheresurfaces with different wettabilities, i.e., hydrophilicity, hydropho-bicity, and superhydrophobicity, are used for diverse purposes.Nowadays, an increasing amount of microelectronic engineeringsurfaces interacting with liquid drops possess hydrophobicity[8–10]. Moreover, there is a rising interest in evaporating drops onsolid surfaces with extremely high water-repellency, such as super-hydrophobic surfaces [11,12] while the rapidly developing micro/nanotechnology has facilitated the fabrication of these surfaces[13–15]. As is well known, the evaporation characteristics, such ascontact radius, contact area and volume, of a sessile drop are signif-icantly affected by the contact angle [11]. It has been also demon-strated that when a colloidal drop dries on a superhydrophobicsurface, the ‘coffee ring’ phenomenon [16] occurs rather differentlyfrom that on a hydrophilic or a hydrophobic surface [17].
A literature survey indicates that many research efforts havebeen made to predict the temporal evolution of the drop volumeduring the evaporation but there is still much room for furtherdevelopment. Picknett and Bexon [18] developed a theory to predict
the evaporation rate at any time in the life of a drop, based on thespherical cap geometry. Rowan et al. [19] also proposed a modelincorporating the spherical cap geometry, but neglected the evapo-ration flux at the drop edge. Shanahan and Bourgès-Monnier model[20,21] used a self-consistent approach to get a radial diffusiongradient of the liquid vapor. However, it is noted that f(h) whichrepresents the dependence of evaporation rate on the contact angleh, proposed by most previous researches, is not coincident with theexperimental data for h < 90�, not to mention for h > 90�.
The present study experimentally investigates the evaporationof sessile water drops on various surfaces that are hydrophilic,hydrophobic and even superhydrophobic. We compare the presentexperimental results to the existing theories and discuss the valid-ity of the previous models. This study then proposes an empiricalrelation f(h) that can be used to predict more accurately the evap-oration rate of a sessile drop for various surface wettabilities thatare widely adopted in microelectronic engineering such as water-repellent coating, self-cleaning, and surface patterning.
2. Materials and methods
We observed the evaporation processes of deionized waterdrops on various surface materials. For the hydrophilic surfaceshaving equilibrium contact angles of he < 90� with water, we chosea bare silicon wafer, thermal SiO2 wafer, sand-blasted glass, slideglass and gold. For the hydrophobic surfaces having contact angleshe P 90�, poly-tetrafluoroethylene (PTFE), platinum and a self-assembled monolayer of octadecyltrichlorosilane (OTS) coated
0167-9317/$ - see front matter � 2011 Elsevier B.V. All rights reserved.doi:10.1016/j.mee.2011.07.015
⇑ Corresponding author. Tel.: +82 2 880 7112; fax: +82 2 883 0179.E-mail address: [email protected] (J.Y. Yoo).
Microelectronic Engineering 88 (2011) 3249–3255
Contents lists available at SciVerse ScienceDirect
Microelectronic Engineering
journal homepage: www.elsevier .com/locate /mee

glass were chosen. For the superhydrophobic surfaces, alkyl ketenedimer (AKD) coated glass and microfabricated structure were cho-sen. For the AKD surface, a chloroform–AKD mixture was sprayedonto a glass surface and left to dry for 3 h. The surface roughnessof each material was measured by an Atomic Force Microscopy(XE-150, PSIA, USA) and averaged over five measurements. The val-ues of he and the surface roughness of each material are listed inTable 1.
After placing a mm-sized water drop on the surface in a temper-ature-controlled environment, images of an evaporating drop weretaken every 20 s using a cooled CCD camera (SensiCam, PCO,Germany) periodically triggered by a computer. Temperature andrelative humidity of the ambient air were measured by ETL DigitalThermo-Hygrometer (CS-201, China) with an accuracy of 0.1 �Cand 1%, respectively. During the experiment, the temperature andrelative humidity remained constant with variations of ±1 �C and1%, respectively. The vapor diffusivity and the saturated vapordensity were calculated by the formula given by Vargaftik [22] andKimball et al. [23], respectively.
To measure the contact radius and the height of the drop fromthe images, we secured five points on the drop/air interface andsix points on the air/substrate interface using MATLAB in con-junction with a homemade threshold routine. Then, the contactangle of the drop was deduced by assuming a spherical cap shapebased on a small Bond number, defined as Bo ¼ qgR2
s=r, where qis the liquid density, g is the gravitational acceleration, Rs is theradius of drop surface curvature, and r is the surface tension.For this investigation, Bo was kept below 0.5 in order to obtainthe instantaneous volume of an evaporating drop with the follow-ing relation:
V ¼ p3
R3s ð1� cos hÞ2ð2þ cos hÞ; ð1Þ
where h is the contact angle. The evaporation rate was obtained bydifferentiating the drop volume with time after fitting the temporalevolution of the volume to a third-order polynomial with a leastsquare method.
2.1. Evaporation on hydrophilic and hydrophobic surfaces
When a liquid drop is situated on a solid surface, the adjacentair becomes saturated with the vapor due to the rapid interchangeof the molecules between the liquid and its vapor [19]. The vaporin the thin saturated region diffuses outward into the surroundingunsaturated air. The evaporation rate of the vapor is representedby Fick’s law as follows:
Q ¼ �DAdcdr; ð2Þ
where D is the vapor diffusivity in still air, A is the area throughwhich diffusion occurs, c is the vapor concentration, and r is the ra-dial distance, as illustrated in Fig. 1. Note that we consider the vaporconcentration gradient only in the radial direction. Assuming a qua-si-equilibrium process for slow evaporation in still air, we integrateEq. (2) from the drop surface to infinity in order to attain the dropvolume change with time [21]:
Q ¼ �qdVdt¼ 4pDRsðcs � c1Þf ðhÞ; ð3Þ
where t is the time, cs is the saturated vapor concentration at dropsurface, c1 is the ambient vapor concentration determined by therelative humidity, and f(h) represents the dependence of evaporationrate on the contact angle. This investigation adopts the followingvalues from the literature [22,23]: D � 25 mm2/s, cs = 2.3 � 10�8
g/mm3, and c1 = 0.76 � 10�8 g/mm3 at the ambient temperature of25 �C with the relative humidity of 33%. The function f(h) used to bedetermined by the profile of the area through which liquid moleculeswere assumed to diffuse [21]. It is interesting to note that, in diffusionproblems as described above, the volume change is linearly propor-tional to the length scale (Rs) rather than the surface area [19].
In order to predict the temporal evolution of a drop volumeaccurately, the functional form of f(h) and the temporal variationsof Rc and h should be known a priori. In Fig. 2, we show temporalvariations of measured Rc and h on different surfaces. For all casesconsidered, Rc remained constant in the first stage while h de-creased with time. For some surfaces, Rc decreased later, whichwas interpreted as the receding of the contact line when h reachedthe critical receding angle hR. It is also of great interest to note thatalthough the equilibrium contact angles (he) of two different sur-faces are comparable, h may behave differently while Rc decreases,depending on the surface material. More specifically, after Rc initi-ated its decrease, h remained constant on the platinum surfacewhile it continued to decrease on the PTFE surface. There is, atpresent, no satisfactory theory to explain all these differentbehaviors.
Various models for f(h) have been proposed since f(h) is a neces-sary prerequisite for accurately predicting the temporal change ofdrop volume during evaporation. Rowan et al. [19] assumed thatvapor molecules escape from a curved surface only in the radialdirection so that the effective diffusion area A can be representedby the solid arc of a radius r as illustrated in Fig. 1. The area thenbecomes A = 2pr2 (1 � cosh). This model (Model A) neglects theevaporation flux at the drop edge, which can be greater than thatfrom the surface away from the edge [24], thus requiring somemodification. Bourgès-Monnier and Shanahan [20] proposedanother model (Model B) in which the effective diffusion area en-
Table 1Equilibrium contact angle with a water drop and root-mean-square roughness of various surfaces considered in the present experimental study.
Surface Bare Siwafer
Thermal SiO2
waferSand-blastedglass
Slideglass
Gold PTFE Platinum OTS-coatedglass
AKD-coatedglass
Micro-fabricatedstructure
he (�) 36.7 43.2 55.9 57.2 84.7 92.4 94.8 100.1 143.5 147.9Roughness
(nm)– 0.47 – 6.38 – 2.2 – 4.77 31.69 16.91
Fig. 1. Schematic of a sessile drop shape, where Rc is the contact radius and thesolid arc of a radius r with its center at O represents the diffusion region modeled byRowan et al. [19] while the diffusion area modeled by Bourgès-Monnier andShanahan [20] is represented by a solid arc plus two dashed arcs.
3250 H. Song et al. / Microelectronic Engineering 88 (2011) 3249–3255

tirely encompassed the drop area, as represented by a solid arc plustwo dashed arcs in Fig. 1. Consequently, the effective diffusion areaand f(h) are respectively given by A = 2pr2(1 � Rs cosh/r) andf(h) = �cosh/[2ln(1 � cosh)]. This model incorporates the diffusionarea, which was excluded by Model A, so that calculated evapora-tion rate is greater than that of Model A. However, the increase ofthe radial distance led to an increase of the subtending angle of thespherical cap shape in Model B. This implies that the vapor mole-cules are redistributed in the circumferential direction, which iscontradictory to the assumption of a pure radial concentration gra-dient. In any event, Model B gives the maximum evaporation ratepossible as long as the drop surface remains a part of a sphericalsurface.
A major difference between Models A and B centers around thetreatment of evaporation around the drop edge where the liquidcontacts the solid. Even though this edge effect may be small incomparison to the bulk evaporation rate, ignoring (as observed in
Model A) or overestimating (as observed in Model B) such an effectinduces an accumulation of errors that lead to a rather severe dis-crepancy between the theory and the experiment. Thus, it is re-called that the steady-state diffusion equation, r2c = 0, for thevapor concentration in the sharp wedge around the contact linecan be solved by using the method of images [25]. Then, the modelof Picknett and Bexon [18] (Model C) can be reconsidered, althoughit was proposed much earlier than Models A and B. This Model C isrepresented by f ðhÞ ¼ 1
2CRs
� �, where C is the capacitance of the equi-
convex lens formed by a sessile drop and its mirror image:For 0 6 h < 10�,
CRs¼ 0:6366hþ 0:09591h2 � 0:06144h3; ð4Þ
and for 10� 6 h < 180�,
CRs¼ 0:00008957þ 0:6333hþ 0:116h2 � 0:08878h3 þ 0:01033h4:
ð5Þ
As plotted in Fig. 3, it is quite noticeable that Model C lies be-tween Models A and B. In retrospect, one of the most importantassumptions on which all the foregoing models were derived isthat the substrate is an ideal (geometrically flat and smooth) sur-face [18–20]. However, on a non-ideal surface, the contact angleis not unique and takes on a range of values because the drop evap-oration affects the contact angle and vice versa in Eq. (3).
Therefore, it is of great interest to experimentally investigatehow f(h) in Eq. (3) behaves on non-ideal surfaces. Thus, the valuesof f(h) for respective surfaces were inversely calculated using Eq.(3) from the measured drop volume and relative humidity. Theresults are shown in Fig. 3 together with the foregoing theoreticalmodel predictions. Since the measurement data do not collapse toa single line, it can be asserted that f(h) strongly depends on thesurface material. Furthermore, it is noted that f(h) on the thermalSiO2 wafer surface, which is hydrophilic, lies above the upperbound although the values of f(h) for most surfaces remainbetween the upper bound indicated by Model B and the lowerbound by Model A.
Fig. 2. Temporal variations of (a) the contact radius Rc and (b) the contact angle hon various surfaces: q, bare Si wafer; r, thermal SiO2 wafer; �, sand-blasted glass;s, glass; 4, gold; e, PTFE; H, platinum; �, OTS-coated glass.
Fig. 3. f(h) versus h. The symbols represent the experimental data obtained oncorresponding surfaces, as indicated in Fig. 2.
H. Song et al. / Microelectronic Engineering 88 (2011) 3249–3255 3251

The present experimental study reveals that for the same con-tact angle rendering the same drop shape, the evaporation behav-ior arises differently depending on the surface material. Thisimplies that the geometric consideration alone, as adopted in the
foregoing models, cannot explain the differences of the evapora-tion behavior on various surfaces. This leads us to reason thatnot only the contact angle but also some additional factors mustbe considered in modeling f(h), which may be due to the existenceof non-ideal surface wettability, for example, the precursor film orthe surface roughness. In fact, it is known that a long precursor filmnear the edge of a drop which grows long on a smooth solid surfacepromotes evaporation [26]. Presumably in this regard, Fig. 3 showsthat the evaporation rate (in other words, f(h)) on the thermal SiO2
wafer is larger than any of the other three theoretical models. Thisis because the thermal SiO2 wafer possesses a roughness of a smal-ler order of magnitude than the other materials, as shown in Table1. This motivated us to write f(h) in Eq. (3) with a new functionalform accounting for the overall dependence of the evaporation rateon the surface condition as well as the contact angle.
Although none of the currently available theories accuratelypredicted f(h) for various surfaces, the present experiment stronglyindicates that all the surfaces respectively exhibit approximatelylinear dependence of f(h) on h. That is,
f ðhÞ ¼ a � hþ b; ð6Þ
where a and b can be regarded as empirical material constants to bedetermined in conjunction with the evaporation rate. By utilizingthe first-hand information which we can obtain from Fig. 3, we givethe best-fitting linear formulas of f(h) for each surface in Table 2. Inconstant contact radius mode where the contact radius is fixed dur-ing evaporation, initial evaporation rate Q1 is derived from the ini-tial contact angle of the drop h1 using Eq. (3). At a later time, thedrop volume V2 is obtained by
V2 ¼ V1 � Q 1 � Dt; ð7Þ
where V1 is the initial drop volume and Dt is taken to be 2 s. Accord-ingly, the contact angle at the next time step (h2) can be calculatedby using Eq. (1) under the constant contact radius condition. Theevaporation rate at the next time step (Q2) can then be calculatedfrom h2 using Eq. (3). Thus, we can predict the temporal evolutionof a drop volume by reiterating this procedure.
Table 2Coefficients necessary for empirically determining the linear dependence of f(h) on h,i.e., f ðhÞ ¼ a � hþ b, where h is in radian.
Surface a b
Bare Si wafer 0.372 24.1 � 10�3
Thermal SiO2 wafer 0.464 �5.3 � 10�3
Sand-blasted glass 0.286 38.2 � 10�3
Slide glass 0.338 6.4 � 10�3
Gold 0.286 38.8 � 10�3
PTFE 0.327 �21.3 � 10�3
Platinum 0.315 21.3 � 10�3
OTS-coated glass 0.418 �172.4 � 10�3
Fig. 4. Comparison between the theoretical predictions of the drop volume changewith time and the experimental results for (a) glass and (b) thermal SiO2 wafer. Thesolid line is calculated using the present linear relationship of f ðhÞ ¼ a � hþ b.
Fig. 5. Comparison between the theoretical predictions of the toluene drop volumechange with time and the experimental results of Erbil et al. [21]. The solid line iscalculated using the relation of f(h) = 0.2365 which is deduced from their Table 1.
3252 H. Song et al. / Microelectronic Engineering 88 (2011) 3249–3255
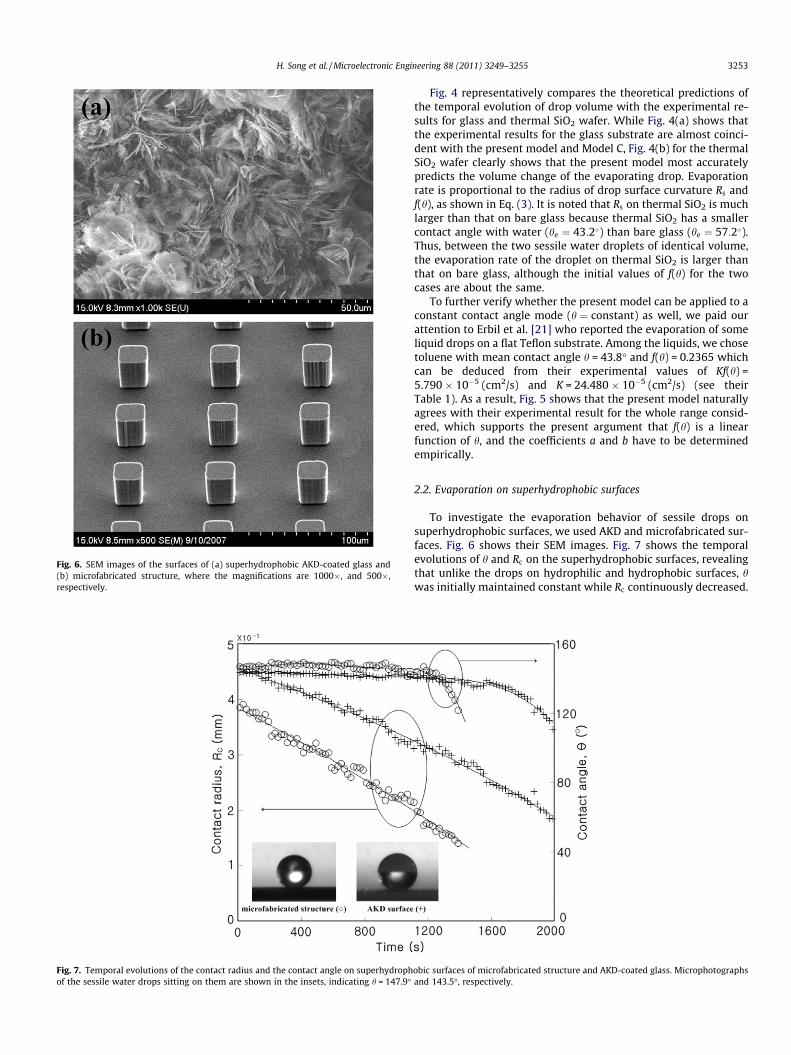
Fig. 4 representatively compares the theoretical predictions ofthe temporal evolution of drop volume with the experimental re-sults for glass and thermal SiO2 wafer. While Fig. 4(a) shows thatthe experimental results for the glass substrate are almost coinci-dent with the present model and Model C, Fig. 4(b) for the thermalSiO2 wafer clearly shows that the present model most accuratelypredicts the volume change of the evaporating drop. Evaporationrate is proportional to the radius of drop surface curvature Rs andf(h), as shown in Eq. (3). It is noted that Rs on thermal SiO2 is muchlarger than that on bare glass because thermal SiO2 has a smallercontact angle with water (he ¼ 43:2�) than bare glass (he ¼ 57:2�).Thus, between the two sessile water droplets of identical volume,the evaporation rate of the droplet on thermal SiO2 is larger thanthat on bare glass, although the initial values of f(h) for the twocases are about the same.
To further verify whether the present model can be applied to aconstant contact angle mode (h ¼ constant) as well, we paid ourattention to Erbil et al. [21] who reported the evaporation of someliquid drops on a flat Teflon substrate. Among the liquids, we chosetoluene with mean contact angle h = 43.8� and f(h) = 0.2365 whichcan be deduced from their experimental values of Kf(h) =5.790 � 10�5 (cm2/s) and K = 24.480 � 10�5 (cm2/s) (see theirTable 1). As a result, Fig. 5 shows that the present model naturallyagrees with their experimental result for the whole range consid-ered, which supports the present argument that f(h) is a linearfunction of h, and the coefficients a and b have to be determinedempirically.
2.2. Evaporation on superhydrophobic surfaces
To investigate the evaporation behavior of sessile drops onsuperhydrophobic surfaces, we used AKD and microfabricated sur-faces. Fig. 6 shows their SEM images. Fig. 7 shows the temporalevolutions of h and Rc on the superhydrophobic surfaces, revealingthat unlike the drops on hydrophilic and hydrophobic surfaces, hwas initially maintained constant while Rc continuously decreased.
Fig. 7. Temporal evolutions of the contact radius and the contact angle on superhydrophobic surfaces of microfabricated structure and AKD-coated glass. Microphotographsof the sessile water drops sitting on them are shown in the insets, indicating h = 147.9� and 143.5�, respectively.
Fig. 6. SEM images of the surfaces of (a) superhydrophobic AKD-coated glass and(b) microfabricated structure, where the magnifications are 1000�, and 500�,respectively.
H. Song et al. / Microelectronic Engineering 88 (2011) 3249–3255 3253

In the superhydrophobic state, also known as the Cassie state [27],the drop contacted only the top of asperities so that a very highh > 150� was maintained. As the drop decreased in size duringthe evaporation, the Laplace pressure, which is inversely propor-tional to the drop radius, increased, causing the water to penetrateinterstices of the rough surface. This eventually caused the drop/solid contact mode to enter the Wenzel state [28], where the roughsurface imbibes the liquid.
We obtained f(h) for the evaporation on the superhydrophobicsurfaces in the same manner as explained for the hydrophilic andhydrophobic surfaces, and the results are shown in Fig. 8. The mostsensible difference of the evaporation on superhydrophobic sur-faces from that on hydrophilic surfaces is that the path of the vapordiffusion is blocked by the solid surface when evaporation initiatesfrom the surface area below the drop’s equator. Therefore, insteadof a diverging vapor flux near the contact line, the drop on a super-
hydrophobic surface has a vanishing vapor flux at the edge. For thisreason, the data lie below all the predictions by Models A, B and C.It is not likely to acquire a linear empirical relationship betweenf(h) and h as in the cases of hydrophilic surfaces. Thus, we takethe average value of f(h) for each surface such that f(h) = 0.58 forthe AKD and 0.61 for the microfabricated surface. Finally, the tem-poral evolution of drop volume can be estimated through a similarprocedure to that of the constant contact radius mode. Fig. 9 rep-resentatively shows that, by using f(h) = 0.58 for the AKD surfacein the calculation of the drop volume evolution with time, a fairlyaccurate prediction can be given. As a matter of fact, any functionof h should remain constant because the contact angle h remainsconstant during the evaporation on superhydrophobic surfaces.
3. Conclusions
We experimentally studied the evaporation behavior of waterdrops on various surfaces covering a wide range of wettabilities.Although all the existing theoretical models predicted that the dropgeometry, such as the contact radius and contact angle, determinesthe evaporation rate, the present experimental results strongly indi-cate that the evaporation rate depends on surface condition as well.Thus, we have proposed a new functional form f ðhÞ ¼ a � hþ b thatrepresents the linear dependence of the evaporation rate on the con-tact angle h with two empirical material constants a and b, providinga fairly accurate prediction of the drop volume change. Furthermore,for the same contact angle, this model can account for the increasedevaporation rate on smoother surfaces, allowing for wide applicabil-ity to various substrate surfaces. Most interestingly, for representingthe temporal evolution of the drop volume on a superhydrophobicsurface, which has not received much attention in the literature todate, the simple relationship f ðhÞ ¼ constant works excellently.
Acknowledgment
This research was supported by the Priority Research Program(2010-0029613) through the National Research Foundation of Kor-ea (NRF) funded by the Ministry of Education, Science and Technol-ogy, Republic of Korea.
References
[1] C. Ingrosso, J.Y. Kim, E. Binetti, V. Fakhfouri, M. Striccoli, A. Agostiano, M.L.Curri, J. Brugger, Microelectron. Eng. 86 (2009) 1124–1126.
[2] A. Voigt, U. Ostrzinski, K. Pfeiffer, J.Y. Kim, V. Fakhfouri, J. Brugger, G. Gruetzner,Microelectron. Eng., in press, doi:10.1016/j.mee.2010.12.004.
[3] S. Maenosono, C.D. Dushkin, S. Saita, Y. Yamaguchi, Langmuir 15 (1999) 957–965.
[4] J.J. Dyreby, G.F. Nellis, K.T. Turner, Microelectron. Eng. 84 (2007) 1519–1522.[5] V. Dugas, J. Broutin, E. Souteyrand, Langmuir 21 (2005) 9130–9136.[6] S.S. Abramchuk, A.R. Khokhlov, T. Iwataki, H. Oana, K. Yoshikawa, Europhys.
Lett. 55 (2) (2001) 294–300.[7] X. Fang, B. Li, E. Petersen, Y.-S. Seo, V.A. Samuilov, Y. Chen, J.C. Sokolov, C.-Y.
Shew, M.H. Rafailovich, Langmuir 22 (2006) 6308–6312.[8] M. Callies, D. Quere, Soft Matter 1 (2005) 55–61.[9] P. Bayiati, A. Tserepi, P.S. Petrou, K. Misiakos, S.E. Kakabakos, E. Gogolides, C.
Cardinaud, Microelectron. Eng. 84 (2007) 1677–1680.[10] L. Jalabert, C. Bottier, M. Kumemura, H. Fujita, Microelectron. Eng. 87 (2010)
1431–1434.[11] D.H. Shin, S.H. Lee, J.-Y. Jung, J.Y. Yoo, Microelectron. Eng. 86 (2009) 1350–
1353.[12] S.A. Kulinich, M. Farzaneh, Appl. Surf. Sci. 255 (2009) 4056–4060.[13] G. Blanco-Gomez, A. Glidle, L.M. Flendrig, J.M. Cooper, Microelectron. Eng. 86
(2009) 1325–1328.[14] B. Bhushan, E.K. Her, Langmuir 26 (2010) 8207–8217.[15] L. Liu, J. Zhao, Y. Zhang, F. Zhao, Y. Zhang, J. Colloid Interface Sci., in press,
doi:10.1016/j.jcis.2011.02.036.[16] R.D. Deegan, O. Bakjin, T.F. Dupont, G. Huber, S.R. Nagel, T.A. Witten, Nature
389 (1997) 827–829.[17] L. Chen, J.R.G. Evans, J. Colloid Interface Sci. 351 (2010) 283–287.[18] R.G. Picknett, R. Bexon, J. Colloid Interface Sci. 61 (1977) 336–350.[19] S.M. Rowan, M.I. Newton, G. McHale, J. Phys. Chem. 99 (1995) 13268–13271.[20] C. Bourgès-Monnier, M.E.R. Shanahan, Langmuir 11 (1995) 2820–2829.
Fig. 9. Comparison of the predictions of the drop volume change with time, wherethe crosses correspond to experimental results for the AKD surface. The solid line iscalculated using the relation of f(h) = constant.
Fig. 8. f(h) versus h for the evaporation on the superhydrophobic surfaces. Thesymbols correspond to the experimental data on the same surfaces, as indicated inFig. 7.
3254 H. Song et al. / Microelectronic Engineering 88 (2011) 3249–3255

[21] H.Y. Erbil, G. McHale, M.I. Newton, Langmuir 18 (2002) 2636–2641.[22] N.B. Vargaftik, Tables on Thermophysical Properties of Liquids and Gases,
second ed., Hemisphere, Washington, DC, 1975.[23] B.A. Kimball, R.D. Jackson, R.J. Reginato, F.S. Nakayama, S.B. Idso, Soil Sci. Soc.
Am. J. 40 (1976) 18–25.
[24] H. Hu, R.G. Larson, J. Phys. Chem. B 106 (2002) 1334–1344.[25] J.D. Jackson, Classical Electrodynamics, second ed., Wiley, New York, 1975.[26] J.-G. Fan, Y.-P. Zhao, Appl. Phys. Lett. 90 (2007) 013102.[27] A.B.D. Cassie, S. Baxter, Trans. Faraday Soc. 40 (1944) 546–551.[28] R.N. Wenzel, Ind. Eng. Chem. 28 (1936) 988–994.
H. Song et al. / Microelectronic Engineering 88 (2011) 3249–3255 3255

Author's personal copy
Erratum
Corrigendum to ‘‘Prediction of sessile drop evaporation considering surfacewettability’’ [Microelectron. Eng. 88 (2011) 3249–3255]
Hyunsoo Song a, Yongku Lee b, Songwan Jin c, Ho-Young Kim a, Jung Yul Yoo a,⇑a School of Mechanical and Aerospace Engineering, Seoul National University, Gwanak-ro, Gwanak-gu, Seoul 151-744, Republic of Koreab Samsung Electronics Co. Ltd., 416 Maetan-dong, Suwon 443-742, Gyeonggi-do, Republic of Koreac Department of Mechanical Engineering, Korea Polytechnic University, 2121 Jeongwang-dong, Siheung 429-793, Gyeonggi-do, Republic of Korea
The units for the ordinates of Fig. 4a and b of the above paper must be corrected from ‘‘nL’’ to ‘‘lL’’. The author apologizes for the incon-venience caused to the valued readers.
0167-9317/$ - see front matter � 2012 Elsevier B.V. All rights reserved.http://dx.doi.org/10.1016/j.mee.2012.11.015
DOI of original article: http://dx.doi.org/10.1016/j.mee.2011.07.015⇑ Corresponding author. Tel.: +82 2 880 7112; fax: +82 2 883 0179.
E-mail address: [email protected] (J.Y. Yoo).
Microelectronic Engineering 104 (2013) 11
Contents lists available at SciVerse ScienceDirect
Microelectronic Engineering
journal homepage: www.elsevier .com/locate /mee