Embed Size (px)
Citation preview
Faculty of Engineering of University of Porto
Integrated Master in Bioengineering
Microencapsulation of Chlorogenic acid – a
natural antioxidant
Dissertation for Master degree in Biological Engineering
Bruna Daniela Barrias Gonçalves
Supervisor: Dr. Lúcia Santos Co-Supervisor: Dr. Berta Estevinho
July, 2015

To my Parents and Brother To my Godmother
To João


“Intelligence is the ability to adapt to change.” Stephen Hawking

Acknowledgments
First and foremost, I would like to gratefully thank my supervisor Dr. Lúcia Santos for the
opportunity of develop a theme that is really of my interest and for accepting me in her group
as a master student. I am thankful for her given support, guidance and promptitude to answer
all my questions with her critical point of view and her friendly advice.
A special thank you goes to my co-supervisor Berta Estevinho for her help, guidance and
commitment during the development of this thesis.
I am particularly grateful to the Faculty of Engineering of Porto University, Department of
Chemical Engineering, and Laboratory for Process Engineering, Environment, Biotechnology,
and Energy for providing me all the necessary facilities and resources for this thesis.
I also would like to thank the Fundação para a Ciência e a Tecnologia (FCT) for funds
provided by FEDER through the Operational Programme for Competitiveness Factors –
COMPETE, ON.2 - O Novo Norte – North Portugal Regional Operational Programme and
National Funds through FCT - Foundation for Science and Technology under the projects: PEst-
C/EQB/UI0511, NORTE-07-0124-FEDER-000025 - RL2- Environment & Health.
To Marzieh Moeenfard for her tireless help, enormous dedication and constant motivation
that have showed towards me throughout this journey. I am deeply thankful for her concern
and valuable assistance with the analytical part of this work. Her constant good mood at the lab
was an inspiration for keep working, even when problems came out. Thank you.
To the whole E201 Lab Group for the amazing welcome, excellent working environment and
all the funny times spent inside and outside the lab. I will always remember the best picnic and
singing time ever. Thank you all.
To my dear friend, Francisca Casanova, for her support, optimism, persistence, friendship
and for all the shared confidences. Thank you for being really a friend.
Finally I want to specially thank my parents and my brother for all the unconditional support,
care and love. They are and they will always be my everything. To my godmother, for her
concern and endless dedication.
To João for his love, support, encouragement and strength. I cannot thank you enough. I
really cannot. I am glad to have you by my side and I will always do my best to make it worth it.


Abstract
Coffee is one of the most consumed and commercialized food products in the world which,
in a chemical point of view, has gained an increased interest due to its biologically active
compounds. Among them, polyphenols, in particular chlorogenic acids (CGA) are highlighted
because of their beneficial health effects. Besides their important role in the quality, flavor and
bitterness of coffee, CGAs carry relevant nutritional and functional properties mainly associated
with their antioxidant activity. Moreover, CGAs present a large number of interesting biological
activities such as anti-inflammatory, antimicrobial, antiviral, among others. Their contribution in
the prevention of several diseases associated with oxidative stress, such as cancer, premature
aging, strokes, Alzheimer’s, Parkinson’s, and other cardiovascular and neurodegenerative
diseases have been also documented in the literature. However, due to their structural and
chemical nature, CGAs can easily undergo oxidation. Furthermore, they are instable under high
temperature conditions and they may suffer from transesterification reaction, limiting their
industrial applications. For these reasons, the stabilization of CGA is one of the major concerns.
Therefore, CGAs requires a finished formulation able to maintain their structural integrity until
its consumption, mask its taste, increase its bioavailability and control its release after
administration. Among the existing stabilization methods, microencapsulation has been widely
reported as an efficient solution. There are several techniques of microencapsulation but, due
to its low cost, availability of equipment and efficiency, spray drying is one of the most used
encapsulation technique in food industry. Biopolymers, such as sodium alginate and modified
chitosan, are encapsulating agents with an increased interest for food applications.
The aim of the present study was to prepare and characterize sodium alginate and modified
chitosan microparticles of chlorogenic acid in order to evaluate their controlled release at two
different pH values (pH 5.6 and 2) and their enhanced bioavailability. The microparticles were
prepared by spray drying and characterized by their particle size and surface morphology by
particle size distribution through laser granulometry (Coulter) and SEM analysis, respectively.
High performance liquid chromatography (HPLC-DAD) and UV-Vis spectrophotometry methods
were developed and validated for analytical detection and quantification of chlorogenic acid.
Both methods presented good linearity with correlation coefficients (R2) better than 0.999 and
good precision results with coefficients of variation values lower than 5%. The limits of
detection (LOD) and quantification (LOQ) for HPLC were 0.19 mg.L-1 and 0.64 mg.L-1,
respectively. For UV-Vis spectrophotometry, the limits of detection and quantification were
0.18 mg.L-1 (LOD) and 0.60 mg.L-1 (LOQ) in water at pH 5.6, and 0.09 mg.L-1 and 0.31 mg.L-1 in
water at pH 2, respectively. Through this work we conclude that it is possible to encapsulate
chlorogenic acid with sodium alginate and modified chitosan as encapsulating agents using
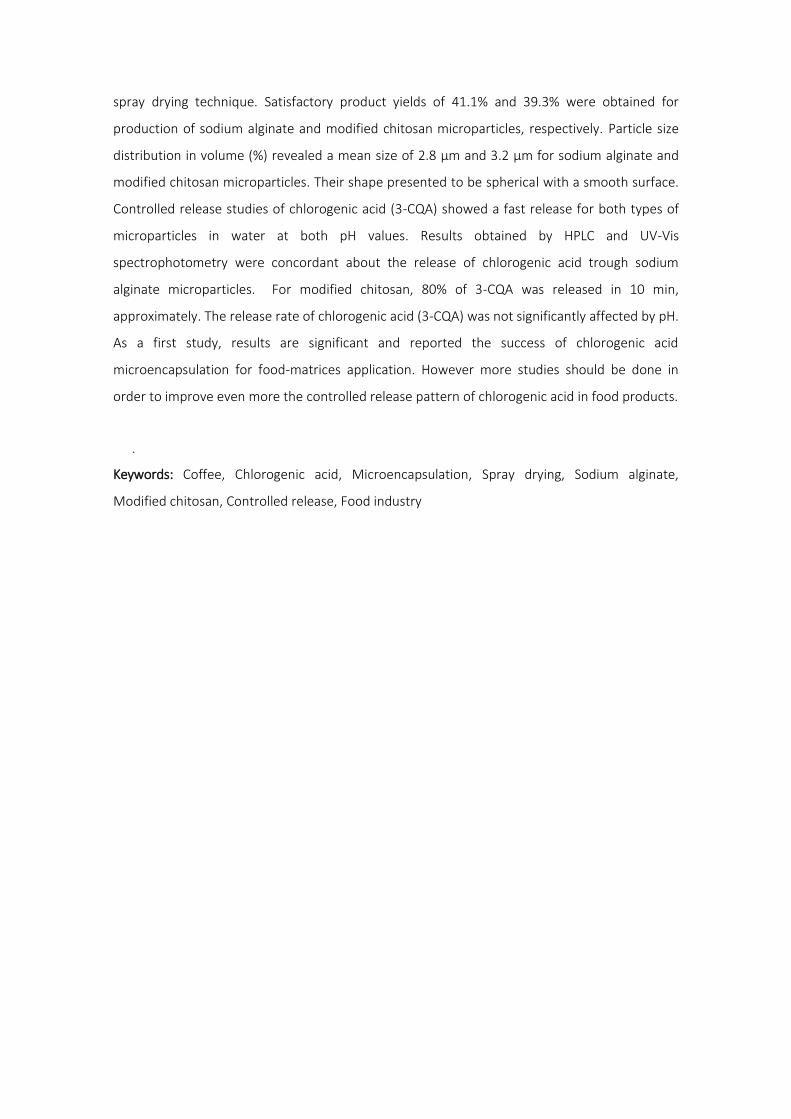
spray drying technique. Satisfactory product yields of 41.1% and 39.3% were obtained for
production of sodium alginate and modified chitosan microparticles, respectively. Particle size
distribution in volume (%) revealed a mean size of 2.8 μm and 3.2 μm for sodium alginate and
modified chitosan microparticles. Their shape presented to be spherical with a smooth surface.
Controlled release studies of chlorogenic acid (3-CQA) showed a fast release for both types of
microparticles in water at both pH values. Results obtained by HPLC and UV-Vis
spectrophotometry were concordant about the release of chlorogenic acid trough sodium
alginate microparticles. For modified chitosan, 80% of 3-CQA was released in 10 min,
approximately. The release rate of chlorogenic acid (3-CQA) was not significantly affected by pH.
As a first study, results are significant and reported the success of chlorogenic acid
microencapsulation for food-matrices application. However more studies should be done in
order to improve even more the controlled release pattern of chlorogenic acid in food products.
.
Keywords: Coffee, Chlorogenic acid, Microencapsulation, Spray drying, Sodium alginate,
Modified chitosan, Controlled release, Food industry
Resumo
O café é um dos produtos alimentares mais consumidos e comercializados em todo o mundo
que, de um ponto de vista químico, ganhou um interesse acrescido devido aos seus compostos
biologicamente activos. Entre eles, os polifenóis, em particular os ácidos clorogénicos (ACGs),
são destacados pelos seus efeitos benéficos para a saúde. Para além do seu papel importante
na qualidade, sabor e amargura do café, os ACGs possuem propriedades nutricionais e
funcionais relevantes, associadas principalmente à sua actividade antioxidante. Além disso,
ACGs apresentam um grande número de actividade biológicas interessantes tais como
actividade anti-inflamatória, antimicrobiana, antivírica, entre outras. A sua contribuição na
prevenção de várias doenças associadas com o estresse oxidativo, tais como cancro,
envelhecimento prematuro, acidentes vasculares, Alzheimer, Parkinson e outras doenças
cardiovasculares e neurodegenerativas têm também vindo a ser documentada na literatura.
Contudo, devido à sua natureza estrutural e química, ACGs sofrem facilmente oxidação. Além
disso, são instáveis em condições de elevadas temperaturas e podem sofrer reacção de
transesterificação, limitando as suas aplicações industriais. Por estas razões, é importante
garantir a estabilidade dos ACGs numa formulação final capaz de manter a sua integridade
estrutural até ao seu consumo, mascarar o seu sabor, aumentar a sua biodisponibilidade a
controlar a sua libertação após a sua administração. Entre os possíveis métodos de estabilização
existentes, a microencapsulação tem sido amplamente divulgada como uma solução eficiente.
Existem várias técnicas de microencapsulação, mas o spray drying é uma das técnicas de
encapsulação mais utilizadas na indústria alimentar, devido ao seu baixo custo de processo,
disponibilidade de equipamento e eficiência. Biopolímeros, como o alginato de sódio e
quitosano modificado, são exemplos de agentes encapsulantes com interesse acrescido em
aplicações alimentares.
O objectivo do presente estudo foi preparar e caracterizar micropartículas de ácido
clorogénico encapsulado por alginato de sódio e quitosano modificado de modo a avaliar a sua
libertação controlada a dois valores de pH diferentes (pH 5,6 e pH 2) e a melhorar a sua
biodisponibilidade. As micropartículas foram preparadas por spray drying e caracterizadas
relativamente ao tamanho das partículas e a morfologia da superfície. Métodos de
cromatografia líquida de alta eficiência (CLAE) e espectrofotometria UV-Vis foram desenvolvidos
para a detecção e quantificação analítica do ácido clorogénico. Ambos os métodos
apresentaram uma resposta linear com coeficientes que correlação (R2) melhores que 0,999 e
bons resultados de precisão, com coeficientes de variação inferiores a 5%. Os limites de
detecção (LOD) e quantificação (LOQ) por CLAE foram 0,19 mg.L-1 e 0,64 mg.L-1,
respectivamente. Por espectrofotometria UV-Vis, os limites de detecção e quantificação foram
0,18 mg.L-1 (LOD) e 0,60 mg.L-1 (LOQ) em água a pH 5,6 e 0,09 mg.L-1 e 0,31 mg.L-1 em água a pH
2, respectivamente. Foi possível encapsular ácido clorogénico com alginato de sódio e
quitosano modificado como agentes encapsulantes usando a técnica de spray drying. Foram
obtidos rendimentos satisfatórios de 41,1% na produção de micropartículas de alginato de
sódio e de 39,3% na produção das partículas de quitosano modificado. A distribuição em
volume do tamanho das partículas revelou um tamanho médio de 2,8 μm e 3,2 μm para as
micropartículas de alginato de sódio e quitosano modificado. Quanto à morfologia, as
micropartículas apresentaram forma esférica com superfície lisa. Os estudos de libertação
controlada do ácido clorogénico mostraram uma rápida libertação para os ambos os tipos de
micropartículas em água em ambos os valores de pH. Usou-se CLAE e espectrofotometria de
UV-Vis na avaliação da percentagem de libertação controlada do ácido clorogénico através de
micropartículas de alginato de sódio e os resultados obtidos foram concordantes nas duas
técnicas. No caso do quitosano modificado, 80% do 3-CQA foi libertado em aproximadamente
10 min. A taxa de libertação do ácido clorogénico (3-CQA) não foi significativamente afectada
pelo valor de pH. Como primeiro estudo realizado, os resultados obtidos são significativos e
reportaram o sucesso da microencapsulação do ácido clorogénico para aplicação em matrizes
alimentares. Contudo, mais estudos devem ser realizados de modo a melhorar o padrão de
libertação controlada do ácido clorogénico em produtos alimentares.
.
Palavras-chave: Café, Ácido clorogénico, Microencapsulação, Spray drying, Alginato de Sódio,
Quitosano modificado, Libertação controlada, Indústria alimentar
Content List
Acknowledgements ....................................................................................................................... vii
Abstract.......................................................................................................................................... ix
Resumo .......................................................................................................................................... xi
Glossary ....................................................................................................................................... xiii
Chapter 1 ....................................................................................................................................... 1
Introduction ................................................................................................................................... 1
1.1) Chlorogenic acids ................................................................................................................ 1
1.1.1) Overview and chemical composition ..................................................................... 1
1.1.2) CGAs in coffee beans .............................................................................................. 3
1.1.3) Interest and possible applications ......................................................................... 5
1.2) Microencapsulation ........................................................................................................... 6
1.2.1) Microcapsules: definition and characterization ..................................................... 6
1.2.2) Microencapuslation techniques ............................................................................. 8
1.2.3) Microencapuslation techniques applied to food industry ..................................... 9
1.2.4) Spray drying .......................................................................................................... 10
1.2.5) Encapsulating agents ........................................................................................... 11
1.2.5.1) Biopolymers .................................................................................................. 12
1.2.5.1.1) Sodium alginate ............................................................................ 13
1.2.5.1.2) Chitosan/Modified chitosan ................................................. 15
Chapter 2 ..................................................................................................................................... 19
State of the Art ............................................................................................................................. 19
Chapter 3 ..................................................................................................................................... 27
Materials and Methods ................................................................................................................ 27
3.1) Materials ........................................................................................................................... 27
3.1.1) Standards and Reagents ....................................................................................... 27
3.1.2) Standards preparation .......................................................................................... 27
3.1.3) Equipment ............................................................................................................ 28
3.2) Methods ........................................................................................................................... 28
3.2.1) High Performance Liquid Chromatography (HPLC-DAD) ...................................... 28
3.2.2) UV-Vis Spectrophotometry ................................................................................... 28
3.2.3) Preparation of chlorogenic acid microparticles: Spray drying process ................ 29
3.2.4) Characterization of chlorogenic acid microparticles ............................................ 30
3.2.4.1) Product yield ........................................................................................ 30
3.2.4.2) Particle size distribution ....................................................................... 30
3.2.4.3) Scanning Electron Microscopy (SEM) analysis ..................................... 30
3.2.5) Controlled release studies of chlorogenic acid (3-CQA) ....................................... 30
Chapter 4 .................................................................................................................................... 33
Results and Discussion ................................................................................................................. 33
4.1) Validation of analytical methods ....................................................................................... 33
4.1.1) HPLC-DAD ............................................................................................................. 33
4.1.2) UV-Vis Spectrophotometry ................................................................................... 36
4.2) Characterization of chlorogenic microparticles ................................................................. 38
4.2.1) Product yield ........................................................................................................ 38
4.2.2) Particle size distribution ....................................................................................... 38
4.2.3) Scanning Electron Microscopy (SEM) analysis ...................................................... 39
4.3) Controlled release studies of chlorogenic acid (3-CQA) ..................................................... 40
4.3.1) HPLC-DAD ............................................................................................................. 41
4.3.2) UV-Vis spectrophotometry ................................................................................... 42
Conclusions .................................................................................................................................. 45
Limitations and Future Work ........................................................................................................ 47
Bibliography ................................................................................................................................. 49
Appendix 1 – Calibration curves ................................................................................................... 55
Appendix 2 – Precision ................................................................................................................. 57
Figures List
Figure 1 – Longitudinal cross-section of the coffee cherry. Adapted from Mussatto et al., 2011... ...................................................................................................................................................... .3
Figure 2 – Formation of a quinonlactone from chlorogenic acid during roasting process. Adapted from Farah and Donangelo, 2006 ................................................................................................. .4
Figure 3 – Example of the antioxidant mechanism of Phenols. Adapted from ChemgaPedia, 2015 ...................................................................................................................................................... .5
Figure 4 – Schematic representation of distinct structural microparticles types: (A) mononuclear; (B) matrix type. Adapted from Fang et al., 2010 ........................................................................... 7
Figure 5 – Schematic illustration of spray drying equipment. Adapted from Munin et al., 2011 10
Figure 6 – Molecular structure of Sodium Alginate. Adapted from Yang et al., 2010 .................. 13
Figure 7 – Molecular structure of Chitosan ................................................................................. 15
Figure 8 – Chemical behavior of Chitosan under low pH conditions ........................................... 16
Figure 9 – Chromatogram of chlorogenic acid analyzed by HPLC-DAD at 325 nm ...................... 33
Figure 10 – Spectrum of chlorogenic acid (3-CQA) in HPLC-DAD analysis ................................... 34
Figure 11 – Absorption spectrum of chlorogenic acid (3-CQA) for water: (A) at pH 5.6; (B) at pH 2. .................................................................................................................................................. 36 Figure 12 – Particle size distribution in number (%) and in volume (%) of chlorogenic acid (3-CQA) microparticles produced with: (a) sodium alginate; (b) modified chitosan ........................ 39
Figure 13– SEM images of the microparticles prepared with (A) sodium alginate and (B) modified chitosan. Amplification of (A1, B1) 10 000 and (A2, B2) 20 000 times, beam intensity (HV) of 1500 kV distance between the sample and the lens (WD) around 10 mm .......................................... 40
Figure 14 – Release profile of chlorogenic acid (%) from sodium alginate microparticles in water at pH 5.6 ...................................................................................................................................... 41
Figure 15 – Release profile of chlorogenic acid (%) from sodium alginate microparticles in water at two different pH values (pH 5.6 and pH 2) .............................................................................. 42
Figure 16 – Release profile of chlorogenic acid (%) from modified chitosan microparticles in water at two different pH values (pH 5.6 and pH 2) .................................................................... 43

Tables List
Table 1 – Characteristics and chemical structures of caffeoylquinic acids (CQAs) present in coffee ............................................................................................................................................. 2
Table 2 – Microencapsulation techniques and each process steps ............................................... 9
Table 3 – Biopolymeric materials commonly used for microencapsulation. Adapted from Desai and Park, 2005 ............................................................................................................................. 13
Table 4 – Overview on microencapsulation techniques applied to chlorogenic acid .................. 24
Table 5 – Experimental conditions of spray drying process ......................................................... 29
Table 6 – Quantification parameters of HPLC-DAD method ........................................................ 34
Table 7 – Linearity conditions for the validation of the HPLC-DAD calibration curve .................. 35
Table 8 – Repeatability and reproducibility (intra-day and inter-day precision) of HPLC-DAD method ........................................................................................................................................ 36
Table 9 – Quantification parameters of UV-Vis spectrophotometry ........................................... 37
Table 10 – Repeatability and reproducibility (intra-day and inter-day precision) of UV-Vis spectrophotometry ..................................................................................................................... 37

Glossary
α-TP α-tocopherol
β-CD NS β-cyclodextrin nanosponges
3-CQA 3-caffeoylquinic acid
4-CQA 4-caffeoylquinic acid
5-CQA 5-caffeoylquinic acid
diCQAs Dicaffeoylquinic acids
Abs Absorbance
AU Absorbance units
Ca2+ Calcium ions
CAS Chemical Abstracts Service
CGA Chlorogenic acid
CQA Caffeoylquinic acid
CS Chitosan
CV Coefficient of variation
DAD Diode array detector
DD Degree of deacetylation
EE Encapsulation efficiency
FQAs Feruloylquinic acids
HDI Hexamethylene diisocyanate
HCl Hydrochloric acid
HPLC High performance liquid chromatography
IUPAC International Union of Pure and Applied Chemistry
LOD Limit of detection
LOQ Limit of quantification
NaCl Sodium chloride
OSA Octenyl succinic anhydride
PBS Phosphate buffered saline
PTFE Polytetrafluoroethylene
R2 Correlation coefficient
RSD Relative standard deviation
RT Room temperature
SA Sodium alginate
SEM Scanning electron microscope
Tin Inlet temperature
Tout Outlet temperature
UV Ultraviolet radiation
UV-Vis Ultraviolet-visible
1
Chapter 1
Introduction
1.1 Chlorogenic acids
1.1.1. Overview and chemical composition
Chlorogenic acids (CGAs) are water soluble phenolic compounds found in many and diverse
natural sources, such as plants, fruits and vegetables (Farah et al., 2008). They are trans-
cinnamic acid derivatives naturally formed by the esterification of caffeic (3,4-dihydroxy-
cinnamic acid), ferulic (3-metoxy,4-hidroxy-cinnamic acid) and p-coumaric (4-hidroxy-cinnamic
acid) acids with (-)-quinic acid (Caprioli et al., 2013; Farah et al., 2008). Sunflowers, apples,
pears, peaches, berries, prunes, sweet potatoes, lettuces and spinaches are some examples of
where they natural occur (Cheng et al., 1995; Clifford et al., 2006; Nallamuthu et al., 2014)
however green (or raw) coffee beans are known as the major source of CGAs (5–12 g/100 g)
(Farah et al., 2008). CGAs are products of the phenylpropanoid pathway and act as protective
agents in higher plants against environmental stress, such as infection, mechanical wounding
and cell damage (Farah and Donangelo, 2006).
Caffeoylquinic acids (CQAs), dicaffeoylquinic acids (diCQAs) and feruloylquinic acids (FQAs)
are the major CGAs classes in coffee (Duarte et al., 2010), each one formed of at least three
isomeric forms namely, three isomers of CQAs (3-, 4- and 5-CQA) (Table 1), three isomers of
diCQAs (3,4-diCQA; 3,5-diCQA and 4,5- diCQA) as well as three isomers for FQAs (3-, 4- and 5-
FQA). Amongst these, CQAs are considered as the main isomers of CGAs as 5-CQA is the most
abundant one, comprising over 50% (w/w dry matter) of all CGAs in green coffee beans,
followed by 3- and 4-CQA that comprise approximately 10% (w/w dry matter) (Narita and
Inouye 2015).

Chapter 1 - Introduction
2
* Adapted from Hmdb and PubChem, 2015.
Compound (Abbreviation) CAS number
Synonym (IUPAC name)
Molecular Formula
Chemical Structure
Molecular weight (g.mol
-1)
Solubility in water (mg.mL
-1)
3-Caffeoylquinic acid (3-CQA)
327-97-9
Chlorogenic acid
((1S,3R,4R,5R)-3-{[(2E)-3-(3,4-
dihydroxyphenyl)prop-2-enoyl]oxy}-1,4,5-trihydroxycyclohexane-1-carboxylic acid)
C16H18O9
354.31 3.44
4-Caffeoylquinic acid (4-CQA)
905-99-7
Cryptochlorogenic acid
(3R,4S,5R)-4-{[(2E)-3-(3,4-
dihydroxyphenyl)prop-2-enoyl]oxy}-1,3,5-trihydroxycyclohexane-1-carboxylic acid)
C16H18O9
354.31 3.12
5-Caffeoylquinic acid (5-CQA)
906-33-2
Neochlorogenic acid
(3-{[(2E)-3-(3,4-dihydroxyphenyl)prop-2-
enoyl]oxy}-1,4,5-trihydroxycyclohexane-1-carboxylic acid)
C16H18O9
354.31 3.44
Table 1 - Characteristics and chemical structures of caffeoylquinic acids (CQAs) present in coffee.
Chapter 1 - Introduction
3
1.1.2 CGAs in coffee beans
Coffee is among the most generally consumed commodity in the world and its composition
has spread worldwide due to its unique sensory properties, as commercially, Coffea arabica and
Coffeea canephora var. robusta are the most prominent species (El-Abassy et al., 2011).
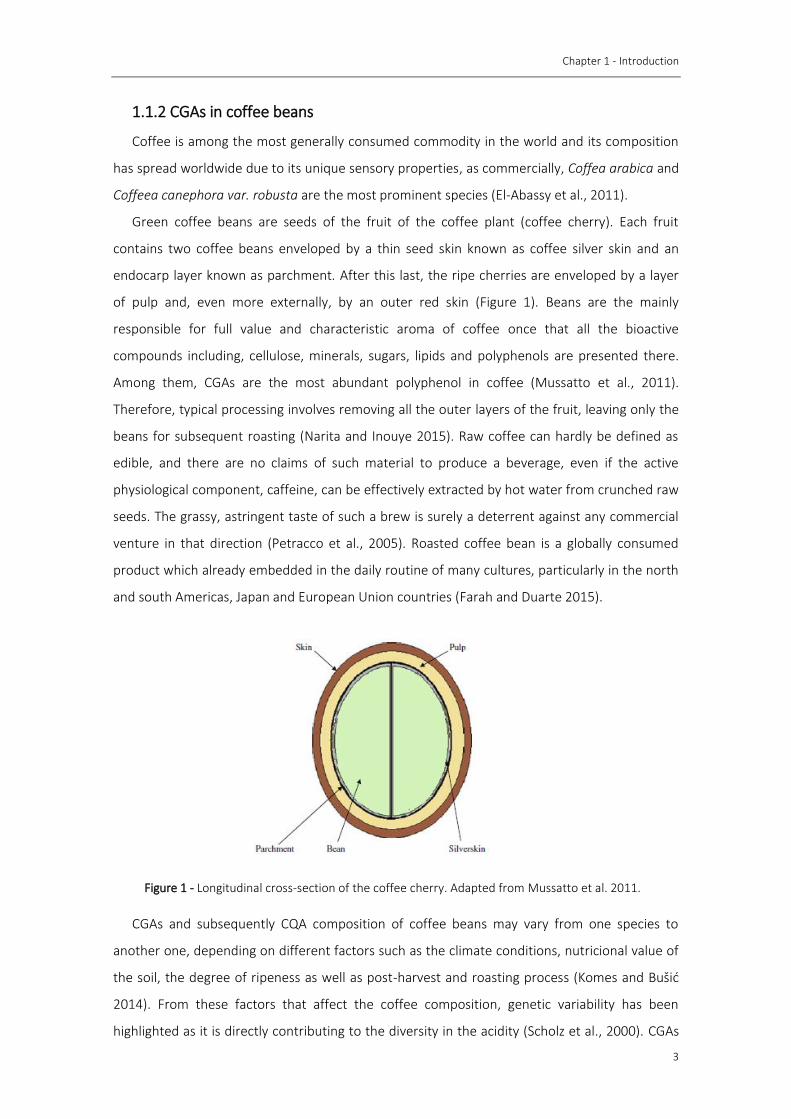
Green coffee beans are seeds of the fruit of the coffee plant (coffee cherry). Each fruit
contains two coffee beans enveloped by a thin seed skin known as coffee silver skin and an
endocarp layer known as parchment. After this last, the ripe cherries are enveloped by a layer
of pulp and, even more externally, by an outer red skin (Figure 1). Beans are the mainly
responsible for full value and characteristic aroma of coffee once that all the bioactive
compounds including, cellulose, minerals, sugars, lipids and polyphenols are presented there.
Among them, CGAs are the most abundant polyphenol in coffee (Mussatto et al., 2011).
Therefore, typical processing involves removing all the outer layers of the fruit, leaving only the
beans for subsequent roasting (Narita and Inouye 2015). Raw coffee can hardly be defined as
edible, and there are no claims of such material to produce a beverage, even if the active
physiological component, caffeine, can be effectively extracted by hot water from crunched raw
seeds. The grassy, astringent taste of such a brew is surely a deterrent against any commercial
venture in that direction (Petracco et al., 2005). Roasted coffee bean is a globally consumed
product which already embedded in the daily routine of many cultures, particularly in the north
and south Americas, Japan and European Union countries (Farah and Duarte 2015).
CGAs and subsequently CQA composition of coffee beans may vary from one species to
another one, depending on different factors such as the climate conditions, nutricional value of
the soil, the degree of ripeness as well as post-harvest and roasting process (Komes and Bušić
2014). From these factors that affect the coffee composition, genetic variability has been
highlighted as it is directly contributing to the diversity in the acidity (Scholz et al., 2000). CGAs
Figure 1 - Longitudinal cross-section of the coffee cherry. Adapted from Mussatto et al. 2011.
Chapter 1 - Introduction
4
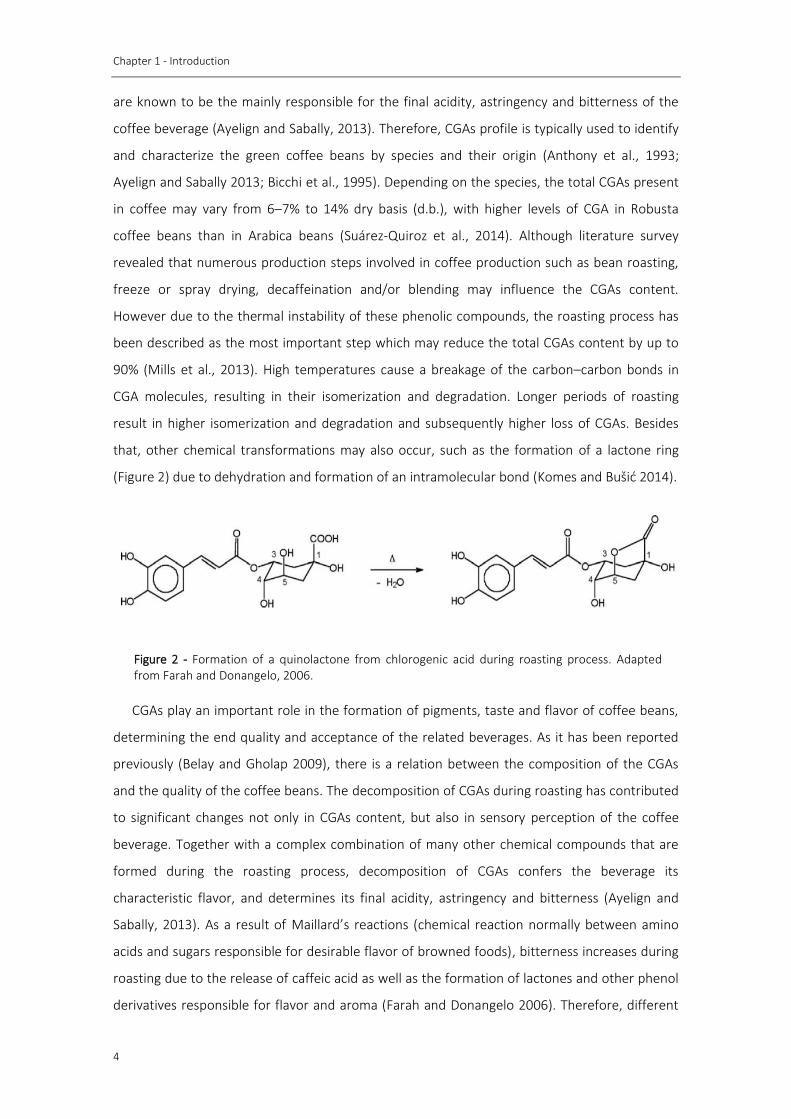
Figure 2 - Formation of a quinolactone from chlorogenic acid during roasting process. Adapted from Farah and Donangelo, 2006.
are known to be the mainly responsible for the final acidity, astringency and bitterness of the
coffee beverage (Ayelign and Sabally, 2013). Therefore, CGAs profile is typically used to identify
and characterize the green coffee beans by species and their origin (Anthony et al., 1993;
Ayelign and Sabally 2013; Bicchi et al., 1995). Depending on the species, the total CGAs present
in coffee may vary from 6–7% to 14% dry basis (d.b.), with higher levels of CGA in Robusta
coffee beans than in Arabica beans (Suárez-Quiroz et al., 2014). Although literature survey
revealed that numerous production steps involved in coffee production such as bean roasting,
freeze or spray drying, decaffeination and/or blending may influence the CGAs content.
However due to the thermal instability of these phenolic compounds, the roasting process has
been described as the most important step which may reduce the total CGAs content by up to
90% (Mills et al., 2013). High temperatures cause a breakage of the carbon–carbon bonds in
CGA molecules, resulting in their isomerization and degradation. Longer periods of roasting
result in higher isomerization and degradation and subsequently higher loss of CGAs. Besides
that, other chemical transformations may also occur, such as the formation of a lactone ring
(Figure 2) due to dehydration and formation of an intramolecular bond (Komes and Bušić 2014).
CGAs play an important role in the formation of pigments, taste and flavor of coffee beans,
determining the end quality and acceptance of the related beverages. As it has been reported
previously (Belay and Gholap 2009), there is a relation between the composition of the CGAs
and the quality of the coffee beans. The decomposition of CGAs during roasting has contributed
to significant changes not only in CGAs content, but also in sensory perception of the coffee
beverage. Together with a complex combination of many other chemical compounds that are
formed during the roasting process, decomposition of CGAs confers the beverage its
characteristic flavor, and determines its final acidity, astringency and bitterness (Ayelign and
Sabally, 2013). As a result of Maillard’s reactions (chemical reaction normally between amino
acids and sugars responsible for desirable flavor of browned foods), bitterness increases during
roasting due to the release of caffeic acid as well as the formation of lactones and other phenol
derivatives responsible for flavor and aroma (Farah and Donangelo 2006). Therefore, different
Chapter 1 - Introduction
5
blend from various coffee species along with the different combination of treatments and
processes that they undergo before reaching the consumer, may led to commercial coffee
brands and ground coffee with different CGAs content (Farah and Donangelo, 2006; Ayelign and
Sabally, 2013).
1.1.3 Interest and possible applications
Coffee as a complex matrix contains more than a thousand compounds which are
appreciated not only for its taste but also for their stimulating properties. Among the various
chemicals present in coffee, the biological effect of a few substances such as CGAs has been
established. The high consumption of coffee in modern society has caused it to become one of
the main dietary sources of CGAs and their inherent antioxidant activities, leading to a rapid
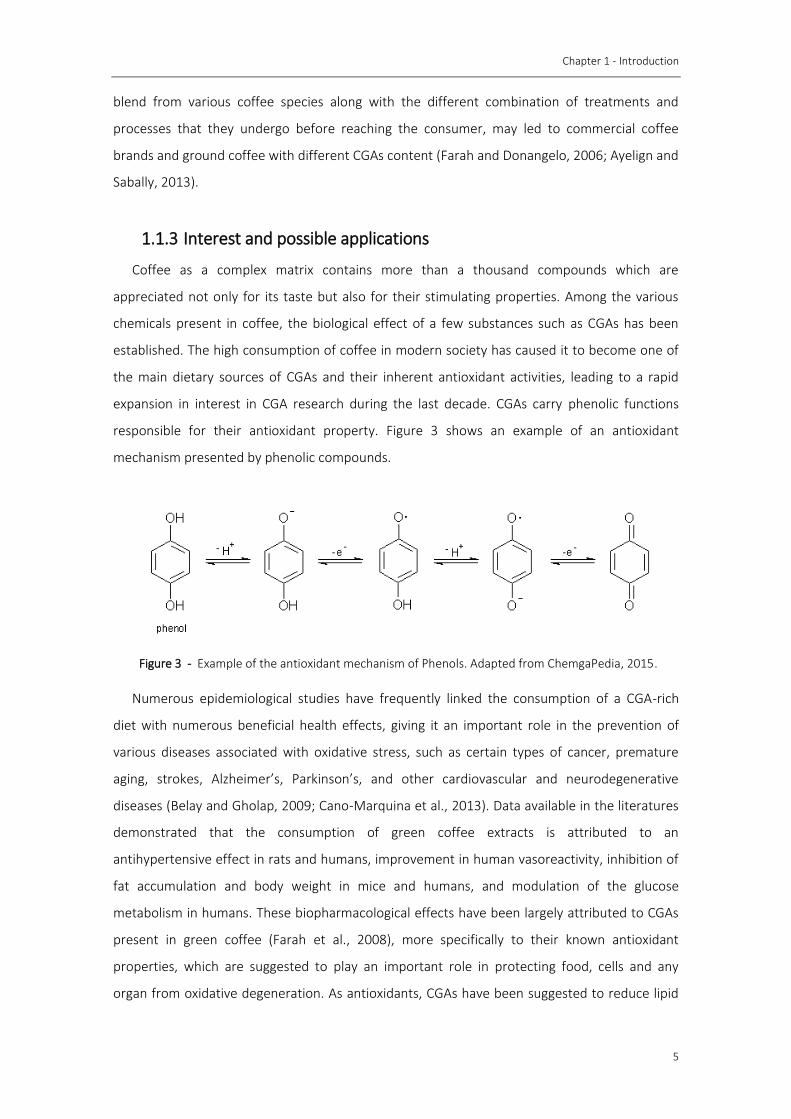
expansion in interest in CGA research during the last decade. CGAs carry phenolic functions
responsible for their antioxidant property. Figure 3 shows an example of an antioxidant
mechanism presented by phenolic compounds.
Numerous epidemiological studies have frequently linked the consumption of a CGA-rich
diet with numerous beneficial health effects, giving it an important role in the prevention of
various diseases associated with oxidative stress, such as certain types of cancer, premature
aging, strokes, Alzheimer’s, Parkinson’s, and other cardiovascular and neurodegenerative
diseases (Belay and Gholap, 2009; Cano-Marquina et al., 2013). Data available in the literatures
demonstrated that the consumption of green coffee extracts is attributed to an
antihypertensive effect in rats and humans, improvement in human vasoreactivity, inhibition of
fat accumulation and body weight in mice and humans, and modulation of the glucose
metabolism in humans. These biopharmacological effects have been largely attributed to CGAs
present in green coffee (Farah et al., 2008), more specifically to their known antioxidant
properties, which are suggested to play an important role in protecting food, cells and any
organ from oxidative degeneration. As antioxidants, CGAs have been suggested to reduce lipid
Figure 3 - Example of the antioxidant mechanism of Phenols. Adapted from ChemgaPedia, 2015.
Chapter 1 - Introduction
6
oxidation (Cano-Marquina et al., 2013). They have also been shown to have significant
antiradical activity. Free radicals are highly reactive by-products of respiration, which when
accumulated can cause severe damage to molecules and originate several diseases and
premature aging. Green coffee bean extract containing CGAs, in particular 5-CQA, indicated the
strongest antiradical activity. It has been reported that 5-CQA, can strongly react with hydroxyl
free radicals, which may explain the neuroprotective effects of coffee consumption as it has
been suggested by recent epidemiological studies (Yashin et al., 2013). In addition to their
quelation and free radical scavenging abilities, CGAs are able to prevent molecule oxidation and
damage (Nakatani et al., 2000, Laranjinha et al., 1994). Moreover and adding to their
antioxidant power, CGAs have also been shown to potentiate other bioprotective effects, such
as hepatoprotective activity in injured liver (Ji et al., 2013), and antibacterial and antiviral
activities (Farah and Duarte, 2015).
As it was mentioned above, CGAs indicated various medicinal properties which lead to a
growing interest in the dietary supplementation of food products with these compounds as
natural antioxidants. Unfortunately, these valuable natural compound’s applications are
substantially limited by its low bioavailability and stability (Namallamuthu et al., 2014). CGAs can
undergo enzymatic oxidation in many food processes and their instability in thermal processing
of foods has also been reported (Namallamuthu et al., 2014). In addition, CGAs may suffer
transesterification reaction which limits the product shelf-life during storage or distribution
(Namallamuthu et al., 2014). The insufficient gastric residence time also proved to limit CGA’s
application once only a small proportion of its administration is absorbed. Furthermore, only
one third of CGAs absorbed from gastrointestinal tract reaches blood circulation (Munin and
Edwards-Lèvy, 2011).
Therefore, the administration of CGAs requires the formulation of a finished protecting
product able to maintain their structural integrity until the consumption or the administration,
mask its taste, increase its bioavailability and convey it towards a physiological target. Among
the existing stabilization methods, microencapsulation has been widely reported as an
alternative solution (Munin and Edwards-Lèvy, 2011).
1.2. Microencapsulation
1.2.1 Microcapsules: definition and characterization
Microencapsulation is the process in which a solid, liquid or gaseous component is
surrounded by a coating of a continuous film of polymeric material. This conformation leads to
the formation of capsules in general, microcapsules. These capsules offer a physical barrier
Chapter 1 - Introduction
7
between the internal compound and the components from the surrounding environment
providing higher protection against external factors such as oxygen, heat, humidity and light
(Poshadri et al., 2010; Jyothi Sri et al., 2012). Microcapsules are small particles with a uniform
wall around it, where the material inside the microcapsule is referred as the core, internal
phase, or fill. The wall is called as shell, coating or membrane. Particle size of microcapsules may
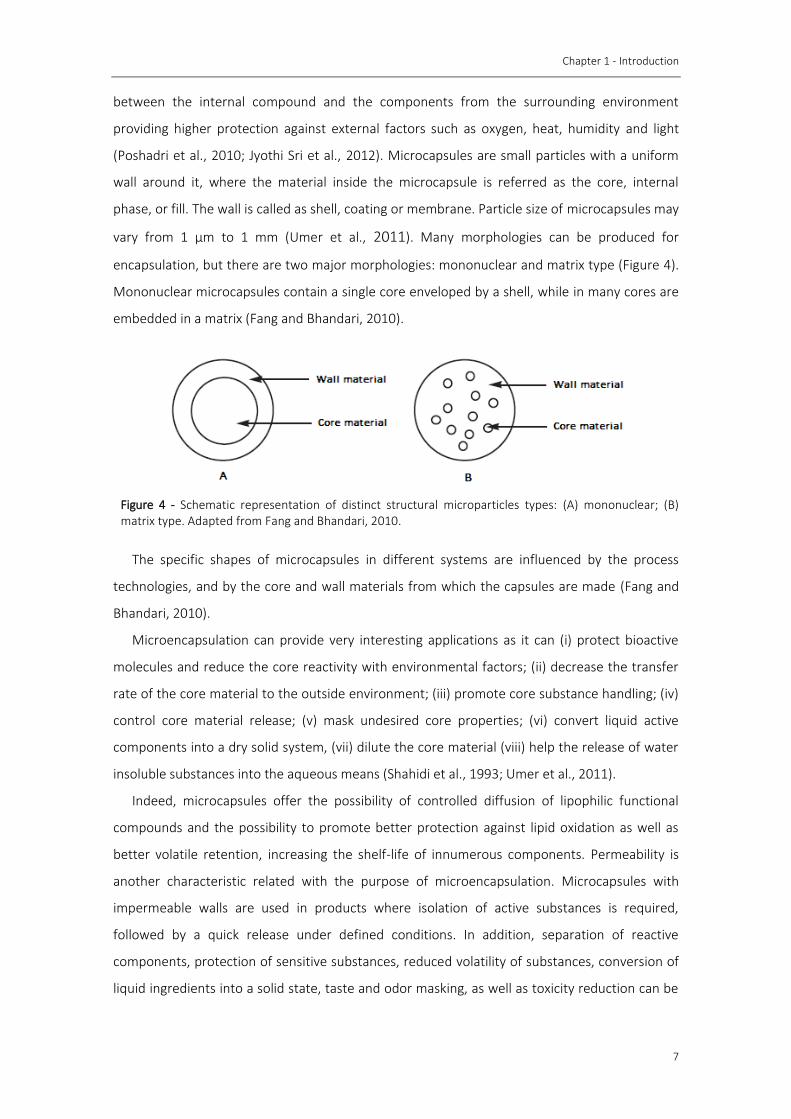
vary from 1 μm to 1 mm (Umer et al., 2011). Many morphologies can be produced for
encapsulation, but there are two major morphologies: mononuclear and matrix type (Figure 4).
Mononuclear microcapsules contain a single core enveloped by a shell, while in many cores are
embedded in a matrix (Fang and Bhandari, 2010).
The specific shapes of microcapsules in different systems are influenced by the process
technologies, and by the core and wall materials from which the capsules are made (Fang and
Bhandari, 2010).
Microencapsulation can provide very interesting applications as it can (i) protect bioactive
molecules and reduce the core reactivity with environmental factors; (ii) decrease the transfer
rate of the core material to the outside environment; (iii) promote core substance handling; (iv)
control core material release; (v) mask undesired core properties; (vi) convert liquid active
components into a dry solid system, (vii) dilute the core material (viii) help the release of water
insoluble substances into the aqueous means (Shahidi et al., 1993; Umer et al., 2011).
Indeed, microcapsules offer the possibility of controlled diffusion of lipophilic functional
compounds and the possibility to promote better protection against lipid oxidation as well as
better volatile retention, increasing the shelf-life of innumerous components. Permeability is
another characteristic related with the purpose of microencapsulation. Microcapsules with
impermeable walls are used in products where isolation of active substances is required,
followed by a quick release under defined conditions. In addition, separation of reactive
components, protection of sensitive substances, reduced volatility of substances, conversion of
liquid ingredients into a solid state, taste and odor masking, as well as toxicity reduction can be
Figure 4 - Schematic representation of distinct structural microparticles types: (A) mononuclear; (B) matrix type. Adapted from Fang and Bhandari, 2010.

Chapter 1 - Introduction
8
accounted as other objective of microencapsulation with impermeable wall materials. On the
other hand, microcapsules with permeable walls enable prolonged release of active
components into the environment, such as prolonged release of drugs, perfumes, deodorants
and repellents (Jyothi Sri et al., 2012).
As it has been documented in the literature, microencapsulation has successfully been
applied for a number of substances namely acids (e.g. chlorogenic acids) (Shi et al., 2006), oils
(Frascareli et al., 2012), vitamins (Wilson and Shah, 2007), amino acids (Chen et al., 1992),
essential oils (Martins et al., 2014), food coloring (Kandansamy and Somasundaram, 2012),
enzymes (Anjani et al., 2007; Estevinho et al., 2014) and microorganisms (Islam et al., 2010).
During food processing, autoxidation of CGAs may occur which may results in the
formulation of brown polymerized products. These drawbacks could be solved via
microencapsulation of CGAs in order to improve its stability during the food processing for the
reasons previously described.
1.2.2 Microencapsulation techniques
Microencapsulation of food ingredients into coating materials can be achieved by several
methods. The selection of the microencapsulation process is governed by the physical and
chemical properties of core, coating materials and the intended application of food ingredients
(Poshadri et al., 2010). Table 2, schematizes several used methods for the preparation of
microencapsulated products, as for food or other industries.
Chapter 1 - Introduction
9
1.2.3 Microencapsulation techniques applied to food industry
Choosing the most adequate microencapsulation technique depends on the type of the
active and encapsulating material, intended application and releasing mechanism. The basic
difference between the existing methods relies in the relation between the active material (the
core) and the encapsulate agent. Among the microencapsulation methods, the most commonly
applied techniques in food industry are: spray drying, coacervation, fluidized bed coating,
emulsification and inclusion complexation (Desai and Park, 2005; Gouin, 2004). Among these,
spray drying has been the most commonly used techniques in food industry (Gouin, 2004,
Martins et al., 2014).
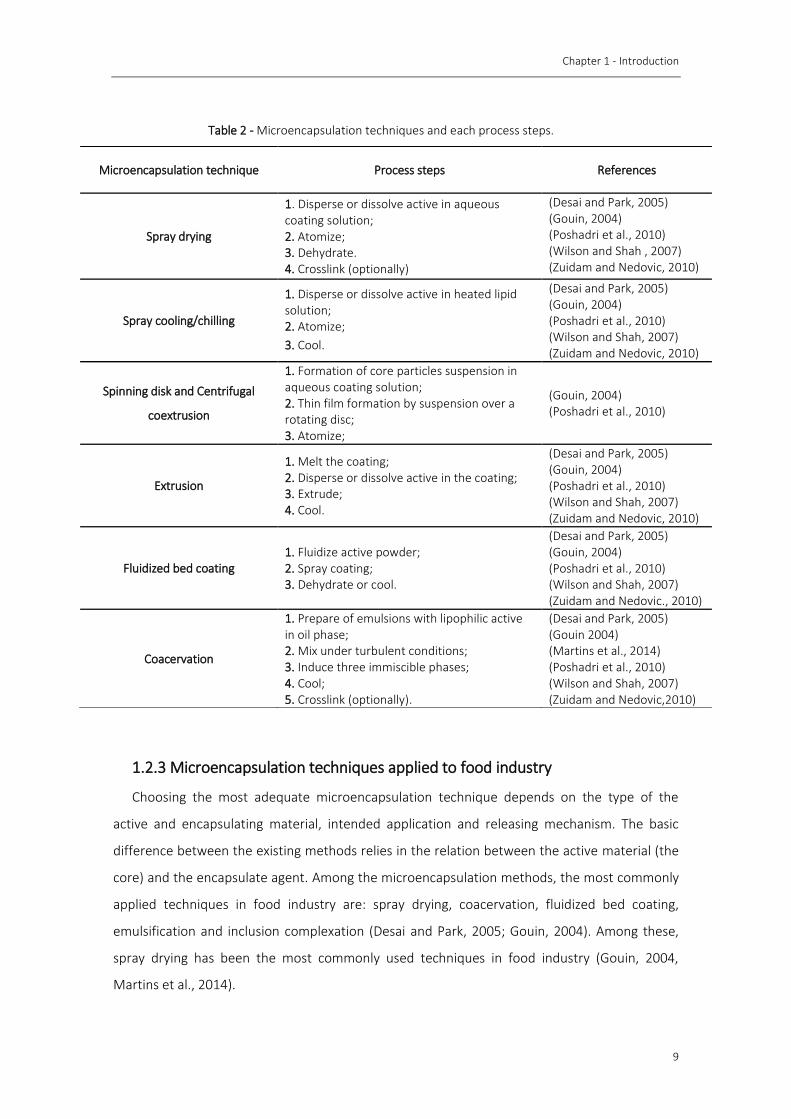
Microencapsulation technique Process steps References
Spray drying
1. Disperse or dissolve active in aqueous coating solution; 2. Atomize; 3. Dehydrate. 4. Crosslink (optionally)
(Desai and Park, 2005) (Gouin, 2004) (Poshadri et al., 2010) (Wilson and Shah , 2007) (Zuidam and Nedovic, 2010)
Spray cooling/chilling
1. Disperse or dissolve active in heated lipid solution; 2. Atomize;
3. Cool.
(Desai and Park, 2005) (Gouin, 2004) (Poshadri et al., 2010) (Wilson and Shah, 2007) (Zuidam and Nedovic, 2010)
Spinning disk and Centrifugal
coextrusion
1. Formation of core particles suspension in aqueous coating solution; 2. Thin film formation by suspension over a rotating disc; 3. Atomize;
(Gouin, 2004) (Poshadri et al., 2010)
Extrusion
1. Melt the coating; 2. Disperse or dissolve active in the coating; 3. Extrude; 4. Cool.
(Desai and Park, 2005) (Gouin, 2004) (Poshadri et al., 2010) (Wilson and Shah, 2007) (Zuidam and Nedovic, 2010)
Fluidized bed coating 1. Fluidize active powder; 2. Spray coating; 3. Dehydrate or cool.
(Desai and Park, 2005) (Gouin, 2004) (Poshadri et al., 2010) (Wilson and Shah, 2007) (Zuidam and Nedovic., 2010)
Coacervation
1. Prepare of emulsions with lipophilic active in oil phase; 2. Mix under turbulent conditions; 3. Induce three immiscible phases; 4. Cool; 5. Crosslink (optionally).
(Desai and Park, 2005) (Gouin 2004) (Martins et al., 2014) (Poshadri et al., 2010) (Wilson and Shah, 2007) (Zuidam and Nedovic,2010)
Table 2 - Microencapsulation techniques and each process steps.
Chapter 1 - Introduction
10
1.2.4 Spray drying
Spray drying has been used in the food industry since the late 1950s and is known to be the
most frequently technique applied to microencapsulation of polyphenols, providing protection
against degradation/oxidation and converting liquids to powders (Gouin, 2004). This technique
is a simple process, similar to one stage drying operation, which is capable of producing a wide
variety of microcapsules at good yield, including microcapsules loaded with fragrance or flavor
oils (Gharsallaoui et al., 2007).
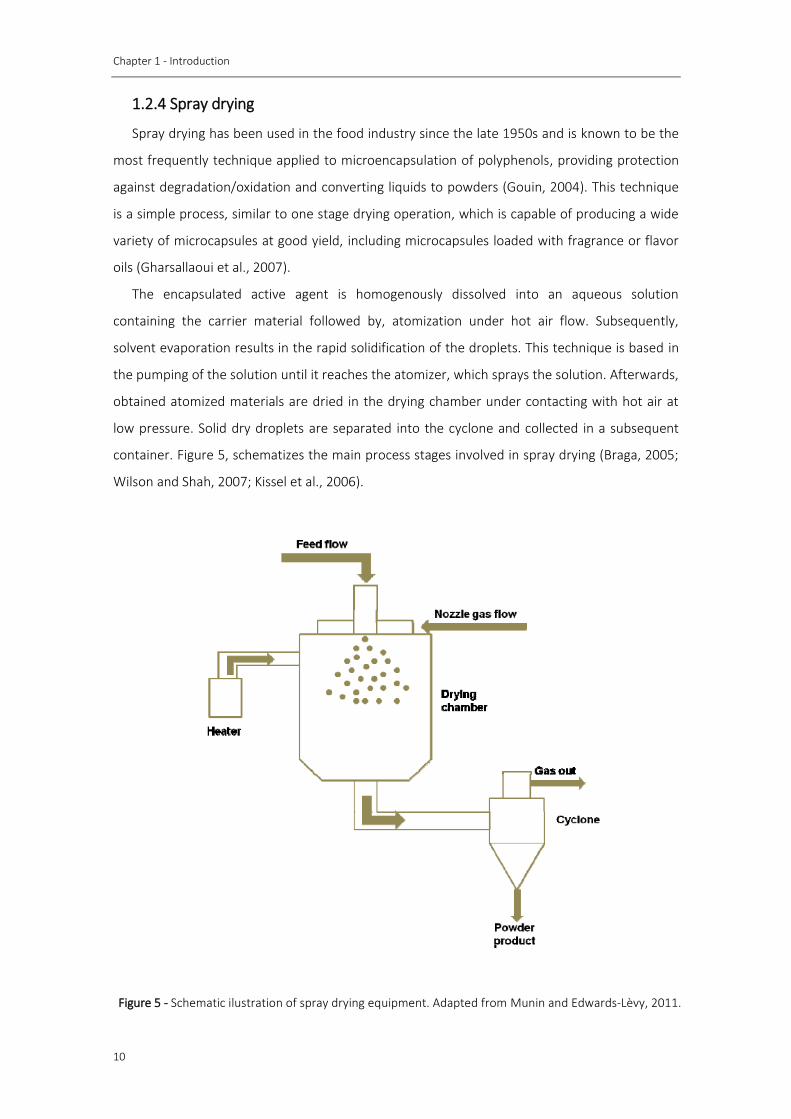
The encapsulated active agent is homogenously dissolved into an aqueous solution
containing the carrier material followed by, atomization under hot air flow. Subsequently,
solvent evaporation results in the rapid solidification of the droplets. This technique is based in
the pumping of the solution until it reaches the atomizer, which sprays the solution. Afterwards,
obtained atomized materials are dried in the drying chamber under contacting with hot air at
low pressure. Solid dry droplets are separated into the cyclone and collected in a subsequent
container. Figure 5, schematizes the main process stages involved in spray drying (Braga, 2005;
Wilson and Shah, 2007; Kissel et al., 2006).
Figure 5 - Schematic ilustration of spray drying equipment. Adapted from Munin and Edwards-Lèvy, 2011.
Chapter 1 - Introduction
11
The process variables are defined by the air temperature (leaving in and out of the system),
air flow, temperature and humidity distribution, residence time and the geometry of the
chamber (Kissel et al., 2006).
Spray drying is a simple and fast method, offering a low cost procedure and allowing
obtaining a final product without the need of washing the microparticles in order to separate
them from remaining solvent residues. The applied high temperatures do not come as an
inconvenient when using thermos-sensitive compounds. The raised relation between
specificsurface and the particles volume promotes the rapid evaporation of the solvent, in this
circumstances the exposure time of the particles to the heat reduce and the temperature of the
nucleus does not exceed the 100 °C, which reduces the possibility of undesired changes in the
compounds properties (Desai and Park, 2005; Estevinho et al., 2013; Gharsallaoui et al., 2007;
Gouin, 2004).
The type and concentration of the active and the encapsulating agent, velocity and the feed
system temperature are important aspects in this method, influencing the microparticles
characteristics (Silva et al., 2003).
1.2.5 Encapsulating agents
The composition of the coating material is the main determinant of the functional properties
of the microcapsule and of how it may be used to improve the performance of a particular
ingredient. The choice of the encapsulate agent depends on several factors, between them, in
the process used for microcapsule formation and in the ideal release mechanism for each
situation (Favaro-Trindade, 2008).
An ideal coating material should exhibit various characteristics, such as: easy workability
during encapsulation; the ability to disperse the active substance; non-reactivity with the
encapsulated material (compatible with core material); the ability to seal and hold the active
material within its structure during processing (controlled release under specific conditions) and
on prolonged storage; the ability to provide maximum protection to the active material against
environmental conditions, such as oxygen (stabilization of core material); inert behavior toward
active ingredients; the ability to provide an flexible, brittle, hard and thin coating; and finally, it
may be abundantly and cheaply available (Goud and Park,2005; Poshadri et al., 2010; Jyothi Sri
et al., 2012 ). After the desired coat functions and coating material restrictions have been
established, a coating formulation can be developed from a range of available coating materials,
modifiers, and solvents. Sophisticated shell materials and technologies have been developed,
Chapter 1 - Introduction
12
and an extremely wide variety of functionalities can now be achieved through
microencapsulation.
1.2.6 Biopolymers
Among the most commonly used materials as encapsulating agents, biopolymers have
gained a much more attention due its natural origin, biocompatible, non-toxic, non-
immunogenic and biodegradable properties (Stoica et al.,2013; Bu et al., 2006). The non-
biodegradability of synthetic polymers has led to ecological problems (Sabiha-Hanim and Siti-
Norsafurah, 2012) so the use of biopolymers for the encapsulation of polyphenols makes them
attractive candidates for industrial applications (Stoica et al., 2013; Bu et al., 2006).
Biopolymers are macromolecules consisting of discrete building blocks naturally formed by
microorganisms, plants and animals. These compounds are produced during the growth cycles
of the mentioned organisms (Maleki, 2008; Pawar and Edgar, 2012; Rao, 2014) being chemically
synthesized from biological starting materials such as amino acids, sugars and natural fats or oils
(Stoica et al.,2013).
As an important source of polymeric materials, biopolymers have been shown a great
potential for commercialization (Imre, 2013). They can modify the flow characteristics of fluids,
stabilize suspensions, flocculate particles, encapsulate materials and produce emulsions.
Consequently, they are now widely used as thickener, stabilizer, emulsifier, gelling agent and
water-binding agents in the food, cosmetics, bioplastics and oil industries. Properties of
biopolymers are dependent on the composition and molecular weight of the polymer (Imre,
2013; Jogdand, 2014). The structure of monomer used in polymer formation is directly effective
on the properties that are required in different areas of work, such as: thermal stability,
flexibility, good barrier to gases, good barrier to water, resistance to chemicals, biocompatibility
and biodegradability (Güner et al., 2006).
The list shown below represents the biopolymers that have been normally applied as coating
materials (Table 3). Starch, maltodextrin, gum arabic, pectin, chitosan and alginate are, among
other common excipients, an example of natural polymers studied as matrix for
microencapsulation. The representative biopolymers including proteins (such as albumin and
gelatin) and polysaccharides (such as alginate and chitosan) have been the preferred polymers
used in microencapsulation systems (Wang et al., 2006).

Chapter 1 - Introduction
13
1.2.6.1 Sodium Alginate (SA)
Alginate is one of the most naturally available polymers. This biopolymer is comprehensively
used in food and beverages or pharmaceutical industries (Goh et al., 2012) due to its
biocompatibility, low toxicity and low cost (Lee and Mooney, 2012). Besides that, they are also
assumed to be non-immunogenic and biodegradable (Yang et al., 2011).
Alginate is a water soluble polysaccharide consisting of two basic building blocks, α-L-
guluronic acid (G) and β-D-mannuronic acid (M) residues, linearly linked together by 1-4
linkages (Figure 6) (Yoo et al., 2006; Goh et al., 2012).
Category Encapsulate agents Widely used techniques References
Carbohydrate
Starch*, Maltodextrins, Chitosan, Corn syrup solids, Dextran, Modified, Starch, Cyclodextrins, Sucrose, Modified Chitosan*, Sodium alginate*
Spray freeze or drying Extrusion Coacervation Inclusion Complexation
(Ascheri et al., 2003) (Muller, 2011) (Rocha et al., 2012) (Laohasongkram et al., 2011)
Cellulose
Carboxymethylcellulose*, Methylcellulose*, Ethylcellulose*, Celluloseacetate-phthalate, Celluloseacetatebutylate- Phthalate
Coacervation, Spray drying
(Greenberg and Mahoney, 1981) (Garcia et al., 1989) (Shahidi et al.,1993) (Uddin et al., 2001)
Gum Gum acacia*, Agar, Carrageenan*
Spray drying, Coacervation
(Comunian, 2013) (Ascheri et al., 2003) (Kim et al., 2013) (Frascareli et al., 2012) (Dima et al., 2014) (Piacentini et al., 2013)
Lipids Wax, Paraffin, Bees wax, Diacylglyerols, Oils, Fats, Phospholipids, Stearic acid
Emulsions, Liposomes, Film formation
(Kapusniak et al., 2006) (Shahidi et al., 1993)
Protein Gluten, Casein, Gelatin*, Albumin, Peptides, Whey proteins hydrogel
Emulsion, Spray drying (Betz and Kulozik, 2011) (Kim et al., 2013)
Table 3 - Biopolymeric materials commonly used for microencapsulation. Adapted from Desai and Park, 2005.
Figure 6 - Molecular structure of Sodium alginate. Adapted from Yang et al., 2011.
*Water soluble agents
Chapter 1 - Introduction
14
Depending on the alginate source, this linear conformation can be composed of consecutive
G residues, consecutive M residues or alternating G and M residues (GM) (Lee and Mooney,
2012). Together with the copolymer composition (M and G contents), the units sequence and
the molecular weight are also known to differ with the source of the alginate extract (Pawar and
Edgar, 2012). Alginate extraction can be accomplished from algae as well as bacterial sources
(Pawar and Edgar, 2012; Goh et al., 2012). For example, brown algae (Phaeophyceae), including
Laminaria hyperborea, Laminaria digitata, Laminaria japonica, Ascophyllum nodosum, and
Macrocystis pyrifera could be accounted as great sources for extraction of alginate. In order to
precipitate the alginate, sodium or calcium chloride may be added to the extract (Lee and
Mooney, 2012).
It should be stress that, approximately 30000 metric tons of alginate per year, is produced
industrially (Pawar and Edgar, 2012). Its opens promising strategies for production of other
biomaterials based on alginate which led to several commercial applications with different
solubility, hydrophobicity and affinity for specific proteins (Pawar and Edgar, 2012). With
regards to food industry, sodium alginate (SA) is used as a thickener and stabilizer in a wide
range of products such as jelly, drinks (chocolate milk) and desserts (ice cream) (Goh et al.,
2012). Furthermore, alginates coatings, as good oxygen barriers, are also known to retard lipid
oxidation in foods (Kester and Fennema, 1997). Besides food industries, other applications such
as ethanol production required alginate for encapsulation of Yeast cells (Goh et al., 2012). Cells
immobilization, tissue engineering, drug delivery, controlled release and immobilization of
micro-organisms are also some examples where alginates have been widely used as a type of
desired biomaterial (Yang et al., 2011).
Due to the reactivity of its carboxylate side groups, alginate is known to form spontaneous
gelation in the presence of divalent cations (such as calcium (Ca2+)) (Stoica et al., 2013). Calcium
act as a crosslinker between the functional groups of alginate chains resulting in cross-linked
alginate hydrogels that has been proved to be a great promise in biomedical applications.
However, besides hydrogels induced by divalent cations, alginate can form acid gels at pH below
the pKa value of 3.7 and 3.4 for G and M, respectively (Yang et al., 2011; Bu et al., 2006).
Alginate gel structure is relatively stable at acidic pH, but it is easily swollen and disintegrated
under mild alkali conditions. Thus, alginate gel has been applied to produce an effective
controlled release carrier as forms of matrix, bead or microcapsules (Yoo et al., 2006).
Literatures suggest a temperature-dependent nature of alginates. At temperatures below
the boiling point of water, non-covalent bonding between continuous polymeric segments keep
the alginates intact so, thermostable alginate gels can be formed in the temperature range
between 0 and 100 °C (Goh et al., 2012). Nevertheless, formation of thermostable alginate gel
Chapter 1 - Introduction
15
up to 150 °C has been also reported in literature. Prolonged heat treatment at low or high pH
may destabilize the gel.
As mentioned above, some uses of alginates depend on their thickening properties and their
ability to increase the viscosity of aqueous systems using relatively low concentrations. The
viscosity of alginate solutions is unaffected over the range of pH 5-11. Below pH 5, the free -
COO- ions in the chain start to become protonated, to -COOH, so the electrostatic repulsion
between chains is reduced, they are able to come closer and form hydrogen bonds, producing
higher viscosities. When the pH is further reduced, a gel will form, usually between pH 3-4. If
the pH is reduced quickly from 6 to 2, a gelatinous precipitate of alginic acid will form. Above pH
11, slow depolymerization occurs on storage of alginate solutions, giving a fall in viscosity.
Besides pH, alginate gels are also influenced by temperature once that viscosity decreases as
temperature increases. Viscosity usually returns to a little less than the original value on cooling.
However, if alginate solutions are kept above 50 °C for several hours, depolymerization may
occur giving a permanent loss of viscosity. Alginate solutions can be frozen and defrosted
without change of viscosity, as long as they are free of calcium.
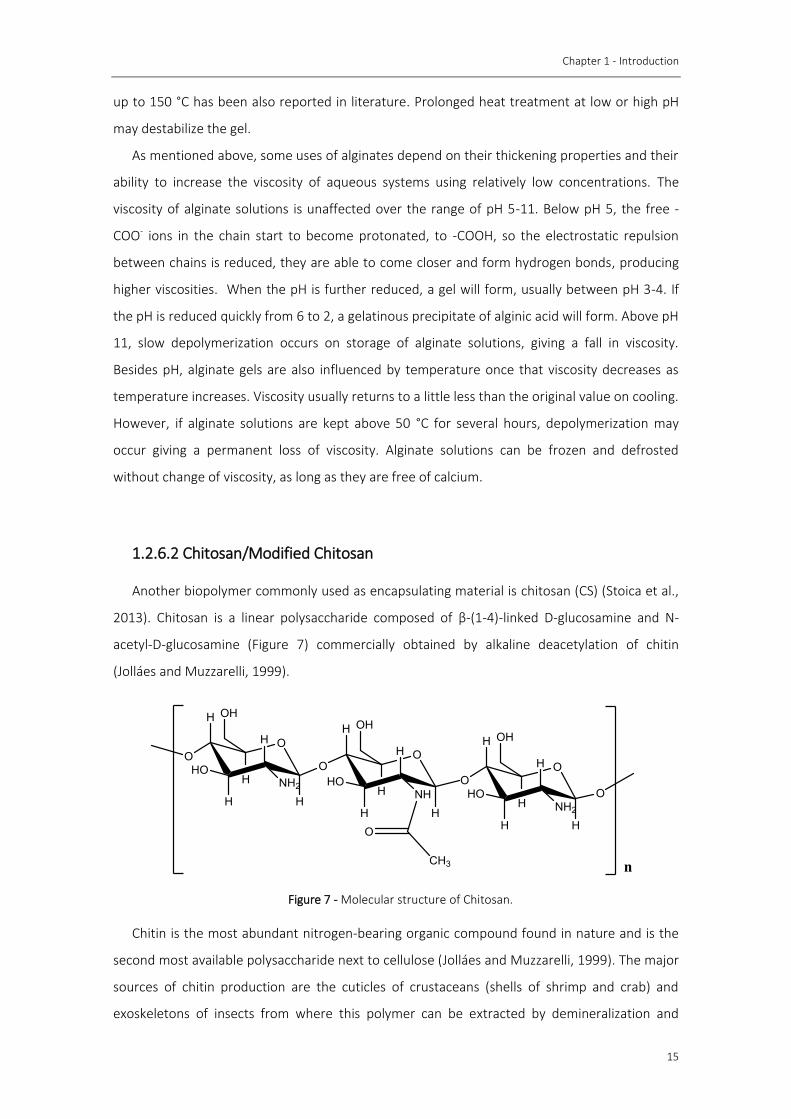
1.2.6.2 Chitosan/Modified Chitosan
Another biopolymer commonly used as encapsulating material is chitosan (CS) (Stoica et al.,
2013). Chitosan is a linear polysaccharide composed of β-(1-4)-linked D-glucosamine and N-
acetyl-D-glucosamine (Figure 7) commercially obtained by alkaline deacetylation of chitin
(Jolláes and Muzzarelli, 1999).
Chitin is the most abundant nitrogen-bearing organic compound found in nature and is the
second most available polysaccharide next to cellulose (Jolláes and Muzzarelli, 1999). The major
sources of chitin production are the cuticles of crustaceans (shells of shrimp and crab) and
exoskeletons of insects from where this polymer can be extracted by demineralization and
Figure 7 - Molecular structure of Chitosan.
Chapter 1 - Introduction
16
deproteinization using highly concentrated solutions of sodium hydroxide under high
temperature (Dumitriu, 2002). The way how chitosan is prepared from chitin is determinant
define important characteristics such as molecular weight, deacetylation degree and
crystallinity (Estevinho et al., 2013). The degree of deacetylation (DD), determined by the
proportion of D-glucosamine and N-acetyl- D-glucosamine, is the most important characteristic
used to characterize both chitin and chitosan polymers. Therefore, chitin and chitosan are
essentially the same polymer but with arbitrarily defined degrees of DD. Generally, if the DD is
more than 40%, the term chitosan is used (Nordtveit, 1996). Together with the degree of
deacetylation, molecular weight of this polymer (50-2000 kDa) has also a significant role in its
biological properties (Estevinho et al., 2013).
Due to its biodegradability, biocompatibility, antimicrobial activity and non-toxicity, chitosan
has been considered among the most valuable biopolymers for biomedical (artificial skin,
wound dressing, contact lens) and pharmaceutical (medicine controlled release systems,
capsules, microcapsules) applications. Regarding its antimicrobial activity, chitosan have also
shown great promise to be used in food industry as preservative. The quality of a variety of food
products have been insured by chitosan based films once that its activity can act against various
microorganisms (Dutta et al., 2009). Nanoparticles, microspheres, hydrogels, films, and fibers
are some examples of typical chitosan based forms used for industrial applications (Kumar,
2000).Although chitosan is an attractive biopolymer, it is a water insoluble material only soluble
in an acidic aqueous medium (pH < 6) such as acetic, nitric, formic, latic, hydrochloric, perchloric
and phosphoric acids (Kurita, 2006; Rinaudo, 2006; Sankararamakrishnan and Sanghi, 2006). Its
pH-sensitive behavior, given to the large quantities of amino groups on its chain, provides
chitosan the ability to dissolve easily at low pH (acidified medium) but hardly at higher pH
ranges, which limit its application to bioactive agents such as drug carrier (Estevinho et al.,
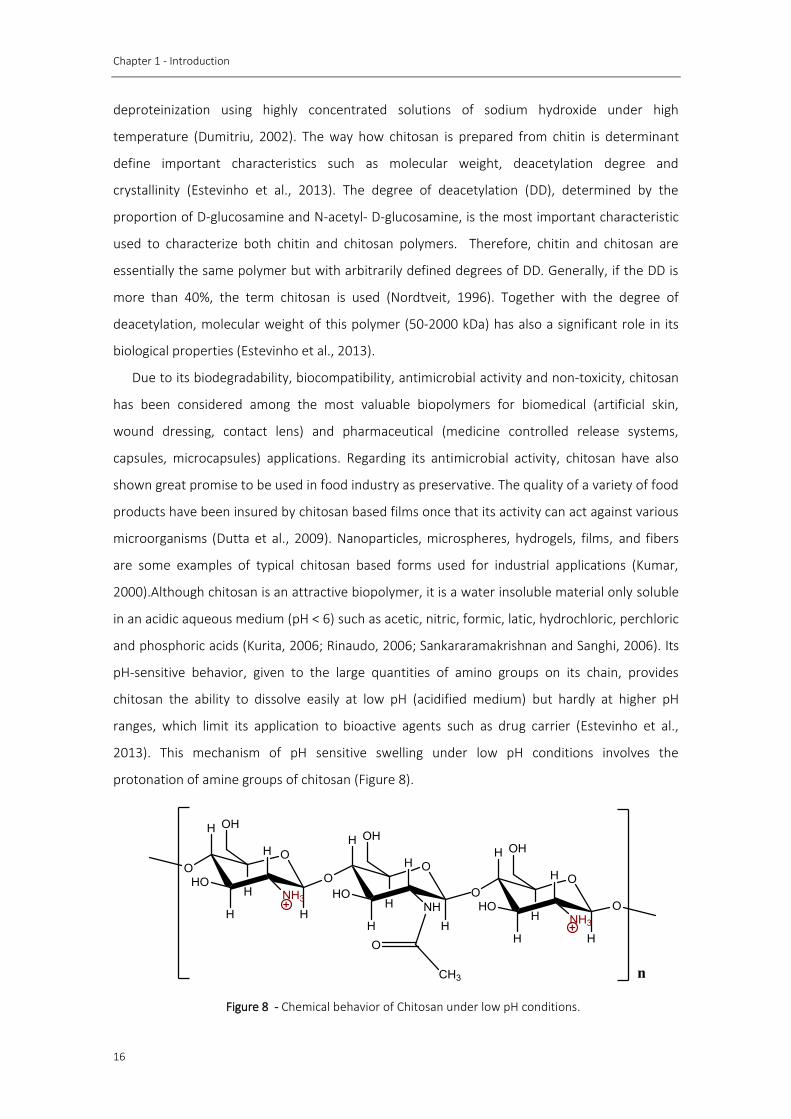
2013). This mechanism of pH sensitive swelling under low pH conditions involves the
protonation of amine groups of chitosan (Figure 8).
Figure 8 - Chemical behavior of Chitosan under low pH conditions.
Chapter 1 - Introduction
17
However, chitosan can undergo chemical modification very easily. This property is attributed
to the presence of free amino groups, which increases the reactivity of the polymer. Therefore,
it can be readily modified by reactions at the amino groups, allowing the improvement of
chemical and mechanical properties of chitosan. These chemical modifications would not
change the fundamental skeleton of chitosan and would keep the original physicochemical and
biochemical properties while bringing new or improved properties (George, 2006). The main
goals of modifying chitosan chemically are to provide derivatives that are soluble at neutral and
basic pH values, to control hydrophobic, cationic, and anionic properties as well as to attach
various functional groups and ligands. This advantage is useful for drug carriers and for food
industrial applications.
Into what comes to microencapsulation, chitosan has one important advantage over other
encapsulating agents, which is the possibility to establish covalent or ionic bonds with the
crosslinking agents, building a network, where the active substance stays retained.
Consequently, these chemical bonds carry advantages in terms of controlled release. The
crosslinking reaction is mainly influenced by the size and type of crosslinker agent and the
functional groups of chitosan, the smaller the molecular size of the crosslinker, the faster the
crosslinking reaction, since its diffusion is easier. Depending on the nature of the crosslinker, the
main interactions forming the network are covalent or ionic bonds. Covalently crosslinked
hydrogels present the crosslinking degree as the main parameter influencing important
properties such as mechanical strength, swelling and drug release. Such gels generally exhibit
pH sensitive swelling and drug release by diffusion through their porous structure. Having this,
hydrogels based on covalently and ionically crosslinked chitosan can be considered as good
candidates, e.g., for the oral delivery of drugs (Estevinho et al., 2013; George, 2006).
To the best of our knowledge, limited studies have been performed with regards to the
encapsulation of chlorogenic acids. For this purpose and to overcome the limitations of
chlorogenic acid for industrial applications (e.g. food industry), the present study aims the
encapsulation of chlorogenic acid (3-CQA) by spray drying into biopolymer-bases microparticles.
The development and characterization of a sustained-release system for chlorogenic acid (3-
CQA) through two natural biodegradable polymers (sodium alginate and modified chitosan)
together with the study of their release profiles under different pH conditions (pH 5.6 and pH 2)
are intended. Validation of an analytical method for 3-CQA quantification and characterization
of the obtained microparticles in terms of size and shape are also pretended.

19
Chapter 2
State of the Art
In the last few years, formulations of new functional food products containing natural
compounds have shown an increased growing interest due to their antioxidant activity and
other beneficial health effects. However, low stability, low bioavailability and the unpleasant
taste presented by certain compounds, such as polyphenols, have restricted many of their
industrial applications. In order to overcome such limitations, many encapsulation methods
have been described in the literature, among which some have been successfully applied to
polyphenols. Nevertheless, there are limited studies for encapsulation of polyphenolic
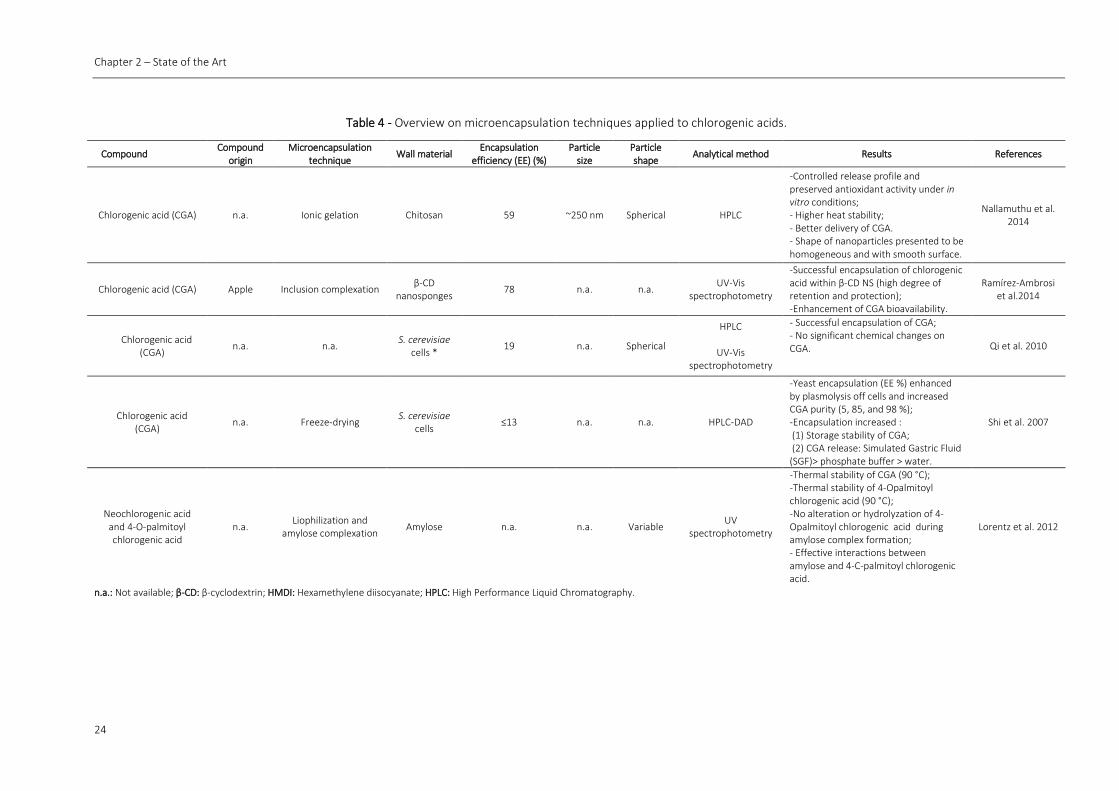
compounds present in coffee, in particular for chlorogenic acids (CGAs) (Table 4).
Carvalho et al., 2013 investigated the process of microencapsulation of green coffee oil
(Coffea arabica) using emulsions stabilized by lecithin and lecithin-chitosan in order to improve
the oxidative stability and maintain the sun protection factor of the oil, for possible cosmetic
applications. The obtained microparticles produced by spray drying used corn syrup and two
chemically octenyl succinic anhydride (OSA) modified starches as wall materials and were
characterized for particle size distribution, microstructure, encapsulation efficiency (EE) and in
vitro sun protection factor. Regarding to EE, values ranged from 86 to 97 % and was significantly
influenced by the kind of wall material and the use of chitosan. Microparticles prepared with
modified starch or combined with corn syrup (50:50) presented the best encapsulation
efficiency values. The ones formed by the mixture of two modified starches with corn syrup
presented better EE just when stabilized by lecithin– chitosan. Chitosan presented to contribute
to a greater stability of the emulsions, providing lower surface oil content in microparticles and,
consequently, higher values of EE. The particle mean diameter varied from 14.51 μm to 29.19
μm, being 14.51 μm to 19.50 μm for emulsions stabilized by lecithin–chitosan and 16.40 μm to
29.19 μm for emulsions stabilized by lecithin only. Microparticles produced with modified starch
and stabilized by lecithin–chitosan presented larger diameter with the addition of corn syrup
than microparticles produced only with modified starch. In general, all the particles exhibited
spherical shape and irregular surface. However, some cracks and holes were observed for syrup
microparticles compromising and reducing, by the enhancement of air permeability, their ability
to protect the active material. No cracks or holes were referred to microparticles of modified
Chapter 2 – State of the Art
20
starch. In terms of oxidative stability, the highest values were obtained for microparticles
produced with modified starch and for the combination of it with corn syrup. Microparticles
prepared with lecithin-chitosan also exhibited higher oxidative stability when compared to the
particles constituted just by lecithin. The presence of chitosan in microparticles proved to
influence positively the oxidative stability once it can provide better barrier to oxidation.
The influence of different combinations of wall materials used for microencapsulation of
green coffee oil by spray drying was also studied by Silva et al., 2013 In their study,
microparticles were prepared using modified starches or gum arabic, with maltodextrin, and
their characterization was also related to encapsulation efficiency, particle mean diameter, in
vitro sun protection factor and oxidative stability. Encapsulation efficiencies varied from 82% to
99% and, for all the combinations of wall materials, values increased with the use of
homogenization pressure in the emulsion preparation step. Particles mean size (10.7 µm – 16.0
µm) and oxidative stability presented no variation with the use of homogenization pressure but
they were influenced by the type of combination of wall material. As in Carvalho et al., 2013
study, the obtained microparticles presented spherical shape and various sizes, which is a
typical characteristic of spray dried powders. The lack of wall fissures or porosity on the
particles surface indicates complete coverage of the wall material over the core, confirming the
high EE values. In general, microparticles revealed higher oxidative stability than pure green
coffee oil. Thereby, the microencapsulation process using modified starches with maltodextrin
has promoted higher stability of the oil. Regarding the oxidative stability and EE, the highest
response was obtained from microparticles made by the mixture modified starch and
maltodextrin.
Besides corn syrup, modified starch and maltodextrin, gum arabic was individually used as
encapsulating agent for microencapsulation of roasted coffee oil. Frascareli et al., 2012
evaluated the influence of process conditions on the microencapsulation of coffee oil (Coffea
arabica) by spray drying using gum arabic and oil concentration (10%-30%) was the variable that
most affected encapsulation efficiency. However, total solid concentration (10%-30%) and inlet
air temperature (150-190 °C) also showed some influence in the obtained results. Both,
encapsulation efficiency and oil retention were negatively influenced by oil concentration and
inlet air temperature, and positively affected by total solid content. The higher the oil
concentration, the lower the encapsulation efficiency and the same behavior was observed for
the inlet air temperature. Higher the oil concentration the lower amount of gum Arabic
available to provide a structural matrix to keep the oil droplets encapsulated, decreasing the
encapsulation efficiency. The decrease in the encapsulation efficiency with the increase of
temperature could be related to the fact that high temperatures promote a faster drying of the
Chapter 2 – State of the Art
21
external area, as compared to the internal one, creating cracks in the particle wall, resulting in
oil release. On the other hand, particles produced with higher solid content presented higher
encapsulation efficiency. Encapsulation efficiency varied from 48% to 82% and the best result
was reported to particles produced from emulsions with higher solid content (25%-30%), lower
oil concentration (10%-15%) and lower drying temperatures (150-170 °C). Besides
encapsulation efficiency, also particle size distribution can be influenced by the conditions
previously mentioned. The increase in total solid content resulted in larger particle size, while
the increase in the oil concentration resulted in smaller particles. This can be explained by the
viscosity of the feed emulsion, which increased with solid concentration and decreased with the
increase of oil concentration. Higher the emulsion viscosity, larger are the atomized droplets
and, therefore, larger the powder particles. Particle mean diameter varied from 7.88 µm to
13.13 µm and their evaluation with respect to oxidative stability showed good results during
storage at room temperature (25 °C), but not at 60 °C. However, at this temperature, pure oil
presented higher lipid oxidation than encapsulated, confirming the protective effect of
microencapsulation on the oxidative stability of the oil and, consequently, in the increase of it
shelf-life.
Regarding the few studies about microencapsulation of chlorogenic acid, different wall
materials and different microencapsulation techniques were suggested until now (Table 4).
Ramírez-Ambrosi et al., 2014 for example, evaluated β-cyclodextrin nanosponges (β-CD NS) as
encapsulating agent for inclusion complexation of polyphenols found in apples, where
chlorogenic acid was included. In their study, the highest encapsulation efficiency of chlorogenic
acid (77.5%) was obtained with nanosponges of hexamethylene diisocyanate (HDI) in a 1:8 ratio
and in vitro dissolution studies confirmed the hydrophilic behavior of the this polyphenolic
compound. Taking into account the results, chlorogenic acid was successfully encapsulated by
β-CD NS with a high degree of retention and protection, enhancing it availability for formulation
of functional foods or food supplements.
On the other hand, the ability to form complexes of chlorogenic acid with amylose using
conventional hydrothermal method was also investigated by Lorentz et al., 2012. Liophilization
was used in order to improve encapsulation method and, once that was required heating to 90
°C to form complexes, chlorogenic acid and its derivative (4-O-palmitoyl chlorogenic acid) were,
among others, evaluated for thermal stability through UV-Vis spectrophotometry. The UV-vis
spectra before and after heating to 90 °C revealed that no change was observed, proving that
chlorogenic acid was stable at this temperature. As similar results were obtained for 4-O-
palmitoyl chlorogenic acid, amylose complexation formation proved to be suitable for
chlorogenic acid and for 4-O-palmitoyl chlorogenic acid encapsulation.

Chapter 2 – State of the Art
22
Yeast cells (Saccharomyces cerevisiae) were another option presented by Qi et al., 2010 to
encapsulate chlorogenic acid. The optimal encapsulation was obtained for 6 h at 40 °C and 3:1
core material/wall material ratio (g/g) in 6 mL of distilled water and corresponded to a
maximum encapsulation efficiency of 18.9%. Infrared spectral analysis indicated the
disappearance of characteristic function groups of chlorogenic acid and fluorescence
microscopic studies revealed that the microcapsules were spherical in shape. The similar
retention time and UV-Vis profiles between unmicroencapsulated and microencapsulated
chlorogenic acid were found through HPLC analysis and results suggested that chlorogenic acid
was successfully encapsulated and no significant chemical changes occurred during the
encapsulation process.
Studies concerning the potential of encapsulation for controlled delivery of CGAs are even
less than those reported just for its microencapsulation. Nallamuthu et al., 2014 and Shi et al.,
2007 were, to the best of our knowledge, the only authors reporting studies with this purpose.
As Qi et al., 2010, Shi et al., 2007 also investigated microencapsulation of chlorogenic acid (CGA)
in yeast cells (S. cerevisiae). In their study, the obtained microparticles were tested for in vitro
release of CGA and the release profile of yeast encapsulated chlorogenic acid was evaluated in
HCl (pH 1.2), in double-distilled water and in phosphate buffer (pH 7.4) in order to simulate
stomach and intestine conditions, respectively. Results showed that the release rate of
chlorogenic acid in simulated gastric fluid (pH 1.2) was the highest, followed by the phosphate
buffer (pH 7.4). Besides that, release profiles also showed that more than 95% of chlorogenic
acid was released within 2 h in HCl, and the complete release was achieve after 5 h.
In Nallamuthu et al., 2014 study, chlorogenic acid (CGA) was microencapsulated into
chitosan nanoparticles by ionic gelation method and exhibited, through scanning electron
microscopy (SEM), a size of 210 nm and a regular, spherical shape distribution. The release
profile of CGA from the obtained chitosan nanoparticles was investigated at 37 °C over a period
of 100h and 0.1 M HCl and PBS were also used to simulate stomach and intestine conditions.
Results revealed a controlled release pattern characterized by a fast initial release (25%) during
the first 10 h, followed by slower and continuous release (69%) till 100 h. In the same period of
time, the release of CGA was faster in PBS than in HCl.
As it is possible to see, all the studies reported for microencapsulation of chlorogenic acid
used different microencapsulation techniques and different wall materials. Different results
presented for morphology and particle size, encapsulation efficiency and controlled release can
be related with these differences. Considering the interest of sodium alginate and chitosan as
encapsulating agent (Chapter 1) and spray drying as encapsulation technique, the study of the
Chapter 2 – State of the Art
23
release of chlorogenic acid from sodium alginate and modified chitosan microparticles prepared
by spray drying prove to be very important.
Chapter 2 – State of the Art
24
n.a.: Not available; β-CD: β-cyclodextrin; HMDI: Hexamethylene diisocyanate; HPLC: High Performance Liquid Chromatography.
Compound Compound
origin Microencapsulation
technique Wall material
Encapsulation efficiency (EE) (%)
Particle size
Particle shape
Analytical method Results References
Chlorogenic acid (CGA) n.a. Ionic gelation Chitosan 59
~250 nm
Spherical HPLC
-Controlled release profile and preserved antioxidant activity under in vitro conditions; - Higher heat stability; - Better delivery of CGA. - Shape of nanoparticles presented to be homogeneous and with smooth surface.
Nallamuthu et al. 2014
Chlorogenic acid (CGA) Apple Inclusion complexation β-CD
nanosponges 78 n.a. n.a.
UV-Vis spectrophotometry
-Successful encapsulation of chlorogenic acid within β-CD NS (high degree of retention and protection); -Enhancement of CGA bioavailability.
Ramírez-Ambrosi et al.2014
Chlorogenic acid (CGA)
n.a. n.a. S. cerevisiae
cells * 19 n.a. Spherical
HPLC
UV-Vis spectrophotometry
- Successful encapsulation of CGA; - No significant chemical changes on CGA. Qi et al. 2010
Chlorogenic acid (CGA)
n.a. Freeze-drying S. cerevisiae
cells ≤13 n.a. n.a. HPLC-DAD
-Yeast encapsulation (EE %) enhanced by plasmolysis off cells and increased CGA purity (5, 85, and 98 %); -Encapsulation increased : (1) Storage stability of CGA; (2) CGA release: Simulated Gastric Fluid (SGF)> phosphate buffer > water.
Shi et al. 2007
Neochlorogenic acid and 4-O-palmitoyl chlorogenic acid
n.a. Liophilization and
amylose complexation Amylose n.a. n.a. Variable
UV spectrophotometry
-Thermal stability of CGA (90 °C); -Thermal stability of 4-Opalmitoyl chlorogenic acid (90 °C); -No alteration or hydrolyzation of 4-Opalmitoyl chlorogenic acid during amylose complex formation; - Effective interactions between amylose and 4-C-palmitoyl chlorogenic acid.
Lorentz et al. 2012
Table 4 - Overview on microencapsulation techniques applied to chlorogenic acids.
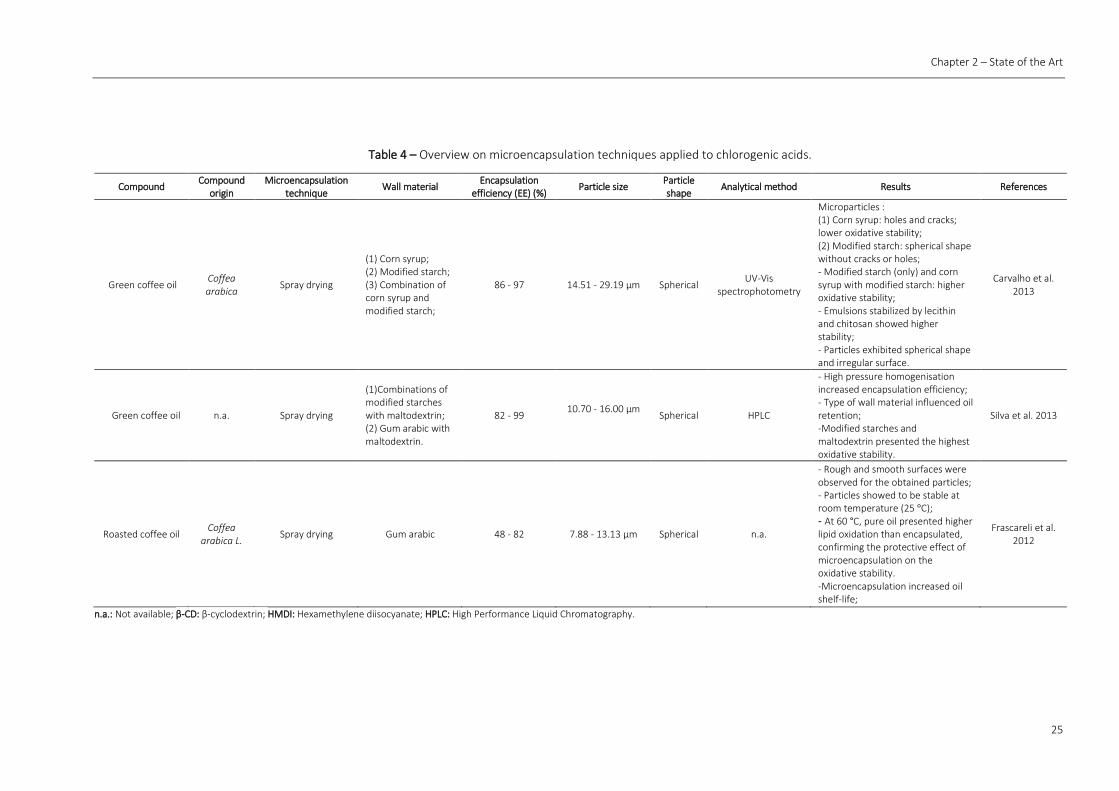
Chapter 2 – State of the Art
25
Compound Compound
origin Microencapsulation
technique Wall material
Encapsulation efficiency (EE) (%)
Particle size Particle shape
Analytical method Results References
Green coffee oil Coffea arabica
Spray drying
(1) Corn syrup; (2) Modified starch; (3) Combination of corn syrup and modified starch;
86 - 97 14.51 - 29.19 μm Spherical UV-Vis
spectrophotometry
Microparticles : (1) Corn syrup: holes and cracks; lower oxidative stability; (2) Modified starch: spherical shape without cracks or holes; - Modified starch (only) and corn syrup with modified starch: higher oxidative stability; - Emulsions stabilized by lecithin and chitosan showed higher stability; - Particles exhibited spherical shape and irregular surface.
Carvalho et al. 2013
Green coffee oil n.a. Spray drying
(1)Combinations of modified starches with maltodextrin; (2) Gum arabic with maltodextrin.
82 - 99 10.70 - 16.00 μm
Spherical HPLC
- High pressure homogenisation increased encapsulation efficiency; - Type of wall material influenced oil retention; -Modified starches and maltodextrin presented the highest oxidative stability.
Silva et al. 2013
Roasted coffee oil Coffea
arabica L. Spray drying Gum arabic 48 - 82 7.88 - 13.13 μm Spherical n.a.
- Rough and smooth surfaces were observed for the obtained particles; - Particles showed to be stable at room temperature (25 °C); - At 60 °C, pure oil presented higher lipid oxidation than encapsulated, confirming the protective effect of microencapsulation on the oxidative stability. -Microencapsulation increased oil shelf-life;
Frascareli et al. 2012
n.a.: Not available; β-CD: β-cyclodextrin; HMDI: Hexamethylene diisocyanate; HPLC: High Performance Liquid Chromatography.
Table 4 – Overview on microencapsulation techniques applied to chlorogenic acids.

27
Chapter 3
Material and Methods
3.1 Materials
3.1.1 Standards and Reagents
All reagents used were of analytical grade purity. Acetonitrile (HPLC gradient grade) was
obtained from VWR (Prolabo) (Leuven, Belgium). Citric acid was supplied from Merck
(Germany). Filtered water used for HPLC analysis was prepared by vacuum purification through
0.45 μm Nylon 66 filter membranes.
Chlorogenic acid standard (3-caffeoylquinic acid, C16H18O9, CAS: 327-97-9) (≥ 98% purity) was
acquired from Sigma-Aldrich Chemical Co. (MO, USA). Sodium alginate (alginic acid, sodium salt)
(180947-100g) was obtained from Sigma Aldrich Chemical Co. (USA) and modified chitosan
(pharmaceutical grade water-soluble chitosan) from China Eastar Group (Dong Chen) Co., Ltd.
(Batch no. SH20091010). Modified chitosan (water-soluble) was produced by carboxylation and
had a deacetylation degree of 96.5% and a viscosity of 5mPa.s-1 (1%, 25 °C).
Deionised water was obtained in the laboratory using MilliporeTM water purification
equipment (Massachusetts, USA).
3.1.2 Standards preparation
For HPLC analysis, a stock solution with a concentration of 400 mg.L-1 of chlorogenic acid (3-
CQA) was prepared by adding 4 mg of 3-CQA into 10 mL of distilled water. The resulting solution
was used to perform 12 calibration standards ranging concentration levels from 1 to 400 mg.L-1.
Since to obtain a linear response it was necessary that the absorbance values were not
above 1 AU, a new stock solution with a concentration of 15 mg.L-1 of chlorogenic acid was
prepared by adding 0.75 mg of 3-CQA in 50 mL of distilled water. Therefore, the absorbance of
the new calibration curve was within the range of UV-Vis spectrophotometer. For this purpose,
7 calibration standards were prepared in a concentration range of 0.5-15 mg.L-1. Standards and
stock solutions were stored at -22 °C until analysis.
Chapter 3 – Materials and Methods
28
Validation of both analytical methods was investigated through parameters such as linearity,
limit of detection (LOD), limit of quantification (LOQ), precision (intra-day and inter-day) and
sensitivity.
3.1.3 Equipment
The instrumental analysis of chlorogenic acid (3-CQA) was performed on Merck Hitachi Elite
LaChromatogragh (Tokyo, Japan) with a quaternary system of pumping (L-2130) which is
equipped with LiChroCART® RP-18 end-capped (250 mm x 4 mm, 5 μm) column attached to a
guard column (4 mm x 4 mm, 5 μm) of the same type and L-2200 auto sampler with L-2455 UV-
Vis spectrophotometry diode array detector. EZChrom Elite 3.1.6 software was used for data
acquisition and peak integration. The pH of mobile phase was controlled by a pH meter (pH
Meter GLP 21, Crison).
A spectrophotometer UV-Vis V-530 (Jasco) was also used for analysis of 3-CQA.
Microencapsulation was performed using a BÜCHI B-290 spray dryer (Flawil, Switzerland).
3.2 Methods
3.2.1 High Performance Liquid Chromatography (HPLC)
Detection and quantification of loaded chlorogenic acid (3-CQA) in water at normal pH (5.6)
was performed isocratically through a Merck Hitachi Elite LaChromatogragh (section 3.1.3) with
a mobile phase composed by 90 % eluent A: 10 mM citric acid solution (acidity adjusted to pH
2.6) and 10% eluent B: acetonitrile. The injection volume was 10 µL and the analysis was
performed with a flow rate of 1 mL.min-1 at room temperature, over 17 min. The maximum
absorbance for the analyzed compound was 325 nm.
Distilled water was filtered through 0.45 µm nylon filter membranes and both phases were
degassed with helium (99.995%) over 30 min (each liter). The same was done for all washing
solutions.
3.2.2 UV-Vis Spectrophotometry
Due to the clog of the chromatographic column during detection and quantification of the
loaded chlorogenic acid from sodium alginate microparticles, UV–Vis spectrophotometry was
used as another method for quantitative analysis of this compound. The amount of loaded
chlorogenic acid was determined in water at two different pH values (pH 5.6 and 2.0). For that,
two high precision cells of quartz (Hellma Analytics) were used. Before measurement, each one
of these two cells was filled with 1 mL of water with pH 5.6 or pH 2, depending on the case, and
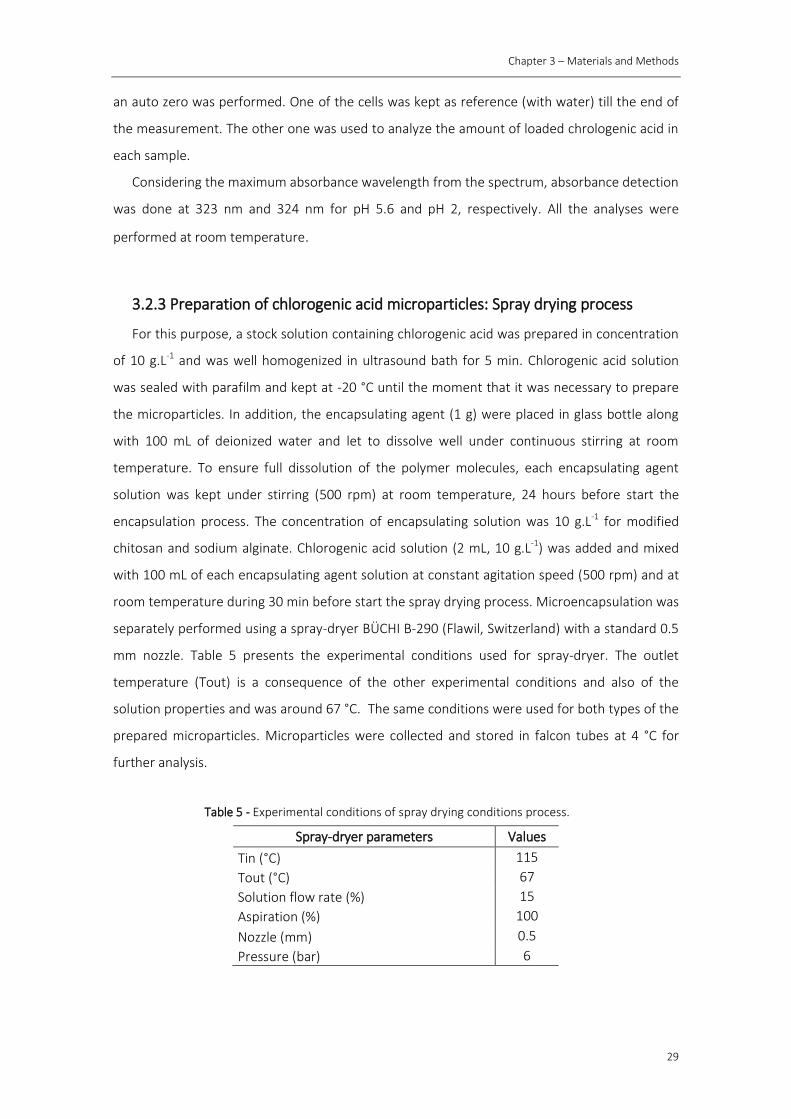
Chapter 3 – Materials and Methods
29
an auto zero was performed. One of the cells was kept as reference (with water) till the end of
the measurement. The other one was used to analyze the amount of loaded chrologenic acid in
each sample.
Considering the maximum absorbance wavelength from the spectrum, absorbance detection
was done at 323 nm and 324 nm for pH 5.6 and pH 2, respectively. All the analyses were
performed at room temperature.
3.2.3 Preparation of chlorogenic acid microparticles: Spray drying process
For this purpose, a stock solution containing chlorogenic acid was prepared in concentration
of 10 g.L-1 and was well homogenized in ultrasound bath for 5 min. Chlorogenic acid solution
was sealed with parafilm and kept at -20 °C until the moment that it was necessary to prepare
the microparticles. In addition, the encapsulating agent (1 g) were placed in glass bottle along
with 100 mL of deionized water and let to dissolve well under continuous stirring at room
temperature. To ensure full dissolution of the polymer molecules, each encapsulating agent
solution was kept under stirring (500 rpm) at room temperature, 24 hours before start the
encapsulation process. The concentration of encapsulating solution was 10 g.L-1 for modified
chitosan and sodium alginate. Chlorogenic acid solution (2 mL, 10 g.L-1) was added and mixed
with 100 mL of each encapsulating agent solution at constant agitation speed (500 rpm) and at
room temperature during 30 min before start the spray drying process. Microencapsulation was
separately performed using a spray-dryer BÜCHI B-290 (Flawil, Switzerland) with a standard 0.5
mm nozzle. Table 5 presents the experimental conditions used for spray-dryer. The outlet
temperature (Tout) is a consequence of the other experimental conditions and also of the
solution properties and was around 67 °C. The same conditions were used for both types of the
prepared microparticles. Microparticles were collected and stored in falcon tubes at 4 °C for
further analysis.
Spray-dryer parameters Values
Tin (°C) 115
Tout (°C) 67
Solution flow rate (%) 15
Aspiration (%) 100
Nozzle (mm) 0.5
Pressure (bar) 6
Table 5 - Experimental conditions of spray drying conditions process.

Chapter 3 – Materials and Methods
30
3.2.4 Characterization of chlorogenic acid microparticles
The obtained microcapsules were characterized in terms of particle size (µm), shape and
product yield (%).
3.2.4.1 Product yield (%)
Product yield (%) was separately measured for each microencapsulation experiment and it
was expressed as the ratio of the mass of powder (microparticles) obtained at the spray-dryer
output and the solid content of the initial infeed solution.
3.2.4.2 Particle size distribution
The size distribution of chlorogenic acid (3-CQA) microparticles produced with sodium
alginate and modified chitosan were individually evaluated by laser granulometry using a
Coulter Counter-LS 230 Particle Size Analyser (Miami, FL, USA) equipped with small volume plus.
Each small powder sample was dispersed in ethanol (Aga, 96%) and ultrasound-irradiated over
10 s to avoid particles agglomeration. Characterization was done by number and volume
average and the results were obtained as an average of two 60 s runs.
3.2.4.3 Scanning Electron Microscopy (SEM) analysis
The morphological analysis of the obtained microparticles was performed by Scanning
Electron Microscopy, SEM (Fei Quanta 400 FEG ESEM/EDAX Pegasus X4M). Samples were
coated with gold by pulverization under vacuum in a Jeol JFC 100 apparatus and analyzed by
SEM for surface structure observation. All analyses were performed at Centro de Materiais da
Universidade de Porto (CEMUP).
3.2.5 Controlled release studies of chlorogenic acid (3-CQA)
The release profile of chlorogenic acid (3-CQA) from microparticles prepared with two
different wall materials (sodium alginate and modified chitosan) was investigated in aqueous
solutions at two different pH values (5.6 and 2). HCl was added to distilled water under
continuous stirring until achieve the pH around 2.0. Another solution for studying the controlled
release was normal distilled water with a pH of 5.6. Microparticles (3 mg) were suspended in 1.5
mL of aqueous solution at pH 2.0 or 5.6 being continuously stirred (60 rpm) with a small magnet
at room temperature. Samples were done in duplicated and were measured after defined time
intervals: 0 min, 1 min, 2 min, 5 min, 10 min, 20 min, 30 min, 45 min, 1h, 2h, 4h, 6h and 24h.
The released amount of chlorogenic acid was also evaluated in duplicate over the specific time
using HPLC-DAD or UV-Vis spectrophotometry methods.
Chapter 3 – Materials and Methods
31
With regards to HPLC-DAD, samples were injected directly after two times filtration through
0.45 μm and 0.22 μm PTFE filters (OlimPeak, Teknokroma). Filtered solutions were analyzed
according to chromatographic conditions explained previously.
Samples analyzed by UV-Vis spectrophotometry were prepared at the same time intervals.
However, in order to keep the absorbance of the real sample in the absorbance range of the
UV-Vis spectrophotometry (0-1 AU) samples were prepared with 3 mg of microparticles in 4.5
mL of aqueous solution at two different pH (5.6 and 2). 1 mL of the prepared samples was
analyzed using UV high precision cells made of quartz (Hellma Analytics). Each analysis was
performed at 323-324 nm and room temperature, over 30 s.

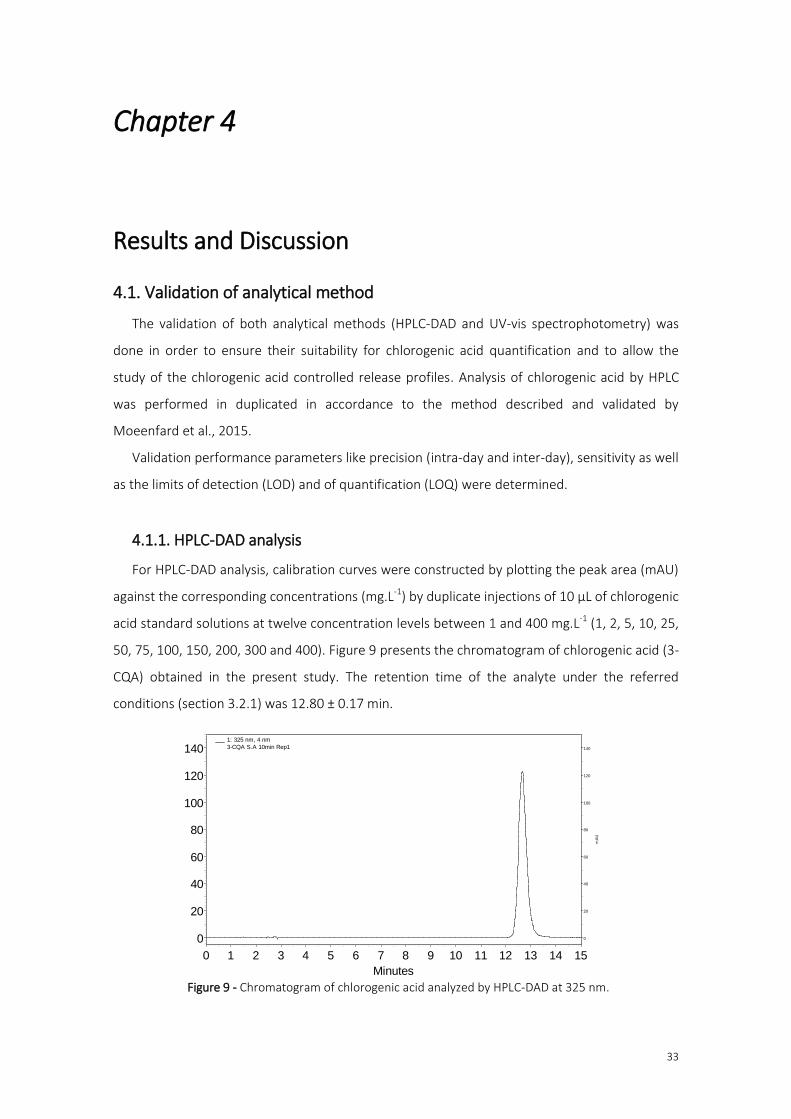
33
Chapter 4
Results and Discussion
4.1. Validation of analytical method
The validation of both analytical methods (HPLC-DAD and UV-vis spectrophotometry) was
done in order to ensure their suitability for chlorogenic acid quantification and to allow the
study of the chlorogenic acid controlled release profiles. Analysis of chlorogenic acid by HPLC
was performed in duplicated in accordance to the method described and validated by
Moeenfard et al., 2015.
Validation performance parameters like precision (intra-day and inter-day), sensitivity as well
as the limits of detection (LOD) and of quantification (LOQ) were determined.
4.1.1. HPLC-DAD analysis
For HPLC-DAD analysis, calibration curves were constructed by plotting the peak area (mAU)
against the corresponding concentrations (mg.L-1) by duplicate injections of 10 µL of chlorogenic
acid standard solutions at twelve concentration levels between 1 and 400 mg.L-1 (1, 2, 5, 10, 25,
50, 75, 100, 150, 200, 300 and 400). Figure 9 presents the chromatogram of chlorogenic acid (3-
CQA) obtained in the present study. The retention time of the analyte under the referred
conditions (section 3.2.1) was 12.80 ± 0.17 min.
Minutes
0 1 2 3 4 5 6 7 8 9 10 11 12 13 14 15
mA
U
0
20
40
60
80
100
120
140
mA
U
0
20
40
60
80
100
120
140
1: 325 nm, 4 nm
3-CQA S.A 10min Rep1
Figure 9 - Chromatogram of chlorogenic acid analyzed by HPLC-DAD at 325 nm.
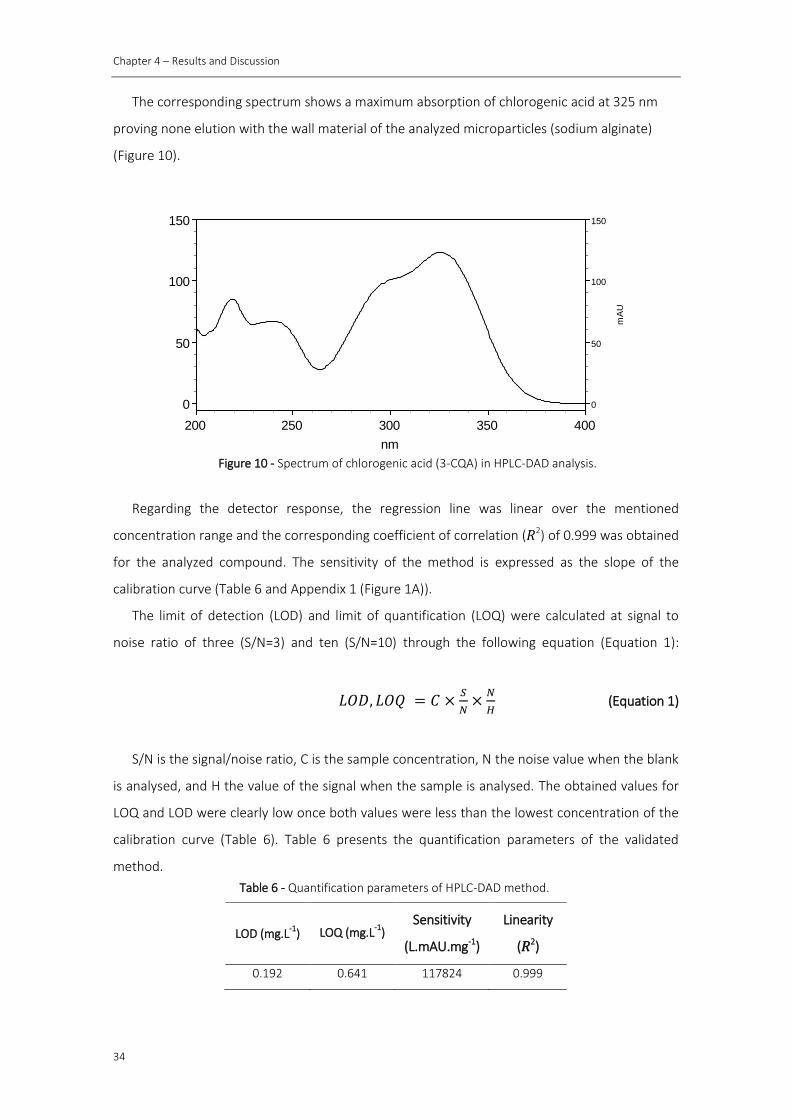
Chapter 4 – Results and Discussion
34
The corresponding spectrum shows a maximum absorption of chlorogenic acid at 325 nm
proving none elution with the wall material of the analyzed microparticles (sodium alginate)
(Figure 10).
Regarding the detector response, the regression line was linear over the mentioned
concentration range and the corresponding coefficient of correlation (𝑅2) of 0.999 was obtained
for the analyzed compound. The sensitivity of the method is expressed as the slope of the
calibration curve (Table 6 and Appendix 1 (Figure 1A)).
The limit of detection (LOD) and limit of quantification (LOQ) were calculated at signal to
noise ratio of three (S/N=3) and ten (S/N=10) through the following equation (Equation 1):
𝐿𝑂𝐷, 𝐿𝑂𝑄 = 𝐶 ×𝑆
𝑁×
𝑁
𝐻 (Equation 1)
S/N is the signal/noise ratio, C is the sample concentration, N the noise value when the blank
is analysed, and H the value of the signal when the sample is analysed. The obtained values for
LOQ and LOD were clearly low once both values were less than the lowest concentration of the
calibration curve (Table 6). Table 6 presents the quantification parameters of the validated
method.
LOD (mg.L-1
) LOQ (mg.L-1
) Sensitivity
(L.mAU.mg-1)
Linearity
(𝑅2)
0.192 0.641 117824 0.999
Figure 10 - Spectrum of chlorogenic acid (3-CQA) in HPLC-DAD analysis.
nm
200 250 300 350 400
mA
U
0
50
100
150
mA
U
0
50
100
150
12,66 Min
3-CQA S.A 10min Rep1
Table 6 - Quantification parameters of HPLC-DAD method.
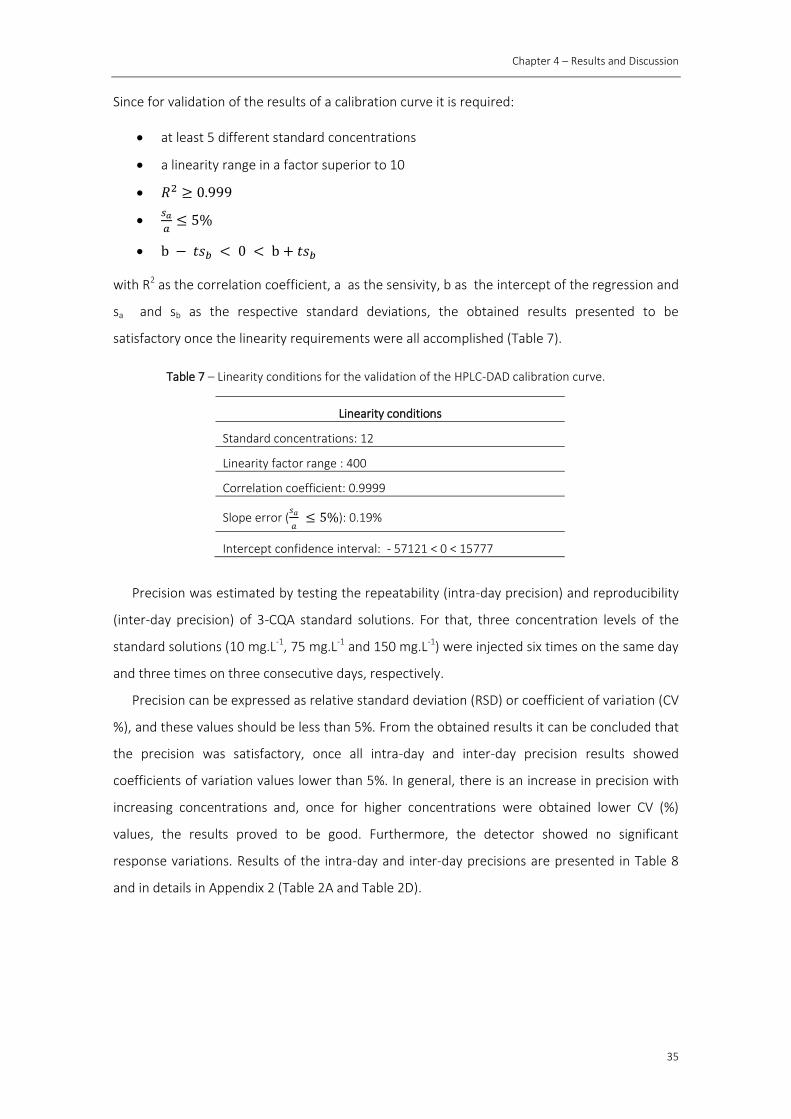
Chapter 4 – Results and Discussion
35
Since for validation of the results of a calibration curve it is required:
at least 5 different standard concentrations
a linearity range in a factor superior to 10
𝑅2 ≥ 0.999
𝑠𝑎
𝑎≤ 5%
b − 𝑡𝑠𝑏 < 0 < b + 𝑡𝑠𝑏
with R2 as the correlation coefficient, a as the sensivity, b as the intercept of the regression and
sa and sb as the respective standard deviations, the obtained results presented to be
satisfactory once the linearity requirements were all accomplished (Table 7).
Linearity conditions
Standard concentrations: 12
Linearity factor range : 400
Correlation coefficient: 0.9999
Slope error (𝑠𝑎
𝑎 ≤ 5%): 0.19%
Intercept confidence interval: - 57121 < 0 < 15777
Precision was estimated by testing the repeatability (intra-day precision) and reproducibility
(inter-day precision) of 3-CQA standard solutions. For that, three concentration levels of the
standard solutions (10 mg.L-1, 75 mg.L-1 and 150 mg.L-1) were injected six times on the same day
and three times on three consecutive days, respectively.
Precision can be expressed as relative standard deviation (RSD) or coefficient of variation (CV
%), and these values should be less than 5%. From the obtained results it can be concluded that
the precision was satisfactory, once all intra-day and inter-day precision results showed
coefficients of variation values lower than 5%. In general, there is an increase in precision with
increasing concentrations and, once for higher concentrations were obtained lower CV (%)
values, the results proved to be good. Furthermore, the detector showed no significant
response variations. Results of the intra-day and inter-day precisions are presented in Table 8
and in details in Appendix 2 (Table 2A and Table 2D).
Table 7 – Linearity conditions for the validation of the HPLC-DAD calibration curve.
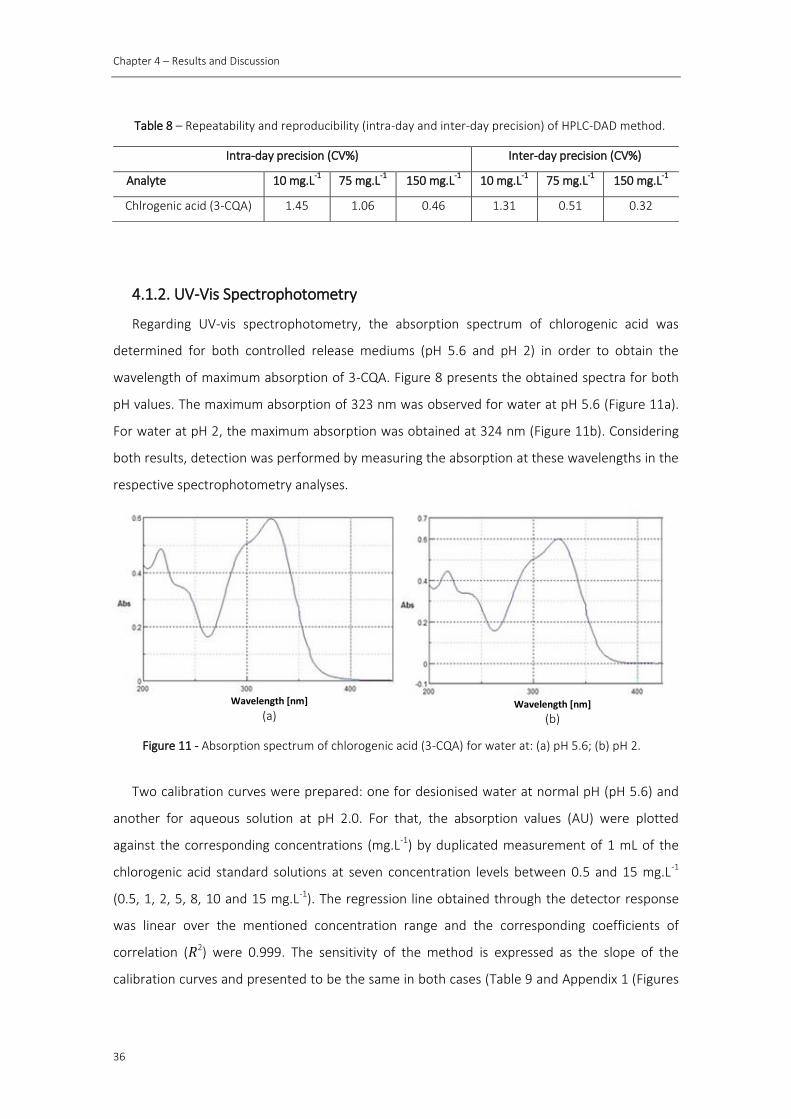
Chapter 4 – Results and Discussion
36
4.1.2. UV-Vis Spectrophotometry
Regarding UV-vis spectrophotometry, the absorption spectrum of chlorogenic acid was
determined for both controlled release mediums (pH 5.6 and pH 2) in order to obtain the
wavelength of maximum absorption of 3-CQA. Figure 8 presents the obtained spectra for both
pH values. The maximum absorption of 323 nm was observed for water at pH 5.6 (Figure 11a).
For water at pH 2, the maximum absorption was obtained at 324 nm (Figure 11b). Considering
both results, detection was performed by measuring the absorption at these wavelengths in the
respective spectrophotometry analyses.
Two calibration curves were prepared: one for desionised water at normal pH (pH 5.6) and
another for aqueous solution at pH 2.0. For that, the absorption values (AU) were plotted
against the corresponding concentrations (mg.L-1) by duplicated measurement of 1 mL of the
chlorogenic acid standard solutions at seven concentration levels between 0.5 and 15 mg.L-1
(0.5, 1, 2, 5, 8, 10 and 15 mg.L-1). The regression line obtained through the detector response
was linear over the mentioned concentration range and the corresponding coefficients of
correlation (𝑅2) were 0.999. The sensitivity of the method is expressed as the slope of the
calibration curves and presented to be the same in both cases (Table 9 and Appendix 1 (Figures
Intra-day precision (CV%) Inter-day precision (CV%)
Analyte 10 mg.L-1
75 mg.L-1
150 mg.L-1 10 mg.L
-1 75 mg.L
-1 150 mg.L
-1
Chlrogenic acid (3-CQA) 1.45 1.06 0.46 1.31 0.51 0.32
Wavelength [nm]
(a) Wavelength [nm]
(b)
Figure 11 - Absorption spectrum of chlorogenic acid (3-CQA) for water at: (a) pH 5.6; (b) pH 2.
Table 8 – Repeatability and reproducibility (intra-day and inter-day precision) of HPLC-DAD method.
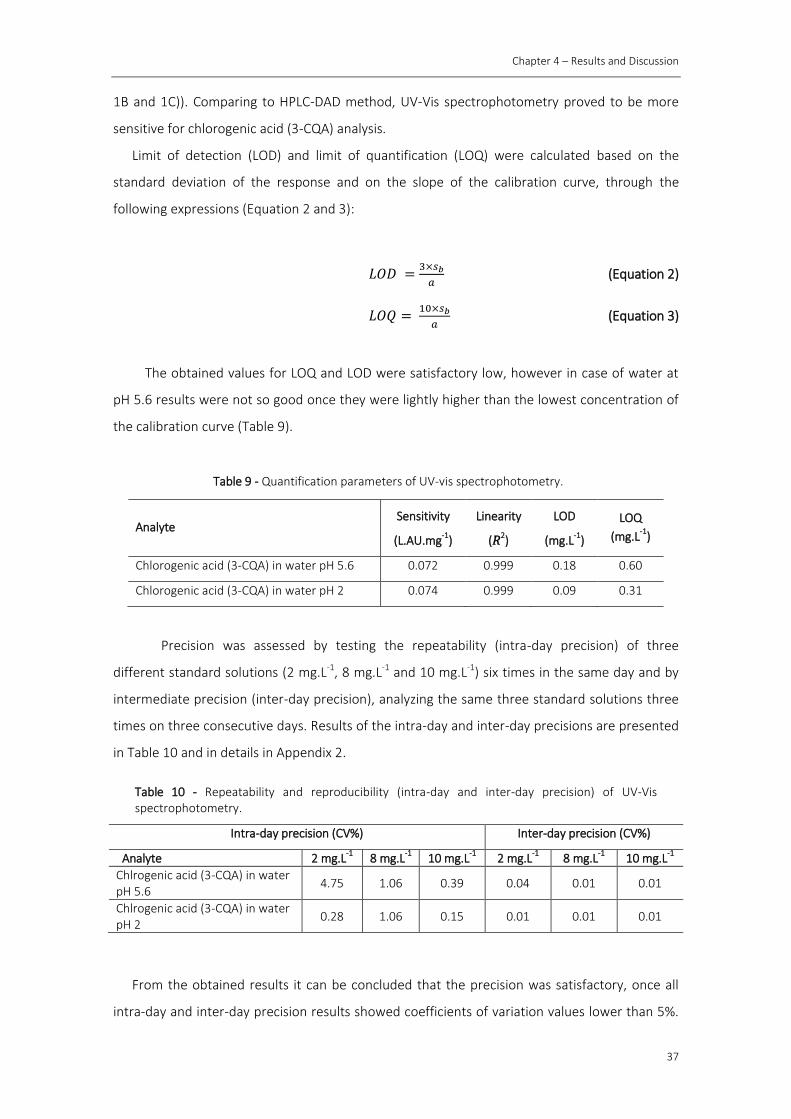
Chapter 4 – Results and Discussion
37
1B and 1C)). Comparing to HPLC-DAD method, UV-Vis spectrophotometry proved to be more
sensitive for chlorogenic acid (3-CQA) analysis.
Limit of detection (LOD) and limit of quantification (LOQ) were calculated based on the
standard deviation of the response and on the slope of the calibration curve, through the
following expressions (Equation 2 and 3):
𝐿𝑂𝐷 =3×𝑠𝑏
𝑎 (Equation 2)
𝐿𝑂𝑄 = 10×𝑠𝑏
𝑎 (Equation 3)
The obtained values for LOQ and LOD were satisfactory low, however in case of water at
pH 5.6 results were not so good once they were lightly higher than the lowest concentration of
the calibration curve (Table 9).
Precision was assessed by testing the repeatability (intra-day precision) of three
different standard solutions (2 mg.L-1, 8 mg.L-1 and 10 mg.L-1) six times in the same day and by
intermediate precision (inter-day precision), analyzing the same three standard solutions three
times on three consecutive days. Results of the intra-day and inter-day precisions are presented
in Table 10 and in details in Appendix 2.
From the obtained results it can be concluded that the precision was satisfactory, once all
intra-day and inter-day precision results showed coefficients of variation values lower than 5%.
Analyte Sensitivity
(L.AU.mg-1
)
Linearity
(𝑅2)
LOD
(mg.L-1
)
LOQ
(mg.L-1
)
Chlorogenic acid (3-CQA) in water pH 5.6 0.072 0.999 0.18 0.60
Chlorogenic acid (3-CQA) in water pH 2 0.074 0.999 0.09 0.31
Intra-day precision (CV%) Inter-day precision (CV%)
Analyte 2 mg.L-1
8 mg.L-1
10 mg.L-1 2 mg.L
-1 8 mg.L
-1 10 mg.L
-1 Chlrogenic acid (3-CQA) in water pH 5.6
4.75 1.06 0.39 0.04 0.01 0.01
Chlrogenic acid (3-CQA) in water pH 2
0.28 1.06 0.15 0.01 0.01 0.01
Table 10 - Repeatability and reproducibility (intra-day and inter-day precision) of UV-Vis spectrophotometry.
Table 9 - Quantification parameters of UV-vis spectrophotometry.
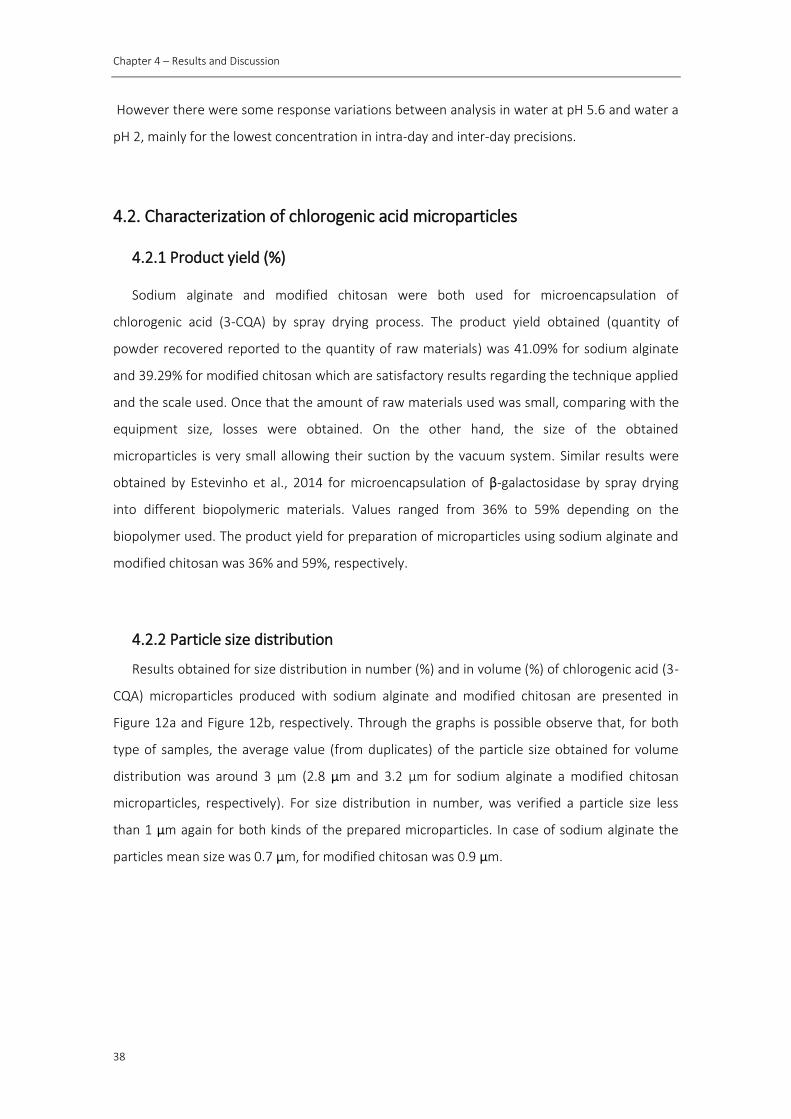
Chapter 4 – Results and Discussion
38
However there were some response variations between analysis in water at pH 5.6 and water a
pH 2, mainly for the lowest concentration in intra-day and inter-day precisions.
4.2. Characterization of chlorogenic acid microparticles
4.2.1 Product yield (%)
Sodium alginate and modified chitosan were both used for microencapsulation of
chlorogenic acid (3-CQA) by spray drying process. The product yield obtained (quantity of
powder recovered reported to the quantity of raw materials) was 41.09% for sodium alginate
and 39.29% for modified chitosan which are satisfactory results regarding the technique applied
and the scale used. Once that the amount of raw materials used was small, comparing with the
equipment size, losses were obtained. On the other hand, the size of the obtained
microparticles is very small allowing their suction by the vacuum system. Similar results were
obtained by Estevinho et al., 2014 for microencapsulation of β-galactosidase by spray drying
into different biopolymeric materials. Values ranged from 36% to 59% depending on the
biopolymer used. The product yield for preparation of microparticles using sodium alginate and
modified chitosan was 36% and 59%, respectively.
4.2.2 Particle size distribution
Results obtained for size distribution in number (%) and in volume (%) of chlorogenic acid (3-
CQA) microparticles produced with sodium alginate and modified chitosan are presented in
Figure 12a and Figure 12b, respectively. Through the graphs is possible observe that, for both
type of samples, the average value (from duplicates) of the particle size obtained for volume
distribution was around 3 μm (2.8 μm and 3.2 μm for sodium alginate a modified chitosan
microparticles, respectively). For size distribution in number, was verified a particle size less
than 1 μm again for both kinds of the prepared microparticles. In case of sodium alginate the
particles mean size was 0.7 μm, for modified chitosan was 0.9 μm.
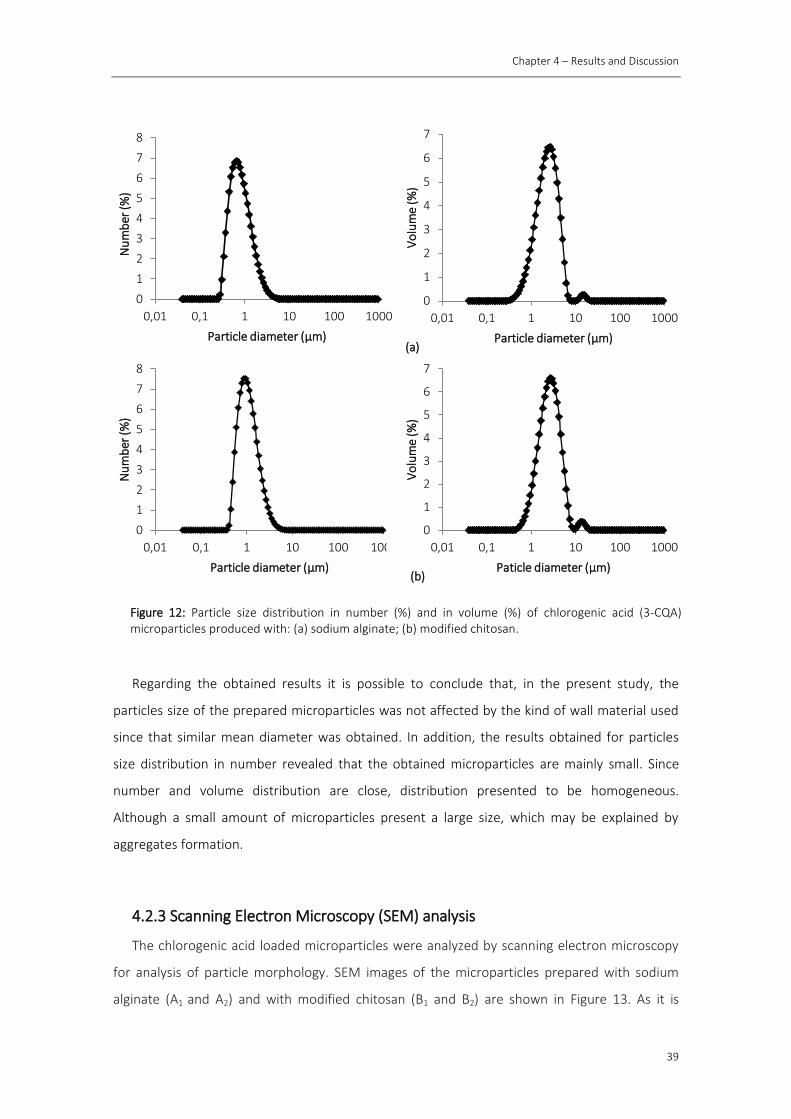
Chapter 4 – Results and Discussion
39
Regarding the obtained results it is possible to conclude that, in the present study, the
particles size of the prepared microparticles was not affected by the kind of wall material used
since that similar mean diameter was obtained. In addition, the results obtained for particles
size distribution in number revealed that the obtained microparticles are mainly small. Since
number and volume distribution are close, distribution presented to be homogeneous.
Although a small amount of microparticles present a large size, which may be explained by
aggregates formation.
4.2.3 Scanning Electron Microscopy (SEM) analysis
The chlorogenic acid loaded microparticles were analyzed by scanning electron microscopy
for analysis of particle morphology. SEM images of the microparticles prepared with sodium
alginate (A1 and A2) and with modified chitosan (B1 and B2) are shown in Figure 13. As it is
Figure 12: Particle size distribution in number (%) and in volume (%) of chlorogenic acid (3-CQA) microparticles produced with: (a) sodium alginate; (b) modified chitosan.
0
1
2
3
4
5
6
7
8
0,01 0,1 1 10 100 1000
Nu
mb
er (
%)
Particle diameter (μm)
0
1
2
3
4
5
6
7
0,01 0,1 1 10 100 1000
Vo
lum
e (%
)
Paticle diameter (µm) (b)
0
1
2
3
4
5
6
7
0,01 0,1 1 10 100 1000
Vo
lum
e (%
)
Particle diameter (µm)
0
1
2
3
4
5
6
7
8
0,01 0,1 1 10 100 1000
Nu
mb
er (
%)
Particle diameter (μm) (a)

Chapter 4 – Results and Discussion
40
possible to observe, spherical microparticles with a smooth surface were produced in both
cases. However, in the case of the sodium alginate microparticles their shape presented to be
not so regular than the microparticles prepared with modified chitosan.
Other authors have reported the same morphology for spray dried microparticles of sodium
alginate and modified chitosan (Estevinho et al., 2014).
4.3 Controlled release studies of chlorogenic acid (3-CQA)
The controlled release study of chlorogenic acid (3-CQA) from the obtained microparticles
was evaluated at two different pH values (pH 5.6 and pH 2). Thus, the release profile of sodium
alginate and modified chitosan microparticles was individually determined in aqueous solution
at pH 5.6 and pH 2 at room temperature, over 24h. Two methods, HPLC-DAD and UV-Vis
Figure 13: SEM images of the microparticles prepared with (A) sodium alginate and (B) modified chitosan. Amplification of (A1,B1) 10 000 and (A2,B2) 20 000 times, beam intensity (HV) of 1500 kV, distance between the sample and the lens (WD) around 10 mm.
A2 A1
B1 B2

Chapter 4 – Results and Discussion
41
spectrophotometry, were used for quantification of the loaded chlorogenic acid after each
defined time interval from the referred microparticles under the referred conditions.
4.3.1 HPLC-DAD
The instrumental analysis for chlorogenic acid quantification was firstly performed by the
HPLC-DAD method validated previously. Through this method it was possible to determine the
release profile of chlorogenic acid from sodium alginate microparticles in water at pH 5.6.
Figure 14 illustrates the obtained release profile in terms of percentage release (%) of
chlorogenic acid under the referred conditions.
As it is possible to observe, sodium alginate (SA) microparticles presented a fast release
pattern (99%) during the first 10 min, followed by a continuous release till 24h. This result is
consistent with what has been reported in the literature once that was referred that sodium
alginate is easily disintegrated under higher pH conditions (Yoo et al., 2006).
The same experiment was planned for chlorogenic acid release at pH 2. However due to
some properties of sodium alginate, such as viscosity, the stability of the chromatographic
0
20
40
60
80
100
120
0 200 400 600 800 1000 1200 1400 1600
Ch
loro
gen
ic a
cid
re
leas
e (%
)
Time (min)
3-CQA + Sodium alginate in water (pH 5.6)
0
20
40
60
80
100
120
0 10 20 30 40 50 60 70
Figure 14 - Release profile of 3-CQA (%) from sodium alginate microparticles in water at pH 5.6.
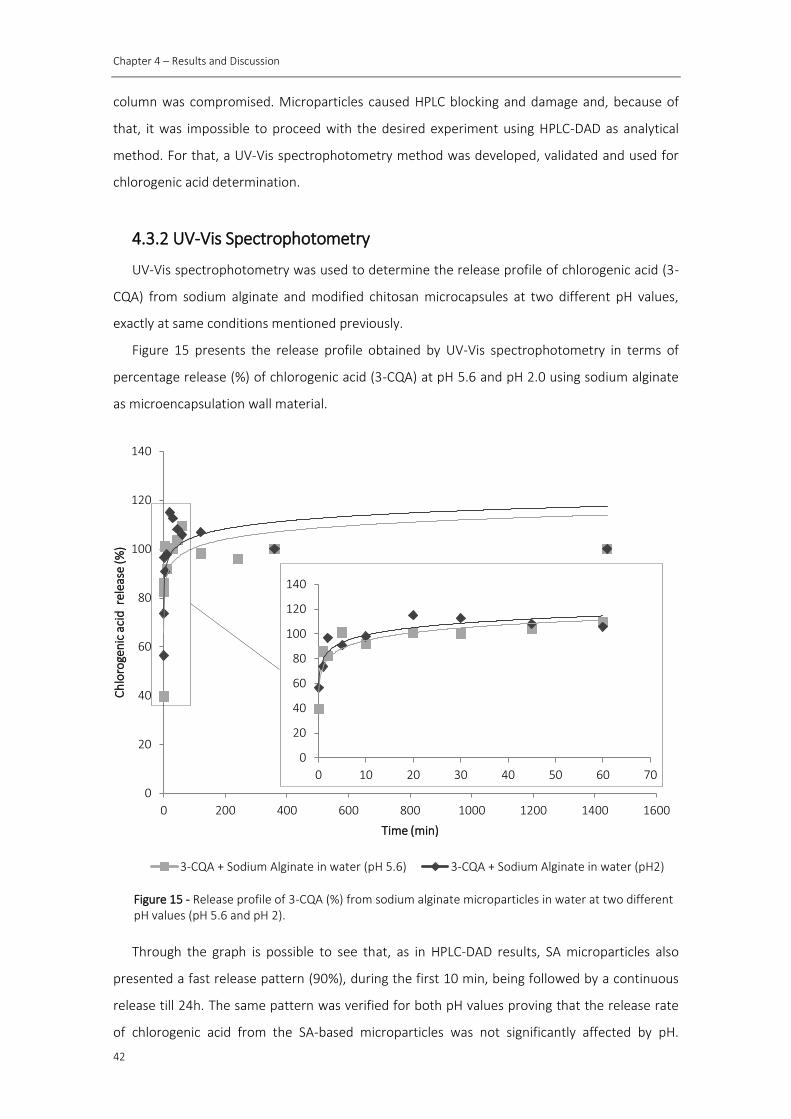
Chapter 4 – Results and Discussion
42
column was compromised. Microparticles caused HPLC blocking and damage and, because of
that, it was impossible to proceed with the desired experiment using HPLC-DAD as analytical
method. For that, a UV-Vis spectrophotometry method was developed, validated and used for
chlorogenic acid determination.
4.3.2 UV-Vis Spectrophotometry
UV-Vis spectrophotometry was used to determine the release profile of chlorogenic acid (3-
CQA) from sodium alginate and modified chitosan microcapsules at two different pH values,
exactly at same conditions mentioned previously.
Figure 15 presents the release profile obtained by UV-Vis spectrophotometry in terms of
percentage release (%) of chlorogenic acid (3-CQA) at pH 5.6 and pH 2.0 using sodium alginate
as microencapsulation wall material.
Through the graph is possible to see that, as in HPLC-DAD results, SA microparticles also
presented a fast release pattern (90%), during the first 10 min, being followed by a continuous
release till 24h. The same pattern was verified for both pH values proving that the release rate
of chlorogenic acid from the SA-based microparticles was not significantly affected by pH.
0
20
40
60
80
100
120
140
0 200 400 600 800 1000 1200 1400 1600
Ch
loro
gen
ic a
cid
rel
ease
(%
)
Time (min)
3-CQA + Sodium Alginate in water (pH 5.6) 3-CQA + Sodium Alginate in water (pH2)
0
20
40
60
80
100
120
140
0 10 20 30 40 50 60 70
Figure 15 - Release profile of 3-CQA (%) from sodium alginate microparticles in water at two different pH values (pH 5.6 and pH 2).
Chapter 4 – Results and Discussion
43
Regarding Yoo et al., 2006 study, sodium alginate was used as coating material for
microencapsulation of an antioxidant of a vitamin E category (α-tocopherol) by ionic gelation
and its in vitro releasing property proved to be relatively different. In the simulated gastric fluid
(0.05M HCl with 0.2% NaCl) the SA microcapsules release was less (28.8%) than when exposed
to a simulated intestinal fluid (0.05M phosphate buffer) where the amount of the released α-TP
was about 81.5%. The same behavior was reported by Kumar and Krishna, 2014 when sodium
alginate was used for encapsulation of an anti-diabetic drug (Vildagliptine) for sustained release
in three different dissolution mediums (pH 1.2, pH 6.8 and pH 7.4). In their study, the prepared
microspheres showed an increased drug release at higher pH (pH 7.4 and pH 6.8) than in lower
pH values (pH 1.2). Although sodium alginate has been reported as relatively stable at acidic pH
(pH 1.2) but easily disintegrated under mild alkali conditions (pH 7.4 and pH 6.8), in the present
study results revealed none interference of pH on the release rate of chlorogenic acid (3-CQA)
from SA-based microparticles.
Regarding the release profile of 3-CQA from microcapsules performed with modified
chitosan at two different pH values (pH 2 and pH 5.6), similar results were obtained (Figure 16).
Figure 16 - Release profile of 3-CQA (%) from modified chitosan microparticles in water at two different pH values (pH 5.6 and pH 2).
0
20
40
60
80
100
120
0 200 400 600 800 1000 1200 1400 1600
Ch
loro
gen
ic a
cid
re
leas
e (%
)
Time (min)
3-CQA + Modified Chitosan in water (pH 5.6) 3-CQA + Modified Chitosan in water (pH 2)
0
20
40
60
80
100
0 10 20 30 40 50 60 70
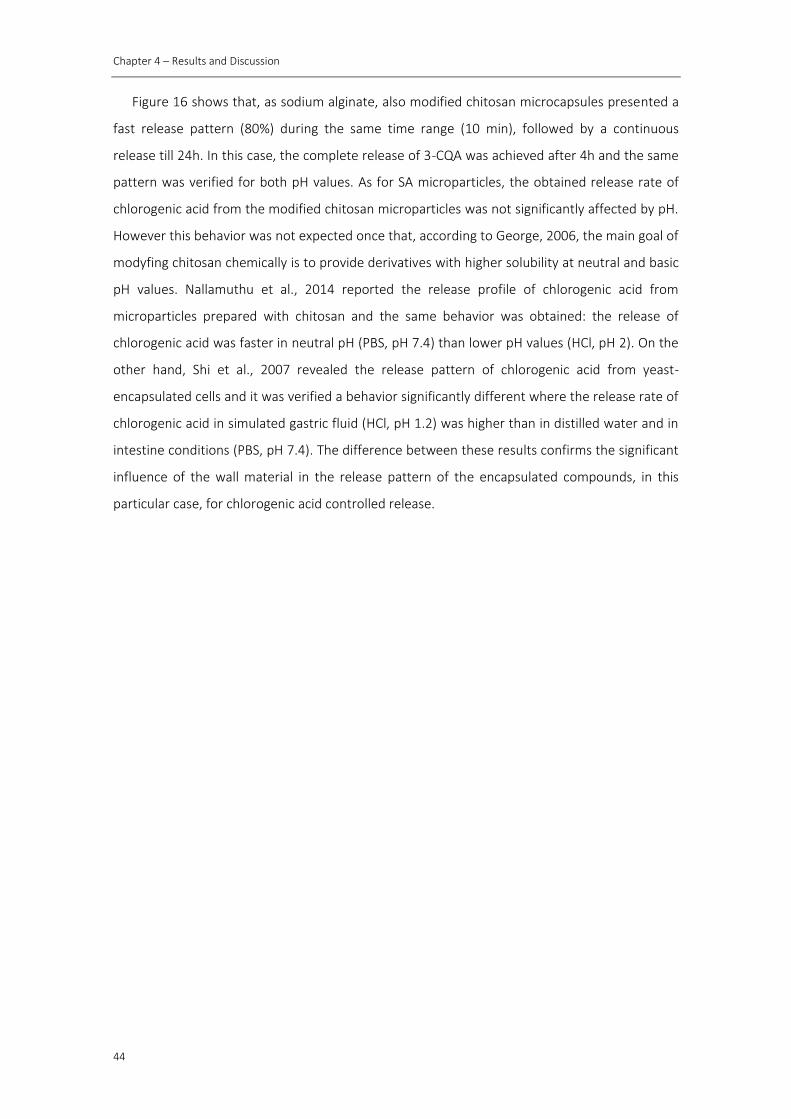
Chapter 4 – Results and Discussion
44
Figure 16 shows that, as sodium alginate, also modified chitosan microcapsules presented a
fast release pattern (80%) during the same time range (10 min), followed by a continuous
release till 24h. In this case, the complete release of 3-CQA was achieved after 4h and the same
pattern was verified for both pH values. As for SA microparticles, the obtained release rate of
chlorogenic acid from the modified chitosan microparticles was not significantly affected by pH.
However this behavior was not expected once that, according to George, 2006, the main goal of
modyfing chitosan chemically is to provide derivatives with higher solubility at neutral and basic
pH values. Nallamuthu et al., 2014 reported the release profile of chlorogenic acid from
microparticles prepared with chitosan and the same behavior was obtained: the release of
chlorogenic acid was faster in neutral pH (PBS, pH 7.4) than lower pH values (HCl, pH 2). On the
other hand, Shi et al., 2007 revealed the release pattern of chlorogenic acid from yeast-
encapsulated cells and it was verified a behavior significantly different where the release rate of
chlorogenic acid in simulated gastric fluid (HCl, pH 1.2) was higher than in distilled water and in
intestine conditions (PBS, pH 7.4). The difference between these results confirms the significant
influence of the wall material in the release pattern of the encapsulated compounds, in this
particular case, for chlorogenic acid controlled release.

45
Conclusions
In this study, sodium alginate and modified chitosan-loaded microparticles of chlorogenic
acid (3-CQA) were prepared by spray drying in order to enhance its stability and bioavailability
for possible food applications. The obtained microparticles were characterized by their particle
size and surface morphology and their controlled release profile was studied in aqueous
solution at two different pH values (pH 5.6 and pH 2). Methods for analytical detection and
quantification (HPLC-DAD and UV-Vis spectrophotometry) of chlorogenic acid were developed
and validated.
Results proved that chlorogenic acid was successfully encapsulated into sodium alginate and
modified chitosan using spray drying technique and a satisfactory product yield was obtained
for encapsulation in both wall materials (41.09% and 39.29% for sodium alginate and modified
chitosan, respectively).
All the parameters from validation of the analytical methods (HPLC-DAD and UV-
spectrophotometry) showed that both methods were sensitive and precise with low detection
and quantification limits. However, UV-Vis spectrophotometry proved to be more sensitive than
HPLC-DAD for detection and quantification of chlorogenic acid (3-CQA). Both methods were
used to investigate the release profile of chlorogenic acid from both types of microparticles:
sodium alginate and modified chitosan-loaded microparticles.
Controlled release profiles evaluated through UV-Vis spectrophotometry revealed a fast
release of chlorogenic acid (80%-90% after 10 min) from both wall materials at both pH values.
Although, comparing to sodium alginate microparticles, microparticles produced with modified
chitosan presented a slower release profile. Furthermore, it was also possible to see that the
release rate of chlorogenic acid (3-CQA) was not significantly affected by pH changes.
Both types of produced microparticles were small in size (3 µm) and presented a spherical
shape and smooth surface. However modified chitosan showed a more regular shape.
Collectively, these results suggest that microparticles synthesized by spray drying using
sodium alginate and modified chitosan as encapsulating agents can be used in food-matrices for
health benefits through effective release of chlorogenic acid.

47
Limitations and Future Work
Some limitations were faced during the development of this work. Availability of HPLC and
UV-spectrophotometer was one of the majors since these equipments were also been used by
other researchers in their projects. Furthermore, analysis through HPLC presented to be really
time consuming regarding the necessity to inject samples one by one (in duplicated) after the
defined time intervals for the controlled release studies together with a washing run of at least
20 min to clean the column between each single injection. Besides that, HPLC column blocking
by microparticles obliged to the development and validation of a new method for chlorogenic
acid quantitative determination, delaying all the results.
For future work it would be interesting attempt for a suitable extraction method for phenolic
compounds (including chlorogenic acids) from the most prominent species of coffee (Coffea
arabica and Coffea robusta) for further encapsulation. The obtained microparticles should be
characterized and analyzed in order to achieve their release profile and evaluate their
antioxidant activity. In vitro studies could also provide relevant information about the
therapeutic effects of chlorogenic acid microparticles regarding the antimicrobial activity
related to this phenolic compound. Furthermore, others encapsulating agents should be tested
for encapsulation of chlorogenic acids. More controlled release studies should be done,
particularly, in commercial food-matrices for real data acquisition.

49
Bibliography
Ascheri, D., Marquez, M., Martucci, E. (2003). Microencapsulação de Óleo Essencial de Laranja: Seleção de Material de Parede. Ciências e Tecnologias da Alimentação, Campinas, 23: 1-6. Anjani, K., Kailasapathy, K., Phillips, M. (2007). Microencapsulation of enzymes for potential application in acceleration of cheese ripening. International Dairy Journal, 17: 79-86. Anthony, F., Clifford, M.N., Noirot, M. (1993). Biochemical diversity in the genus Coffea L.: chlorogenic acids, caffeine and mozambioside contents. Genetic Resources and Crop Evolution, 40: 61-70. Ayelign, A. and Sabally, K. (2013). Determination of chlorogenic acids (CGA) in coffee beans using HPLC. American Journal of Research Communication, 1 (2): 78-91. Belay, A., Gholap, A.V. (2009). Characterization and determination of chlorogenic acids (CGA) in coffee beans by UV-Vis spectroscopy. African Journal of Pure and Applied Chemistry, 3 (11): 234-240. Betz, M. and Kulozik, U. (2011). Microencapsulation of bioactive bilberry anthocyanins by means of whey protein gels. 11th International Congress on Engineering and Food (ICEF11). Procedia Food Science, 1: 2047 – 2056. Bicchi, C.P., Binello, A.E., Pellegrino, G.M., Vanni, A.C. (1995). Characterization of green and roasted coffees through the chlorogenic acid fraction by HPLC-UV and principal component analysis. Journal of Agricultural and Food Chemistry, 43: 1549-1555. Braga, G.K. Determinação das especificações do processo de spray drying na obtenção de micropartículas biodegradáveis para a libertação sustentada de princípios ativos com aplicação odontológica. MsC Thesis, Universidade de São Paulo, 2005. Bu, H., Kjøniksen, A-L., Elgsaeter, A., Nystrom, B. (2006). Interaction of unmodified and hydrophobically modified alginate with sodium dodecyl sulfate in dilute aqueous solution Calorimetric, rheological, and turbidity studies. Colloids and Surfaces A: Physicochem. Eng. Aspects, 278: 166-174. Cano-Marquina, A., Tarín, J.J., Cano, A. (2013). The impact of coffee on health. Maturitas, 75: 7-21. Caprioli, G., Cortese, M., Odello L., Ricciutelli, M., Sagratini G., Tomassoni, G., Torregiani, E., Vittori, S. (2013). Importance of espresso coffee machine parameters on the extraction of chlorogenic acids in a certified Italian espresso by using SPE-HPLC-DAD. Journal of Food Research, 2 (3): 55-64. Cheng, G.W., Crisosto, C.H. (1995). Browning potential, phenolic composition and polyphenoloxidase activity of buffer extracts of peach and nectarine skin tissue. Journal of the American Society for Horticultural Science, 120 (5): 835–838. Chen, H.-Y, Leu, Y.-T, Roelants, I. (1992). Effective supplementation of arginine in the diets of juvenile marine shrimp, Penaeus monodon. Aquaculture, 108: 87-95.
Bibliography
50
Clifford, M.N., Zheng, W., Kuhnert, N. (2006). Profiling the chlorogenic acids of Aster by HPLC-MSn. Phytochemical Analysis, 17: 384-393. Comunian, T. Microencapsulação de ácido ascórbico por coacervação complexa e dispositivos microfluídicos: Estudo estrutural, estabilidade e aplicação das microcápsulas. MsC Thesis, Universidade de São Paulo, 2013. Desai, K. G. H. and Park, H. J. (2005). Recent developments in microencapsulation of food ingredients”, Drying Technology, London, 23 (7): 1361-1394. Dima, C., Cotarlet, M., Tiberious, B., Bahrim, G., Alexe, P., Dima, S. (2014). Encapsulation of Coriander Essential Oil in Beta-Cyclodextrin: Antioxidant and Antimicrobial Properties Evaluation. Romanian Biotechnologie Letters, 19 (2): 9128-9140. Duarte, G.S., Pereira, A.A., Farah, A. (2010). Chlorogenic acids and other relevant compounds in Brazilian coffees processed by semi-dry and wet post-harvesting methods. Food Chemistry, 118: 851–855. Dumitriu, S. Polymeric biomaterials. Marcel Dekker, Inc., 2002. Dutta, P.K., Tripathi, S., Mehrotra G.K., Dutta J. (2009). Perspectives for chitosan based antimicrobial films in food applications. Food Chemistry, 114: 1173-1182. El-Abassy, R.M, Donfack, P, Materny, A. (2011). Discrimination between Arabica and Robusta green coffee using visible micro Raman spectroscopy and chemometric analysis. Food Chemistry, 126: 1443-1448. Estevinho, B.N., Damas, A.M., Martins, P., Rocha, F. (2014). Microencapsulation of β-galactosidase with different biopolymers by a spray drying process. Food Research International, 64: 134-140. Estevinho, B.N., Rocha, F., Santos, L., Alves, A. (2013). Using water-solube chitosan for flavor microencapsulation in food industry. Journal of Microencapsulation, 1–9. Fang, Z. and Bhandari, B. (2010). Encapsulation of polyphenols - a review. Food Science & Technology, 21: 510-523. Farah, A., Donangelo, C.M. (2006). Phenolic compounds in coffee. Brazilian Journal of Plant Physiology, 18 (1): 23-36. Farah, A. and Duarte, G. (2015). Bioavailability and metabolism of chlorogenic acids from coffee. Coffee in Health and Disease Prevention, (21): 789-801. Farah, A., Monteiro M., Donangelo, C.M., Lafay, S. (2008). Chlorogenic acids from green coffee extract are highly bioavailable in humans. Journal of Nutrition: 2309-2315. Favaro-Trindade, C. S. (2008). Review: Microencapsulation of food ingredients. Braz. J. Food Technol., 11 (2): 103-112. Frascareli, E.C., Silva, V., Tonon, R.V., Hubinger, M.D. (2012). Effect of process conditions on the microencapsulation of coffee oil by spray drying. Food and Bioproducts Processing, 90 (3): 413-424.
Bibliography
51
Garcia, I., Aisina, R.B., Ancheta, O., Pascual, C. (1989). Action of gastric juice on microencapsulated invertase. Enzyme Microbiology and Technology, Woburn, 11 (4): 247-251. Gharsallaoui, A., Roudaut, G., Chambin, O., Voilley, A., Saurel, R. (2007). Applications of spray drying in microencapsulation of food ingredients: An overview. Food Research International, 40: 1107–1121 Goh, C.H., Heng, P.W.S., Chan, L.W. (2012). Alginates as a useful natural polymer for microencapsulation and therapeutic applications. Carbohydrate Polymers, 88: 1–12. Goud, K. and Park, H.J. (2005). Recent Developments in Microencapsulation of Food Ingredients. Drying Technology, 23: 1361–1394. Gouin, S. (2004). Microencapsulation: industrial appraisal of existing technologies and trends. Trends in Food Science & Technology, 15: 330-347. Greenberg, N. A. and Mahoney, R.R. (1981). Immobilisation of lactase for use in dairy processing: a review. Process Biochemistry, Oxford, 16 (2): 2-8. Güner, F., Yagci, Y., Erciyes, A.T. (2006). Polymers from triglyceride oils. Progress in Polymer Science, 31(7): 633-670. Imer, B. Modification of Biopolymers – Chemistry, Interactions, Structure and Properties. PhD Thesis, Budapest University of Technology and Economics, 2013. Islam, MA, Yun, CH, Choi, YJ, Cho, Cs. (2010). Microencapsulation of live probiotic bacteria. Journal of Microbiology and Biotechnology, 20 (10): 1367-1377. Ji, L., Jiang, P., Lu, B., Scheng, Y., Wang, X., Wang, Z. (2013). Chlorogenic acid, a dietary polyphenol, protects acetaminophen-induced liver injury and its mechanism. Journal of Nutritional Biochemistry, 24: 1911-1919. Jogdand, S.N. (2014). Biopolymers. Biotech Support Services (BSS), Chap. 1, India. Jolláes, P., Muzzarelli, R.A.A., Chitin and chitinases, Birkhèauser Verlag, 1999. Jyothi, S., Seethadevi, A., Prabha, K., Muthuprasanna, P., Pavitra, P. (2012). Microencapsulation: A review. International Journal of Pharma and Bio Sciences, 3(1): 509-531. Kandansamy and Somasundaram (2012). Microencapsulation of colors by spray drying – A review. International Journal of Food Engineering, 8 (2): 1556-3758. Kapusniak, J., Tomasik, P. (2006). Lipid microencapsulation in starch. Journal of Microencapsulation, London, 23 (3): 341-348. Kester, J. J., Fennema, O. R. (1997). Edible films solve problems. Food Technology-Chicago, 51 (2): 60-74. Kim, I., Han, J., Na, J., Chang, P., Chung, M.S., Park, K.H., Min, S.C. (2013). Insect-Resistant Food Packaging Film Development Using Cinnamon Oil and Microencapsulation Technologies. Journal of Food Science, 78 (2):229-237. Kissel, T., Maretschek, S., Packhauser, C., Schnieders, J., Seidel, N., (2006). Microencapsulation techniques for parenteral depot systems and their application in the pharmaceutical industry.
Bibliography
52
Microencapsulation: methods and industrial applications, CRC Press Taylor & Francis Group, 2nd Edition pp. 104. Komes, D. and Bušić, A. (2014). Antioxidants in coffee. Processing and Impact on Antioxidants in Beverages, 3: 25-32. Kumar, M. (2000). A review of chitin and chitosan applications. Reactive & Functional Polymers, 46: 1–27. Kumar, G.P. and Krishna, L.S. (2014). Formulation and evaluation of Vildagliptine sustained release microspheres. International Journal of Chemical and Natural Science, 2 (6): 189-194. Kurita, K. (2006). Chitin and chitosan: Functional biopolymers from marine crustaceans. Marine Biotechnology, 8: 203-226. Laranjinha, J.A.N., Almeida, L.M., Madeira, V.M.C. (1994). Reactivity of dietary phenolic acids with peroxyl radicals: antioxidant activity upon low density lipoprotein peroxidation. Biochemical Pharmacology, 48 (3): 487-494. Laohasongkram, K., Mahamaktudsanee, T., Chaiwanichsiri, S. (2011). Microencapsulation of Macadamia oil by spray drying. 11th International Conference on Engineering and Food (ICEF11). Procedia Food Science, 1:1660 – 1665. Lee, K.Y. and Mooney, D.J. (2012). Alginate: Properties and biomedical applications. Progress in Polymer Science, 37: 106– 126. Lorentz, C., Pencreac’h, G., Soultani-Vigneron, S., Rondeau-Mouro, C., de Carvalho, M., Pontoire, B., Ergan, F., Le Bail, P. (2012). Coupling lipophilization and amylose complexation to encapsulate chlorogenic acid. Carbohydrate Polymers, 90: 152-158. Maleki, A. Characterization of Functional Biopolymers under Various External Stimuli. PhD Thesis, University of Oslo, Chap. 1, 2008. Martins, I.M., Barreiro, M.F., Coelho, M., Rodrigues, A.E. (2014). Microencapsulation of essential oils with biodegradable polymeric carriers for cosmetic applications. Chemical Engineering Journal, 245:191–200. Mills, C.E., Oruna-Concha, M.J., Mottram, D.S., Gibson, G.R., Spencer, J.P.E. (2013). The effect of processing on chlorogenic acid content of commercially available coffee. Food Chemistry, 141: 3335-3340. Moeenfard, M., Rocha, L., Alves, A. (2014). Quantification of caffeoylquinic acids in coffee brews by HPLC-DAD. Journal of Analytical Methods in Chemistry, 1-11. Muller, P. Microencapsulação do óleo essencial de laranja. MsC Thesis, Universidade Federal do Paraná – Sector de Tecnologia, 2011. Mussatto, S.I., Machado, E.M.S., Martins, S., Teixeira, J.A. (2011). Production, composition, and application of coffee and its industrial residues. Food and Bioprocess Technology, 4: 661-672. Munin, A. and Edwards-Lèvy, F. (2011). Encapsulation of Natural Polyphenolic Compounds- a Review. Pharmaceutics, 3: 793-829.
Bibliography
53
Nallamuthu, I., Devi A., Khanum, F. (2014). Chlorogenic acid loaded chitosan nanoparticles with sustained release property, retained antioxidant activity and enhanced bioavailability. Asian Journal of Pharmacological Sciences XXX, I-9:1-9. Nakatani, N., Kayano, S., Kikuzaki, H., Sumino, K., Katagiri, K., Mitani, T. (2000). Identification, quantitative determination, and antioxidative activities of chlorogenic acid isomers in prune (Prunus domestica L.). Journal of Agricultural and Food Chemistry, 48: 5512-5516. Narita, Y. and Inouye, K. (2015). Chlorogenic acids from coffee. Coffee in Health and Disease Prevention, (21): 189-199. Nordtveit, R.J. (1996). Degradation of partially N-acetylated chitosans with hen egg white and human lysozyme. Carbohydrate Polymers, 29 (2):163-167. Pawar, S.N. and Edgar, K.J. (2012). Alginate derivatization: A review of chemistry, properties and applications. Biomaterials, 33: 3279-3305. Petracco, Marino. (2005). Our Everyday Cup of Coffee: The Chemistry behind its magic. Journal of Chemical Education, 82 (8): 1161-1167. Piacentini, E., Giorno, L., Dragosavac, M., Vladisavljević, G., Holdich, R. (2013). Microencapsulation of oil droplets using cold water fish gelatine/gum arabic complex coacervation by membrane emulsification. Food Research International, 53: 362–372. Poshadri, A., Kuna, A. (2010). Microencapsulation technology: A review. J.Res. Angrau, 38 (1): 86-102. Rao, M., Bharathi, P., Akila, R.M. (2014). A Comprehensive Review on Biopolymers. Scientific Reviews & Chemical Communications, 4 (2). Rinaudo, M. (2006). Chitin and chitosan: Properties and applications. Progress in Polymer Science, 31: 603–632. Rocha, G., Fávaro-Trindade, C., Grosse, C. (2012). Microencapsulation of lycopene by spray drying: Characterization, stability and application of microcapsules. Food and Bioproducts Processing, 90: 37-42. Sabiha-Hanim, S. and Siti-Norsafurah, A.M. (2012). Physical Properties of Hemicellulose Films from Sugarcane Bagasse. Procedia Engineering, 42: 1390-1395. Sankararamakrishnan, N. and Sanghi, R. (2006). Preparation and characterization of a novel xanthated chitosan. Carbohydrate Polymers, 66: 160–167. Scholz, M.B.S, Prete, C.E.C., Crudi, E., Magri, T.B. (2000). Composição química de variedades de café (Coffea arabica). In: Simpósio de Pesquisa dos Cafés do Brasil, Vol.2, Brasília, Brazil, 673-676. Shahidi, F., Han, X.Q. (1993). Encapsulation of food ingredients. Critical Reviews in Food Science and Nutrition, 33: 501–547. Shi, G., Rao, L., Yu, H., Xiang, H., Pen, G., Long, S., Yang, C. (2007). Yeast-cell-based microencapsulation of chlorogenic acid as a water-soluble antioxidant. Journal of Food Engineering, 80: 1060-1067.
Bibliography
54
Silva, C., Ribeiro, A., Ferreira, D., Veiga, F. (2003). Administração oral de peptídeos e proteínas: II. Aplicação de métodos de microencapsulação. Brazilian Journal of Pharmaceutical Sciences, 39: 1-9. Silva, V.M., Vieira, G.S., Hubinger, M.D. (2014). Influence of different combinations of wall materials and homogenization pressure on the microencapsulation of green coffee oil by spray drying. Food Research International, 61: 132-143. Stoica, R., Pop, S.F., Ion, R.M. (2013). Evaluation of natural polyphenols entrapped in calcium alginate beads prepared by the ionotropic gelation method. Journal of Optoelectronics and Advanced Materials, 15: (7): 893-898. Suárez-Quiroz, M.L., Campos, A.A., Alfaro, G.V., González-Ríos, O., Villeneuve, P., Figueroa-Espinoza, M.C. (2014). Isolation of green coffee chlorogenic acids using activated carbon. Journal of Food Composition and Analysis, 33: 55-58. Uddin, M.S., Hawlader, M.N.A., Zhu, H.J. (2001). Microencapsulation of ascorbic acid: effect of process variables on product characteristics. Journal of Microencapsulation, 18 (2): 199-209. Umer, H., Nigam, H., Tamboli, A.M., Nainar, M.S.M. (2011). Microencapsulation: Process, Techniques and Applications. International Journal of Research in Pharmaceutical and Biomedical Sciences, 2: 474-481. Wang, W., Liu, X., Xie, Y., Zhang, H., Yu, W., Xiong, Y., Xie, W., Ma, X. (2006). Microencapsulation using natural polysaccharides for drug delivery and cell implantation. Journal of Materials Chemistry, 16:3252-3267. Wilson, N. and Shah, N. (2007). Microencapsulation of vitamins. ASEAN Food Journal, 14: 1-4. Yang, J.S., Xie, Y-J., He, W. (2011). Research progress on chemical modification of alginate: A review. Carbohydrate Polymers, 84: 33–39. Yashin, A., Yashin, Y., Wang, J.Y., Nemzer, B. (2013). Antioxidant and antiradical activity of coffee. Antioxidants, 2: 230-245. Yoo, S-H., Song, Y-B., Chang, P-S., Lee, H.G. (2006). Microencapsulation of α-tocopherol using sodium alginate and its controlled release properties. International Journal of Biological Macromolecules, 38: 25–30. Zuidam, N.J. and Nedovic, V.A. (2010). Encapsulation Technologies for Active Food Ingredients and Food Processing. Springer Science, 2: 3-4.
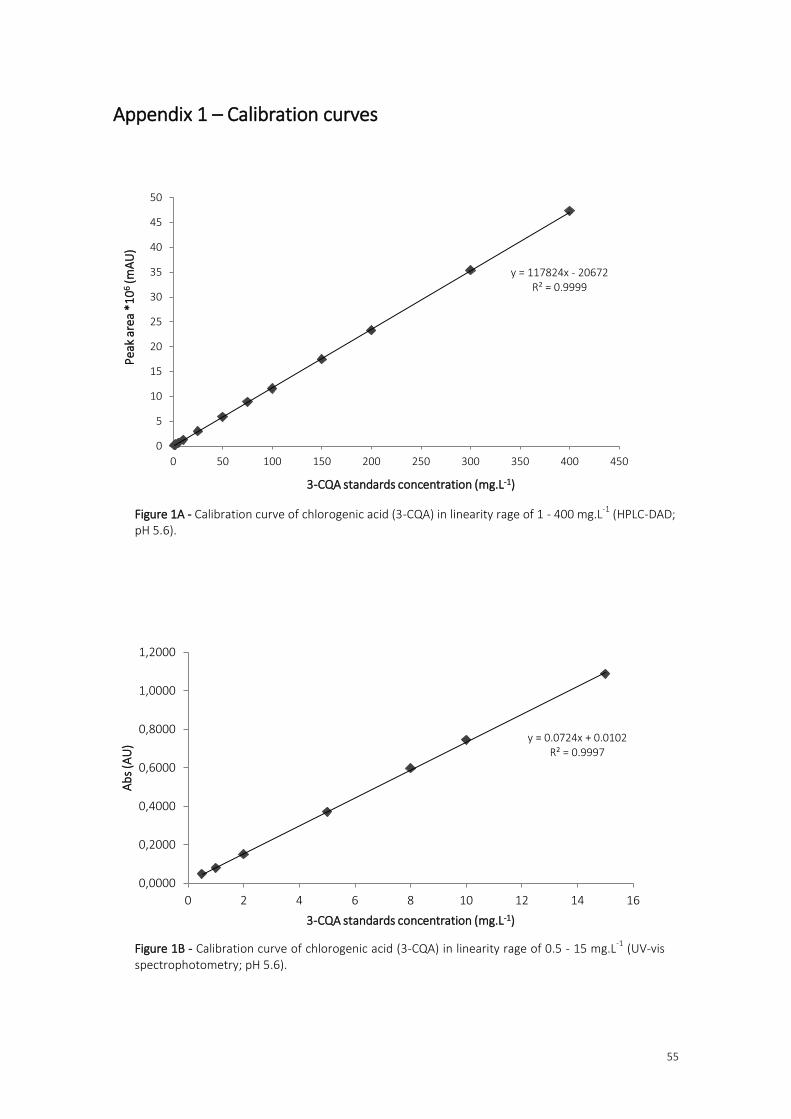
55
y = 117824x - 20672 R² = 0.9999
0
5
10
15
20
25
30
35
40
45
50
0 50 100 150 200 250 300 350 400 450
Pea
k ar
ea *
10
6 (m
AU
)
3-CQA standards concentration (mg.L-1)
y = 0.0724x + 0.0102 R² = 0.9997
0,0000
0,2000
0,4000
0,6000
0,8000
1,0000
1,2000
0 2 4 6 8 10 12 14 16
Ab
s (A
U)
3-CQA standards concentration (mg.L-1)
Appendix 1 – Calibration curves
Figure 1A - Calibration curve of chlorogenic acid (3-CQA) in linearity rage of 1 - 400 mg.L-1
(HPLC-DAD; pH 5.6).
Figure 1B - Calibration curve of chlorogenic acid (3-CQA) in linearity rage of 0.5 - 15 mg.L-1
(UV-vis spectrophotometry; pH 5.6).
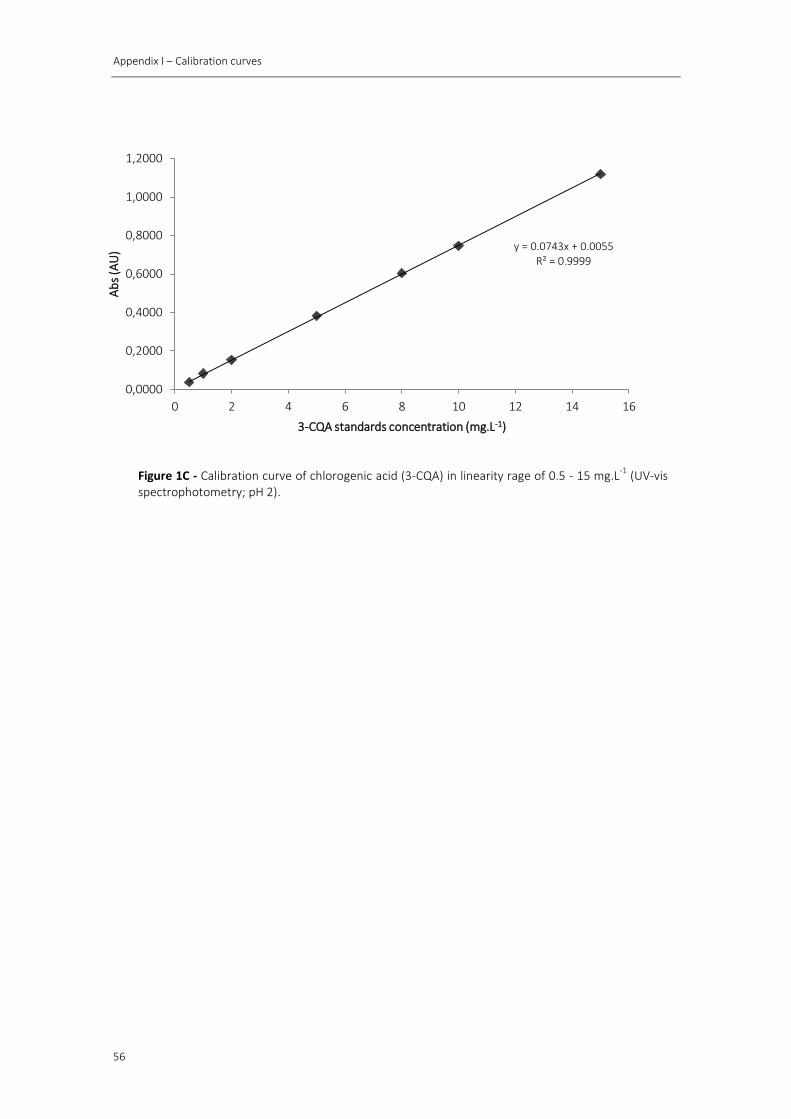
Appendix I – Calibration curves
56
y = 0.0743x + 0.0055 R² = 0.9999
0,0000
0,2000
0,4000
0,6000
0,8000
1,0000
1,2000
0 2 4 6 8 10 12 14 16
Ab
s (A
U)
3-CQA standards concentration (mg.L-1)
Figure 1C - Calibration curve of chlorogenic acid (3-CQA) in linearity rage of 0.5 - 15 mg.L-1
(UV-vis spectrophotometry; pH 2).
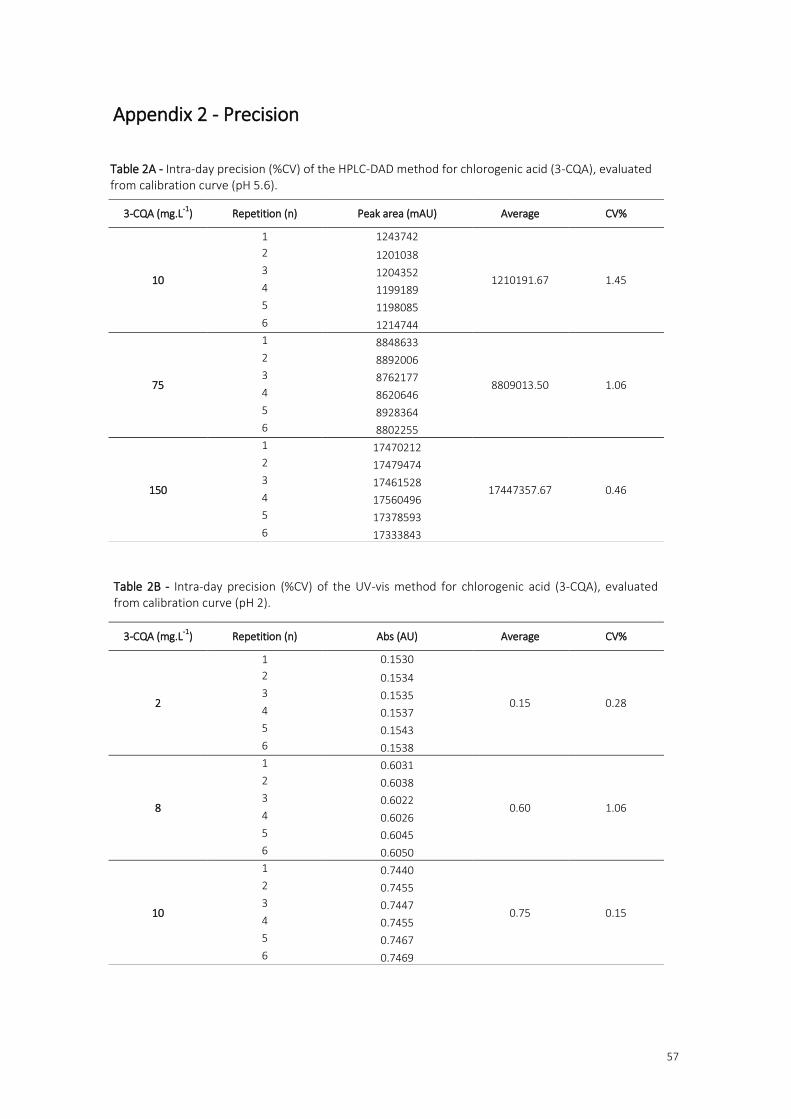
57
Appendix 2 - Precision
3-CQA (mg.L-1
) Repetition (n) Peak area (mAU) Average CV%
10
1 1243742
1210191.67 1.45
2 1201038
3 1204352
4 1199189
5 1198085
6 1214744
75
1 8848633
8809013.50 1.06
2 8892006
3 8762177
4 8620646
5 8928364
6 8802255
150
1 17470212
17447357.67 0.46
2 17479474
3 17461528
4 17560496
5 17378593
6 17333843
3-CQA (mg.L-1
) Repetition (n) Abs (AU) Average CV%
2
1 0.1530
0.15 0.28
2 0.1534
3 0.1535
4 0.1537
5 0.1543
6 0.1538
8
1 0.6031
0.60 1.06
2 0.6038
3 0.6022
4 0.6026
5 0.6045
6 0.6050
10
1 0.7440
0.75 0.15
2 0.7455
3 0.7447
4 0.7455
5 0.7467
6 0.7469
Table 2B - Intra-day precision (%CV) of the UV-vis method for chlorogenic acid (3-CQA), evaluated from calibration curve (pH 2).
Table 2A - Intra-day precision (%CV) of the HPLC-DAD method for chlorogenic acid (3-CQA), evaluated from calibration curve (pH 5.6).
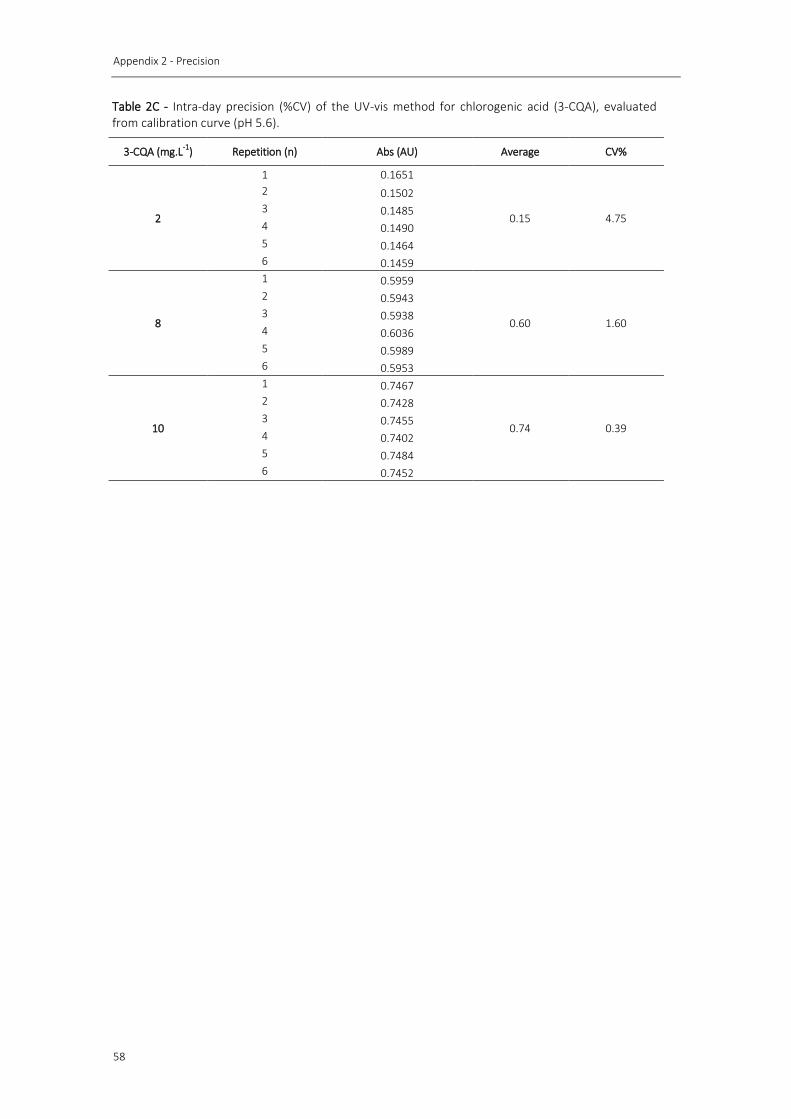
Appendix 2 - Precision
58
3-CQA (mg.L-1
) Repetition (n) Abs (AU) Average CV%
2
1 0.1651
0.15 4.75
2 0.1502
3 0.1485
4 0.1490
5 0.1464
6 0.1459
8
1 0.5959
0.60 1.60
2 0.5943
3 0.5938
4 0.6036
5 0.5989
6 0.5953
10
1 0.7467
0.74 0.39
2 0.7428
3 0.7455
4 0.7402
5 0.7484
6 0.7452
Table 2C - Intra-day precision (%CV) of the UV-vis method for chlorogenic acid (3-CQA), evaluated from calibration curve (pH 5.6).
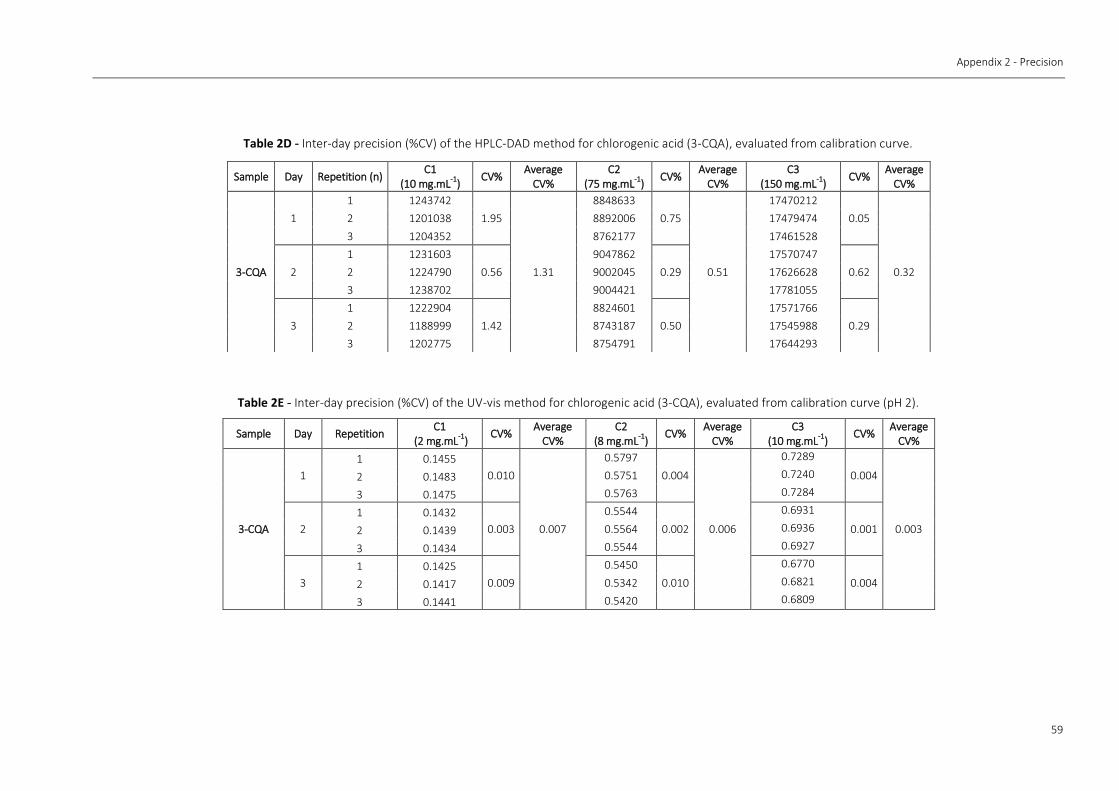
Appendix 2 - Precision
59
Sample Day Repetition (n) C1
(10 mg.mL-1
) CV%
Average CV%
C2 (75 mg.mL
-1)
CV% Average
CV% C3
(150 mg.mL-1
) CV%
Average CV%
3-CQA
1
1 1243742
1.95
1.31
8848633
0.75
0.51
17470212
0.05
0.32
2 1201038 8892006 17479474
3 1204352 8762177 17461528
2
1 1231603
0.56
9047862
0.29
17570747
0.62 2 1224790 9002045 17626628
3 1238702 9004421 17781055
3
1 1222904
1.42
8824601
0.50
17571766
0.29 2 1188999 8743187 17545988
3 1202775 8754791 17644293
Sample Day Repetition C1
(2 mg.mL-1
) CV%
Average CV%
C2 (8 mg.mL
-1)
CV% Average
CV% C3
(10 mg.mL-1
) CV%
Average CV%
3-CQA
1
1 0.1455
0.010
0.007
0.5797
0.004
0.006
0.7289
0.004
0.003
2 0.1483 0.5751 0.7240
3 0.1475 0.5763 0.7284
2
1 0.1432
0.003
0.5544
0.002
0.6931
0.001 2 0.1439 0.5564 0.6936
3 0.1434 0.5544 0.6927
3
1 0.1425
0.009
0.5450
0.010
0.6770
0.004 2 0.1417 0.5342 0.6821
3 0.1441 0.5420 0.6809
Table 2D - Inter-day precision (%CV) of the HPLC-DAD method for chlorogenic acid (3-CQA), evaluated from calibration curve.
Table 2E - Inter-day precision (%CV) of the UV-vis method for chlorogenic acid (3-CQA), evaluated from calibration curve (pH 2).
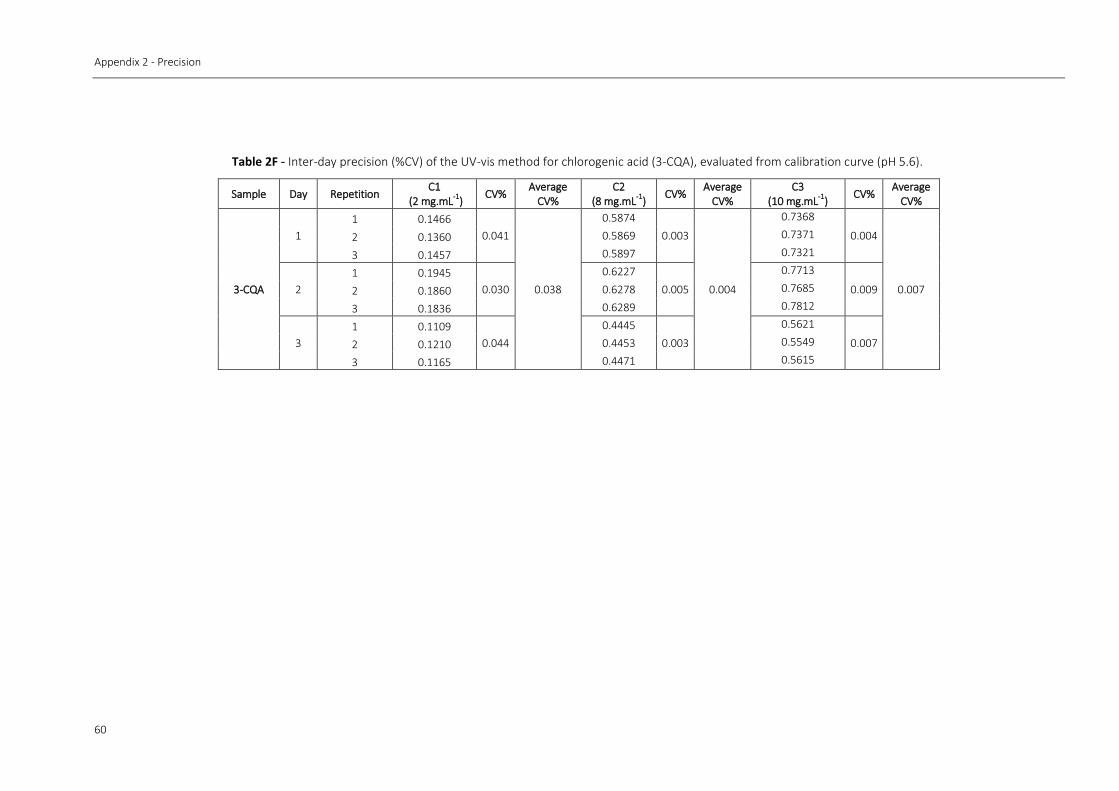
Appendix 2 - Precision
60
Sample Day Repetition C1
(2 mg.mL-1
) CV%
Average CV%
C2 (8 mg.mL
-1)
CV% Average
CV% C3
(10 mg.mL-1
) CV%
Average CV%
3-CQA
1
1 0.1466
0.041
0.038
0.5874
0.003
0.004
0.7368
0.004
0.007
2 0.1360 0.5869 0.7371
3 0.1457 0.5897 0.7321
2
1 0.1945
0.030
0.6227
0.005
0.7713
0.009 2 0.1860 0.6278 0.7685
3 0.1836 0.6289 0.7812
3
1 0.1109
0.044
0.4445
0.003
0.5621
0.007 2 0.1210 0.4453 0.5549
3 0.1165 0.4471 0.5615
Table 2F - Inter-day precision (%CV) of the UV-vis method for chlorogenic acid (3-CQA), evaluated from calibration curve (pH 5.6).