Embed Size (px)
Citation preview

Dr.Greeley and Mr. Chaturvedi presenting the key findings of the MISFA baseline and initial impact study at the Ministry of Finance on 10 September 2007.
Microfinance in Afghanistan:
A baseline and initial impact study for MISFA
Authors:
Martin Greeley, PhD Mohit Chaturvedi
Institute of Development Studies (IDS) University of Sussex Brighton BN1 9RE UK

Microfinance in Afghanistan: A baseline and initial impact study for MISFA September 2007 ii
Contents
Contents..........................................................................................................................................i List of Figures ..................................................................................................................................iv List of Tables.....................................................................................................................................v Acknowledgements .........................................................................................................................vi Acronyms.........................................................................................................................................vii Executive summary..................................................................................................................... viii 1 Introduction............................................................................................................................ 1 2 Research design .................................................................................................................... 6
2.1 Objectives.......................................................................................................... 6 2.2 Coverage by region........................................................................................... 6 2.3 Coverage by MFI ............................................................................................... 7 2.4 Analytical domains ........................................................................................... 7 2.5 Data collection methodology and instrument ................................................ 8 2.6 Sample design .................................................................................................. 8 2.7 Research questions........................................................................................ 11 2.8 Research hypotheses..................................................................................... 11
3 Housing and amenities........................................................................................................13
3.1 Housing type ................................................................................................... 13 3.2 Ownership status............................................................................................ 13 3.3 Second dwelling.............................................................................................. 14 3.4 Disputed housing............................................................................................ 14 3.5 Differences in housing types and ownership status .................................... 14 3.6 Amenities ........................................................................................................ 15 3.7 Access to electricity........................................................................................ 15 3.8 Cooking fuel .................................................................................................... 16 3.9 Heating arrangements in winter.................................................................... 16 3.10 Access to drinking water ................................................................................ 17 3.11 Conclusion ...................................................................................................... 17
4 Assets................................................................................................................................... 18
4.1 Why assets?.................................................................................................... 18 4.2 Construction of asset index ........................................................................... 18 4.3 Distribution of sewing machines ................................................................... 18 4.4 Improvement to property ............................................................................... 19 4.5 Asset endowment by project participation status........................................ 19 4.6 Asset endowment: new clients versus non-clients ...................................... 20 4.7 Asset endowment: rural versus urban clients .............................................. 21 4.8 Asset endowment: male versus female clients............................................ 21 4.9 Hypotheses tested in this chapter ................................................................ 22

Microfinance in Afghanistan: A baseline and initial impact study for MISFA September 2007 iii
5 Crisis and coping ................................................................................................................. 23 5.1 Crisis: its meaning and incidence ................................................................. 23 5.2 Incidence of crisis by disaggregates ............................................................. 24 5.3 Incidence of crisis: male versus female clients............................................ 24 5.4 Incidence of crisis: rural versus urban clients.............................................. 24 5.5 Important crises.............................................................................................. 25 5.6 Coping strategies............................................................................................ 25 5.7 Overlap of sample with cash for work and food for work programmes...... 26 5.8 Hypothesis tested in this chapter.................................................................. 28
6 Microfinance ........................................................................................................................ 29
6.1 Why are non-clients non-clients? .................................................................. 29 6.2 Duration of membership................................................................................ 29 6.3 Alternative sources of loan ............................................................................ 30 6.4 Size of informal loans..................................................................................... 31 6.5 Uses of informal loans ................................................................................... 31 6.6 Was there an unmet demand for credit?...................................................... 31 6.7 Size of the first microfinance loan ................................................................ 32 6.8 Use of first microfinance loan........................................................................ 32 6.9 How did usage pattern behave with successive loans? .............................. 33 6.10 Distribution of clients against loan cycles .................................................... 33 6.11 Size of progressive loans ............................................................................... 33 6.12 Spin-offs from the sector ............................................................................... 35 6.13 Hypotheses tested in this chapter ................................................................ 42
7 Status of women and access to services............................................................................ 43
7.1 Control over money ........................................................................................ 43 7.2 Willingness to join vocational programmes.................................................. 44 7.3 Assistance at childbirth.................................................................................. 44 7.4 Immunisation cards........................................................................................ 45 7.5 Incidence of illness and seeking medical advice......................................... 46 7.6 Hypotheses tested in this chapter ................................................................ 48 7.7 Conclusion ...................................................................................................... 48
8 Dropouts .............................................................................................................................. 50
8.1 Duration of stay with the programme ........................................................... 50 8.2 Decision to exit the programme .................................................................... 50 8.3 Reasons for exiting the programme.............................................................. 51 8.4 Are dropouts the poorest section?................................................................ 51 8.5 Conclusion ...................................................................................................... 52
9 Indicators for MFIs ............................................................................................................. 53 10 Conclusion.......................................................................................................................... 55 Appendix 1: Study questionnaire used for data collection........................................................ 57 Appendix 2: Map showing geographical outreach of MISFA partners ...................................... 75 Appendix 3: Recommended indicators for MFIs........................................................................ 76 References.................................................................................................................................. 79

Microfinance in Afghanistan: A baseline and initial impact study for MISFA September 2007 iv
List of Figures
Figure 3.1 Percentage of households owning a second dwelling
Figure 3.2 Percentage of households without access to electricity
Figure 3.3 Percentage of households using gas as the main cooking fuel
Figure 3.4 Percentage of households without access to heating in winter
Figure 4.1 Percentage of households owning a sewing machine
Figure 4.2 Percentage of households that improved their property
Figure 4.3 Household score on asset index
Figure 4.4 Asset index score for new clients and non-clients
Figure 4.5 Asset index score for rural and urban clients
Figure 4.6 Asset index score for male and female clients
Figure 4.7 Asset index score for new versus old clients
Figure 5.1 Incidence of crisis across sample
Figure 5.2 Incidence of crisis by disaggregates
Figure 5.3 Households that experienced shock/crisis by gender of client
Figure 5.4 Coping strategy against high incidence of human disease
Figure 5.5 Households that did not participate in CFW and FFW programmes
Figure 6.1 Reasons for not joining the microfinance programme
Figure 6.2 Alternative sources of loan
Figure 6.3 Size of informal loans
Figure 6.4 Informal loan use
Figure 6.5 Size of first formal loan
Figure 6.6 Usage pattern of first loan
Figure 6.7 Productive use of successive MFI loans
Figure 6.8 Frequency distribution by number of MFI loans taken
Figure 6.9 Large loans: trends
Figure 6.10 New businesses versus expansion
Figure 6.11 Number employed (excluding the entrepreneur)
Figure 6.12 Trends in economic situation
Figure 6.13 Trends in savings
Figure 6.14 Positive change in the perception of relatives
Figure 6.15 Start-ups and expansions with loans
Figure 7.1 Women’s control over money that belonged to them
Figure 7.2 Women reporting absolute control over money
Figure 7.3 Willingness and ability to join vocational programmes
Figure 7.4 Reasons for not joining vocational courses

Microfinance in Afghanistan: A baseline and initial impact study for MISFA September 2007 v
Figure 7.5 Assistance at childbirth
Figure 7.7 Penetration of immunisation cards
Figure 7.8 Penetration of immunisation cards by disaggregates
Figure 7.9 Women seeking medical advice for illness of children
Figure 8.1 Duration of stay with MFI (in years)
Figure 8.2 Whose decision was it to leave the programme?
List of Tables
Table 1.1 MISFA at a glance
Table 2.1 Provinces selected for survey
Table 2.2 Sample distribution across regions and provinces
Table 2.3 Sample distribution across MFIs
Table 3.1 Sample distribution by type of housing
Table 3.2 Sample distribution by ownership status of housing (%)
Table 6.1 Duration of MFI membership
Table 6.2 Loan intake by activity
Table 6.3 Decision on loan use
Table 7.1 Assistance at childbirth
Table 8.1 Reasons for dropping out of the programme

Microfinance in Afghanistan: A baseline and initial impact study for MISFA September 2007 vi
Acknowledgements The authors would like to thank the following for their support in the preparation of this report: Amjad Arbab, Managing Director MISFA, Amit Brar, Director of Operations MISFA, Stephen Rassmussen, Lead Specialist SASFP World Bank, Ehsan Zia, Minister for Reconstruction and Rural Development in Afghanistan, Nadine Beard, IDS Sussex, the staffs of MISFA, the Afghanistan Marketing and Management Consultancy, the Central Statistical Office and the National Risk and Vulnerability Assessment. Special thanks are due to the surveyed microfinance institutions for without their fantastic support this study would not have been possible. Above all, our thanks go to the respondents in the surveyed households.

Microfinance in Afghanistan: A baseline and initial impact study for MISFA September 2007 vii
Acronyms
AFSG Ariana Financial Services Group
AMFI Afghanistan Microfinance Initiative
ARMP Afghanistan Rural Microcredit Programme
BDS Business development services
BRAC Bangladesh Rural Advancement Committee
BRI Bank Rakyat Indonesia
CFW Cash for work
CGAP Consultative Group to Assist the Poor
FFW Food for work
FINCA Foundation for International Community Assistance
INAFI International Network of Alternative Financial Institutions
MADRAC Microfinance Agency for the Development and Rehabilitation of Afghan
Communities
M-CRIL Micro-Credit Ratings International Limited
MFI Microfinance institution
MISFA Microfinance Investment Support Facility for Afghanistan
MoFAD Micro Finance Agency for Development
NCR National Capital Region
NRVA National Risk and Vulnerability Assessment
SEWA Self Employed Women’s Association
USAID United States Agency for International Development
WFW Women for Women International

Microfinance in Afghanistan: A baseline and initial impact study for MISFA September 2007 viii
Executive summary This study of the microfinance sector in Afghanistan, commissioned by the Microfinance Investment Support Facility for Afghanistan (MISFA), was aimed at estimating a baseline database of clients to assess the impact of the microfinance impact in Afghanistan since its inception in 2003. It also aimed to test and establish critical indicators for benchmarking purposes. An increasing body of evidence shows that microfinance can have an impact on poverty reduction and in reductions of vulnerability to poverty. Is this also true for Afghanistan? The findings of this study suggest that the question can be answered in the affirmative. The findings of the study are based on household interviews carried out across 1,019 client, non-client and dropout households. The study design was a randomised sample spread across the provinces of Kabul, Nangarhar, Laghman, Herat, Balkh, Baghlan and Kunduz. The sample covered clients of ten out of MISFA’s 12 partner microfinance institutions (MFIs). The sample size and study design were both aimed at statistical robustness so as to allow extrapolation of findings to 350,000 MISFA clients.
Measures of household well-being
The study explored a number of facets of household well-being, which were grouped under housing and amenities, assets and economic well-being, crisis and coping strategies, microfinance, and the status of women. The findings are, on the whole, positive and encouraging. Most of the households interviewed reported living in single-family houses or in part of or shared houses. Two positive findings emerge from studying housing status: households are not residing in shacks and housing properties are not disputed. For the household, this means security and asset and for the development initiatives it implies permanency for the results of interventions. Access to amenities is an important measure of welfare. In Afghanistan, as elsewhere in the world, access to amenities is dependent on the availability of amenities and the availability of resources to access amenities. When households are in a position to make provisions, the access to amenities is high. Water is a good example: 98 per cent of households reported that it took them less than one hour to collect water. However, access to electricity compares poorly with this with 25 per cent of the households reporting that they did not have access to electricity. Access to amenities is naturally higher in urban centres as compared to the rural areas. The study used the same asset portfolio as the National Risk and Vulnerability Assessment (NRVA) 2005, using the score obtained by a household on this asset portfolio to place it in one of the five different categories of economic well-being. The rationale for this approach is based on the empirically validated hypothesis that assets will determine the socio-economic well-being of a household and also its ability to cope with crises. The client households were not any better off than the non-client households when they joined the programme. Among clients, women, who are 70 per cent of the total MISFA clients, were found to be from economically weaker sections. These two findings are an indication that microfinance clients do not come from economically better-off households but are spread across different economic categories. There are trends that suggest that participation in the microfinance programme has led to economic betterment. Old clients

Microfinance in Afghanistan: A baseline and initial impact study for MISFA September 2007 ix
are better off than non-clients who in turn are better off than new clients. But the differences are not significant. This is an indicator that will take time to be reflected and should be measured again after a few years.
Crisis and coping
Exposure to crises and the ability to cope with them are fair indicators of household well-being and resilience. The percentage of households that experienced crises in the previous twelve months ranged from 38 per cent for client households to 54 per cent for dropout households. More males than females reported crises situations. The most important crises reported by the interviewed households were high rates of morbidity and loss of employment. Borrowing from diverse sources is the only coping strategy that these households have. Households need credit to build on or protect what they have. Before the microfinance sector started functioning in Afghanistan in 2003 65 per cent of the people said that they did not take any loans (did not have access to loans is the more likely scenario as 23 per cent of the sample reported that their credit needs went unmet before the advent of MFIs). The remaining 35 per cent borrowed from friends, relatives and moneylenders. The study could not estimate the rate of interest that was being paid to access loans from informal sources of credit as interest on a loan is a taboo and people would not discuss it. These loans were being used mostly for consumptive purposes. Households burdened under consumptive debt would find their asset base eroded to furnish the debt thus starting a vicious downward spiral.
Socio-economic outcomes of microfinance
There are numerous positive outcomes emerging from these initiatives. Microfinance loans are, on average, larger than informal loans and unlike informal loans have been used largely for productive purposes: just under 89 per cent for the first loan rising to 100 per cent in the fourth loan cycle. Though loans are taken for a number of activities, the important ones are livestock, small business, self-employment and housing. In all, 81 per cent loans have been used to either start a new business or expand an existing business. The expansions and start-ups have employed people and it is estimated that every client generates 1.5 employment opportunities. This figure, extrapolated to all MISFA clients, would add up to 500,000 jobs. Clients reported a significantly higher improvement in their economic situation than non-clients and dropouts, results backed up by the figures for savings across the three groups. More than 80 per cent of the clients reported positive changes in the perception of their relatives in the wake of joining the programme. Of over 300 female clients interviewed, only 50 said that all decisions pertaining to loan use were taken by their male relatives 44 per cent of female clients reported absolute control over money that they earned, compared to 18 per cent of female non-clients. If there is indeed socio-economic betterment as a result of participation in microfinance programmes does this get reflected in increased awareness and increased access to services that would build human capital? This study used access to health services as a proxy to make such estimates. Women with young children were asked if they had immunisation cards for their children: 91 per cent of female clients answered affirmatively as against 79 per cent of female non-clients. They were also if they had

Microfinance in Afghanistan: A baseline and initial impact study for MISFA September 2007 x
sought medical advice for children that had fallen sick in the previous two weeks: 77 per cent of clients responded in the affirmative as against 59 per cent of non-clients.
Dropouts
Dropout households were once members of the microfinance programme and the purpose of interviewing these households was to examine reasons for their exit from the programme. The study found that over 60 per cent of dropouts exited the programme within the first year of joining the programme. While 50 per cent of the dropouts reported that the decision to exit was a personal decision, 37 per cent reported that the decision was taken by their male relatives. When asked their reasons for dropping out, 30 per cent said that they had benefited from the programme and did not need credit any more. Other reasons included high interest rates (20 per cent), difficulty in making repayments on time (18 per cent) and inability to save (15 per cent). There are strong reasons to believe that most of the dropouts exit within the first year of joining the programme; they are poorer than those who continue in the programme and compelled to drop out because of reasons that could be attributed to their poor economic state. This does not mean that the programme has no impact on them whatsoever. Probably these households do not benefit economically, but it would appear that they definitely benefit socially from their association with the programme. Female dropouts are more receptive to the idea of training, have better networks, access services more, are more aware, and report a greater control over money that belongs to them.
Areas of concern
While there are many reasons for optimism, there are also areas of concern. It would appear that the level of awareness about the programme is far from satisfactory. Many non-clients reported not being members of the programme because they were not aware of it. A large proportion of non-clients reported not being members of the programme as they thought that the terms and conditions were harsh, the interest rate was high and that it was too risky to take credit from MFIs. One of the major concerns for the sector should be the ‘limits to growth’ that clients face. Such limits are reached by the third or the fourth loan cycle and once reached, these limits possibly force clients to dropout.
Indicators for MFIs
The study concludes by discussing indicators that the MFIs could use to track the socio-economic progress of their clients with minimal financial and human investment. Where these indicators have been developed, they have been developed on the basis of income/expenditure data. Unfortunately, there are no reliable income/expenditure data available for Afghanistan. However, on the basis of the findings of this study and a survey of literature on indicators used by MFIs in post-conflict countries, the study has recommended a set of indicators for MFIs. While recommending these indicators, the study was conscious of the need to balance the best with the most practical and most likely to be accepted.

Microfinance in Afghanistan: A baseline and initial impact study for MISFA September 2007 1
Introduction In awarding the 2006 Nobel Peace Prize jointly to Dr Muhammad Yunus and Grameen Bank the Nobel committee, for the first time, established a link between poverty and peace. Today, microfinance is considered to be an important tool for poverty eradication in the developing world. An increasingly large body of evidence shows that microfinance can have an impact on poverty reduction and in reductions of vulnerability to poverty, and there is an emerging body of literature that microfinance can impact positively on health, nutritional status and primary school attendance (Morduch and Haley 2002). Indeed, the role that microfinance has played in assisting the poor in countries such as Bangladesh has been lauded across the board. No wonder then that the policy-makers engaged with the work of reconstruction in post-conflict societies should turn to microfinance. Can microfinance deliver in post-conflict societies? Post-conflict societies have some key differences when compared to ‘normal’ societies. These are: ● Pervasive poverty and loss of assets
● Mobile population
● High levels of dissaving
● Damaged or non-existent banking system
● Inflation
● Non-operational regulation and supervision
● Severe distrust
● Short-term operational focus vs. sustainability
● Safety threats
● Greater dependence on the informal sector
● High level of uncertainty and incentive to avoid irreversible investments.
All of these characteristics are applicable to Afghanistan and enough to deter the organic growth of a financial sector. And yet, access to credit is crucial if the economy is to be rebuilt. It is important because the formal sector cannot employ everyone.1 But jobs are important. One alternative is to make credit available to people so that they can start small businesses and commercial activities or build on existing ones. The process of reconstruction requires economic development and small businesses to provide a viable alternative to limited formal employment. Refugees returning home need money to rebuild their lives. Informal sources of credit in the form of social networks might have ceased to exist or might not be in a position to lend money. Trends in borrowing in post-conflict societies suggest that even if informal networks are active, they might not be able to cope with the demand for credit put on them. Demand is typically low immediately following hostilities but rises rapidly as reconstruction progresses. With a banking system in a shambles or non-existent, who would such large numbers of people turn to? Given the remoteness of settlements, both urban and rural, can the commercial banking sector serve the country effectively in the short to medium term? 1 According to Friedrich Schneider, in Africa over 48 per cent of the labour force is engaged in informal activities, in Central and South America 45 per cent and in Asia 33 per cent (Schneider 2002).

Microfinance in Afghanistan: A baseline and initial impact study for MISFA September 2007 2
With a non-functioning financial sector, a total absence of commercial players willing to serve the poor, and a lack of delivery capacity among existing microfinance institutions (MFIs), foreign donors were asked to step in. Strong donor interest in post-war reconstruction efforts in Afghanistan led some to see this as an opportunity to build a microfinance sector from scratch. In 2003 the Government of Afghanistan decided to actively support microfinance – the development of a financial sector that would provide access to credit for poor people – with the full support of international donors. Commercial banks had not yet been established and it was clear that even after beginning operations it would take a long time before they would be in a position to serve the vast majority of people in Afghanistan. It is at this point that the Microfinance Investment Support Facility for Afghanistan (MISFA) was established under the Ministry for Rural Rehabilitation and Development as the vehicle through which government and donors would channel technical assistance and funding to build up the lower end of the financial sector. The structure was intended to: ● Coordinate donor funding so that the conflicting donor priorities endemic in post-
conflict situations did not end up duplicating effort and distorting markets.
● Help young microfinance institutions scale up rapidly, offering performance-based
funding for operations and technical assistance.
● Build systems for transparent reporting and instil a culture of accountability.
Today MISFA works with 12 partner organisations.2 They are different in size, products, operating philosophy, geographical scale and target population. Most organisations, however, are similar in that they have designed their operations on the Grameen model of small groups.3 Most MFIs give preference to women clients and some, such as Afghanistan Rural Microcredit Programme (ARMP), Bangladesh Rural Advancement Committee (BRAC), Micro Finance Agency for Development (MoFAD), Parwaz and Women for Women (WFW), work exclusively with women clients in the field of small loans. Table 1.1 presents a snapshot of the sector.
Table 1.1 MISFA at a glance
Outreach: overall
Provinces 23
Districts 100
Active clients 364,786
Active borrowers 314,208
Client dropout (cumulative) 112,546
Number of loans disbursed (cumulative) 739,352
Amount of loans disbursed, US$ (cumulative) 252,790,523
2 MISFA website: www.misfa.org.af/index.php?page_id=4. 3 www.grameen-info.org/mcredit/cmodel.html.

Microfinance in Afghanistan: A baseline and initial impact study for MISFA September 2007 3
Number of loans outstanding 314,208
Gross loans outstanding, US$ 83,705,846
Client savings outstanding, US$ 9,176,908
Outreach: vulnerable section
Women clients 247,293
Widow clients 3,782
Disabled clients 92
Returnee clients 11,925
Women as percentage of total clients 68%
MFI resources employed
Branches 233
Male staff 2,088
Female staff 1,591
Total staff 3,679

Microfinance in Afghanistan: A baseline and initial impact study for MISFA September 2007 4
But what do these numbers tell us about the success or failure of the microfinance programme in Afghanistan? Has the programme been able to play the role that policy-makers envisaged for it? This document is an attempt to ascertain trends in the socio-economic impact of the microfinance programme. The design of this study is embedded in the National Risk and Vulnerability Assessment (NRVA) 2005. There were two reasons to emulate the NRVA: continuity (working with an accepted definition of well-being in the context of Afghanistan) and comparability. The report is divided into short chapters that are drawn from the structure of the questionnaire employed for data collection. The design of the study is discussed in Chapter 2 but it may help to mention here that the analysis of data and presentation of results revolve around three distinct categories of respondents in the sample – clients, non-clients and dropouts. Clients are divided into old clients and new clients, rural and urban clients, and male and female clients. These disaggregates have been used to further calibrate the findings on clients wherever it was felt that such calibration might help to reveal trends. An attempt has been made to present the results as simply as possible to ensure wide dissemination and intuitive understanding of the findings. Chapter 3 looks at housing and access to basic amenities such as water, heating, and lighting. Access to housing and other amenities seems to be normally distributed across the sample. In other words, most households seem to fall into the category ‘moderate’ while some appear to be very comfortable and the remainder not at all comfortable. There is a caveat here (indeed, this is true for most of the findings that are presented in this report). When this report discusses housing, it refers primarily to access to housing types. It does not make a distinction in housing in terms of size, quality of construction material or physical state of the structure itself. While a greater degree of sophistication would be useful, the study was constrained by time available, the security situation, the capacity of enumerators and the capacity of respondents. One could think of the results as approximations of trends. One could also view this report as laying down the foundations for new areas of research. Chapter 4 discusses assets at the disposal of the sample households. The asset list has been drawn up on the basis of the asset portfolio employed by NRVA 2005. In an attempt to make the most of the information collected, key assets have been combined to prepare an asset-based wealth index, which has then been used to place households in five categories. The dispersion is far greater for non-clients as compared to clients and dropouts. This is to be expected: non-clients represent the population (as opposed to clients, who represent a sub-section of the population) and will, therefore, have a greater diversity. Chapter 5 touches on the issues of social protection programmes and their overlap with the microfinance programme. The chapter also looks at crises that households are likely to face and their coping strategies. It would appear that 2006–7 was a good year for a large number of sample households. The incidence of shocks is not as widespread as one would have imagined. Where there have been crisis-like situations, credit from formal and informal sources have been the most important coping mechanism. This is not a surprising finding. What is surprising is that shocks appear to be idiosyncratic. This, perhaps, leaves a greater degree of flexibility in borrowing from informal sources. The chapter on crisis and coping is followed by a discussion of microfinance in Chapter 6. That the demand for credit is growing is reflected in the growing number of microfinance

Microfinance in Afghanistan: A baseline and initial impact study for MISFA September 2007 5
clients as well as in progressive increase in the size of loans. It is not suggested here that there is a causal link between the establishment of MISFA and growing demand for credit. The process of reconstruction and stabilisation can also result in increased demand for credit. But it is interesting to note how availability of credit can fuel demand for it. And to that extent the role played by MISFA in making credit available to ordinary men and women of Afghanistan is commendable. More importantly, the significance of such findings lies not so much in the demand for credit as in the use it is being put to. The expansion of existing businesses, the setting up of new businesses and employment creation seem to be the economic spin-offs emanating from the microfinance programme. These spin-offs are reflected in an improved perception of economic well-being, improved food security, positive trends in savings, and the rebuilding of assets. There are socially desirable outcomes as well. Participation of women in the microfinance programme has been promoted as a strategic objective of the programme. It has paid dividends: women are involved in business and many can take decisions on business matters independently; many have control over the money they earn; their social status within and outside the household has improved; and they have been able to form social networks through interaction with group members. Chapter 7 discusses the findings of the section on women, which explored women’s well-being, especially access to services, in more detail. Access to services, especially health services, seems to be better than might have been expected. Most households in the sample reported accessing health facilities of some kind and mother- and childcare (where applicable to households). However, there is a possibility that some of the questions on pre-natal and ante-natal care might not have been properly understood. The results for these have not been included in the report. Chapter 8 presents results from a sub-sample comprising 100 dropouts. These households came exclusively from urban areas and dropped out of the microfinance programme after association of varying time length. The results for this group suggest that the dropouts are probably the weakest in terms of their economic status. This is probably the reason why they drop out and has important lessons for the programme. The programme could identify the characteristics of households that are more likely to drop out and then design special packages for those more likely to drop out or screen them out. On the positive side, though, the performance of dropout households suggests that associating with the programme benefited the households in terms of such broad indicators as the empowerment of women, awareness and access to services. It is possible that the urban location of the dropout households works to their advantage in accessing services. However, the element of increased awareness and confidence cannot be discounted. Chapter 9 flags some of the indicators that MISFA and its partners could use to track the trends in the welfare of the programme participant households. While the issue of identifying and operationalising a few key indicators that could be used by MFIs for welfare profiling of clients is of immense importance, it is important to recognise that this is a complex issue. Most conventional indicators are not applicable to Afghanistan, given its unique social and political environment. Chapter 10 brings together and sums up the results of the study. It discusses the implications of the findings. While the findings are, on the whole, positive and encouraging there are also areas of concern. These relate to programme awareness, structural issues relating to the larger socio-economic and political environment and the implications that these have for programmatic success, and dropouts.

Microfinance in Afghanistan: A baseline and initial impact study for MISFA September 2007 6
Research design Objectives
The study of the microfinance sector in Afghanistan, commissioned by MISFA, was conceived with three broad objectives in mind: ● To establish a baseline database of clients to assess the subsequent impact of the
microfinance programme.
● To measure the impact of the microfinance programme in Afghanistan since the
inception of the programme.
● To test and establish a few key socio-economic indicators that MFIs could monitor to
track the well-being of their clients.
Coverage by region
The study covered five regions of Afghanistan: ● National capital region (NCR)
● Western region
● North-western region
● North-eastern region
● Eastern region.
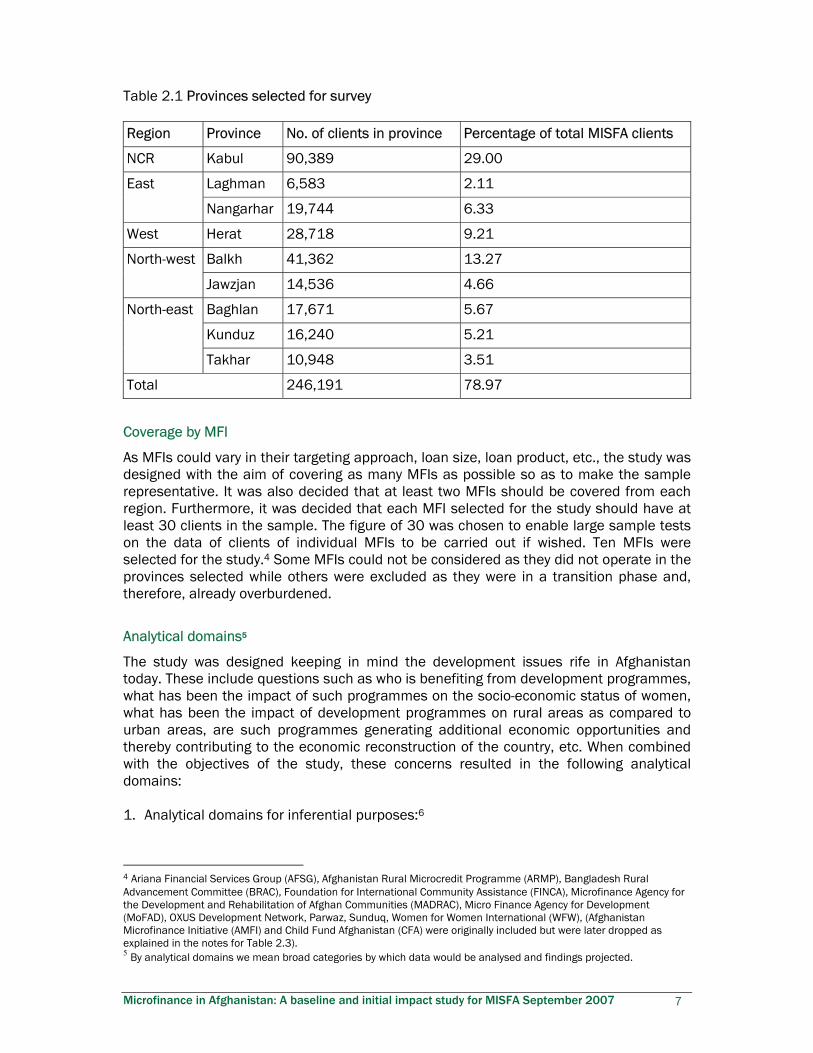
These five regions account for 97 per cent of the MISFA clients and portfolio. The remaining 3 per cent are located in the south-west and south-east of the country. These regions were excluded from the study for security reasons. Within each region, provinces were selected with an eye to balancing coverage against cost, logistical support and exposure to security risk. In all, nine provinces were selected for the study. The number of provinces selected from a region depended on the degree of concentration of clients, ease of traveling and stay, and the security environment of the region. Table 2.1 shows the provinces that were selected and what such a selection means in terms of client coverage. The nine provinces selected for the study accounted for 79 per cent of the client population.
Microfinance in Afghanistan: A baseline and initial impact study for MISFA September 2007 7
Table 2.1 Provinces selected for survey
Region Province No. of clients in province Percentage of total MISFA clients
NCR Kabul 90,389 29.00
Laghman 6,583 2.11 East
Nangarhar 19,744 6.33
West Herat 28,718 9.21
Balkh 41,362 13.27 North-west
Jawzjan 14,536 4.66
Baghlan 17,671 5.67
Kunduz 16,240 5.21
North-east
Takhar 10,948 3.51
Total 246,191 78.97
Coverage by MFI
As MFIs could vary in their targeting approach, loan size, loan product, etc., the study was designed with the aim of covering as many MFIs as possible so as to make the sample representative. It was also decided that at least two MFIs should be covered from each region. Furthermore, it was decided that each MFI selected for the study should have at least 30 clients in the sample. The figure of 30 was chosen to enable large sample tests on the data of clients of individual MFIs to be carried out if wished. Ten MFIs were selected for the study.4 Some MFIs could not be considered as they did not operate in the provinces selected while others were excluded as they were in a transition phase and, therefore, already overburdened.
Analytical domains5
The study was designed keeping in mind the development issues rife in Afghanistan today. These include questions such as who is benefiting from development programmes, what has been the impact of such programmes on the socio-economic status of women, what has been the impact of development programmes on rural areas as compared to urban areas, are such programmes generating additional economic opportunities and thereby contributing to the economic reconstruction of the country, etc. When combined with the objectives of the study, these concerns resulted in the following analytical domains: 1. Analytical domains for inferential purposes:6
4 Ariana Financial Services Group (AFSG), Afghanistan Rural Microcredit Programme (ARMP), Bangladesh Rural Advancement Committee (BRAC), Foundation for International Community Assistance (FINCA), Microfinance Agency for the Development and Rehabilitation of Afghan Communities (MADRAC), Micro Finance Agency for Development (MoFAD), OXUS Development Network, Parwaz, Sunduq, Women for Women International (WFW), (Afghanistan Microfinance Initiative (AMFI) and Child Fund Afghanistan (CFA) were originally included but were later dropped as explained in the notes for Table 2.3). 5 By analytical domains we mean broad categories by which data would be analysed and findings projected.

Microfinance in Afghanistan: A baseline and initial impact study for MISFA September 2007 8
● Male versus female clients
● Urban versus rural clients7
● Old versus new clients
● Clients versus non-clients
2. Analytical domain for summary statistics:
● Dropouts.
Data collection methodology and instrument
The study employed a structured questionnaire to conduct household surveys across the five regions and was administered by enumerators from Afghan Marketing and Management Consultancy (AMMC) (see Appendix 1 for questionnaire in full). Respondents were interviewed in private, one at a time, at their homes or in MFI offices. If the interviewed client was male his wife or mother was asked questions pertaining specifically to females. The questionnaire comprised 11 sections and covered such themes as household demographic information, housing, amenities, assets, access to social protection schemes of the government, crisis and coping strategies, participation in the microfinance programme, and women and access to services. The questionnaire also included a small section addressed to those households that had dropped out of the microfinance programme.
Sample design
The three broad objectives of the study mentioned at the beginning of this chapter, together with the analytical domains listed above, guided the sample size and the process of sample selection. Using the formula N=Z²*P*(1-P)*D/E² the minimum sample for each analytical domain at 6 per cent standard error and 95 per cent significance level was calculated to be 267.8 This was rounded off to 300. To establish a baseline database of clients, the study interviewed 300 ‘new clients’. New clients were defined as those households that either had not taken any loans or were in the process of repaying the first loan, also called first cycle. While most MFIs have a six-month cycle, some MFIs (BRAC being the most prominent example) have a one-year cycle. The study, in defining new clients, did not distinguish between six-month and one-year cycles. To establish the impact of the microfinance programme, the study included 300 ‘old clients’ (second-cycle clients or clients older than second cycle). The study also included 300 non-clients (meaning those households that lived in close proximity to clients but were not and had never been members of any microfinance programme) as a control group to explore whether clients, old or new, were different from non-clients in one or more of the various parameters employed by the study.
6 For these domains, a minimum sample size of 267 per category is needed at standard error of 6 per cent and 95 per cent significance. 7 In the absence of any clear definition of rural and urban, the study relied on the criteria employed by MFIs to define their clients as rural or urban. 8 Where N stands for the minimum sample size required, Z refers to Z score, P refers to the anticipated proportion to be measured, D refers to design effect, and E refers to the margin of error.
Microfinance in Afghanistan: A baseline and initial impact study for MISFA September 2007 9
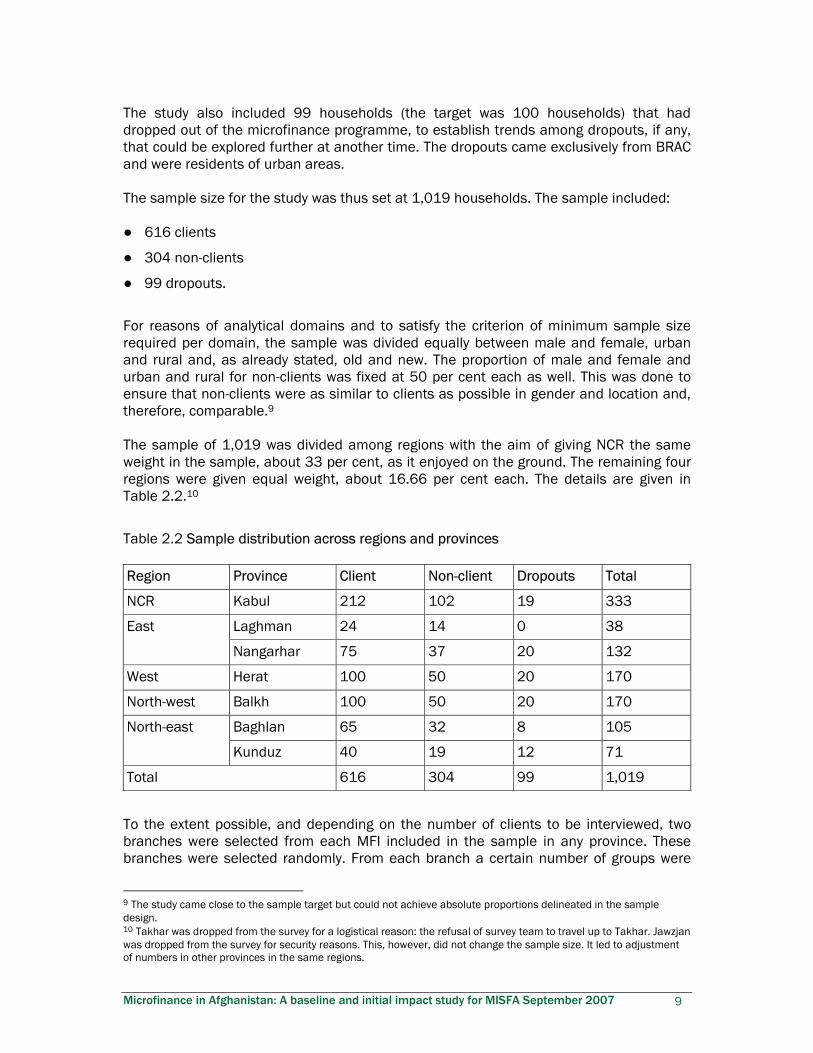
The study also included 99 households (the target was 100 households) that had dropped out of the microfinance programme, to establish trends among dropouts, if any, that could be explored further at another time. The dropouts came exclusively from BRAC and were residents of urban areas. The sample size for the study was thus set at 1,019 households. The sample included: ● 616 clients
● 304 non-clients
● 99 dropouts.
For reasons of analytical domains and to satisfy the criterion of minimum sample size required per domain, the sample was divided equally between male and female, urban and rural and, as already stated, old and new. The proportion of male and female and urban and rural for non-clients was fixed at 50 per cent each as well. This was done to ensure that non-clients were as similar to clients as possible in gender and location and, therefore, comparable.9 The sample of 1,019 was divided among regions with the aim of giving NCR the same weight in the sample, about 33 per cent, as it enjoyed on the ground. The remaining four regions were given equal weight, about 16.66 per cent each. The details are given in Table 2.2.10
Table 2.2 Sample distribution across regions and provinces
Region Province Client Non-client Dropouts Total
NCR Kabul 212 102 19 333
Laghman 24 14 0 38 East
Nangarhar 75 37 20 132
West Herat 100 50 20 170
North-west Balkh 100 50 20 170
Baghlan 65 32 8 105 North-east
Kunduz 40 19 12 71
Total 616 304 99 1,019
To the extent possible, and depending on the number of clients to be interviewed, two branches were selected from each MFI included in the sample in any province. These branches were selected randomly. From each branch a certain number of groups were
9 The study came close to the sample target but could not achieve absolute proportions delineated in the sample design. 10 Takhar was dropped from the survey for a logistical reason: the refusal of survey team to travel up to Takhar. Jawzjan was dropped from the survey for security reasons. This, however, did not change the sample size. It led to adjustment of numbers in other provinces in the same regions.
Microfinance in Afghanistan: A baseline and initial impact study for MISFA September 2007 10
selected randomly and from each group thus selected, a certain number of clients were selected randomly. The number of branches, groups, and clients approached in practice was determined by the need to balance the categories such as old and new clients, male and female clients, rural and urban clients, clients and non-clients, and dropouts. Original interview plans had to be revised sometimes depending on the prevailing security situation, ease of travel and readiness of groups to be interviewed. Table 2.3 presents details of coverage across MFIs.

Microfinance in Afghanistan: A baseline and initial impact study for MISFA September 2007 11
Research questions
The research questions stem from the second and the third objectives of the study. They are: 1. Who are the people participating in the microfinance programme?
2. What are the characteristics of the households participating in the microfinance programme?
3. Does participation in microfinance lead to an increase in economic well-being?
4. Is the socio-economic status of women improving as a result of participation in the microfinance programme?
5. Does microfinance have any impact on the health and education status of participating households?
6. Does microfinance act as a safety net?
7. Does microfinance accelerate economic activity, thereby leading to job and wealth creation?
8. Are there some key indicators that can accurately predict the welfare of participating household?
Research hypotheses
The study would test the following hypotheses: 1. Microfinance clients do not come from specific income or ethnic groups or
geographical areas.
2. Microfinance clients are economically better off than non-clients as a result of participation in the microfinance programme.
3. Long-standing clients of the microfinance programme are economically better off than new clients.
4. Women participating in the microfinance programme enjoy a higher socio-economic status than those women who are not participants.
5. The level of awareness is higher among those women who are participants in the microfinance programme.
6. Participation in the microfinance programme has empowered women.
7. The educational status of the members of client households is higher than the educational status of the members of non-client households.
8. More client households than non-client households access health services.
9. Microfinance plays a key role in the livelihood calculations of the participant households and acts as a safety net in times of crisis.
10. Microfinance has helped to start new economic activities and expand existing economic activities.
11. Microfinance has created jobs and thereby contributed to reduction in unemployment.
12. There are key socio-economic indicators that can help track the trends in the welfare status of the participant households over time.

Microfinance in Afghanistan: A baseline and initial impact study for MISFA September 2007 12
Table 2.3 Sample distribution across MFIs
Region Province AFSG ARMP BRAC* CFA** FINCA MADRAC MoFAD OXUS Parwaz SUNDUQ WFW
NCR Kabul 30 30 30 30 30 30 30
Laghman 10 15 East
Nangarhar
30 30 15
West Herat 30 30 20 20
Balkh 30 25 20 North-west
Jawzjan 25
Baghlan 20 20
Kunduz 40
North-east
Takhar 15 10
Total 30 95 170 40 100 30 30 30 30 30 30 * AMFI clients were eventually not interviewed because of failure to establish contact and liaise with the management of AMFI. Their part of the sample was transferred to BRAC. ** CFA was subsequently dropped from the study as the research team could not contact the management during the planning phase.

Microfinance in Afghanistan: A baseline and initial impact study for MISFA September 2007 13
Housing and amenities Housing and access to amenities are important factors in the welfare equation of households in both rural and urban areas. They assume greater importance in a post-conflict situation where infrastructure is either non-existent or diminished; there is an influx of returnees and pressure on existing resources.
Housing type
Most of the households interviewed reported living in single-family houses or in part of or shared houses (see Table 3.1).
Table 3.1 Sample distribution by type of housing
Single-family house
Part or shared house
Separate apartment
Part or shared apartment
Temporary shelter/shack
Total
Non-client 188 114 1 0 1 304
% 62 37 0 0 0 100
Client 378 236 0 1 1 616
% 61 38 0 0 0 100
Dropout 55 42 1 0 1 99
% 56 42 1 0 1 100
Total 621 392 2 1 3 1,019
% 61 38 0 0 0 100
Ownership status
As with similarity in the type of housing, the ownership status was also similar across disaggregates. The most common way to acquire a house was through inheritance, followed by purchase. Tenants were an important category in ownership status, primarily in urban areas. See Table 3.2.

Microfinance in Afghanistan: A baseline and initial impact study for MISFA September 2007 14
Table 3.2 Sample distribution by ownership status of housing (%)
Non-client Client Dropout Total
Inherited 44.41 50.00 51.52 48.48
Purchased 28.29 28.25 21.21 27.58
Occupied mortgaged dwelling 3.95 3.90 3.03 3.83
Tenant 13.82 11.36 13.13 12.27
Caretaker 5.92 3.25 2.02 3.93
Dwelling of relative/friend 2.30 1.62 6.06 2.26
Squatter 0.66 0.32 0.00 0.39
Other 0.66 1.30 3.03 1.28
Total 100.00 100.00 100.00 100.00
Second dwelling
Most households did not have a second dwelling. Where they did, the percentage of such households was similar for clients and non-clients while being substantially lower for dropouts (see Fig. 3.1).
Figure 3.1 Percentage of households owning a second dwelling
Disputed housing
The percentage of ‘disputed housing’ was found to be insignificant. Illegal settlements or squatter settlements do not pose any serious threat of displacement. This fact should itself give a boost to reconstruction work and to the expansion of the microfinance sector. Squatter settlements, especially in urban areas, have acted as a major stumbling block to the expansion of microfinance as they have prevented microfinance from reaching a large section of the population. That is not a problem in the case of Afghanistan; a good sign for the sector.
Differences in housing types and ownership status
Most categories of disaggregates and sub-disaggregates are similar in the type of housing that they live in and in the ownership status of the housing that they occupy. Nevertheless, under the broad umbrella of similarity, there are differences, which include:
0 20 40 60 80.
100
13.49 12.82 5.05Non-client Client Dropout

Microfinance in Afghanistan: A baseline and initial impact study for MISFA September 2007 15
● Dropouts perform poorly compared to clients and non-clients on the type of housing
that they occupy and also on whether they have a second house.
● More clients are tenants in urban areas (17.74 per cent) than in rural areas (5.57 per
cent)
● More male than female client respondents reported having inherited the houses that
they lived in. This is probably more a reflection of inheritance customs than of
economic status.
● Single family housing is significantly more prevalent among clients in rural areas than
among clients in urban areas.
Amenities
Access to amenities is an important measure of welfare. Amenities do increase welfare, but access to amenities or a lack of them, in the context of present-day Afghanistan, is dependent primarily on two factors: ● The availability of amenities through public and/or private provisioning, which, in
turn, is dependent on the location of a household along the rural–urban continuum.
● The availability of resources to pay for these amenities. The enumerators asked the respondents a number of questions about access to amenities. For most amenities, there is little to distinguish one category of disaggregate from another. And yet some of the findings shed light on the importance of the points that we made above about access to amenities.
Access to electricity
When respondents were asked whether they had access to electricity supply 251 respondents out of 1,019 (24.63 per cent) responded in the negative. Figure 3.2 shows distribution of these households across disaggregates.
Figure 3.2 Percentage of households without access to electricity
0 5
10 15 20 25 30
27.00 26.83 9.00
Non-clients Clients Dropouts

Microfinance in Afghanistan: A baseline and initial impact study for MISFA September 2007 16
The dropouts fared worse than clients and non-clients on the housing indicators. Yet only 9 per cent of dropout households did not have access to electricity. This can be attributed to the exclusively urban location of dropouts. This is substantiated further by analysing access to electricity among clients living in rural and urban areas. Whereas only 12 per cent of clients in urban areas did not have access to electricity, for clients in rural areas this stood at 39 per cent.
Cooking fuel
Let’s look at another example: that of respondents using gas as the primary cooking fuel. There is hardly any difference between disaggregates as Figure 3.3 shows. Once again the dropouts perform better than the other two categories, even if marginally, because of their location in urban areas. Gas is readily available and other sources of fuel may be expensive or difficult to get. But where they can save money on non-essential items, the dropouts’ access to amenities reduces or becomes qualitatively poorer. The example of heating in the winter months makes this clear.
Heating arrangements in winter
When dropouts have to make arrangements for amenities by themselves or, in other words, when they do not benefit from location, economic factors become important. The dropouts then lose out to other categories in access to amenities. See Figure 3.4.
Figure 3.3 Percentage of households using gas as the main cooking fuel
Figure 3.4 Percentage of households without access to heating in winter
47.50 48 48.50 49 49.50 50 50.50
48.33 49.00 50.00
Non-clients Clients Dropouts
0 2 4 6 8
10 12
6.33 4.50 10.00
Non-clients Clients Dropouts

Microfinance in Afghanistan: A baseline and initial impact study for MISFA September 2007 17
Access to drinking water
In spite of the examples discussed above, access to amenities is quite satisfactory across board in the sample collected for this study. For example, about 40 per cent of the respondents in each category of disaggregate reported ‘well within compound’ as the primary source of drinking water and 98 per cent of the sample reported that it took them less than an hour to collect water. Only 13 households (1.28 per cent) reported not having access to a toilet of any kind.
Conclusion
In wrapping up this section, it is important to remember that access to amenities is a function of the availability of these amenities. A family might be strongly inclined to send their daughters to school but if there are no schools in their vicinity, the family can do precious little. Accessing amenities privately can be difficult even for well-off households because of the cost involved. Until the social and physical infrastructure is developed beyond a certain critical level, a programme’s success or failure cannot be indicated by how many households are accessing certain amenities. To put it differently, a linear, positive relationship between increased economic welfare and increased access to services such as health, education, electricity, clean drinking water, etc. cannot be expected.

Microfinance in Afghanistan: A baseline and initial impact study for MISFA September 2007 18
Assets Why assets?
The survey did not collect data on periodic income and expenditure of the sample households. The problems associated with any assessment based on one-time collection of data on these variables, solely on the basis of recall, are too well known to be discussed here. Instead the study collected information on assets available to households to compare them for well-being. An ‘assets-based approach to poverty’ establishes that assets are an important factor in determining the well-being of a household and a household’s ability to improve its well-being. For the purposes of this study, information was collected on the same portfolio of assets as employed by NRVA 2005. The survey instrument in Appendix 1 furnishes the details of the assets portfolio used by the study.
Construction of asset index
For purposes of comparison, all assets were given a standard score. These scores were then added for individual households to prepare an assets index. One could argue that a watch and a stove are not equally important and so should be scored differentially. But any weight assigned to an asset is a value judgment and as such is open to criticism. Secondly, it was assumed that if a household had a sophisticated asset, it was also more likely to have a basic asset while the reverse was less likely to be true. Therefore, any difference in asset endowment should be captured in differential scores on the asset index. Households were divided into five equal categories on the basis of their scores (theoretically ranging from 0 to 30). We will present the findings after we have looked at the distribution of some assets of interest across various disaggregates.
Distribution of sewing machines
Dropouts report a higher penetration of sewing machines than non-clients (Fig. 4.1). If we consider a sewing machine to be a productive asset, we can safely attribute the higher penetration of sewing machines among dropout and client households to participation in the microfinance programme. This attribution is based on the fact that the dropouts, as we shall see in subsequent tables and figures (such as those on the housing and asset scores), are worse off than both clients and non-clients and, therefore, less likely to own a productive asset prior to joining the microfinance programme. As this report shows, there is other evidence that the increased economic well-being of a household – in the example above the owning of a sewing machine – can be attributed to the microfinance programme. There are other reasons to believe that attribution should be fairly accurate.

Microfinance in Afghanistan: A baseline and initial impact study for MISFA September 2007 19
Figure 4.1 Percentage of households owning a sewing machine
Improvement to property
When respondents were asked if they had improved property in recent years, more clients and dropouts responded in the affirmative than non-clients (see Fig. 4.2).
Figure 4.2 Percentage of households that improved their property
Although it is possible to argue that a chance factor might be responsible for the trend witnessed, given that these results have been generated at a level that is statistically robust, it is unlikely that chance has played a role in the findings. Some other findings on this important variable, by other sub-disaggregates, are presented below: ● 24.42 per cent of new clients responded that they had improved their property in the
last 12 months as against 24.92 per cent for the old clients.
● 29.53 per cent of female clients reported improving their property. The percentage
among male clients for the same question stood at 19.80 per cent.
● 26.62 per cent of clients in urban areas reported improving their property in the last
12 months. The percentage among rural clients was a close 23 per cent.
Asset endowment by project participation status
We have already outlined the method employed to construct the asset-based index. With all its accompanying limitations, it is still an accurate indicator of what the trends across
0.00
20.00
40.00
60.00
80.00
50.67 64.12 58.00
Non-clients Clients Dropouts
0 5
10 15 20 25 30
17.00 24.68 22.00
Non-clients Clients Dropouts

Microfinance in Afghanistan: A baseline and initial impact study for MISFA September 2007 20
different categories of disaggregates are and what are the likely explanations for these evident trends.
Figure 4.3 Household score on asset index
Figure 4.3 and its labelling shows the following: ● Clients are better off than non-clients and dropouts in asset endowment.
● Non-clients report the greatest range in asset endowment being represented in all five
categories
● Dropouts are the worst off in asset endowment.
● The mean scores for the three categories of disaggregate are: non-clients 1.83, clients
1.91 and dropouts 1.59.
● Clients, as a category, are significantly better endowed than dropouts but not
significantly better endowed than non-clients.
Asset endowment: new clients versus non-clients
Figure 4.4 compares the asset index score of new clients with non-clients.
Figure 4.4 Asset index score for new clients and non-clients
0
20
40
60
Non-client 33.22 52.30 12.50 1.32 0.66
Client 28.08 52.44 19.48 0.00 0.00
Dropout 42.42 55.56 2.02 0.00 0.00
1 2 3 4 5
0
10
20
30
40
50
60
1 2 3 4 5
New clients Non-clients

Microfinance in Afghanistan: A baseline and initial impact study for MISFA September 2007 21
Asset endowment: rural versus urban clients
The status of asset endowment is examined further by splitting the category clients into sub-categories.
Figure 4.5 Asset index score for rural and urban clients
Figure 4.5 compares asset endowment of rural and urban clients. There are no significant differences between the two sub-categories either in distribution across the asset score range or in the mean score for sub-category. In other words, it would be logical to conclude that rural and urban clients are economically similar. It would also be reasonable to conclude that if they started at the same level of well-being, the two have benefited equally from the programme. If this conclusion were accepted, the implication would be that the microfinance programme has been able to make a dent in the rural areas of Afghanistan. It is no secret that the rural areas are far more difficult to work in than the urban areas. However, if the microfinance programme, or any other programme for that matter, is to make a meaningful contribution to the process of reconstruction of Afghanistan, rural areas and their population cannot be overlooked.
Asset endowment: male versus female clients
There are significant differences between the asset endowment of male and female clients, in terms of both mean scores and distribution across asset score classes/categories. Female clients compare poorly to male clients. There could be three explanations for this: (1) Female clients come from households that are economically worse off to begin with, which suggests that targeting has been quite effective; (2) Female clients became poorer after joining the programme; or (3) Male clients benefited more from the programme. While the first two are theoretically possible, there is nothing in the trends, which we present subsequently, to suggest that the third reason will explain the differences. Female clients appear to be performing as well as male clients if not better on key outcome indicators (Fig. 4.6).
0
20
40
60
Urban 28.33 53.24 18.43
Rural 27.86 51.70 20.43
1 2 3

Microfinance in Afghanistan: A baseline and initial impact study for MISFA September 2007 22
Figure 4.6 Asset index score for male and female clients
Hypotheses tested in this chapter
1. Microfinance clients are economically better off than non-clients
Microfinance clients come across as economically better off than non-clients but the differences between the two categories are not statistically significant at 95 per cent. The new clients are, in fact, worse off than non-clients in terms of asset endowment. This suggests a lack of bias in client selection on economic grounds and proves the second hypothesis, which follows. 2. Microfinance clients do not come from specific income or ethnic groups or areas.
3. Old clients of microfinance programme are economically better off than new clients
Once again, old clients are marginally better off than new clients but the differences between the two categories are not statistically significant at 95 per cent (Fig. 4.7).
Figure 4.7 Asset index score for new versus old clients
1 2 3
New client Old client
A word of warning is needed here. The difference between old clients and new clients should be considered with a dose of caution. If we accept that Afghanistan has been rebuilding itself since the fall of Taliban, and that the pace of growth has been smart if not scorching, we have to accept a certain rate of natural progression. In other words, the new clients, when they joined the microfinance programme, were already much better off than the old clients were when the old clients joined the programme. This should dilute the effective difference that the microfinance programme might have made to the lives of old clients.
0 20 40 60 80
Female 33.41 48.91 17.68
Male 17.24 59.61 23.15
1 2 3

Microfinance in Afghanistan: A baseline and initial impact study for MISFA September 2007 23
Crisis and coping Crisis: its meaning and incidence
Credit has often been called the only coping mechanism available to the poor in a crisis situation. Is this true in the context of Afghanistan? Before we proceed to ascertain this, we should underline what is implied by a crisis situation. There is a pattern to the existence of every household, which revolves around the average living conditions for that household. Sometimes this pattern of existence is violently disturbed by man-made or natural causes. Conflict is one such cause. If the household does not have access to resources to tide it over the shock and revert back to its normal pattern of existence, shock can quickly turn into a crisis. There cannot be any absolute definition of shock and crisis as the resilience of individuals and communities differs over time and space and across cultures. The respondents were given an exhaustive list of shock or crisis situations and were asked to list the ones that they had faced in the previous 12 months. 2006/7 must have been a good year, because the majority of respondents reported that they had not faced any shocks/crises (see Fig. 5.1).
Figure 5.1 Incidence of crisis across sample
The response was better than the survey team had anticipated, but even so, close to 41 per cent of the sample households reported having suffered a crisis or a crisis-like situation. Where did these households lie in the schematics of analysis for this report?
0
20
40
60
80
40.63 59.37
Yes No

Microfinance in Afghanistan: A baseline and initial impact study for MISFA September 2007 24
Incidence of crisis by disaggregates
The percentage of dropout households that reported suffering a crisis was the highest of the three groups at 53.54 per cent (see Fig. 5.2). It was the lowest for the clients (38.31 per cent). The explanation would appear to be straightforward. The dropouts are the poorest in asset endowment, which, in turn, is a reflection of their overall state of poverty. When faced with a shock, they have fewer resources to forestall a crisis situation.
Figure 5.2 Incidence of crisis by disaggregates
Incidence of crisis: male versus female clients
Female clients, as a sub-category, are worse off than male clients in asset endowment and yet they report significantly lower incidence of shock/crisis situation (Fig. 5.3). This is, however, not a contradiction of the link between assets and coping. Dropouts are poorer than female clients and are less able to cope. Equally importantly, the category ‘female client’ is not the same as ‘female-headed household’. In other words, what is lost because of poor asset endowment is probably compensated for by having extra working hands.
Figure 5.3 Households that experienced shock/crisis by gender of client
Incidence of crisis: rural versus urban clients
The incidence of shocks/crisis was significantly higher for rural clients (43.03 per cent) than for urban clients (33.10 per cent). The dataset offers no explanation for this finding nor does one come to mind intuitively except that shocks are of different kinds and the most important category is ‘very high incidence of human disease’. It is possible that a
0 10 20 30 40 50 60
41.12 38.31 53.54Non-client Client Dropout
0 10 20 30 40 50
34.62 45.81
Female Male

Microfinance in Afghanistan: A baseline and initial impact study for MISFA September 2007 25
high incidence of human disease is more likely to turn into a shock in rural areas for want of proper medical facilities.11
Important crises
Respondents reported a wide variety of crises, but most crises had very few cases or observations under them. The crisis ranked as most important was ‘high incidence of human disease’, reported by 109 households or close to 11 per cent of the sample. This was followed by ‘loss of employment’, reported by 65 households or 6.3 per cent of the sample.
Coping strategies
The array of coping mechanisms to tide over a crisis was as exhaustive as the list of crises itself (Fig. 5.4). However, none except for credit came across as an important coping mechanism. When we say important, we are referring only to the numerical preponderance of a strategy. Of the 109 households that reported high incidence of human disease, 61 households (over 55 per cent) reported credit as the single most important coping strategy, but while 53 households took loans from friends and relatives only 7 took loans from MFIs. This is not a surprising finding. Most MFIs would probably not give loans for non-productive consumption (however they might define it). Other coping strategies were ‘decreased expenditure’ (14.67 per cent) and ‘used savings and investments’ (14.67 per cent). Though there is nothing to prove this explicitly, the trends in other key variables suggest that the microfinance programme helps clients build up resources, which in turn ward off crisis-like situations or help tide them over crises. It is not a mere coincidence that the incidence of shocks/crisis is lowest in the category ‘clients’. The argument being made here is that availability of credit is what stands between most poor households and crisis-like situations, whether this credit is proactive and helps build their resources to prevent crises or is reactive and helps households recover from a crisis.
11 The results revealed that 10.2 per cent of rural client households were affected by high incidence of human disease as against 7.5 per cent of urban client households. It is very likely that there is an element of truth in the inference that we have tentatively drawn.

Microfinance in Afghanistan: A baseline and initial impact study for MISFA September 2007 26
Figure 5.4 Coping strategy against high incidence of human disease
Overlap of sample with cash for work and food for work programmes
We conclude this chapter by drawing attention to the fact that there could be many coping mechanisms to tide over crises. Many left-leaning writers have drawn attention to the concept of moral economy, which they believe is the lowest level (economically) that a community would let any of its members fall to before it intervenes. Social capital could be thought of in terms of moral economy, as could loans from friends and relatives. There could also be active state intervention in the form of social protection and safety nets, which could take the form of conditional transfer of assets and/or cash, unconditional transfer of assets and/or cash, food for work (FFW), cash for work (CFW), etc. While we have no doubt that both these categories (moral economy and state intervention) are important in Afghanistan, we would have doubts about either of them effectively preparing people to cope with crises. Afghan society is in a state of flux. To give one example, the rate of migration is very high, implying that social networks are likely to break down. This would constrict the ability of households to access loans informally. As for state intervention, one issue would be whether the government has enough resources to hand out doles. There are conflicting priorities and they are numerous. To find out if our sample overlapped with other social protection programmes, we asked respondents if they had participated in food for work or cash for work programmes since the previous harvest (see Fig. 5.5).
2%
15%
15%
46%
3%
6%
4%1%
1% 7% Reduced food
Decreased expenditure
Used savings or investments
Loans from family/friends
Employer/money lenders/traders
Loan from MFI
Sold/mortgaged HH assets
Sold/mortgaged productiveassetsOut migrated
Others

Microfinance in Afghanistan: A baseline and initial impact study for MISFA September 2007 27
Figure 5.5 Households that did not participate in CFW and FFW programmes
As we have already established, loss or lack of employment is a serious issue facing the population and yet participation in CFW and FFW is low. If these programmes were truly effective in coverage and delivery, the issue of loss of employment should have been less pervasive. There are, as has been already stated, constraints on what these programmes can achieve in the short run. What they would build up (probably social and economic infrastructure) will be useful only in the medium to long term. In the meantime, if traditional support structures are getting weaker and access to resources is becoming or is likely to become problematic, a viable financial sector can fill the vacuum left by disappearing social networks and complement state-funded transfers (cash for work and food for work). It could also complement, and be complemented by, social and economic infrastructure, a likely outcome of state endeavours.
0 20 40 60 80
100 120
Cash for work 97.35
Food for work 97.84

Microfinance in Afghanistan: A baseline and initial impact study for MISFA September 2007 28
Hypothesis tested in this chapter
Microfinance plays a key role in the livelihood calculations of the participant households and acts as a safety net in times of crisis. The rate of incidence of crisis situations is lowest among the clients and the difference in the rate of incidence between the three disaggregates is statistically significant. We have already established a relationship between availability of credit or of assets and incidence of crisis situation in the preceding discussion. If credit acts as a safety net, then microfinance should act as a safety net. This study is not in a position to shed light on how participant households manage livelihoods and incumbent risk factors.

Microfinance in Afghanistan: A baseline and initial impact study for MISFA September 2007 29
Microfinance Why are non-clients non-clients?
We begin the discussion on microfinance by presenting the findings on why non-clients were not members of the microfinance programme. The general perception in Afghanistan amongst policy-makers and development professionals is that people in conservative areas are opposed to microfinance because they are required to pay interest on loans and interest runs contrary to the tenets of Islam. If this is indeed true, our findings did not capture the sentiment. The reasons that the non-clients cited for not being members of the microfinance programme are presented in Figure 6.1.
Figure 6.1 Reasons for not joining the microfinance programme
The most important reason that non-client respondents cited for not joining the programme was that they did not require credit. This is an issue that the forces unleashed by the process of reconstruction should address in the medium to long term. Availability of credit should create demand for credit. Increased economic activity should also create demand for credit. There are other reasons for not joining the programme that the microfinance programme should be concerned about. Lack of awareness (22 per cent), harsh terms and conditions (12 per cent) and perceived risk (9 per cent) together account for 43 per cent of the non-engagement with the programme. These are issues that the programme can address and should attempt to.
Duration of membership
Close to 50 per cent of the clients interviewed were less than six months into the programme and only 15.5 per cent were more than 18 months into the programme. Table 6.1 shows the average duration of membership for clients at the time of the survey.
22%
51%
9%
4% 1%
12% 1% Not aware of any such
programme
Do not require credit
It is too risky
It is not a culturally acceptable practice
Can't spare time for such programmes
The terms and conditions of the programme are quite strict
Applied for the programme but was not accepted

Microfinance in Afghanistan: A baseline and initial impact study for MISFA September 2007 30
Table 6.1 Duration of MFI membership
Frequency Percentage
0–6 months 282 45.78
7–12 months 139 22.56
13–18 months 100 16.23
19–24 months 46 7.47
25–30 months 24 3.90
31–36 months 21 3.41
37 months or more 4 0.65
Total 616 100.00
Alternative sources of loan
We next look at where clients, non-clients and dropouts raised credit from before the clients joined the microfinance programme. In other words what alternative sources of credit were/are available?
Figure 6.2 Alternative sources of loan
Figure 6.2 shows that 65 per cent did not take any loans or did not have access to any loans (a more likely scenario). For those who took loans, friends, relatives and employers were the only sources of loans; moneylenders were of negligible importance. Close to 100 per cent of the respondents who reported borrowing from informal sources reported a 0 per cent rate of interest. Two issues come to mind. First, is it true that they were not charged any interest or was their response being guided by customary refrain from the mention of interest payment? The study could not estimate the rate of interest that was being paid to access loans from informal sources of credit as interest on a loan is a taboo and people would not discuss it. But a recent study puts the figure as ranging from 40 per cent to 100 per cent (India Knowledge@Wharton 2007). The second issue is whether interest is charged only in cash or whether there are other ways of discharging the obligations associated with a loan?
65% 14%
16% 1% 4%
No loan
Friend
Relative
Moneylender
Employer

Microfinance in Afghanistan: A baseline and initial impact study for MISFA September 2007 31
Size of informal loans
Informal loans tended to be neither small nor large. If we employ AFN10,000 (approx US$ 200) as the amount separating small loans from large loans, we find that 50 per cent of the informal loans fall on either side of this amount (see Fig. 6.3).
Figure 6.3 Size of informal loans
Uses of informal loans
Along with the size of the loan, the use it is put to will have implications for the loan outcome. It is generally believed that loans that are used for productive purposes will benefit a household in the long run whereas loans used for consumption purposes12 will burden households with increased levels of debt. The findings, as presented in Figure 6.4, suggest a preponderance of consumptive loans in the portfolio of informal loans. Figure 6.4 Informal loan use
Was there an unmet demand for credit?
It would appear that there was an unmet demand for credit more or less uniformly distributed across the three categories of disaggregates with 22.3 per cent of the respondents reporting that they had not been able to procure loans. This percentage was the highest for dropouts (24 per cent) followed by non-clients (23.6 per cent) and clients (20 per cent). The difference in the incidence of unfulfilled credit needs could be a reflection of the marginally better economic status and social network of the clients. The respondents reported inability to procure loans for a number of activities but for the
12 Consumptive loans are defined as loans taken to buy food, for marriage, for health reasons and to repay earlier loans. Loans spent on housing are considered as productive loans. This definition could be debated.
1% 7%
18%
25% 15%
34% 1-500
501-2000
2001-5000
5001-10000
10001-20000
20001 and above
0
20
40
60
80
39.83 60.17Productive Consumptive

Microfinance in Afghanistan: A baseline and initial impact study for MISFA September 2007 32
sample the important ones were health (5.89 per cent), small business (5 per cent), food (3.63 per cent), housing (1.57 per cent) and agricultural input (1.28 per cent).
Size of the first microfinance loan
While the first cycle of microfinance loans was similar to informal loans in being equally divided between small and large loans (AFN10,000 being the dividing line), the average size of microfinance loans was much larger (less than 30 per cent of the first loans being less than AFN7,000). Figure 6.5 gives the details of the distribution of the size of the first cycle of microfinance loan.
Figure 6.5 Size of first formal loan
Use of first microfinance loan
While making a rather arbitrary distinction between productive and consumptive uses of loan, we also suggested why productive loans were more beneficial in the long run than the consumptive loans. In short, productive usage of loans is expected to build assets and productivity thereby increasing income and welfare. Not all first loans taken under the microfinance programme were used for productive purposes but the consumptive use of the first loan was rather small (see Fig. 6.6).
Figure 6.6 Usage pattern of first loan
1% 17%
12%
51%
6%
7% 6% 1000-3000
3001-5000
5001-7000
7001-10000
10001-15000
15001-20000
20001 and more
0 20
40 60
80 100
88.89 11.11Productive Consumptive

Microfinance in Afghanistan: A baseline and initial impact study for MISFA September 2007 33
How did usage pattern behave with successive loans?
Figure 6.7 shows that productive loan use increased in each successive loan cycle until it reached 100 per cent by the fourth loan.
Figure 6.7 Productive use of successive MFI loans
Distribution of clients against loan cycles
Close to half of the clients were six months or less into the programme. In other words, if client data on the loan cycles engaged in were plotted in the shape an age pyramid, the pyramid would be bottom heavy and would taper off sharply towards the top. Figure 6.8 shows this distribution.
Figure 6.8 Frequency distribution by number of MFI loans taken
Size of progressive loans
The proportion of large loans in the total loans extended shows an interesting trend. The proportion of such loans increases rapidly up to the third loan before declining equally dramatically for the fourth loan (Fig. 6.9).
80 85
90 95
100105
88.89 90.73 95.54 100Loan 1 Loan 2 Loan 3 Loan 4
0
200
400
600
800
603 313 112 25 One Loan Two Loans Three Loans Four Loans

Microfinance in Afghanistan: A baseline and initial impact study for MISFA September 2007 34
Figure 6.9 Large loans: trends
We do not have any ready explanations for this trend but could make a few conjectures. It could be that the business stabilises by the fourth loan cycle and therefore a smaller loan size is more appropriate. It could also be that, given the wider economic context, small businesses face a glass ceiling to expansion and reach it by the fourth loan cycle. Changes in proportions of loan use with each progressive loan cycle and the elimination of certain categories of loan use suggest that it is very likely that many categories of loan use do not find avenues for expansion beyond a certain point. Table 6.2 suggests that only a few loan uses such as livestock rearing, small business, and self-employment can sustain themselves beyond a certain number of loan cycles.
Table 6.2 Loan intake by activity
Use Loan 1 Loan 2 Loan 3 Loan 4
Housing 3.15 3.83 2.68 0
Agricultural input 4.98 4.15 1.79 0
Land 0.33 0 0 0
Livestock 10.95 8.31 3.57 0
Small business 55.39 59.42 68.75 64.00
Self-employment 11.61 12.46 15.18 36.00
Manufacturing 2.49 2.56 3.57 0
Marriage 0.33 0 0 0
Health 4.31 4.15 2.68 0
Food 3.81 3.83 0.89 0
Repay earlier loans 2.16 0.96 0 0
Other 0.50 0.32 0.89 0 However, as we said, these are surmises that could benefit from further research. On a firmer note, the findings on trends in the proportion of big loans versus small loans, productive versus consumptive loans, and progressive concentration of loan intake into a few activities suggest a maturing of clients and the microfinance sector with progressive loan cycles.
0
20
40
60
80
48.59 55.59 75.89 56.00Loan1 Loan2 Loan3 Loan4

Microfinance in Afghanistan: A baseline and initial impact study for MISFA September 2007 35
Spin-offs from the sector
Business activity
Microfinance loans have been used almost exclusively for productive purposes. But that does not necessarily mean that they have all led to the setting up of new businesses or expansion of existing businesses. Loans used for housing purposes may improve the condition of production facilities (home-based business enterprises). Loans used to procure agricultural input or make improvements on agricultural land may similarly not qualify as expansion of an old business or setting up of a new one. But these are all productive uses of loans. We should interpret Figure 6.10 with this caveat in mind. The figure shows what percentage of client households set up new businesses and what percentage of client households expanded existing businesses with the loans that they took. It also shows what percentage of client households did neither of the two.
Figure 6.10 New businesses versus expansion
0 10 20 30 40 50 60
18.99 27.92 53.08No activity Start-up Expansion

Microfinance in Afghanistan: A baseline and initial impact study for MISFA September 2007 36
Employment creation
Such a high percentage of expansions and start-ups should logically create job opportunities for entrepreneurs and for people that they would need to hire.13 Expansions and start-ups have provided job opportunities for 414 entrepreneurs and have also allowed 264 clients to employ other people from within and outside the household, either full time or part time. It is estimated that every client generates 1.5 employment opportunities. This figure, extrapolated to all MISFA clients would add up to 500,000 jobs.14 The details of employment beyond self are given in Figure 6.11.
Figure 6.11 Number employed (excluding the entrepreneur)
In all, 441 self-employment and 551 additional employment opportunities for others were created by clients through expansions and start-ups:15 ● 36.30 per cent of new clients generated employment opportunities for others while
48.90 per cent of the old clients did the same.
● 35.6 per cent of female clients started new businesses as against 11.82 per cent of
male clients.
● 63.68 per cent of female clients and 74.38 per cent of male clients generated
employment for themselves.
● 42.37 per cent of female clients and 43.34 per cent of male clients generated
employment opportunities for other individuals.
● 46.75 per cent of urban clients generated employment opportunities for others. This
figure was lower for rural clients at 39 per cent.
13 The concern for job creation resonates increasingly in the microfinance industry itself: major microfinance networks justify their work also with the expected impact on job creation. Opportunity International (2004: 7), for example, claimed to have created or maintained over 1.2 million jobs in 2004 worldwide. 14 ‘Of course, it can be argued that the word “employment” may not actually mean full time, stable and remunerated jobs, but also largely unpaid family jobs. Indeed, the notion “employment” is elusive in an environment like the informal economy where most clients are own account workers’ (Balkenhol 2005). 15 The AIMS survey of the Self Employed Women’s Association (SEWA) in India found that participation ‘led to some modest employment creation’ (Chen and Snodgrass 2001: 98). The findings of the AIMS survey of Mibanco in Peru (Dunn and Arbuckle 2001) extrapolated to the 40,000 MIBANCO clients in 1999 would amount to 4,3 million more work days per year, the equivalent of 17300 full time jobs, of which 6300 paid jobs for non household members’ (Balkenhol 2005).
0 50
100150200
192 54 14 2 21-2 3-4 5-6 7-8 9-10

Microfinance in Afghanistan: A baseline and initial impact study for MISFA September 2007 37
● In urban areas loans have led to 27 per cent start-ups while in rural areas there have
been 28.5 per cent start-ups.
Economic welfare
Microfinance is expected to increase household income by making credit available to households, which is then used to build assets and increase income. Hulme and Mosley (1996), in their study of Grameen Bank in Bangladesh and the Bank Rakyat Indonesia (BRI), uncovered a positive impact on the income of borrowers with, on average, an increase over the control groups ranging from 10–12 per cent in Indonesia to around 30 per cent in Bangladesh and India. Is the same happening in Afghanistan? We began by asking respondents what trends they detected in their household economic situation in the previous 12 months (Fig. 6.12).
Figure 6.12 Trends in economic situation
The improvement in the economic situation of clients was significantly higher than the improvement in the economic well-being of non-clients and dropouts.16 Dropouts, as usual, performed poorly compared to the other two categories. We cross-checked these results by looking at the trends in savings over the previous 12 months; 46 per cent of clients reported having savings as against 31 per cent of non-clients and 24 per cent of dropouts. The results were as anticipated. Clients were significantly better off than both non-clients and dropouts.
16 Pitt and Khandker (1998), in their study on the impact of microfinance in Bangladesh, reported that the programme had a positive effect on household consumption, which was significantly greater for female borrowers. On average, a loan of BDT100 to a female borrower, after it is repaid, allows a net consumption increase of BDT18. In terms of poverty impact it is estimated that 5 per cent of participant households are pulled above the poverty line annually.
0
50
100
Non-client 2.30 50.66 25.33 17.11 4.61 Client 3.25 71.59 15.58 9.09 0.49 Dropout 4.04 43.43 21.21 28.28 3.03
Remarkably better
Slightlybetter
Same Slightlyworse
Much worse
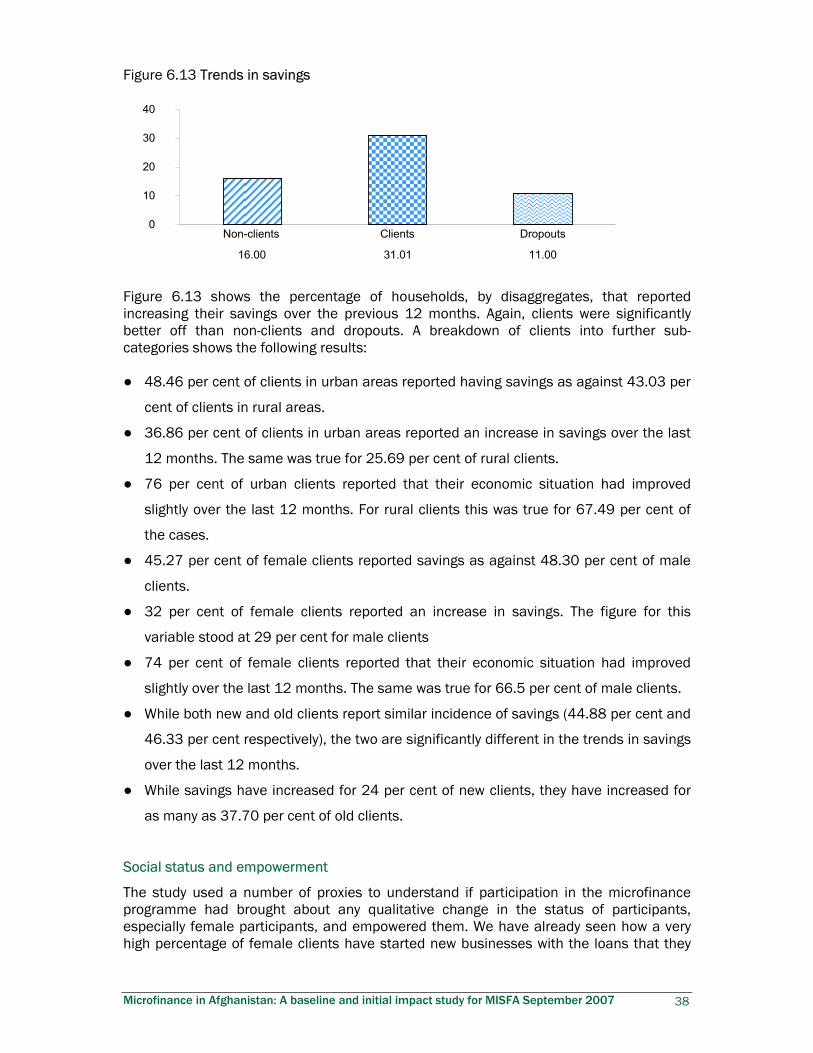
Microfinance in Afghanistan: A baseline and initial impact study for MISFA September 2007 38
Figure 6.13 Trends in savings
Figure 6.13 shows the percentage of households, by disaggregates, that reported increasing their savings over the previous 12 months. Again, clients were significantly better off than non-clients and dropouts. A breakdown of clients into further sub-categories shows the following results: ● 48.46 per cent of clients in urban areas reported having savings as against 43.03 per
cent of clients in rural areas.
● 36.86 per cent of clients in urban areas reported an increase in savings over the last
12 months. The same was true for 25.69 per cent of rural clients.
● 76 per cent of urban clients reported that their economic situation had improved
slightly over the last 12 months. For rural clients this was true for 67.49 per cent of
the cases.
● 45.27 per cent of female clients reported savings as against 48.30 per cent of male
clients.
● 32 per cent of female clients reported an increase in savings. The figure for this
variable stood at 29 per cent for male clients
● 74 per cent of female clients reported that their economic situation had improved
slightly over the last 12 months. The same was true for 66.5 per cent of male clients.
● While both new and old clients report similar incidence of savings (44.88 per cent and
46.33 per cent respectively), the two are significantly different in the trends in savings
over the last 12 months.
● While savings have increased for 24 per cent of new clients, they have increased for
as many as 37.70 per cent of old clients.
Social status and empowerment
The study used a number of proxies to understand if participation in the microfinance programme had brought about any qualitative change in the status of participants, especially female participants, and empowered them. We have already seen how a very high percentage of female clients have started new businesses with the loans that they
0
10
20
30
40
16.00 31.01 11.00
Non-clients Clients Dropouts

Microfinance in Afghanistan: A baseline and initial impact study for MISFA September 2007 39
took and have, in the process, created employment opportunities for themselves and for others. We asked male and female clients if participation in the microfinance programme and what they had been able to do in its wake had changed the perceptions of male and female relatives within and outside the immediate household. The response is presented in Figure 6.14.
Figure 6.14 Positive change in the perception of relatives
As the response is so overwhelmingly positive, the likelihood that it would vary across male and female clients, old and new clients, and rural and urban clients is non-existent. We have, therefore, not presented findings for this variable by these sub-categories. We also asked client respondents who took decisions on loan use. The results were unexpected. Only 50 female clients said that the decisions were taken exclusively by their male relatives. Most clients (male and female) said that decisions were either joint or taken exclusively by the clients themselves.17 Table 6.3 presents results on decision-making pertaining to loan use. It is important to remember that these are aggregate results which we will analyse in detail by sub-categories of client to see if there are any differences that allow us to make any further deductions.
Table 6.3 Decision on loan use
Who makes decision Frequency Percentage
Client 298 48.38
Client in consultation with wife/husband 200 32.47
Client in consultation with male relatives 62 10.06
Client in consultation with female relatives 4 0.65
Male relative of client (husband, brother, father) 50 8.12
Female relative of client (wife, sister, mother) 2 0.32
Total 616 100.00
17 In Pakistan, studies carried out by Kashf Foundation suggest that ‘about 30% - 40% per cent of clients worked for their own account in 2003. For the remaining clients, their spouse or sons or blood relatives used credit for family businesses’ (Balkenhol 2005).
76
78
80
82
84
83.60 81.98 79.06
Husband/wife Other male relatives Other female relatives

Microfinance in Afghanistan: A baseline and initial impact study for MISFA September 2007 40
● Independent decision-making was reported by 52 per cent of new clients while only
45 per cent of old clients reported it.
● Joint decision-making (husband and wife) was reported by 29 per cent of new clients
and 35.5 per cent of old clients.
● Male relatives decided for 9 per cent of new clients (read female clients) and for
about 7 per cent of long-standing female clients.
● 34.6 per cent of female clients reported taking loan use decisions independently
while 76.35 per cent male clients did so.
● 42.85 per cent of female clients reported that they took loan usage decisions jointly
with their husbands. Only 10.83 per cent of male clients took their wives into
confidence on loan use decisions.
● Independent decision-making on loan use in urban areas was reported by 53.24 per
cent of the clients. In rural areas, the same was reported by 43.96 per cent of the
clients.
It could be argued that where women are taking independent decisions on loan use, they are at once becoming empowered and expressing this sense of empowerment or operationalising it. Even when they are taking decisions in consultation with their husbands or other male relatives, they have acquired a platform to engage with their male counterparts in affairs that are more secular and pertain to public life, beyond the domain of what is strictly household. These negotiations will, one hopes, enable women to engage men in a dialogue that is less dictated by tradition and cultural understanding of gender-defined roles. When a conflict is at its most intense women, it is suggested, take the centre stage as men are gone. However, when normalcy is restored, women once again start to recede into more traditional roles. This may be true but given the fact that 42.85 per cent of female clients decide on loan usage in consultation with their husbands and 10.83 per cent of male clients discuss loan use with their wives, it would appear that females are not merely filling the boots of absent male relatives. We also tried to examine the issue of horizontal social capital formation by virtue of being associated with microfinance groups. We began by asking respondents about more general associations with group members such as their relationship with group members and went progressively down to more personal manifestations of this association. Findings include the following: ● 5.84 per cent of clients reported sharing a very good relationship with the other group
members and 91.23 per cent clients reported that their relationship with the other
group members was good.
● 48.86 per cent clients reported that they could rely on group members to give them
advice on social matters and would seek such advice from them.
● Only 29.70 per cent of the clients said that they would seek advice from group
members on business matters.

Microfinance in Afghanistan: A baseline and initial impact study for MISFA September 2007 41
● Only 8.6 per cent of the clients reported that they could count on group members for
material support in times of need.
The progressive decline in the percentage as questions moved from impersonal and vague to personal and specific suggests that even though group formation has led to the building of an identity around the group, this identity is weak and probably in need of a conscious effort at fostering.

Microfinance in Afghanistan: A baseline and initial impact study for MISFA September 2007 42
Hypotheses tested in this chapter
1. Microfinance has helped to start new economic activities and expand existing
economic activities (see Fig. 6.15).
Figure 6.15 Start-ups and expansions with loans
2. Microfinance has created jobs and contributed to reduction in unemployment
● Microfinance loans have provided self-employment for 414 individuals in the sample.
● In addition microfinance has also generated employment for 551 individuals within
and outside the immediate family.
3. Women participants of microfinance enjoy a higher social status
● 80 per cent of female respondents reported an ‘improved attitude’ in their husbands
and other relatives, both male and female, since joining the microfinance programme.
4. Participation in the microfinance programme has led to social networks for women
● 47.22 per cent of the women reported that they could rely on their group members for
advice on social matters.
34%
66%
Start up
Expansion
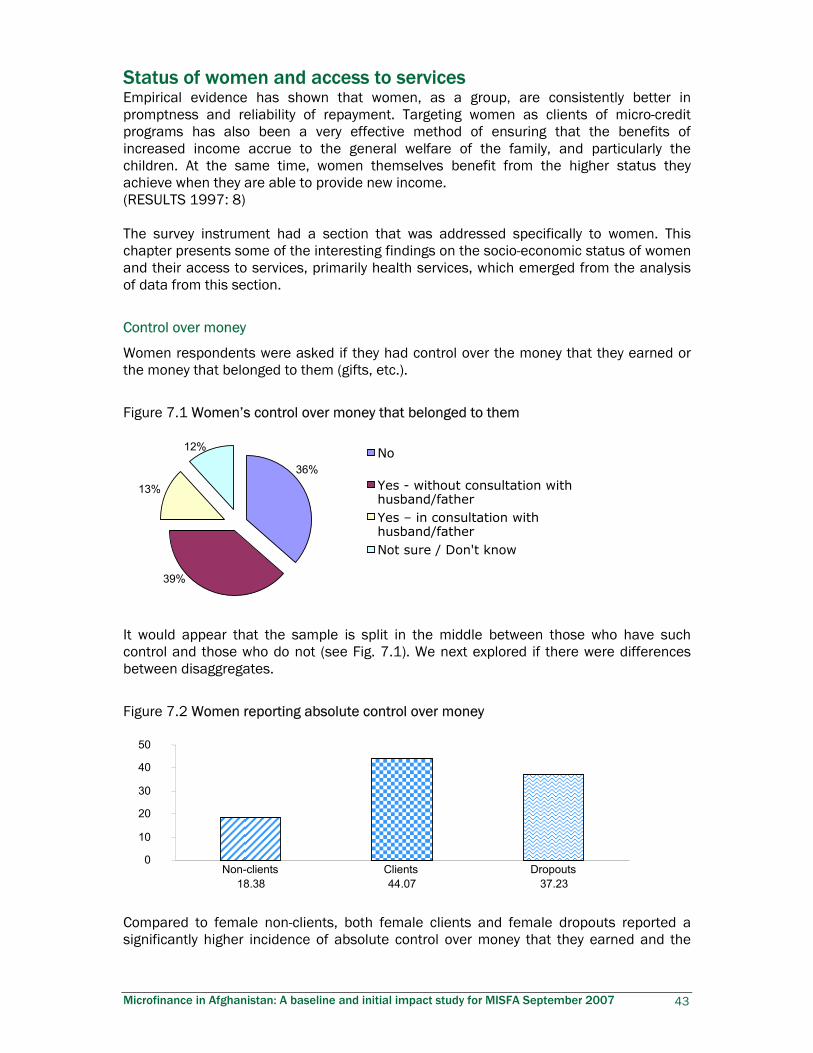
Microfinance in Afghanistan: A baseline and initial impact study for MISFA September 2007 43
Status of women and access to services Empirical evidence has shown that women, as a group, are consistently better in promptness and reliability of repayment. Targeting women as clients of micro-credit programs has also been a very effective method of ensuring that the benefits of increased income accrue to the general welfare of the family, and particularly the children. At the same time, women themselves benefit from the higher status they achieve when they are able to provide new income. (RESULTS 1997: 8) The survey instrument had a section that was addressed specifically to women. This chapter presents some of the interesting findings on the socio-economic status of women and their access to services, primarily health services, which emerged from the analysis of data from this section.
Control over money
Women respondents were asked if they had control over the money that they earned or the money that belonged to them (gifts, etc.).
Figure 7.1 Women’s control over money that belonged to them
It would appear that the sample is split in the middle between those who have such control and those who do not (see Fig. 7.1). We next explored if there were differences between disaggregates.
Figure 7.2 Women reporting absolute control over money
Compared to female non-clients, both female clients and female dropouts reported a significantly higher incidence of absolute control over money that they earned and the
36%
39%
13%
12% No
Yes - without consultation withhusband/father Yes – in consultation withhusband/fatherNot sure / Don't know
0 10 20 30 40 50
18.38 44.07 37.23Non-clients Clients Dropouts
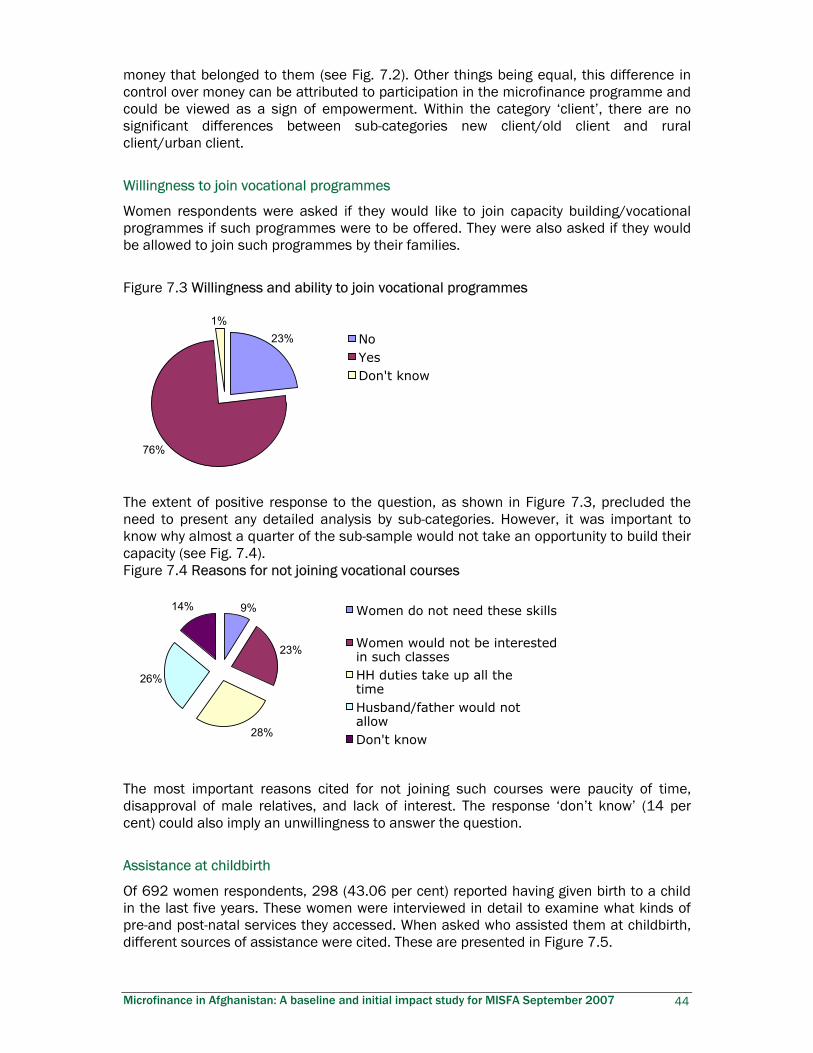
Microfinance in Afghanistan: A baseline and initial impact study for MISFA September 2007 44
money that belonged to them (see Fig. 7.2). Other things being equal, this difference in control over money can be attributed to participation in the microfinance programme and could be viewed as a sign of empowerment. Within the category ‘client’, there are no significant differences between sub-categories new client/old client and rural client/urban client.
Willingness to join vocational programmes
Women respondents were asked if they would like to join capacity building/vocational programmes if such programmes were to be offered. They were also asked if they would be allowed to join such programmes by their families.
Figure 7.3 Willingness and ability to join vocational programmes
The extent of positive response to the question, as shown in Figure 7.3, precluded the need to present any detailed analysis by sub-categories. However, it was important to know why almost a quarter of the sub-sample would not take an opportunity to build their capacity (see Fig. 7.4). Figure 7.4 Reasons for not joining vocational courses
The most important reasons cited for not joining such courses were paucity of time, disapproval of male relatives, and lack of interest. The response ‘don’t know’ (14 per cent) could also imply an unwillingness to answer the question.
Assistance at childbirth
Of 692 women respondents, 298 (43.06 per cent) reported having given birth to a child in the last five years. These women were interviewed in detail to examine what kinds of pre-and post-natal services they accessed. When asked who assisted them at childbirth, different sources of assistance were cited. These are presented in Figure 7.5.
9%
23%
28%
26%
14% Women do not need these skills
Women would not be interestedin such classesHH duties take up all thetimeHusband/father would notallowDon't know
23%
76%
1% NoYesDon't know

Microfinance in Afghanistan: A baseline and initial impact study for MISFA September 2007 45
Figure 7.5 Assistance at childbirth
Surprisingly, doctors and trained birth attendants were important sources of assistance. Untrained attendants as a sum total of likely untrained categories were also well represented (one would not expect neighbours and relatives to be trained birth attendants though they might well be so). The example of dropouts on assistance at childbirth (highlighted in Table 7.1) suggests that economic resources or economic well-being or even awareness alone will not determine who accesses what services. In this example we find that the dropouts reported the highest rate of being assisted at the time of childbirth by a doctor.
Table 7.1 Assistance at childbirth
Traditional birth attendant
Trained birth attendant Nurse Doctor Relative Neighbour None
Non-client 6 12 3 21 19 1 1
% 9.52 19.05 4.76 33.33 30.16 1.59 1.59
Client 30 38 7 68 47 7 4
% 14.93 18.91 3.48 33.83 23.38 3.48 1.99
Dropout 3 5 2 17 4 2 1
% 8.82 14.71 5.88 50.00 11.76 5.88 2.94
Total 39 55 12 106 70 10 6
% 13.09 18.46 4.03 35.57 23.49 3.36 2.01
Immunisation cards
The female respondents were next asked if their children had immunisation cards (Fig. 7.6).
13%
18%
4% 37%
23%
3% 2% Traditional birth attendant
Trained birth attendant
Nurse
Doctor
Relative
Neighbour
None

Microfinance in Afghanistan: A baseline and initial impact study for MISFA September 2007 46
Figure 7.6 Penetration of immunisation cards
This was, once again, a pleasantly surprising finding, for such a high rate of penetration for immunisation cards was unexpected. The rate was significantly higher for clients than for non-clients (Fig. 7.7). Figure 7.7 Penetration of immunisation cards by disaggregates
Incidence of illness and seeking medical advice
We next asked female respondents if their child had suffered cough/cold/fever (proxy for illness) in the last two weeks and if so whether they had been given any treatment: 41.61 per cent answered the first question in the affirmative. Of these, 73.39 per cent reported having sought medical advice in the wake of illness. The non-client respondents reported a significantly lower rate of accessing medical advice in the wake of the illness of children compared to clients and dropouts. Figure 7.8 shows that the rate was the highest among clients.
Figure 7.8 Women seeking medical advice for illness of children
0 20 40 60 80
100
12.42 87.58
No Yes
70 75 80 85 90 95
79.37 90.55 85.29Non-client Client Dropout
0 20 40 60 80
100
59.09 77.38 72.22Non-client Client Dropout

Microfinance in Afghanistan: A baseline and initial impact study for MISFA September 2007 47
● 89.41 per cent of rural clients who qualified for this question reported having
immunisation cards. For urban clients, the response stood at 91.28 per cent
● 81.08 per cent of urban client households sought medical advice when the child fell
ill. 74.46 per cent of rural clients did the same.

Microfinance in Afghanistan: A baseline and initial impact study for MISFA September 2007 48
Hypotheses tested in this chapter
1. Women participants of microfinance enjoy a higher socio-economic status than non-
participant women.
● Women participants reporting ‘absolute control’ over the money that they earned:
- Clients 44.10 per cent
- Non-clients 18.4 per cent
- Dropouts 37.2 per cent.
2. More client households than non-client households access health services.
● 90.55 per cent of relevant client households reported having immunisation cards as
against 79.37 per cent of non-client households.
● 77.38 per cent of client households with ill children in the two weeks preceding the
survey sought medical advice. Only 59.09 per cent of non-client households did the
same.
3. The level of awareness is higher among those women who are participants in the
microfinance programme.
● Women respondents were asked why iodised salt was important. This question was a
proxy for the level of awareness, which was low. Only 15.54 per cent of non-client
women responded by saying that iodised salt prevented goitre, the right answer. The
percentage was 15.94 for dropouts and 20 per cent for client respondents giving the
right answer.
Conclusion
The findings of this study suggest that the microfinance programme has benefited women and has improved their socio-economic status. This is indeed found to be true for microfinance programmes in other parts of the world especially South Asia.
The available evidence does point to a considerable potential of micro-finance for
empowerment…many women, particularly in programmes targeting women
entrepreneurs, decide on the loan use and invest in income-earning activities…Even
where women do not directly control incomes, perceptions of their contribution to the
household have changed. Increased confidence through interaction with program
[sic] staff and groups has improved their role in decision-making within the
household.
(Mayoux 2007a: 12)

Microfinance in Afghanistan: A baseline and initial impact study for MISFA September 2007 49
Having said this, it is important to recognise yet again that the microfinance sector is a small component of the socio-economic dynamics playing out in Afghanistan today. There are serious limitations to what it can achieve on its own. Gender inequalities at the household and community levels are reinforced by microeconomic environment, macroeconomic policies, legislation and social programmes (Johnson and Kidder 1999; Mayoux 2000b).
These inequalities seriously constrain women’s access to markets and their ability to
negotiate change. Inequalities also underlie entrenched and all pervasive institutional
gender discrimination. These constraints in turn considerably limit the degree to
which women can use access to savings and credit to increase incomes and well-
being.
(Mayoux 2000a: 15–16)

Microfinance in Afghanistan: A baseline and initial impact study for MISFA September 2007 50
Dropouts One of the dominant themes in the analysis presented in various chapters of this report is the relative economic poverty of the dropouts. The dropouts perform worse than both clients and non-clients when it comes to economic indicators of well-being such as assets and savings and in trends in economic well-being, etc. It might not be off the mark to suggest that among those who join the programme, the poorest are the most likely to drop out. In this chapter, we present findings that would help us to substantiate this view.
Duration of stay with the programme
We began by asking dropouts how long they continued in the programme before dropping out. Figure 8.1 shows that 65 per cent dropped out within one year.
Figure 8.1 Duration of stay with MFI (in years)
This means that most of the households that dropped out did so after one loan.18 One loan would hardly have any impact on their material well-being unless it was taken to tide them over a specific problem. The next questions asked whose decision it was to drop out and what brought it about.
Decision to exit the programme
Close to 50 per cent of the dropouts reported that it was a personal decision. For many others (37 per cent), it was a decision taken by their male relatives. Some reported it to be a family decision (see Figure 8.2). The important point to make here is that not one respondent mentioned social or religious reasons for dropping out even though that option was available to respondents in the list of responses. Not a single respondent cited pressure from outside the family as the reason for dropping out of the programme. What, then, were the important reasons for dropping out?
Figure 8.2 Whose decision was it to leave the programme?
18 Dropouts came exclusively from BRAC where a loan cycle is one year.
0 10 20 30 40 50 60
12.00 53.00 30.00 5.00<1 1 2 3
49%
37%
14% Own
Husband/father/brother/othermale relative
Joint family decision

Microfinance in Afghanistan: A baseline and initial impact study for MISFA September 2007 51
Reasons for exiting the programme
Table 8.1 shows that 30 per cent of the respondents reported that they had benefited from the programme and did not need credit any more; 20 per cent of the dropouts reported dropping out because they thought that the interest rate was very high; 18 per cent dropped out because they found it difficult to repay on time; and 15 per cent reported dropping out as they could not save.19 Of those who spent two or more years with the programme (only 35 observations), close to 40 per cent cited ‘not needing credit any more’ as the reason for leaving the programme. For those who left the programme in less than two years (65 observations), only 26 per cent cited not needing credit as the reason for leaving the programme. For those who left the programme in less than a year (12 observations), 75 per cent cited high rate of interest as the reason for leaving the programme. These findings suggest that among dropouts the poorest would be the first to drop out and, most likely, within a year of joining the programme. In other words, it is not surprising that most of those who cited not needing credit as the reason for leaving the programme came from the group that lasted two or more years in the microfinance programme. This translates to two or three loan cycles. We next see if we have any other reasons to believe that the dropouts are, on average, the poorest of the three categories of disaggregates. Table 8.1 Reasons for dropping out of the programme
Frequency Percent
Can't save 15 15.15
Unable to withdraw savings 2 2.02
Less interest on savings 2 2.02
Small loan amounts 2 2.02
High interest on credit 20 20.20
Interest charged by MFI is against the tenets of Islam 3 3.03
Could not repay loan in time 18 18.18
Migration 2 2.02
Family pressure 2 2.02
Have benefited, no longer needed 30 30.30
Prefer informal sources 2 2.02
Group problems 1 1.01
Total 99 100.00
Are dropouts the poorest section?
In analysing the data for this report, we used AFN10,000 as the amount separating large loans from small loans. We saw that 48.59 per cent of the first loans for clients were large loans. For the dropouts interviewed, only 28 per cent (28 observations) of the first loans were large. Of these 28 loans, 22 were borderline loans of AFN10,000. While for
19 Savings are mandatory for BRAC clients.

Microfinance in Afghanistan: A baseline and initial impact study for MISFA September 2007 52
clients 55.59 per cent of the second loans were large loans, for dropouts this percentage was 60 per cent (40 dropouts from the sample reported taking a second loan). The interesting feature is that taking out a second loan means at least two years of programme involvement. The poorest households drop out in the first year itself. Therefore, if the percentage of large loans among dropouts converges with the percentage of large loans among clients at the stage of the second loan cycle, it probably suggests the merging of their economic status as well. Most of the poor are weeded out within the first year of joining the programme.
Conclusion
In conclusion, there are strong reasons to believe that most dropouts would drop out within the first year of joining the programme. They would be poorer than those who would continue in the programme and would be compelled to drop out because of reasons that could be attributed to their poor economic state. Does this mean that the programme has no impact on them whatsoever? We can point out various levels of impact. Probably these households do not benefit economically, but it would appear that they definitely benefit socially from their association with the programme. The dropout women are more receptive to the idea of training, have better networks, access services more, are more aware, and report a greater control over money that belongs to them. We have already considered the idea that the rate at which they access certain services and amenities is higher than the rate for clients and non-clients could be attributed to their urban location. But there is more to it than mere location.

Microfinance in Afghanistan: A baseline and initial impact study for MISFA September 2007 53
Indicators for MFIs There is near unanimous consensus that financial sustainability is a crucial gauge of the success of microfinance institutions…But for most microfinance practitioners and funders, it is also important to reach poor and very poor people, to provide quality services, and most importantly to improve clients’ lives.
(Hashemi 2007: 1) The idea of microfinance is grounded in the belief that making credit available to the poor will help them engage in productive pursuits, which, in turn, will help improve their socio-economic status. It makes sense that stakeholders would like to know whether socio-economic advancement is taking place. Are there some robust indicators that the programme and its partners could monitor, with little financial, human and technical commitment, to track the progress of client households? The answer to this question cannot be a straight yes or no as there is no consensus on whether it is possible or not, or, if it is possible, on what set of indicators could be employed to track changes in the socio-economic status of the microfinance clients. Some examples from our study highlight this point: ● It can be some time before a change in asset portfolio is detected. This does not
mean that a household cannot or will not progress or regress in the meantime.
● Access to amenities and services as an indicator of well-being or programme impact is influenced, to a large extent, by location. If one lives close to a service or in an area where an amenity is readily available, one is more likely to access such a service or amenity. This, however, does not necessarily mean that those who are not accessing such a service or amenity are worse off, or, if they are worse off, that this cannot be attributed to the ineffectiveness of the programme.
● The rate of enrolment of children of school-going age is cited as an indicator of well-being. It may be so. But a report by Amnesty International (2005) cites security concerns and fears of kidnapping as the reasons that have kept girls away from school even in supposedly secure locations such as Kabul. In a situation such as this, would a low rate of enrolment among the children of client households, or a rate that is comparable to non-client households, be an indicator of programmatic failure?
Having said this, it is recognised that indicators are needed to monitor progress. There has been a lot of work done on indicators to track social performance. The Consultative Group to Assist the Poor (CGAP) has been at the forefront of such efforts. But in spite of best efforts, there is not, so far, a set of universally accepted and applied indicators. We feel that such indicators should be informed by the objectives of the programme and the context in which the programme is being implemented. There cannot be a generic set of indicators that would hold true for all places and all times. Furthermore, given the limited capacity of those who would collect information on such indicators and those who would provide such information, the indicators and the information they require, to be translated into meaningful tools, should be kept simple. The findings that emerge should be looked upon as trends and approximation rather than as the final word on the situation. A list of recommended indicators is presented in the Appendix 3. The indicators are divided into three categories: those pertaining to the supply side (satisfaction with

Microfinance in Afghanistan: A baseline and initial impact study for MISFA September 2007 54
services), targeting (proportion of clients below the national poverty line) and progress (socio-economic advancement). The indicators on targeting, also called poverty score cards, rely on income/expenditure data to place households below or above the poverty line. These indicators make use of select variables, which strongly correlate with different levels of income/expenditure, to predict the poverty status of households. Unfortunately, reliable income/expenditure data for Afghanistan is not yet available. Therefore, this study will recommend only supply-side and progress indicators. There are different social performance assessment tools available. Well-known tools include CERISE Social Performance Indicator Initiative (focus on institutional process and internal assessment), CGAP, Ford Foundation (focus on poverty profiles and change outcomes), Grameen, Micro-Credit Ratings International Limited (M-CRIL) and Microfinanza (focus on intent, design, and client level information on outputs). While trying to assimilate the best from these tools, the study has relied primarily on indicators recommended by the US Agency for International Development (USAID) and the Social Impact Measurement Project (INAFI–Oxfam Novib-Ordina), and some of the indicators have been adopted from the MISFA survey questionnaire.20 Appendix 3 presents a set of 19 indicators. These indicators could be grouped under economic/expenditure indicators (assets including livestock and savings), social (education and health), empowerment of women (control over loan use and income derived from loan use), and service side of credit (level of satisfaction with MFI). These indicators also effectively cover the millennium development goals. We feel that these indicators or some of these indicators might be effective in shedding light on the trends in the welfare status of households. These indicators are informed by the objectives of the programme and are grounded in the findings of this study. They should be relatively easy to monitor and should approximate the ground situation in the rural and urban areas.
20 USAID Poverty Assessment Tools, www.povertytools.org/USAID_Tools/USAID_Tools.htm; www.inafiinternational.org/cms/index.php?option=com_remository&Itemid=36&func=select&id=4.

Microfinance in Afghanistan: A baseline and initial impact study for MISFA September 2007 55
Conclusion The microfinance sector in Afghanistan is young and has a long way to go, but it has catered to a hitherto unmet demand for credit. While the percentage of those who reported that their credit needs were not met, either partially or fully, was in excess of 20 per cent before the advent of MFIs, it was less than 2 per cent for the MFI clients. The microfinance programme comes across as an inclusive programme. It is spread across the country with the exception of southern Afghanistan, where it is beginning to pick up. There are more than 350,000 clients, spread across different provinces and ethnic groups. To that extent the programme has been inclusive. Almost 70 per cent of the clients are women. Though there was an urban bias when the programme began, today the microfinance programme boasts a strong presence in rural areas of Afghanistan and almost 40 per cent of the clients come from rural areas. And even though urban clients come across as marginally better off on many indicators, one must remember that differences are small and that urban clients have the advantage of an early start. Even though microfinance clients score better than non-clients on the asset index at the aggregate level, it might be prudent to highlight that clients come from diverse categories ranked on the basis of the asset index score. There does not appear to be a programme bias in favour of the better-off sections of the population. On the basis of the asset index, the old clients appear to be marginally better off than the new clients. The difference, in our opinion, is bigger than the findings suggest, as a straight comparison does not factor in natural progression in social and economic well-being. Furthermore, most ‘old’ clients are, realistically speaking, second-cycle clients. For any welfare to translate into meaningful difference in asset portfolio, a year or two is an insignificant time span. The clients are less affected by crisis situation than both the non-clients and the dropouts. It is likely that access to credit, and what such access builds as a buffer, helps clients to deal with shocks better. The clients also perform better than non-clients on issues related to the empowerment of men and women. The overwhelming majority share good relations with fellow group members, which might be the beginning of the formation of a more secular social capital. The clients also access such services as health facilities more than non-clients. Women clients in both rural and urban areas are more enthusiastic about capacity building, report greater autonomy in decision-making, and have a greater control over resources. This, in turn, is reflected in the commercial/business pursuits that they have embarked on with the help of the microfinance programme. Such pursuits by male and female clients have given a boost to economic activity in both rural and urban areas. A number of new businesses have been set up and the old ones have been expanded. This also means job creation. Our estimate is that each client in the sample created 1.5 full-time and part-time employment opportunities. If this estimate is extrapolated to all microfinance clients we arrive at a figure of more than 500,000 full-time and part-time employment opportunities. In a country where job opportunities are few, self-employment and small-scale employment opportunities are crucial to absorb a large employable population looking for jobs. Having said this, there are areas where the programme could benefit from improvement. It would appear that the level of awareness about the programme is far from satisfactory. A large number of non-clients reported not being members of the programme as they were not aware of it. Lack of awareness could have two components: not being aware of

Microfinance in Afghanistan: A baseline and initial impact study for MISFA September 2007 56
the programme at all or not being aware of what the programme is about. Dissemination of information in a simple, easy-to-understand manner might help the programme to gain access to a large chunk of the non-client section. A number of non-clients reported not being members of the programme as they were of the view that the terms and conditions were harsh, the interest rate was high, and that it was too risky to take credit from MFIs. These were also some of the important reasons cited by dropouts for exiting the programme. The impression that taking credit from MFIs is risky is an issue that should be addressed in the process of dissemination of information about the programme. However, other concerns such as perceived high rate of interest or harsh terms and conditions are issues that demand looking at the products being made available and examining whether these can be modified to suit the more conservative prospective clients. One of the major concerns for the sector should be limits to growth. Such limits are reached by the third or fourth loan cycle. Once reached, these limits possibly force clients to drop out. In our sample, as we discussed in the report, the proportion of clients on their third or fourth loans was miniscule. This is, in all likelihood, a good representation of the reality on the ground. It is also true that as clients move from one loan cycle to another, the size of loans increases, consumptive use of loans declines and there is an overall increase in welfare. It is therefore important that the programme should be able to cut back on early dropouts. Currently, most dropouts are likely to exit within the first year of joining the programme. In such an eventuality the benefits that they would derive from the programme would be very small and short lived. The programme could look into helping clients to develop their capacity. It could also provide business development services (BDS), either directly or by collaborating with organisations that are involved in BDS.

Microfinance in Afghanistan: A baseline and initial impact study for MISFA September 2007 57
Appendix 1: Study questionnaire used for data collection
Interviewer code Urban/Rural
Name of interviewer
Province name (pre-fill)
Date of interview District name (pre-fill)
Household code (pre-fill)
Name of village/urban nahia (pre-fill)
Group/Individual Name of sub-village/gozar/mosque
Group code Name of head of household
Cluster code (pre-fill)
Gender of the household head
MFI code Marital status of the household head
Region code Relationship of respondent to head of household
0.1 Are you a member of MFI programme?
0. No 1. Yes, → 1.1
0.2 Why have you not joined the MFI programme?
1. Not aware of any such programme 2. Do not require credit 3. It is too risky 4. It is not a culturally acceptable practice (interest rate) 5. Women should not join such programmes 6. Can’t spare time for such programmes 7. The terms and conditions of the programme are quite strict 8. Applied for the programme but was not accepted

Microfinance in Afghanistan: A baseline and initial impact study for MISFA September 2007 58
1 Male household head
2 Husband
3 Son
4 Son-in-law
5 Brother
6 Brother-in-law
7 Father
8 Grandfather
9 Grandson
10 Uncle
11 Nephew
12 Other male relative
13 Female head household
14 1st Wife
15 2nd Wife
16 3rd Wife
17 Mother
18 Grandmother
19 Daughter
20 Daughter-in-law
21 Sister-in-law
22 Aunt
23 Granddaughter
24 Niece
25 Other female relative
1.8 What are the main reasons of non-enrolment or lack of attendance? Please rank in order of importance up to 2 reasons.
0 School too far away / no school to enrol in
1 Works at home or nearby
2 Didn’t like school / wasn’t learning anything
3 Went as far in school as they need to learn useful skills / education not a priority
4 Poor health / disability
5 Not allowed to enrol by family
6 Not allowed to enrol by school
7 Security concerns / unsafe inappropriate journey to school
8 Marriage during school age
9 Cost of schooling
1.9 List the occupation that member is engaged in
0 Nothing
1 Agriculture
2 Animal rearing
3 wage labour (Ag.)
4 Wage labour (non Ag.)
5 Salaried job (service)
6 Business
1.10 If more than one occupation, which gets you the most money annually
1 Agriculture
2 Animal rearing
3 wage labour (Ag.)
4 Wage labour (non Ag.)
5 Salaried job (service)
6 Business
1.11 If non-resident member, does he or she send money to the household regularly (every month, every three months, every six months)
0 No
1 Yes
1.1 Relationship of all household members to head of household.
Put head of household as #1
1.2 Age of household member
1.3 Can the household member read and write?
0 No
1 Yes
1.4 What kind of school does/did the member go to?
0 No school
1 Madrassa
2 Formal school
1.5 What is highest grade level attained in school for those household members more than 5 yrs old. (i.e. currently enrolled in or grade when left school)
0 No school
1 Primary
2 Secondary
3 High school
4 University college
5 Post-graduate
1.6 For children 6-13 years old only,, are they currently enrolled & regularly attending school?
0 No, → 1.7
1 Yes
1.7 For children 6-13 years old only, do you plan be attend school?
0 No
1 Yes
1st reason 2nd reason
1
2
3
4
5
6
7
8
9
10
11
12
13
14
15
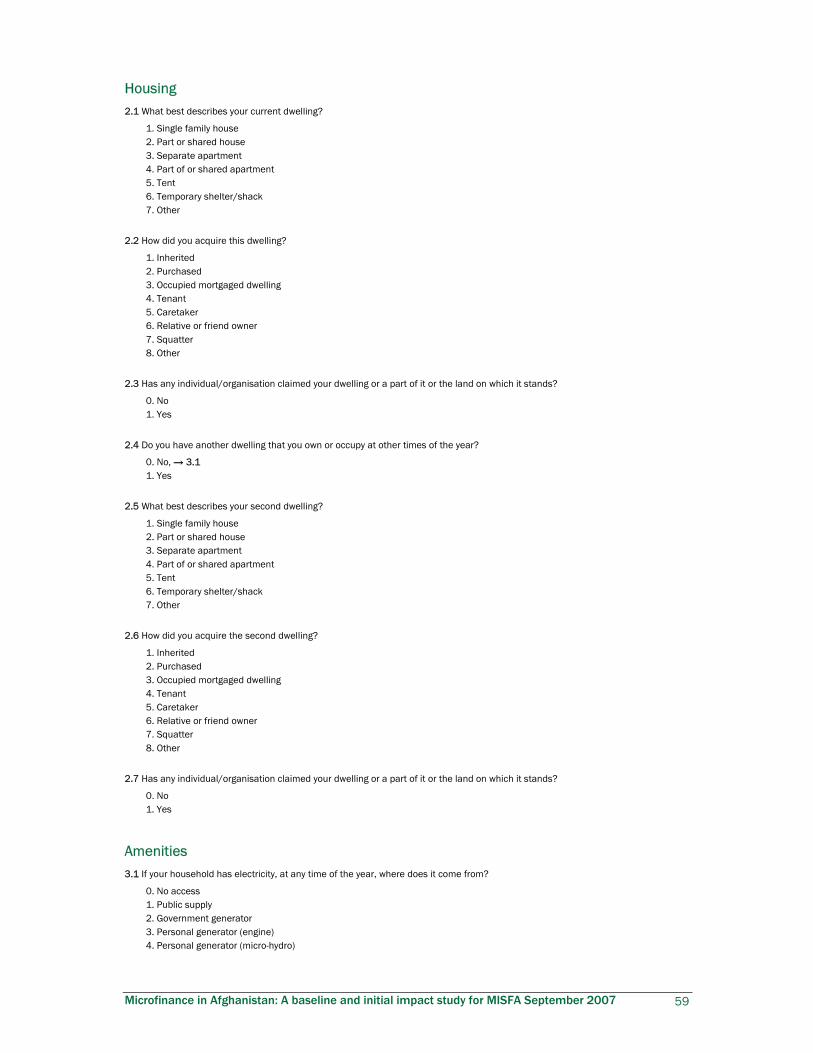
Microfinance in Afghanistan: A baseline and initial impact study for MISFA September 2007 59
Housing 2.1 What best describes your current dwelling?
1. Single family house 2. Part or shared house 3. Separate apartment 4. Part of or shared apartment 5. Tent 6. Temporary shelter/shack 7. Other
2.2 How did you acquire this dwelling?
1. Inherited 2. Purchased 3. Occupied mortgaged dwelling 4. Tenant 5. Caretaker 6. Relative or friend owner 7. Squatter 8. Other
2.3 Has any individual/organisation claimed your dwelling or a part of it or the land on which it stands?
0. No 1. Yes
2.4 Do you have another dwelling that you own or occupy at other times of the year?
0. No, → 3.1 1. Yes
2.5 What best describes your second dwelling?
1. Single family house 2. Part or shared house 3. Separate apartment 4. Part of or shared apartment 5. Tent 6. Temporary shelter/shack 7. Other
2.6 How did you acquire the second dwelling?
1. Inherited 2. Purchased 3. Occupied mortgaged dwelling 4. Tenant 5. Caretaker 6. Relative or friend owner 7. Squatter 8. Other
2.7 Has any individual/organisation claimed your dwelling or a part of it or the land on which it stands?
0. No 1. Yes
Amenities 3.1 If your household has electricity, at any time of the year, where does it come from?
0. No access 1. Public supply 2. Government generator 3. Personal generator (engine) 4. Personal generator (micro-hydro)

Microfinance in Afghanistan: A baseline and initial impact study for MISFA September 2007 60
5. Community generator (engine) 6. Community generator (micro-hydro) 7. Solar
3.2 What is your main source of lighting? (Write the most important source only)
Summer Winter
0. No lighting
1. Lamp oil
2. Candles
3. Electricity
4. Generator
5. Battery
6. Gas
7. Firewood
8. Other
3.3 What is your main source of cooking fuel? (Write the most important source only)
Summer Winter
1. Animal dung
2. Ping or bushes
3. Crop residues or sawdust
4. Firewood
5. Charcoal
6. Kerosene or oil
7. Gas
8. Electricity
9. Other
3.4 What is the main source of heating for this house in winter? (The most important source only)
1. No heating in house, → 3.6 2. Electric heater 3. Gas heater 4. Kerosene heater 5. Firewood 6. Stoves burning straw, ping or manure 7. Charcoal 8. Other
3.5 Which months do you use heating in a year?
Jan Feb Mar Apr May Jun Jul Aug Sep Oct Nov Dec
3.6 What is the current main source of drinking water for your household?
1. Shallow open wells – public 2. Shallow open wells – in compound 3. Hand pump – public 4. Hand pump – in compound 5. Bored wells – hand-pump 6. Bored wells - motorised 7. Spring – unprotected 8. Spring – protected 9. Pipe scheme-gravity
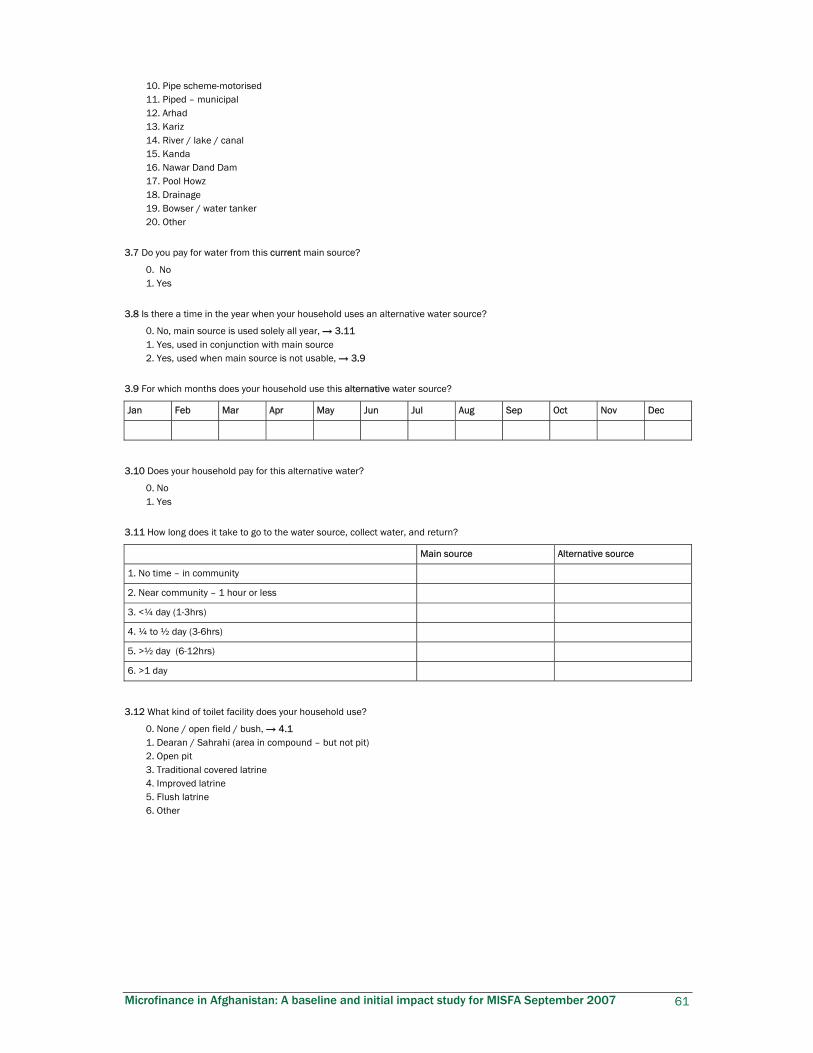
Microfinance in Afghanistan: A baseline and initial impact study for MISFA September 2007 61
10. Pipe scheme-motorised 11. Piped – municipal 12. Arhad 13. Kariz 14. River / lake / canal 15. Kanda 16. Nawar Dand Dam 17. Pool Howz 18. Drainage 19. Bowser / water tanker 20. Other
3.7 Do you pay for water from this current main source?
0. No 1. Yes
3.8 Is there a time in the year when your household uses an alternative water source?
0. No, main source is used solely all year, → 3.11 1. Yes, used in conjunction with main source 2. Yes, used when main source is not usable, → 3.9
3.9 For which months does your household use this alternative water source?
Jan Feb Mar Apr May Jun Jul Aug Sep Oct Nov Dec
3.10 Does your household pay for this alternative water?
0. No 1. Yes
3.11 How long does it take to go to the water source, collect water, and return?
Main source Alternative source
1. No time – in community
2. Near community – 1 hour or less
3. <¼ day (1-3hrs)
4. ¼ to ½ day (3-6hrs)
5. >½ day (6-12hrs)
6. >1 day
3.12 What kind of toilet facility does your household use?
0. None / open field / bush, → 4.1 1. Dearan / Sahrahi (area in compound – but not pit) 2. Open pit 3. Traditional covered latrine 4. Improved latrine 5. Flush latrine 6. Other

Microfinance in Afghanistan: A baseline and initial impact study for MISFA September 2007 62
3.13 Is the toilet facility located within the compound of your household?
0. No 1. Yes
Assets and livestock 4.1 Does your household own any of the following items? (In working condition - where appropriate)
1. Watch / clock 2. Carpets (Khalin) 3. Gilim / Satrangi / Namad / Fash 4. Radio / tape 5. Refrigerator 6. TV 7. VCR / DVD 8. Sewing machine 9. Rug weaving loom 10. Carpentry/ masonry tools 11. Generator 12. Thuraya 13. Hand cart (Karachi) 14. Bicycle 15. Motorcycle 16. Tractor 17. Combine or thresher 18. Plough 19. Cereal grinder mill 20. Car 21. Truck
4.2 How many of the following does your household have?
1. Computers – working
2. Internet users in this household
3. Telephone land lines
4. Mobile phones
4.3 During the last year, did your household?
1. Sell a house 2. Buy a house 3. Construct a new house 4. Sell irrigated land 5. Buy irrigated land 6. Sell rain-fed land 7. Buy rain-fed land 8. Rent-in more land 9. Rent-out more land 10. Sharecrop-out more land 11. Sharecrop-in more land 12. Mortgage-out land 13. Gain more land through mortgage-in 14. Gain new water rights to existing land 15. Gain access to land by using vacant land 16. Lose land because of flooding 17. Lose land because returnee took land back 18. Lose land because of default on mortgage 19. Lose land by force 20. Improve your property
4.4 Do any members of your household own any livestock, including poultry?
0. No, → 5.1

Microfinance in Afghanistan: A baseline and initial impact study for MISFA September 2007 63
1. Yes
4.5 Which and how many of the animals/poultry listed in the table below do you own?
Yes/No Number
Cattle
Oxen / yaks
Horse
Donkey
Camel
Goat
Sheep
Poultry
Land 5.1 Do you or any of your household members own or manage agricultural land or a garden plot (cultivated or fallow)?
0. No, → 6.1 1. Yes, own and manage 2. Yes, only own 3. Yes, only manage
5.2 Please complete the following table
Access Status Claims Size Benefit to household
No 0
Yes 1
Rented 1
Share cropped in 2
Purchased 3
Inherited 4
Other (specify) 5
Not disputed 0
Disputed 1
(in jeribs) No 0
Yes 1
Garden plot
Irrigated agricultural land
Rain-fed agricultural land
Participation in cash-for-work and food-for-work programmes 6.1 Has any member of your household participated in any cash-for-work programmes or income-generating programmes/projects
since the last harvest?
0. No 1. Yes
6.2 Has any member of your household participated in any food-for-work/food aid programmes since the last harvest?
0. No 1. Yes

Microfinance in Afghanistan: A baseline and initial impact study for MISFA September 2007 64
Crisis and coping 7.1 In the last 12 months has the household been negatively affected by any of the following? Rank the top 3 in order of importance.
Coping strategy codes: Reduced food 1; Decreased expenditure 2; Used savings or investments 3; Loans from family/friends 4;
Loans from employer/moneylenders 5; Loans from NGO/MFI 6; Purchased food on credit from traders 7; Sold/mortgaged household
assets 8; Sold/mortgaged productive assets 9; Out migrated 10; Increased/started child labour 11; Begging 12; Others (specify) 13.
Shock Affected
0. NO SHOCKS EXPERIENCED, → 8.1
1. Water shortage
2. Unusually high level of crop pests & diseases
3. Unusually high level livestock diseases
4. Insecurity / violence
5. Reduced availability of grazing areas
6. Earthquakes
7. Landslides/avalanches
8. Flooding
9. Late damaging frosts
10. Heavy rains
11. Unusually high level of human disease
12. Unusually high increases in food prices
13. Unusual decrease in farm gate prices
14. Loss of employment by a household member
15. Reduced salary of a household member
16. Bankruptcy of family business
17. Serious illness accident for working household member
18. Death of a working household member
19. Death of other household member
20. Involuntary loss of house/land
21. Involuntary loss of livestock
Awareness 8.1 Have you ever heard of iodised salt?
0. No, → 9.1 1. Yes
8.2 Why is iodised salt important? (Do not read responses)
0. Don’t know 1. It is tastier than plain salt 2. It is cleaner 3. It prevents goitre 4. It prevents cretinism 5. It makes you smarter 6. It prevents mental retardation 7. It prevents stillbirth 8. It prevents abortion 9. It prevents pregnancy

Microfinance in Afghanistan: A baseline and initial impact study for MISFA September 2007 65
Microfinance 9.1 When did you join the MFI programme? (Client only)
9.2 What were your sources of credit in the preceding 12 months (non-client) or 12 months preceding your joining the MFI (client)?
Use of credit code Source
Housing 1
Agricultural input 2
Land 3
Livestock 4
Small business 5
Self employment 6
Manufacturing 7
Marriage 8
Education 9
Health 10
Food 11
Repay earlier loans 12
Other (specify) 13
Friends 1
Relative 2
Moneylender 3
Employer 4
Amount borrowed
Annual interest rate
Amount paid Amount outstanding

Microfinance in Afghanistan: A baseline and initial impact study for MISFA September 2007 66
9.3 Were some of your credit needs left unfulfilled in the last 12 months (non-client) or 12 months preceding your joining the MFI
(client)?
0. No, → 9.4 1. Yes
Credit need
Housing 1
Agricultural input 2
Land 3
Livestock 4
Small business 5
Self employment 6
Manufacturing 7
Marriage 8
Education 9
Health 10
Food 11
Repay earlier loans 12
Other (specify) 13
No credit Insufficient credit
9.4 Were there instances in the 12 months preceding your joining of MFI (client) or preceding 12 months (non-client) when you had to
sell off assets or/and mortgage assets to tide over lack of/insufficient credit?
No Yes
Sold off assets
Mortgaged assets
Non-client, → 9.15
9.5 How many loans have you taken from MFI? (Clients only)
Loan use code: Housing 1; Agricultural input 2; Land 3; Livestock 4; Small business 5; Self employment 6; Manufacturing 7;
Marriage 8; Education 9; Health 10; Food 11; Repay earlier loans 12; Other 13.
Amount borrowed
Amount paid
Amount outstanding
P1 Amount P2 Amount P3 Amount
Loan1
Loan2
Loan3
Loan4
Total

Microfinance in Afghanistan: A baseline and initial impact study for MISFA September 2007 67
9.6 What have been the uses of MFI credit since you joined the programme? (Client only)
Credit use
Housing 1
Agricultural input 2
Land 3
Livestock 4
Small business 5
Self employment 6
Manufacturing 7
Marriage 8
Education 9
Health 10
Food 11
Repay earlier loans 12
Other (specify) 13
Amount (1st loan) Amount (last loan)
9.7 Who takes decision on loan use? (Client only)
1. I the member, → 9.13 2. I the member in consultation with my wife/husband 3. I the member in consultation with my male relatives 4. I the member in consultation with my female relatives 5. Male relative (husband, brother, father) 6. Female relative (wife, sister, mother)
9.8 How aware are you of the outcomes of loan use (income, expenditure, profits)? (Client only)
1. Highly aware 2. Somewhat aware 3. Not aware at all
9.9 What are the reasons for lack of involvement/awareness? (Client only)
1. The user does not discuss the issue with me 2. I do not have time to discuss the issue 3. I do not understand these issues 4. I do not think it is appropriate for me to discuss the issue
9.10 Does the user give you money on time for paying the instalments? (Client only)
0. No 1. Yes, → 9.13
9.11 If the user does not give you money for repayment on time, how do you manage? (Client only)
1. Default 2. Borrow from informal sources 3. Sell off/mortgage assets 4. Ask for the help of group members 5. Ask for the help of MFI
9.12 Has this adversely affected your relationship with MFI and group members? (Client only)
0. No 1. Yes

Microfinance in Afghanistan: A baseline and initial impact study for MISFA September 2007 68
9.13 Has MFI failed to fulfil some of your credit needs? (Client only)
0. No, → 9.15 1. Yes
Need
Housing 1
Agricultural input 2
Land 3
Livestock 4
Small business 5
Self employment 6
Manufacturing 7
Marriage 8
Education 9
Health 10
Food 11
Repay earlier loans 12
Other (specify) 13
No credit (code 1) Insufficient credit (code 2)
9.14 What action did you take when your credit needs were not met by MFI? (Client only)
Need
Housing 1
Agricultural input 2
Land 3
Livestock 4
Small business 5
Self employment 6
Manufacturing 7
Marriage 8
Education 9
Health 10
Food 11
Repay earlier loans 12
Other (specify) 13
No action (code 0) Mortgaged assets (code 1)
Sold off assets (code 2)
Borrowed from other sources (code 3)
9.15 Do you have any savings? (Clients and non-clients)
0. No, → 9.18 1. Yes

Microfinance in Afghanistan: A baseline and initial impact study for MISFA September 2007 69
9.16 In the last one year your: (Clients and non-clients)
1. Savings have increased 2. Savings have remained the same 3. Savings have depleted
9.17 Where do you keep your savings? (Clients and non-clients)
1. At home 2. MFI 3. Loans to others 4. Other NGO 5. Group 6. Others (specify)
9.18 Do you now: (Clients and non-clients)
1. Borrow a lot more from informal sources 2. A little more from informal sources 3. Borrow the same amount from informal sources 4. Borrow a little less from informal sources 5. Borrow a lot more from informal sources 6. Don’t borrow at all
Non-client, → 9.21
9.19 If your borrowings from the informal sources have increased or have remained the same, which of these is applicable to you?
(Clients only)
1. Informal sources are more willing to lend 2. You feel more confident about managing large debts 3. MFI don’t meet all your needs 4. MFI loans are too small to meet your needs

Microfinance in Afghanistan: A baseline and initial impact study for MISFA September 2007 70
9.20 Have you started/expanded a practice in the wake of MFI loans that you did not pursue earlier? (Clients only)
0. No, → 9.21 1. Yes
Activity code Self employment
Employment to others
Farming 1
Orchard 2
Poultry 3
Sheep 4
Dairy 5
Hawking 6
Vending 7
Shop 8
Manufacturing 9
Processing 10
Hotel 11
Tailoring 12
Weaving 13
Knitting 14
Carpet 15
Bakery 16
Others 17
Start-up 0
Expansion 1
No 0
Yes1
No 0
Yes1
Number employed
Males Females Outside 0
Family 1
9.21 How would you describe your economic situation today as compared to 12 months ago? (Clients and non-clients)
1. Remarkably better 2. Slightly better 3. Same 4. Slightly worse 5. Much worse
9.22 What is the basis of your response? (Tick as appropriate) (Clients and non-clients)
1. Food quality and quantity 2. Clothing 3. Money for health and education 4. Money to buy household assets (furniture, etc.) 5. Savings 6. Money to invest in business from profits 7. A sense of security emanating from the presence of MFI 8. Don’t need to take loans any more
End of questionnaire for non-clients

Microfinance in Afghanistan: A baseline and initial impact study for MISFA September 2007 71
9.23 Since you joined the MFI programme, has people’s perception of you (Clients only)
Changed for the better 1
Remained the same 2
Changed for the worse 3
Husband /wife Other male relatives
Other female relatives
Males outside the household
Females outside the household not members of MFI
Changed for the better
Remained the same
Changed for the worse
9.24 If your husband’s attitude or the attitude of other male relatives towards you has undergone a change, what do you think is the
reason for this change? (Female clients only)
9.25 How would you describe your relationship with other members of the group? (Clients only)
1. Very good 2. Good 3. Neither good nor bad 4. Bad 5. Very bad
9.26 Which of these benefits, if any, do you derive from being a part of the group? (Clients only)
1. Can rely on them for advice on social matters 2. Can rely on them for advice on business matters 3. Can rely on them for material support in times of need 4. Can rely on them for financial support in times of need 5. Feel secure and confident being a part of a group 6. None
Women’s section 10.1 How do you compare the overall economic situation of the household with 1 year ago?
1. Much worse 2. Slightly worse 3. Same 4. Slightly better 5. Much better
10.2 How often in the last year did you have problems satisfying the food needs of the household?
1. Never 2. Rarely (1 to 3 times) 3. Sometimes (3 to 6 times) 4. Often (a few times every month) 5. Mostly (this happens a lot)
10.3 If you are involved in income generating activities, can you as women decide how to spend that income?
0. No 1. Yes – female-headed household 2. No – female-headed household 3. Yes – without consultation with husbands/fathers 4. Yes – with consultation with husbands/fathers 5. Not sure / Don’t know
10.4 Would women from this household be able to participate in any literacy or vocational training classes if they were offered?
0. No 1. Yes, → 10.6 2. Don’t know
10.5 If no or don’t know, what would be the main reason?
0. Women do not need these skills

Microfinance in Afghanistan: A baseline and initial impact study for MISFA September 2007 72
1. Women would not be interested in such classes 2. Household duties take up all of their time 3. Husbands / fathers would not allow them 4. Too old for training 5. Don’t know
10.6 Did you have any delivery during last five years?
0. No, → 10.16 1. Yes
10.7 What was the place of your delivery?
1. Government hospital 2. Private hospital 3. NGO clinic 4. Home delivery 5. Relative 6. Neighbour
10.8 Who assisted with the delivery of your last child?
1. Traditional birth attendant (TBA) 2. Trained birth attendant 3. Nurse 4. Doctor 5. Relative 6. Neighbour 7. None
10.9 How many doses of TT injection have you taken in the arm to prevent your newborn being affected from tetanus? (If none write
0)
10.10 Did you see anyone for taking advice during this pregnancy (i.e. antenatal care other than TT)?
1. Traditional birth attendant 2. Trained birth attendant 3. Nurse 4. Doctor 5. Relative 6. Neighbour 7. None
10.11 Does the child have an immunisation card?
0. No 1. Yes
10.12 How many times has the child been given DPT vaccine?
10.13 Did the child have cough and/or fever in last 2 weeks?
0. No 1. Yes
10.14 Did you seek advice or treatment for this episode of cough/fever that the child suffered?
0. No 1. Yes
10.15 If yes, from where did you seek care?
1. Hospital 2. Health centre/MCH clinic/Mobile outreach clinic 3. Dispensary/pharmacy/drug sellers

Microfinance in Afghanistan: A baseline and initial impact study for MISFA September 2007 73
4. Community health workers 5. Private practitioner/traditional healer 6. Relative/other 7. None/DK
10.16 Have you ever heard of iodised salt?
0. No, → End 1. Yes
10.17 Why is iodised salt important? (Do not read responses)
1. Don’t know 2. It is tastier than plain salt 3. It is cleaner 4. It prevents goitre 5. It prevents cretinism 6. It makes you smarter 7. It prevents mental retardation 8. It prevents stillbirth 9. It prevents abortion 10. It prevents pregnancy
Dropouts 11.1 In which year did you join the microfinance programme? (MM/YY)
11.2 In which year did you leave the microfinance programme? (MM/YY)
11.3 How many loans did you take from the MFI?
Use code: Housing 1; Agricultural Input 2; Land 3; Livestock 4; Small business 5; Self employment 6; Manufacturing 7; Marriage
8; Education 9; Health 10; Food 11; Repay earlier loans 12; Other 13
Loan Amount Use 1 Use 2 Use 3 Amount outstanding
Loan 1
Loan 2
Loan 3
Loan 4
11.4 Whose decision was it to leave the programme?
1. Own 2. Husband/father/brother/other male relative 3. Joint family decision 4. Wife/mother/sister (in case of male dropouts) 5. Community/ulema 6. Group 7. MFI 8. Others (specify)
11.5 If it was a decision of the community/ulema, did other members of the group also drop out?
0. No 1. Yes
11.6 If yes, how many?
11.7 Why did you leave the MFI programme?
1. Can’t save

Microfinance in Afghanistan: A baseline and initial impact study for MISFA September 2007 74
2. Unable to withdraw savings 3. Less interest on savings 4. Did not get loan when wanted 5. Did not get loan for the purposes needed 6. Small loan amounts 7. High interest on credit 8. Interest charged by MFI is against the tenets of Islam 9. Could not repay loan in time 10. Migration 11. Family pressure 12. Community pressure 13. No time for meetings 14. Have benefited, no longer need 15. Prefer informal sources 16. Group problems - biased 17. Other – specify______________
11.8 If given a chance would you join the MFI programme again?
0. No 1. Yes
End of interview

Microfinance in Afghanistan: A baseline and initial impact study for MISFA September 2007 75
Appendix 2: Map showing geographical outreach of MISFA partners
Source MISFA September 2007
22% 22%
10% 8%
10%7%
% of clients
% of portfolio
36%
39%
2% 2%
17%
25%
North-East 5 MFIs
West5 MFIs
Capital12 MFIs
South 4 MFIs
East6 MFIs
North-West6 MFIs

Appendix 3: Recommended indicators for MFIs The instrument is a structured questionnaire and the questions should be asked at the time of a client joining the programme
and at the time of loan renewal and/or exit from the programme.
B. Sex C. Relation to head of household
F. For those 15 years or older, how many classes of (primary) school has (…) completed?
G. During the past 2 weeks, has (…) had any acute illness or injury?
A. Household member
Female=0; Male=1
Head=1; Spouse=2; Child=3; Parent=4; Grandchild=5; Grandparent=6; Other=7
D. Age E. If between the age of 6 and 15, enrolment status (at school)
Enter number for classes, 1–11
No education=0
No=0;
Yes=1
1) Respondent
2)
3)
4)
5)
6)
7)
8)
Do you or a member of your household own the dwelling that all of you occupy? 0=no, 1=yes
What fuel do you use most often for cooking?
1. Gas
2. Electricity
3. Wood
4. Kerosene
5. Manure
6. Others (specify)
What is the main type of material for your roof?
1. Slate
2. Metal sheets
3. Thatch
4. Tiles
5. Plastic
6. Mud
7. Others (specify)
Does your household own a bicycle? 0=no, 1=yes
Does your household own a stereo? 0=no, 1=yes
Does your household own a TV? 0=no, 1=yes
Does your household own a sewing machine? 0=no, 1=yes

Page 77 of 90 MISFA Baseline/impact Study September, 2007
Does your household own livestock? 0=no, 1=yes
Livestock No=0; Yes=1 Number
1. Cattle
2. Sheep
3. Goat
4. Poultry
5. Others (specify)
Does your household have any savings? 0=no, 1=yes
What has been the trend in savings in the last six months?
1. Decreased
2. Same as before
3. Increased
When a member of your household fell sick last, did you access medical advice? 0=no, 1=yes
What source of medical advice did you consult?
1. Hospital
2. Health centre
3. Dispensary
4. Community health workers
5. Pharmacy/drug sellers
6. Private practitioner
7. Traditional healer
8. Relative/other
To what degree can you decide on loan use?
1. Not at all
2. Informed by male relatives
3. Consulted by male relatives
4. Decide in consultation with male relatives
5. Decide independently
To what degree can you decide on use of income derived from loan use?
1. Not at all
2. Informed by male relatives
3. Consulted by male relatives
4. Decide in consultation with male relatives
5. Decide independently
Has any of your credit need not been met by MFI in the last six months? 0=no, 1=yes
Extent of unmet need. 0=partial, 1=full
Page 78 of 90 MISFA Baseline/impact Study September, 2007
What was the activity for which you needed credit (specify)?
How satisfied are you with the service provided by the MFI?
1. Very dissatisfied
2. Dissatisfied
3. Neither satisfied nor dissatisfied
4. Satisfied
5. Highly satisfied

Page 79 of 90 MISFA Baseline/impact Study September, 2007
References Amnesty International (2005) ‘Women Still Under Attack: A Systematic Failure to Protect’, AI Index ASA 11/007/2005, Amnesty International 30 May 2005, http://web.amnesty.org/library/index/ENGASA110072005 (accessed 29 November 2007) Balkenhol, B. (2005). The Impact of Microfinance on Employment: What Do We Know? Geneva: International Labour Organisation Chen, M. and Snodgrass, D. (2001) Managing Resources, Activities and Risk in Urban India: the Impact of SEWA Bank, Washington, D.C.: USAID AIMS project Dunn, E. and Arbuckle, G. (2001) The Impact of Microcredit: A Case Study from Peru, Washington, D.C.: USAID AIMS project Hashemi, S. (2007) ‘Beyond Good Intentions: Measuring the Social Performance of Microfinance Institutions’ Focus Note 41, Washington D.C.: Consultative Group to Assist the Poor, May 2007, www.cgap.org/portal/binary//com.epicentric.contentmanagement.servlet.ContentDeliveryServlet/Documents/FocusNote_41.pdf (accessed 6 December 2007) Hulme, D. and Mosley, P. (eds) (1996) Finance Against Poverty, (2 Vols), London: Routledge India Knowledge@Wharton (2007) ‘Afghanistan’s Microfinance Industry: Off to a Good Start, but Big Hurdles Remain’, India Knowledge@Wharton October 2007, http://knowledge.wharton.upenn.edu/india/index.cfm?fa=viewfeature&id=4230 (accessed 29 November 2007) Johnson, S. and Kidder, T. (1999) ‘Globalization and Gender: Dilemmas for Microfinance Organisations’, Small Enterprise Development 10,3: 4–15 Mayoux, L. (2000a) Micro-finance and the Empowerment of Women: A Review of the Key Issues, Geneva: International Labour Organisation, www.oit.org/public/english/ employment/finance/download/wpap23.pdf (accessed 6 December 2007) Mayoux, L. (2000b) ‘Selected Programme Case Studies: SHDF, Zambuko Trust, SEF, CGT and SCF-UK Vietnam Programme’, Geneva: International Labour Organisation Morduch, J. and Haley, B. (2002) Analysis of the Effects of Microfinance on Poverty Reduction, Wagner Working Paper 1,014, New York: New York University Opportunity International (2004) Annual Report, Oxford: Opportunity International Pitt, M. and Khandker, S. (1998) ‘The Impact of Group-based Credit Programs on Poor Households in Bangladesh: Does the Gender of Participants Matter?’ Journal of Political Economy 106,5: 958–96 RESULTS (1997) The Micro-credit Summit February 2-4, 1997 Declaration and Plan of Action, Washington D.C.: RESULTS Educational Fund

Page 80 of 90 MISFA Baseline/impact Study September, 2007
Schneider, F. (2002) ‘Size and Measurement of the Informal Economy in 110 Countries Around the World’, July 2002, http://rru.worldbank.org/Documents/PapersLinks/informal_economy.pdf (accessed 4 December 2007)


![[XLS]twtconsult.comtwtconsult.com/public/userfiles/files/swift.xlsx · Web viewFIRST MICROFINANCE BANK LTD., THE // FMFBAFKAXXX FMFBAFKAXXX DA AFGHANISTAN BANK // AFGBAFKAXXX AFGBAFKAXXX](https://img.pdfslide.net/doc/110x75/5ad711187f8b9a32618bcd56/xls-viewfirst-microfinance-bank-ltd-the-fmfbafkaxxx-fmfbafkaxxx-da-afghanistan.jpg)