Embed Size (px)
Citation preview

Microfinance Institutions and Poverty Reduction
MASTER THESIS WITHIN: Economics
NUMBER OF CREDITS: 30 ECTS
PROGRAMME OF STUDY: Civilekonom
AUTHOR: Linn Christensson
JÖNKÖPING May 2017
Evidence from Nigeria

i
Master Thesis in Economics
Title: Microfinance Institutions and Poverty Reduction: Evidence from Nigeria Authors: Linn Christensson Tutor: Mikaela Backman Date: 2017-05-22
Key terms: Microfinance, Microfinance institutions, Poverty, Microcredit, Nigeria
Abstract
Microfinance has been claimed to be an important building block in the process of diminishing
poverty. Commercial banks do often not serve poor people, and therefore the poor need an
alternative source of credit. The purpose of this study is to investigate the relationship between
access to microfinance institutions and poverty reduction in Nigeria on state level. Previous
research has shown varying results of microfinance programmes depending on where it has been
carried out and who have been on the receiving end of the loans. By using ordinary least square
regression, the results show there is a negative relation between the number of microfinance
institutions and the poverty level of the states. Thus, it indicates that microfinance institutions
decrease the poverty levels in Nigeria.

ii
Table of Contents
1 Introduction ................................................................................... 1
2 The Nigerian Financial Sector ..................................................... 4
3 Microfinance and Poverty Reduction .......................................... 7
3.1 The importance of financial development ...................................................................... 7
3.2 Cross-country studies on the impact of microfinance .................................................. 8
3.3 The impact of microfinance in Asia............................................................................... 10
3.4 Evidence from South America, North America and Europe.................................... 12
3.5 Microfinance in Africa ..................................................................................................... 14
4 Empirical Design ........................................................................ 17
4.1 Variables and Data ............................................................................................................ 17
4.1.1 Dependent variable ........................................................................................................... 18
4.1.2 Independent Variables ..................................................................................................... 19
4.2 Method ................................................................................................................................ 22
4.3 Empirical testing................................................................................................................ 23
4.4 Heteroscedasticity ............................................................................................................. 26
5 Empirical Analysis....................................................................... 27
5.1 Descriptive Statistics ......................................................................................................... 27
5.2 Correlation .......................................................................................................................... 33
5.3 Regression Analysis........................................................................................................... 33
5.3.1 Access to microfinance institutions ............................................................................... 34
5.3.2 Control variables ............................................................................................................... 36
6 Conclusions ................................................................................. 38
Reference list ........................................................................................... 40
Appendix .................................................................................................. 47

iii
Figures Figure 1 Distribution of microfinance institutions in Nigeria ............................................... 6
Figure 2 Map of Nigeria .............................................................................................................17
Figure 3 Heteroscedasticity .......................................................................................................26
Figure 4 Multidimensional poverty index ...............................................................................28
Figure 5 Population by state......................................................................................................30
Figure 6 Education by state .......................................................................................................31
Figure 7 Unemployment Rate by state ....................................................................................32
Figure 8 Agricultural activity .....................................................................................................32
Tables Table 1 Global Moran's I test ....................................................................................................24
Table 2 Descriptive statistics ....................................................................................................27
Table 3 Correlation matrix.........................................................................................................33
Table 4 Regression Results ........................................................................................................34
Table 5 Regression results Model 2 .........................................................................................36
Appendix Litterature Review Table ............................................................................................................47 Geopolitical zones of Nigeria....................................................................................................51

1
1 Introduction
In 2013, 62 percent of the Nigerian population lived below the poverty line of $1.90/day, set
by the world bank (UNDP, 2016). The first of the Millennium Development Goals (MDGs)
set by the UN is to eradicate extreme poverty (UN, 2013). To do this, the financial sector
plays an important role, as financial development has been proven to reduce poverty (Jalilian
& Kirkpatrick, 2002). In 2005, only 35 percent of the population in Nigeria had access to
financial services such as saving and checking accounts. Finance on a smaller scale- smaller
loans, savings, insurances etc. - aimed for the poor is called microfinance. To provide the
poor and low-income groups with diversified microfinance services to resolve the informal
micro-financial sector, improve the living situation of the poor, and decrease the poverty
level of the country the Central Bank of Nigeria introduced a microfinance policy in 2005
(Acha, 2012). The purpose of this study is to investigate the impact access to microfinance
institutions have on poverty reduction in Nigeria. Poverty is one of the biggest issues in the
world today and finding ways to reduce it is crucial. It is therefore essential to examine and
evaluate the methods used to do so.
Microfinance is a tool for economically active poor, i.e. people earning wages or
entrepreneurs with small businesses in the informal sector, to access financial services. The
main difference between microfinance institutions and conventional banks is the size of the
transactions. Microfinance institutions offer savings accounts and small, short-term loans to
people with few assets to use as collateral, to help them increase their income levels and
improve their living situation. The microfinance institutions also offer micro-insurances to
protect the clients from adversities such as floods and illness. Some microfinance institutions
also offer their services to companies who employ poor people for them to grow their
businesses and indirect help the poor (Idolor & Eriki, 2012).
The Nigerian financial sector is made up of the formal sector, including the Central bank,
conventional banks and other financial institutions, and the informal sector, which is people
borrowing and lending usually directly to each other. The informal sector is large in Nigeria,
where most of the population is living in rural areas without access to any financial
institutions. The Nigerian government has used several different programmes besides the
microfinance policy to reduce poverty, including Agricultural Development programmes

2
(ADPs) and National Directorate of Employments (NDE), in order to incorporate the poor
and unemployed in the formal sector, and make use of their willingness to work, ideas and
skills, but many of the programmes have failed (Akanji, 2006).
As for other programmes introduced by the Central Bank with the intent of reducing poverty,
the microfinance institutions following the microfinance policy faced many challenges.
Public officials have several times been caught diverting money from microfinance funds to
relatives and friends with seemingly no intentions of using it for business (Nwanyanwu,
2011). Transaction costs are generally higher for microfinance institutions than conventional
banks as they are dealing with many clients with small loans. The poor infrastructure in the
rural areas adds on additional costs due to the bank’s necessity to provide their buildings with
water and electricity. The lack of basic infrastructure also complicates the outreach of the
banks, and when adding everything up, the high operational costs put them at a big
competitive disadvantage (Acha, 2012). Further, financial institutions owned by the state,
particularly those with a lack of profit orientation, have been easily manipulated and
politically influenced. The recipients of loans from these institutions tend to be wealthy
households selected for political reasons rather than the target group, i.e. the poor
(Imhanlahimi & Idolor, 2010).
Though the objective of microfinance institutions is to improve the standard of living for
the poor and thereby reduce poverty, many critics still question if it has a significant impact
(Adams & Von Pischke, 1992; Coleman, 1999; Schicks & Rosenberg, 2011). Many studies
have been carried out to measure the effects of microfinance on poverty across developing
countries for over two decades. The results of the studies have been varied, to say the least.
Even tests performed on the same data by different researchers yield contradictory results
(Murdoch, 1998; Pitt & Khandker, 1998). To the author’s knowledge, no research has been
done on the relationship between microfinance institutions and poverty reduction on state
level in Nigeria. Previous research studies the impact of microfinance institutions on a
national level (Idolor & Eiriki, 2012; Okpara, 2010). This study investigates the correlation
between the poverty level and the number of microfinance institutions per state in relation
to population. It is interesting to test the differences of impact between states since the
microfinance institutions are unequally distributed in the country, and this may give a clearer
view on its actual impact.

3
To accomplish the objective of the study, an ordinary least square regression is performed.
The dependent variable is poverty which is measured by the multi-dimensional poverty index
(OPHI, 2016), and the independent variables are access to microfinance institutions (CBN,
2016) - measured as a ratio of population to number of microfinance institutions in each
state, and education, unemployment, and agriculture which are used as control variables. The
model also contains a dummy variable representing closeness to the coastline. The study
shows that there is a negative relationship between access to microfinance institutions and
poverty in Nigeria, indicating access to microfinance services can reduce poverty. Increased
investments in microfinance institutions and the microfinance programme to improve and
expand the outreach of the microfinance institutions is suggested to further reduce poverty
in the country. In order to improve the impact further, it is suggested the government invest
in infrastructure to simplify the establishment of more microfinance institutions in rural
areas.
This study does not consider the size of the assets base, deposit liabilities, and loans of the
microfinance institutions due to lack of data. Not considering the size of the microfinance
institutions can be problematic as some of the institutions may have a very large client base
while others may not. The study will not examine who has benefitted from the services, i.e.
women, micro-entrepreneurs, in what sector they operate etc., it will solely look at the state
as a whole. The change in number of microfinance institutions and poverty reduction over
time is also not considered in this study, as there is not enough data available on the subject.
A problem of not investigating changes over time is that states in which poverty is low and
number of microfinance institutions is high, may have had low poverty levels prior to the
instalments of the microfinance institutions, and vice versa, and low poverty levels are
therefore not a result of microfinance institutions. Another limitation of the study is that
Nigeria has a large informal sector, and the access to informal financial services cannot be
measured. Therefore, areas with little access to microfinance institutions may have low
poverty levels due to informal lending and borrowing.
Chapter 2 of this thesis give the background information on the Nigerian financial sector.
Chapter 3 presents previous studies on the subject, predominantly in other countries. In
chapter 4, the method and data are presented. Empirical results and analysis are presented in
chapter 5, and lastly, chapter 6 presents conclusions and suggestions for further research.

4
2 The Nigerian Financial Sector
In July 2004, the Central Bank of Nigeria (CBN) issued a recapitalization policy to clean up
the country’s banking industry. Prior to the recapitalization policy the banking industry was
overflowed by small size banks with high transaction costs and low capital. The requirement
of the new policy was that the commercial banks should have a minimum capitalization of
N25 billion with full compliance by December 2005. The policy led to mergers between
small and large banks, and 89 commercial banks became 20 (Ailemen, 2010). The banks
broadened their services by including retail banking1, leading to a rapid credit expansion. In
2011, six of the banks (five of which are domestic) dominated the banking system accounting
for 60 percent of the total assets in the banking sector. The banking system in Nigeria
appears to be profitable, liquid and well capitalized (International Monetary Fund, 2013).
The concept of microfinance is nothing new in Nigeria. Esusu is an example of an informal
microfinance programme that has a long history in the country. It is a rotating savings and
credit association (RoSCA) mainly used by the Yoruba, the largest ethnic group in Nigeria,
with the main purpose of reducing poverty. The first trace of this type of financial institution
in Nigeria dates back to as early as the 16th century (Seibel, 2004). It consists of groups where
members contribute with a fixed amount of money at regular intervals. One member collects
the contributions at each interval until every member has collected it once, and then it starts
over again. For the people who collect the money at the end of the cycle, the programme
serves as a savings mechanism (Akanji, 2006). Similar programmes used by other ethnic
groups are Etoto in the east of Nigeria among the Igbos, and Adashi in the north among the
Hausas (Anyawu, 2004).
The informal financial sector has long played a large financial role in Nigeria, especially in
rural areas due to the lack of provision of formal financial services to the poor. For the
Nigerian government, this means difficulties in economic management, as they cannot
regulate nor monitor the financial activities in the informal sector (Acha, 2012).
The Nigerian government has introduced several poverty-reducing programmes over the
years (Akanji, 2006). Five different Agricultural Development Projects (ADPs) was
implemented between 1979 and 1990 as a response to a fall in productivity in the agricultural
1 Retail banking is when banks serve individual customers, not only companies.

5
sector. The goals of the programmes were to increase farm incomes and food production.
Unfortunately, none of the projects met their expectations and only two of the projects had
satisfactory outcomes. Some of the issues of these projects were the overoptimistic targets,
unproven assumptions about agricultural technology and miscalculations in projecting the
time it would take to adopt new technology (IEG, 2012). Other programmes introduced by
the government to reduce poverty were the Directorate of Food, Roads, and Rural
Infrastructure (DFRRI) in 1986, Family Support Programmes in 1993, and the National
Poverty Eradication Programme (NAPEP) in 2001 (Obadan, 2001).
In 2005, the Central Bank of Nigeria (CBN) introduced the Microfinance Policy, Regulatory
and Supervisory Framework to reduce poverty and incorporate poor who operate in the
informal sector, as well as poor people with no prior interaction with financial institutions or
services, into the formal sector (Acha, 2012). The policy was justified by the following seven
arguments; (1) Weak institutional capacity due to several factors, including incompetent
management and poor corporate governance in existing community banks, microfinance
institutions and development finance institutions, (2) Weak capital base in existing
institutions, particularly community banks, (3) The big un-served market, with less than two
percent of households in rural areas having access to financial services, (4) Economic
empowerment of the poor, employment generation and poverty reduction, (5) The need for
increased savings opportunity with less risk and higher return than current savings methods,
(6) The interest of local and international communities in microfinancing to provide an
opportunity for the interested investors to finance the economic activities of the poor, and
(7) Utilization of Small and Medium Enterprises Equity Investment Scheme (SMEEIS). Due
to lack of framework and confidence in the institutions, ten percent of the fund intended for
micro credit remained unutilized (CBN, 2005).
The objectives set by the CBN included creating access to financial services for a large part
of the population which earlier had not been served by any banks, with the intentions of
making use of their potential productivity. The targets of the policy included to cover the
majority of the economically active poor by 2020, and by that decrease unemployment and
reduce poverty. The microcredit in relation to total credit was set to increase from 0.9 percent
in 2005 to 20 percent in 2020 and the microcredit to GDP ratio from 0.2 percent in 2005 to
five percent in 2020 (CBN, 2005). In 2007, the microfinance institutions were licensed to
start operations in Nigeria. Existing microfinance institutions and community banks could

6
receive the license for microfinance institutions if they met the CBN’s condition of increasing
their capital base to N20 million (equivalent of $63,448) by the end of 2007 (Acha, 2012).
Individuals, groups of individuals, private corporate entities, community development
associations, or foreign investors can all establish microfinance institutions (CBN, 2005).
There are currently 1017 licensed microfinance institutions operating in the 37 states of
Nigeria. Figure 1 shows the distribution of microfinance institutions by state. The number
of microfinance institutions vary from one in the state with the fewest – Yobe, to 191 in the
state with the highest – Lagos. To put this in relation to population, 2.6 percent of the
population lives in Yobe, where 0.1 percent of the microfinance institutions are located, while
4.6 percent lives in Lagos, where 18.8 percent of the microfinance institutions are located.
In Kano, which is the state with the highest population rate, 8.9 percent, 3.4 percent of the
microfinance institutions are located (CBN, 2016). Thus, the figure shows a high dispersion
in access to microfinance institutions. This thesis intends to analyse if the distribution has a
relationship with poverty.
Figure 1 Distribution of microfinance institutions in Nigeria
Note: The percentages represent the share of the total amount of microfinance institutions.
█▌0.00-0.99%
█▌1.00-1.99%
█▌2.00-3.99%
█▌4.00-5.99%
█▌6.00-7.96%
█▌18.78%
Share of MFIs

7
3 Microfinance and Poverty Reduction2
3.1 The importance of financial development
Studies have shown that financial development increases average growth in a country (Levine
1997; Levine 2005), but what impact does it have on the poor? Beck et. al (2007) examined
the impact of financial development on poverty. They found that financial development
helps the poorest, as it disproportionately increases the income of the poor, that is, the
income of the poor grows faster than average GDP per capita and thereby reduces income
equality. Beck et. al (2007) also found a relationship between financial development and a
decrease in the part of the population living on less than $1 per day.
Financial development reduces poverty indirect through economic growth. It can generate
more jobs and thereby decrease the unemployment rate which is positively correlated with
poverty (Zhuang et al., 2009). In the early stages of financial development, evidence show an
increase in wage difference between skilled and unskilled workers. In a later stage of financial
development however, the wage difference decreases and hence, has a positive impact on
poverty reduction (Galor & Tsiddon, 1996). Financial development also reduces poverty
directly through the use of financial services. Access to savings, credit, and insurance services
promotes poverty reduction as it increases overall income and reduces income equality
through for example investments in business expansions and protection against risks such as
natural disasters. The use of financial services also smooths consumption over time
preventing undernourishment in the face of shocks, and reduces general undernourishment
through investments in productivity enhancing equipment (Claessens & Feijen, 2007).
Aportela (1999) showed the importance of access to financial services when analysing the
income and expenditure of Mexican households. He found that people with low income level
did not save due to the lack of formal instruments available to them. An increase in number
of savings institutions in Mexico led to an increase in savings in low income households by
eight percent. Similar results were obtained by Bae et al. (2012) who studied the access to
2 The literature covered in the literature review was obtained by searching for articles in google scholar and
primo.ju.se. The databases the articles were retrieved from were JSTOR, ScienceDirect, ProQuest Central,
Oxford Academic, Wiley, and Business Source Premier (EBSCO). The key words used were: microfinance,
microcredit, poverty, poverty alleviation, poverty reduction.

8
finance on poverty and income inequality on state level in the US. Access was measured by
(1) number of banks per 100 000 people, (2) number of banks per 100 square miles, and (3)
average deposit size to GDP per capita ratio. Bae et al (2012) found that access to finance
reduced both the poverty level and income equality. Not all three variables for access were
significant in all the models, but at least one variable was significant in each model, meaning
access always had an impact on the poverty level and income equality.
Negative effects also occur when increasing access to financial services. This will be discussed
further in the following sections.
3.2 Cross-country studies on the impact of microfinance
In an early study of microfinance, Adams and Von Pischke (1992) compared the modern
(1990’s) microfinance institutions to the rural credit agencies introduced by Least Developed
Countries (LDC) governments in the 1960’s and 1970’s. The credit agencies not only failed
to promote poverty alleviation but also cost the governments millions of dollars. The authors
argue that the operational framework of the 1990’s microfinance institutions are so similar
to the ones of the rural credit agencies that they are destined to fail. Woller et. al (1999)
however disagree with the statements made by Adams and Von Pischke. They say that the
microfinance 1990’s microfinance institutions are much different from the rural credit
agencies of the 60’s and 70’s, one of the fundamental differences being technical innovations
that decrease transaction costs and information asymmetry, and it is therefore inaccurate to
use them as a prophecy for the success of microfinance institutions (Woller et. al, 1999).
Further, Adams and Von Pischke (1992) claimed that debt is not an appropriate tool when
trying to raise poor people out of poverty as it can backfire and pull people further into
poverty. If a person fails to make a profitable investment and thereby fails to pay back the
loan, the debt will increase and he or she will be worse off than prior to taking the loan.
Schicks and Rosenberg (2011) agree with the statements of Adams and Von Pischke (1992).
They highlight the downside of access to credit as they analyse the over-indebtness in
microfinance. They discuss the concerns with increased competition in microfinance and the
uninformed borrowers leading to overborrowing. This would put the low-income clients in
excessive indebtness and borrowers who feel forced to repay even if they do not have the
resources to do so gets pushed further into poverty.

9
Stewart et al. (2012) performed a systematic review of existing studies on access to financial
services in various countries. They expect microfinance to impact income in more than one
way when combined with other economic opportunities. Microcredit puts the client in debt
due to the repayment that needs to be done, but is expected to increase the income of the
borrower over time. Micro-savings could also be a source of higher long-term income by for
example investing accumulated savings to expand a business or smooth income by using the
savings to cover shortfalls due to seasonal changes or the likes. Evidence from Malawi shows
savers’ businesses increased in value when using a commitment account3. It did however not
increase the profits of the business (Stewart et al., 2012).
In Malawi and Kenya, micro-savings had a significant impact on people’s savings, however
in Kenya, that only applies to women. In Bosnia and Herzegovina, evidence shows a decrease
in savings when people get access to micro-credit, and in Peru, there is no evidence of any
impact on savings at all (Stewart et al., 2012). This suggests that microcredit and micro-
savings have the ability to reduce poverty, but not for all clients and not in all environments.
The evidence shows that the outcome of microfinance differs a lot between countries and
programmes. Stewart et al. (2012) stress the importance of considering the possibility that
offering microcredit services might actually do harm. Although lack of access to financial
services may prevent the poor from increasing their wealth and enduring shocks, micro-
credit puts a person in debt and if the borrower is not able to repay the loan, it will lead to
loss of collateral. Therefore, it would be safer to offer micro-savings account to the very
poor, as there can be no harm done by saving, and microcredit should only be offered after
careful consideration of the possible consequences that comes with increased debt.
Banerjee et. al (2015a) studied microcredit expansions in Bosnia, Mexico, Morocco, Ethiopia,
Mongolia, and India between the years of 2003 to 2012. They consider the lenders, products,
and settings observed in the study as representative of the worldwide microfinance industry.
One of the challenges when performing the study was the presence of other sources of credit.
In some of the cases, the areas did not have any or very little access to other microfinance
institutions, but in Bosnia, India, and Mexico there were other microfinance institutions
present which increases the complexity of the study. In these countries, borrowing from
other microfinance institutions increased, and the new customers were assumed to be the
3 A commitment account is a type of savings account that requires customers to save an agreed amount until a predetermined date, and they cannot withdraw the money before that date (Stewart et al., 2012).

10
people who were not served by the microfinance institutions but were a part of the study,
i.e. the control group.
In India, informal borrowing was widespread before the study by Banerjee et al. (2015a) took
place, and the results showed a fall in informal borrowing in the areas once the people had
access to formal loans from microfinance institutions. In Mongolia, the access to
microfinance institutions had a negative effect on other formal sources of credit, while in the
other four countries it had no effect on other sources of formal nor informal credit (Banerjee
et al., 2015a). Another challenge when using income and consumption as indicators of the
effects of microfinance is that some of the effects can be hard to detect. If families or
households use the credit for different purposes, for example, some use it to grow businesses
while others borrow to smooth consumption, then the effects may become too small to
detect. One of the key outcomes of the study is income, which is an essential part of poverty
reduction. In none of the six countries studied were there any significant increase in the
household income, which suggests that microcredit might not have the characteristics of
helping people out of poverty, but that does not rule out the possibility of microcredit giving
people more opportunities when making choices, e.g., choice of occupation. Another key
outcome is family consumption as a measure of living standards. In the countries where total
household consumption was used as an indicator, there was no evidence of an increase. It is,
however, important to measure not only expenditures but also durable stocks. In Mongolia,
access to microcredit increased the household durable stock, while in Bosnia and India it
decreased. One of the social indicators of the studies was child schooling, which saw no
significant change except in Bosnia, where 16-19-year-olds had a decline in school attendance
(Banerjee et al. 2015a).
3.3 The impact of microfinance in Asia
An early study on the impact of the use of microcredit in Asia was performed by Pitt and
Khandker (1998). They studied the outcomes of the three major microfinance programmes
in Bangladesh, namely Grameen Bank, Bangladesh Rural Advancement Committee (BRAC),
and Bangladesh Rural Development Board (BRDB), which provide the poor with credit and
other financial services. They found that the use of credit had a small but significant impact
on household expenditure, household assets, labour supply and children’s school attendance.
However, Morduch (1998) performed a similar study using a different approach. He

11
concludes that the consumption levels in the households with access to microcredit are not
notably higher than in the households in the control group. He also states that there was no
significant difference in children’s school attendance between the two groups. The impact of
microcredit can, however, be observed in the lower variation in labour supply and
consumption across seasons. This indicates that the access to microcredit cannot be directly
linked to poverty reduction, but rather reduction a of vulnerability.
However, Pitt (1999) argued that Morduch (1998) had misunderstood the methods used by
Pitt and Khandker (1998) and that the methods applied by Morduch (1998) were incorrect.
Khandker (2005) performed a panel analysis and confirmed the findings made by Pitt and
Khandker (1998). He reported that not only does the access reduce poverty but also
continues to reduce poverty over time although at a diminishing rate. Further, not only the
borrowers benefit from the microcredit but also the nonparticipants of the programmes
through spillover effects within the local economy. The increased consumption as a result of
borrowing increase the probability of programme participants escaping poverty and
simultaneously benefits the non-participants through growth in the local income. Khandker
(2005) found that microcredit reduced the poverty of villages by one percent per year in areas
where microcredit programmes were present. He also claims that microfinance had a higher
impact on the people living in extreme poverty than on those living in moderate poverty.
Roodman and Morduch (2009) reconfirms the results of the research performed by Morduch
(1998), stating they have not discovered anything that contradicts the ideas presented.
Instead, they claim that the evidence of impact in the studies performed by Pitt and
Khandker (1998) is weak.
Coleman (1999) studied the effects of microfinance in north east Thailand. The author
compared borrowers of existing microfinance institutions with so-called borrowers-in-
waiting, people in villages identified as future locations for microfinance institutions.
Coleman found that credit had no significant impact on many of the indicators including
physical assets, savings, and expenditure on health care and education to name a few. This
implies that the loans are not being invested in productive activities that yield a positive
return.

12
Giné and Townsend (2004) found somewhat contradicting results, they showed that the
increase in access to credit can be a reason for the high growth in GDP per capita, rapid
poverty reduction, and decrease in income inequality in Thailand. Kaboski and Townsend
(2012) also found positive results when evaluating the impact of the microfinance
programme ‘Million Baht Village Fund’ in Thailand. They found that the programme
successfully increased overall credit instead of moving source of credit from one bank to
another. The results also show a significant increase in consumption and a large but short-
term increase in household income growth. There is evidence of an increase in wage income
and business profits as a result of the programme, in fact, the increase in wage income was
1.25 bath to every bath borrowed. The agricultural sector, however, did not experience a
positive change in wages. To the surprise of the authors, the wages decreased substantially.
The programme had the desired effect, which was increasing the overall credit.
Banerjee et al. (2015b) found that the demand for microloans is smaller than microfinance
institutions sometimes claim. In a study performed in Hyderabad in India, only 38 percent
of households with high propensity to take up microcredit had micro-loans by the end of the
three-year study period. The authors speculate the reason for this is that most households
do not have a high enough rate of return to cover the annual percentage rate of the loans, or
they prefer to borrow from family, friends, or money-lenders, since the flexibility is greater
with that type of loans. Of the group that did borrow, it did not seem to be an escape from
poverty. The study names monthly consumption as a good indicator of welfare, and it did
not increase for the people with early access to microfinance in the short run nor in the long
run. It also showed that after 18 months, a few of the borrowers had expanded their
businesses, but it did however not have any effect in terms of increasing the number of
entrepreneurs.
3.4 Evidence from South America, North America and Europe
On the contrary to the findings of Khandker (2005), Schreiner (1999), who studied
microenterprise programmes in the United States found that the main users of the
programmes are not the poorest but the poor with the highest education, experience, skills,
and assets. Copestake et al. (2005) studied microfinance impact on poverty in Peru with
similar outcomes to those of Schreiner (1999). The people most benefitted by microcredit
had secondary or higher education, at least three years business experience and owned larger
13
businesses. The people who benefitted the least were divorced or widowed women with
young children, and small business owners.
Cotler and Woodruff (2008) performed a study in Mexico, similar to that of Coleman (1999),
comparing the sales and profits of small-scale retailers. One group had received loans from
a microfinance lender. They found that the microlending programme had a positive effect
on sales and profits for the smallest retailers. However, for the larger retailers, it had a
negative effect on sales and profits. One possible explanation put forward by the authors is
the short study period of less than a year, as the return on the investments may not have
been realized yet.
Angelucci et al. (2015) study the impacts of microfinance at the community level in Mexico.
Using a clustered randomized trial and more than 16 000 household surveys, the trial
observes the effects of an expansion of Mexico’s largest microlender Compartamos. They
find correlation between access to microcredit and growth in businesses, but no effects on
profits, and the growth in businesses seems to be growth in existing businesses rather than
increase in number of businesses, as opposed to the results encountered by Banerjee et al
(2015a). There are no statistically significant effects on household income, but the results
show a reduction in income from the government or similar support systems which suggest
a possible increase in business income which has been balanced out by the decrease in
income from government sources and the like. School enrolment increased for children
between the ages of four and seventeen. Overall, the study shows that micro-lending had a
modest effect on the borrowers. The access to microcredit did increase borrowing while it
did not decrease borrowing of other loans. The loans were generally used for expanding
existing businesses and risk management, i.e. minimize and control the impact or probability
of unfavourable events. It also shows depression and needs for aid decreased. The overall
effects were not large, but there was also no evidence of negative effects such as debt traps.
Augsburg et al. (2015) conducted a Randomized Control Trial (RCT)4 in Bosnia to analyse
the impacts of microcredit. They studied loan applicants who had been rejected by a
microfinance institution and offered a loan to a random subset of the group. They found
evidence of increased self-employment and decreased wage work, but no increase in the
4 A Randomized Control Trial is a study in which the participants are randomly chosen to either receive or not receive treatment (Augsburg et. al, 2015).
14
overall household income. Profits increased for the loan recipients while consumptions and
savings decreased.
3.5 Microfinance in Africa
Buckley (1997) questions if the extensive donor interest in microenterprises5 focuses on the
real problems faced by microentrepreneurs or if it is perceived as a quick fix. Buckley studied
field summary data from Malawi, Kenya, and Ghana and suggests that the problems of
microenterprises are more profound than just lack of capital and needs to be tackled with
structural changes. Despite the undeniable growth experienced by African microenterprise
credit programmes in the 1990’s, Buckley points out there is not much evidence suggesting
the impact has been significant for the recipients in terms of higher or more modernized
levels of operations, increase in income level or employment. The loan repayment rate has
been an advertising indicator of success when promoting microenterprise programmes, but
Buckley claims it does not indicate the microcredit’s impact on the operations of the
enterprise but rather the borrowers’ willingness and ability to repay. It can however not be
disregarded that microcredit in some cases do promote sustained enterprise growth, but the
impact is likely to be overshadowed by the barriers faced by the microentrepreneurs6
including weak property rights, poor infrastructure, and corrupt governments.
A randomized evaluation of a microcredit programme was performed by Crépon et al.
(2015). The programme was introduced by the largest microfinance institution in the country,
Al Amana, in 2006 and took place in rural areas of Morocco. It was the only operating
microfinance institution in the area during the period of the evaluation. Access to microcredit
led to a significant increase in investment in assets for entrepreneurial activities and to an
increase in profit among household that had been identified as more likely to borrow based
on characteristics including number of households, existing infrastructure, and type of
agriculture activities to name a few. The increase in profit, however, was at the expense of a
decrease in income from casual labour, so the overall income or consumption did not change.
Tarozzi et. al (2015) use data on district level in Ethiopia to study the effect of microfinance
on several socioeconomic outcomes, including child school attendance, income-generating
5 A microenterprise is defined as a company with less than ten employees (Investopedia, 2017). 6 A microentrepreneur is an owner or a developer of a microenterprise (US Legal, 2016).

15
activities, labour supply, indicators of women’s empowerment and indicators of food and
health adequacy. The estimates of the study, which involves two microfinance institutions,
can be interpreted as first generation microcredit as there was very limited activity of other
microfinance institutions in this area before and during the study. Three years into the trial
the areas in which microfinance institutions had started operating, the percentage of
households holding loans was 25 percent higher than in the control areas with no access to
microfinance, and the most common place of investment was to fund production activities.
This was considered a significant increase since the interest rates on the microloans were 13
percent, and the authors did not find any signs indicating that the microloans had replaced
other sources of credit. But despite the large increase in number of borrowers, there was no
evidence of any improvement regarding the socioeconomic indicators concerning household
welfare in the areas where microfinance institutions were present. However, the lack of
household welfare improvement was not due to low demand for microcredit. The families
must have found the loans valuable enough to borrow at a 13 percent interest rate.
Increase in self-employment activities can have a positive effect on poverty reduction as it is
income generating. Tarozzi et. al (2015) found, when looking at self-employment activities,
access to loans had a positive impact on farm activities, but no impact on nonfarm
businesses. The number of working hours was similar between areas with access to
microfinance institutions and control areas, both among adults and teenagers. However, a
shortcoming of the study was that the households participating in the survey were not the
same before and after the trial period (Tarozzi et al., 2015).
Okpara (2010) performed a study on the impact of microfinance credit on poverty in Nigeria
over time. Using a poverty index as the dependent variable and microfinance credit as the
independent variable, and performing a factor analysis on several factors affecting poverty
including low agricultural production, lack of employment, and low profits, Okpara (2010)
found that microfinance has impacted poverty in Nigeria in two phases. In the first phase,
prior to 2001, the poverty level in Nigeria continued to increase but at a decreasing rate as
microfinance credit increased in the country. In the second phase, from 2001 and onward,
the poverty index decreased as the microfinance credit increased. Okpara (2010) therefore
concluded that microfinance has a positive impact on poverty reduction in Nigeria.

16
Idolor and Eiriki (2012) examined the impact of microfinance on poverty reduction in
Nigeria. They used Microfinance institutions aggregate assets, deposit liabilities, and loans
and advances as explanatory variables and life expectancy index, education index, GDP per
capita and human development Index as the dependent variables and performed ordinary
least squares regressions. They found that the microfinance institution indicators were
significant determinants of the education index. The asset size and loans and advances of the
institutions had a positive impact while the deposit liabilities had a negative impact on the
education index in Nigeria.
When testing for correlation between the life expectancy index and the microfinance
institution indicators, Idolor and Eiriki (2012) found that deposit liabilities had a negative
impact on the index while the impact of loans and advances was positive. The asset variable
was insignificant and therefore not a suitable determinant. In the third test concerning GDP
per capita, all three explanatory variables were statistically insignificant and can therefore not
be used as determinants of GDP. Lastly, the human development index was not affected by
the microfinance institution indicators. The conclusions drawn by the authors is that
microfinance institutions have a weak impact on poverty alleviation in Nigeria. It may,
however, have a long-term positive effect as increased educational level generally leads to
higher income and can help people escape poverty.
The literature review shows the impact of microfinance varies between countries. Positive
results include expansion of businesses, smoothing of consumption, and increases in
household expenditure and assets. Some studies find no significant changes at all while some
find negative effects such as over-indebtness and decline in school attendance. A summary
of the entire literature review can be found in the appendix. Since the results of previous
research vary, it is difficult to form expectations on the outcome of this study. However, the
research done in Nigeria (Okpara, 2010; Idolor & Eiriki, 2012), has proven more positive
than in many other countries. Based on this, the following hypothesis is formed:
Increased access to microfinance institutions reduces the poverty in Nigeria.

17
4 Empirical Design
4.1 Variables and Data
The unit of observation in this thesis is the states of Nigeria. Nigeria has 36 states and one
federal territory (which will be regarded as a state in this study), where the capital Abuja is
located (Figure 2), and the states are divided into 744 local government areas. The power
possessed by state level governments is shared with the federal government, so the states
have little power assigned to them exclusively. Many leaders at the state level are of the
opinion that the federal government limits their ability to conduct effective government. The
state government is organized according to the so-called presidential model. In the
presidential model, the head of government is elected by all voters of the state. The governor
appoints cabinet ministers from outside the legislative branch (World Bank, 2002). States
were chosen as unit of observation although it is not an economic unit, but rather an
administrative. It was chosen as it is the smallest area with available data.
Figure 2 Map of Nigeria

18
4.1.1 Dependent variable
The dependent variable in this model is poverty level. The data is obtained from the multi-
dimensional poverty index (MPI) from 2016. The MPI consists of three dimensions and 10
indicators. All three of the dimensions are equally weighted, that is, each dimension makes
out one-third of the index. Within each dimension, the indicators are also equally weighted.
The first dimension is education, and the two indicators for education are years of schooling
and school attendance. A person is considered deprived of years of schooling if no one in
the household above the age of ten has completed five years of schooling. A person is
considered deprived of school attendance if any child up to the age at which he or she would
complete 8th grade is not attending school (OPHI, 2016).
The second dimension is health and the two indicators for health are child mortality and
nutrition. A person is deprived in the indicator child mortality if, in the five years preceding
the survey, any child has died in the family. A person is considered deprived in nutrition if
any adult in the household under the age of 70, or any child in the household is
undernourished based on information on weight and age (OPHI, 2016).
The third dimension is standard of living and consists of six indicators – electricity,
sanitation, water, floor, cooking fuel, and assets. A person is deprived electricity if the
household has no electricity. Sanitation deprivation is defined as a household’s sanitation
facility not meeting the guidelines of the Millennium development goals (MDG)7 set by the
UN, or that the sanitation facility is shared with other households. A person is considered
deprived of water if he or she does not have access to drinking water according to MDG’s
guidelines, or if safe drinking water is more than 30-minute round trip walking distance from
home. If a household’s floor is made of dirt, sand or dung, the people living there are
considered deprived of flooring. If a household cooks with wood, charcoal or dung it is
considered deprived of cooking fuel. A person is considered deprived in assets if the
household does not own at least one of the following assets; TV, telephone, radio, bike,
motorbike, or refrigerator, and does not own a truck or a car (OPHI, 2016).
7 The Millenium Development Goals: (1) Eradicate extreme poverty and hunger, (2) Achieve universal primary education, (3) Promote gender equality and empower women, (4) Reduce child mortality, (5) Improve maternal health, (6) Combat HIV/Aids, malaria, and other diseases, (7) Ensure environmental sustainability, (8) Global partnership for development (UN, 2013).

19
Being multidimensionally poor (MPI poor) is defined as being deprived in at least 33.3
percent of the indicators. The MPI is obtained by multiplying the average proportion of the
indicators where poor people are deprived, the intensity of poverty, with the portion of the
population being MPI poor, the incidence of poverty. This gives an indication of how large
the population living in poverty is as well as the degree of poverty.
A person is considered ‘vulnerable to poverty’ if he or she is deprived in 20-33.3 percent of
the indicators. They are considered as living in ‘severe poverty’ if they are deprived in at least
50 percent of the indicators (OPHI, 2016).
The MPI was chosen since it takes many different indicators into account and creates one
index number. It was also suitable as it contains sub-national level data which is needed.
Other data that was considered was poverty data from the Annual Abstract report 2012
provided by the National Bureau of Statistics (2012). An advantage of using the data from
the annual abstract would have been that it is divided into different datasets including
absolute poverty, relative poverty, and extreme poverty. Using this data would have allowed
for testing the impact of access to microfinance on different poverty levels. However, the
latest available data on the different poverty levels is from 2010, and there is no available
data on number of microfinance institutions prior to 2016.
4.1.2 Independent Variables
The model uses four independent variables – access to microfinance institutions, education,
unemployment, and agriculture, the latter three are used as control variables, and one dummy
variable representing closeness to the coast. The first variable, Access to microfinance institutions,
represents the microfinance bank to population ratio for each state. The data on the number
of microfinance institutions operating in the country was obtained from the CBN (2016). It
consists of a file listing all existing microfinance institutions, what state they operate in, and
how long they have been operating for. It does however not include any data on the size of
the institutions, although we can be sure that they have an asset base of more than N20
million as it is the minimum requirement to get licensed. Out of the 1017 operating
microfinance institutions in Nigeria, 45 were licensed in the first year following the new
20
framework in 2007 (CBN, 2016).
By using the number of microfinance institutions, the impact of the geographical access to
financial services, rather than actual credit access, can be measured. This can be an important
aspect as a lot of people do not have access to digital payment services (Pande et al., 2012).
This in combination with lack of good infrastructure creates a large obstacle for the
microfinance institutions to reach the poor, and vice versa. When putting the number of
institutions in relation to population for each state, it gives a more objective view on the
variation of number on institutions per state. If the study shows that geographical access to
microfinance institutions actually does have a positive impact on poverty reduction in
Nigeria, it can be interesting to further study the possibilities of expanding the outreach of
the microfinance institutions. However, although the microfinance institutions are ordered
by state, the exact geographical position is not known. Thus, all microfinance institutions in
a state may be located in the same area, meaning people in other areas of the state may not
have access to them.
The disadvantage of using the number of microfinance institutions is that people may have
geographical access to financial services but still not actual access. That is, they may live
within a short distance of the microfinance institutions but may not be served by them due
to other factors such as low credibility (from either side), or low capacity (on the supply side).
The population rate for each state, which is used to calculate the ratio for the first variable,
was obtained from the National Bureau of Statistics of Nigeria (NBS, 2017). The collection
of data on population is carried out by the National Population Commission to capture
reliable and accurate information on size, composition, and distribution of the population.
The variable is simply calculated by dividing the number of microfinance institutions in the
state with the size of the population in the state. This is done as the size of the population
vary a lot between states, and putting number of microfinance institutions in relation to
population will give better view of the access.
The second independent variable measures the level of Education in the state. Education was
chosen as it has been commonly used as a control variable in similar tests (Coleman, 1999;
Bae et al. 2012). It has a proven positive impact on poverty (Awan et al., 20011; Morrisson,
2002; Harber, 2002), and it has a positive correlation with income and therefore also welfare.

21
The higher the education of the head of the household, the lower the risks of the household
falling into poverty (Aigbokhan, 2008). Education is also one of the indicators for the
multidimensional poverty index, which means these two variables are correlated. An issue
with two variables using the same aspect is the results of the regression can be bias. This,
however, is not the case in this model, as can be concluded by the correlation matrix in Table
3, which shows low correlation between poverty and education. The data for the education
variable was obtained from the Selected education data for the year 2014 (NBS, 2016). The
data consists of two categories, male and female, and covers primary school enrolment in
Nigeria by state in 2014. The variable for education was computed by adding the number of
male and females enrolling in primary school in each state and dividing it by the population
of the state.
The third independent variable in the model is Unemployment. Previous research shows a
positive relationship between unemployment and poverty, that is, the higher the
unemployment rate, the higher the poverty level (Ukpere & Slabbert, 2009; Šileika &
Bekerytė, 2013). It is, therefore, an important parameter to include in the model. The
unemployment rate data used in this paper was obtained from the Annual Abstract of
Statistics 2011 (NBS, 2012). The report estimates unemployment by a 40-hour work week
instead of the one-hour work in a week definition by the International Labour Organisation
(ILO).
The fourth and last independent variable is Agriculture. Agricultural activities have an impact
on poverty in the way that they contribute to nutrition and food security (Zezza & Tasciotti,
2010). In Nigeria, it is the predominant activity among the poor (Olowa, 2012). The data on
agriculture was retrieved from the National Agricultural Sample Survey (NASS) by the
National Bureau of Statistics and the Federal Ministry of Agriculture and Rural Development
(FMA&RD), the data is from 2011 (NBS, 2012). The report from the NBS of Nigeria consist
of four categories; Private farmers – Fisheries, Private farmers – Poultry, Private farmers –
Livestock, and Private farmers – Crop. The survey was carried out at the household level
and corporate farm level. This study will use data from the household level. The variable for
agriculture was computed by adding the number of private farmers in each of the four
categories and dividing it by the population to obtain the percentage of the population
engaging in private agricultural activity in each state.

22
Previous research has shown distance to the coast is one of the main determinants of poverty
in Nigeria and worldwide (Gallup et al 1998; Demurger et al 2002; Madu, 2006). Therefore,
the model contains a dummy variable that represents closeness to the coastline. Nigeria has
six geopolitical zones: North Central, North East, North West, South East, South South, and
South West. The states in each zone have similar history, culture, background, and close
territories (OldNaija, 2016). A map of the geopolitical zones can be found in the appendix.
The three northern zones are considered far from the coastline, and have a dummy value of
one. The three southern zones are close to the coastline and have a dummy value of 0.
The data used in the empirical testing is from 2011-2016. This is the latest data available for
all variables. It was considered most accurate to use the most recent data since the
microfinance institutions then have been operating for a few years and the impact, if any,
should show. As the new framework introduced by the Central Bank came into force in
2007, the first microfinance institutions have had eight years of operations. Out of the 1017
microfinance institutions currently operating in Nigeria, 45 were established in 2007 (CBN,
2016). The data used in the model is from different years for different variables. However,
the three control variables with data from 2011 are semi-fixed, meaning changes in these
variables are slow. Therefore, they can be considered accurate despite not being from the
same year as microfinance institutions and poverty.
4.2 Method
This study will use ordinary least squares (OLS) regression to determine the impact of the
access to microfinance institutions on poverty reduction in Nigeria. A quantitative method
was chosen since the purpose of the study is to test the relationship between two variables,
in this case, poverty and access to microfinance institutions. The design of this quantitative
research is descriptive and will, therefore, measure associations between the variables, and
not causality. The reason for this is the lack of historical data on the number of microfinance
institutions in Nigeria. It should therefore be taken into consideration that the number of
samples in this regression model are very few and may make the results less reliable. One or
a few observations may have extreme values and therefore affect the results of the test.
This quantitative method was chosen to measure the level of poverty of 37 observations

23
based on four independent variables, where one is the number of microfinance institutions
to population ratio and the three others are education, unemployment rate, and agriculture.
The observations represent the 37 states, which is the smallest observable regions in Nigeria
with the chosen parameters.
As the data for each variable was collected at the same point in time, the empirical study is
based on cross-sectional data. Cross-sectional data was chosen as the study only covers one
time period, and does not measure the impact of microfinance institutions over time. The
problem of cross-sectional data is the possible presence of heteroscedasticity (Gujarati &
Porter, 2009). In this study, heteroscedasticity may be present in the form of outliers,
observations that differ a lot from the other observations and therefore has a large effect on
the results of the regression analysis.
The estimated model is as follows:
𝑃𝑂𝑉𝑖 = 𝛽0 + 𝛽1𝑀𝐹𝐼𝑖 + 𝛽2𝐸𝐷𝑈𝑖 + 𝛽3𝑈𝑁𝐸𝑖 + 𝛽4𝐴𝐺𝑅𝐼𝑖 + 𝛽5𝐶𝑂𝐴 + 𝜀 (1)
Where POV is the dependent variable poverty and MFI is the independent variable access
to microfinance institutions. EDU, UNE, and AGRI are the independent control variables
education, unemployment, and agriculture, and COA is the dummy variable closeness to
coastline. 𝛽1, 𝛽2, 𝛽3, 𝛽4, and 𝛽5 are the estimation parameters, 𝛽0 is the intercept and 𝜀 is
the error term.
4.3 Empirical testing
The model uses only 37 observations, which is rather low for an OLS regression. This may
affect the model in the form of under coverage bias. For this study, it means that some
groups of the population may not be represented in the model. A state with a large population
and high variations in poverty level and uneven distribution of microfinance institutions
within the state may give a misleading result. Further, due to the low number of observations,
the model has a low number of explanatory variables. This may cause an endogeneity
problem, as the poverty level may be lower or higher due to factors not included in the
model, for example infrastructure, which can have an impact on poverty as well as access to
microfinance institutions.
24
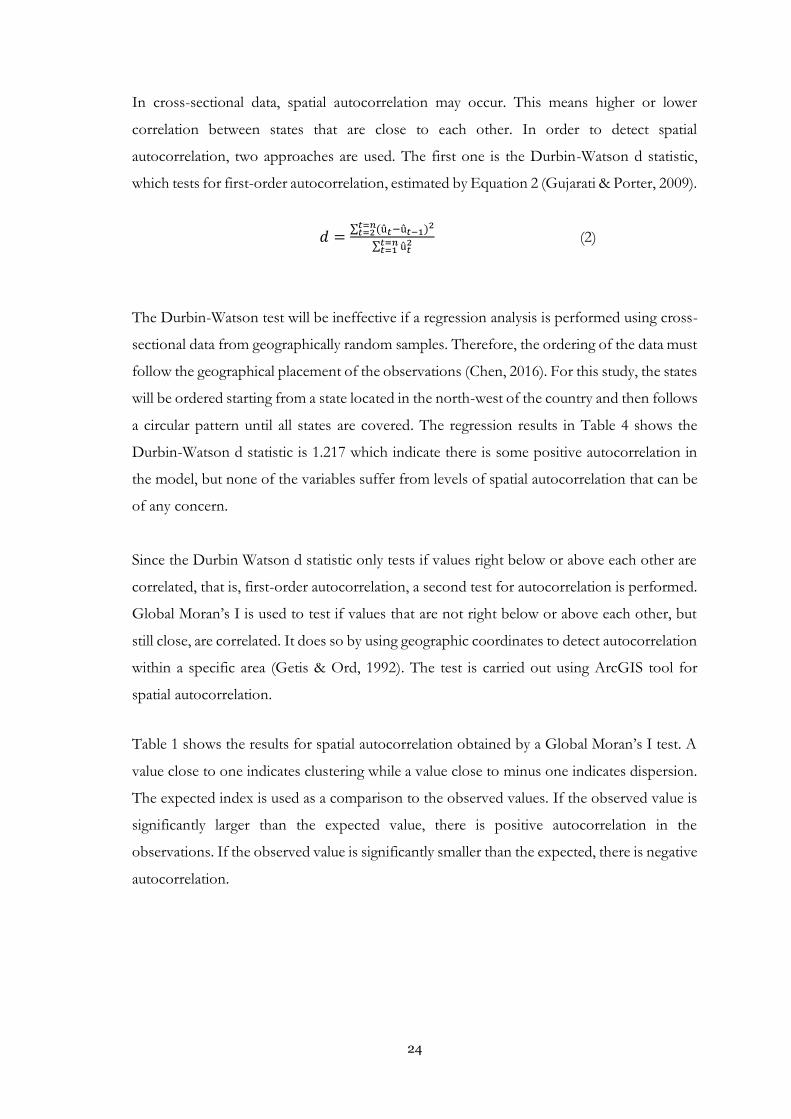
In cross-sectional data, spatial autocorrelation may occur. This means higher or lower
correlation between states that are close to each other. In order to detect spatial
autocorrelation, two approaches are used. The first one is the Durbin-Watson d statistic,
which tests for first-order autocorrelation, estimated by Equation 2 (Gujarati & Porter, 2009).
𝑑 =∑ (û𝑡−û𝑡−1)
2𝑡=𝑛𝑡=2
∑ û𝑡2𝑡=𝑛
𝑡=1 (2)
The Durbin-Watson test will be ineffective if a regression analysis is performed using cross-
sectional data from geographically random samples. Therefore, the ordering of the data must
follow the geographical placement of the observations (Chen, 2016). For this study, the states
will be ordered starting from a state located in the north-west of the country and then follows
a circular pattern until all states are covered. The regression results in Table 4 shows the
Durbin-Watson d statistic is 1.217 which indicate there is some positive autocorrelation in
the model, but none of the variables suffer from levels of spatial autocorrelation that can be
of any concern.
Since the Durbin Watson d statistic only tests if values right below or above each other are
correlated, that is, first-order autocorrelation, a second test for autocorrelation is performed.
Global Moran’s I is used to test if values that are not right below or above each other, but
still close, are correlated. It does so by using geographic coordinates to detect autocorrelation
within a specific area (Getis & Ord, 1992). The test is carried out using ArcGIS tool for
spatial autocorrelation.
Table 1 shows the results for spatial autocorrelation obtained by a Global Moran’s I test. A
value close to one indicates clustering while a value close to minus one indicates dispersion.
The expected index is used as a comparison to the observed values. If the observed value is
significantly larger than the expected value, there is positive autocorrelation in the
observations. If the observed value is significantly smaller than the expected, there is negative
autocorrelation.

25
Table 1 Global Moran's I test
Moran's Index Expected index z-score p-value
Poverty 0.679678 -0.027778 7.644953 0.000000
MFI 0.167688 -0.027778 2.217435 0.026593
Education -0.08185 -0.027778 -0.628222 0.529859
Unemployment 0.363874 -0.027778 4.242824 0.000022
Agriculture 0.020628 -0.027778 0.530631 0.595674
Note: The following abbreviation is used: MFI - Microfinance institution
The variables poverty, microfinance institutions, and unemployment all have a significant z-
score and a positive Moran’s Index. This means that these three variables suffer from positive
autocorrelation. The result is in line with the patterns observed in Figure 4 showing poverty
is higher in the north. This was expected as previous research has shown distance to the
coast is one of the main determinants of poverty (Gallup et al 1998; Demurger et al 2002;
Madu, 2006), and only the southern part of Nigeria border to the sea. There is low
autocorrelation for microfinances institutions, as can be seen in Figure 1 where many
microfinance institutions are located in the south-west. Figure 7 shows high unemployment
rates in the north, yielding low levels of autocorrelation for the unemployment variable. The
values for variables education and agriculture are insignificant indicating the spatial patterns
are random. The results of the Global Moran’s I test confirms the results of the Durbin
Watson d statistic, that there is some autocorrelation in the model.

26
4.4 Heteroscedasticity
Figure 3 Heteroscedasticity
Figure 3 shows a scatterplot of the standardized residuals on the y-axis and the standardized
predicted values on the x-axis. They have been estimated to investigate if the model suffers
from heteroscedasticity. It can be concluded from the scatterplot that the residuals are
random, i.e. the model does not suffer from heteroscedasticity as the residuals are not
dependent on the predicted value, and the model is efficient.

27
5 Empirical Analysis
5.1 Descriptive Statistics
Table 2 shows descriptive statistics for the five variables and two additional variables. The
first additional variable is the number of microfinance institutions per state in 2016. This
variable was included to get a clearer view of the distribution of the microfinance institutions.
The second additional variable is population living in poverty in in relation to number of
microfinance institutions. The variable was included to give a perspective of the extremely
higher numbers of people living in poverty in Nigeria and the shortfall of financial services
accessible to these people.
Table 2 Descriptive statistics
Minimum Maximum Mean Standard Deviation
Poverty level 0.04 0.64 0.2599 0.19517
MFI to population rate* 0 0.2 0.0496 0.04398
Education 0.04 0.49 0.1429 0.09069
Unemployment rate 0.03 0.43 0.2337 0.10619
Agriculture 0.02 0.45 0.2383 0.0924
Number of MFI per state 1 191 27.4865 34.02338
Population living in poverty per MFI 2,300 2,091,777 197,581 376,321.919
Note: The following abbreviation is used: MFI - Microfinance institution
*Population is measured in 10,000
The mean poverty level of 0.2599 implicates that on average, 25.99 percent of the population
lives in poverty in each state, and that the poverty level of Nigeria is 25.99 percent if measured
accordingly to the indicators used for the multidimensional poverty index (OPHI, 2016). By
looking at the minimum and maximum poverty levels of 4 percent and 64 percent
respectively, and the rather large standard deviation of 0.19517, it is evident that the levels
differ substantially between states. The poorest state according to the multidimensional
poverty index is Yobe in the north east and the richest is Lagos in the south west.

28
Figure 4 Multidimensional poverty index
Note: The index ranges from 0 to 1, 1 being the highest level of poverty.
Figure 4 shows the poverty levels in the different states of Nigeria. The map gives a clear
view on the spatial patterns of poverty in the country. It is evident that states located close
to each other have a similar score on the multidimensional poverty index. This means that
spatial autocorrelation may be present in the model. The southern part of Nigeria with lower
levels of poverty is the coastline of the Atlantic Ocean, while the northern, poorer parts
border to Niger. Previous studies on poverty in Nigeria have shown the distance from the
coast is one of the main contributing factors to poverty (Madu, 2006; Erubami & Young,
2003), which accords with worldwide findings showing greater development in coastal areas
than inland areas (Gallup et al 1998; Demurger et al 2002). The south of the country is also
where many of Nigeria’s cities and large towns are located, which may be due to the closeness
to water (Foster & Pushak, 2011). The connection between cities and lower poverty rates
indicates poverty is a problem of rural areas. Even though the infrastructure networks cover
the country extensively, it is more widespread in the southern parts of the country (Foster &
Pushak, 2011). Thus, the higher poverty level in the northern parts of the country is not
surprising. Another factor that most likely plays an important role in the development of
█▌0.000-0.099
█▌0.100-0.199
█▌0.200-0.299
█▌0.300-0.399
█▌0.400-0.499
█▌0.500-1
MPI, Index

29
northern Nigeria is Boko Haram8. The group has its headquarters in Borno state in the north-
east of Nigeria. The philosophy of Boko Haram is that any activity, social or political,
associated with the Western society is forbidden fruit for Muslims. Many Muslim families in
the northern parts of the country refuse to let their children take part in the so-called
“Western schools” run by the government (Chothia, 2012).
The number of microfinance institutions to population rate shows that on average there are
0.0496 microfinance institutions per 10,000 inhabitants. The state with the lowest amount of
microfinance institutions has close to 0 institutions per 10,000 since Yobe state only has 1
microfinance institution and a population of 3,294,137. The state with the highest value has
0.2 institutions per 10,000 people and the mean for the country is 0.0496.
The number of microfinance institutions per state shows that the state with the lowest
amount of microfinance institutions only has one, while the state with the highest amount
has 191 out of the total 1017 microfinance institutions in Nigeria, hence the high standard
deviation of 34 which exceeds the average amount of 27 microfinance institutions for the
country. The last indicator shows the number of people living in poverty per microfinance
institution, and the differences between the minimum and maximum values are large. In the
state with the most amount of microfinance institutions in relation to population living in
poverty, the number of people per institution is 2,300, while in the state with the largest
number of people per institution it is 2,091,777. The standard deviation for this variable is
extremely high at 376,321.919 as Sokoto state, which has the second highest value after Yobe
state, scores a value of 684,738, which is less than half of that of Yobe.
Figure 1 shows the distribution of microfinance institutions in Nigeria. The states with the
largest percentage of microfinance institutions are Lagos in the south-west with 18.78
percent, Anambra in the south with 7.96 percent, and Federal Capital Territory, in the middle
of the country where the capital Abuja is located, 6.88 percent. Evidently, Lagos has a much
larger percentage of the microfinance institutions than any other state, but it is also the state
with the second largest amount of people.
8 Boko Haram is a militant Islamist group known for its bombings and fighting to create an Islamic state (Chothia, 2012). In April, 2014 they kidnapped 276 Nigerian girls from a boarding school in Borno state (BBC, 2017).

30
Infrastructure plays an important role in the distribution of microfinance institutions. Poor
infrastructure limits the outreach of the microfinance institutions and increases the costs. It
can, therefore, be expected that more microfinance institutions are located in areas with
better infrastructure, even though it might not be the areas they are needed the most (Acha,
2012). Religion is another factor that may play a part in the distribution. The northern parts
of Nigeria are mainly populated by Muslims, and they see interest on loans as usury (Acha,
2012). Mohammed & Hassan (2009) stated that charging interest is forbidden for Muslims
as it violates Islamic principles. This naturally complicates the establishment of microfinance
institutions in these areas.
Figure 5 shows the population distributions in Nigeria, Kano is the most populated state
with 13 million people, second is Lagos with 12.5 million, and the state with the third largest
population Kaduna has far less at 8.6 million.
Figure 5 Population by state
█▌2-3.999
█▌4-5.999
█▌6-7.999
█▌8-9.999
█▌10-11.999
█▌12<
Population in millions of people

31
Figure 6 Education by state
Figure 6 shows the percentage of the population enrolling in primary school by state. The
education mean of 0.1429 implicates that the average of children enrolled in primary school
in relation to population is 14.29 percent in Nigeria, and in the states with the lowest and
highest enrolment it is four percent and 49 percent respectively. The low mean in comparison
to the maximum rate is due to that one observation, Kano state, has a much higher primary
school enrolment than the state coming in second, Ondo state with 31 percent.
The unemployment rate has similar minimum and maximum values, where the lowest rate
of unemployment is three percent and the highest is 42 percent. The mean for all states,
however, is greater, as 0.2337 implicates an average unemployment rate of 23.37 percent.
Figure 7 shows the unemployment rate by state, and it is clear that it follows the same pattern
as poverty.
█▌0-5.99 %
█▌6-10.99 %
█▌11-15.99 %
█▌16-20.99 %
█▌21-25.99 %
█▌26 % <
Percentage of population enrolling in primary school
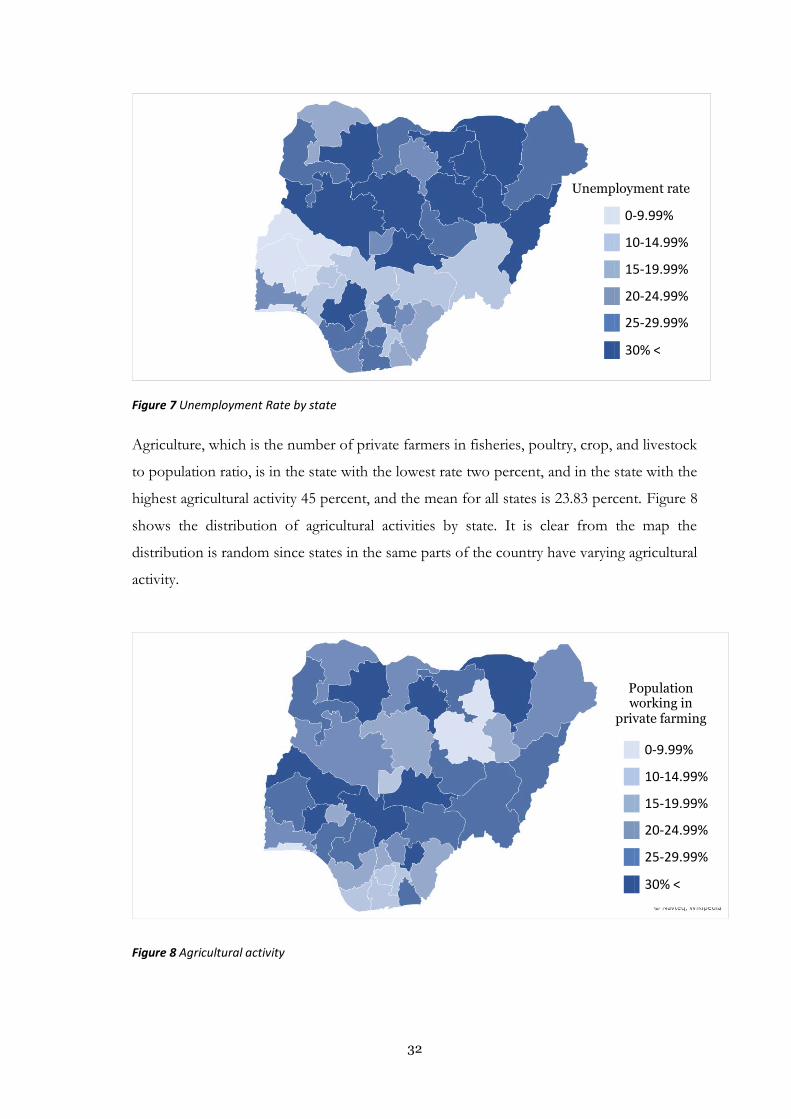
32
Figure 7 Unemployment Rate by state
Agriculture, which is the number of private farmers in fisheries, poultry, crop, and livestock
to population ratio, is in the state with the lowest rate two percent, and in the state with the
highest agricultural activity 45 percent, and the mean for all states is 23.83 percent. Figure 8
shows the distribution of agricultural activities by state. It is clear from the map the
distribution is random since states in the same parts of the country have varying agricultural
activity.
Figure 8 Agricultural activity
█▌0-9.99%
█▌10-14.99%
█▌15-19.99%
█▌20-24.99%
█▌25-29.99%
█▌30% <
█▌0-9.99%
█▌10-14.99%
█▌15-19.99%
█▌20-24.99%
█▌25-29.99%
█▌30% <
Unemployment rate
Population working in
private farming
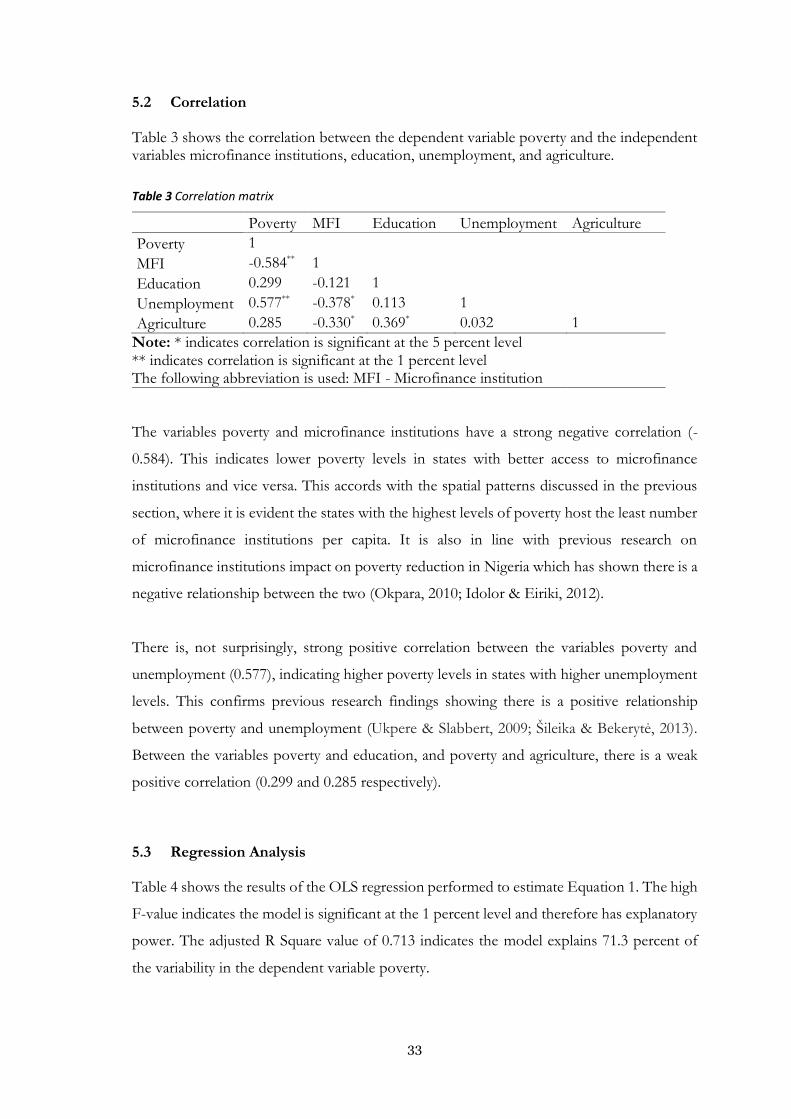
33
5.2 Correlation
Table 3 shows the correlation between the dependent variable poverty and the independent variables microfinance institutions, education, unemployment, and agriculture.
Table 3 Correlation matrix
Poverty MFI Education Unemployment Agriculture
Poverty 1
MFI -0.584** 1
Education 0.299 -0.121 1
Unemployment 0.577** -0.378* 0.113 1
Agriculture 0.285 -0.330* 0.369* 0.032 1
Note: * indicates correlation is significant at the 5 percent level ** indicates correlation is significant at the 1 percent level The following abbreviation is used: MFI - Microfinance institution
The variables poverty and microfinance institutions have a strong negative correlation (-
0.584). This indicates lower poverty levels in states with better access to microfinance
institutions and vice versa. This accords with the spatial patterns discussed in the previous
section, where it is evident the states with the highest levels of poverty host the least number
of microfinance institutions per capita. It is also in line with previous research on
microfinance institutions impact on poverty reduction in Nigeria which has shown there is a
negative relationship between the two (Okpara, 2010; Idolor & Eiriki, 2012).
There is, not surprisingly, strong positive correlation between the variables poverty and
unemployment (0.577), indicating higher poverty levels in states with higher unemployment
levels. This confirms previous research findings showing there is a positive relationship
between poverty and unemployment (Ukpere & Slabbert, 2009; Šileika & Bekerytė, 2013).
Between the variables poverty and education, and poverty and agriculture, there is a weak
positive correlation (0.299 and 0.285 respectively).
5.3 Regression Analysis
Table 4 shows the results of the OLS regression performed to estimate Equation 1. The high
F-value indicates the model is significant at the 1 percent level and therefore has explanatory
power. The adjusted R Square value of 0.713 indicates the model explains 71.3 percent of
the variability in the dependent variable poverty.
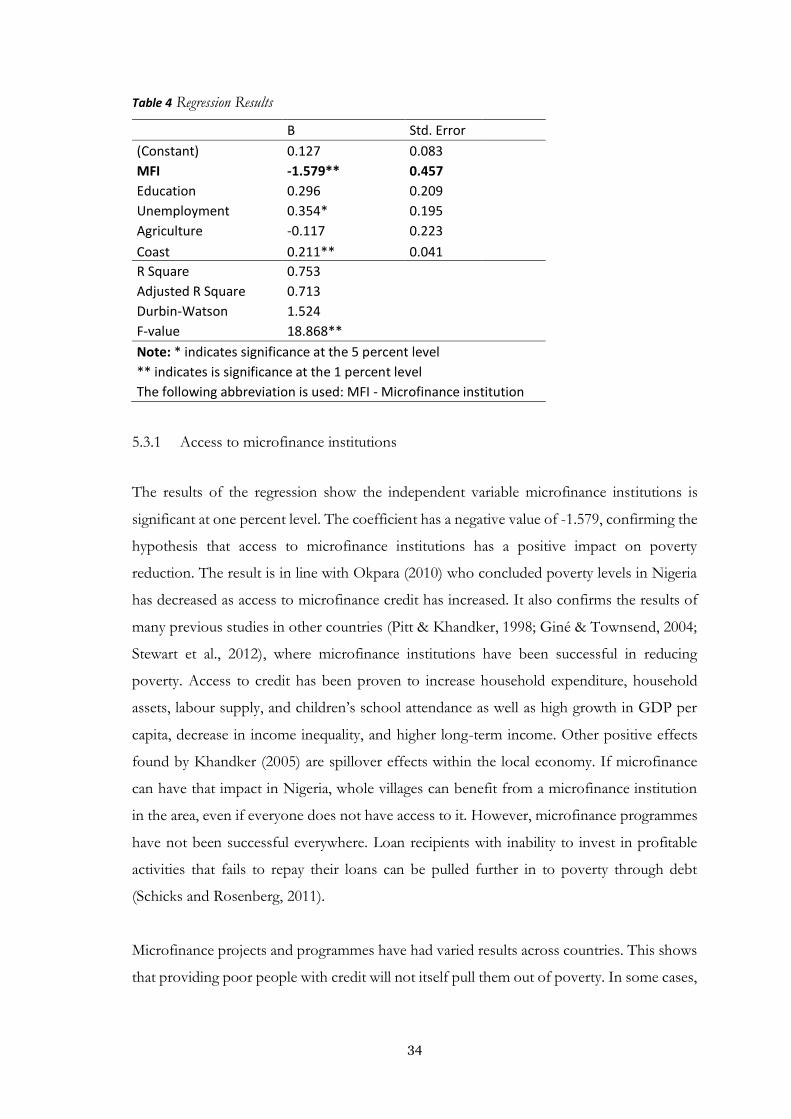
34
Table 4 Regression Results
B Std. Error
(Constant) 0.127 0.083 MFI -1.579** 0.457 Education 0.296 0.209 Unemployment 0.354* 0.195 Agriculture -0.117 0.223
Coast 0.211** 0.041
R Square 0.753 Adjusted R Square 0.713 Durbin-Watson 1.524 F-value 18.868**
Note: * indicates significance at the 5 percent level
** indicates is significance at the 1 percent level The following abbreviation is used: MFI - Microfinance institution
5.3.1 Access to microfinance institutions
The results of the regression show the independent variable microfinance institutions is
significant at one percent level. The coefficient has a negative value of -1.579, confirming the
hypothesis that access to microfinance institutions has a positive impact on poverty
reduction. The result is in line with Okpara (2010) who concluded poverty levels in Nigeria
has decreased as access to microfinance credit has increased. It also confirms the results of
many previous studies in other countries (Pitt & Khandker, 1998; Giné & Townsend, 2004;
Stewart et al., 2012), where microfinance institutions have been successful in reducing
poverty. Access to credit has been proven to increase household expenditure, household
assets, labour supply, and children’s school attendance as well as high growth in GDP per
capita, decrease in income inequality, and higher long-term income. Other positive effects
found by Khandker (2005) are spillover effects within the local economy. If microfinance
can have that impact in Nigeria, whole villages can benefit from a microfinance institution
in the area, even if everyone does not have access to it. However, microfinance programmes
have not been successful everywhere. Loan recipients with inability to invest in profitable
activities that fails to repay their loans can be pulled further in to poverty through debt
(Schicks and Rosenberg, 2011).
Microfinance projects and programmes have had varied results across countries. This shows
that providing poor people with credit will not itself pull them out of poverty. In some cases,

35
there seems to be some threshold before benefitting from microfinance. Copestake et al.
(2005) and Schreiner (1999) found that the poorest were not the main users of microfinance
programmes, but rather the poor with high skills, education, and assets. The loan recipient
must be able to invest the money in something that will be profitable in order to escape
poverty. As discussed by Schicks and Rosenberg (2011), if loans are not invested in
productive activities that yield a positive return, it may be hard for the lender to repay the
loan. If this is the case in Nigeria, that the absolute poorest have not been affected positively
by the microfinance institutions, but rather the moderately poor, is not observable in this
model as it only measures the percentage of people living in poverty, not different poverty
levels. What can be concluded, however, is that the overall poverty level of the state is lower
if the number of microfinance institutions to population ratio is higher.
The findings of Stewart et al. (2012) also implies microfinance is beneficial for people in
some environments but not in others. This means the structure of the programmes and
political frameworks of the country could also be the reason for such different results across
countries. As this is a within country study, the microfinance institutions have the same
institutional rights and the microfinance policy set by the CBN applies to all institutions of
this study. This study does not investigate changes in poverty levels and microfinance
institutions over time, which makes it hard to say whether the regulatory framework for
microfinance institutions, provided by the CBN, which entered into force in 2007 has
improved the performance of the microfinance institutions in a way beneficial for the
customers. The CBN revised the framework in 2011 and reported some improvements in
the form of increased awareness among stakeholders. However, the CBN confirmed the
uneven distribution of microfinance institutions. The microfinance institutions were mainly
located in areas perceived by investors as areas with high business volume and profitability
(CBN, 2011). This complicates the interpretations of the results of the regression as it is
hard to tell whether poverty levels are lower because of higher access to microfinance
institutions, or if microfinance institutions are more commonly established in more
developed areas where poverty levels are lower.
Nevertheless, it cannot be concluded that the relationship between access to microfinance
institutions and poverty is solely due to an endogeneity problem. As previous research has
shown, there is a positive relationship between microfinance and poverty reduction in
Nigeria on a national level (Okpara, 2010; Idolor & Eiriki, 2012), which supports the results

36
of this study. The result of the regression shows access to microfinance institutions has a
higher impact on poverty than any of the control variables.
An additional regression was carried out using poverty as the dependent variable and number
of microfinance institutions per state, without taking population into account, as
independent variable (the control variables were the same as in the previous model). The
results show the model, presented in Table 5, is significant and explains 62.3 percent of the
variability in the dependent variable poverty. However, the coefficient for number of
microfinance institutions is insignificant. This indicates that the number of microfinance
institutions in a state is not a determinant of the poverty level unless it is put in relation to
the population. The results imply that there are not more microfinance institutions located
in richer states, but rather more microfinance institutions in relation to population in those
states. Further, it is clear that it is the actual access to rather than the existence of
microfinance institutions that plays a role in poverty reduction.
Table 5 Regression results Model 2
B Std. Error
(Constant) 0.023 0.097
Number of MFI -0.001 0.001
Education 0.288 0.240
Unemployment 0.488** 0.037
Agriculture -0.035 0.272
Coast 0.215** 0.046
R Square 0.675
Adjusted R Square 0.623 Durbin-Watson 1.177 F 12.885**
Note: ** indicates significance at the 1 percent level
The following abbreviation is used: MFI - Microfinance institutions
5.3.2 Control variables
Education is insignificant, meaning the education level in a state is not an important indicator
of poverty. This is somewhat surprising but as previous studies have shown a positive
relationship between education and poverty reduction (Awan et al., 20011; Morrisson, 2002;
Harber, 2002). However, the reason the variable is insignificant in this model may be the way
education is measured. This model only uses primary school enrolment as data for the
education variable, while higher education might be necessary prove significant for poverty

37
reduction. Another explanation can be urbanization. There are more job opportunities in the
cities, which can lead people with an education to move to urban areas (World Bank Group,
2016). This means people educated in one state may immigrate to a different state, and
therefore the education of that person will not affect the poverty level in his or her home
state.
The control variable unemployment is significant at the 1 percent level and the coefficient is
positive. As previous research has shown, there is a strong positive relationship between
poverty and unemployment, as unemployment has a tendency of pulling people into poverty
due to lack of income (Ukpere & Slabbert, 2009; Šileika & Bekerytė, 2013). Therefore, the
result of the regression regarding the unemployment variable was expected.
The variable agriculture is insignificant, implying it is not an important determinant of the
poverty level at the state level. Agriculture was expected to be a determinant of poverty levels
as studies have shown agriculture can increase income and improve the living situation of
the poor (Thirtle et al., 2001; Zezza & Tasciotti, 2010). The insignificance of agriculture in
this model may be explained by the fact that agricultural activities can help pulling people
out of poverty, and at the same time, agriculture is the most common occupation among
poor in Nigeria (Olowa, 2012). This means that many farmers may have escaped poverty
through their work, while others are still poor, which would explain the lack of correlation
between poverty and agriculture in the country.

38
6 Conclusions
Previous research show different results depending on where microfinance is provided and
to whom. Recipients of microfinance loans need to be able to invest the money into
profitable activities in order to benefit from the credit. Some countries have seen great results
using microfinance programmes for instance through growth in GDP per capita, higher long-
term income, and increase in household income and assets. This proves the importance of
engaging the poor into financial activities to improve their living situation. It is therefore
crucial to find a structure of the programme that fits the society and to make microfinance
accessible to as many people as possible. This study shows that access to microfinance
institutions has a significant impact on poverty reduction in Nigeria. It can, therefore, be
concluded that increasing the number of microfinance institutions in the poor areas can
decrease the poverty levels in the country. More money and time needs to be invested in the
microfinance programme to expand and improve it. However, it may be beneficial to
incorporate education for the loan taker on how to invest the money for it to be profitable,
as investing in non-profitable activities can give the opposite effect and pull people further
into poverty by putting them in debt. Information can be given to the loan taker in
conjunction with the grant of the loan. The investment knowledge of the employees of the
microfinance institutions needs to be high for them to be able to advise the loan takers on
what activities will or will not yield a positive return.
Closer monitoring of the microfinance institutions, in particular the state owned once with
a tendency to be politically influenced, to make sure the recipients of the services provided
is indeed the target group, is necessary to ensure improvement in the impact of microfinance.
It is also suggested the government invests in improving the infrastructure of the country in
order to enable more establishments of microfinance institutions in areas where people
currently do not have access to any financial institutions. However, it may not be enough to
give access to financial services in some areas. In the northern parts of the country, mainly
populated by Muslims who regards charging interest as a violation of the Islamic principles,
a different approach to reducing poverty may be necessary.
This paper uses number of microfinance institutions to population as a measure of access to
microfinance, as this was the only relevant data on microfinance institutions available to the
author. It is suggested that future research includes a measure of the size of the microfinance

39
institutions, for example asset base or number of customers, as it may yield different results.
Testing for changes over time was not possible in this study as historical data on the number
of microfinance institutions per state was not available to the author. This could, however,
be an interesting approach for future research, as it can give a clearer view on the relationship
between microfinance and poverty. Initially, this study was supposed to use data from 2017
which was set to be released in March, 2017 by the National Bureau of Statistics. However,
the release date of the data was delayed and it was not possible to use it for this study. It is
therefore suggested that future research performs similar testing to that of this study on the
data being released later this year.

40
Reference list
Acha I. A. (2012). Microfinance banking in Nigeria: Problems and prospects. International Journal of Finance and Accounting, 1(5), 106-111. Retrieved 2017-03-23 from: https://www.researchgate.net/profile/Ikechukwu_Acha/publication/305721447_Microfinance_Banking_in_Nigeria_Problems_and_Prospects/links/579bc49a08ae5d5e1e1382a3.pdf
Adams, D. W., & Von Pischke, J. D. (1992). Microenterprise credit programs: Deja vu. World development, 20(10), 1463-1470. Retrieved 2017-03-23 from: http://www.sciencedirect.com/science/article/pii/0305750X92900665
Aigbokhan, B. E. (2008). Growth, inequality and poverty in Nigeria. Prepared for United Nations Economic Commission for Africa (UNECA). Addis Ababa, Ethiopia. Retrieved 2017-04-25 from: http://repository.uneca.org/handle/10855/14927
Ailemen, I. O. (2010). Bank consolidation/capitalization in the Nigerian Commercial Bank (1986-2006): causes, consequences and implication for the future. Manager (University of Bucharest, Faculty of Business & Administration), (11). Retrieved 2017-03-30 from: http://econpapers.repec.org/article/butmanage/v_3a11_3ay_3a2010_3ai_3a1_3ap_3a215-233.htm
Akanji, O. O. (2006). Microfinance as a strategy for poverty reduction. Central Bank of Nigeria Economic and Financial Review, 39(4), 78-102. Retrieved 2017-03-23 from: http://w1219.cbn.gov.ng/OUT/PUBLICATIONS/EFR/RD/2002/EFRVOL39-4-1.PDF
Angelucci, M., Karlan, D., & Zinman, J. (2015). Microcredit impacts: Evidence from a randomized microcredit program placement experiment by Compartamos Banco. American Economic Journal: Applied Economics, 7(1), 151-182. Retrieved 2017-03-23 from: https://ideas.repec.org/p/cpr/ceprdp/9811.html
Anyanwu, C. M. (2004). Microfinance institutions in Nigeria: policy, practice and potentials. In G24 Workshop on “Constraints to Growth in Sub Saharan Africa,” Pretoria, South Africa. Retrieved 2017-03-23 from: https://g24.org/wp-content/uploads/2016/01/Microfinance-Institutions-in-Nigeria.pdf
Aportela, F. (1999). Effects of financial access on savings by low-income people. Mexico City: Banco de Mexico Research Department. Retrieved 2017-03-30 from: https://pdfs.semanticscholar.org/7797/b4a48434a76aee3fd978cec9a347902b8b77.pdf
Augsburg, B., De Haas, R., Harmgart, H., & Meghir, C. (2015). The impacts of microcredit: Evidence from Bosnia and Herzegovina. American Economic Journal: Applied Economics, 7(1), 183-203.
Awan, M. S., Malik, N., Sarwar, H., & Waqas, M. (2011). Impact of education on poverty reduction. International Journal of Academic Research, 3(1), 659-664. Retrieved 2017-03-23 from: https://mpra.ub.uni-muenchen.de/31826/

41
Bae, K., Han, D., & Sohn, H. (2012). Importance of Access to Finance in Reducing Income Inequality and Poverty Level. International Review of Public Administration, 17(1), 55-77. Retrieved 2017-03-23 from: http://www.tandfonline.com.proxy.library.ju.se/doi/abs/10.1080/12264431.2012.10805217
Banerjee, A., Duflo, E., Glennerster, R., & Kinnan, C. (2015b). The miracle of microfinance? Evidence from a randomized evaluation. American Economic Journal: Applied Economics, 7(1), 22-53. Retrieved 2017-03-23 from: http://citeseerx.ist.psu.edu/viewdoc/summary?doi=10.1.1.167.6428
Banerjee, A., Karlan, D., & Zinman, J. (2015a). Six randomized evaluations of microcredit: Introduction and further steps. American Economic Journal: Applied Economics, 7(1), 1-21.
BBC. (2017, May 8). Nigeria Chibok abductions: What we know. BBC. Retrieved 2017-05-19 from: http://www.bbc.com/news/world-africa-32299943
Beck, T., Demirgüç-Kunt, A., & Levine, R. (2007). Finance, inequality and the poor. Journal of economic growth, 12(1), 27-49.
Buckley, G. (1997). Microfinance in Africa: Is it either the problem or the solution?. World development, 25(7), 1081-1093.
CBN. (2005). Microfinance Policy Regulatory and Supervisory Framework for Nigeria. Abuja: CBN. Retrieved 2017-03-23 from: http://www.cbn.gov.ng/out/publications/guidelines/dfd/2006/microfinance%20policy.pdf
CBN. (2011). Microfinance Policy Framework for Nigeria. CBN. Retrieved 2017-05-04 from: http://www.cbn.gov.ng/Out/2011/publications/dfd/Reviewed%20Microfinance%20Policy%20July%2012%202011.pdf
CBN. (2016). List of Microfinance Banks. Retrieved 2017-03-23 from: http://www.cbn.gov.ng/supervision/inst-mf.asp
Chen, Y. (2016). Spatial autocorrelation approaches to testing residuals from least squares regression. PloS one, 11(1). Retrieved 2017-03-23 from: http://journals.plos.org/plosone/article?id=10.1371/journal.pone.0146865
Claessens, S., & Feijen, E. (2007). Financial sector development and the millennium development goals (No. 89). World Bank Publications.
Coleman, B. E. (1999). The impact of group lending in Northeast Thailand. Journal of development economics, 60(1), 105-141. Retrieved 2017-03-23 from: http://www.sciencedirect.com/science/article/pii/S0304387899000383
Copestake, J., Dawson, P., Fanning, J. P., McKay, A., & Wright‐Revolledo, K. (2005). Monitoring the diversity of the poverty outreach and impact of microfinance: A comparison of methods using data from Peru. Development Policy Review, 23(6), 703-723.

42
Chothia, F. (2012). Who are Nigeria’s Boko Haram Islamists. BBC News, 11. Retrieved 2017-05-19 from: http://cfec.typepad.com/files/article---boko-haram-background---1-11-12---bbc.pdf
Cotler, P., & Woodruff, C. (2008). The impact of short-term credit on microenterprises: evidence from the Fincomun-Bimbo program in Mexico. Economic Development and Cultural Change, 56(4), 829-849.
Crépon, B., Devoto, F., Duflo, E., & Parienté, W. (2015). Estimating the impact of microcredit on those who take it up: Evidence from a randomized experiment in Morocco. American Economic Journal: Applied Economics, 7(1), 123-150.
Démurger, S., Sachs, J. D., Woo, W. T., Bao, S., Chang, G., & Mellinger, A. (2002). Geography, economic policy, and regional development in China. Asian Economic Papers, 1(1), 146-197.
Erubami, M., & Young, I. R. (2003). Nigerian social and economic inequality in its global context. CHRRD Research Review, (2).
Foster, V., & Pushak, N. (2011). Nigeria's infrastructure: a continental perspective. Washington: The World Bank. Retrieved 2017-04-20 from: https://papers.ssrn.com/sol3/papers.cfm?abstract_id=1871582
Gallup, J. L., Sachs, J., & Mellinger, A. D. (1998). Geography and economic growth (pp. 20-1). World Bank. Retrieved 2017-04-15 from: http://siteresources.worldbank.org/INTABCDEWASHINGTON1998/Resources/sachs.pdf
Galor, O., & Tsiddon, D. (1996). Income distribution and growth: the Kuznets hypothesis revisited. Economica, S103-S117. Retrieved 2017-05-13 from: http://www.jstor.org/stable/2554811?seq=1#page_scan_tab_contents
Getis, A., & Ord, J.K. (1992). The analysis of spatial association by use of distance statistics. Geographical Analysis, 24(3), 189-206. Retrieved 2017-03-23 from: http://onlinelibrary.wiley.com/doi/10.1111/j.1538-4632.1992.tb00261.x/full
Giné, X., & Townsend, R. M. (2004). Evaluation of financial liberalization: a general equilibrium model with constrained occupation choice. Journal of development Economics, 74(2), 269-307. Retrieved 2017-03-23 from: http://www.sciencedirect.com/science/article/pii/S0304387804000161
Gujarati, D.N., & Porter, D.C. (2009). Basic Econometrics (5th international ed.). New York: McGraw-Hill
Harber, C. (2002). Education, democracy and poverty reduction in Africa. Comparative Education, 38(3), 267-276. Retrieved 2017-03-23 from: http://www.tandfonline.com/doi/abs/10.1080/0305006022000014133
Idolor, E. J., & Eriki, P. O. (2012). Financial Analysis of Assessment of Impact of Micro-Financing Institutions Towards Poverty Reduction in Nigeria. Journal of Financial Management and Analysis, 25(1), 51-74.

43
IEG. (2012). Agricultural Development Projects in Nigeria. The World Bank Group. Retrieved 2017-04-12 from: http://lnweb90.worldbank.org/oed/oeddoclib.nsf/DocUNIDViewForJavaSearch/FE7BA13642E3E0D7852567F5005D85CF
Imhanlahimi, J., & Idolor, E. J. (2010). Poverty alleviation through micro financing in Nigeria: Prospects and challenges. Journal of Financial Management & Analysis, 23(1), 66. Retrieved 2017-03-23 from: http://www.globalacademicgroup.com/journals/knowledge%20review/POVERTY%20ALLEVIATION%20THROUGH%20MICRO%20FINANCING%20IN%20NIGERIA.pdf
Independent Evaluation group (IEG). (2012). Agricultural Development Programs in Nigeria. The World Bank Group. Retrieved 2017-03-23 from: http://lnweb90.worldbank.org/oed/oeddoclib.nsf/DocUNIDViewForJavaSearch/FE7BA13642E3E0D7852567F5005D85CF
International Monetary Fund. (2013). Nigeria: Financial Sector Stability Assessment. IMF Country Report No 13/140. Washington D.C. Retrieved 2017-04-10 from: https://www.imf.org/external/pubs/ft/scr/2013/cr13140.pdf
Investopedia. (2017). Microenterprise. Retrieved 2017-04-12 from: http://www.investopedia.com/terms/m/microenterprise.asp
Jalilian, H., & Kirkpatrick, C. (2002). Financial development and poverty reduction in developing countries. International Journal of Finance & Economics, 7(2), 97-108. Retrieved 2017-03-30 from: http://onlinelibrary.wiley.com/doi/10.1002/ijfe.179/full
Kaboski, J. P., & Townsend, R. M. (2012). The impact of credit on village economies. American Economic Journal: Applied Economics, 4(2), 98-133.
Khandker, S. R. (2005). Microfinance and poverty: Evidence using panel data from Bangladesh. The World Bank Economic Review, 19(2), 263-286.
Levine, R. (1997). Financial development and economic growth: Views and agenda. Journal of Economic Literature, 35, 688–726.
Levine, R. (2005). Finance and growth: Theory and evidence. Handbook of economic growth, (Eds), P. Aghion & S. Durlauf, Amsterdam: North-Holland Elsevier Publishers. Retrieved 2017-04-02 from: http://www.sciencedirect.com/science/article/pii/S1574068405010129
Madu, I. A. (2006). Spatial inequality in Nigeria: The imperative of geographic perspectives in the development process. Journal of Social and Economic Development, 8(2), 105. Retrieved 2017-04-22 from: http://www.isec.ac.in/JSED/JSED_V8_I2_105-120.pdf
Mohammed, A. D. and Hassan, Z. (2009). Microfinance in Nigeria and the Prospects of Introducing and Islamic Version in the light of Selected Muslim Countries’ Experience. Review of Islamic Economics, 13(1), pp. 115-174. Retrieved 2017-04-26 from: https://mpra.ub.uni-muenchen.de/8127/

44
Morrisson, C. (2002). Health, Education and Poverty Reduction. OECD Development Centre Policy Briefs, 19. Paris: OECD Publishing. Retrieved 2017-03-23 from: http://www.oecd-ilibrary.org/development/health-education-and-poverty-reduction_764315057662
Morduch, J. (1998). Does microfinance really help the poor?: New evidence from flagship programs in Bangladesh. Research Program in Development Studies, Woodrow School of Public and International Affairs.
NBS. (2012). Annual Abstract of Statistics 2011. Abuja: NBS
NBS. (2017). Population Forecasts. NBS
NBS & (2012). Collaborative Survey on National Agriculture Sample Survey (NASS). NBS
NBS & UBEC. (2016). Selected Basic Public Education Statistics in Nigeria 2013-2014. NBS & UBEC
Nwanyanwu, O. J. (2011), Microfinance in Nigeria: Problems and Prospects. African Research Review, 5(2), 87-103. Retrieved 2017-03-23 from: http://citeseerx.ist.psu.edu/viewdoc/download?doi=10.1.1.920.8379&rep=rep1&type=pdf
Obadan, M. I. (2001). Poverty reduction in Nigeria: The way forward. CBN Economic and Financial Review, 39(4), 159-188. Retrieved 2017-03-23 from: http://www.cenbank.gov.ng/OUT/PUBLICATIONS/EFR/RD/2002/EFRVOL39-4-3.PDF
OECD. (2005). OECD SME and Entrepreneurship Outlook 2005. Paris: OECD. Retrieved 2017-03-23 from: http://www.oecd.org/cfe/smes/oecdsmeandentrepreneurshipoutlook-2005edition.htm
Okpara, G. C. (2010). Microfinance banks and poverty alleviation in Nigeria. Journal of Sustainable development in Africa, 12(6), 177-191.
OldNaija. (2016). The Six Geopolitical Zones in Nigeria With Their States. Retrieved 2017-05-17 from: https://oldnaija.com/2016/03/17/the-six-geopolitical-zones-in-nigeria-with-their-states/
Olowa, O. W. (2012). Concept, Measurement and causes of poverty: Nigeria in perspective. American Journal of Economics, 2(1), 25-36. Retrieved 2017-04-27 from: http://article.sapub.org/10.5923.j.economics.20120201.04.html
Oxford Poverty and Human Development Initiative (2016). “Nigeria Country Briefing”, Multidimensional Poverty Index Data Bank. OPHI, University of Oxford.
Pande, R., Cole, S., Sivasankaran, A., Bastian, G., & Durlacher, K. (2012). Does poor people’s access to formal banking services raise their incomes?. London: EPPI-Centre, Social Science Research Unit, Institute of Education, University of London. Retrieved 2017-03-23 from: https://assets.publishing.service.gov.uk/media/57a08a5bed915d622c0006cb/Banking-access-2012Pande.pdf
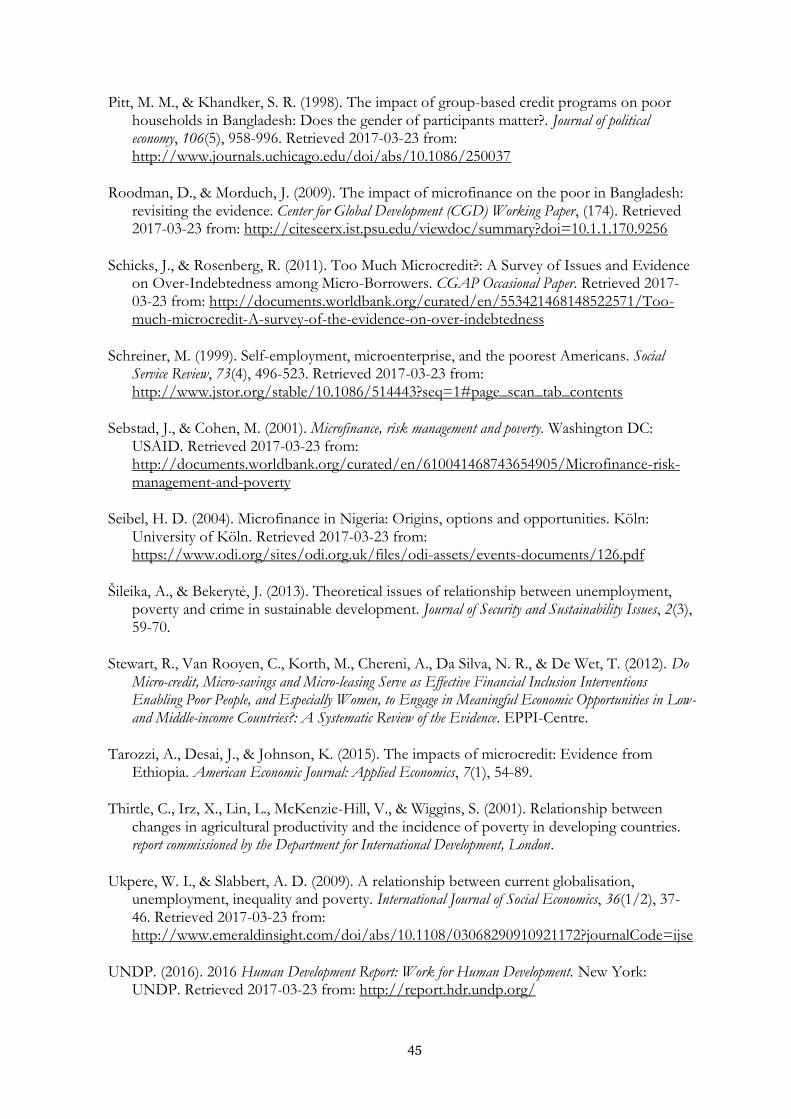
45
Pitt, M. M., & Khandker, S. R. (1998). The impact of group-based credit programs on poor households in Bangladesh: Does the gender of participants matter?. Journal of political economy, 106(5), 958-996. Retrieved 2017-03-23 from: http://www.journals.uchicago.edu/doi/abs/10.1086/250037
Roodman, D., & Morduch, J. (2009). The impact of microfinance on the poor in Bangladesh: revisiting the evidence. Center for Global Development (CGD) Working Paper, (174). Retrieved 2017-03-23 from: http://citeseerx.ist.psu.edu/viewdoc/summary?doi=10.1.1.170.9256
Schicks, J., & Rosenberg, R. (2011). Too Much Microcredit?: A Survey of Issues and Evidence on Over-Indebtedness among Micro-Borrowers. CGAP Occasional Paper. Retrieved 2017-03-23 from: http://documents.worldbank.org/curated/en/553421468148522571/Too-much-microcredit-A-survey-of-the-evidence-on-over-indebtedness
Schreiner, M. (1999). Self-employment, microenterprise, and the poorest Americans. Social Service Review, 73(4), 496-523. Retrieved 2017-03-23 from: http://www.jstor.org/stable/10.1086/514443?seq=1#page_scan_tab_contents
Sebstad, J., & Cohen, M. (2001). Microfinance, risk management and poverty. Washington DC: USAID. Retrieved 2017-03-23 from: http://documents.worldbank.org/curated/en/610041468743654905/Microfinance-risk-management-and-poverty
Seibel, H. D. (2004). Microfinance in Nigeria: Origins, options and opportunities. Köln: University of Köln. Retrieved 2017-03-23 from: https://www.odi.org/sites/odi.org.uk/files/odi-assets/events-documents/126.pdf
Šileika, A., & Bekerytė, J. (2013). Theoretical issues of relationship between unemployment, poverty and crime in sustainable development. Journal of Security and Sustainability Issues, 2(3), 59-70.
Stewart, R., Van Rooyen, C., Korth, M., Chereni, A., Da Silva, N. R., & De Wet, T. (2012). Do Micro-credit, Micro-savings and Micro-leasing Serve as Effective Financial Inclusion Interventions Enabling Poor People, and Especially Women, to Engage in Meaningful Economic Opportunities in Low-and Middle-income Countries?: A Systematic Review of the Evidence. EPPI-Centre.
Tarozzi, A., Desai, J., & Johnson, K. (2015). The impacts of microcredit: Evidence from Ethiopia. American Economic Journal: Applied Economics, 7(1), 54-89.
Thirtle, C., Irz, X., Lin, L., McKenzie-Hill, V., & Wiggins, S. (2001). Relationship between changes in agricultural productivity and the incidence of poverty in developing countries. report commissioned by the Department for International Development, London.
Ukpere, W. I., & Slabbert, A. D. (2009). A relationship between current globalisation, unemployment, inequality and poverty. International Journal of Social Economics, 36(1/2), 37-46. Retrieved 2017-03-23 from: http://www.emeraldinsight.com/doi/abs/10.1108/03068290910921172?journalCode=ijse
UNDP. (2016). 2016 Human Development Report: Work for Human Development. New York: UNDP. Retrieved 2017-03-23 from: http://report.hdr.undp.org/

46
UN. (2013). 2013: MDG Acceleration and Beyond 2015. United Nations. Retrieved 2017-03-23 from: http://www.un.org/millenniumgoals/bkgd.shtml
US Legal. (2016). Microentrepreneur Law and Legal Definition. Retrieved 2017-04-12 from: https://definitions.uslegal.com/m/microentrepreneur/
Woller, G. M., Dunford, C., & Woodworth, W. (1999). Where to microfinance. International Journal of Economic Development, 1(1), 29-64. Retrieved 2017-03-23 from: http://marriottschool.net/emp/WPW/pdf/class/Class_14-Gender_Equity_and_Microenterprise_Continued.pdf
World Bank. (2002). Nigeria - State and local governance in Nigeria. Washington, DC: World Bank. Retrieved 2017-05-13 from: http://documents.worldbank.org/curated/en/442501468780898611/Nigeria-State-and-local-governance-in-Nigeria
World Bank Group. (2016). From Oil to Cities: Nigeria’s Next Transformation. World Bank Group.
Zezza, A., & Tasciotti, L. (2010). Urban agriculture, poverty, and food security: empirical evidence from a sample of developing countries. Food policy, 35(4), 265-273. Retrieved 2017-03-23 from: http://www.sciencedirect.com.proxy.library.ju.se/science/article/pii/S0306919210000515
Zhuang, J., Gunatilake, H. M., Niimi, Y., Khan, M. E., Jiang, Y., Hasan, R., & Huang, B. (2009). Financial sector development, economic growth, and poverty reduction: a literature review. Retrived 2017-05-13 from: https://www.adb.org/sites/default/files/publication/28391/economics-wp173.pdf

47
Appendix
Appendix A Litterature Review Table
Author Year Country Outcomes Study
Adams & Von Pischke 1992
Debt is not an appropriate tool when trying to raise people out of poverty due to the risks of pulling the loan taker further into poverty.
Angelucci et al. 2015 Mexico
Results show correlation between access to microcredit and growth in businesses, but no effects on profits, and the growth in businesses seems to be growth in existing businesses rather than increase in number of businesses.
The impacts of microfinance at the community level in Mexico.
Aportela 1999 Mexico
An increase in number of savings institutions led to an increase in savings in low income households.
Ausburg et al. 2015 Bosnia
Evidence of increased self-employment and decreased wage work. No increase in overall household income.
Studied loan applicants who had been rejected by a microfinace instituton and offered a loan to a subset of the group.
Bae et al. 2012 US Access to finance has an impact on the poverty level and income equality.
Banerjee et al. 2015a
Bosnia, Mexico, Morocco, Ethiopia, Mongolia, India
In none of the six countries studied were there any significant increase in the household income, which suggests that microcredit might not have the characteristics of helping people out of poverty, but that does not rule out the possibility of microcredit giving people more opportunities when making choices.
Microcredit expansions

48
Banerjee et al. 2015b India
The demand for microloans is smaller than claimed. Monthly consumpition was used as an indicator for welfare and it did not increase with access to microfinance.
Beck 2007 Financial development helps the poorest.
Buckley 1997
Malawi, Kenya, Ghana
There is not much evidence suggesting the impact has been significant for the recipients in terms of higher or more modernized levels of operations, increase in income level or employment.
Microenterprise programmes
Claessens & Feijen 2007
The use of financial services reduce poverty as it increases overall income, reduces income equality, and smooths consumpition over time.
Coleman 1999 Thailand
Credit had no significant impact on many of the indicators including physical assets, savings, and expenditure on health care and education to name a few.
Compared borrowers of existing microfinance institutions to borrowers-in-waiting.
Copestake et al. 2005 Peru
The people most benefitted by microcredit had secondary or higher education, at least three years business experience and owned larger businesses.
Cotler & Woodruff 2008 Mexico
The microlending programme had a positive effect on sales and profits for the smallest retailers
Compared the sales and profits of small-scale retailers where one group had recieved microloans.
Crépon et al. 2015 Morocco
Access to microcredit led to a significant increase in investment in assets for entrepreneurial activities and to an increase in profit among household that had been identified as more likely to borrow based on characteristics.
Randomized evaluation of a microcredit programme.

49
Galor & Tsiddon 1996
In later stages of financial development, the wage difference between skilled and unskilled workers decrease.
Giné & Townsend 2004 Thailand
The increase in access to credit can be a reason for the high growth in GDP per capita, rapid poverty reduction, and decrease in income inequality in Thailand.
Idolor & Eiriki 2012 Nigeria
Microfinance institution indicators are significant determinants of the education index.
Used Microfinance institutions aggregate assets, deposit liabilities, and loans and advances as explanatory variable and performed OLS regressions.
Kaboski & Townsend 2012 Thailand
The microfinance programme increased overall credit. The results show a significant increase in consumption and income.
Evaluated the microfinance programme 'Million Baht Village Fund'.
Khandker 2005 Bangladesh
The access to microcredit reduce poverty but also continues to reduce poverty over time although at a diminishing rate. Not only the borrowers benefit from the microcredit but also the nonparticipants of the programmes through spillover effects within the local economy.
Access to microcredit
Levine 1997 Financial development increase average growth.
Levine 2007 Financial development increase average growth.
Morduch 1998 Bangladesh
The consumption levels in the households with access to microcredit are not notably higher than in the households in the control group. There was no significant difference in children’s school attendance between the two groups.
Access to microcredit

50
Okpara 2010 Nigeria
Prior to 2001, the poverty level in Nigeria continued to increase but at a decreasing rate as microfinance credit increased in the country. In the second phase, from 2001 and onward, the poverty index decreased as the microfinance credit increased.
Impact of microfinance on poverty using time series data
Pitt & Khandker 1998 Bangladesh
Use of credit has a small but significant impact on household expenditure, household assets, labour supply and children’s school attendance.
Access to microcredit
Roodman & Morduch 2009 Bangladesh
The consumption levels in the households with access to microcredit are not notably higher than in the households in the control group. There was no significant difference in children’s school attendance between the two groups.
Schicks & Rosenberg 2011
Highlight the downside of access to credit as they analyse the over-indebtness in microfinance.
Schreiner 1999 US
The main users of the programmes are not the poorest but the poor with the highest education, experience, skills, and assets.
Microenterprise programmes
Stewart et al. 2012
Malawi, Bosnia and Herze-govina, Peru, Kenya
Micro-savings can be a source of higer long-term income. Results differ depending on country.
Performed a systematic review of existing studies on access to financial services.
Tarozzi et al. 2015 Ethiopia
Three years into the trial the areas in which microfinance institutions had started operating, the percentage of households holding loans was 25 percent higher than in the control areas with no access to microfinance, and the most common place of investment was to fund production activities. There was no evidence of any improvement regarding the socioeconomic indicators concerning household welfare in the areas where microfinance institutions were present.
The effect of microfinance on several socioeconomic outcomes.

51
Woller et al. 1999
Microfinance institutions can be successful due to technincal innovations that decrease transaction costs and information asymmetry.
Zhuang et al. 2009 Financial development reduces poverty through economic growth.
Appendix B Geopolitical zones of Nigeria