Embed Size (px)
Citation preview
Microhabitat selection in the potentiallyendangered wolf spider Donacosa merlini(Araneae, Lycosidae): implications for spiderconservation
C. Fernandez-Montraveta and M. Cuadrado
Abstract: Habitat quality affects many components of animal fitness and animals are expected to be distributed in thespace accordingly. Mismatch between habitat preferences and fitness may relate to scale-dependent effects and trade-offsbetween costs and benefits of moving to high-quality habitats. We investigated the effects of habitat quality and habitat se-lection in Donacosa merlini Alderweireldt and Jocque, 1991, a burrowing wolf spider included in the Spanish InvertebratesRed Data Book. Particularly, we compared burrow size and density and analysed the relationship between burrow presenceand vegetation at two different scales. At a regional scale, we found strong differences in burrow size and density. Burrowdensity affected burrow aggregation, which was utmost under mean densities. At both spatial scales, burrows were foundat relatively clear (or low-covered) patches, as scrubs were lower and nearest vegetation was farther from burrows thanrandomly expected. Our results suggest habitat selection and effects of habitat quality on the life history of D. merlini. Inspite of the recent expansion of the species distribution area, our data support the need for suitable habitat managementprograms. Information about ecological requirements is paramount to correctly assess spider conservation status. This topichas received little attention in spite of the diversity and the relevance of spider ecological roles.
Resume : La qualite de l’habitat affecte plusieurs composantes de la valeur adaptative des animaux qui devraient se repar-tir dans l’espace en accord avec ces effets. La disparite entre les preferences d’habitat et la valeur adaptative des animauxpeut s’expliquer par les effets dependants de l’echelle spatiale, ainsi que par les compromis entre les couts et les avantagesd’un deplacement vers les habitats de haute qualite. Nous avons analyse les effets de la qualite de l’habitat et de la selec-tion d’habitat chez Donacosa merlini Alderweireld et Jocque, 1991, une araignee-loup qui habite des nids souterrains etqui figure dans le Livre Rouge des Invertebres d’Espagne. En particulier, nous avons compare la taille et la densite desnids, ainsi que la relation entre la presence des nids et la vegetation a deux echelles spatiales. A l’echelle regionale, il y ade fortes differences dans la taille et la densite des nids. La densite des nids affecte le regroupement des nids, qui est max-imal quand la densite est moyenne. Aux deux echelles spatiales, les nids se retrouvent dans les sites relativement ouverts(ou a couverture vegetale plus basse), parce que les broussailles sont plus basses et la vegetation la plus proche est pluseloignee des nids que ce que l’on pourrait attendre au hasard. Ces resultats laissent croire qu’il y a selection d’habitat etque la qualite de l’habitat a des effets sur l’histoire de la vie de D. merlini. Malgre la recente extension de l’aire de repar-tition de l’espece, nos resultats soulignent la necessite de programmes appropries de gestion de l’habitat. L’information surles besoins ecologiques des araignees est d’une importance capitale pour evaluer correctement leur statut de conservation.Ce sujet a recu peu d’attention malgre la diversite et la pertinence des roles ecologiques des araignees.
[Traduit par la Redaction]
Introduction
Habitat quality may have strong effects on life history inmost animal taxa, including spiders. For example, habitatquality affects age and size at maturity (Lubin et al. 1993;Ward and Lubin 1993; Sinsch et al. 2007), longevity, orpotential reproductive life span (Sinsch et al. 2007), which
may ultimately affect individual fitness and population size.Animals reproducing in rich habitats produce larger and (or)higher quality offspring than those reproducing in relativelypoor habitats (Ward and Lubin 1993; Lambrechts et al.2004), and population size increases accordingly (Arango etal. 2000; Beja et al. 2007). Knowledge about effects of hab-itat quality on animal life history or populations is henceparamount for adequately assessing threats to potentially en-dangered species and for developing suitable habitat man-agement programs.
Given the relationships between habitat quality and fit-ness, animals should preferentially choose suitable habitats.For example, the desert widow spider Latrodectus revivensisShulov, 1948 (Theridiidae) relocate their webs as they grow,which improves spider body condition and reproductive suc-cess (Lubin et al. 1993). However, habitat preferences donot always match fitness consequences (Lubin et al. 1993).
Received 11 March 2008. Accepted 4 September 2008.Published on the NRC Research Press Web site at cjz.nrc.ca on31 October 2008.
C. Fernandez-Montraveta.1 Departamento de PsicologıaBiologica y de la Salud, Universidad Autonoma de Madrid,28049 Madrid, Spain.M. Cuadrado. ZooBotanico Jerez, Taxdirt s/n, E-11404 Jerez dela Frontera, Cadiz, Spain.
1Corresponding author (e-mail: [email protected]).
1280
Can. J. Zool. 86: 1280–1288 (2008) doi:10.1139/Z08-113 # 2008 NRC Canada
This disparity may be attributed to different reasons. First,most studies only consider a single spatial scale, but inheterogeneous landscapes habitat effects on individual fit-ness do not apply similarly at different spatial scales (Chal-foun and Martin 2007). Second, moving may be costly(Lubin et al. 1993), and there may be trade-offs betweencosts and benefits of choosing particular habitats. For exam-ple, high vegetation complexity is associated with reducedpredation risk but also with a reduced foraging efficiencyfor ground-dwelling spiders (Blamires et al. 2007; Rypstraet al. 2007). Finally, dispersal ability may limit individualmobility and increase species susceptibility to habitat loss(Hedenas and Ericson 2008). For example, habitat qualityaffects migration rates in the wolf spider Hogna helluo(Walckenaer, 1837) (Araneae, Lycosidae) but not in Par-dosa milvina (Hentz, 1844) (Buddle and Rypstra 2003).
Although they are a megadiverse animal group that makesa huge contribution to animal biodiversity (the estimatednumber of species is nearly 40 000; cf. Platnick 2007), spi-ders are generally given very little attention in conservationprograms, and the number of spider species included ininternational endangered species lists is remarkably low —only 22 spider species are included in the CITES database(http://www.cites.org; accessed 10 March 2008), 15 addi-tional species are included in the International Union forConservation of Nature and Natural Resources (IUCN) red-list (http://www.redlist.org; accessed 10 March 2008), and 1additional species (Macrothele calpeiana (Walckenaer,1805) (Hexathelidae)) is protected under the Bern Conven-tion (Appendix 2, http://www.coe.int; accessed 10 March2008). Even for these few examples, ecological informationis scarce or uncertain. This situation is partly explained byspider biological characteristics, including the high repro-ductive potential and dispersal mechanisms of most spidertaxa (Foelix 1996).
Donacosa merlini Alderweireldt and Jocque, 1991 is amedium-sized burrowing wolf spider (Araneae, Lycosidae)that is known only in coastal areas with slightly compactedsandy soils and restricted to the pine woodland habitats ofDonana (Huelva, southwest Spain; Alderweireldt andJocque 1991a, 1991b). The species has a singular taxonomi-cal position within the family Lycosidae, because it is theonly known World representative of the genus (see Platnick2007). In contrast to the closely related wolf spider speciesliving in the area (i.e., Lycosa tarantula (L., 1758) andHogna radiata (Latreille, 1817); for details on the reproduc-tive cycle of L. tarantula see Fernandez-Montraveta andCuadrado 2003), D. merlini shows an unusual life-historypattern, with autumn maturation and winter reproduction(Alderweireldt and Jocque 1991b; Fernandez-Montraveta etal. 2004). The species also shows a reversed pattern of sex-ual size dimorphism, with males slightly larger than females(Fernandez-Montraveta et al. 2004). The restricted geo-graphic range of the species, together with regression ofsuitable habitat in the area, was claimed as an important rea-son for the inclusion of the species in the Bern Convention(Alderweireldt and Jocque 1991b). For the above reasons,the species has recently been included in the Spanish Inver-tebrates Red Data Book (Verdu and Galante 2005) on thebasis of a reduced number of known localities and the in-creasing human impact on its natural habitat (Barrientos
2005). The geographic range of the species, however, hasrecently been broadened to include new and distant(>100 km) populations (Sanchez 2004). The species habitathas also been enlarged to include grassland, scrubby, anddune habitats (Fernandez-Montraveta and Cuadrado 2007).These new findings bring into question the need for any spe-cial protection status for this species. Donacosa merlini is,however, an obligate burrower, and available informationsuggests low dispersal and strong site attachment (shown bythe correlation between spider and burrow size;C. Fernandez-Montraveta and M. Cuadrado, unpublisheddata), which might increase the species susceptibility to lossof suitable habitats (Marshall 1995b, 1997; Halloran et al.2000; Carrel 2003).
To further analyse the susceptibility of D. merlini to lossof habitat quality, we investigated habitat selection and theeffects of habitat quality on the spider life history (age andtime at maturity) and population size at two spatial scales.To assess these parameters, we compared burrow densityand size between two sites, 3 km apart, in the Donana area(regional scale) and within sites (local scale, <100 m). Toinvestigate habitat selection, we first analysed burrow spatialdistribution within each site and the relationship betweenburrow density and aggregation. Second, we compared thevegetation structure between burrow locations and randomlyselected points within the same plot. Specifically, we meas-ured the identity, orientation, height, and distance to thenearest vegetation (either scrub or tree) and the percentageof vegetation intercepted.
Materials and methods
Study speciesBurrows of D. merlini are easy to recognise in the field
because of their external appearance, which includes a smallturret built up with silk and vegetation debris at their upperpart (Alderweireldt and Jocque 1991a). The species’ post-embryonic development is relatively long, taking almost2 years following spiderling dispersal, which occurs shortlyafter hatching. Fieldwork was then performed in November2001 during daylight (between 1000 and 1700, local time).At this time of the year, virtually all burrows are detected,as maturation has already occurred and spider activity hasreached its maximum, indicated by the open burrows. Thisreduces sampling error resulting from burrow closing.
Study sitesFieldwork was performed at two sites (hereafter site A
and site B) within the Parque Natural de Donana (Huelva,southwest Spain; Fig. 1). Both sites were close to one ofthe locations where the species was originally found (Alder-weireldt and Jocque 1991b). Both sites (measuring 6000 m2
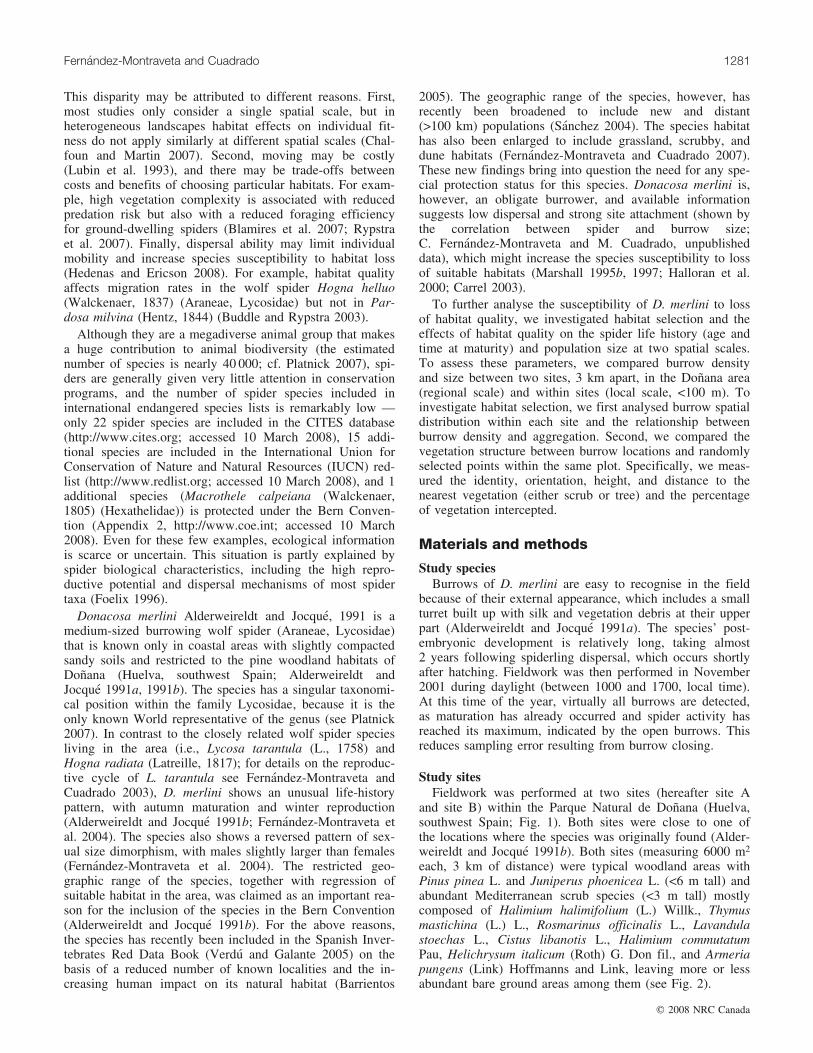
each, 3 km of distance) were typical woodland areas withPinus pinea L. and Juniperus phoenicea L. (<6 m tall) andabundant Mediterranean scrub species (<3 m tall) mostlycomposed of Halimium halimifolium (L.) Willk., Thymusmastichina (L.) L., Rosmarinus officinalis L., Lavandulastoechas L., Cistus libanotis L., Halimium commutatumPau, Helichrysum italicum (Roth) G. Don fil., and Armeriapungens (Link) Hoffmanns and Link, leaving more or lessabundant bare ground areas among them (see Fig. 2).
Fernandez-Montraveta and Cuadrado 1281
# 2008 NRC Canada
At each study site, we selected four different 25 m �25 m square plots. The perimeter of each plot was markedby poles (5 m apart from each other). To facilitate burrowlocation, we also used flags to mark 5 m wide corridorswithin each plot to delimit a 5 m � 5 m grid within eachplot (Fig. 3). The southwest corner of each plot was consid-ered its origin and was used as a reference point. Minimumdistance between plots was 30 m to ensure no disturbanceduring fieldwork.
Burrow density and spatial distributionWe searched for burrows of D. merlini at each 5 m � 5 m
square within each plot. All burrows found were plotted ona scaled map of each plot, and the x and y coordinates weremeasured from the reference corner, which was always thesouthwest corner. Burrows were individually numbered and
tagged by firmly attaching a plastic card to the soil near theburrow entrance to facilitate fieldwork.
At a regional scale, burrow density was compared be-tween sites by taking the 25 m � 25 m plots as sample units(sites A and B, 4 plots per site). Burrow density was alsocompared at a local scale (among plots), using the 5 m �5 m squares as sample units. The spatial distribution of theburrows was analysed within sites, and the 25 m � 25 mplots were used as the sample units.
Burrow sizeBurrow size was defined by both burrow depth and turret
size. Measurements were taken in a total of 10 randomlyselected burrows per plot. We measured the following varia-bles that define turret size: (i) turret height (i.e., maximumheight of the turret from the ground); (ii) external diameter(i.e., measured from the outer side of the turret); and(iii) internal diameter (i.e., measured from the inner side ofthe turret). In both cases, maximum diameters were meas-ured at the upper part of the turret. From these data, we cal-culated (iv) the turret volume by considering each turret as acylinder (turret height � perimeter). Finally, (v) burrow
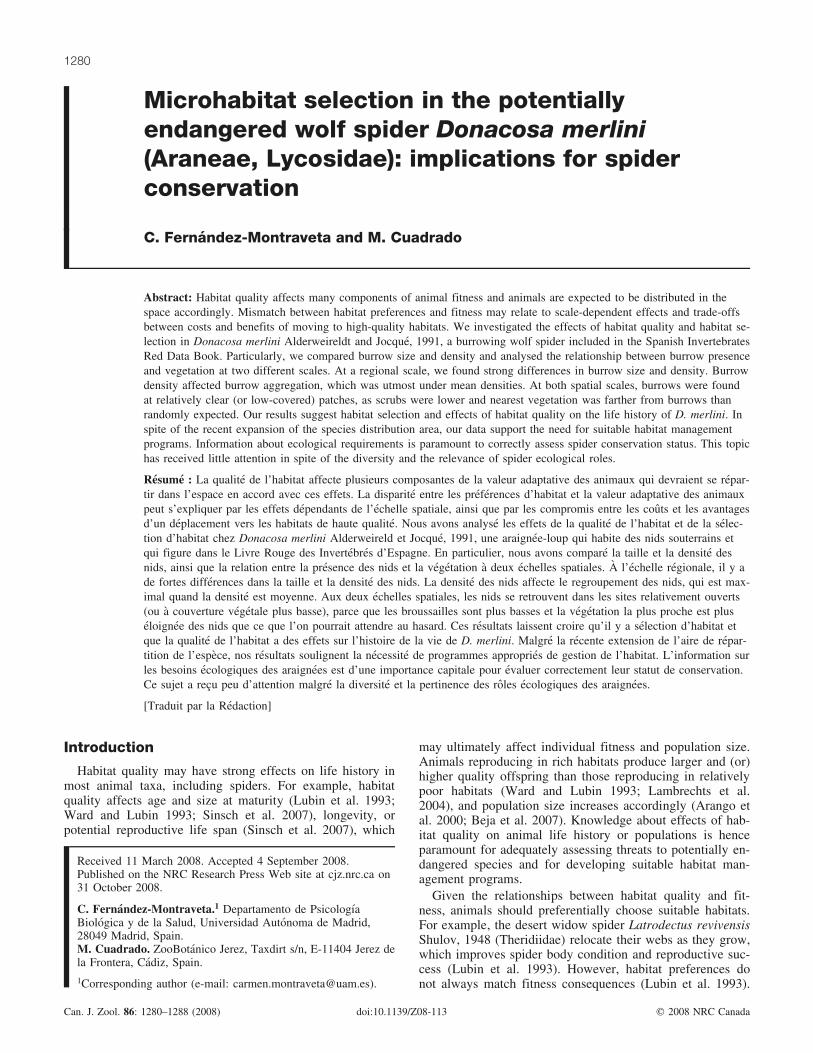
Fig. 1. Map of the Iberian Peninsula and Baleares Islands, with theinset enlarged in the bottom panel to show the location of the studysites (black squares in both panels).
Fig. 2. Overview of a typical habitat at Donana area where burrowsof Donacosa merlini were found and where the fieldwork was con-ducted.
1282 Can. J. Zool. Vol. 86, 2008
# 2008 NRC Canada
depth was measured as the distance from the base of the tur-ret to the bottom of the burrow. All variables were measuredin millimetres (to the nearest 0.05 mm) using a Mitutoyocalliper.
Microhabitat preferencesWe studied whether D. merlini showed microhabitat pref-
erences for locating their burrows by comparing environ-mental variables at burrow locations (see above) with thosemeasured at a similar number of randomly selected pointswithin each plot. We measured several environmental varia-bles. (i) Percentage of vegetation intercepted: measured asthe percentage of times that vegetation was interceptedaround the burrow. To measure intercepts, we used a 1 mlong string attached to a pole, centred either at the burrowor the random point. The string was located at 3 differentheights (0.25, 0.5, and 1 m above the ground). Furthermore,we measured vegetation intercepted at 5 different distances(0.2, 0.4, 0.6, 0.8, and 1 m) from the pole. The procedurewas repeated at 8 geographical orientations (north, north-west, west, southwest, south, southeast, east, and northeast).Hence, percentage of vegetation intercepted ranged from 0%(bare ground, 0 intercepted) to 100% (vegetation was inter-cepted on 120 points). (ii) Distance to the vegetation:
minimum distance to the nearest scrub. (iii) Scrub orienta-tion: direction of the nearest scrub (<3 m tall). (iv) Scrubheight: maximum height of the nearest scrub (<3 m tall).(v) Tree orientation: orientation of the nearest tree (trunkdiameter >0.15 m). (vi) Tree height: height of the nearesttree (trunk diameter >0.15 m). (vii) Distance to the tree:minimum distance to the nearest tree. Finally, we also notedthe species of the closest scrub and tree.
Statistical analysesData are presented as mean ± 1 SE. Normality (Shapiro–
Wilk test) and homocedasticity (Levene test) were checkedprior to parametric statistical testing. Data were optimallytransformed (Box–Cox transformation y’ = (yl – 1)/l) to fitthe requirements of parametric tests (Sokal and Rohlf1995). Orientations were always transformed into linearmeasurements (radians). Equivalent nonparametric testswere used when the data did not fit the requirements ofparametric tests even after transformations. Statistica version7.0 (StatSoft Inc., Tulsa, Oklahoma) was used for the statis-tical tests.
We analysed the density of burrows at a regional scale bycomparing the mean number of burrows per plot betweensites using Mann–Whitney U tests. Density of burrows at alocal scale was analysed by comparing the mean number ofburrows among plots within the same site using Kruskal–Wallis tests and pairwise tests with Bonferroni corrections.Burrow size was compared both between sites (fixed) andamong plots (random) using a mixed nested design (generallinear model). In the event that plots did not show any sig-nificant effect in the whole model (p > 0.1), data from allplots were pooled to increase the sample size and the powerof the test. The spatial distribution of burrows was analysedwithin sites, using plots as the sample units, by measuringthe Euclidean distance from each burrow to its nearestneighbour. We tested for the pattern of spacing between bur-rows by the ratio R (observed mean distance / expectedmean distance to the nearest burrow) (Clark and Evans1954). We calculated the expected mean distance as 1=
ffiffiffi�
p,
where r is the number of burrows per square metre in eachplot. The value of R is expected to be close to 1 if burrowsare randomly distributed, whereas the value of R is close to0 if the burrows are aggregated. The significance of R wastested by the c statistics (Clark and Evans 1954). Addition-ally, we tested for the relationship between burrow aggrega-tion (R, standardized value) and density (r). To include boththe linear and the quadratic relationships between these twoparameters, we used a general linear model fitted to a poly-nomial function (r + r2).
To analyse microhabitat preferences, we considered loca-tion (yes = burrow; no = random) as a binomial responsevariable (yes = 1; no = 0) and tested for its relationshipwith the environmental variables. Because this relationshipmay be not direct but rather indirect, we used a multiple lo-gistic regression (logit link, backward-stepwise procedure,threshold level to remove a variable was set at p = 0.05) toidentify the best environmental predictors of burrow pres-ence while controlling for other environmental variables.The significance of the individual variables was estimatedby the log likelihood (type III hypothesis testing) againstthe c2 distribution. The environmental parameters included
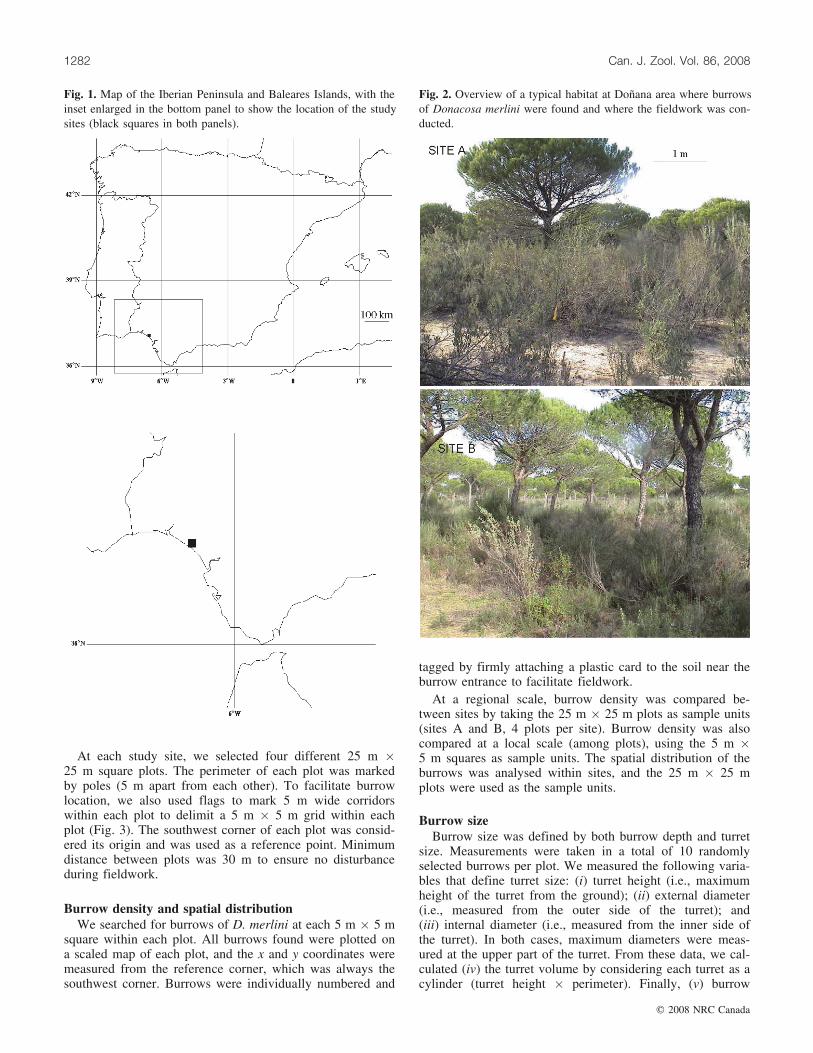
Fig. 3. Spatial distribution of burrows of Donacosa merlini found ateach plot (numbered from plots 1 to 4) at two study sites (sites Aand B). Each dot represents a burrow found during fieldwork.
Fernandez-Montraveta and Cuadrado 1283
# 2008 NRC Canada
in the initial model were selected by previously assessing in-dividual variables independently from each other (univariatetests). Only environmental variables significantly explainingburrow presence (p < 0.05) were included in the initialmodel. Because the multiple logistic regression is based onthe assumption of a lack of correlation among the independ-ent variables, we also tested for colinearity between environ-mental predictors by calculating all pairwise correlations(Spearman’s coefficient ranks of correlation) between indi-vidual variables. Highly correlated environmental variables(r > 0.7; Fielding and Haworth 1995) were included in dif-ferent models, among which we chose the model minimiz-ing the Akaike’s information criterion. Finally, we testedfor preferences in burrow location based on the identity ofthe nearest scrub by comparing the likelihood of scrub-typepresence between burrow and random locations using c2
tests.
Results
Burrow densityDensity of burrows significantly varied at a regional scale
(Table 1). The number of burrows was up to 10 times higherin site A than in site B (one-tailed Mann–Whitney U test,p = 0.01). Given these extreme differences, data on numberof burrows per plot were analysed separately for both sites.Overall, mean density of burrows per 5 m � 5 m square wasrelatively small (0.9 ± 1.9, range = 0–10, N = 200). Densitytended to differ among plots in site A (two-tailed Kruskal–Wallis test, H3 = 6.75, p = 0.08), but not in site B (H1 =1.34, p = 0.24; data from plots 3 and 4 were excluded be-cause there was no variation in burrow number, see Table 1).We conducted additional pairwise tests (Bonferroni cor-rected) to compare individual plots in site A. Plot 3 showeda significantly lower burrow density compared with plot 2(Mann–Whitney U test, p = 0.005), but we did not find anysignificant difference among the other pairs of plots (Mann–Whitney U test, all p > 0.1; see Table 1).
Burrow sizeBecause density of burrows differed between sites and at
least between a pair of plots within site A, we included bothplot and site as factors in the initial analyses. Turret size dif-fered between the two sites in some of the measured param-eters. However, none of the turret size measurementsdiffered among plots (all p > 0.1; see Table 2), hence datafrom plots were pooled within each site. Turret height(F[1,53] = 4.6, p = 0.04) and internal diameter (F[1,53] = 7.3,p = 0.009) were significantly higher in site B than in site A.In contrast, neither the turret external diameter (F[1,53] = 0.6,p = 0.4) nor the burrow depth (F[1,53] = 0.4, p = 0.5) and theturret volume (F[1,53] = 0.007, p = 0.9) differed significantlybetween the two sites.
Burrow spatial distributionBecause density of burrows differed between the two sites
and at least between a pair of plots within site A, the spatialdistribution of burrows was analysed separately for bothsites and plots (site A). The analysis of the distance to thenearest neighbouring burrow suggests a clumped distributionof burrows at both sites (Table 2, Fig. 3). R values werealways lower than 1. Moreover, in site A (the area showingthe higher burrow density, see above), the R value reachedstatistical significance except for plot 3 (R = 1.05, p >0.05), which also showed the lowest burrow density (see Ta-ble 2).
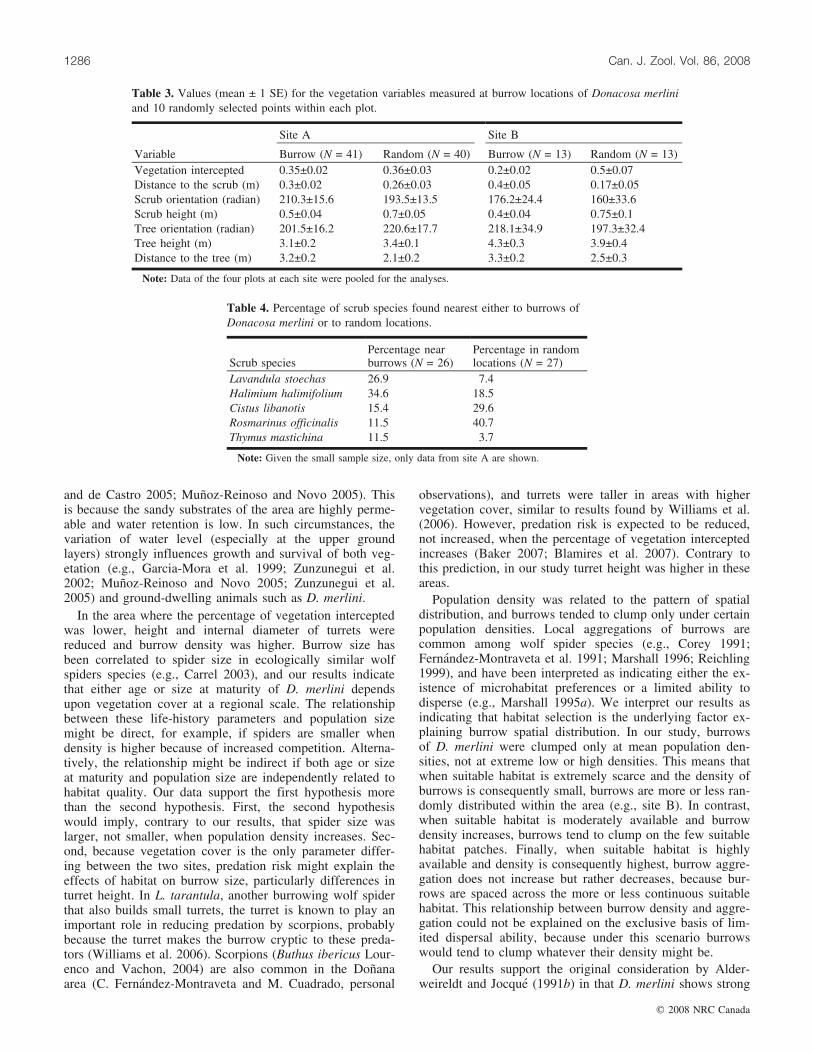
The relationship between burrow aggregation and densitywas not linear, as the linear density parameter (r) was notsignificantly related to burrow aggregation (R2 = 0.23,F[1,2] = 0.61 p = 0.51). However, the quadratic term was sig-nificant (R2 = 0.95, F[1,2] = 38.2 p = 0.02; Fig. 4), given thepositive relationship between burrow aggregation and squaredensity (b = 0.97).
Microhabitat preferencesGiven the lack of significant differences among plots in
burrow size (see above), data from all plots within each site
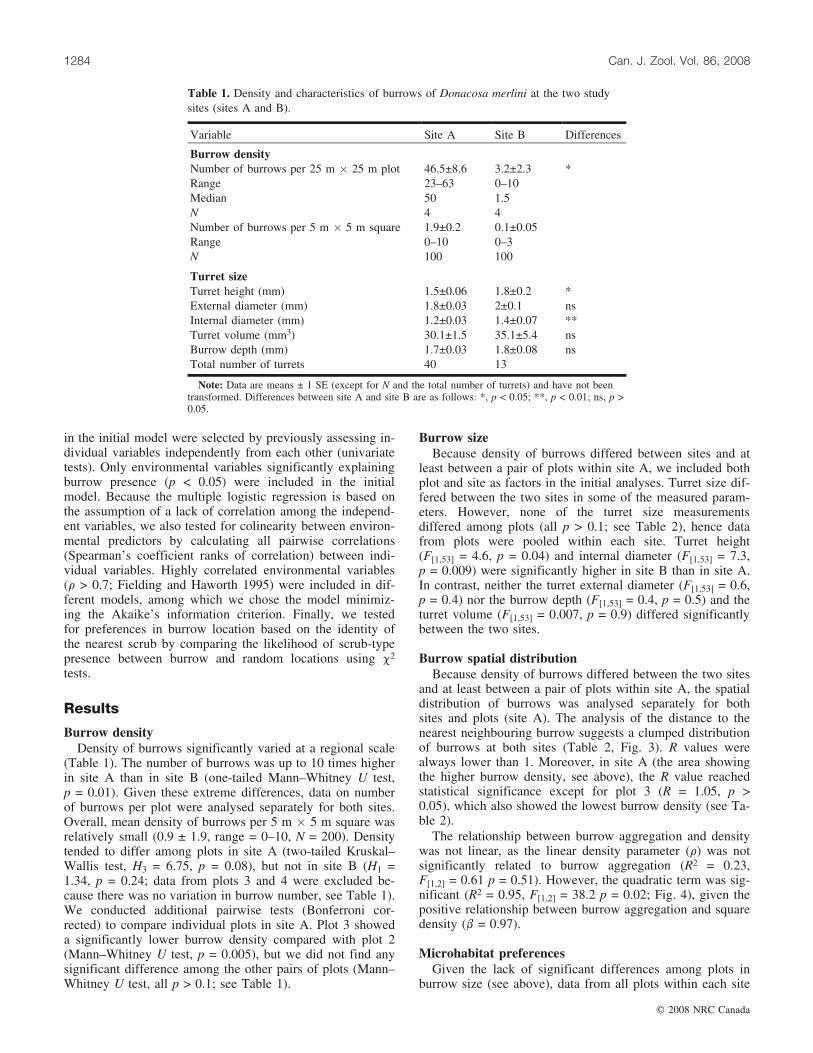
Table 1. Density and characteristics of burrows of Donacosa merlini at the two studysites (sites A and B).
Variable Site A Site B Differences
Burrow densityNumber of burrows per 25 m � 25 m plot 46.5±8.6 3.2±2.3 *Range 23–63 0–10Median 50 1.5N 4 4Number of burrows per 5 m � 5 m square 1.9±0.2 0.1±0.05Range 0–10 0–3N 100 100
Turret sizeTurret height (mm) 1.5±0.06 1.8±0.2 *External diameter (mm) 1.8±0.03 2±0.1 nsInternal diameter (mm) 1.2±0.03 1.4±0.07 **Turret volume (mm3) 30.1±1.5 35.1±5.4 nsBurrow depth (mm) 1.7±0.03 1.8±0.08 nsTotal number of turrets 40 13 .
Note: Data are means ± 1 SE (except for N and the total number of turrets) and have not beentransformed. Differences between site A and site B are as follows: *, p < 0.05; **, p < 0.01; ns, p >0.05.
1284 Can. J. Zool. Vol. 86, 2008
# 2008 NRC Canada
were pooled. Given significant differences in turret size be-tween sites, the site was included as a categorical factor inunivariate tests. In general, D. merlini selected clear andlow-covered vegetation areas (Table 3). Indeed, percentageof vegetation intercepted was reduced (�2
½1� = 8.9, p =0.002), distance to the nearest vegetation was higher (scrub:�2½1� = 11.2, p = 0.0007; tree: �2
½1� = 11.7, p = 0.0006), andvegetation was shorter (�2
½1� = 13.6, p = 0.002) in burrow lo-cations compared with random places. The other vegetationvariables did not differ between random and burrow loca-tions (Table 3). Site had no significant effect; there wasalso no significant interaction between site and any environ-mental parameter (all p > 0.05) except for the percentage ofvegetation intercepted. The two sites significantly differed inthe percentage of vegetation intercepted, which was higherin site B (�2
½1� = 7.8, p = 0.004). The percentage of vegeta-tion intercepted � site interaction was also significant(�2½1� = 8.4 p = 0.004). Neither scrub or tree orientation nor
tree height were significant predictors of burrow presence(all p > 0.1).
Given the significant effects of site and percentage ofvegetation intercepted � site interaction, we ran separate re-gression models for both sites. As sample sizes were small,
only data from site A could be properly analysed. The fourenvironmental variables individually contributing to explainburrow presence (distance to the nearest scrub and tree,height of the nearest scrub, and total cover) showed littlecorrelation between them (all r < 0.4) and were all includedin the initial logistic model. The final model was highly sig-nificant (�2
½3� = 18.4, p = 0.0004), and only excluded the per-centage of vegetation intercepted (�2
½1� = 1.5, p = 0.22).Distance to the vegetation (�2
½1� = 3.9, p = 0.05), distance tothe nearest tree (�2
½1� = 8.7, p = 0.003), and scrub height(�2½1� = 5. 2, p = 0.02) remained significant predictors of bur-
row presence while statistically controlling for the effect ofthe other environmental variables.
Burrows were also nonrandomly located relative to thespecies identity of the nearest scrub. The comparison of thenearest scrub species between burrows and randomly se-lected points showed that burrows were more likely to befound near certain scrub species (�2
½4� = 18.4, p < 0.001; Ta-ble 4). Particularly, burrows were more likely to be foundrelatively far from R. officinalis scrubs (�2
½1� = 59.1, p <0.001).
DiscussionResults summarized in this paper indicate that both at re-
gional (between habitats) and local (within habitats) scales,burrows of D. merlini do not distribute randomly in the hab-itat. Moreover, habitat (i.e., vegetation) characteristics affectspider population size and life history, and these effects varydepending on the spatial scale considered. At a regionalscale, we found noticeable differences in burrow densityand size only related to the percentage of vegetation inter-cepted. At a local scale, habitat did not affect burrow size.Moreover, burrow presence was independent of vegetationintercepted, but burrows were preferentially located in low-covered patches, away from tall vegetation, and especiallyfrom certain scrub species such as R. officinalis, which is arelatively highly dense scrub class.
The relationship between vegetation structure and popula-tions of D. merlini might indicate that water availabilityaffects this singular spider species. In the Donana area,water availability is known to influence the vegetation com-position and distribution at both local and regional scales(Allier et al. 1974; Garcıa-Novo et al. 1977; Munoz-Reinoso
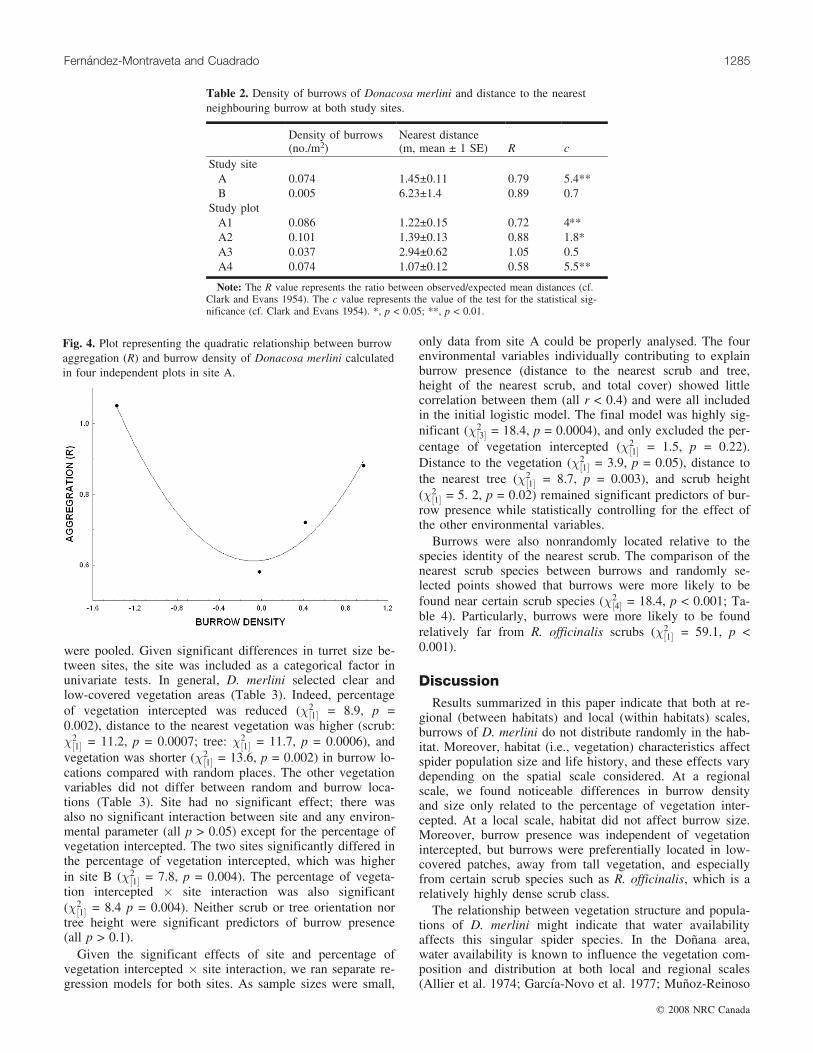
Table 2. Density of burrows of Donacosa merlini and distance to the nearestneighbouring burrow at both study sites.
Density of burrows(no./m2)
Nearest distance(m, mean ± 1 SE) R c
Study siteA 0.074 1.45±0.11 0.79 5.4**B 0.005 6.23±1.4 0.89 0.7
Study plotA1 0.086 1.22±0.15 0.72 4.**A2 0.101 1.39±0.13 0.88 1.8*A3 0.037 2.94±0.62 1.05 0.5A4 0.074 1.07±0.12 0.58 5.5**
Note: The R value represents the ratio between observed/expected mean distances (cf.Clark and Evans 1954). The c value represents the value of the test for the statistical sig-nificance (cf. Clark and Evans 1954). *, p < 0.05; **, p < 0.01.
Fig. 4. Plot representing the quadratic relationship between burrowaggregation (R) and burrow density of Donacosa merlini calculatedin four independent plots in site A.
Fernandez-Montraveta and Cuadrado 1285
# 2008 NRC Canada
and de Castro 2005; Munoz-Reinoso and Novo 2005). Thisis because the sandy substrates of the area are highly perme-able and water retention is low. In such circumstances, thevariation of water level (especially at the upper groundlayers) strongly influences growth and survival of both veg-etation (e.g., Garcia-Mora et al. 1999; Zunzunegui et al.2002; Munoz-Reinoso and Novo 2005; Zunzunegui et al.2005) and ground-dwelling animals such as D. merlini.
In the area where the percentage of vegetation interceptedwas lower, height and internal diameter of turrets werereduced and burrow density was higher. Burrow size hasbeen correlated to spider size in ecologically similar wolfspiders species (e.g., Carrel 2003), and our results indicatethat either age or size at maturity of D. merlini dependsupon vegetation cover at a regional scale. The relationshipbetween these life-history parameters and population sizemight be direct, for example, if spiders are smaller whendensity is higher because of increased competition. Alterna-tively, the relationship might be indirect if both age or sizeat maturity and population size are independently related tohabitat quality. Our data support the first hypothesis morethan the second hypothesis. First, the second hypothesiswould imply, contrary to our results, that spider size waslarger, not smaller, when population density increases. Sec-ond, because vegetation cover is the only parameter differ-ing between the two sites, predation risk might explain theeffects of habitat on burrow size, particularly differences inturret height. In L. tarantula, another burrowing wolf spiderthat also builds small turrets, the turret is known to play animportant role in reducing predation by scorpions, probablybecause the turret makes the burrow cryptic to these preda-tors (Williams et al. 2006). Scorpions (Buthus ibericus Lour-enco and Vachon, 2004) are also common in the Donanaarea (C. Fernandez-Montraveta and M. Cuadrado, personal
observations), and turrets were taller in areas with highervegetation cover, similar to results found by Williams et al.(2006). However, predation risk is expected to be reduced,not increased, when the percentage of vegetation interceptedincreases (Baker 2007; Blamires et al. 2007). Contrary tothis prediction, in our study turret height was higher in theseareas.
Population density was related to the pattern of spatialdistribution, and burrows tended to clump only under certainpopulation densities. Local aggregations of burrows arecommon among wolf spider species (e.g., Corey 1991;Fernandez-Montraveta et al. 1991; Marshall 1996; Reichling1999), and have been interpreted as indicating either the ex-istence of microhabitat preferences or a limited ability todisperse (e.g., Marshall 1995a). We interpret our results asindicating that habitat selection is the underlying factor ex-plaining burrow spatial distribution. In our study, burrowsof D. merlini were clumped only at mean population den-sities, not at extreme low or high densities. This means thatwhen suitable habitat is extremely scarce and the density ofburrows is consequently small, burrows are more or less ran-domly distributed within the area (e.g., site B). In contrast,when suitable habitat is moderately available and burrowdensity increases, burrows tend to clump on the few suitablehabitat patches. Finally, when suitable habitat is highlyavailable and density is consequently highest, burrow aggre-gation does not increase but rather decreases, because bur-rows are spaced across the more or less continuous suitablehabitat. This relationship between burrow density and aggre-gation could not be explained on the exclusive basis of lim-ited dispersal ability, because under this scenario burrowswould tend to clump whatever their density might be.
Our results support the original consideration by Alder-weireldt and Jocque (1991b) in that D. merlini shows strong
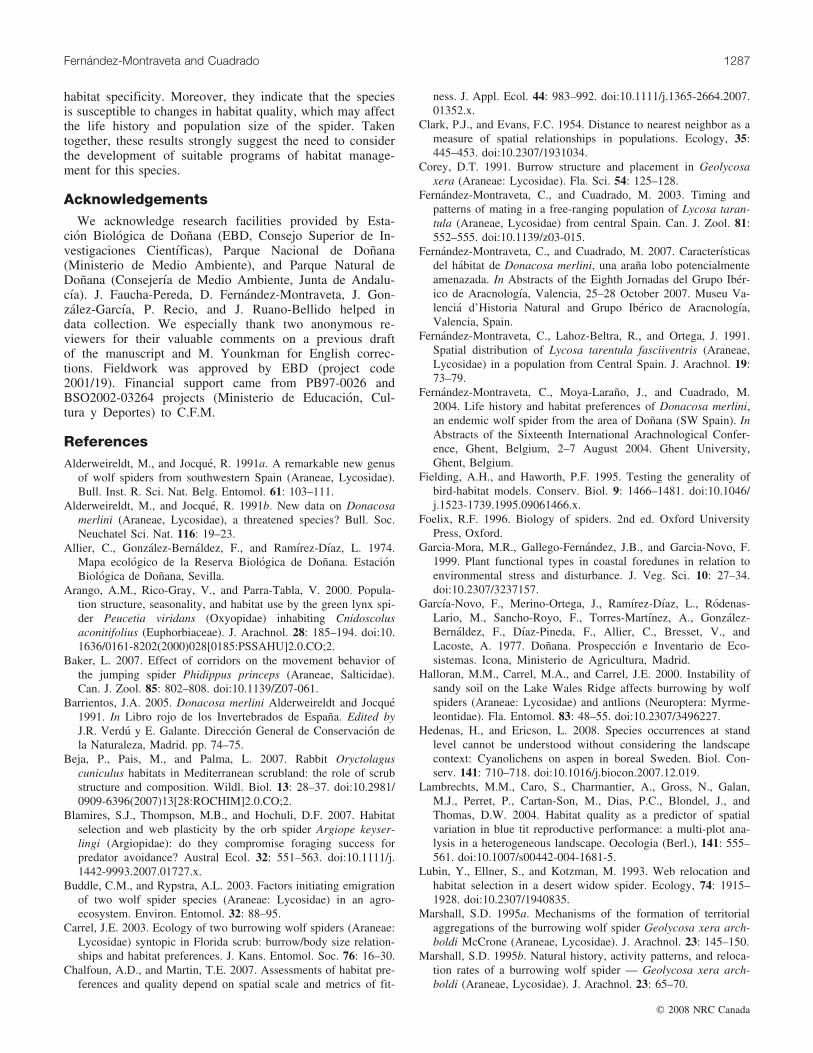
Table 3. Values (mean ± 1 SE) for the vegetation variables measured at burrow locations of Donacosa merliniand 10 randomly selected points within each plot.
Site A Site B
Variable Burrow (N = 41) Random (N = 40) Burrow (N = 13) Random (N = 13)Vegetation intercepted 0.35±0.02 0.36±0.03 0.2±0.02 0.5±0.07Distance to the scrub (m) 0.3±0.02 0.26±0.03 0.4±0.05 0.17±0.05Scrub orientation (radian) 210.3±15.6 193.5±13.5 176.2±24.4 160±33.6Scrub height (m) 0.5±0.04 0.7±0.05 0.4±0.04 0.75±0.1Tree orientation (radian) 201.5±16.2 220.6±17.7 218.1±34.9 197.3±32.4Tree height (m) 3.1±0.2 3.4±0.1 4.3±0.3 3.9±0.4Distance to the tree (m) 3.2±0.2 2.1±0.2 3.3±0.2 2.5±0.3
Note: Data of the four plots at each site were pooled for the analyses.
Table 4. Percentage of scrub species found nearest either to burrows ofDonacosa merlini or to random locations.
Scrub speciesPercentage nearburrows (N = 26)
Percentage in randomlocations (N = 27)
Lavandula stoechas 26.9 7.4Halimium halimifolium 34.6 18.5Cistus libanotis 15.4 29.6Rosmarinus officinalis 11.5 40.7Thymus mastichina 11.5 3.7
Note: Given the small sample size, only data from site A are shown.
1286 Can. J. Zool. Vol. 86, 2008
# 2008 NRC Canada
habitat specificity. Moreover, they indicate that the speciesis susceptible to changes in habitat quality, which may affectthe life history and population size of the spider. Takentogether, these results strongly suggest the need to considerthe development of suitable programs of habitat manage-ment for this species.
AcknowledgementsWe acknowledge research facilities provided by Esta-
cion Biologica de Donana (EBD, Consejo Superior de In-vestigaciones Cientıficas), Parque Nacional de Donana(Ministerio de Medio Ambiente), and Parque Natural deDonana (Consejerıa de Medio Ambiente, Junta de Andalu-cıa). J. Faucha-Pereda, D. Fernandez-Montraveta, J. Gon-zalez-Garcıa, P. Recio, and J. Ruano-Bellido helped indata collection. We especially thank two anonymous re-viewers for their valuable comments on a previous draftof the manuscript and M. Younkman for English correc-tions. Fieldwork was approved by EBD (project code2001/19). Financial support came from PB97-0026 andBSO2002-03264 projects (Ministerio de Educacion, Cul-tura y Deportes) to C.F.M.
ReferencesAlderweireldt, M., and Jocque, R. 1991a. A remarkable new genus
of wolf spiders from southwestern Spain (Araneae, Lycosidae).Bull. Inst. R. Sci. Nat. Belg. Entomol. 61: 103–111.
Alderweireldt, M., and Jocque, R. 1991b. New data on Donacosamerlini (Araneae, Lycosidae), a threatened species? Bull. Soc.Neuchatel Sci. Nat. 116: 19–23.
Allier, C., Gonzalez-Bernaldez, F., and Ramırez-Dıaz, L. 1974.Mapa ecologico de la Reserva Biologica de Donana. EstacionBiologica de Donana, Sevilla.
Arango, A.M., Rico-Gray, V., and Parra-Tabla, V. 2000. Popula-tion structure, seasonality, and habitat use by the green lynx spi-der Peucetia viridans (Oxyopidae) inhabiting Cnidoscolusaconitifolius (Euphorbiaceae). J. Arachnol. 28: 185–194. doi:10.1636/0161-8202(2000)028[0185:PSSAHU]2.0.CO;2.
Baker, L. 2007. Effect of corridors on the movement behavior ofthe jumping spider Phidippus princeps (Araneae, Salticidae).Can. J. Zool. 85: 802–808. doi:10.1139/Z07-061.
Barrientos, J.A. 2005. Donacosa merlini Alderweireldt and Jocque1991. In Libro rojo de los Invertebrados de Espana. Edited byJ.R. Verdu y E. Galante. Direccion General de Conservacion dela Naturaleza, Madrid. pp. 74–75.
Beja, P., Pais, M., and Palma, L. 2007. Rabbit Oryctolaguscuniculus habitats in Mediterranean scrubland: the role of scrubstructure and composition. Wildl. Biol. 13: 28–37. doi:10.2981/0909-6396(2007)13[28:ROCHIM]2.0.CO;2.
Blamires, S.J., Thompson, M.B., and Hochuli, D.F. 2007. Habitatselection and web plasticity by the orb spider Argiope keyser-lingi (Argiopidae): do they compromise foraging success forpredator avoidance? Austral Ecol. 32: 551–563. doi:10.1111/j.1442-9993.2007.01727.x.
Buddle, C.M., and Rypstra, A.L. 2003. Factors initiating emigrationof two wolf spider species (Araneae: Lycosidae) in an agro-ecosystem. Environ. Entomol. 32: 88–95.
Carrel, J.E. 2003. Ecology of two burrowing wolf spiders (Araneae:Lycosidae) syntopic in Florida scrub: burrow/body size relation-ships and habitat preferences. J. Kans. Entomol. Soc. 76: 16–30.
Chalfoun, A.D., and Martin, T.E. 2007. Assessments of habitat pre-ferences and quality depend on spatial scale and metrics of fit-
ness. J. Appl. Ecol. 44: 983–992. doi:10.1111/j.1365-2664.2007.01352.x.
Clark, P.J., and Evans, F.C. 1954. Distance to nearest neighbor as ameasure of spatial relationships in populations. Ecology, 35:445–453. doi:10.2307/1931034.
Corey, D.T. 1991. Burrow structure and placement in Geolycosaxera (Araneae: Lycosidae). Fla. Sci. 54: 125–128.
Fernandez-Montraveta, C., and Cuadrado, M. 2003. Timing andpatterns of mating in a free-ranging population of Lycosa taran-tula (Araneae, Lycosidae) from central Spain. Can. J. Zool. 81:552–555. doi:10.1139/z03-015.
Fernandez-Montraveta, C., and Cuadrado, M. 2007. Caracterısticasdel habitat de Donacosa merlini, una arana lobo potencialmenteamenazada. In Abstracts of the Eighth Jornadas del Grupo Iber-ico de Aracnologıa, Valencia, 25–28 October 2007. Museu Va-lencia d’Historia Natural and Grupo Iberico de Aracnologıa,Valencia, Spain.
Fernandez-Montraveta, C., Lahoz-Beltra, R., and Ortega, J. 1991.Spatial distribution of Lycosa tarentula fasciiventris (Araneae,Lycosidae) in a population from Central Spain. J. Arachnol. 19:73–79.
Fernandez-Montraveta, C., Moya-Larano, J., and Cuadrado, M.2004. Life history and habitat preferences of Donacosa merlini,an endemic wolf spider from the area of Donana (SW Spain). InAbstracts of the Sixteenth International Arachnological Confer-ence, Ghent, Belgium, 2–7 August 2004. Ghent University,Ghent, Belgium.
Fielding, A.H., and Haworth, P.F. 1995. Testing the generality ofbird-habitat models. Conserv. Biol. 9: 1466–1481. doi:10.1046/j.1523-1739.1995.09061466.x.
Foelix, R.F. 1996. Biology of spiders. 2nd ed. Oxford UniversityPress, Oxford.
Garcia-Mora, M.R., Gallego-Fernandez, J.B., and Garcia-Novo, F.1999. Plant functional types in coastal foredunes in relation toenvironmental stress and disturbance. J. Veg. Sci. 10: 27–34.doi:10.2307/3237157.
Garcıa-Novo, F., Merino-Ortega, J., Ramırez-Dıaz, L., Rodenas-Lario, M., Sancho-Royo, F., Torres-Martınez, A., Gonzalez-Bernaldez, F., Dıaz-Pineda, F., Allier, C., Bresset, V., andLacoste, A. 1977. Donana. Prospeccion e Inventario de Eco-sistemas. Icona, Ministerio de Agricultura, Madrid.
Halloran, M.M., Carrel, M.A., and Carrel, J.E. 2000. Instability ofsandy soil on the Lake Wales Ridge affects burrowing by wolfspiders (Araneae: Lycosidae) and antlions (Neuroptera: Myrme-leontidae). Fla. Entomol. 83: 48–55. doi:10.2307/3496227.
Hedenas, H., and Ericson, L. 2008. Species occurrences at standlevel cannot be understood without considering the landscapecontext: Cyanolichens on aspen in boreal Sweden. Biol. Con-serv. 141: 710–718. doi:10.1016/j.biocon.2007.12.019.
Lambrechts, M.M., Caro, S., Charmantier, A., Gross, N., Galan,M.J., Perret, P., Cartan-Son, M., Dias, P.C., Blondel, J., andThomas, D.W. 2004. Habitat quality as a predictor of spatialvariation in blue tit reproductive performance: a multi-plot ana-lysis in a heterogeneous landscape. Oecologia (Berl.), 141: 555–561. doi:10.1007/s00442-004-1681-5.
Lubin, Y., Ellner, S., and Kotzman, M. 1993. Web relocation andhabitat selection in a desert widow spider. Ecology, 74: 1915–1928. doi:10.2307/1940835.
Marshall, S.D. 1995a. Mechanisms of the formation of territorialaggregations of the burrowing wolf spider Geolycosa xera arch-boldi McCrone (Araneae, Lycosidae). J. Arachnol. 23: 145–150.
Marshall, S.D. 1995b. Natural history, activity patterns, and reloca-tion rates of a burrowing wolf spider — Geolycosa xera arch-boldi (Araneae, Lycosidae). J. Arachnol. 23: 65–70.
Fernandez-Montraveta and Cuadrado 1287
# 2008 NRC Canada

Marshall, S.D. 1996. Evidence for territorial behavior in a burrow-ing wolf spider. Ethology, 102: 32–39.
Marshall, S.D. 1997. The ecological determinants of space use by aburrowing wolf spider in a xeric shrubland ecosystem. J. AridEnviron. 37: 379–393. doi:10.1006/jare.1997.0287.
Munoz-Reinoso, J.C., and de Castro, F. 2005. Application of a sta-tistical water-table model reveals connections between dunesand vegetation at Donana. J. Arid Environ. 60: 663–679. doi:10.1016/j.jaridenv.2004.07.006.
Munoz-Reinoso, J.C., and Novo, F.G. 2005. Multiscale control ofvegetation patterns: the case of Donana (SW Spain). Landsc.Ecol. 20: 51–61. doi:10.1007/s10980-004-0466-x.
Platnick, N.I. 2007. The World spider catalog. Version 8.0 [online].Available from http://research.amnh.org/entomology/spiders/catalog/ [accessed 18 February 2008].
Reichling, S.B. 1999. Nearest neighbor relationships among thera-phosid spiders in Belize. Southwest. Nat. 44: 518–521. doi:10.2307/3672353.
Rypstra, A.L., Schmidt, J.M., Reif, B.D., DeVito, J., and Persons,M.H. 2007. Tradeoffs involved in site selection and foraging ina wolf spider: effects of substrate structure and predation risk.Oikos, 116: 853–863. doi:10.1111/j.0030-1299.2007.15622.x.
Sanchez, I. 2004. Nuevos datos de ‘‘Donacosa merlini’’ Alderweir-eldt & Jocque, 1991. Rev. Iber. Aracnol. 10: 317–319.
Sinsch, U., Leskovar, C., Drobig, A., Konig, A., and Grosse, W.R.
2007. Life-history traits in green toad (Bufo viridis) populations:indicators of habitat quality. Can. J. Zool. 85: 665–673. doi:10.1139/Z07-046.
Sokal, R.R., and Rohlf, F.J. 1995. Biometry: the principles andpractice of statistics in biological research. 3rd. ed. W.H. Free-man and Co., New York.
Verdu, J.R., and Galante, E. 2005. Libro Rojo de los Invertebradosde Espana. Direccion General de Conservacion de la Naturaleza,Madrid.
Ward, D., and Lubin, Y. 1993. Habitat selection and the life-historyof a desert spider, Stegodyphus lineatus (Eresidae). J. Anim.Ecol. 62: 353–363. doi:10.2307/5366.
Williams, J.L., Moya-Larano, J., and Wise, D.H. 2006. Burrowdecorations as antipredatory devices. Behav. Ecol. 17: 586–590.doi:10.1093/beheco/ark003.
Zunzunegui, M., Barradas, M.C.D., Aguilar, F., Lhout, F.A.,Clavijo, A., and Novo, F.G. 2002. Growth response of Halimiumhalimifolium at four sites with different soil water availabilityregimes in two contrasted hydrological cycles. Plant Soil, 247:271–281. doi:10.1023/A:1021598112037.
Zunzunegui, M., Barradas, M.C.D., Ain-Lhout, F., Clavijo, A., andNovo, F.G. 2005. To live or to survive in Donana dunes: adap-tive responses of woody species under a Mediterranean climate.Plant Soil, 273: 77–89. doi:10.1007/s11104-004-6806-4.
1288 Can. J. Zool. Vol. 86, 2008
# 2008 NRC Canada