Embed Size (px)
Citation preview
1
Micro/Nano Technology Service Center Financial Report for FY2011
Dr. Kevin Walsh, Director
Dr. Rob Keynton, Associate Director Dr. Shamus McNamara, Assisting Director
Mark Crain, Cleanroom Manager Wendy S. Metcalf, Administrative Associate
Don Yeager, Technical Staff and Facilities Coordinator Joseph Lake, Technical Staff and Outreach Coordinator
Curtis McKenna, Technical Staff Caitlin Grothaus, Student Assistant
SUMMARY
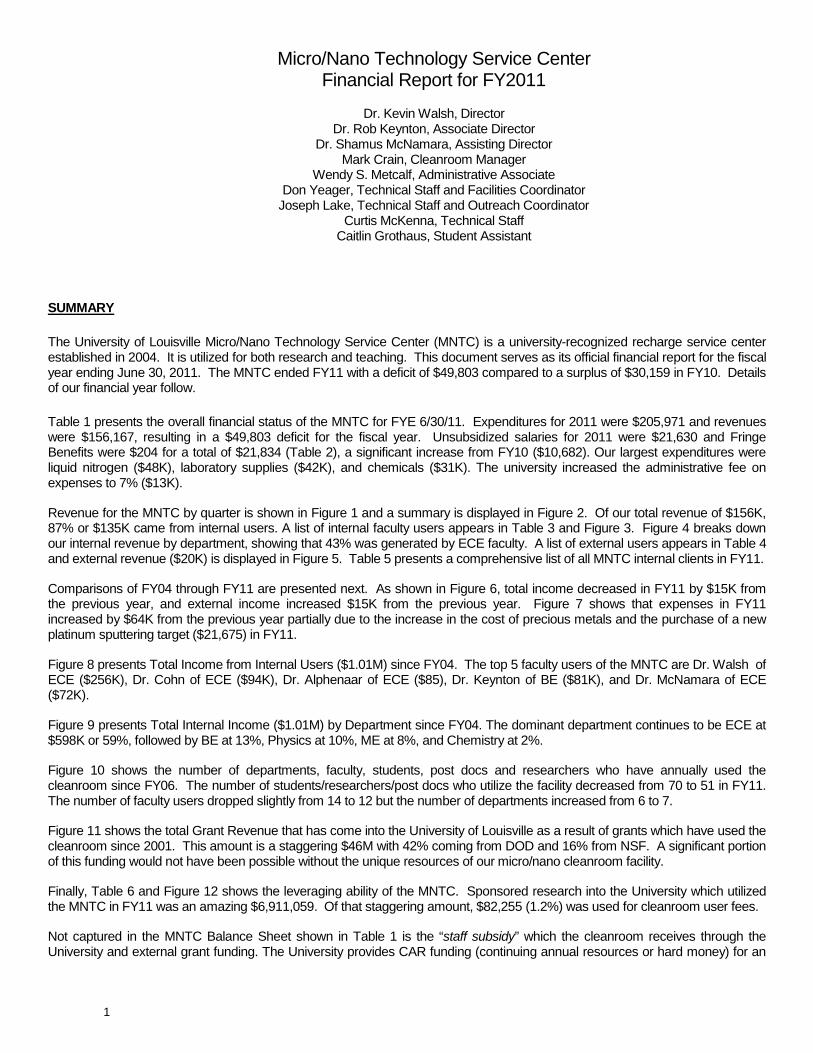
The University of Louisville Micro/Nano Technology Service Center (MNTC) is a university-recognized recharge service center established in 2004. It is utilized for both research and teaching. This document serves as its official financial report for the fiscal year ending June 30, 2011. The MNTC ended FY11 with a deficit of $49,803 compared to a surplus of $30,159 in FY10. Details of our financial year follow.
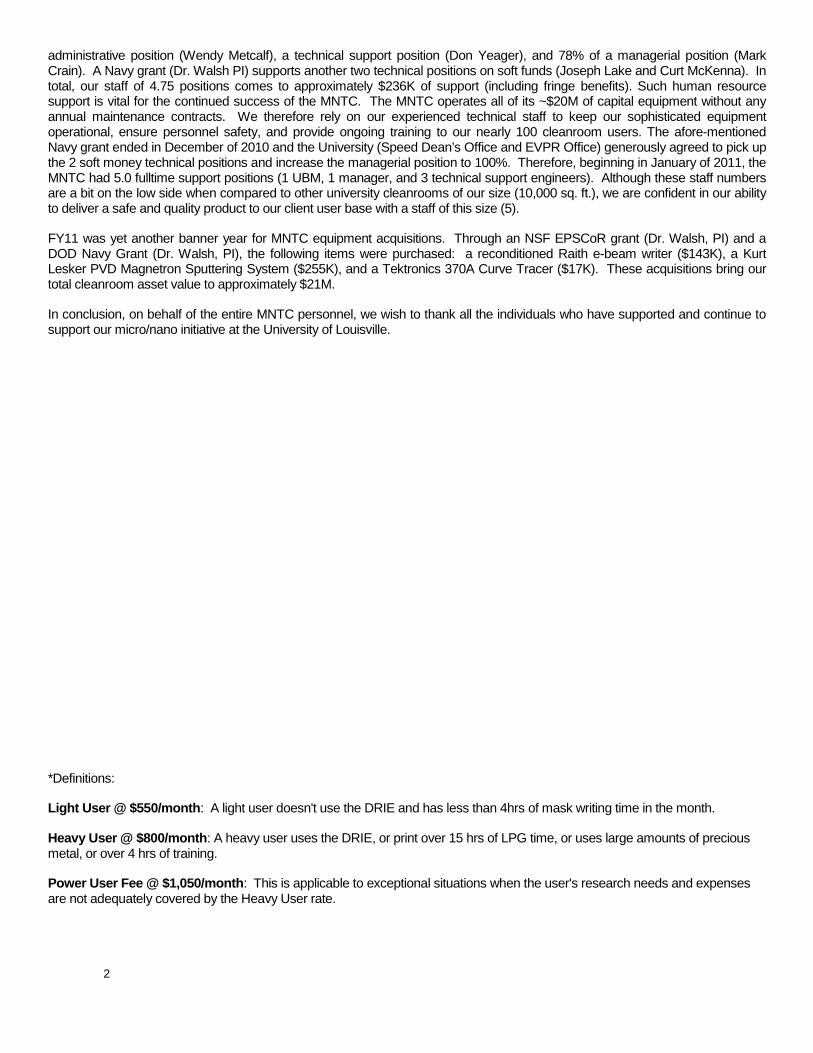
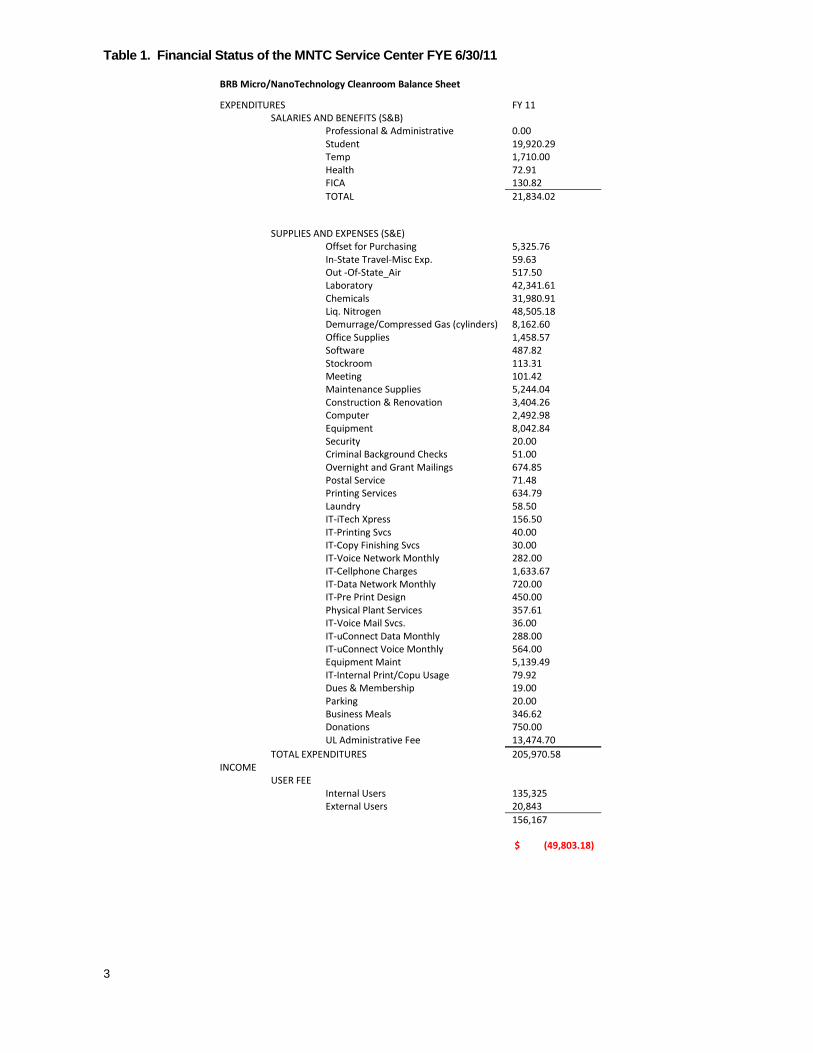
Table 1 presents the overall financial status of the MNTC for FYE 6/30/11. Expenditures for 2011 were $205,971 and revenues were $156,167, resulting in a $49,803 deficit for the fiscal year. Unsubsidized salaries for 2011 were $21,630 and Fringe Benefits were $204 for a total of $21,834 (Table 2), a significant increase from FY10 ($10,682). Our largest expenditures were liquid nitrogen ($48K), laboratory supplies ($42K), and chemicals ($31K). The university increased the administrative fee on expenses to 7% ($13K).
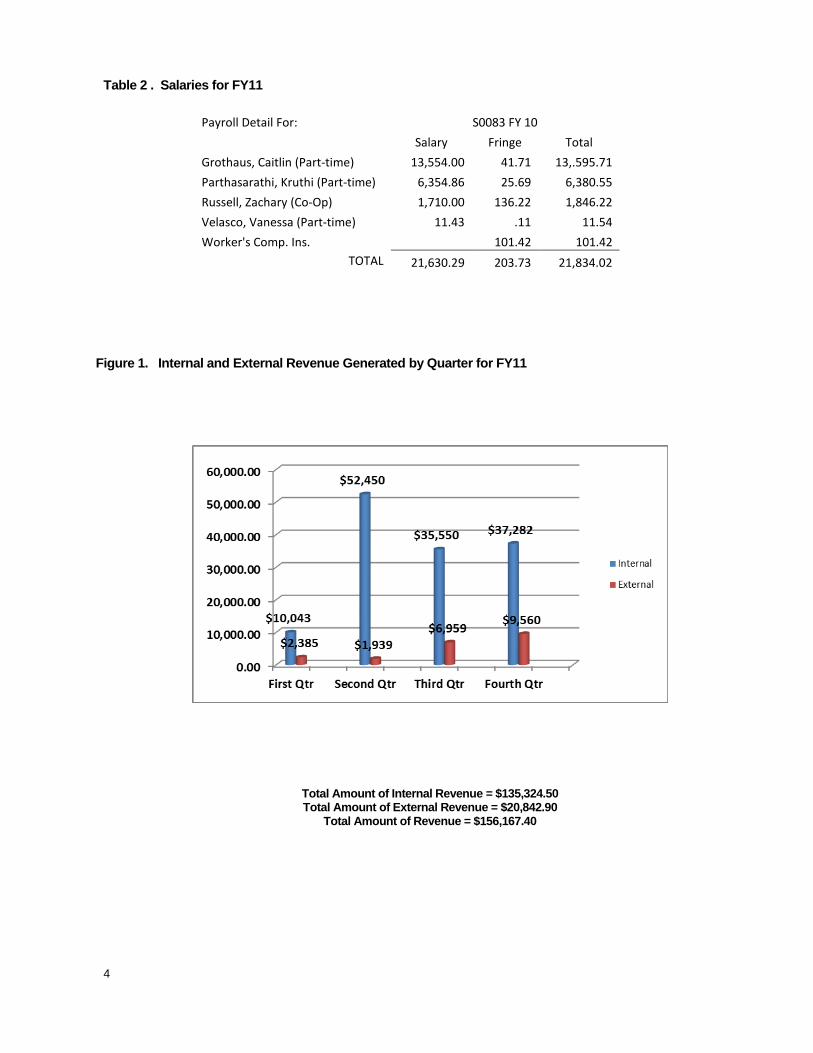
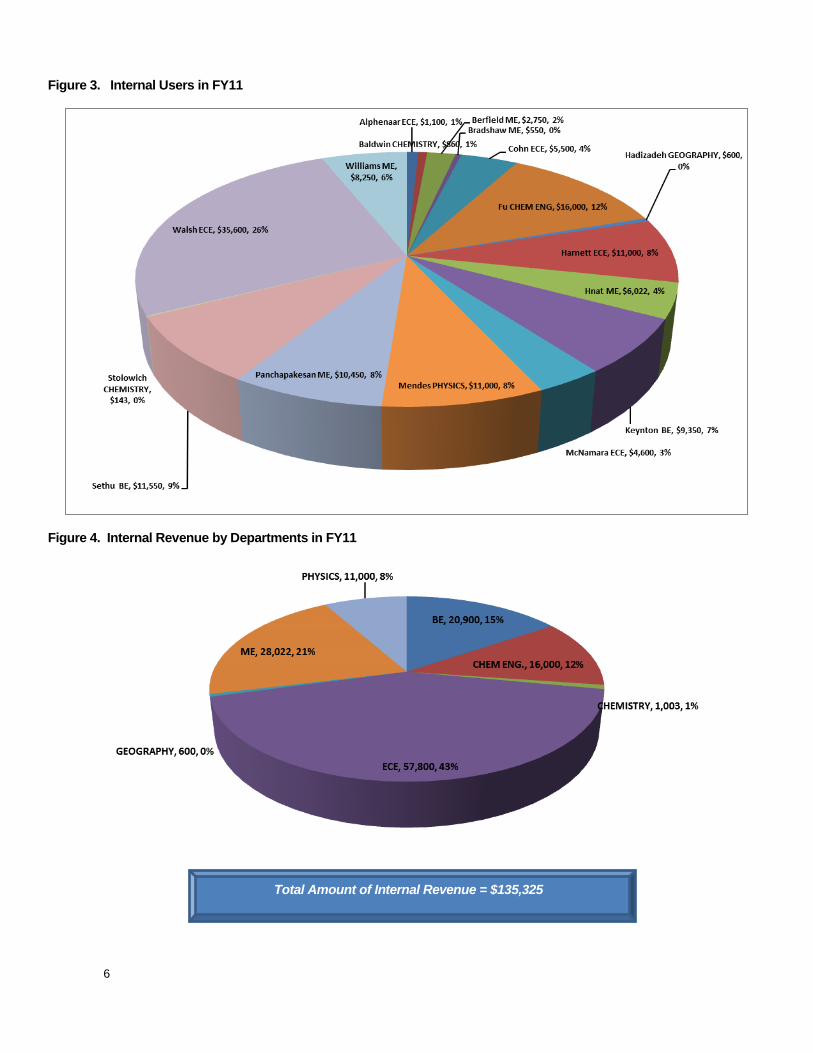
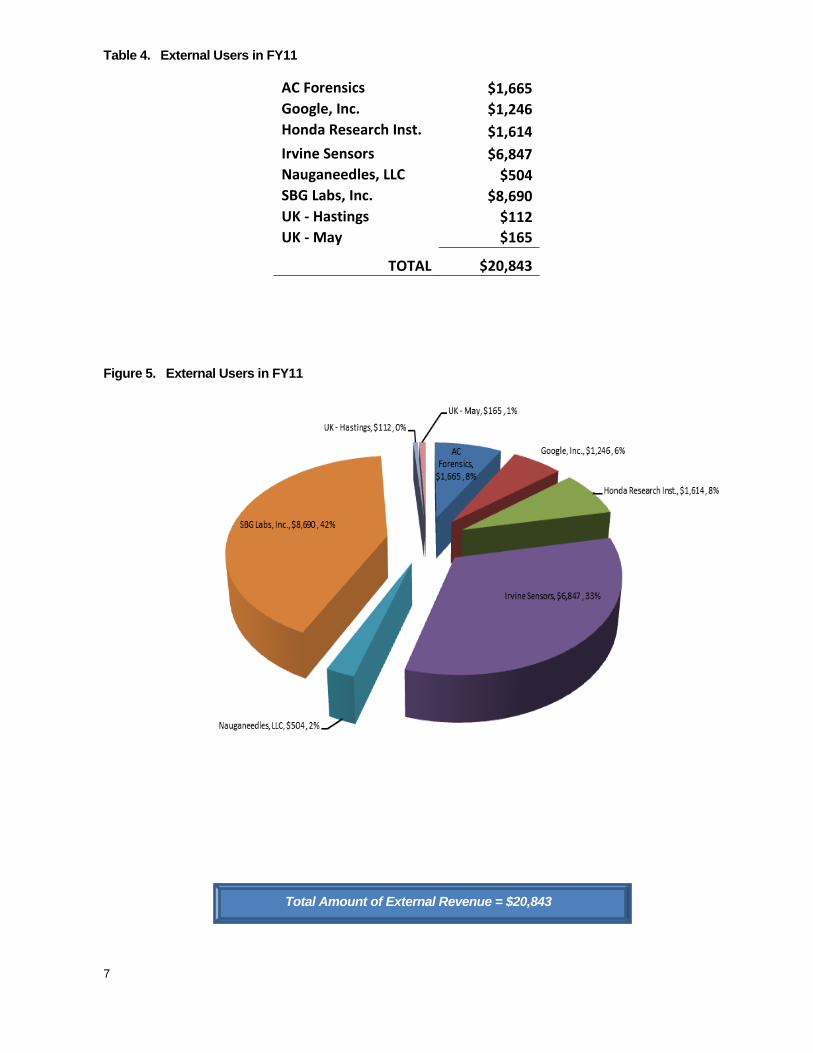
Revenue for the MNTC by quarter is shown in Figure 1 and a summary is displayed in Figure 2. Of our total revenue of $156K, 87% or $135K came from internal users. A list of internal faculty users appears in Table 3 and Figure 3. Figure 4 breaks down our internal revenue by department, showing that 43% was generated by ECE faculty. A list of external users appears in Table 4 and external revenue ($20K) is displayed in Figure 5. Table 5 presents a comprehensive list of all MNTC internal clients in FY11.
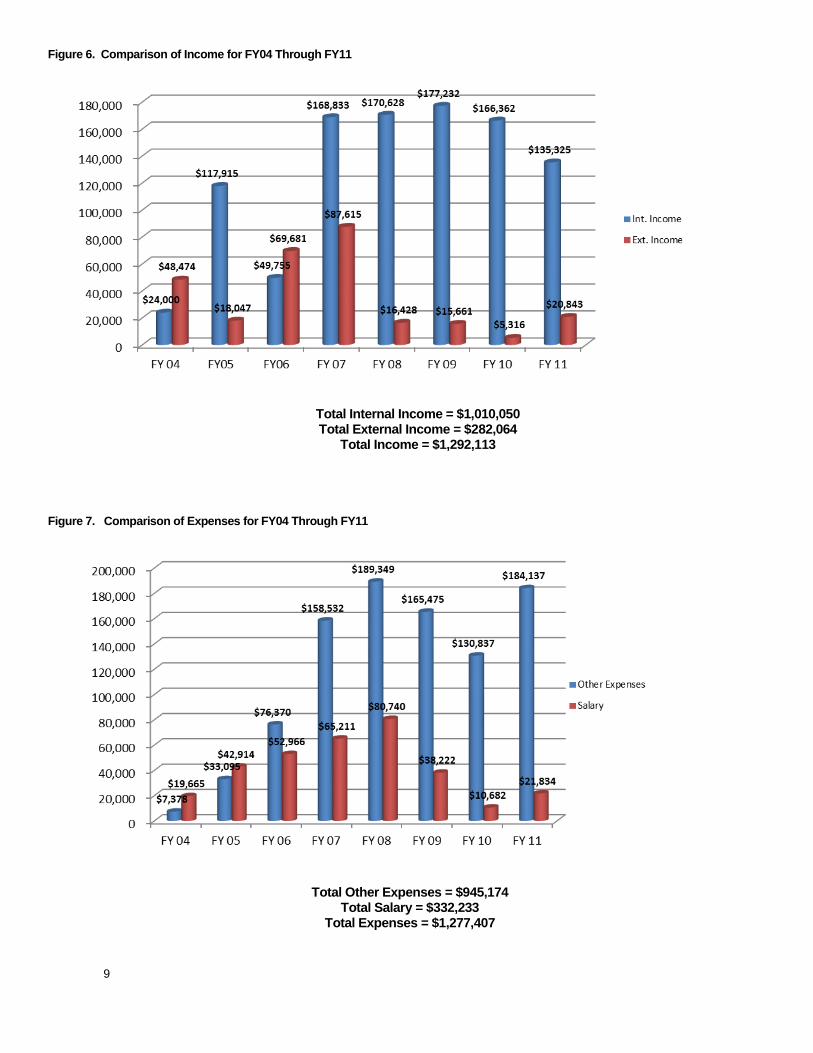
Comparisons of FY04 through FY11 are presented next. As shown in Figure 6, total income decreased in FY11 by $15K from the previous year, and external income increased $15K from the previous year. Figure 7 shows that expenses in FY11 increased by $64K from the previous year partially due to the increase in the cost of precious metals and the purchase of a new platinum sputtering target ($21,675) in FY11.
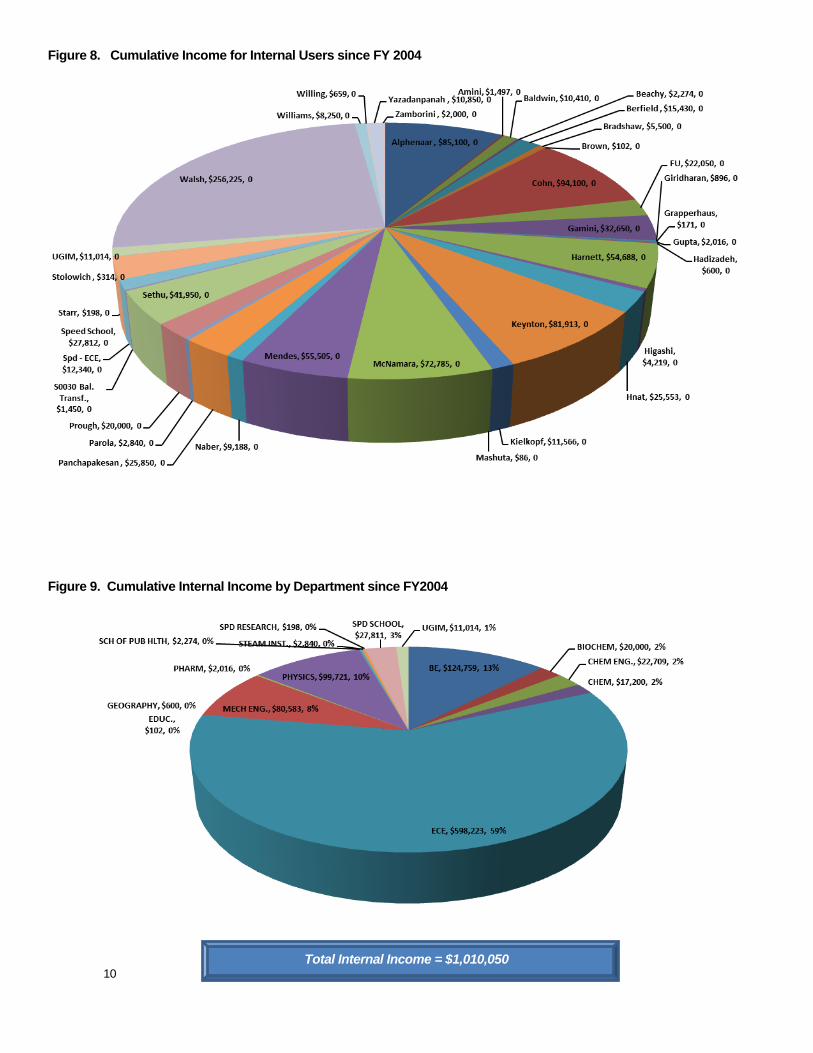
Figure 8 presents Total Income from Internal Users ($1.01M) since FY04. The top 5 faculty users of the MNTC are Dr. Walsh of ECE ($256K), Dr. Cohn of ECE ($94K), Dr. Alphenaar of ECE ($85), Dr. Keynton of BE ($81K), and Dr. McNamara of ECE ($72K).
Figure 9 presents Total Internal Income ($1.01M) by Department since FY04. The dominant department continues to be ECE at $598K or 59%, followed by BE at 13%, Physics at 10%, ME at 8%, and Chemistry at 2%.
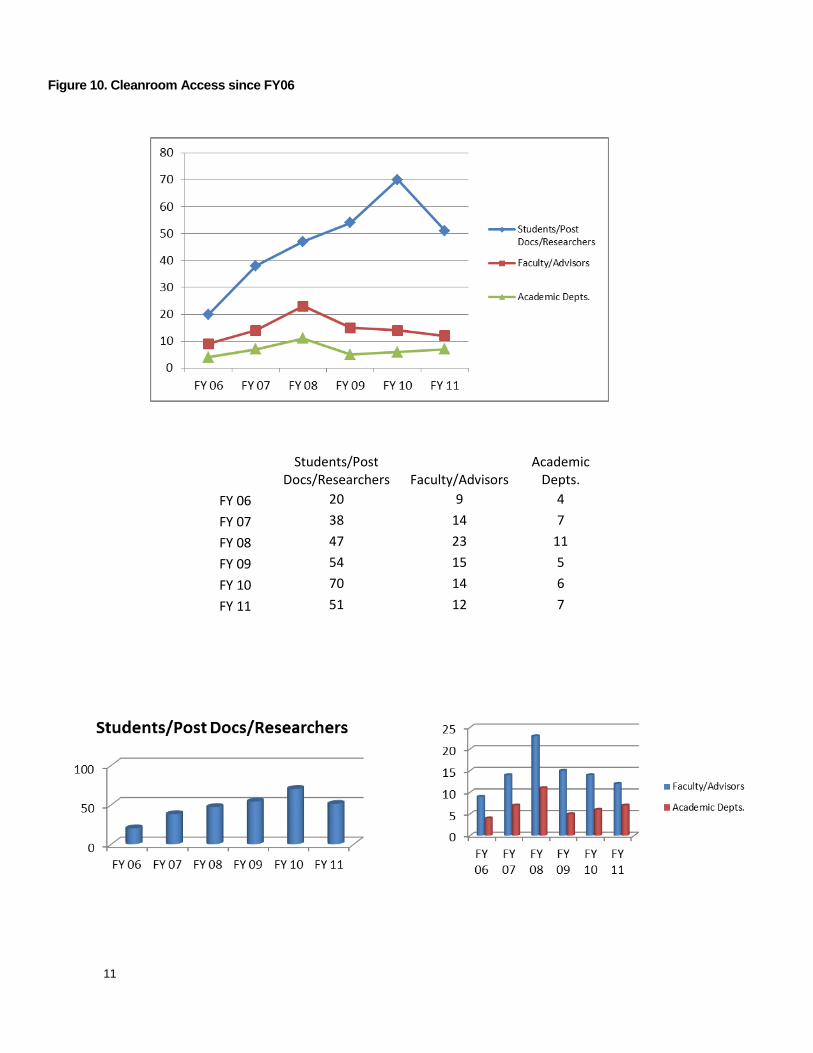
Figure 10 shows the number of departments, faculty, students, post docs and researchers who have annually used the cleanroom since FY06. The number of students/researchers/post docs who utilize the facility decreased from 70 to 51 in FY11. The number of faculty users dropped slightly from 14 to 12 but the number of departments increased from 6 to 7.
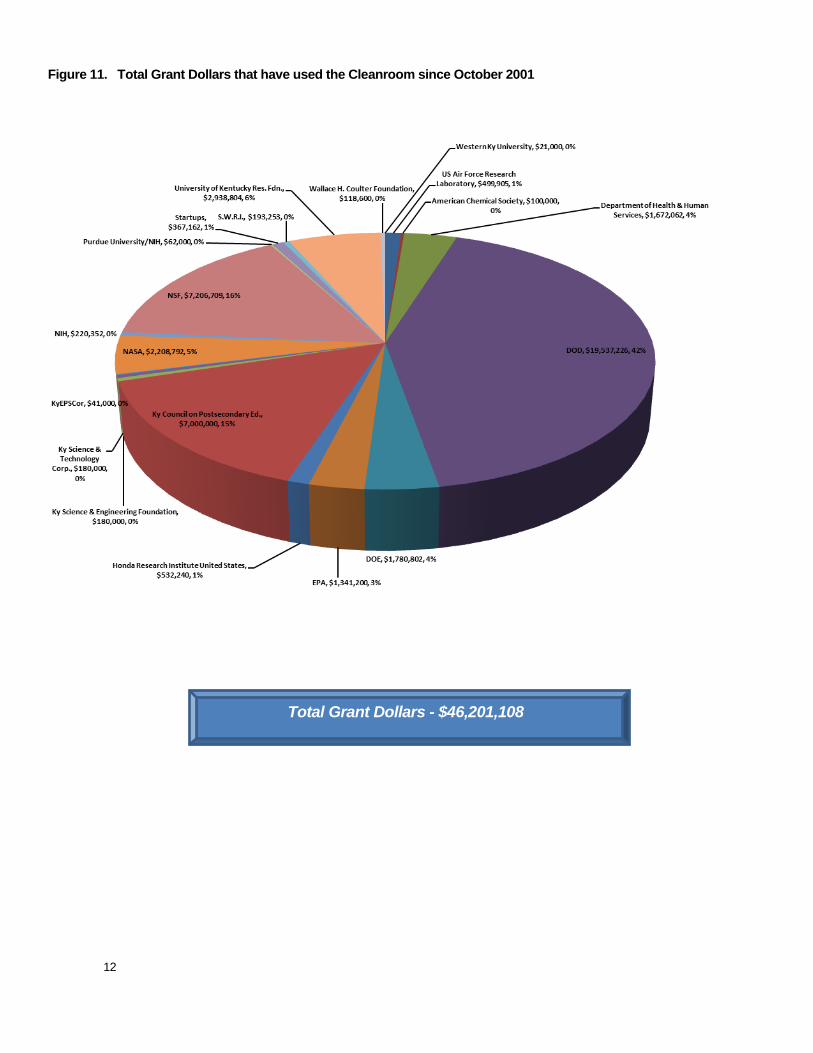
Figure 11 shows the total Grant Revenue that has come into the University of Louisville as a result of grants which have used the cleanroom since 2001. This amount is a staggering $46M with 42% coming from DOD and 16% from NSF. A significant portion of this funding would not have been possible without the unique resources of our micro/nano cleanroom facility.
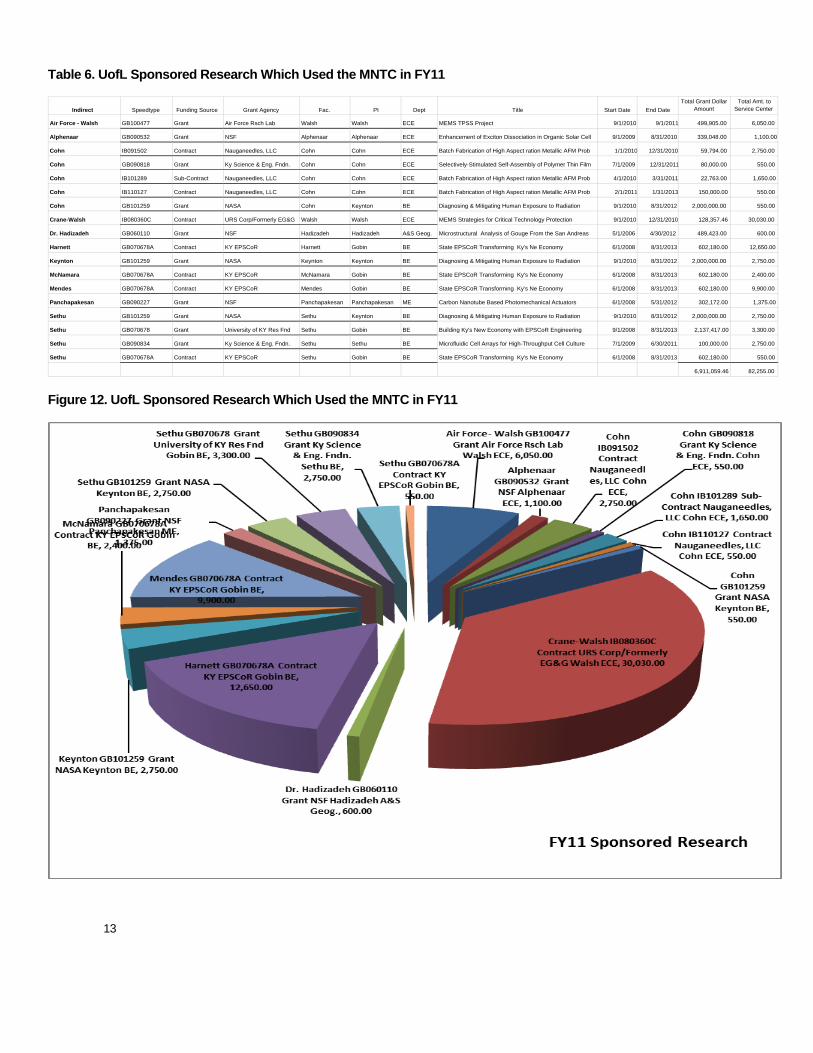
Finally, Table 6 and Figure 12 shows the leveraging ability of the MNTC. Sponsored research into the University which utilized the MNTC in FY11 was an amazing $6,911,059. Of that staggering amount, $82,255 (1.2%) was used for cleanroom user fees.
Not captured in the MNTC Balance Sheet shown in Table 1 is the “staff subsidy” which the cleanroom receives through the University and external grant funding. The University provides CAR funding (continuing annual resources or hard money) for an
2
administrative position (Wendy Metcalf), a technical support position (Don Yeager), and 78% of a managerial position (Mark Crain). A Navy grant (Dr. Walsh PI) supports another two technical positions on soft funds (Joseph Lake and Curt McKenna). In total, our staff of 4.75 positions comes to approximately $236K of support (including fringe benefits). Such human resource support is vital for the continued success of the MNTC. The MNTC operates all of its ~$20M of capital equipment without any annual maintenance contracts. We therefore rely on our experienced technical staff to keep our sophisticated equipment operational, ensure personnel safety, and provide ongoing training to our nearly 100 cleanroom users. The afore-mentioned Navy grant ended in December of 2010 and the University (Speed Dean’s Office and EVPR Office) generously agreed to pick up the 2 soft money technical positions and increase the managerial position to 100%. Therefore, beginning in January of 2011, the MNTC had 5.0 fulltime support positions (1 UBM, 1 manager, and 3 technical support engineers). Although these staff numbers are a bit on the low side when compared to other university cleanrooms of our size (10,000 sq. ft.), we are confident in our ability to deliver a safe and quality product to our client user base with a staff of this size (5).
FY11 was yet another banner year for MNTC equipment acquisitions. Through an NSF EPSCoR grant (Dr. Walsh, PI) and a DOD Navy Grant (Dr. Walsh, PI), the following items were purchased: a reconditioned Raith e-beam writer ($143K), a Kurt Lesker PVD Magnetron Sputtering System ($255K), and a Tektronics 370A Curve Tracer ($17K). These acquisitions bring our total cleanroom asset value to approximately $21M.
In conclusion, on behalf of the entire MNTC personnel, we wish to thank all the individuals who have supported and continue to support our micro/nano initiative at the University of Louisville.
*Definitions:
Light User @ $550/month: A light user doesn't use the DRIE and has less than 4hrs of mask writing time in the month.
Heavy User @ $800/month: A heavy user uses the DRIE, or print over 15 hrs of LPG time, or uses large amounts of precious metal, or over 4 hrs of training.
Power User Fee @ $1,050/month: This is applicable to exceptional situations when the user's research needs and expenses are not adequately covered by the Heavy User rate.
3
Table 1. Financial Status of the MNTC Service Center FYE 6/30/11
BRB Micro/NanoTechnology Cleanroom Balance Sheet EXPENDITURES FY 11 SALARIES AND BENEFITS (S&B) Professional & Administrative 0.00 Student 19,920.29 Temp 1,710.00 Health 72.91 FICA 130.82 TOTAL 21,834.02 SUPPLIES AND EXPENSES (S&E) Offset for Purchasing 5,325.76 In-State Travel-Misc Exp. 59.63 Out -Of-State_Air 517.50 Laboratory 42,341.61 Chemicals 31,980.91 Liq. Nitrogen 48,505.18 Demurrage/Compressed Gas (cylinders) 8,162.60 Office Supplies 1,458.57 Software 487.82 Stockroom 113.31 Meeting 101.42 Maintenance Supplies 5,244.04 Construction & Renovation 3,404.26 Computer 2,492.98 Equipment 8,042.84 Security 20.00 Criminal Background Checks 51.00 Overnight and Grant Mailings 674.85 Postal Service 71.48 Printing Services 634.79 Laundry 58.50 IT-iTech Xpress 156.50 IT-Printing Svcs 40.00 IT-Copy Finishing Svcs 30.00 IT-Voice Network Monthly 282.00 IT-Cellphone Charges 1,633.67 IT-Data Network Monthly 720.00 IT-Pre Print Design 450.00 Physical Plant Services 357.61 IT-Voice Mail Svcs. 36.00 IT-uConnect Data Monthly 288.00 IT-uConnect Voice Monthly 564.00 Equipment Maint 5,139.49 IT-Internal Print/Copu Usage 79.92 Dues & Membership 19.00 Parking 20.00 Business Meals 346.62 Donations 750.00 UL Administrative Fee 13,474.70 TOTAL EXPENDITURES 205,970.58 INCOME USER FEE Internal Users 135,325 External Users 20,843 156,167 $ (49,803.18)
4
Table 2 . Salaries for FY11
Figure 1. Internal and External Revenue Generated by Quarter for FY11
Payroll Detail For: S0083 FY 10
Salary Fringe Total
Grothaus, Caitlin (Part-time) 13,554.00 41.71 13,.595.71 Parthasarathi, Kruthi (Part-time) 6,354.86 25.69 6,380.55 Russell, Zachary (Co-Op) 1,710.00 136.22 1,846.22 Velasco, Vanessa (Part-time) 11.43 .11 11.54 Worker's Comp. Ins. 101.42 101.42
TOTAL 21,630.29 203.73 21,834.02
Total Amount of Internal Revenue = $135,324.50 Total Amount of External Revenue = $20,842.90
Total Amount of Revenue = $156,167.40
5
Figure 2. Total Internal and External Revenue Generated in FY11
Table 3. Internal Faculty Users in FY11
Alphenaar ECE $1,100
Baldwin CHEMISTRY $860
Berfield ME $2,750
Bradshaw ME $550
Cohn ECE $5,500
Fu CHEM ENG $16,000
Hadizadeh GEOGRAPHY $600
Harnett ECE $11,000
Hnat ME $6,022
Keynton BE $9,350
McNamara ECE $4,600
Mendes PHYSICS $11,000
Panchapakesan ME $10,450
Sethu BE $11,550
Stolowich CHEMISTRY $143
Walsh ECE $35,600
Williams ME $8,250
TOTAL
$135,325
Total Amount of Revenue = $156,167
6
Figure 3. Internal Users in FY11
Figure 4. Internal Revenue by Departments in FY11
Total Amount of Internal Revenue = $135,325
7
Table 4. External Users in FY11
AC Forensics $1,665 Google, Inc. $1,246 Honda Research Inst. $1,614 Irvine Sensors $6,847 Nauganeedles, LLC $504 SBG Labs, Inc. $8,690 UK - Hastings $112 UK - May $165
TOTAL $20,843
Figure 5. External Users in FY11
Total Amount of External Revenue = $20,843
8
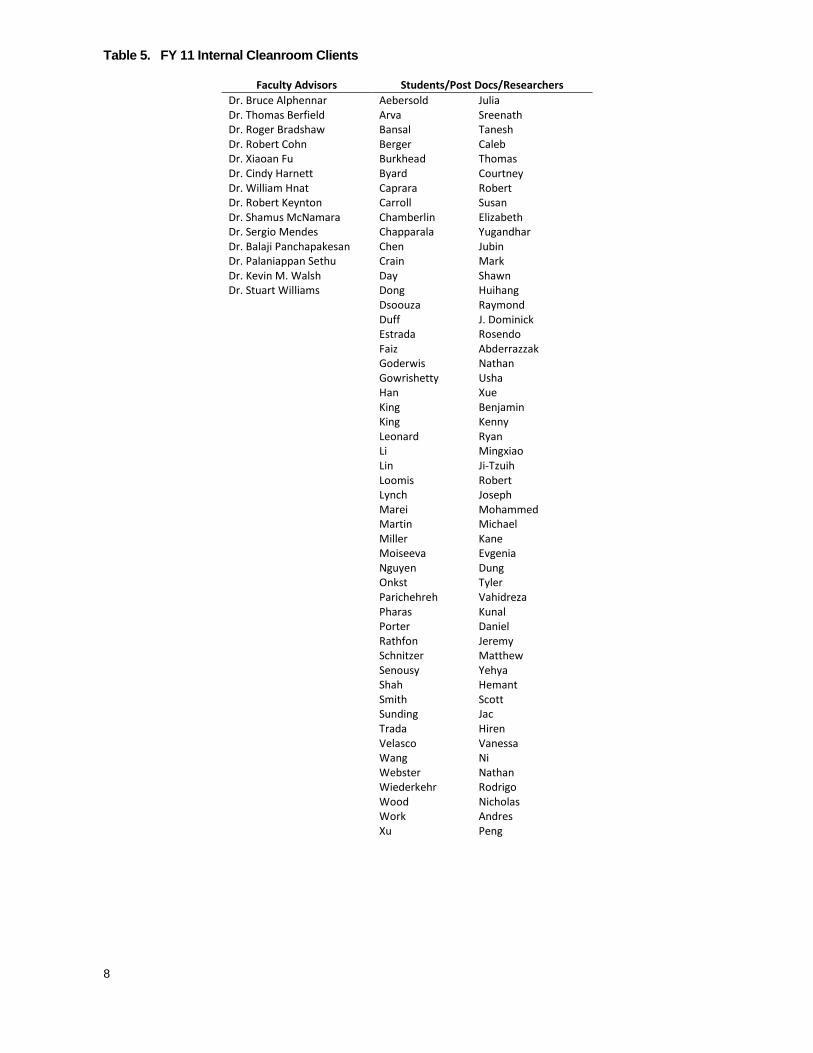
Table 5. FY 11 Internal Cleanroom Clients
Faculty Advisors Students/Post Docs/Researchers Dr. Bruce Alphennar Aebersold Julia Dr. Thomas Berfield Arva Sreenath Dr. Roger Bradshaw Bansal Tanesh Dr. Robert Cohn Berger Caleb Dr. Xiaoan Fu Burkhead Thomas Dr. Cindy Harnett Byard Courtney Dr. William Hnat Caprara Robert Dr. Robert Keynton Carroll Susan Dr. Shamus McNamara Chamberlin Elizabeth Dr. Sergio Mendes Chapparala Yugandhar Dr. Balaji Panchapakesan Chen Jubin Dr. Palaniappan Sethu Crain Mark Dr. Kevin M. Walsh Day Shawn Dr. Stuart Williams Dong Huihang
Dsoouza Raymond
Duff J. Dominick
Estrada Rosendo
Faiz Abderrazzak
Goderwis Nathan
Gowrishetty Usha
Han Xue
King Benjamin
King Kenny
Leonard Ryan
Li Mingxiao
Lin Ji-Tzuih
Loomis Robert
Lynch Joseph
Marei Mohammed
Martin Michael
Miller Kane
Moiseeva Evgenia
Nguyen Dung
Onkst Tyler
Parichehreh Vahidreza
Pharas Kunal
Porter Daniel
Rathfon Jeremy
Schnitzer Matthew
Senousy Yehya
Shah Hemant
Smith Scott
Sunding Jac
Trada Hiren
Velasco Vanessa
Wang Ni
Webster Nathan
Wiederkehr Rodrigo
Wood Nicholas
Work Andres
Xu Peng
9
Figure 6. Comparison of Income for FY04 Through FY11
Figure 7. Comparison of Expenses for FY04 Through FY11
Total Internal Income = $1,010,050 Total External Income = $282,064
Total Income = $1,292,113
Total Other Expenses = $945,174 Total Salary = $332,233
Total Expenses = $1,277,407
10
Figure 8. Cumulative Income for Internal Users since FY 2004
Figure 9. Cumulative Internal Income by Department since FY2004
Total Internal Income = $1,010,050
11
Figure 10. Cleanroom Access since FY06
Students/Post Docs/Researchers Faculty/Advisors
Academic Depts.
FY 06 20 9 4 FY 07 38 14 7 FY 08 47 23 11 FY 09 54 15 5 FY 10 70 14 6 FY 11 51 12 7
12
Figure 11. Total Grant Dollars that have used the Cleanroom since October 2001
Total Grant Dollars - $46,201,108
13
Table 6. UofL Sponsored Research Which Used the MNTC in FY11
Indirect Speedtype Funding Source Grant Agency Fac. PI Dept Title Start Date End DateTotal Grant Dollar
AmountTotal Amt. to
Service Center
Air Force - Walsh GB100477 Grant Air Force Rsch Lab Walsh Walsh ECE MEMS TPSS Project 9/1/2010 9/1/2011 499,905.00 6,050.00
Alphenaar GB090532 Grant NSF Alphenaar Alphenaar ECE Enhancement of Exciton Dissociation in Organic Solar Cell 9/1/2009 8/31/2010 339,048.00 1,100.00
Cohn IB091502 Contract Nauganeedles, LLC Cohn Cohn ECE Batch Fabrication of High Aspect ration Metallic AFM Prob 1/1/2010 12/31/2010 59,794.00 2,750.00
Cohn GB090818 Grant Ky Science & Eng. Fndn. Cohn Cohn ECE Selectively-Stimulated Self-Assembly of Polymer Thin Film 7/1/2009 12/31/2011 80,000.00 550.00
Cohn IB101289 Sub-Contract Nauganeedles, LLC Cohn Cohn ECE Batch Fabrication of High Aspect ration Metallic AFM Prob 4/1/2010 3/31/2011 22,763.00 1,650.00
Cohn IB110127 Contract Nauganeedles, LLC Cohn Cohn ECE Batch Fabrication of High Aspect ration Metallic AFM Prob 2/1/2011 1/31/2013 150,000.00 550.00
Cohn GB101259 Grant NASA Cohn Keynton BE Diagnosing & Mitigating Human Exposure to Radiation 9/1/2010 8/31/2012 2,000,000.00 550.00
Crane-Walsh IB080360C Contract URS Corp/Formerly EG&G Walsh Walsh ECE MEMS Strategies for Critical Technology Protection 9/1/2010 12/31/2010 128,357.46 30,030.00
Dr. Hadizadeh GB060110 Grant NSF Hadizadeh Hadizadeh A&S Geog. Microstructural Analysis of Gouge From the San Andreas 5/1/2006 4/30/2012 489,423.00 600.00
Harnett GB070678A Contract KY EPSCoR Harnett Gobin BE State EPSCoR Transforming Ky's Ne Economy 6/1/2008 8/31/2013 602,180.00 12,650.00
Keynton GB101259 Grant NASA Keynton Keynton BE Diagnosing & Mitigating Human Exposure to Radiation 9/1/2010 8/31/2012 2,000,000.00 2,750.00
McNamara GB070678A Contract KY EPSCoR McNamara Gobin BE State EPSCoR Transforming Ky's Ne Economy 6/1/2008 8/31/2013 602,180.00 2,400.00
Mendes GB070678A Contract KY EPSCoR Mendes Gobin BE State EPSCoR Transforming Ky's Ne Economy 6/1/2008 8/31/2013 602,180.00 9,900.00
Panchapakesan GB090227 Grant NSF Panchapakesan Panchapakesan ME Carbon Nanotube Based Photomechanical Actuators 6/1/2008 5/31/2012 302,172.00 1,375.00
Sethu GB101259 Grant NASA Sethu Keynton BE Diagnosing & Mitigating Human Exposure to Radiation 9/1/2010 8/31/2012 2,000,000.00 2,750.00
Sethu GB070678 Grant University of KY Res Fnd Sethu Gobin BE Building Ky's New Economy with EPSCoR Engineering 9/1/2008 8/31/2013 2,137,417.00 3,300.00
Sethu GB090834 Grant Ky Science & Eng. Fndn. Sethu Sethu BE Microfluidic Cell Arrays for High-Throughput Cell Culture 7/1/2009 6/30/2011 100,000.00 2,750.00
Sethu GB070678A Contract KY EPSCoR Sethu Gobin BE State EPSCoR Transforming Ky's Ne Economy 6/1/2008 8/31/2013 602,180.00 550.00
6,911,059.46 82,255.00
Figure 12. UofL Sponsored Research Which Used the MNTC in FY11