Embed Size (px)
Citation preview

MicroPort 2016 1H Earning Release

Contents *Appendix 1- Business Highlights
*Appendix 2- Financial Statements
Contents
Group Performance & Outlook
•This document is for information purposes only and does not constitute or form part of any offer or invitation to sell or the solicitation of an offer or invitation to purchase or subscribe for any securities of MicroPort Scientific Corporation, and no part of it shall form the basis of, or be relied upon in connection with, any agreement, arrangement, contract, commitment or investment decision in relation thereto whatsoever. •FORWARD-LOOKING STATEMENTS •Some information contained on this website contains forward-looking statements. These forward-looking statements include, without limitation, those regarding our future financial position, our strategy, plans, objectives, goals and targets, future developments in the markets where we participate or are seeking to participate, and any statements preceded by, followed by or that include the words "believe", "intend", "expect", anticipate", "project", "estimate", "predict", "is confident", "has confidence" and similar expressions are also intended to identify forward-looking statements. Such statements are based upon the current beliefs and expectations of MicroPort’s management and are subject to significant risks and uncertainties. MicroPort Scientific Corporation undertakes no obligation to update any of the statements. These forward-looking statements are not guarantees of future performance and are subject to risks, uncertainties and other factors that could cause actual future results to differ materially from current expectations include, but are not limited to, general industry and economic conditions, PRC governmental policies and regulations relating to the medical device manufacturing industry, competition in the medical device manufacturing industry, our ability to develop new products and stay abreast of market trends and technological advances, our goals and strategies, our ability to execute strategic acquisitions of, investments in or alliances with other companies and businesses, fluctuations in general economic and business conditions in China. •CONFIDENTIALITY •This presentation is confidential and may not be reproduced, redistributed or passed on, directly or indirectly, to any other person or published, in whole or in part, for any purpose.
Disclaimer

*Appendix 1- Business Highlights
*Appendix 2- Financial Statements
Contents * Appendix 1-Business Highlights * Appendix 2-Financial Statements
1. Interim Results Highlights
2. Financial Review
3. Business Review
• Financial Statements
4. Appendix

1H 2016 Results Highlights
Key Financial Summary (*Excl. FX) Highlights
4
Successfully achieved revenue of $198.6m, representing a growth rate of 6.9% excluding foreign exchange impact
Key segments and core products maintained robust growth
Cardiovascular, Endovascular and Neurovascular revenues increased by 12.4%, 40.2% and 26.8% respectively excluding foreign exchange impact
MPO further narrowed its net loss with cash flow break-even on track
Net Profit realized turnaround from (US$2.6m) to US$5.5m
Substantial progress in R&D and pipeline development Columbus ™ and FireMagic ™ 3D Cool & Supercool obtained CFDA
approvals Firehawk ™ obtained regulatory approval in Brazil, India, Argentina
and Vietnam; Target AC Clinical Trials in Europe completed ~70% patient enrollment
Evolution Revision Tibial System submitted for FDA approval TAVI, Firesorb ™ ,“Innovated-in-China” Pacing Lead and Minos ™ at
Clinical Trials stage TAVI, Firesorb ™, Tubridge™ and Reewarm™ PTX granted Green-Path
for CFDA approval Total hip prosthesis R&D in China scheduled to enter Clinical Trials Surgical Robot is in good process EP business was approved by HKSE and the Board for
quotation on NEEQ, which is expected to provide a good platform for financing and further development.
Pre-Clinical Study
Total Hip Prosthesis
Surgical Robot
Clinical Trials
TAVI
Firesorb
Pacing Lead
Minos
CFDA Green-Path
TAVI
Firesorb
Tubridge
Reewarm PTX
CFDA or Overseas Approval
Columbus
FireMagic 3D Cool & Supercool
Firehawk
Net Profit : –USD 2.6m + USD5.5m
Driven by Key Areas and Core Products MPO Net loss:
narrowed 27%* Ortho China:
+78%* be consol. Firehawk: +126%*
Hercules Thoracic : +60%* APPOLO: +31%*
Driven by Key Segments Orthopedics: +1.2% Cardio: +12.4%* Endo: +40.2%* Neuro: +26.8%*
Revenue: +6.9%*
R&D and Pipeline Progress

*Appendix 1- Business Highlights
*Appendix 2- Financial Statements
Contents * Appendix 1-Business Highlights * Appendix 2-Financial Statements
1. Interim Results Highlights
2. Financial Review
3. Business Review
• Financial Statements
4. Appendix

Consolidated Financial Performance
Revenue Gross Profit Margin
Operating Expenses
USD: million USD: million
USD: million
Net Profit/(Loss) USD: million
Group revenue up 7% excl. FX, 4% as reported
Percentage of sales improved 1%
GP margin improved 2%
Turnaround from loss ($3m) to profit $6m.
191 199 ↑7%
↑1%
6
106 107
85 92
2015 1H 2016 1H
Non-OrthoOrtho
67% 69%
2015 2016 1H
(3)
6
2015 1H 2016 1H
75 76
40 42
60% 59%
2015 1H 2016 1H
Non-Ortho
Ortho
%sales
115 118
↑2M
↑1M

Operating Expenses
Percentage of Sales ↑ 0.3%
Increase by 2.9M
- Ortho ↑ 1.6M due to more bonus paid for promotion of the orthopedics business;
- Non-Ortho ↑1.3M due to more input in post-market clinical trials for promotion of Firehawk in the domestic market.
Percentage of Sales ↓ 0.7%
Decrease by 0.5M
- Non-Ortho Y/Y ↓ 0.3M;
- Ortho Y/Y ↓0.2M.
* Note: Capitalized R&D ↑ 1.7M
Percentage of Sales ↓ 0.2%
Increase by 0.7M
- Non-Ortho Y/Y ↑ 0.9M to support business growth;
- Offset by Ortho Y/Y ↓ 0.2M.
USD: million USD: million USD: million
Sales and Marketing Expenses Administrative Expenses Research and Develop. Expenses
7
59.1 62.0
30.9% 31.2%
2015 1H 2016 1HS&M % of Sales
31.0 31.7
16.2% 16.0%
2015 1H 2016 1HG&A % of Sales
24.7 24.2
12.9% 12.2%
2015 1H 2016 1HR&D % of Sales

(156.4)
35.9
2015 1H 2016 1H
12.3
35.7
2015 1H 2016 1H
Cashflow
Net operating cash inflow
increased 23.4M
USD: million USD: million
Net Cashflow from Operating Activities
Net Cashflow from Investing Activities
Net Cashflow
8
21.5 29.0
2015 1H 2016 1H
Net investing cash outflow
increased 7.5M to support
business growth
Net cashflow turned positive to
35.9M in 1H 2016
Convertible bond issued in 1H 2016
bringing in Carlyle as new important
strategic investor
USD: million
*2015 1H includes (160m) Otsuka loan repayment
* Includes movement in time deposits over 3 month (1H16: -6m vs 1H15: -10m)
* Includes movement in time deposits over 3 month (1H16: -6m vs 1H15: -10m)

*Appendix 1- Business Highlights
*Appendix 2- Financial Statements
Contents
1. Interim Results Highlights
2. Financial Review
3. Business Review
• Financial Statements
4. Appendix
05
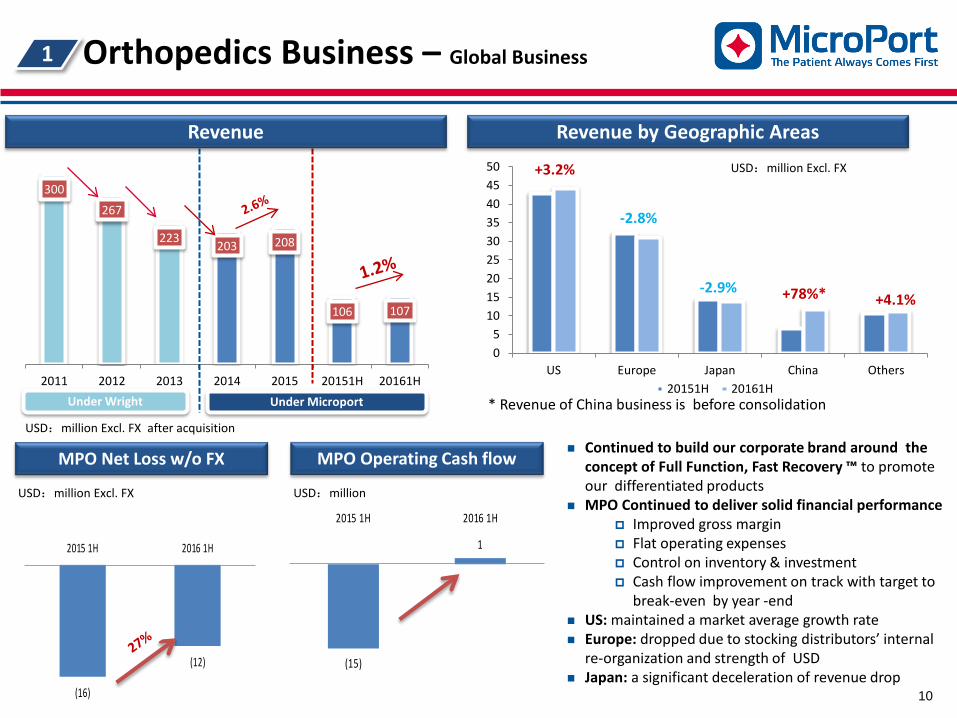
101520253035404550
US Europe Japan China Others20151H 20161H
+3.2%
-2.8%
-2.9% +4.1%
300 267
223 203 208
106 107
2011 2012 2013 2014 2015 20151H 20161HUnder Microport Under Wright
1 Orthopedics Business – Global Business
10
Continued to build our corporate brand around the concept of Full Function, Fast Recovery ™ to promote our differentiated products
MPO Continued to deliver solid financial performance Improved gross margin Flat operating expenses Control on inventory & investment Cash flow improvement on track with target to
break-even by year -end US: maintained a market average growth rate Europe: dropped due to stocking distributors’ internal
re-organization and strength of USD Japan: a significant deceleration of revenue drop
Revenue by Geographic Areas Revenue
* Revenue of China business is before consolidation
+78%*
MPO Net Loss w/o FX
(16)
(12)
2015 1H 2016 1H
MPO Operating Cash flow
(15)
1
2015 1H 2016 1H
USD:million Excl. FX
USD:million Excl. FX after acquisition
USD:million USD:million Excl. FX

2014 2015 2015 1H 2016 1H
OrthoRecon Spine&Trauma GSC
1 Orthopedics Business – China Business
11
China OrthoRecon : Solid ramp up on SuperpathTM and EvolutionTM
Sales on imported products became profitable Improved margin driven by product mix Made in China project on track: Equipment are under installation and
debugging Global Supply Center (“GSC”):
Start GSC phase II projects Raw materials for made-in-China project: 20% savings Rapid progress of purchase of low-cost instruments in Asia-Pacific area
Instrument Manufacturing: Completion of verification, start to fulfill GSC orders in Ability to provide 60% kinds of instruments purchased by GSC
Spine and Trauma (“S&T”): New products next year: bone cement, PKP, PVP, bone nail
Revenue and Growth 2016 SuperpathTM and EvolutionTM
As of Mid-Aug: SuperpathTM
Hospitals covered: 159 in 23 provinces
Total surgical cases: 1665 since launched at Nov.14
EvolutionTM
Hospitals covered: 10 in 9 provinces Total Surgical cases: 136 since
launched at Aug.15
* Revenue of China business is before consolidation
209
715
20151H 20161H
SuperpathTM
Surgical Cases
12
67
99
159
7 10
31-Dec-2014 30-Jun-15 31-Dec-15 30-Jun-16SuperPath Evolution
Hospital Coverage
Ortho 34%
GSC 340%
USD:million Excl. FX
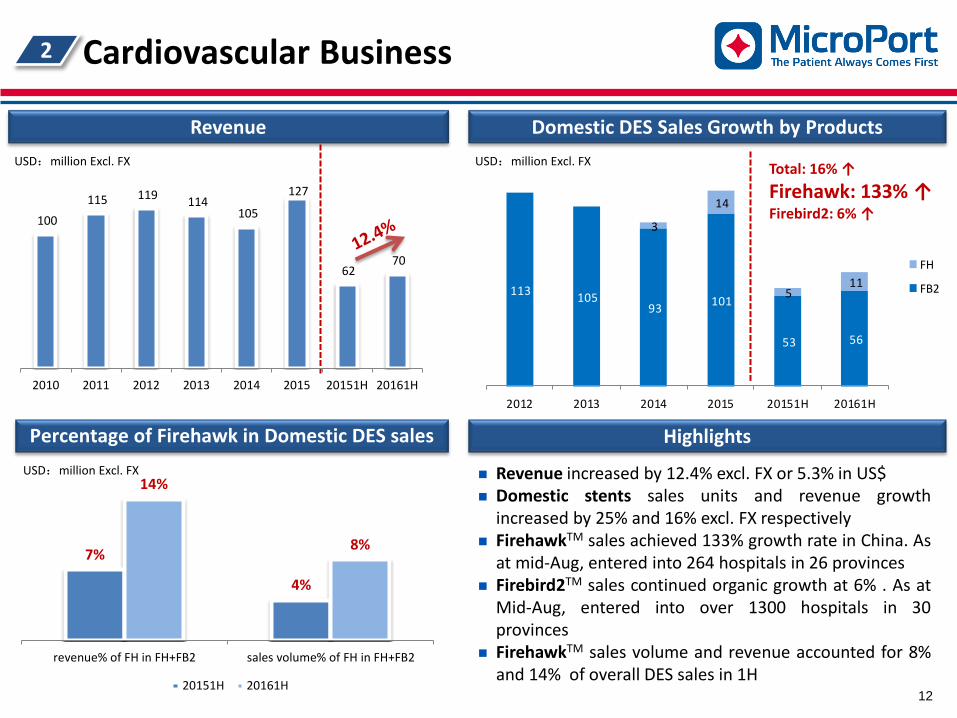
113 105 93 101
53 56
3
14
5 11
2012 2013 2014 2015 20151H 20161H
FH
FB2
Total: 16% ↑ Firehawk: 133% ↑ Firebird2: 6% ↑
2 Cardiovascular Business
12
Revenue
Highlights
USD:million Excl. FX
Percentage of Firehawk in Domestic DES sales
Domestic DES Sales Growth by Products
Revenue increased by 12.4% excl. FX or 5.3% in US$ Domestic stents sales units and revenue growth
increased by 25% and 16% excl. FX respectively FirehawkTM sales achieved 133% growth rate in China. As
at mid-Aug, entered into 264 hospitals in 26 provinces Firebird2TM sales continued organic growth at 6% . As at
Mid-Aug, entered into over 1300 hospitals in 30 provinces
FirehawkTM sales volume and revenue accounted for 8% and 14% of overall DES sales in 1H
7%
4%
14%
8%
revenue% of FH in FH+FB2 sales volume% of FH in FH+FB2
20151H 20161H
100 115 119 114
105
127
62 70
2010 2011 2012 2013 2014 2015 20151H 20161H
USD:million Excl. FX
USD:million Excl. FX

Actual No. of Activated Sites
Exp. Low speed model
Exp. Middle speed model
Actual Recruitment
Exp. No. of Activated Sites
Overseas Revenue
2 Cardiovascular Business- International business
13
Firebird2+Firehawk Firehawk
20151H 20161H
USD:million Excl. FX
FirehawkTM overseas coverage: 24 overseas countries
Total overseas sales of Firebird2TM and FirehawkTM growth: Y/Y 10%
FirehawkTM overseas sales: Y/Y 84% FirehawkTM Target AC Clinical Trials in Europe is
ahead of schedule with over 1214 patients enrolled in 21 hospitals (total target 1656 patients)
High speed model: 1137 Low speed model: 918
New Countries & Distributors Development
FirehawkTM TARGET AC Enrollment Status
Highlights

Firesorb-Bioresorbable Rapamycin Target Eluting Coronary Stent System
2 Cardiovascular Business
Granted Green-Path for CFDA approval FIM Clinical Trials (45 patients) completed Clinical follow-up ongoing and expected to
receive report in Q3 and then Initiate FUTURE-II in Q4
Milestone
Project Approval
2012 2015 2016 2017 2018 2020
FIM
RCT&OPC
Design Finalization
CFDA approval & CE approval
CFDA green channel status
Transcatheter Aortic Valve (TAVI) --Vitaflow
2010
FIM
2014 2016 2017 2018 2019
CFDA Approval
Clinical Trials
Project approval
Milestone Granted Green-Path for CFDA approval. At the Stage of Pre-marketing Clinical
Trials. Estimated to complete all of its Clinical
Trials before the End of 2016. Introduced at “China Valve” conference

8.2 8.9
10.3
12.2 13.2
15.4
7.4
10.5
2010 2011 2012 2013 2014 2015 20151H 20161H
3 Endovascular Business
15
Revenue
Highlights
Soli
Sales growth by products
HT HBL HBB AB surgical
20151H 20161H
Achieved Y/Y sales growth of 40% excl. FX and 32% in USD, exceeding market average level
Hercules Thoracic Stent-Graft System maintains strong growth momentum with 74% and 60% growth rate in volume and revenue, respectively .
Significant growth of AAA related products
Cronus TM Surgical stent graft system, the unique product adopted in China, maintained solid growth after launched for decade.
Castor TM Thoracic Branch Stent-Graft System granted Green-Path with 70 follow-up Clinical Trials completed
Reewarm TM PTX Drug balloon dilatation granted Green-Path
Extensive product pipeline ~ 17 products expected by 2019 across all sectors
Product Name
Castor Next Generation
TAA
多分支
Ultra-LP ReeWarm PTX(0.018) ReeWarm PTX(0.014)
ReeWarm(0.018) Drug PTX
Next Generation Surgical Stent
Q4 2016 Q1 2018
*
*
Q4 2018
*
*
*
Q2 2019
*
*
*
TAA AAA
Peripheral Surgical
USD:million Excl. FX USD:million Excl. FX
Sales growth by products
Highlights
Revenue
4 Neurovascular Business
16
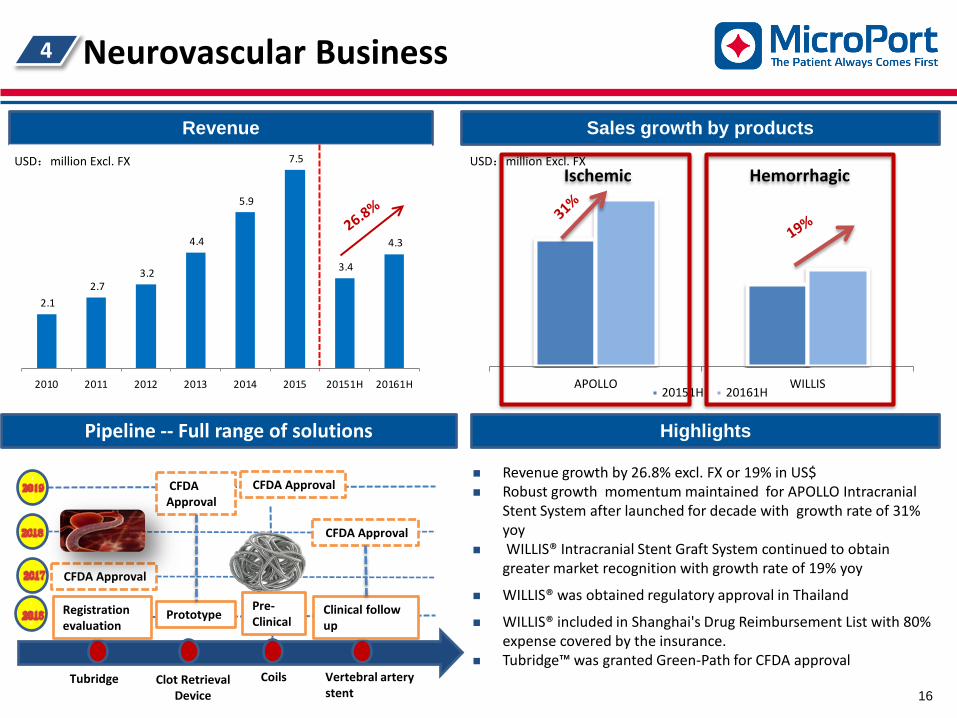
Revenue growth by 26.8% excl. FX or 19% in US$ Robust growth momentum maintained for APOLLO Intracranial
Stent System after launched for decade with growth rate of 31% yoy
WILLIS® Intracranial Stent Graft System continued to obtain greater market recognition with growth rate of 19% yoy
WILLIS® was obtained regulatory approval in Thailand
WILLIS® included in Shanghai's Drug Reimbursement List with 80% expense covered by the insurance.
Tubridge™ was granted Green-Path for CFDA approval
APOLLO WILLIS20151H 20161H
Hemorrhagic Ischemic
Pipeline -- Full range of solutions
Tubridge
2019
2019
CFDA Approval
Clinical follow up
CFDA Approval
Registration evaluation
Prototype
CFDA Approval
Pre-Clinical
Coils
CFDA Approval
Clot Retrieval Device
Vertebral artery stent
2.1 2.7
3.2
4.4
5.9
7.5
3.4
4.3
2010 2011 2012 2013 2014 2015 20151H 20161H
USD:million Excl. FX USD:million Excl. FX

5 Electrophysiology Business
17
Revenue Highlights
Full product portfolio & platform for the treatment of CA & AF
Soli
Sales Growth by Products
The only Chinese company to have 3-D Magnet Mapping System and full EP product line.
Revenue growth of 9.2% excl. FX or 2.4% in US$;
Columbus® and FireMagic ™ 3D Cool & Supercool obtained CFDA Approval
Totally 29 hospitals initiated coverage globally in 1H
EP business was approved by HKSE and the Board for quotation on NEEQ, which is expected to provide a good platform for financing and further development.
RF diagnostic catheter-quadrupole
diagnostic catheter-tenpole
20151H 20161H
0.2 0.8
1.5 2.8
3.9 5.0
2.2 2.4
0.6
0.6
0.3 0.3
2010 2011 2012 2013 2014 2015 20151H 20161H
International domestic
Total: 9.2% ↑ Domestic: 10.2% ↑
Overseas: 1.2% ↑
EasyLoop
20 pole
Variable Loop
EasyFinder
Steerable
3D DX
Columbus
Circular Ablation Catheter
Cryoablate
Introducer, Needle
Irrigation Pump
Cloud
CFDA Approved
CE Approved
Under development
Columbus 2.0
FireMagic
Irrigated 3D
Irrigated 2D
3D
66-hole3D
Bi-directional
Force
Renal Ablation System
RF Generator Stimulator
ECG Monitor
USD:million Excl. FX
USD:million Excl. FX

18
MicroPort Sorin CRM (MSC)
2014
创 新 起 搏
领 梦 中 国
What we do? • R&D • Made-in-China Product • Services
Who we are? • 51% Microport • 49% Sorin
Why we do it? • Demand in China • Know-how • break the monopoly How we do it? • Serving China • Made in China • Innovated in China
I N N O V A T E D I N
C H I N A , F O R C H I N A
Launched PRC’s first domestic cardiac pacemaker production line with international advanced standards in 2015
“Innovated-in-China” BonaFire® Pacing Lead completed first Implantation in FIM Clinical Trials of in May, 15 patients enrollment completed ahead of schedule
“Made-in-China” pacemaker submitted documents for CFDA registration approval
“Innovated-in-China” pacing analyzer finished Pre-clinical study , and ready to initiate Pre-marketing Clinical Trials
R&D Progress
Reply
Esprit
Reply 200

19
Others
R&D Progress of surgical robot keep on schedule
MicroPort® Online “Life-Line-Live ” was Launched to
connect doctors and patients to provide consultant
services
MicroPort® and Yizheng Municipal Government established
“Shanghai-Yizheng Healthcare Cooperation Project ” to
conduct remote consultation, real-time surgery instruction
and online training.
Online service platform "Life Line Live“ launched
2014
2015
2016
2017
2018
2019
2020
Project approval
Complete first generation prototype
Complete design verification Begin type testing
FIM CFDA Approval

*Appendix 1- Business Highlights
*Appendix 2- Financial Statements
Contents
1. Interim Results Highlights
2. Financial Review
3. Business Review
• Financial Statements
4. Appendix
Appendix I - Consolidated Income Statement
21
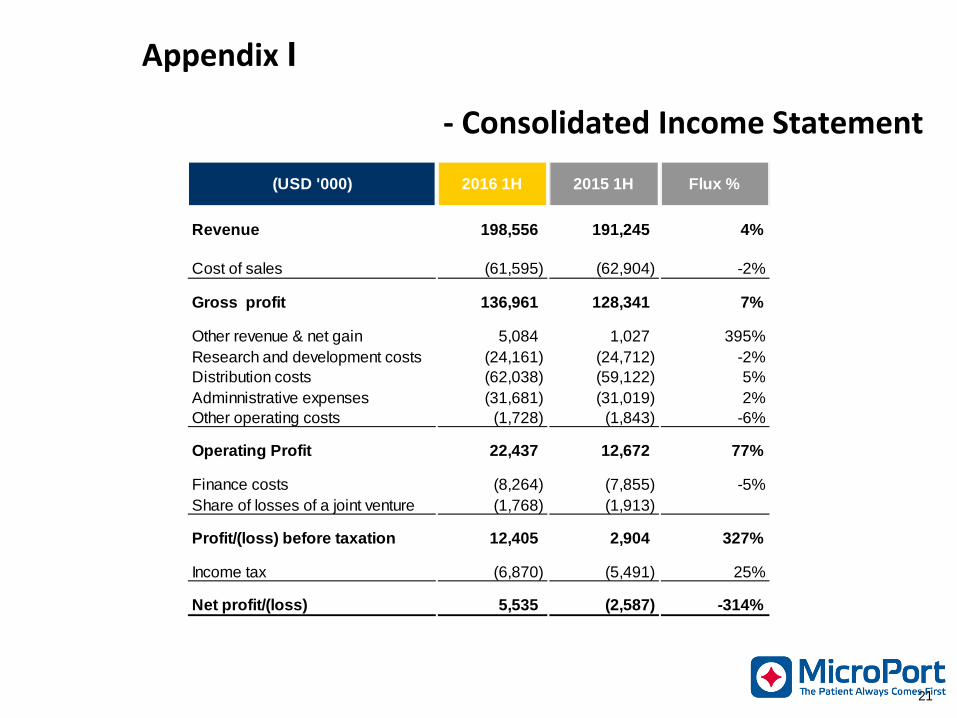
Revenue 198,556 191,245 4%
Cost of sales (61,595) (62,904) -2%
Gross profit 136,961 128,341 7%
Other revenue & net gain 5,084 1,027 395%Research and development costs (24,161) (24,712) -2%Distribution costs (62,038) (59,122) 5%Adminnistrative expenses (31,681) (31,019) 2%Other operating costs (1,728) (1,843) -6%
Operating Profit 22,437 12,672 77%
Finance costs (8,264) (7,855) -5%Share of losses of a joint venture (1,768) (1,913)
Profit/(loss) before taxation 12,405 2,904 327%
Income tax (6,870) (5,491) 25%
Net profit/(loss) 5,535 (2,587) -314%
(USD '000) 2016 1H Flux %2015 1H

Appendix II
- Consolidated Balance Sheet
22
30 Jun 2016 31 Dec 2015Fixed assets 267,842 271,203 Intangible assets 63,440 60,217 Prepayments for fix assets 3,378 2,711 Goodwill 54,458 55,463 Interest in a joint venture 2,917 4,759 Deferred tax assets 3,669 3,711 Time deposits - - Other non-current assets 3,441 4,339 Total non-current assets 399,145 402,403
Inventories 103,601 101,840 Trade and other receivables 139,624 126,957 Time deposits 9,197 2,976 Cash and cash equivalents 129,102 99,467 Total current assets 381,524 331,240
Total assets 780,669 733,643
Trade and other payables (88,181) (99,418) Interest-bearing borrowings (104,461) (55,086) Income tax payable (4,839) (1,226) Deferred income (3) (5) Derivative financial liabilities (50) (397) Obligation under finance leases (415) (1,209) Other current liabilities (7,286) (7,260) Total current liabilities (205,235) (164,601)
Interest-bearing borrowings (51,543) (129,374) Convertible bonds (145,001) (94,815) Obligation under finance leases (68) (33) Deferred income (31,708) (22,086) Other payables (2,051) (1,541) Other non-current liabilities - - Deferred tax liabilities (3,573) (3,365) Total liabilities (439,179) (415,815)
Share capital (14) (14) Reserves (334,747) (312,505) Non controlling interests (6,729) (5,309) Total equity (341,490) (317,828)
USD'000

Appendix III
* Adjusted net uplift 6 million of time deposits over 3 month (2015 1H: 10 million net placement ) in to cash and cash equivalents.
- Condensed Consolidated Cash Flow Statement - Adjusted
23
Cash generate from operations 38,104 14,476 163%
Income tax paid (2,381) (2,221) 7%
Net cash generated from operating activities 35,723 12,255 191%
Net cash (used in)/from investing activities* (29,042) (21,485) 35%
Net cash generated in financing activities 30,435 (146,272) -121%
Net decrease in cash and cash equivalent 37,116 (155,502) -124%
Cash and cash equivalents at 1 January 102,443 287,721 -64%
Effect of foreign exchange rate changes (1,260) (882) 43%
Cash and cash equivalents at 30 June 138,299 131,337 5%
(USD '000) Flux %2016 1H 2015 1H

Thank You The Patient Always Comes First