Embed Size (px)
Citation preview
microReportTH
E
M I C R O M E R I T I C S I N S T R U M E N T C O R P O R A T I O N VOLUME 14 NO. 1
The Science and Technology of Small Particles™
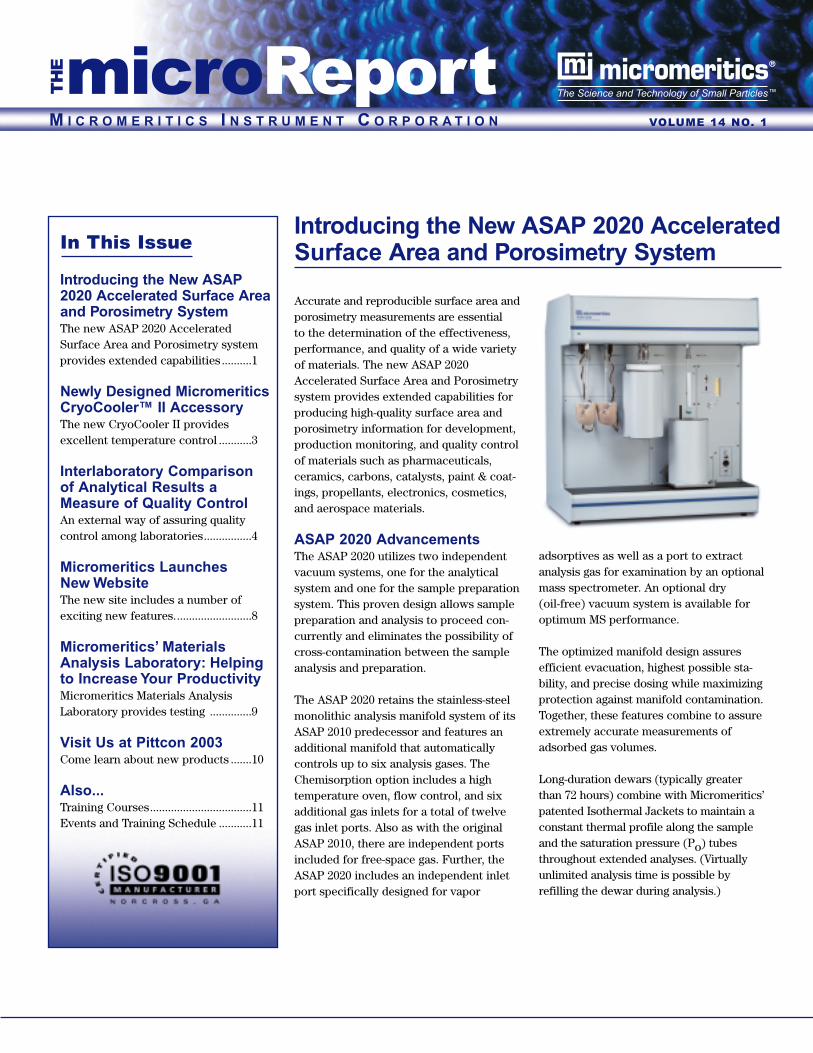
Accurate and reproducible surface area andporosimetry measurements are essential to the determination of the effectiveness,performance, and quality of a wide varietyof materials. The new ASAP 2020Accelerated Surface Area and Porosimetrysystem provides extended capabilities forproducing high-quality surface area andporosimetry information for development,production monitoring, and quality controlof materials such as pharmaceuticals,ceramics, carbons, catalysts, paint & coat-ings, propellants, electronics, cosmetics,and aerospace materials.
ASAP 2020 AdvancementsThe ASAP 2020 utilizes two independentvacuum systems, one for the analyticalsystem and one for the sample preparationsystem. This proven design allows samplepreparation and analysis to proceed con-currently and eliminates the possibility ofcross-contamination between the sampleanalysis and preparation.
The ASAP 2020 retains the stainless-steelmonolithic analysis manifold system of itsASAP 2010 predecessor and features anadditional manifold that automaticallycontrols up to six analysis gases. TheChemisorption option includes a high temperature oven, flow control, and sixadditional gas inlets for a total of twelvegas inlet ports. Also as with the originalASAP 2010, there are independent portsincluded for free-space gas. Further, theASAP 2020 includes an independent inletport specifically designed for vapor
Introducing the New ASAP 2020 AcceleratedSurface Area and Porosimetry System
adsorptives as well as a port to extractanalysis gas for examination by an optionalmass spectrometer. An optional dry (oil-free) vacuum system is available foroptimum MS performance.
The optimized manifold design assuresefficient evacuation, highest possible sta-bility, and precise dosing while maximizingprotection against manifold contamination.Together, these features combine to assureextremely accurate measurements ofadsorbed gas volumes.
Long-duration dewars (typically greaterthan 72 hours) combine with Micromeritics’patented Isothermal Jackets to maintain aconstant thermal profile along the sampleand the saturation pressure (Po) tubesthroughout extended analyses. (Virtuallyunlimited analysis time is possible by refilling the dewar during analysis.)
In This Issue
Introducing the New ASAP2020 Accelerated Surface Areaand Porosimetry SystemThe new ASAP 2020 AcceleratedSurface Area and Porosimetry systemprovides extended capabilities ..........1
Newly Designed MicromeriticsCryoCooler™ II AccessoryThe new CryoCooler II provides excellent temperature control ...........3
Interlaboratory Comparisonof Analytical Results aMeasure of Quality ControlAn external way of assuring qualitycontrol among laboratories................4
Micromeritics Launches New WebsiteThe new site includes a number ofexciting new features..........................8
Micromeritics’ MaterialsAnalysis Laboratory: Helping to Increase Your ProductivityMicromeritics Materials AnalysisLaboratory provides testing ..............9
Visit Us at Pittcon 2003Come learn about new products .......10
Also...Training Courses..................................11Events and Training Schedule ...........11
2
(ASAP 2020 Cont.)
Available Options
Some of the new options available with the ASAP 2020 include an Enhanced ChemicalResistance Option for use with aggressive gases or vapors as the adsorptive, a water vaporreservoir accessory for use with water vapor experiments, a dry vacuum system for use witha mass spectrometer; and a stand-alone sample preparation system.
VOL 14 NO 1
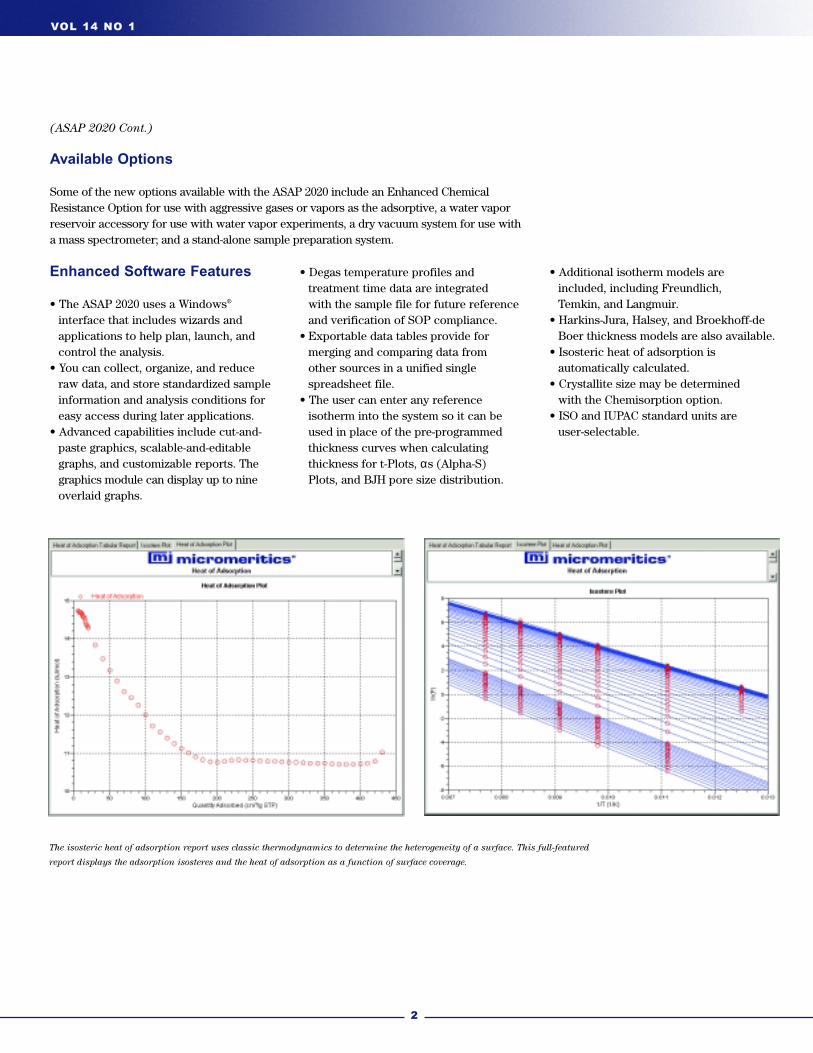
The isosteric heat of adsorption report uses classic thermodynamics to determine the heterogeneity of a surface. This full-featured
report displays the adsorption isosteres and the heat of adsorption as a function of surface coverage.
Enhanced Software Features
• The ASAP 2020 uses a Windows®
interface that includes wizards and applications to help plan, launch, and control the analysis.
• You can collect, organize, and reduce raw data, and store standardized sample information and analysis conditions for easy access during later applications.
• Advanced capabilities include cut-and-paste graphics, scalable-and-editable graphs, and customizable reports. The graphics module can display up to nine overlaid graphs.
• Degas temperature profiles and treatment time data are integrated with the sample file for future reference and verification of SOP compliance.
• Exportable data tables provide for merging and comparing data from other sources in a unified single spreadsheet file.
• The user can enter any reference isotherm into the system so it can be used in place of the pre-programmed thickness curves when calculating thickness for t-Plots, αs (Alpha-S) Plots, and BJH pore size distribution.
• Additional isotherm models are included, including Freundlich, Temkin, and Langmuir.
• Harkins-Jura, Halsey, and Broekhoff-de Boer thickness models are also available.
• Isosteric heat of adsorption is automatically calculated.
• Crystallite size may be determined with the Chemisorption option.
• ISO and IUPAC standard units are user-selectable.
3
VOL 14 NO 1
Newly DesignedMicromeritics CryoCooler™ II Accessory
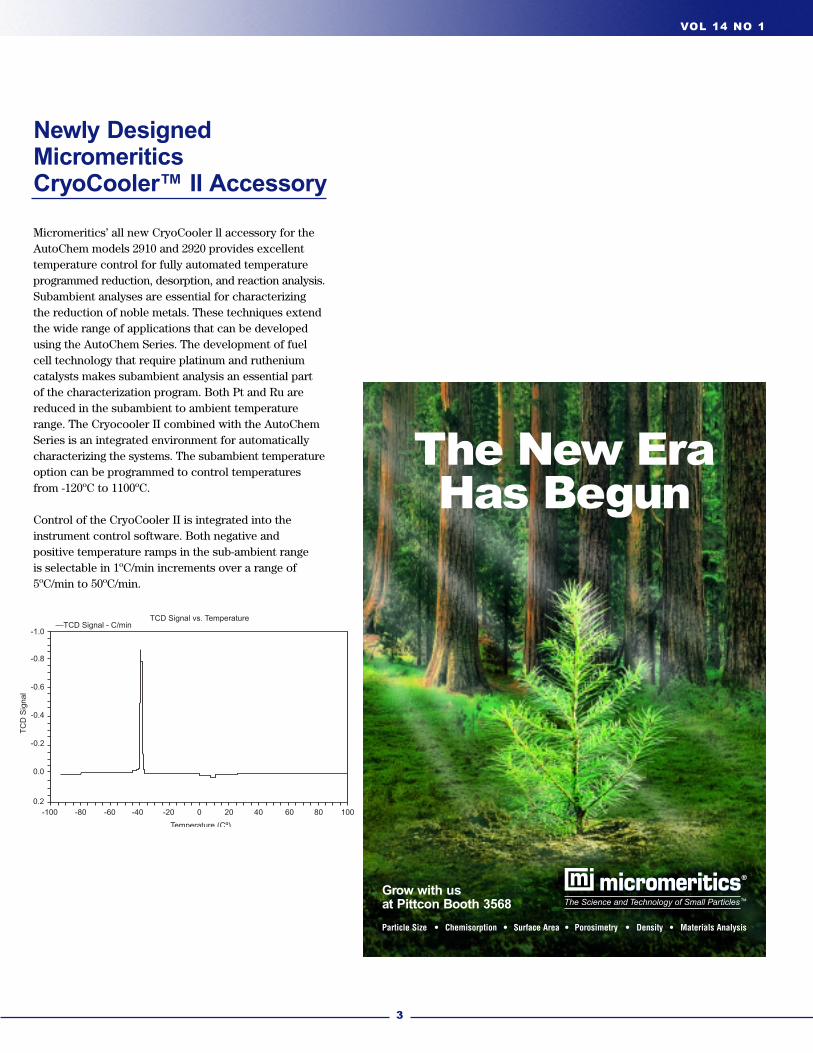
Micromeritics’ all new CryoCooler ll accessory for theAutoChem models 2910 and 2920 provides excellenttemperature control for fully automated temperatureprogrammed reduction, desorption, and reaction analysis.Subambient analyses are essential for characterizingthe reduction of noble metals. These techniques extendthe wide range of applications that can be developedusing the AutoChem Series. The development of fuelcell technology that require platinum and rutheniumcatalysts makes subambient analysis an essential partof the characterization program. Both Pt and Ru arereduced in the subambient to ambient temperaturerange. The Cryocooler II combined with the AutoChemSeries is an integrated environment for automatically characterizing the systems. The subambient temperatureoption can be programmed to control temperaturesfrom -120ºC to 1100ºC.
Control of the CryoCooler II is integrated into theinstrument control software. Both negative and positive temperature ramps in the sub-ambient range is selectable in 1ºC/min increments over a range of5ºC/min to 50ºC/min.
TCD Signal vs. Temperature
Temperature (Cº)
—TCD Signal - C/min-1.0
-0.8
-0.6
-0.4
-0.2
0.0
0.2-100 -80 -60 -40 -20 0 20 40 60 80 100
TC
D S
igna
l
The New EraHas Begun
Grow with usat Pittcon Booth 3568
Particle Size • Chemisorption • Surface Area • Porosimetry • Density • Materials Analysis
By Engª Conceição Fonseca, Dra. Rosário Amaral and Rui Lucas of CTCV – Technological Centre of Ceramic and Glass – Coimbra - Portugal
Interlaboratory Comparison of AnalyticalResults a Measure of Quality Control
4
VOL 14 NO 1
An Interlaboratory Comparison is anexternal way of assuring quality controlamong laboratories. It allows the partici-pants to detect unsuspected errors and deficiencies in their methodology. Recently,the Technological Centre of Ceramic andGlass (CTCV) in Portugal conducted aninterlaboratory comparison among eightlaboratories that employ the granulometricanalysis technique. Each laboratory wasasked to submit results of analysis of silicaflour performed with the MicromeriticsSediGraph™ 5100. The results were calculated by CTCV according to ISO 5725– Part 2 standard, and the z-score to deter-mine the testing performance of each participant laboratory.
Granulometric analysis is a technique for characterizing pulverized materials and is applied to the determination of theparticle size distribution of a wide range ofmaterials. Granulometric analysis by X–raysedimentation is a technique based on themeasurement of the sedimentation velocityof particles dispersed in a fluid that allows,by Stokes’ law, the calculation of the diameterof the sphere with the same sedimentationspeed of the particle. What is obtained isnot a geometrical diameter, rather a hydro-dynamical or equivalent spherical diameter.
This is known as Stokes diameter, which isthe diameter of a sphere whose characteristicproperty has the same value as that of theparticle being tested. [1]
The equipment used in this interlaboratorycomparison was Micromeritics’ SediGraph5100. The sedimentation technique using theSediGraph is an incremental technique andis based in the study of the concentrationchange with time in a zone of measurementdescribed by its depth in the sedimentationcell. At time zero, the suspension is homo-geneous and the concentration is 100%. At any time later, the relative concentration(when compared with the concentration at time zero) is equal to the cumulative massfraction smaller than the Stokes diametercalculated for the smallest particle that couldhave settled below the measurement zone.
The measure of the mass distribution of particle size in the cell containing the suspension is determined using a source of X–Ray of low energy and a suitabledetector. The X–Ray source and the detectorremain stationary while the cell moves vertically between them subjecting differentmeasuring zones to the X-Ray.
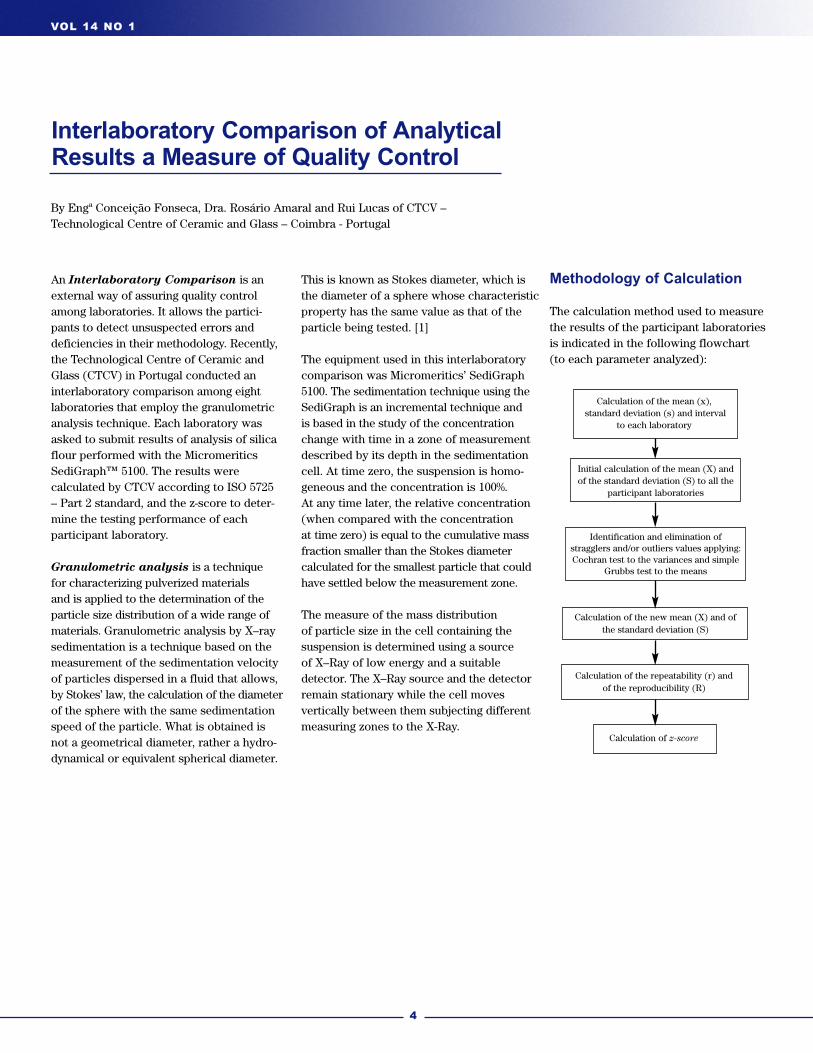
Calculation of the mean (x),standard deviation (s) and interval
to each laboratory
Initial calculation of the mean (X) andof the standard deviation (S) to all the
participant laboratories
Identification and elimination of stragglers and/or outliers values applying:Cochran test to the variances and simple
Grubbs test to the means
Calculation of the new mean (X) and ofthe standard deviation (S)
Calculation of the repeatability (r) and of the reproducibility (R)
Calculation of z-score
Methodology of Calculation
The calculation method used to measurethe results of the participant laboratories is indicated in the following flowchart (to each parameter analyzed):
5
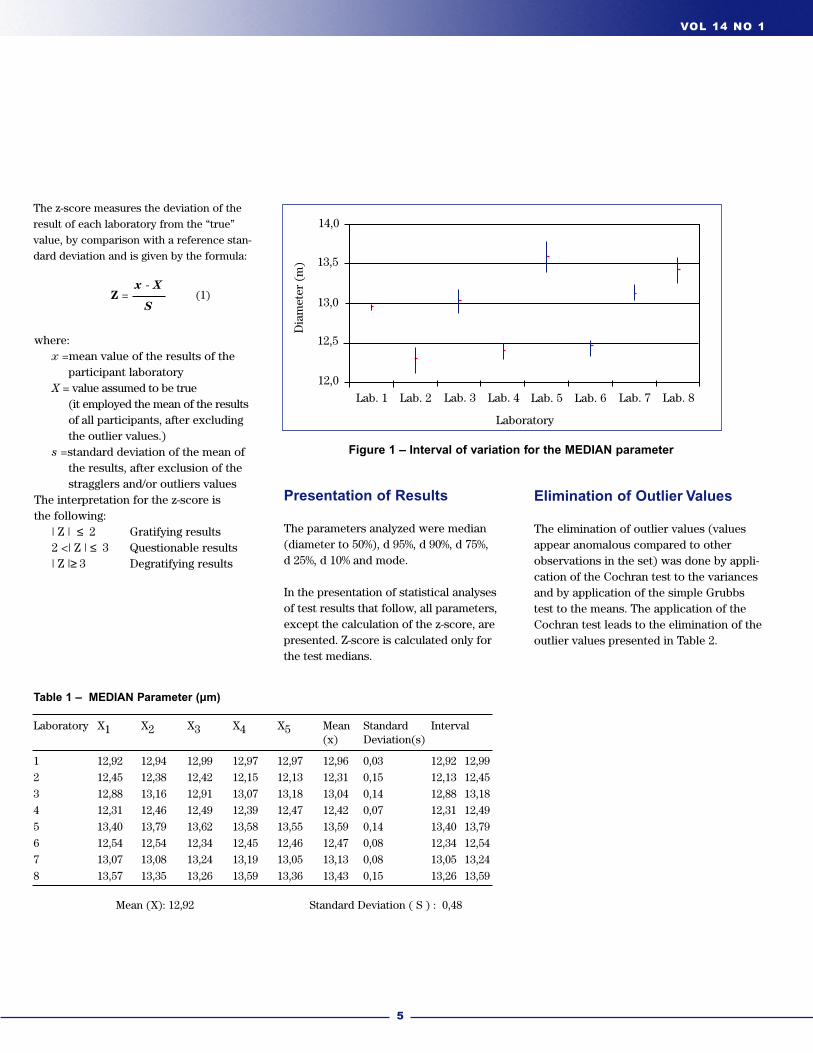
The z-score measures the deviation of theresult of each laboratory from the “true”value, by comparison with a reference stan-dard deviation and is given by the formula:
(1)
VOL 14 NO 1
Z =x - X
S
Table 1 – MEDIAN Parameter (µm)
Laboratory X1 X2 X3 X4 X5 Mean Standard Interval(x) Deviation(s)
1 12,92 12,94 12,99 12,97 12,97 12,96 0,03 12,92 12,99
2 12,45 12,38 12,42 12,15 12,13 12,31 0,15 12,13 12,45
3 12,88 13,16 12,91 13,07 13,18 13,04 0,14 12,88 13,18
4 12,31 12,46 12,49 12,39 12,47 12,42 0,07 12,31 12,49
5 13,40 13,79 13,62 13,58 13,55 13,59 0,14 13,40 13,79
6 12,54 12,54 12,34 12,45 12,46 12,47 0,08 12,34 12,54
7 13,07 13,08 13,24 13,19 13,05 13,13 0,08 13,05 13,24
8 13,57 13,35 13,26 13,59 13,36 13,43 0,15 13,26 13,59
Mean (X): 12,92 Standard Deviation ( S ) : 0,48
where:x =mean value of the results of the
participant laboratoryX = value assumed to be true
(it employed the mean of the results of all participants, after excluding the outlier values.)
s =standard deviation of the mean of the results, after exclusion of the stragglers and/or outliers values
The interpretation for the z-score is the following:
| Z | ≤ 2 Gratifying results2 <| Z | ≤ 3 Questionable results| Z |≥ 3 Degratifying results
14,0
13,5
13,0
12,5
12,0
Lab. 1 Lab. 2 Lab. 3 Lab. 4 Lab. 5 Lab. 6 Lab. 7 Lab. 8
Laboratory
Dia
met
er (
m)
Figure 1 – Interval of variation for the MEDIAN parameter
Presentation of Results
The parameters analyzed were median(diameter to 50%), d 95%, d 90%, d 75%, d 25%, d 10% and mode.
In the presentation of statistical analyses of test results that follow, all parameters,except the calculation of the z-score, arepresented. Z-score is calculated only for the test medians.
Elimination of Outlier Values
The elimination of outlier values (valuesappear anomalous compared to otherobservations in the set) was done by appli-cation of the Cochran test to the variancesand by application of the simple Grubbstest to the means. The application of theCochran test leads to the elimination of theoutlier values presented in Table 2.
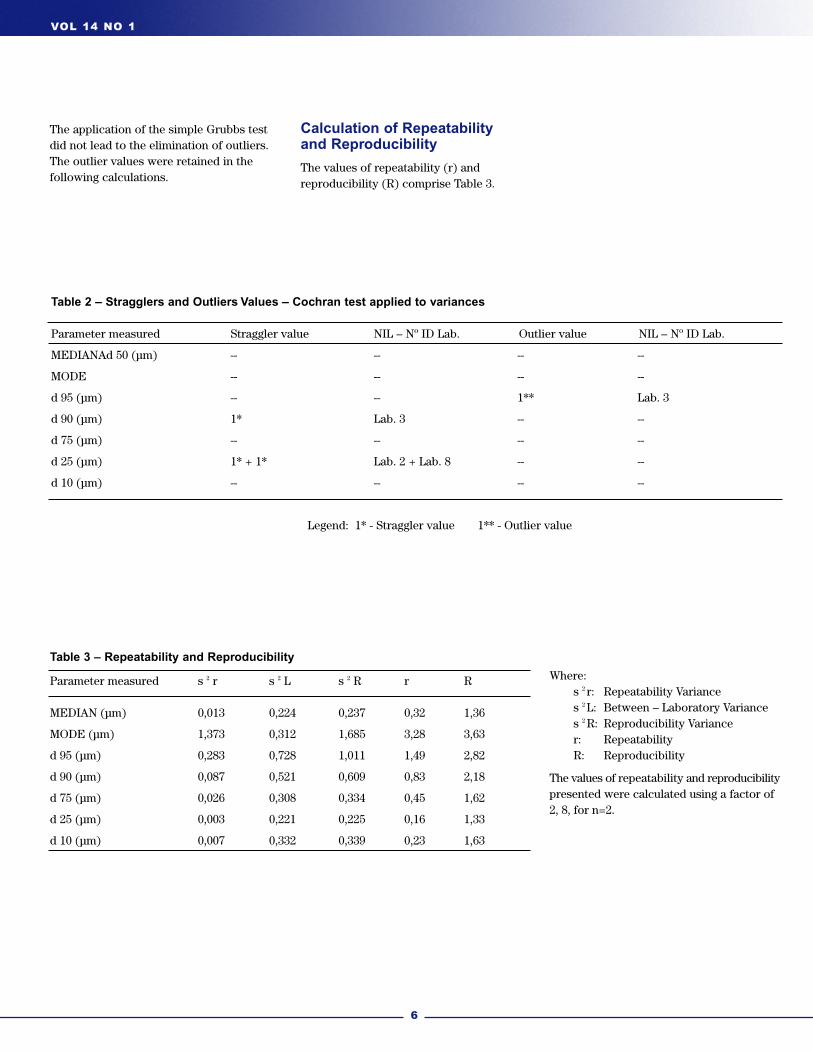
Table 3 – Repeatability and Reproducibility
Parameter measured s 2 r s 2 L s 2 R r R
MEDIAN (µm) 0,013 0,224 0,237 0,32 1,36
MODE (µm) 1,373 0,312 1,685 3,28 3,63
d 95 (µm) 0,283 0,728 1,011 1,49 2,82
d 90 (µm) 0,087 0,521 0,609 0,83 2,18
d 75 (µm) 0,026 0,308 0,334 0,45 1,62
d 25 (µm) 0,003 0,221 0,225 0,16 1,33
d 10 (µm) 0,007 0,332 0,339 0,23 1,63
6
VOL 14 NO 1
Table 2 – Stragglers and Outliers Values – Cochran test applied to variances
Parameter measured Straggler value NIL – Nº ID Lab. Outlier value NIL – Nº ID Lab.
MEDIANAd 50 (µm) -- -- -- --
MODE -- -- -- --
d 95 (µm) -- -- 1** Lab. 3
d 90 (µm) 1* Lab. 3 -- --
d 75 (µm) -- -- -- --
d 25 (µm) 1* + 1* Lab. 2 + Lab. 8 -- --
d 10 (µm) -- -- -- --
Legend: 1* - Straggler value 1** - Outlier value
The application of the simple Grubbs testdid not lead to the elimination of outliers. The outlier values were retained in the following calculations.
Where:s 2 r: Repeatability Variances 2 L: Between – Laboratory Variances 2 R: Reproducibility Variancer: RepeatabilityR: Reproducibility
The values of repeatability and reproducibilitypresented were calculated using a factor of2, 8, for n=2.
Calculation of Repeatability and Reproducibility
The values of repeatability (r) and reproducibility (R) comprise Table 3.
7
VOL 14 NO 1
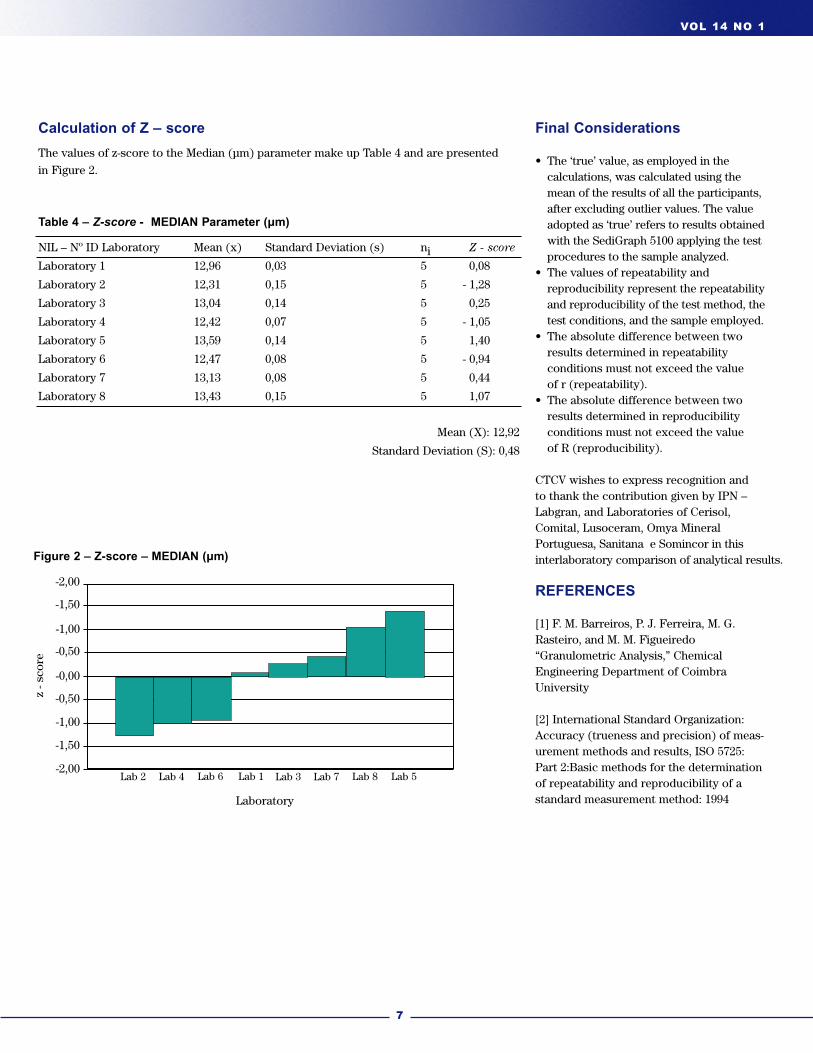
Calculation of Z – score
The values of z-score to the Median (µm) parameter make up Table 4 and are presented
in Figure 2.
Table 4 – Z-score - MEDIAN Parameter (µm)
NIL – Nº ID Laboratory Mean (x) Standard Deviation (s) ni Z - score
Laboratory 1 12,96 0,03 5 0,08
Laboratory 2 12,31 0,15 5 - 1,28
Laboratory 3 13,04 0,14 5 0,25
Laboratory 4 12,42 0,07 5 - 1,05
Laboratory 5 13,59 0,14 5 1,40
Laboratory 6 12,47 0,08 5 - 0,94
Laboratory 7 13,13 0,08 5 0,44
Laboratory 8 13,43 0,15 5 1,07
Mean (X): 12,92
Standard Deviation (S): 0,48
Lab 2 Lab 4 Lab 6 Lab 1 Lab 3 Lab 7 Lab 8 Lab 5
Laboratory
z - s
core
-2,00
-1,50
-1,00
-0,50
-0,00
-0,50
-1,00
-1,50
-2,00
Figure 2 – Z-score – MEDIAN (µm)
Final Considerations
• The ‘true’ value, as employed in the calculations, was calculated using the mean of the results of all the participants, after excluding outlier values. The value adopted as ‘true’ refers to results obtainedwith the SediGraph 5100 applying the test procedures to the sample analyzed.
• The values of repeatability and reproducibility represent the repeatabilityand reproducibility of the test method, thetest conditions, and the sample employed.
• The absolute difference between two results determined in repeatability conditions must not exceed the value of r (repeatability).
• The absolute difference between two results determined in reproducibility conditions must not exceed the value of R (reproducibility).
CTCV wishes to express recognition and to thank the contribution given by IPN –Labgran, and Laboratories of Cerisol,Comital, Lusoceram, Omya MineralPortuguesa, Sanitana e Somincor in thisinterlaboratory comparison of analytical results.
REFERENCES
[1] F. M. Barreiros, P. J. Ferreira, M. G.Rasteiro, and M. M. Figueiredo“Granulometric Analysis,” ChemicalEngineering Department of CoimbraUniversity
[2] International Standard Organization:Accuracy (trueness and precision) of meas-urement methods and results, ISO 5725:Part 2:Basic methods for the determinationof repeatability and reproducibility of astandard measurement method: 1994
8
VOL 14 NO 1
Micromeritics has recently redesigned its website! The new site includes a number of features to make it easy for you to get the information you are seeking.
Dynamic pull-out menus allow you to navigate the site easily and quickly and get the information you are looking for. You can find detailed information about our products, our company, and the services we provide. You can submit questions to our service staff andorder accessory parts for your Micromeritics instrument. New application notes and technical articles have been added, and others will be continually added on a regular basis.
Software updates are available for download. The latest Material Data Safety Sheets (MSDS) are accessible, as well as information about service agreements and training courses.
You can sign up to get the electronic version of the MicroReport, as well as updates from Micromeritics.
The website is a resource that provides information about our company, our products, and the services we offer. Please visitwww.micromeritics.com or www.smallparticles.com to explore the new site.
Micromeritics Launches New Website
9
VOL 14 NO 1
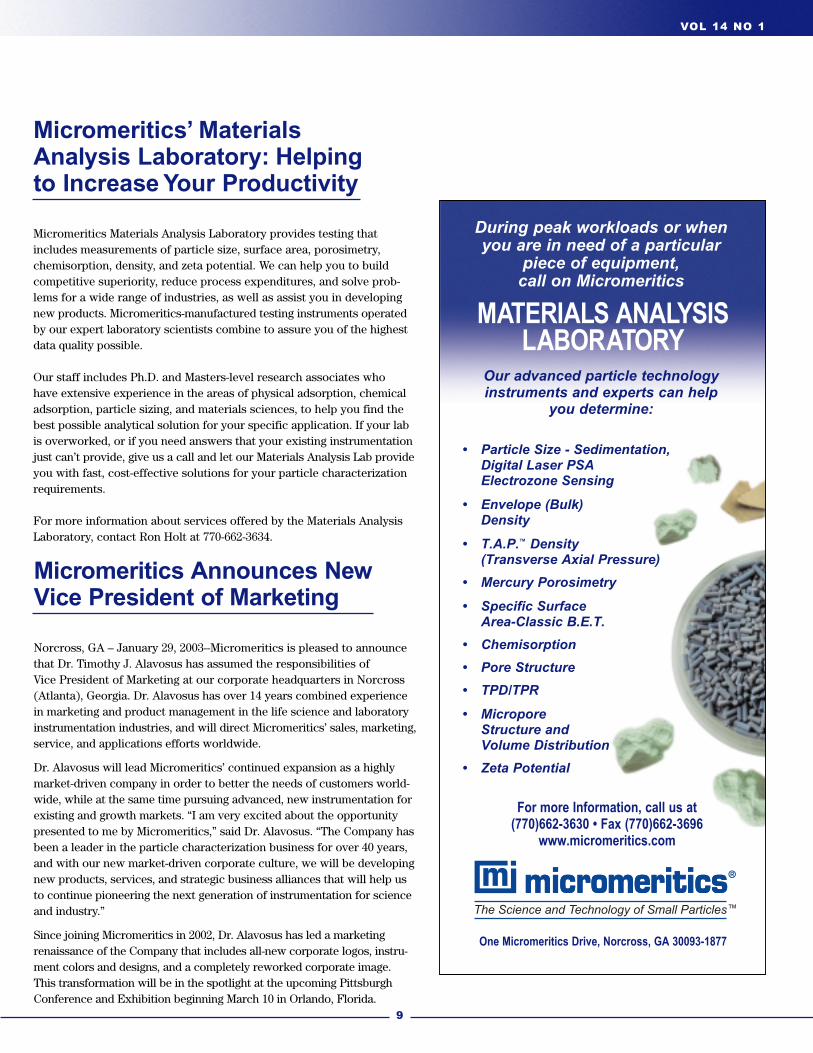
During peak workloads or whenyou are in need of a particular
piece of equipment, call on Micromeritics
MATERIALS ANALYSISLABORATORY
Our advanced particle technologyinstruments and experts can help
you determine:
• Particle Size - Sedimentation, Digital Laser PSAElectrozone Sensing
• Envelope (Bulk)Density
• T.A.P.™ Density(Transverse Axial Pressure)
• Mercury Porosimetry
• Specific SurfaceArea-Classic B.E.T.
• Chemisorption
• Pore Structure
• TPD/TPR
• MicroporeStructure andVolume Distribution
• Zeta Potential
For more Information, call us at(770)662-3630 • Fax (770)662-3696
www.micromeritics.com
The Science and Technology of Small Particles™
One Micromeritics Drive, Norcross, GA 30093-1877
Micromeritics’ MaterialsAnalysis Laboratory: Helping to Increase Your Productivity
Micromeritics Materials Analysis Laboratory provides testing thatincludes measurements of particle size, surface area, porosimetry,chemisorption, density, and zeta potential. We can help you to buildcompetitive superiority, reduce process expenditures, and solve prob-lems for a wide range of industries, as well as assist you in developingnew products. Micromeritics-manufactured testing instruments operatedby our expert laboratory scientists combine to assure you of the highestdata quality possible.
Our staff includes Ph.D. and Masters-level research associates who have extensive experience in the areas of physical adsorption, chemicaladsorption, particle sizing, and materials sciences, to help you find thebest possible analytical solution for your specific application. If your labis overworked, or if you need answers that your existing instrumentationjust can’t provide, give us a call and let our Materials Analysis Lab provideyou with fast, cost-effective solutions for your particle characterizationrequirements.
For more information about services offered by the Materials AnalysisLaboratory, contact Ron Holt at 770-662-3634.
Norcross, GA – January 29, 2003--Micromeritics is pleased to announcethat Dr. Timothy J. Alavosus has assumed the responsibilities of Vice President of Marketing at our corporate headquarters in Norcross(Atlanta), Georgia. Dr. Alavosus has over 14 years combined experiencein marketing and product management in the life science and laboratoryinstrumentation industries, and will direct Micromeritics’ sales, marketing,service, and applications efforts worldwide.
Dr. Alavosus will lead Micromeritics’ continued expansion as a highlymarket-driven company in order to better the needs of customers world-wide, while at the same time pursuing advanced, new instrumentation forexisting and growth markets. “I am very excited about the opportunitypresented to me by Micromeritics,” said Dr. Alavosus. “The Company hasbeen a leader in the particle characterization business for over 40 years,and with our new market-driven corporate culture, we will be developingnew products, services, and strategic business alliances that will help usto continue pioneering the next generation of instrumentation for scienceand industry.”
Since joining Micromeritics in 2002, Dr. Alavosus has led a marketing renaissance of the Company that includes all-new corporate logos, instru-ment colors and designs, and a completely reworked corporate image. This transformation will be in the spotlight at the upcoming PittsburghConference and Exhibition beginning March 10 in Orlando, Florida.
Micromeritics Announces NewVice President of Marketing
10
VOL 14 NO 1
Come learn about these great new products:
VISIT US AT PITTCON 2003
March 10-13, Orlando, Florida
Micromeritics will be introducing several new products at The PittsburghConference and Exhibition. Pittcon is the world’s premier annual conferencedevoted to laboratory science and instrumentation. The conference attracts25,000-35,000 conferees and exhibitors from more than 120 countries.
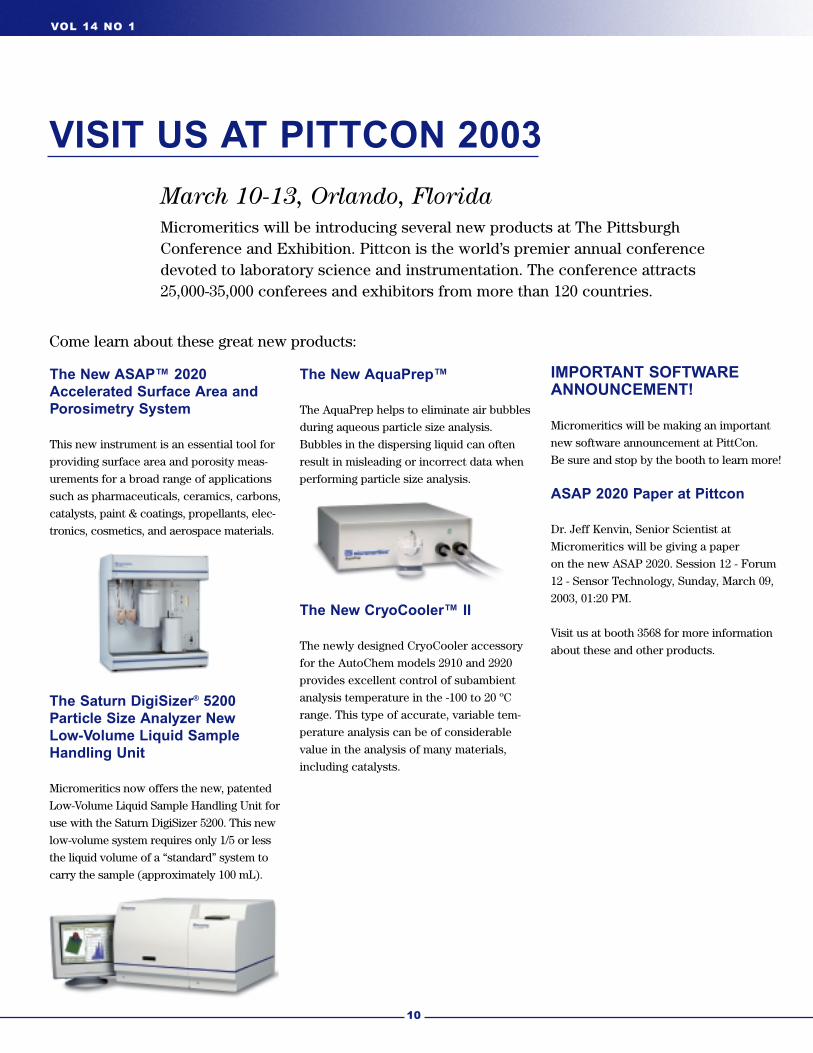
The New ASAP™ 2020Accelerated Surface Area andPorosimetry System
This new instrument is an essential tool for
providing surface area and porosity meas-
urements for a broad range of applications
such as pharmaceuticals, ceramics, carbons,
catalysts, paint & coatings, propellants, elec-
tronics, cosmetics, and aerospace materials.
The Saturn DigiSizer® 5200Particle Size Analyzer New Low-Volume Liquid SampleHandling Unit
Micromeritics now offers the new, patented
Low-Volume Liquid Sample Handling Unit for
use with the Saturn DigiSizer 5200. This new
low-volume system requires only 1/5 or less
the liquid volume of a “standard” system to
carry the sample (approximately 100 mL).
The New AquaPrep™
The AquaPrep helps to eliminate air bubbles
during aqueous particle size analysis.
Bubbles in the dispersing liquid can often
result in misleading or incorrect data when
performing particle size analysis.
IMPORTANT SOFTWAREANNOUNCEMENT!
Micromeritics will be making an important
new software announcement at PittCon.
Be sure and stop by the booth to learn more!
ASAP 2020 Paper at Pittcon
Dr. Jeff Kenvin, Senior Scientist at
Micromeritics will be giving a paper
on the new ASAP 2020. Session 12 - Forum
12 - Sensor Technology, Sunday, March 09,
2003, 01:20 PM.
Visit us at booth 3568 for more information
about these and other products.
The New CryoCooler™ II
The newly designed CryoCooler accessory
for the AutoChem models 2910 and 2920
provides excellent control of subambient
analysis temperature in the -100 to 20 ºC
range. This type of accurate, variable tem-
perature analysis can be of considerable
value in the analysis of many materials,
including catalysts.

11
VOL 14 NO 1
Events
Cocoa Beach Conference and
Exposition (Ceramics)
January 26, 2003 - January 31, 2003Hilton Cocoa BeachCocoa Beach, FL
Western Coatings Society Symposium
February 17, 2003 - February 19, 2003Nugget Resort HotelSparks , NV
Pittcon 2003
March 10, 2003 - March 13, 2003Orange County Convention CenterOrlando, FL
Micromeritics Instrument Training Courses
Training
AutoChem II 2920
April 22-24, September 9-11
Gemini
March 18-19, September 16-17
SediGraph 5100
April 1-3, November 4-6
AutoPore IV
April 8-10, October 7-9
ASAP 2020 Chemisorption
June 10-12, November 11-13
ASAP 2020 Physisorption
June 3-5, November 11-13
TriStar 3000
March 25-27, August 26-28
Training is provided for most Micromeriticsinstrumentation at the time of installation. This training presents all the informationrequired for a new operator to begin quicklyproficient operation. However in somecases where personnel changes occur or more advanced training is required,Micromeritics conducts a variety of classesfor many of our instruments. These coursesare held at our headquarters in suburbanAtlanta, Georgia.
The courses include:
Detailed Operational ProceduresItems covered are effective sample file creation, use of analysis parameters, andmanual sample entry. You´ll learn how toutilize the full power and flexibility of theoperating software.
Automatic AnalysisDevelop correct analysis procedures to optimize collection of accurate, repro-ducible data. Much of the class time isspent performing analyses in a controlled,tutorial environment.
Systems UtilitiesDiscover all of the instrument software utilities which help you manage sampleinformation files and directories, protectdata, and select system options.
Report Generation andComprehensionLearn to configure reports flexibly and obtainmore useful information, as well as improvecomprehension of the reports produced.
User MaintenancePractice routine maintenance procedureswhich improve operation, reduce down-time, and increase data accuracy.
TroubleshootingLearn techniques that enable you to quicklylocate and resolve instrument problems. Again, emphasis is placed on practicingthese techniques on instruments in theMicromeritics Training Laboratory.
Theory OverviewLearn about the scientific theory uponwhich each instrument is based and how it applies to the critical factors relevant to successful sample preparation and analysis performance.
ENROLLMENT
Training courses last from 2 to 3 days andare designed to provide hands-on, perform-ance-based instrument knowledge. Smallclasses guarantee close individual attention.Included in the course materials are a StudyGuide, an instrument Operator´s Manual,and other handout materials. Certificates ofCompletion are also awarded to all trainees.
For additional information or to register for the class of your choice, contact theMicromeritics Training Department at770.662.3607. Early registration is recommended since class space is limited.
American Chemical Society 2003
March 24, 2003 - March 26, 2003Morial Convention CenterNew Orleans, LA
Interphex
March 31, 2003 - April 2, 2003Jacob K. Javits Convention CenterNew York, NY
AAPS Workshop on Particle Size
Analysis
April 30, 2003 - May 2, 2003Crystal Gateway MarriottArlington, VA
Micromeritics GmbH
Erftstrasse 54D-41238 Mönchengladbach GERMANYTelephone (+49) (0)2166-98708-0Fax (+49) (0)2166-98708-88
Micromeritics Ltd.
Unit 2, Chestnut House178-182 High Street NorthDunstable, Bedfordshire LU6 1AT ENGLANDTelephone (+44) (0)1582-475248Fax (+44) (0)1582-475252
Micromeritics N.V./S.A.
Eugene Plaskylaan 140B1030 Brussels BELGIUMTelephone (+32) (0)2-743-39-74Fax (+32) (0)2-743-39-79
Micromeritics SRL
Via W. Tobagi n. 26/720068 Peschiera BorromeoMilano ITALYTelephone (+39) (0)2 553 02833Fax (+39) (0)2 553 02843
Micromeritics Instrument Corporation
One Micromeritics DriveNorcross, GA 30093-1877 USATelephones:Domestic Sales (770) 662-3633International Sales (770) 662-3660Fax (770) 662-3696WEB: www.micromeritics.com
SUBSIDIARIES:Micromeritics China
Apt. 5H, No. 1 BuildingHua-Ao (Epoch Center)No. 31 Zi Zhu Yuan Road, Hai Dian DistrictBeijing 100089, P.R. CHINATelephone (+86) (0)10-6848-9371Fax (+86) (0)10-6848-9371
Micromeritics France
181, rue Henri BessemerF-60100 Creil FRANCETelephone (+33) (0)3-4464-6080Fax (+33) (0)3-4464-6089
HEADQUARTERS:
We welcome articles and information concerning particle technology applicationsperformed with Micromeritics instrumenta-tion. Everything from a single plot withoperating conditions to an in-depth articleon physisorption, chemisorption, etc. with supporting plots will be considered. If yourmaterial is published in The microReport,you will receive a copy of Analytical
Methods in Fine Particle Technology byPaul A. Webb and Clyde Orr.All text should be typed and limited to 1500words. Plots, graphs, and diagrams shouldbe clear and legible. Laurel Whitmire, EditorThe microReportMICROMERITICSOne Micromeritics DriveNorcross, GA 30093-1877of email [email protected]
Include your title, return address and phonenumber. Contributions cannot be returned,but each will be acknowledged.
Attention Authors How To Reach Us
Micromeritics offers over 50 sales, service, and distribution offices throughout the world.For additional information, a free product demonstration, or the location of the office nearest you, call or write:
The microReport newsletter is published by Micromeritics Instrument CorporationEditor: Laurel Whitmire(770) 662-3654.
Subscriptions are free to particle technologyusers and can be started simply by writingto The microReport editor.
Copyright 2003 Micromeritics InstrumentCorporation. All rights reserved.
All trademarks noted herein are the property of their respective owners.
MicromeriticsOne Micromeritics DriveNorcross, GA 30093-1877, U.S.A.
Part No. 008-VM14#1-MR
microReportTH
E
The Science and Technology of Small Particles™