Embed Size (px)
Citation preview

Microscale investigation into the geochemistry
of arsenic, selenium, and iron in soil developed
in pyritic shale materials
Daniel Strawn a,*, Harvey Doner b, Mavrik Zavarin c, Scott McHugo d
aUniversity of Idaho, Moscow, ID, USAbUniversity of California-Berkeley, Berkeley, CA, USA
cLawrence Livermore National Laboratory, Livermore, CA, USAdLawrence Berkeley National Laboratory, Berkeley, CA, USA
Received 28 May 2001; received in revised form 22 January 2002; accepted 14 February 2002
Abstract
In this study, we report on the distribution and mineralogy of micron-sized mineral aggregates
formed in the top horizon of an acid sulfate soil. The distribution and oxidation state of arsenic (As)
and selenium (Se) were also determined. The soil used in this study was formed from pyritic shale
parent materials on the east side of the California Coast Range. Synchrotron-based X-ray
fluorescence microprobe (A-XRF) was used to generate elemental distribution maps of soil thin
sections. Using the elemental distribution maps and optical micrographs, distinct mineral aggregates
of iron oxide and iron sulfate were identified throughout the top horizon of the soil. These aggregates
range in size from 10 to 100 Am in diameter and can be found only a few micrometers apart. The As
and Se concentrations in the iron oxide aggregates were 5–10 times the concentrations in the iron
sulfate aggregates and the weathered shale matrix. This suggests that the As and Se become
preferentially associated with iron oxides during the weathering process. Using a focused micron-
sized beam, Fe, As, and Se X-ray absorption spectroscopy (XAS) data were collected from the sub-
millimeter soil aggregates. The micro-extended X-ray absorption fine structure (A-EXAFS) spectrumcollected from the iron oxide aggregate revealed that its mineralogy was a combination of
ferrihydrite ( > 50%) and goethite. The A-EXAFS spectra from the iron sulfate region suggest that
these aggregates contain jarosite. Using micro-X-ray absorption near edge spectroscopy (A-XANES),oxidation states of the As and Se were determined. Arsenic was present in the iron oxide aggregate as
As(V). Selenium was present in the soil as both Se(IV) and Se(VI), with a higher percentage of
Se(VI) in the jarosite aggregate than the iron oxide aggregate. These results provide direct evidence
of the distribution, oxidation states, and speciation of As and Se in the solid phase of an unaltered
0016-7061/02/$ - see front matter D 2002 Elsevier Science B.V. All rights reserved.
PII: S0016 -7061 (02 )00133 -7
* Corresponding author. University of Idaho, Moscow, ID, USA. Fax: +1-208-885-7760.
E-mail address: [email protected] (D. Strawn).
www.elsevier.com/locate/geoderma
Geoderma 108 (2002) 237–257

native soil. Information on the weathering and geochemistry of the pyritic materials, and the
associated arsenic and selenium is useful for predicting the pedogenic processes of acid sulfate soils
and the long-term fate of newly exposed pyritic materials (e.g., mine tailings and drained wetlands).
D 2002 Elsevier Science B.V. All rights reserved.
Keywords: Micro-XAFS; Arsenic; Selenium; Iron minerals; Acid sulfate soils
1. Introduction
Reduced iron sulfur containing earth materials such as pyrite are significant sources of
arsenic and selenium in the environment (Foster et al., 1998; Ganje and Rains, 1982;
Masschelyn et al., 1991; Presser and Swain, 1990; Savage et al., 2000; Tamaki and
Frankenberger, 1992; Velinsky and Cutter, 1990). In addition, the geochemistry of soils
derived from pyritic parent materials are strongly influenced by the iron and sulfur
weathering products (Lumsdon et al., 2001). Human activities such as mining, ground-
water drawdown, and wetland drainage have exposed pyritic materials to a more
oxidizing environment. The weathering of these newly exposed geological materials
will oxidize and dissolve the reduced iron sulfur minerals, which will reprecipitate as
secondary minerals. Two common minerals that result from the weathering of pyritic
materials are iron oxides (e.g., goethite and ferrihydrite) and iron sulfates (jarosite)
(Dudas et al., 1988; Evangelou and Zhang, 1995; Lumsdon et al., 2001). In semiarid or
arid regions, sulfate salts such as gypsum and sodium sulfate may also be present in
pyrite-influenced soils. As the pyrites weather, coprecipitated As and Se also undergo
oxidation, forming new minerals or leaching out of the soils. The changes in the As and
Se speciation affect the availability of these elements for transport into surface and
ground waters, and uptake by plants and other biota. Thus, in order to better predict and
model the fate of As and Se from Fe–S-rich materials, it is necessary to have a clear
understanding of the geochemical processes that affect their oxidation state and mineral
associations.
Soils whose geochemical properties are controlled by the oxidation of iron and sulfur
minerals, in particular pyrite, are called acid sulfate soils (Fanning and Fanning, 1989).
Some of the characteristics of these soils include, low pH, the presence of jarosite and
sulfate salts, and extensive mottling due to iron oxide and sulfate mineral aggregates
(Fanning and Fanning, 1989; Sencindiver and Ammons, 2000). These soils are com-
monly formed on sedimentary rocks of marine origin (e.g., shales). Mermut et al. (1985)
studied the micromorphology and distribution of features related to pyrite oxidation in a
soil derived from marine shale parent materials in Saskatchewan using scanning and
transmission electron microscopes (SEM and TEM, respectively) and energy dispersive
analysis of X-ray (EDX). Based on the shapes of the jarosite aggregates, Mermut et al.
(1985) hypothesized that the jarosite was crystallized from the solution phase as opposed
to in situ replacement of the pyrite phase. They found that the jarosite aggregates were
most common in the lower horizons, while iron oxides were more common in the upper
horizons. In the upper horizon, the iron minerals were identified as goethite and hematite
based on crystalline morphology, while in the lower horizon, noncrystalline ferric
D. Strawn et al. / Geoderma 108 (2002) 237–257238

hydroxides were identified. Several other researchers have also studied the distribution
and speciation of minerals in acid sulfate soils (Dudas et al., 1988; Fanning and Fanning,
1989; McSweeney and Madison, 1988; Ross et al., 1988; Sencindiver and Ammons,
2000).
Arsenic and Se occur in the environment in several oxidation states. The most common
oxidation states of As in soils are three and five, while Se primarily occurs as four and six.
More reduced forms of As and Se can occur in anoxic soils. During the formation of pyrite
in reducing environments, As and Se are isomorphically substituted for reduced sulfur in
the pyrite structure (Nesbitt et al., 1995; Presser and Swain, 1990). The oxidized forms of
these elements exist in soils and solutions as the oxyanions arsenate (AsO43� ), arsenite
(AsO33� ), selenate (SeO4
2� ), and selenite (SeO32� ). Lumsdon et al. (2001) modeled the
weathering of an arsenopyrite/pyrite particle in water using thermodynamic data and a
diffusion model. Their results showed a succession of As solubilization as the particle
weathered; upon initial dissolution, dissolved As concentrations were at maximum,
followed by a decrease as the pyrite weathered to jarosite, and the lowest dissolved As
concentration occurring during the later stages of weathering when poorly ordered iron
oxides were formed. A major reaction mechanism controlling the fate of As and Se in soils
is sorption and desorption. The oxyanions are strongly sorbed as inner-sphere complexes
on the functional groups of iron minerals (Fendorf et al., 1997; Fuller et al., 1993;
Manceau and Charlet, 1994; Manning et al., 1998; O’Reilly et al., 2001). The extent of
sorption of these oxyanions is dependent on pH. Although arsenate is thought to be the
least mobile form of As, recent data has shown that at high concentrations or pH arsenite
loading levels are higher than arsenate loading levels (Manning and Goldberg, 1997;
Raven et al., 1998; Sun and Doner, 1998). Selenate is adsorbed less strongly than selenite,
and is considered to be the most readily available species for bio-uptake and transport to
surface and ground waters (Zhang et al., 1999).
The chemical speciation and physical distribution of As in both pyritic acid sulfate soils
and mine spoils have been studied. Savage et al. (2000) and Foster et al. (1998) studied the
oxidation state, molecular structure, and micromorphology of As from mine spoils located
in California using X-ray absorption spectroscopy (XAS), X-ray diffraction (XRD), TEM,
and SEM. They found that the weathering of arsenopyrite minerals released arsenate that
either coprecipitated with iron sulfate and iron oxide minerals, or adsorbed on the surface
of iron oxide or silicate minerals. Arsenate coprecipitates such as scorodite (FeAsO4) have
been observed in natural systems. Several studies have been done on the geochemistry of
contaminants in mine tailings (Evangelou and Zhang, 1995; Fennemore et al., 1998; Foster
et al., 1998; Ribet et al., 1994; Savage et al., 2000). However, few have evaluated trace
element geochemical processes in naturally developing soils (i.e., basic pedogenic
process), which is valuable for predicting the long-term fate of the trace elements
(McSweeney and Madison, 1988; Sencindiver and Ammons, 2000). Dudas et al. (1988)
evaluated the geochemistry of As in acid sulfate soils from Alberta using a sequential
extraction technique and a thermodynamic chemical speciation program. They found that
the As accumulated in pockets and veins of soil enriched in iron oxides and that calcium,
manganese, and iron arsenate minerals were not thermodynamically stable. However, their
results did not provide direct information about the microdistribution and oxidation state
of As in the solid phase.
D. Strawn et al. / Geoderma 108 (2002) 237–257 239

The geochemistry of Se mineral weathering mirrors that of S. In most oxidizing
environments, Se exists primarily sorbed onto the surfaces of oxide minerals (Glasauer et
al., 1995; Presser and Swain, 1990; Sposito et al., 1988). Most selenite and selenate
minerals are too soluble to persist in natural environments (Masschelyn et al., 1991).
However, some iron selenite minerals have been reported in acid environments, such as
the insoluble ferric selenite (Fe2(OH)4SeO3) (Presser and Swain, 1990), and selenate has
been observed to be isomorphically substituted for sulfate in hydrous Mg and Na sulfate
salts (Presser and Swain, 1990). In arid regions, sulfate salts with coprecipitated Se are
common. Very little research has been done on the mineralogy of Se weathered from
pyritic materials.
The objective of this study is to provide a better understanding of the natural
geochemical cycling of arsenic and selenium in soils. To accomplish this objective, we
utilized a new research tool that combines synchrotron-based micro-X-ray fluorescence (A-XRF) spectroscopy and spatially resolved X-ray absorption fine structure spectroscopy (A-XAFS). These tools are ideally suited for investigating micromorphology and chemical
speciation in heterogeneous samples such as soils. By scanning across the surface with a
focused X-ray beam, the elemental composition and spatial distribution of the elements
can be determined. Utilization of the intense X-ray beams from a synchrotron source
allows for the detection of elements present at much lower levels than is possible using an
electron microscope (e.g., SEM). Since the spatial resolution of the synchrotron X-ray
beam is f 1 Am, it is possible to focus on individual aggregates and particles and collect
A-XAFS spectra, which allows for determination of oxidation state and molecular structure
of these microscopic features. Several researchers have used microscopic X-ray absorption
near edge structure (A-XANES) spectroscopy to determine the oxidation state of metals in
natural samples (Bertsch et al., 1994; Tokunaga et al., 1997, 1998, and others); Manceau et
al. (2000) and Alexander (1995) provided a review of this literature. However, only a few
studies have used spatially resolved extended XAFS (A-EXAFS) spectra from whole soils
with their morphology intact (Manceau et al., 2000). EXAFS spectra provide detailed
information on the local atomic structure surrounding the atom of interest (Fendorf and
Sparks, 1996). In powder, EXAFS spectroscopy of heterogeneous samples deciphering the
spectra is complicated by the presence of several different mineral phases, and no
information on the morphology or spatial distribution can be obtained. Manceau et al.
(2000) used A-EXAFS to determine the chemical speciation of Zn in a whole soil collected
near a smelter in France. They found that the Zn was present in the soil incorporated into
phyllosilicates, and Mn and Fe oxide minerals. In the current study, A-EXAFS spectro-
scopy is used to investigate the iron mineralogy of sub-millimeter aggregates in undis-
turbed soil cores, and A-XANES is used to determine the oxidation state of As and Se in
the soil aggregates.
The soil used in this study was collected from the east side of the California Coast
Range. The soil has undergone natural pedogenic processes with only minor influences
from range cattle. The parent materials for the soil are shale materials that contain small
inclusions of pyrite. Eroded materials from these upland soils provide the parent materials
for the alluvial soils of the Western San Joaquin Valley, which are extensively used for
agriculture (Presser and Swain, 1990). Also, since these soils are formed on As and Se
containing pyritic shale parent materials, the information gained from this study will be
D. Strawn et al. / Geoderma 108 (2002) 237–257240

important for evaluating the weathering and geochemistry of trace elements from other
newly exposed pyrite containing materials over long time periods. Such information will
lead to the development of effective management strategies for these soils.
2. Research procedures
2.1. Site description
Soil samples were collected from the top (A) horizon of a soil located in the Panoche
Hills on the east side of the California Coast Range. This soil belongs to the Gewter series
and is classified as a Ultic Haploxeralf (National Cooperative Soil Survey, 1997). The
location of the study site is N36j35V32U, W120j41V28U. The slope at this site faces
southeast and has an incline of 15%. The parent material for the soil is the Late Cretaceous
to Paleocene Moreno formation (Presser and Ohlendorf, 1987). The Moreno formation
consists of black shale containing small inclusions of pyrite. The A horizon is 2–4 cm
deep, has small roots from annual grasses and forbs, and has a texture class of clay with
25% rock fragments consisting of soft friable shale material. The soils have a relatively
high salt content as indicated by an electrical conductivity of 1.2 dS m � 1 and the presence
of evaporites in the cracks and crevices below 3 cm. Salt crystals were not observed in the
sample used in this study. The vegetation on these soils is sparse, with some annual grasses
and other forbs that have high salt tolerances. The pH of a 1:1 (soil/deionized water)
gravimetric suspension of the soil was 4.0. This low pH is due to the formation of sulfuric
acid from the oxidation of the pyritic mineral inclusions in the shale materials (sulfuri-
cization) (Fanning and Fanning, 1989).
2.2. Sample preparation
In April 1999, soils were collected using a soil-coring device (diameter = 4.5 cm) fitted
with a Lucite sleeve that was capped after collection to preserve the morphology and
aggregate distribution of the sample. The soil cores were air-dried at 35 jC, impregnated
with LR White resin (SPI Supplies, West Chester, PA) under a vacuum and then cured in
an oven at 60 jC for 24–48 h to induce resin hardening. The impregnated soil cores were
cut into 2� 3� 0.3 cm pieces using a diamond-edged saw, after which they were ground
to various thicknesses (0.5–3 mm). This preparation procedure results in small self-
supporting wafers with morphologies intact that are flat enough so that the plane of focus
is constant throughout the xy scan. Experiments on untreated soil material (see discussion
below) showed no impacts on the oxidation state of Se from sample preparation. The data
presented in this paper represent only a few isolated regions (on the order of 1 mm2) and
features from the soil. Soils have infinite variability, and cannot be completely charac-
terized by a single 1 mm2. However, microspectropic analysis was carried out on several
regions and thin sections using three different beamline configurations (see below), and
the results from all of the analyses were identical to those presented in this paper. Thus, it
is inferred that the results discussed in this paper are applicable for the entire A horizon of
the soil.
D. Strawn et al. / Geoderma 108 (2002) 237–257 241

2.3. Microspectroscopic analysis
To determine the elemental distribution in soil thin sections, the samples were analyzed
using a synchrotron-based X-ray fluorescence microprobe on beamline 10.3.1 at the
Advanced Light Source (ALS), Lawrence Berkeley National Laboratory (Berkeley, CA).
The storage ring at the ALS is operated at 1.9 GeV with a maximum current of 400 mA.
Beamline 10.3.1 has an Si (Li) energy dispersive solid-state detector mounted at 90jincident to the X-ray beam, and Kirpatrick–Baez optical geometry to focus the mono-
chromatic light to f 1 Am. The sample was held at a 45j angle and f 3 mm at closest
point to the detector. The sample was scanned at an energy of 12.5 eV using an
automatically controlled sample stage that rasters across the sample at predefined step
sizes. Data were collected in 10-Am steps at 4 s per step. The final spectra were corrected
for background and normalized to National Institute of Standards and Technology
fluorescence spectroscopy standards that have known elemental concentrations (SRM
1832 and 1833). The units of the data are Ag/cm2, and allow for relative comparisons only.
The Mn Kh1 (6.490 keV) may contribute to the intensity of the Fe Ka1 peak, causing a small
amount of error in the element concentrations. Converting from Ag/cm2 to Ag/g soil in
heterogeneous samples such as soils is difficult since the depth of penetration of the X-
rays is dependent on the elemental composition, mineral density, and the fluorescence
energy of the element being detected. Zavarin (1999) has discussed these limitations in
detail, and has proposed some strategies for overcoming them. In this study, the variable
X-ray penetration depth may have some impact on spatial resolution and relative
elemental concentrations. However, scans from several samples yielded the same trends,
indicating that the errors introduced from sample heterogeneity do not impact interpre-
tation of the relative elemental distributions in the soil thin sections. Data were mapped
using the contour-mapping feature available in the program Microcal Origin (North
Hampton, MA).
The As (K edge) XANES and Fe (K edge) EXAFS spectra were collected on Beamline
10.3.2 at the ALS, and the Se (K edge) XANES spectra were collected at Beamline 13-ID-
C at the Advanced Photon Source (APS), Argonne National Laboratory (Chicago, IL).
Beamline 10.3.2 at the ALS uses elliptically bent mirrors to focus the beam to 1–5 Amwith an Si(111) crystal to obtain monochromatic light (MacDowell et al., 1998).
The detector at beamline 10.3.2 is an Si (Li) solid-state detector orientated at a 45jangle to the sample (90j incident to the beam), and can be moved in as close as 1 mm
from the sample. Beamline 13-ID-C uses a Kirpatrick–Baez optical geometry to focus the
monochromatic light obtained from an Si crystal monochromator to 1–5 Am. The detector
used on BL 13-ID-C was a 13-element germanium detector with a 100-Am aluminum foil
filter to prevent saturation of the detector electronics from the high Fe K edge
fluorescence.
XANES data were collected using 0.4 or 0.5 eV steps at 0.5 to 15 s per step from f 1
Am spots in the sample. For Se XANES, the spectra from 8 to 10 channels were merged.
For the As XANES, the spectra from 10 to 20 individual scans were merged. The scans
were collected from 100 to 50 eV before the edge to 200 eV after the edge. The spectra
were processed by subtracting pre-edge and post-edge backgrounds, and normalizing the
step height to one. To test for the effects of resin impregnation on the As oxidation state,
D. Strawn et al. / Geoderma 108 (2002) 237–257242

soil cores were spiked with As(III) (final As loading = 781 mg (kg soil) � 1, equilibrium
pH= 4.5) and prepared into thin sections as described above. To test for the effects of resin
impregnation on the Se oxidation state, small jarosite aggregates were isolated from the
unaltered soil under a dissecting microscope and the XANES spectra from these
aggregates were compared to the XANES spectra from the impregnated samples. The
possibility of beamline oxidation/reduction was evaluated by collecting several successive
scans; the spectra showed no change over time. Arsenic and Se standard XANES data
were collected from sodium arsenate, arsenite, selenite, and selenate salts dissolved in
deionized water (0.1–0.001 M) and placed on a 0.2-Am polyethersulfone filter paper and
sealed in Kapton. For the Se spectra, the salts were also run as solids diluted in boron
nitride.
The iron A-EXAFS spectra were collected on Beamline 10.3.2 at the ALS. Data
acquisition of the Fe K edge (7.112 keV) was done by scanning from 200 eV before to 800
eV after the edge. The time for each scan was f 30 min. Multiple (15–25) scans were
merged to increase the signal to noise ratio. Data reduction of the EXAFS spectra involved
background subtraction, normalization, conversion to k-space, and weighting by k3. All
spectra (samples and standards) were processed using identical k-space, normalization, and
background subtraction. The parameters were optimized by minimizing oscillations in the
spline derivative, minimization of low R peak height in the radial structure function, and
maximizing the peak height of the O backscatterer while minimizing its FWHM.
Processing all of the spectra using the same parameters allows for relative comparisons
between the spectra and the standards. The sample used for the Fe EXAFS data collection
was a 0.5-mm-thick soil thin section. The standards used for fitting were well-charac-
terized hematite, ferrihydrite, goethite, and jarosite minerals (Scheinost and Schwertman,
1999). The EXAFS spectra of the standards were collected in transmission using bulk
EXAFS techniques.
Fitting of the EXAFS spectra was accomplished using a linear combination least
squares optimization routine in the program WinXAFS. A similar approach for fitting
EXAFS spectra was used by Manceau et al. (1996, 2000) and Gaillard et al. (2001). To
begin the fitting process, the unknown chi spectrum was fitted using four iron mineral
standard spectra (goethite, ferrihydrite, hematite, and jarosite). Standards that had partial
contributions that were very low ( < 1%) or negative were removed from the succeeding
fits. The fit of the components were normalized so that they comprised 100% of the
spectra from the aggregates. The final fit was taken as the fit that consisted of the least
number of components and yielded the lowest residual. Manceau et al. (2000) reported
that the accuracy of fitting EXAFS spectra linear combinations of standards is 15%;
however, in our experiments, the error is higher since the EXAFS spectra from the
samples were collected in fluorescence mode, while the EXAFS spectra from the
standards were collected in transmission mode; self-absorption decreases the signal of
the EXAFS spectra collected in fluorescence mode. We did not do any corrections for
self-absorption since our samples have variable density, particle size, and elemental
compositions; thus, our results are only semiquantitative. Attempts to fit the spectra from
ab initio theoretical phase shifts and amplitudes was not attempted since the spectra
terminate at f 10 A � 1, and isolation and distinction of the backscattering shells would be
difficult without more data.
D. Strawn et al. / Geoderma 108 (2002) 237–257 243

3. Results and discussion
3.1. Identification of iron minerals using A-EXAFS
Fig. 1 shows an optical image taken from a soil thin section. There were three unique
features that were identified from this image: orange aggregates (medium tone gray in
black and white micrograph, features labeled A), yellow aggregates (bright white in black
and white micrograph, feature labeled B), and the brown matrix that is indicative of the
shale parent material. These features were observed throughout the soil horizon. Previous
X-ray diffraction (XRD) analysis of large bulk separates that were collected from nearby
soils indicated that the orange materials are composed of primarily goethite, and the
yellow separates are composed of jarosite (Zavarin, 1999). Small amounts of montmor-
illonite, illite, quartz, and muscovite were also identified in the separates. In the top soil
horizon investigated in this study, the iron oxide and iron sulfur aggregates ranged in size
from 10 to 100 Am, and are located within a few microns of each other. While XRD and
color associations allow for some mineral identification, these techniques have limited use
in determining mineralogy of poorly crystalline materials and heterogeneous samples,
both common characteristics of soils (Schwertmann and Taylor, 1989). Since poorly
crystalline iron oxides have highly reactive surfaces, it is important to include them in
mineralogical characterization.
Fig. 1. Black and white reflected light micrograph (converted from color) from a f 0.5-mm-thick soil section
prepared from the A horizon of the soil used in this study. Features labeled A (gray tone) are iron oxide
aggregates. Feature labeled B (bright yellow in color turns white in black and white transformation) is an iron
sulfate aggregate. Black regions are shale matrix (brown in color photo). White bar is 100 Am long.
D. Strawn et al. / Geoderma 108 (2002) 237–257244

In Fig. 2a, the comparison of the EXAFS spectrum from ferrihydrite, goethite, jarosite,
and hematite standards clearly shows that there are distinct features that can be used to
identify the minerals. The goethite and jarosite spectra reported by Savage et al. (2000)
had similar spectral features as the spectra shown in this study. For the iron oxides, there
Fig. 2. EXAFS spectra from iron mineral standards and iron mineral aggregates in Fig. 1. Panel a: reference
mineral spectra used to fit raw data (solid lines) in Panels b and c. Panel b: EXAFS spectrum from feature B in
Fig. 1, best fit (dashed line) was obtained by using 100% jarosite standard. Panel c: EXAFS spectrum from
feature A in Fig. 1, best fit was obtained by combining 74% ferrihydrite, 26% goethite.
D. Strawn et al. / Geoderma 108 (2002) 237–257 245

are significant differences in the size, shape, and position of the small shoulders and peaks
between 5 and 6 A � 1, while the jarosite has a distinct difference in the phase of the chi
structure after 7 A � 1. The EXAFS spectra from the orange and yellow aggregates are
shown in Fig. 2b and c together with the best fits from the linear combination of the
standards. The best fit for the orange aggregate material was obtained by combining the
ferrihydrite (74%) and the goethite (26%) spectra. The resulting spectra from this
combination represented the data very well (Fig. 2b). An attempt to fit hematite to the
spectra resulted in a very small contribution and the residual of the fit was larger than the
fit with just goethite and ferrihydrite. The addition of jarosite resulted in a negative
contribution when added to the fit of the orange aggregate. In the linear combination, the
fit was dependent on the spectral features (i.e., wavelength and nodes or shoulders) and the
amplitude of the oscillations. The amplitude of the EXAFS spectra from the iron mineral
aggregates is not only affected by the degree of structural order, but also self-absorption of
the fluorescence signal since they were collected in fluorescence mode. Since the
standards were collected in transmission (no self-absorption), there are additional
inaccuracies that are introduced into the fit results. Thus, the percent of the components
that the linear composition yielded is semiquantitative and only provides a measure of
relative amounts. To test the effects of amplitude on the linear combination fit results, the
amplitude of the chi structure from the ferrihydrite standard was doubled and the EXAFS
from the iron oxide aggregate was refit. This resulted in a decrease in the ferrihydrite
contribution to 55%, verifying that there is some sensitivity of the fit results to the chi
structure amplitude. However, since the fit results still yielded greater than 50%
ferrihydrite, it is likely that the composition of the iron oxide aggregate has more
ferrihydrite in it than goethite. The best fit of the EXAFS spectrum from the yellow
aggregate was obtained by fitting only the single jarosite standard (Fig. 2c). When goethite
or hematite was added to the fit of the jarosite aggregate, the result was less than 1%
contribution. An attempt to use the ferrihydrite standard spectrum in the fit of the yellow
aggregate resulted in a 27% ferrihydrite composition; however, the fit residual increased
indicating a poorer fit than when just the jarosite standard spectrum was used. Thus, it is
concluded that the yellow aggregate is composed of predominantly jarosite. The other iron
oxides (lepidocrocite, maghemite, etc.) and iron sulfates (schwertmannite and natrojar-
osite) were not tested for; however, we expect that their concentrations are low and would
be difficult to detect in these experiments.
Mermut et al. (1985) found that the mineral composition of the surface horizon of a soil
formed in pyritic shale parent material located in Saskatchewan, Canada consisted of
quartz, amphiboles, feldspars, and micas, with some iron oxide glaebules. From the SEM
and TEM micrographs, they identified amorphous iron oxides that were clustered together
with jarosite crystals in the lower horizons. Dudas et al. (1988) analyzed the minerals in a
sulfate soil (pyritic shale parent material) from Alberta, Canada using differential XRD
and aqueous speciation modeling based on thermodynamics. Similar to Mermut et al.
(1985), they found that jarosite was common in the lower horizons but absent from the A
horizon. However, they were unable to detect ferrihydrite using differential X-ray
diffraction, and identified the iron oxide rich soil fractions collected from the lower
horizons as goethite and hematite. Ross et al. (1988) found similar trends in the spatial
distribution of jarosite in an acid sulfate soil from Manitoba, Canada. However, using the
D. Strawn et al. / Geoderma 108 (2002) 237–257246

same technique as Dudas et al. (1988), they found that ferrihydrite dominated the iron
oxide mineralogy of the surface horizon, and goethite was the most common iron oxide in
the lower horizons. The increased weathering in the Canadian soils is likely the reason for
the lack of jarosite minerals in the surface horizon as compared to the soils from this study
that are located in an arid region prone to intense erosion. The variability in the iron oxide
mineralogy reported in the literature may be a result of temperature and other soil
weathering and formation factors (i.e., organic matter content, soil pH, rainfall, redox,
crystallization time, etc.), as well as analytical technique. The results of this study show
not only the ability of EXAFS spectroscopy to distinguish iron oxide minerals, but also
demonstrates the ability of A-EXAFS spectroscopy to distinguish features that are sub-
millimeter in size, and located only a few microns apart.
3.2. Microscale distribution of elements
The XRF spectra from a goethite aggregate and a jarosite aggregate are shown in Fig. 3a
and b, respectively. The Ka1 peaks for As and Se are located at 10.543 and 11.222 keV,
respectively. The Kh1 peaks for As (11.7262 keV) and Se (12.4959 keV) could not be
detected because of their low intensity and the presence of the inelastic scattering curve
from the X-ray beam. The much higher intensity of the As and Se emission lines in the iron
oxide aggregate (Fig. 3a) indicates that there was a higher concentration of these elements
associated with the iron oxide minerals than the jarosite minerals (Fig. 3b). Other peaks are
also present in the XRF spectra, such as Mn (Ka1 = 5.8988 keV), Zn (Ka1 = 8.6389 keV),
and Ti (Ka1 = 4.5108 keV). The distribution maps for these elements are not shown;
however, the Mn distribution in the soil is directly correlated with the Fe distribution, the Ti
distribution is correlated with Ca and Si distributions, and the Zn distribution is not
correlated with any other elements in the soil section.
The spatial distributions of the elements in the thin section are shown in Fig. 4. Similar
to Fig. 1, there were small orange and yellow aggregates present in the thin section
analyzed in this experiment. These aggregates are indicated in Fig. 4a by the regions with
high Fe concentrations. The presence of relatively high concentrations of S and K (Fig. 4b
and c) in the iron aggregate centered at x = 495 Am and y= 200 Am provides elemental data
to support the claim that this feature is jarosite (KFe3(OH)6(SO4)2). To further evaluate
possible relationships, paired elemental concentrations from selected xy scans were plotted
against each other as scatter plots (Fig. 5). Fig. 5a shows the S vs. Fe concentration. Two
data fields can be identified in this figure; one shows a positive relationship between S and
Fe concentrations, and the other shows little or no increase in S concentration with Fe. The
positive relationship between the Fe and S concentrations is indicative of the jarosite
aggregate, while the field of data that lack a correlation are indicative of the iron oxide
aggregate. Similarly, at S concentrations greater than 50 Ag cm � 2, there is a positive
relationship between K and S concentrations (Fig. 5b) that is consistent with the
composition of jarosite.
The distribution of As and Se shown in Fig. 4c and e indicates that these elements were
more concentrated in the iron oxide aggregates than the clay/shale matrix and the jarosite
aggregate. Fig. 5c and d shows that there are positive relationships between Se and As, and
Fe concentrations. Fig. 5c shows at least two unique distributions of Se and Fe. One
D. Strawn et al. / Geoderma 108 (2002) 237–257 247

possible explanation for this distribution is that it represents two different iron oxide
aggregates. Similar trends are evident for As in Fig. 5d, although not as distinct. Using S
as the indicator for jarosite, it is apparent from Fig. 5e that there was little correlation
between As and Se concentrations and jarosite.
The total concentrations of As and Se in the soils were 13.7 and 6.76 mg (kg soil)� 1,
respectively. Based on the results presented in this section, it appears that the As and Se
were hyperaccumulated by the iron oxide minerals in the soil. Iron oxides are one of the
end products of oxidative pyrite weathering. The accumulation of As and Se on these
minerals suggests that either the elements coprecipitated with the iron oxide and not the
jarosite, or they were sorbed much more strongly on the functional groups of the oxide
than the other minerals present in the soil. Dudas et al. (1988) determined the total As
concentration in mineral separates from the B and C horizons of an acid sulfate soil that
formed from shale materials in a forest in Alberta, Canada. Similar to this study, they
Fig. 3. XRF spectra collected from iron oxide aggregate (Panel a) and iron sulfur aggregate (Panel b) in Fig. 4.
D. Strawn et al. / Geoderma 108 (2002) 237–257248

Fig. 4. Elemental distributions obtained from a 0.4� 0.6 mm area in a f 3-mm-thick soil section taken from the
top horizon of the soil used in this study. Concentrations are in Ag/cm2.
D. Strawn et al. / Geoderma 108 (2002) 237–257 249

Fig. 5. Element associations for selected elements shown in Fig. 4.
D. Strawn et al. / Geoderma 108 (2002) 237–257250

found that the As was concentrated in the iron oxide fraction by 10–20 times the level in
the jarosite fractions, and at least 10 times the bulk soil concentration. Foster et al. (1998)
found that the predominant speciation of arsenic in weathered pyritic mine tailings was
either a coprecipitated scorodite like mineral, or adsorbed on the surfaces of iron and
aluminum oxides. Savage et al. (2000) reported that the arsenic in weathered pyritic mine
tailings was either adsorbed on the surfaces of iron oxides, or coprecipitated with iron
sulfate minerals. Our results provide direct evidence on the microscale that iron oxides
preferentially accumulate As and Se over jarosite.
The elemental distribution of P is shown in Fig. 4g. The highest P concentrations were
found in the jarosite and iron oxide aggregates. There was a direct relationship between the
P and the Fe distribution (Fig. 5f). The total P concentration in the soil was 660 mg (kg
soil) � 1. Phosphorus and As are thought to be analogous in their chemical behavior.
However, in these soils, they exhibited different partitioning behavior. Phosphorus was
associated with the both the iron oxide and the jarosite aggregates, while As is only
associated with the iron oxide aggregates. O’Reilly et al. (2001) showed that only 35% of
the sorbed arsenate could be desorbed from goethite, even though the phosphate
desorptive solution was three times the concentration of the initial arsenate sorption
solution. This suggests that the arsenate bond on iron oxides is stronger than the phosphate
bond, and may be a reason for the dissimilar behavior of the two elements in this soil.
Calcium was distributed throughout the thin section (Fig. 4f). There was a relatively
high concentration of calcium surrounding the iron oxide aggregate centered at x = 90 Amand y = 100 Am. The reason for this high Ca concentration is not clear. However, similar
distributions have not been observed in other element micrographs from thin sections of
the same soil. In the lower profile, Ca hot spots were identified that are correlated with S;
Fig. 6 shows the elemental distribution of one of these features. Increased Ca–S
concentrations were observed in regions where salt crystals are visible, and are most
likely gypsum crystals, and had no accumulations of As. Mermut et al. (1985) found
similar gypsum features in the lower horizon of a soil formed in Saskatchewan, Canada.
Since S was not correlated with the Ca in the feature identified in Fig. 4f, it is not likely to
be gypsum. Silicon, Ti, and K were also closely associated with Ca in the soil thin section
(Fig. 4h). The Ca–S–K may be a weathering rind; however, it is difficult to speculate
about the mineralogy and formation of this feature without additional information.
3.3. Oxidation states of As and Se in soil aggregates
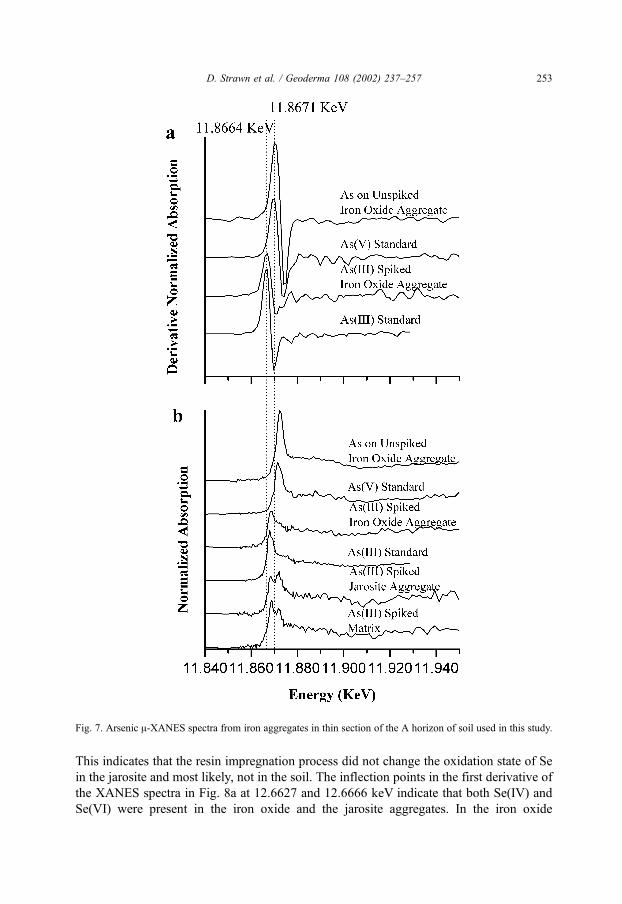
The As XANES spectra are presented in Fig. 7. For determination of the effects of the
resin impregnation on the As oxidation state a small soil core was spiked with As(III) and
carried through the impregnation and thin sectioning steps as described above. In the
As(III) spiked soil matrix and jarosite aggregates, the XANES spectra in Fig. 7b show
peaks that are indicative of both As(III) and As(V), indicating that during the preparation
of the thin sections, As was oxidized in these mineral aggregates (note, successive scans
over time indicated no change in the spectra from photon induced oxidation). In contrast to
the jarosite and soil matrix aggregates, the oxidation state of the spiked As(III) in the iron
oxide aggregate shows no As(V), indicating that the As(III) oxidation state was preserved
in this sample. Note that the peak from the native As(V) was masked since it was present
D. Strawn et al. / Geoderma 108 (2002) 237–257 251

at much lower concentrations than the spiked As(III) (the concentration of native As was
approximately 1/50 the concentration of spiked As(III)). These data show that the
oxidation state of As on the iron oxide aggregate was preserved through the resin
impregnation and thin sectioning process, i.e., resin impregnation and thin sectioning
could not have caused oxidation of As(III) to As(V). In the untreated iron oxide aggregate,
the halfway point for the absorption edge occurred at 11.8671 keV, directly in line with the
As(V) standard. Thus, the predominant oxidation state of the As in the iron oxide
aggregate was As(V), with little to no As(III) present. In the reduced iron sulfur, parent
material for the soil the As likely existed as FeAsS-type coprecipitates and would have a
nominal oxidation state of As0. Through pedogenic processes, the As-pyrite minerals were
oxidized and the As was either leached out of the soil as As(III) since it is more mobile
than As(V), or completely oxidized and sorbed onto secondary iron oxide minerals as
As(V).
The Se XANES spectra are shown in Fig. 8. To test for the effects of resin impregnation
and thin sectioning on the Se oxidation state, unaltered jarosite aggregates were collected
using a dissecting microscope and tweezers. Jarosite was selected because the aggregates
could be isolated from the rest of the soil in significant quantities and scanned as a unique
unaltered phase. The XANES spectra from the unimpregnated jarosite dust and the
impregnated jarosite aggregate showed that the Se oxidation states are the same (Fig. 8).
Fig. 6. Elemental distributions obtained from a 0.6� 1 mm area in a f 1-mm-thick soil section taken from the
horizon below 3 cm in the soil used in this study. Dark areas are the highest fluorescent counts and white areas are
the lowest.
D. Strawn et al. / Geoderma 108 (2002) 237–257252
This indicates that the resin impregnation process did not change the oxidation state of Se
in the jarosite and most likely, not in the soil. The inflection points in the first derivative of
the XANES spectra in Fig. 8a at 12.6627 and 12.6666 keV indicate that both Se(IV) and
Se(VI) were present in the iron oxide and the jarosite aggregates. In the iron oxide
Fig. 7. Arsenic A-XANES spectra from iron aggregates in thin section of the A horizon of soil used in this study.
D. Strawn et al. / Geoderma 108 (2002) 237–257 253

aggregate, the Se(VI) peak was smaller than in the jarosite aggregate, suggesting that the
ratio of Se(IV) to Se(VI) was highest in the iron oxide aggregate. Selenite (Se(IV)) is
known to form strong bonds and/or coprecipitates with iron oxides in soils, particularly in
acid soils. In alkaline and/or oxidizing soils, selenate (Se(VI)) may also persist (McBride,
1994); however, it is less strongly adsorbed to oxides than selenite and is considered to be
more mobile. Thus, since these soils are very oxidizing but have a low pH, it is likely that
the selenate is coprecipitating with the jarosite minerals. The isomorphic substitution of
Fig. 8. Selenium A-XANES spectra from iron aggregates in thin section of the A horizon of soil used in this study.
D. Strawn et al. / Geoderma 108 (2002) 237–257254

selenate for sulfate is favorable since the two molecules are chemical anaologues. This
mechanism would account for the higher Se(VI) concentration observed in the jarosite
mineral aggregate as compared to the iron oxide mineral aggregate.
4. Summary
This study presented information about the microspatial distribution of pyrite weath-
ering products, including As, Se, P, K, S, Fe, Si, and Ca, in the top horizon of a native soil.
In addition, speciation of the iron minerals and As and Se oxyanions was determined using
X-ray absorption spectroscopy. We successfully determined the mineral species of two
iron aggregates that were less than 100 Am in diameter and located within only a few
microns of each other. One of the iron oxide aggregates was comprised of ferrihydrite and
goethite and the other was predominantly jarosite. Arsenic and Se were found to be
preferentially associated with the iron oxide aggregates in the soil. Selenium was present
as both Se(IV) and Se(VI) oxidation states, with Se(IV) predominating. Arsenic was
present only in the As(V) oxidation state. In this paper, results from only a few sections
from the soil were presented. However, identical trends were observed in several sections
that were scanned. Thus, the results presented in this paper are representative of the
geochemical processes occurring throughout the A horizon of this soil.
The weathering of the pyrite parent materials results in the formation of secondary iron
oxide and sulfate minerals. During weathering, the reduced As and Se in the pyrite are
oxidized. The least mobile form of the As and Se (V and IV, respectively) remain in the
soil preferentially associated with the iron oxide aggregates. The formation of iron oxide
minerals in soils is dependent on several factors; of primary importance are organic matter,
temperature, and pH. In these acid sulfate soils located in an arid region, the predominant
iron oxide minerals observed are ferrihydrite and goethite.
The information provided by measuring the in situ oxidation states of As and Se in a
naturally weathered soil formed on pyritic parent materials is important for predicting the
fate and long-term geochemistry of newly exposed pyritic materials. Such information can
be used to design better remediation and management strategies that will reduce the
potential for environmental contamination. For example, information about the oxidation
states and mineralogical associations of As and Se will allow models to be developed that
will predict sorption and desorption behavior (kinetics and equilibrium) in the soil based
on the true chemical speciation of the trace elements, as opposed to bulk geochemical soil
properties.
Acknowledgements
We are grateful for the help in running the X-ray analysis of the samples by Gerry
Lamble, Allistar MacDowell, Matt Newville, Steve Sutton, and Al Thompson. Thanks are
extended to Derek Peak and Andreas Scheinost for providing the synthesized iron mineral
XAFS spectra. This research was supported by the Kearney Foundation of Soil Science.
Use of the Advanced Light Source was supported by the director, Office of Science, Office
D. Strawn et al. / Geoderma 108 (2002) 237–257 255

of Basic Energy Sciences, U.S. Department of Energy, DE-AC03-76SF00098. Geo-
SoilEnviroCARS at the APS is supported by NSF EAR-9906456 (M. Rivers, PI) and DOE
DE-FG02-92ER14244 and DE-FG02-94ER14466 (S. Sutton, PI). Use of the Advanced
Photon Source was supported by the U.S. Department of Energy, Office of Science, Office
of Basic Energy Sciences, under Contract No. W-31-109-ENG-38.
References
Alexander, M., 1995. How toxic are chemicals in soils? Environmental Science and Technology 29 (11), 2713–
2717.
Bertsch, P.M., Hunter, D.B., Sutton, S.R., Bajt, S., Rivers, M.L., 1994. In situ chemical speciation of uranium in
soils and sediments by micro X-ray absorption spectroscopy. Environmental Science and Technology 28,
980–984.
Dudas, M.J., Warren, C.J., Spiers, G.A., 1988. Chemistry of arsenic in acid sulphate soils of northern Alberta.
Communications in Soil Science and Plant Analysis 19, 887–895.
Evangelou, V.P., Zhang, Y.L., 1995. A review: pyrite oxidation mechanisms and acid mine drainage prevention.
Critical Reviews in Environmental Science and Technology 25 (2), 141–199.
Fanning, D.S., Fanning, M.C.B., 1989. Soil Morphology, Genesis, and Classification. Wiley, New York.
Fendorf, S.E., Sparks, D.L., 1996. X-ray absorption fine structure spectroscopy. In: Sparks, D.L. (Ed.), Methods
of Soil Analysis. Soil Science Society of America, Madison, WI, pp. 377–416.
Fendorf, S., Eick, M.J., Grossl, P., Sparks, D.L., 1997. Arsenate and chromate retention on goethite: I. Surface
structure. Environmental Science and Technology 31, 315–320.
Fennemore, G.G., Neller, W.C., Davis, A., 1998. Modeling pyrite oxidation in arid environments. Environmental
Science and Technology 32, 2680–2687.
Foster, A.L., Brown Jr., G.E., Tingle, T.N., Parks, G.A., 1998. Quantitative arsenic speciation in mine tailings
using X-ray absorption spectroscopy. American Mineralogist 83, 553–568.
Fuller, C.C., Davis, J.A., Waychunas, G.A., 1993. Surface chemistry of ferrihydrite: Part 2. Kinetics of arsenate
adsorption and coprecipitation. Geochimica et Cosmochimica Acta 57, 2271–2282.
Gaillard, J.F., Webb, S.M., Quintana, J.P.G., 2001. Quick X-ray absorption spectroscopy for determining metal
speciation in environmental samples. International Union of Crystallography 8 (2), 943–945.
Ganje, T.J., Rains, D.W., 1982. Arsenic. In: Page, A.L. (Ed.), Methods of Soil Analysis: Part 2. American Society
of Agronomy, Madison, WI, USA, pp. 385–402.
Glasauer, S., Doner, H.E., Gehring, A.U., 1995. Adsorption of selenite to goethite in a flow-through reaction
chamber. European Journal of Soil Science 46, 47–52.
Lumsdon, D.G., Meeussen, J.C.L., Paterson, E., Garden, L.M., Anderson, P., 2001. Use of solid phase character-
isation and chemical modelling for assessing the behavior of arsenic in contaminated soils. Applied Geo-
chemistry 16, 571–581.
MacDowell, A.A., et al., 1998. Progress toward sub-micron hard X-ray imaging using elliptically bent mirrors.
Proceedings of SPIE, The International Society for Optical Engineering 3152, 126–133.
Manceau, A., Charlet, L., 1994. The mechanism of selenate adsorption on goethite and hydrous ferric oxide.
Journal of Colloid and Interface Science 168, 87–93.
Manceau, A., et al., 1996. Direct determination of lead speciation in contaminated soils by EXAFS spectroscopy.
Environmental Science and Technology 30 (5), 1540–1552.
Manceau, A., et al., 2000. Quantitative Zn speciation in smelter-contaminated soils by EXAFS spectroscopy.
American Journal of Science 300, 289–343.
Manning, B., Goldberg, S., 1997. Adsorption and stability of arsenic(III) at the clay mineral–water interface.
Environmental Science and Technology 31, 2005–2011.
Manning, B.A., Fendorf, S.E., Goldberg, S., 1998. Surface structures and stability of arsenic (III) on goethite:
spectroscopic evidence for inner-sphere complexes. Environmental Science and Technology 32, 2383–2388.
Masschelyn, P.H., Delaune, R.D., Patrick Jr., W.H., 1991. Biogeochemical behavior of selenium in anoxic soils
and sediments: an equilibrium thermodynamics approach. Journal of Environmental Science and Health A26,
555–573.
D. Strawn et al. / Geoderma 108 (2002) 237–257256

McBride, M.M., 1994. Environmental Chemistry of Soils. Oxford Univ. Press, New York, NY, 406 pp.
McSweeney, K., Madison, F.W., 1988. Formation of a cemented subsurface horizon in sulfidic minewaste.
Journal of Environmental Quality 17, 256–262.
Mermut, A.R., Curtin, D., Rostad, H.P.W., 1985. Micromorphological and submicroscopical features related to
pyrite oxidation in a inland marine shale from east central Saskatchewan. Soil Science Society of America 49,
256–261.
National Cooperative Soil Survey, 1997. Official Soil Series Descriptions. Soil Survey Division, Natural Re-
sources Conservation Service, United States Department of Agriculture.
Nesbitt, H.W., Muir, I.J., Pratt, A.R., 1995. Oxidation of arsenopyrite by air and air-saturated, distilled water, and
implications for mechanism of oxidation. Geochimica et Cosmochimica Acta 59, 1773.
O’Reilly, S.E., Strawn, D.G., Sparks, D.L., 2001. Residence time effects on arsenate adsorption/desorption
mechanisms on goethite. Soil Science Society of America 1, 67–77.
Presser, T.S., Ohlendorf, H.M., 1987. Biogeochemical cycling of selenium in the San Joaquin Valley, California,
USA. Environmental Management 11, 805–821.
Presser, T.S., Swain, W.C., 1990. Geochemical evidence for Se mobilization by the weathering of pyritic shale,
San Joaquin Valley, California, U.S.A. Applied Geochemistry 5, 703–717.
Raven, K.P., Jain, A., Loeppert, R.H., 1998. Arsenite and arsenate adsorption on ferrihydrite: kinetics, and
adsorption envelopes. Environmental Science and Technology 32, 344–349.
Ribet, I., Ptacek, C.J., Blowes, D.W., Jambor, J.L., 1994. The potential for metal release by reductive dissolution
of weathered mine tailings. Journal of Contaminant Hydrology 17, 239–273.
Ross, G.J., Eilers, R.G., Ivarson, K.C., 1988. Influence of acid sulfate weathering on chemical and mineralogical
properties of an acid sulfate soil of Manitoba. Canadian Journal of Soil Science 68, 629–644.
Savage, K.S., Tingle, T.N., O’Day, P.A., Waychunas, G.A., Bird, D.K., 2000. Arsenic speciation in pyrite and
secondary weathering phases, Mother Lode District, Toulumne County, California. Applied Geochemistry 15,
1219–1244.
Scheinost, A.C., Schwertman, U., 1999. Color identification of iron oxides and hydroxysulfates: use and limi-
tations. Soil Science Society of America Journal 63, 1463–1471.
Schwertmann, U., Taylor, R.M., 1989. Iron oxides. In: Dixon, J.B., Weed, S.B. (Eds.), Minerals in the Soil
Environment. Soil Science Society of America, Madison, pp. 379–427.
Sencindiver, J.C., Ammons, J.T., 2000. Minesoil genesis and classification. In: Barnhisel, R.I., Darmody, R.G.,
Daniels, W.L. (Eds.), Reclamation of Drastically Disturbed Lands. Agronomy Monograph. American Society
of Agronomy, Madison.
Sposito, G., DeWit, J.C.M., Neal, R.H., 1988. Selenite adsorption on alluvial soils: III. Chemical modeling. Soil
Science Society of America 52 (4), 947–950.
Sun, X., Doner, H.E., 1998. Adsorption and oxidation of arsenite on goethite. Soil Science 163, 278–287.
Tamaki, S., Frankenberger, W.T., 1992. Environmental biochemistry of arsenic. Reviews of Environmental
Contamination and Toxicology 124, 79–110.
Tokunaga, T.K., Brown, G.E., Pickering, I.J., Sutton, S.R., Bajt, S., 1997. Selenium redox reactions and transport
between ponded waters and sediments. Environmental Science and Technology 31, 1419–1425.
Tokunaga, T.K., Sutton, S.R., Bait, S., Nuessle, P., Shea-McCarthy, G., 1998. Selenium diffusion and reduction at
the water sediment boundary: micro-XANES spectroscopy of reactive transport. Environmental Science and
Technology 32, 1092–1098.
Velinsky, D.J., Cutter, G.A., 1990. Determination of elemental selenium and pyrite-selenium in sediments.
Analytica Chimica Acta 235, 419–425.
Zavarin, M., 1999. Sorptive properties of synthetic and soil carbonates for selenium, nickel, and manganese. PhD
Thesis, University of California-Berkeley, Berkeley, CA, 279 pp.
Zhang, Y., Moore, J.N., Frankenberger, W.T., 1999. Speciation of soluble selenium in agricultural waters and
aqueous soil-sediment extracts using hydride generation atomic absorption spectrometry. Environmental
Science and Technology 33, 1652–1656.
D. Strawn et al. / Geoderma 108 (2002) 237–257 257