Embed Size (px)
Citation preview
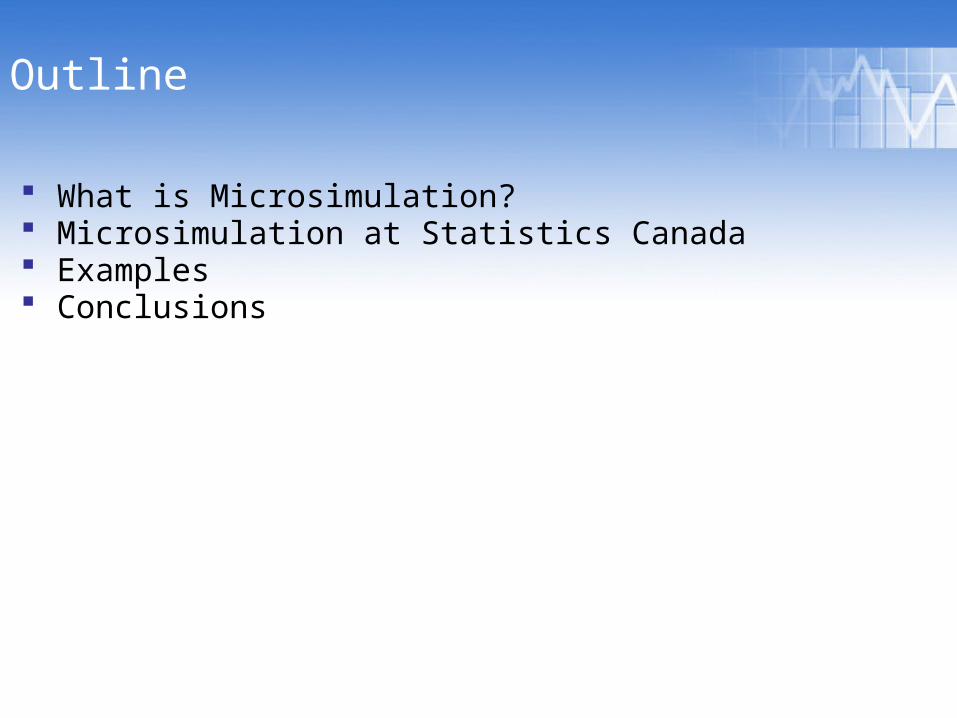
Outline
What is Microsimulation? Microsimulation at Statistics Canada Examples Conclusions
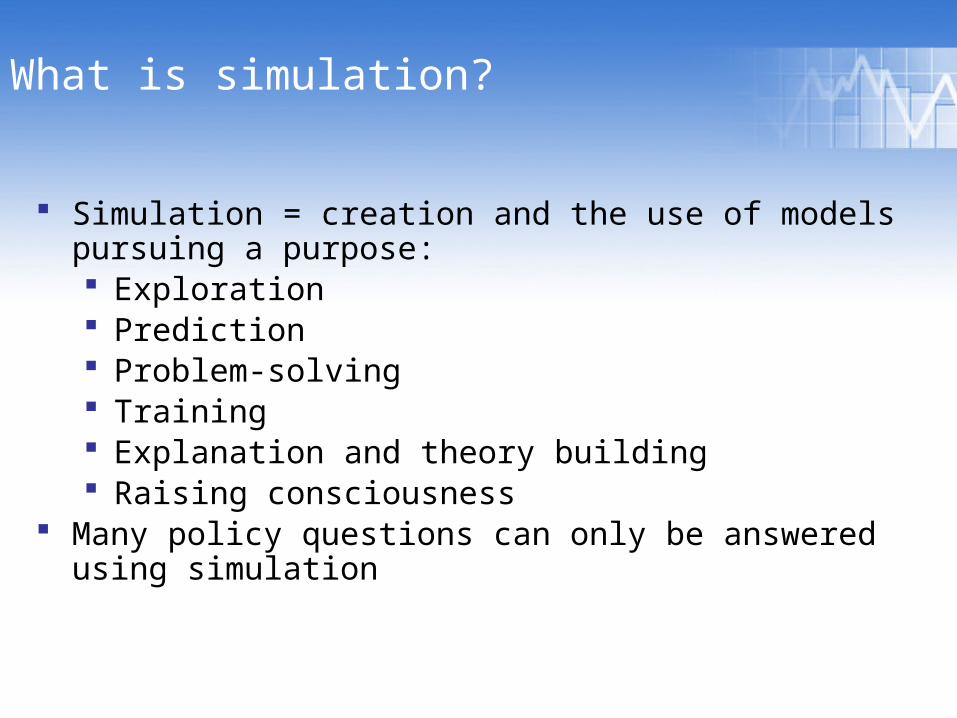
What is simulation?
Simulation = creation and the use of models pursuing a purpose: Exploration Prediction Problem-solving Training Explanation and theory building Raising consciousness
Many policy questions can only be answered using simulation
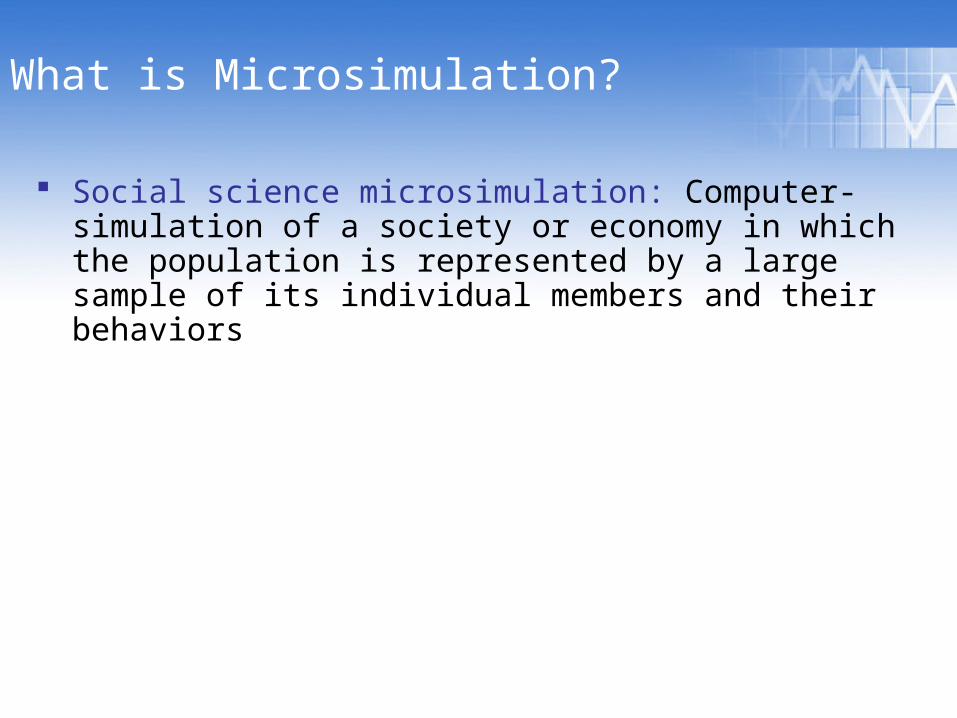
What is Microsimulation?
Social science microsimulation: Computer-simulation of a society or economy in which the population is represented by a large sample of its individual members and their behaviors
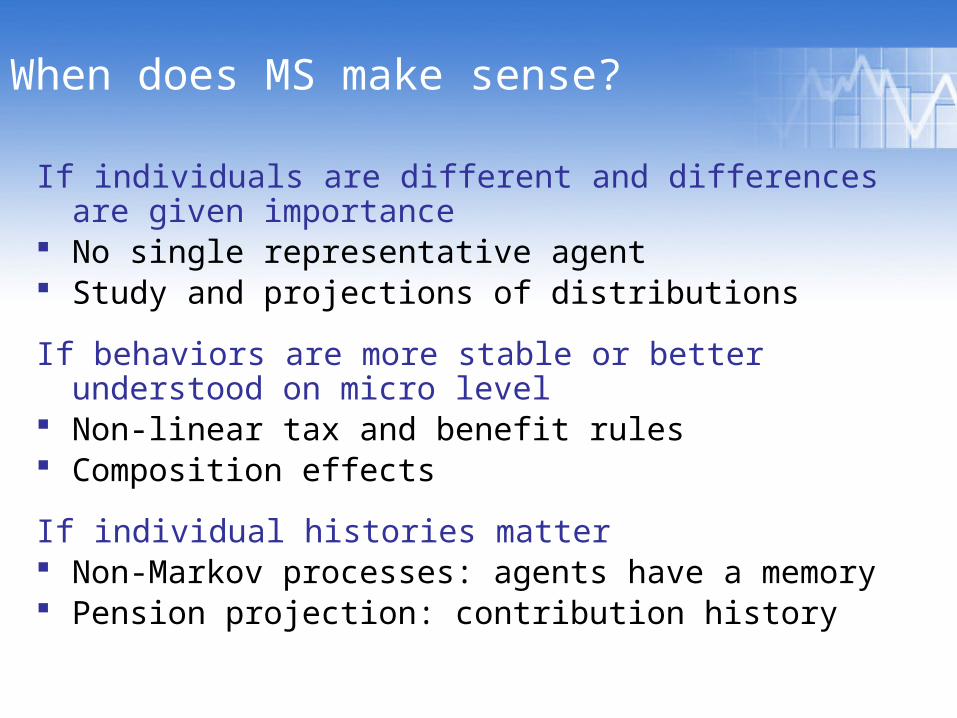
When does MS make sense?
If individuals are different and differences are given importance No single representative agent Study and projections of distributions
If behaviors are more stable or better understood on micro level Non-linear tax and benefit rules Composition effects
If individual histories matter Non-Markov processes: agents have a memory Pension projection: contribution history
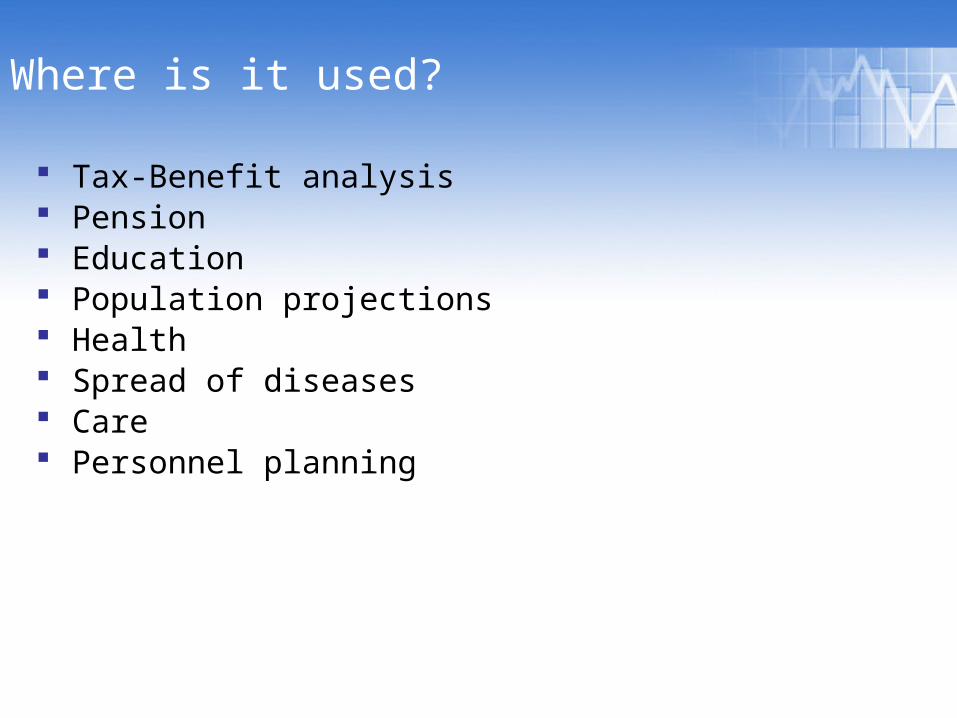
Where is it used?
Tax-Benefit analysis Pension Education Population projections Health Spread of diseases Care Personnel planning
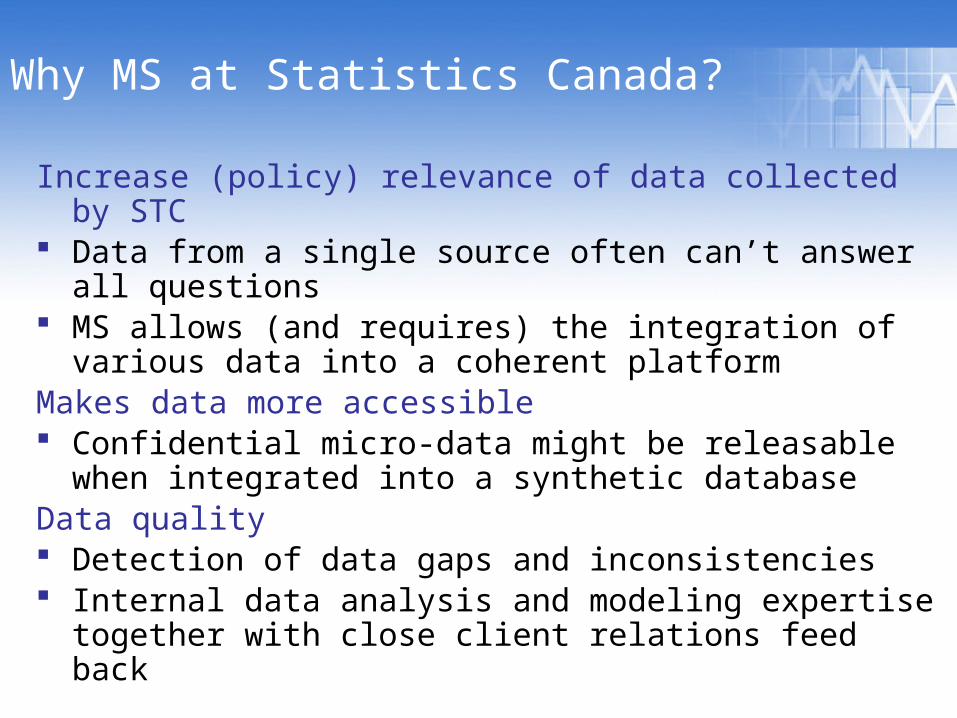
Why MS at Statistics Canada?
Increase (policy) relevance of data collected by STC Data from a single source often can’t answer all questions MS allows (and requires) the integration of various data into a
coherent platformMakes data more accessible Confidential micro-data might be releasable when integrated
into a synthetic databaseData quality Detection of data gaps and inconsistencies Internal data analysis and modeling expertise together with
close client relations feed back
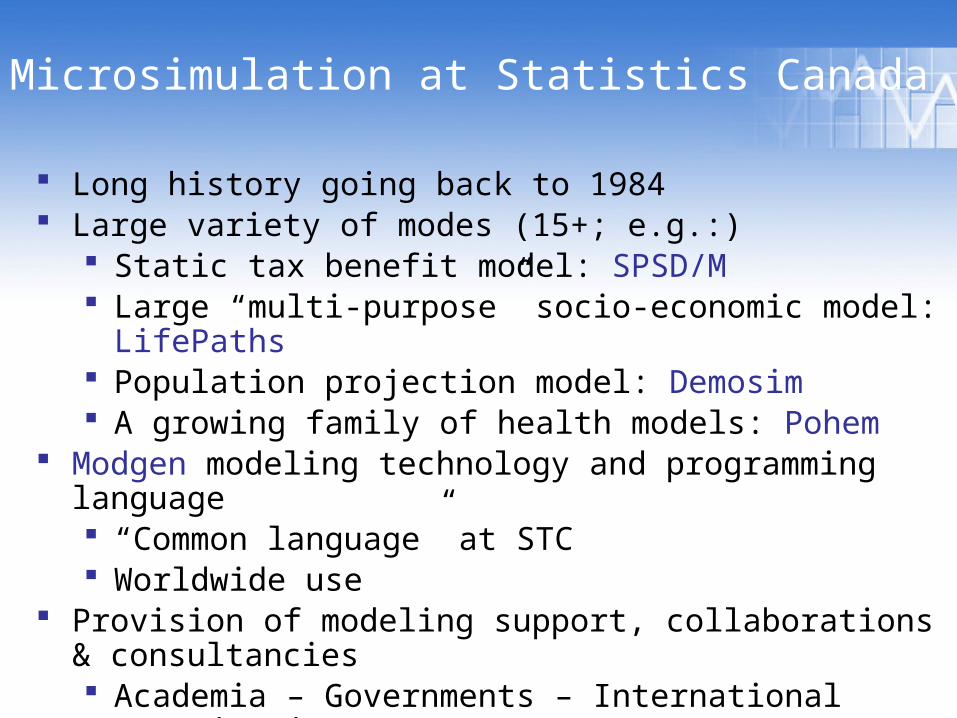
Microsimulation at Statistics Canada
Long history going back to 1984 Large variety of modes (15+; e.g.:)
Static tax benefit model: SPSD/M Large “multi-purpose” socio-economic model: LifePaths Population projection model: Demosim A growing family of health models: Pohem
Modgen modeling technology and programming language “Common language” at STC Worldwide use
Provision of modeling support, collaborations & consultancies Academia – Governments – International Organizations
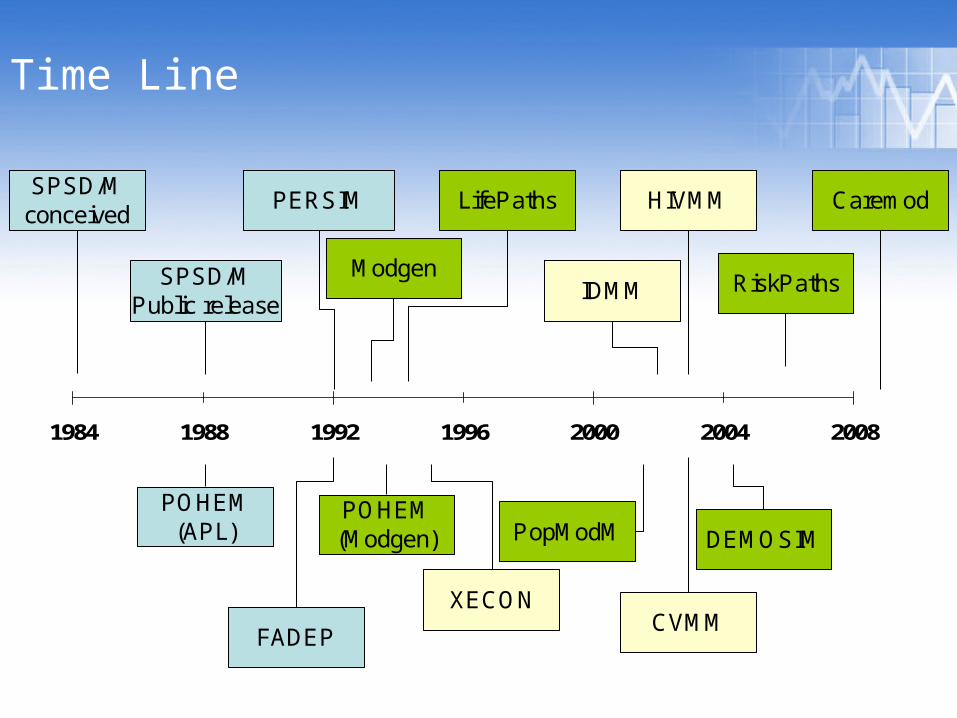
Time Line
POHEM(Modgen)
1984 1988 1992 1996 2000 2004 2008
SPSD/Mconceived
DEMOSIM
POHEM(APL)
FADEP
SPSD/MPublic release
CaremodLifePaths HIVMM
CVMM
IDMM
XECON
PopModM
RiskPathsModgen
PERSIM
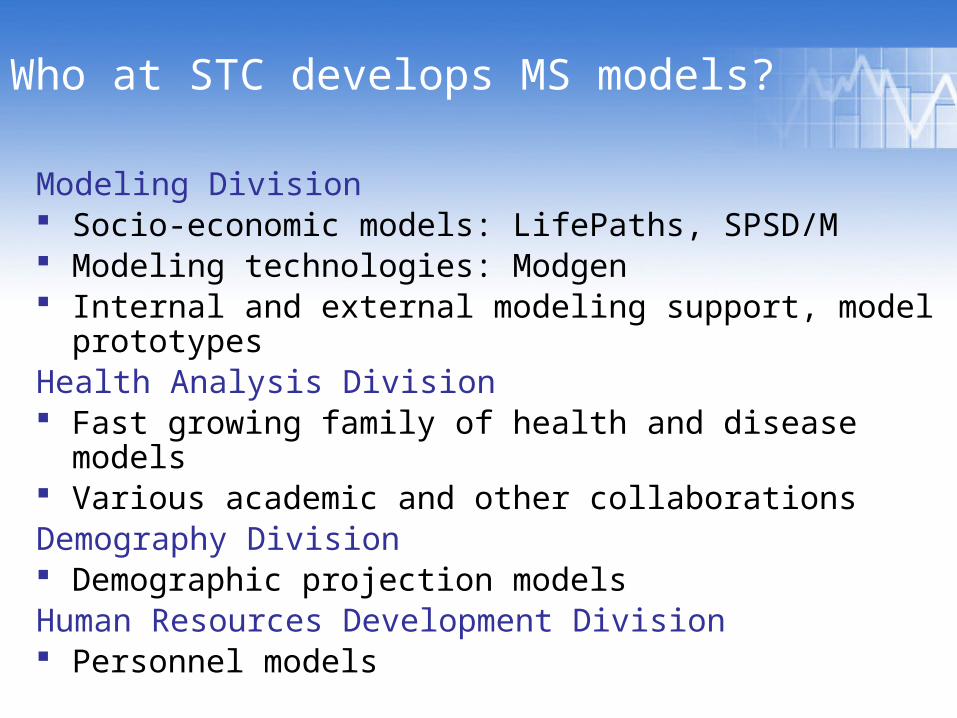
Who at STC develops MS models?
Modeling Division Socio-economic models: LifePaths, SPSD/M Modeling technologies: Modgen Internal and external modeling support, model prototypesHealth Analysis Division Fast growing family of health and disease models Various academic and other collaborationsDemography Division Demographic projection modelsHuman Resources Development Division Personnel models
STATIC MICROSIMULATIONExample: SPSD/M
STATIC MICROSIMULATIONExample: SPSD/M
Model for analysis of tax-transfer changes in a given year Federal & provincial transfers and taxes
Static accounting model Includes tax and transfer rules from 1991 to 2015
Tax and transfer model is controlled by over 1600 parameters Includes commodity taxes & consumption Starting database: synthetic database (~200,000 individuals)
created using 4 datasets
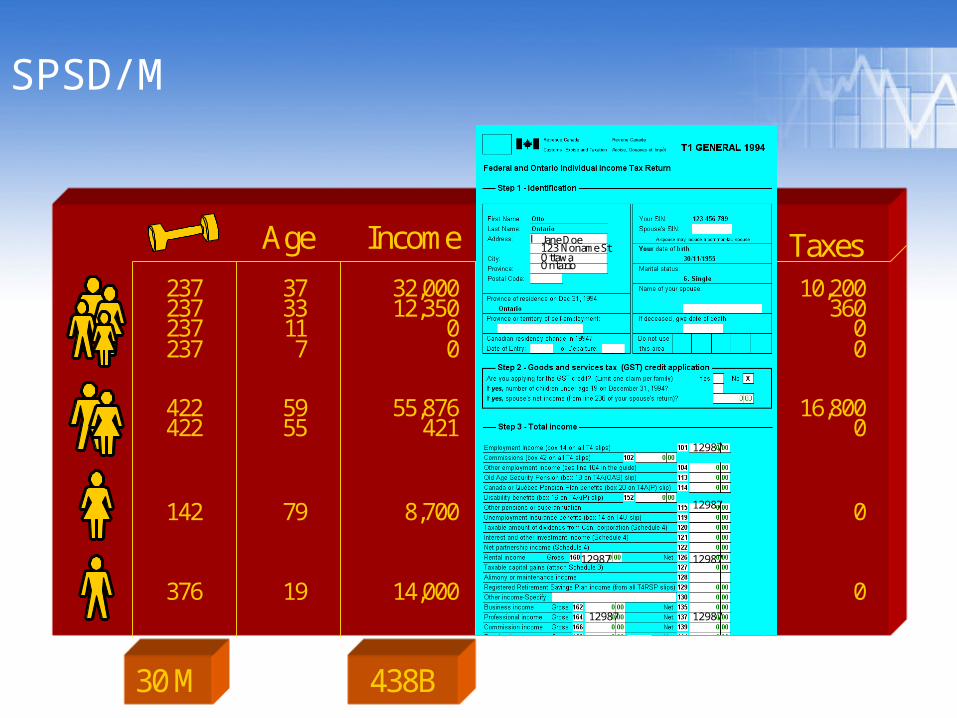
SPSD/M
OAS Taxes237237237237
422422
142
376
Age Income Jane Doe123 Noname StOttawaOntario
12987
12987
12987 12987
12987 12987
3733117
5955
79
19
32,00012,350
00
55,876421
8,700
14,000
30 M 438B
10,200360
00
16,8000
0
0
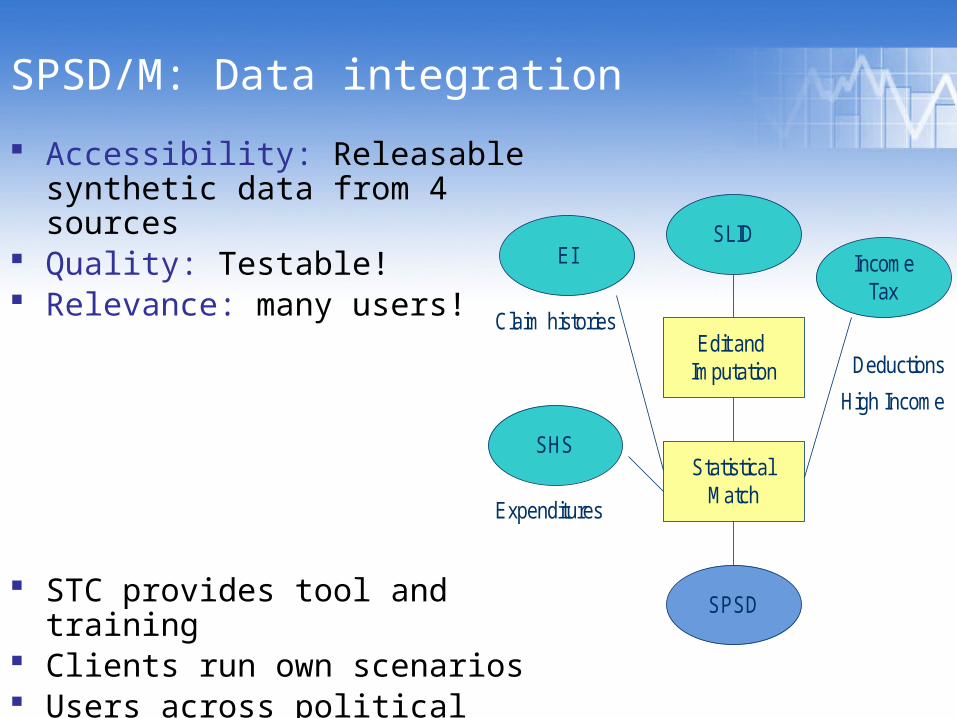
SPSD/M: Data integration
Accessibility: Releasable synthetic data from 4 sources
Quality: Testable! Relevance: many users!
STC provides tool and training Clients run own scenarios Users across political spectrum
SHS
IncomeTax
EISLID
SPSD
Edit and Imputation
Statistical Match
Claim histories
Expenditures
Deductions
High Income
Technology:Modgen programming language
Technology
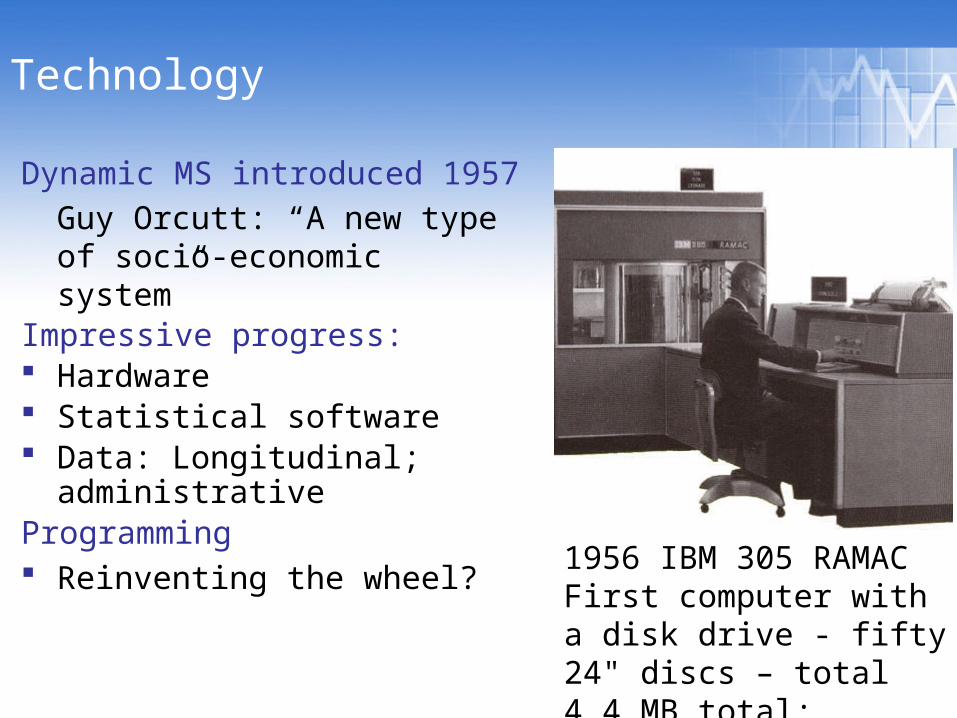
Dynamic MS introduced 1957
Guy Orcutt: “A new type of socio-economic system”
Impressive progress: Hardware Statistical software Data: Longitudinal; administrativeProgramming Reinventing the wheel?
1956 IBM 305 RAMAC First computer with a disk drive - fifty 24" discs – total 4.4 MB total; $35,000/year
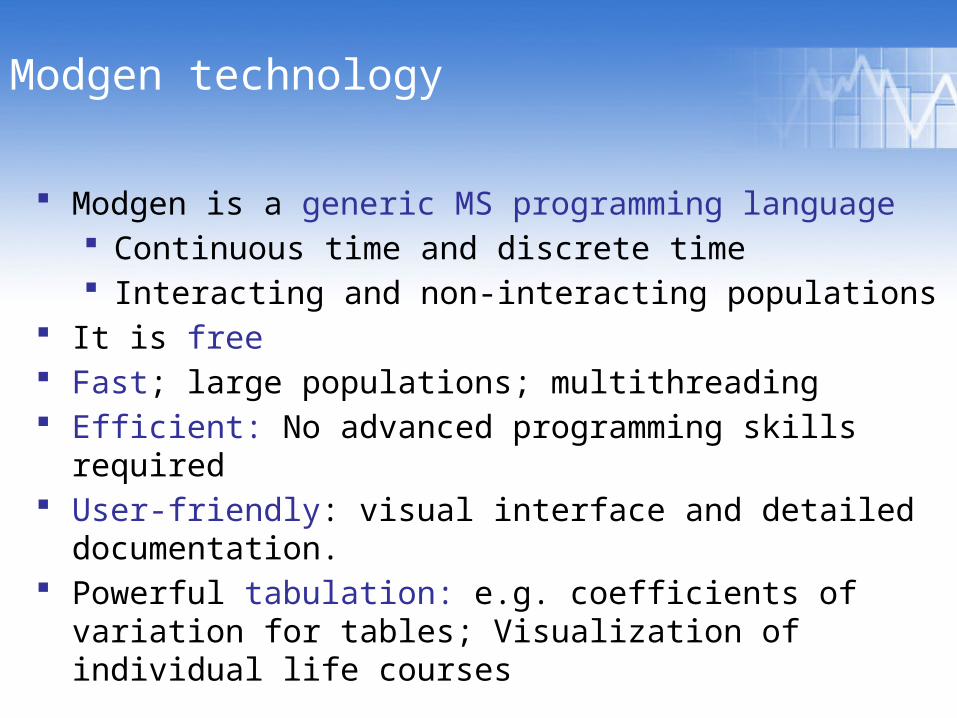
Modgen technology
Modgen is a generic MS programming language Continuous time and discrete time Interacting and non-interacting populations
It is free Fast; large populations; multithreading Efficient: No advanced programming skills required User-friendly: visual interface and detailed documentation. Powerful tabulation: e.g. coefficients of variation for tables;
Visualization of individual life courses
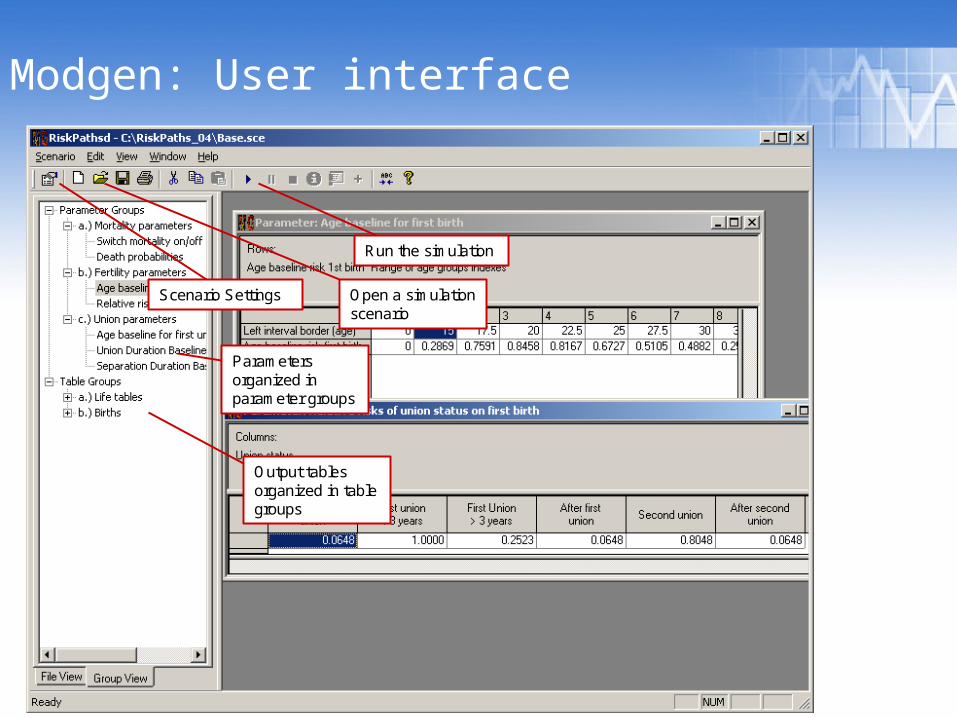
Modgen: User interface
Run the simulation
Parameters organized in parameter groups
Open a simulation scenario
Output tables organized in table groups
Scenario Settings
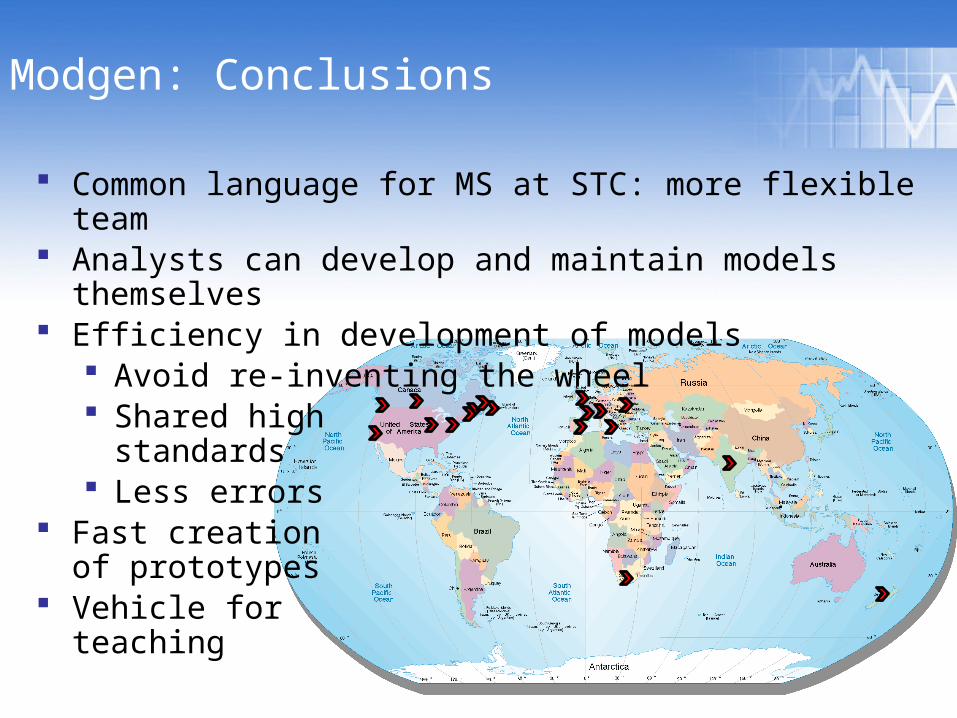
Modgen: Conclusions
Common language for MS at STC: more flexible team Analysts can develop and maintain models themselves Efficiency in development of models
Avoid re-inventing the wheel Shared high
standards Less errors
Fast creation of prototypes
Vehicle for teaching
Population projectionsExample: Demosim
Microsimulation and Demography
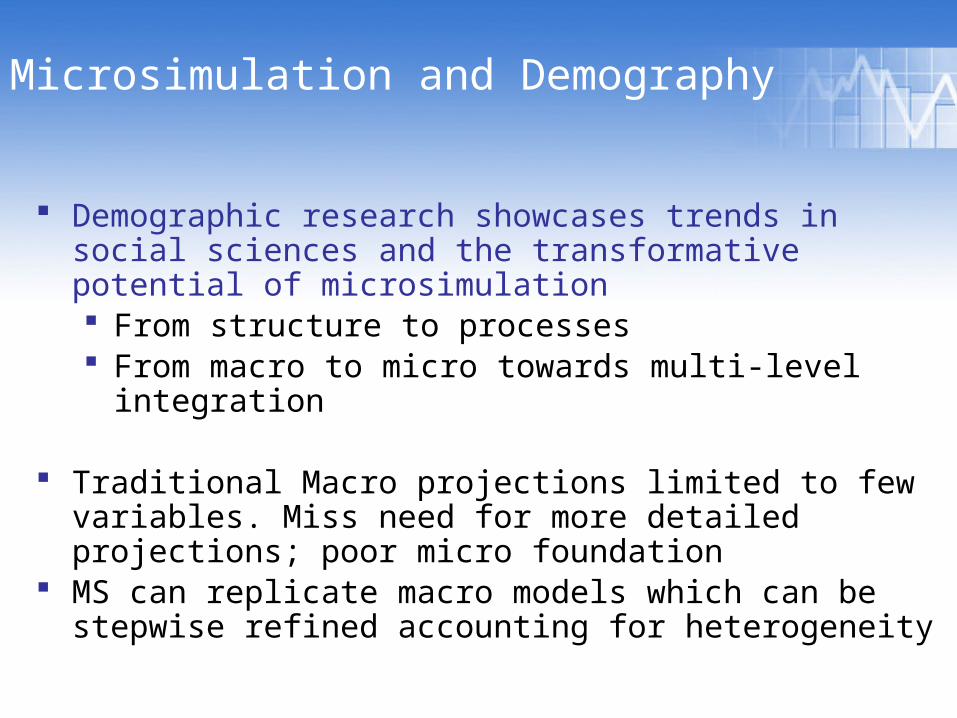
Demographic research showcases trends in social sciences and the transformative potential of microsimulation From structure to processes From macro to micro towards multi-level integration
Traditional Macro projections limited to few variables. Miss need for more detailed projections; poor micro foundation
MS can replicate macro models which can be stepwise refined accounting for heterogeneity
Microsimulation and Demography
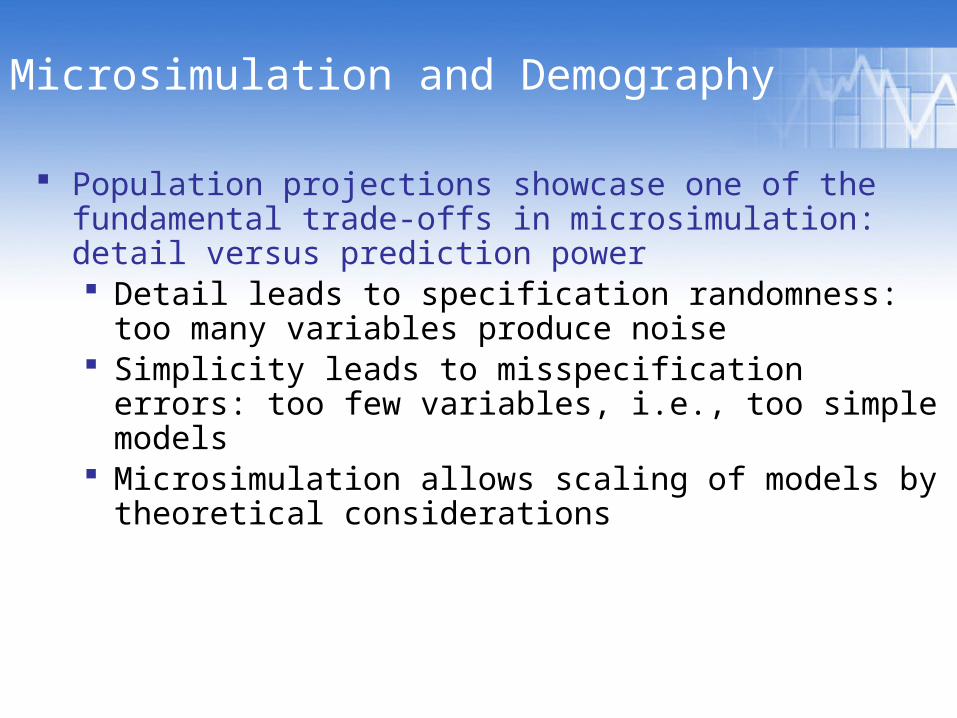
Population projections showcase one of the fundamental trade-offs in microsimulation: detail versus prediction power Detail leads to specification randomness: too many
variables produce noise Simplicity leads to misspecification errors: too few
variables, i.e., too simple models Microsimulation allows scaling of models by theoretical
considerations
Demosim: Context
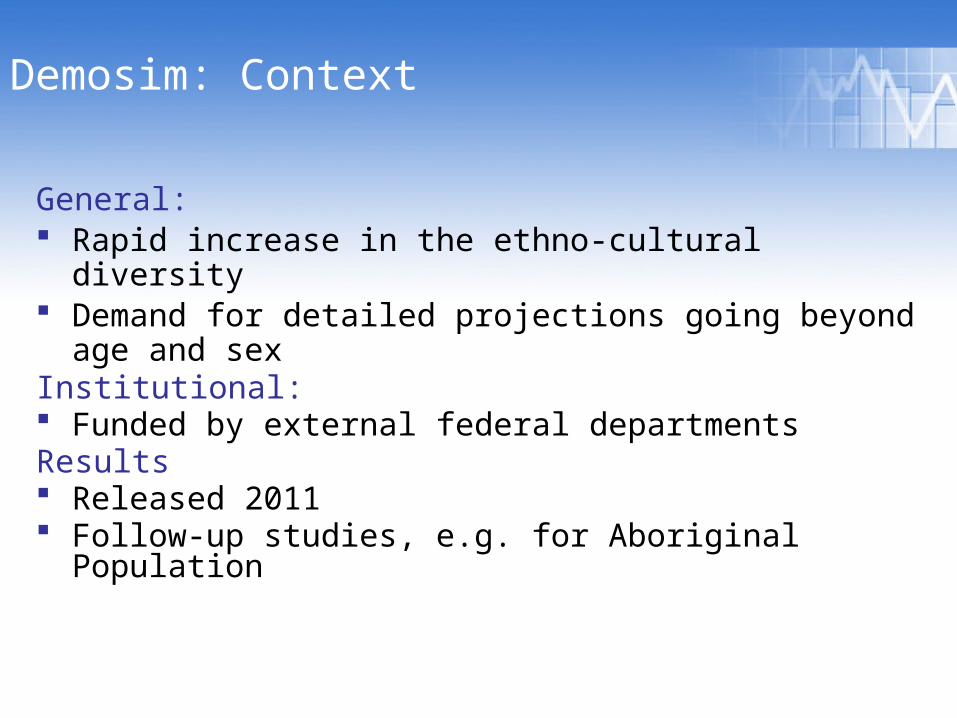
General: Rapid increase in the ethno-cultural diversity Demand for detailed projections going beyond age and sexInstitutional: Funded by external federal departmentsResults Released 2011 Follow-up studies, e.g. for Aboriginal Population
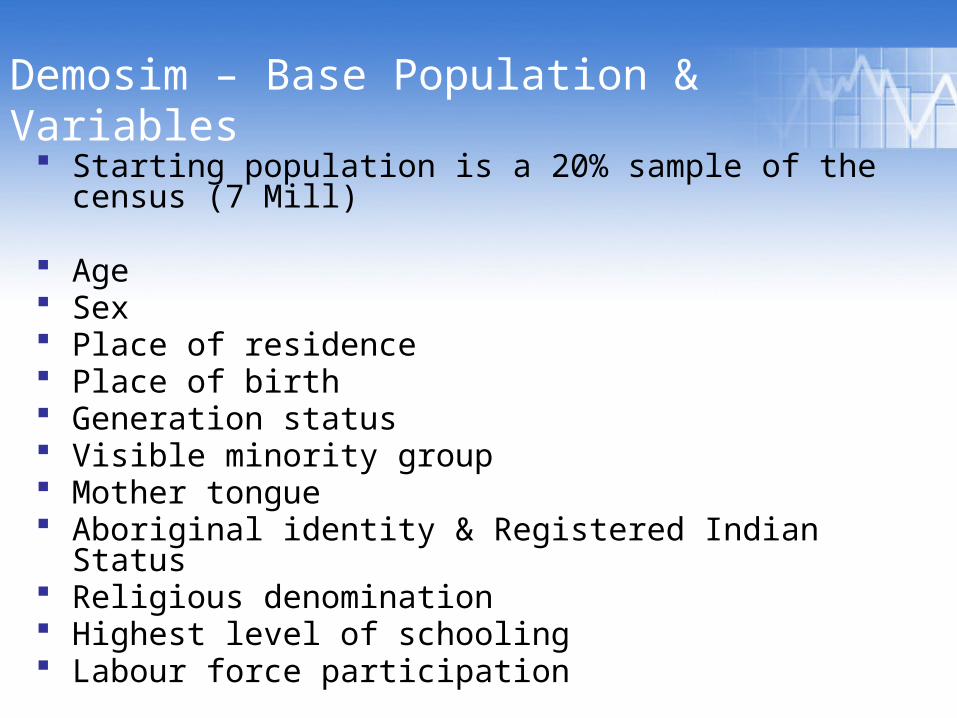
Demosim – Base Population & Variables
Starting population is a 20% sample of the census (7 Mill)
Age Sex Place of residence Place of birth Generation status Visible minority group Mother tongue Aboriginal identity & Registered Indian Status Religious denomination Highest level of schooling Labour force participation
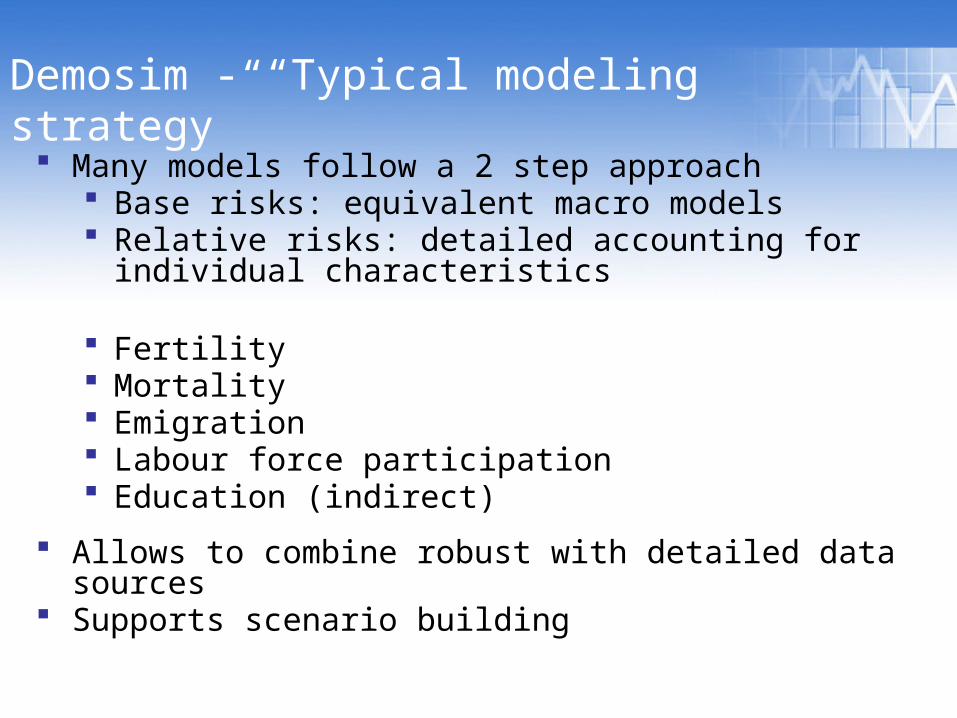
Demosim - “Typical modeling strategy”
Many models follow a 2 step approach Base risks: equivalent macro models Relative risks: detailed accounting for individual
characteristics
Fertility Mortality Emigration Labour force participation Education (indirect)
Allows to combine robust with detailed data sources Supports scenario building
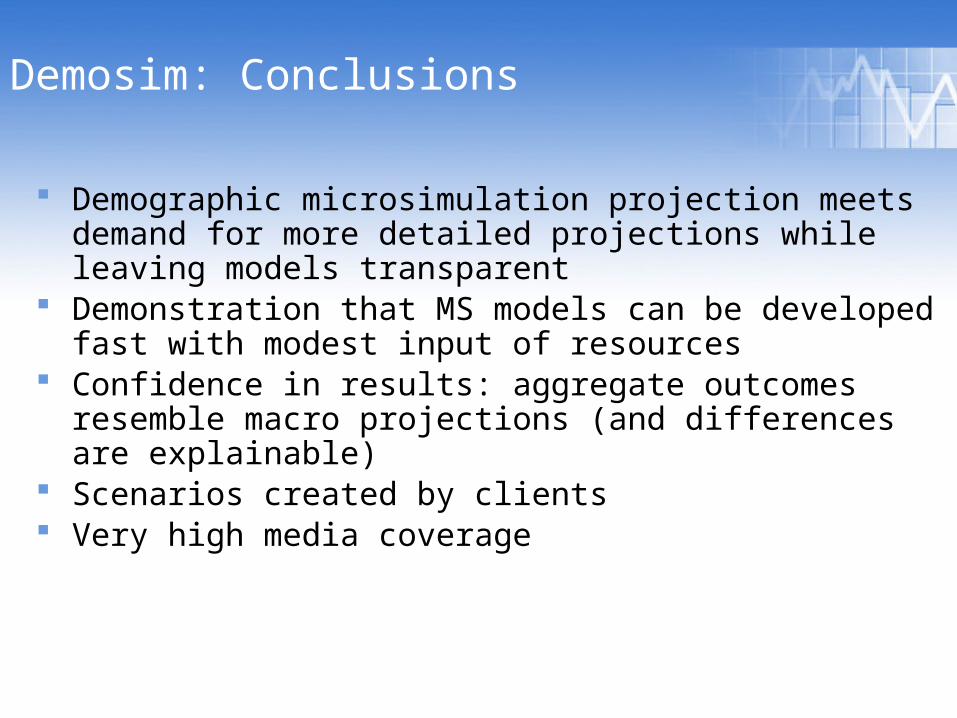
Demosim: Conclusions
Demographic microsimulation projection meets demand for more detailed projections while leaving models transparent
Demonstration that MS models can be developed fast with modest input of resources
Confidence in results: aggregate outcomes resemble macro projections (and differences are explainable)
Scenarios created by clients Very high media coverage
Large multi-purpose dynamic modelsExample: LifePaths
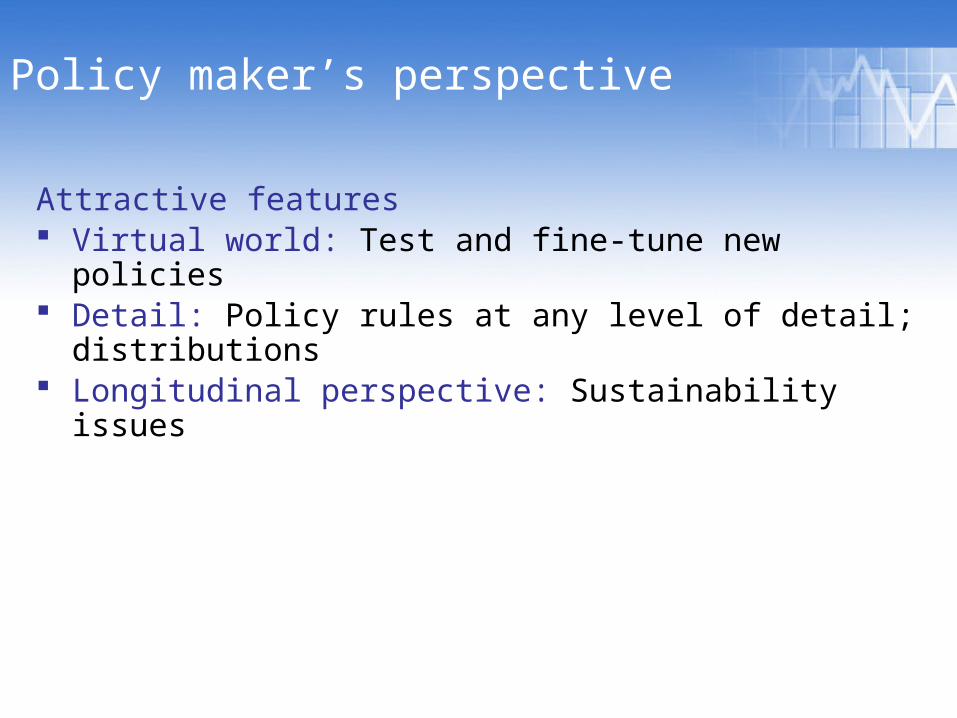
Policy maker’s perspective
Attractive features Virtual world: Test and fine-tune new policies Detail: Policy rules at any level of detail; distributions Longitudinal perspective: Sustainability issues
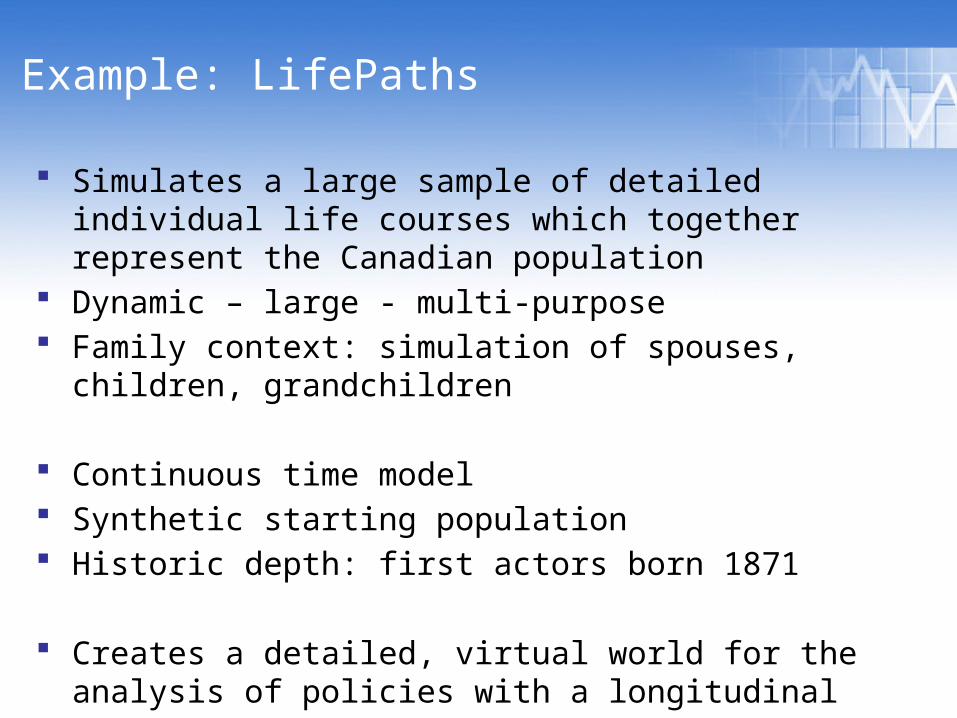
Example: LifePaths
Simulates a large sample of detailed individual life courses which together represent the Canadian population
Dynamic – large - multi-purpose Family context: simulation of spouses, children, grandchildren
Continuous time model Synthetic starting population Historic depth: first actors born 1871
Creates a detailed, virtual world for the analysis of policies with a longitudinal component
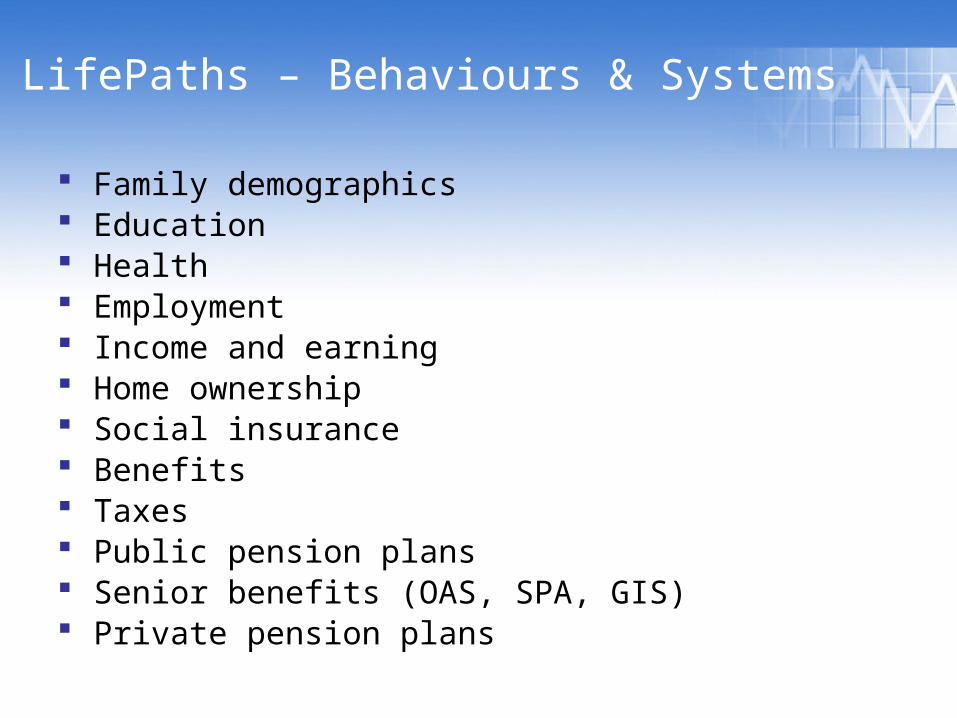
LifePaths – Behaviours & Systems
Family demographics Education Health Employment Income and earning Home ownership Social insurance Benefits Taxes Public pension plans Senior benefits (OAS, SPA, GIS) Private pension plans
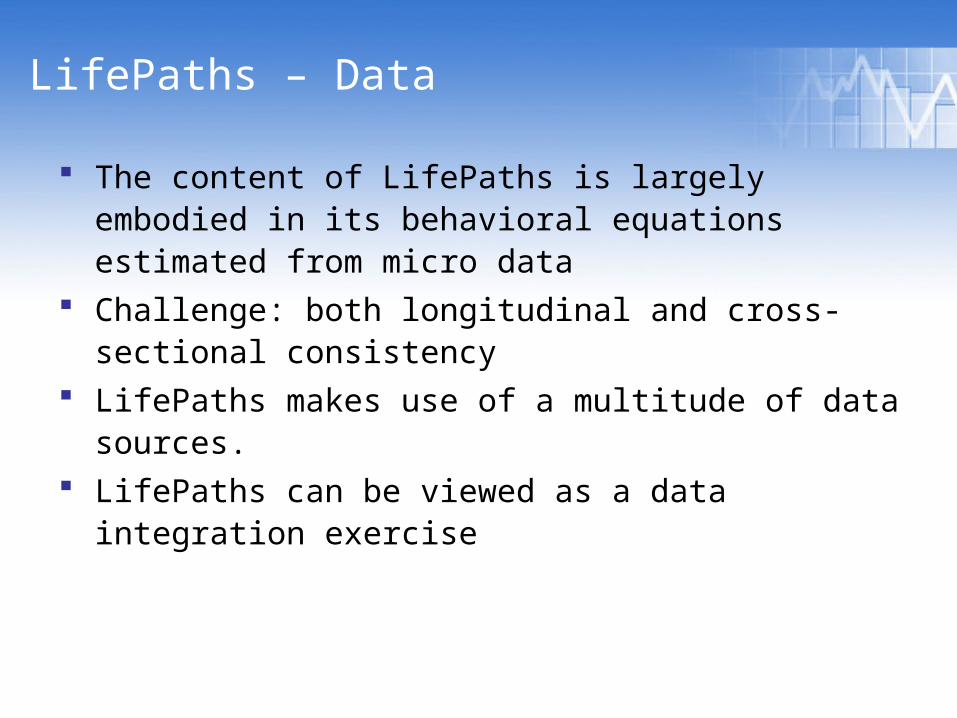
LifePaths – Data
The content of LifePaths is largely embodied in its behavioral equations estimated from micro data
Challenge: both longitudinal and cross-sectional consistency
LifePaths makes use of a multitude of data sources. LifePaths can be viewed as a data integration exercise
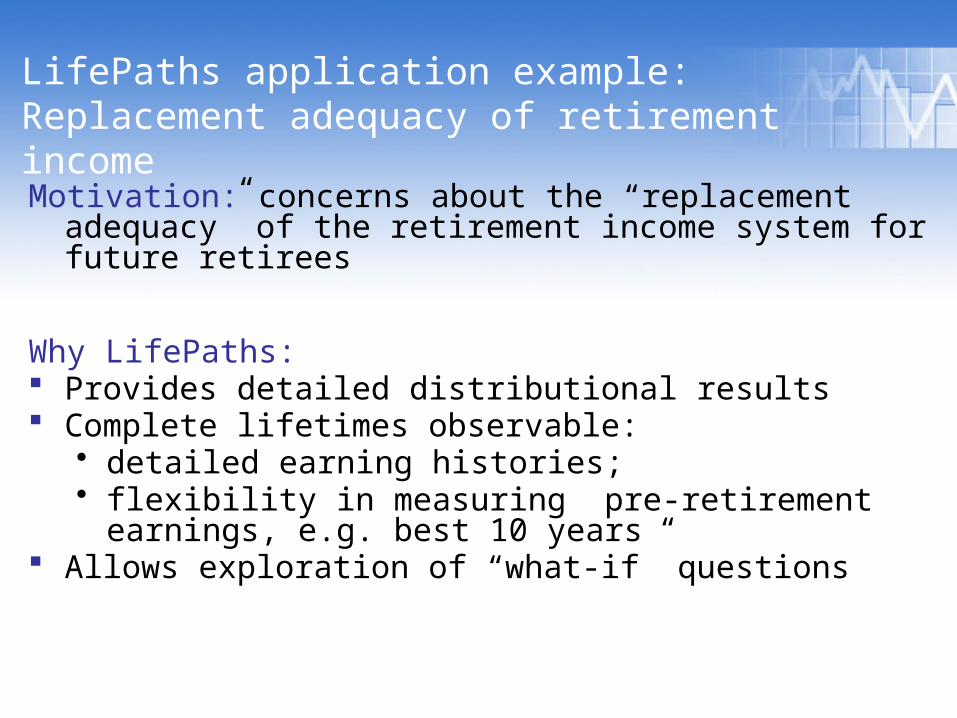
LifePaths application example: Replacement adequacy of retirement income
Motivation: concerns about the “replacement adequacy” of the retirement income system for future retirees
Why LifePaths: Provides detailed distributional results Complete lifetimes observable:
• detailed earning histories; • flexibility in measuring pre-retirement earnings, e.g. best
10 years Allows exploration of “what-if” questions
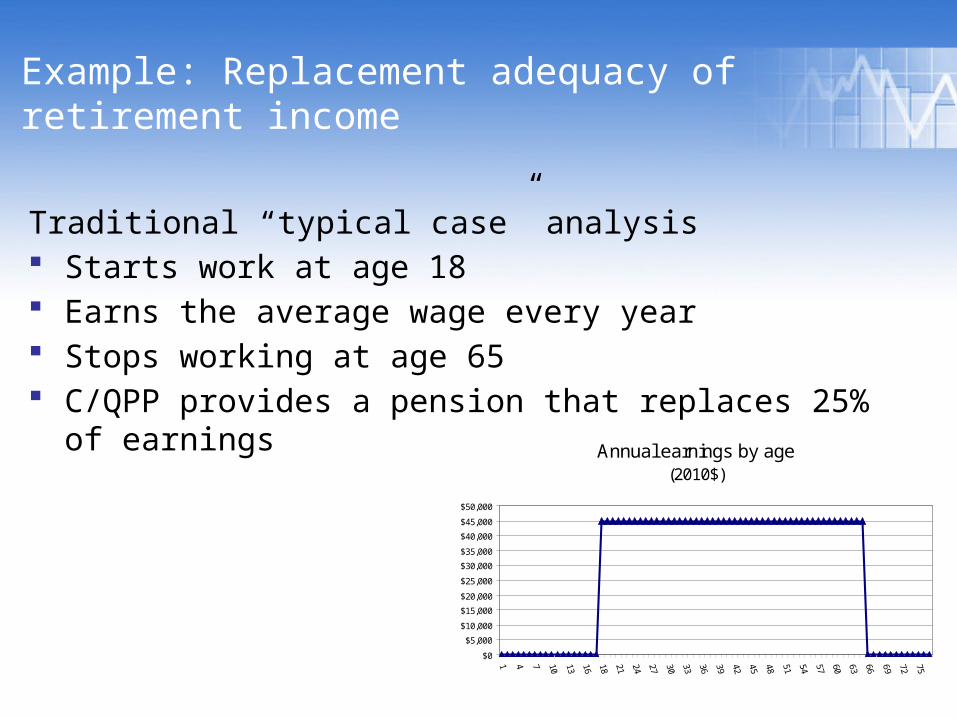
Example: Replacement adequacy of retirement income
Traditional “typical case” analysis Starts work at age 18 Earns the average wage every year Stops working at age 65 C/QPP provides a pension that replaces 25% of earnings
Annual earnings by age (2010$)
$0
$5,000
$10,000
$15,000
$20,000
$25,000
$30,000
$35,000
$40,000
$45,000
$50,000
1 4 7 10 13 16 18 21 24 27 30 33 36 39 42 45 48 51 54 57 60 63 66 69 72 75
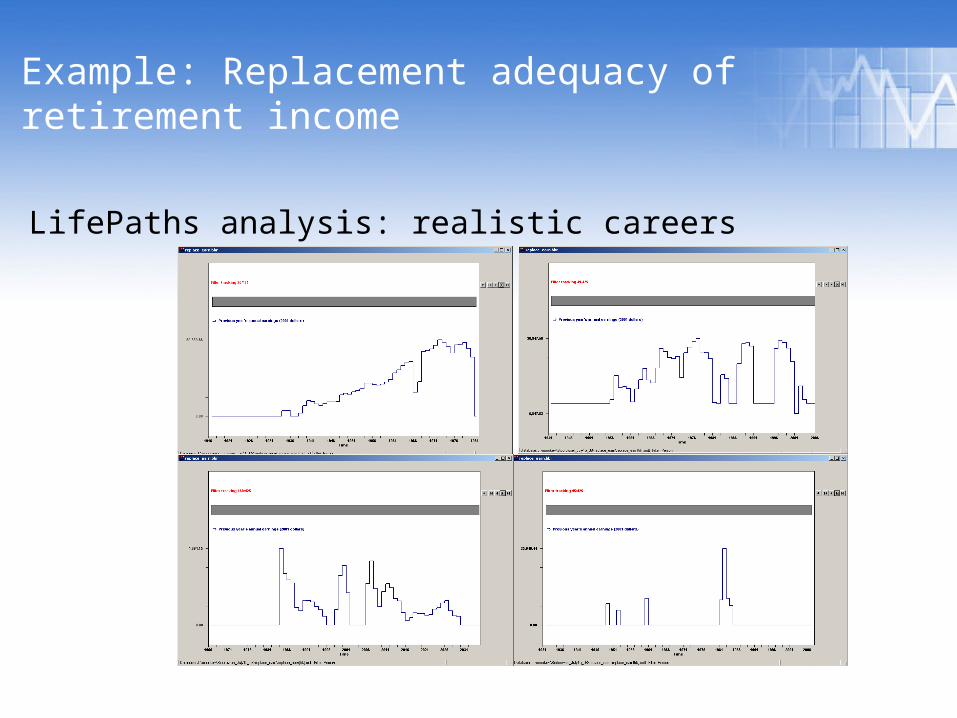
Example: Replacement adequacy of retirement income
LifePaths analysis: realistic careers
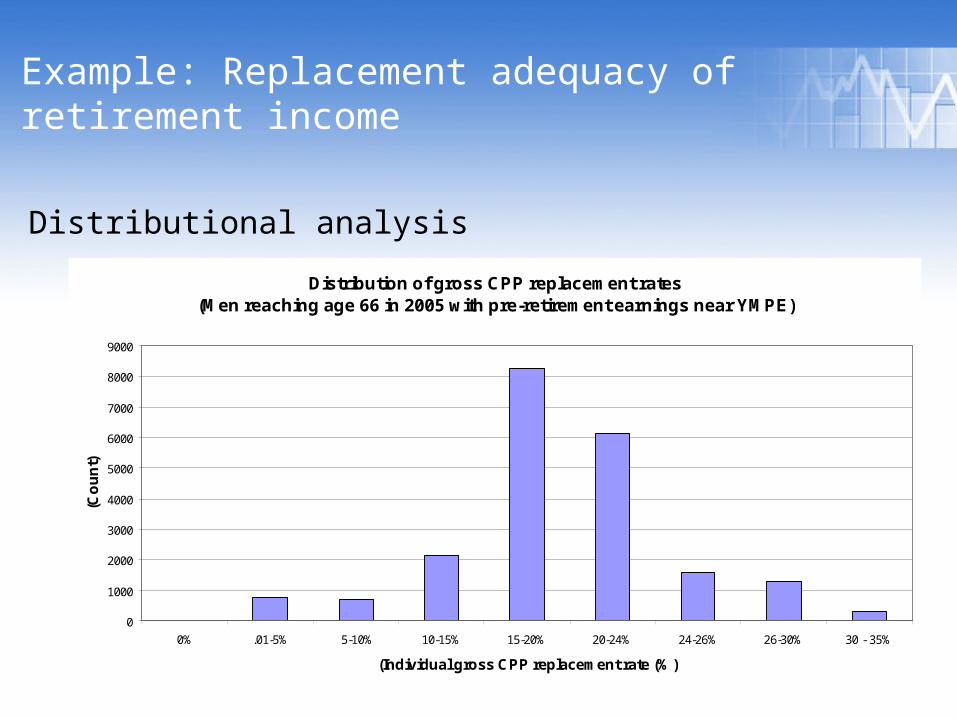
Example: Replacement adequacy of retirement income
Distributional analysis
Distribution of gross CPP replacement rates (Men reaching age 66 in 2005 with pre-retirement earnings near YMPE)
0
1000
2000
3000
4000
5000
6000
7000
8000
9000
0% .01-5% 5-10% 10-15% 15-20% 20-24% 24-26% 26-30% 30 - 35%
(Individual gross CPP replacement rate (%)
(Co
un
t)
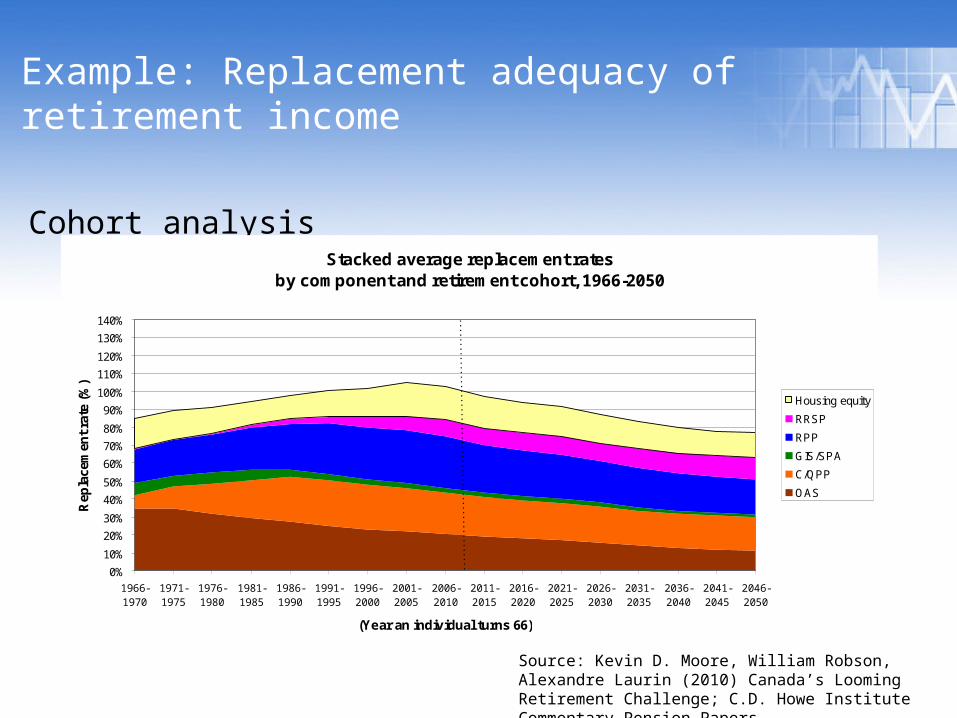
Example: Replacement adequacy of retirement income
Cohort analysisStacked average replacement rates
by component and retirement cohort, 1966-2050
0%
10%
20%
30%
40%
50%
60%
70%
80%
90%
100%
110%
120%
130%
140%
1966-1970
1971-1975
1976-1980
1981-1985
1986-1990
1991-1995
1996-2000
2001-2005
2006-2010
2011-2015
2016-2020
2021-2025
2026-2030
2031-2035
2036-2040
2041-2045
2046-2050
(Year an individual turns 66)
Rep
lace
men
t ra
te (
%)
Housing equity
RRSP
RPP
GIS/SPA
C/QPP
OAS
Source: Kevin D. Moore, William Robson, Alexandre Laurin (2010) Canada’s Looming Retirement Challenge; C.D. Howe Institute Commentary Pension Papers
Example: Replacement adequacy of retirement income
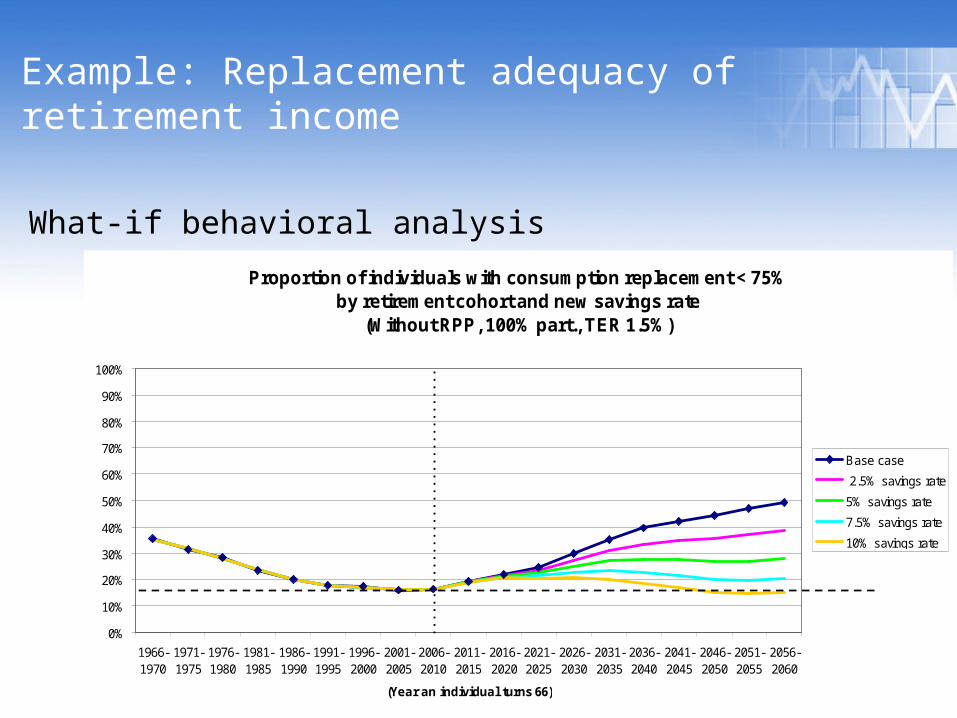
What-if behavioral analysis
Proportion of individuals with consumption replacement < 75% by retirement cohort and new savings rate
(Without RPP, 100% part., TER 1.5%)
0%
10%
20%
30%
40%
50%
60%
70%
80%
90%
100%
1966-1970
1971-1975
1976-1980
1981-1985
1986-1990
1991-1995
1996-2000
2001-2005
2006-2010
2011-2015
2016-2020
2021-2025
2026-2030
2031-2035
2036-2040
2041-2045
2046-2050
2051-2055
2056-2060
(Year an individual turns 66)
Base case
2.5% savings rate
5% savings rate
7.5% savings rate
10% savings rate
Recent retirees
LifePaths: Benefits & Lessons
Complex “general purpose” models come at a price but are very flexible for a wide field of policy applications
Policy needs ebb and flow; balancing updates and core development with client’s applications is a difficult task.
Many spin-offs (which have to be valued) Expertise; “training lab” Readiness: base for new applications, fast response to
new policy demands Contribution to quality and relevance of data
Conclusions
There are many reasons for expecting a boom in MS Many policy questions require MS MS is a logical next step complementing data analysis MS will probably replace many cell-based models:
population projection, actuarial models, disease models Technologies like Modgen make MS accessible
Microsimulation is still under-used and has to find its way into the standard toolbox of social scientists and into classrooms
Students pick up the ideas and develop skills fast Microsimulation has high data demands. Statistical offices are
a logical collaborator in microsimulation projects; In return MS can enhance the relevance, quality, and accessibility of data