Embed Size (px)
Citation preview

Microsoft Excel
Working with Excel Lists, Subtotals and Pivot Tables
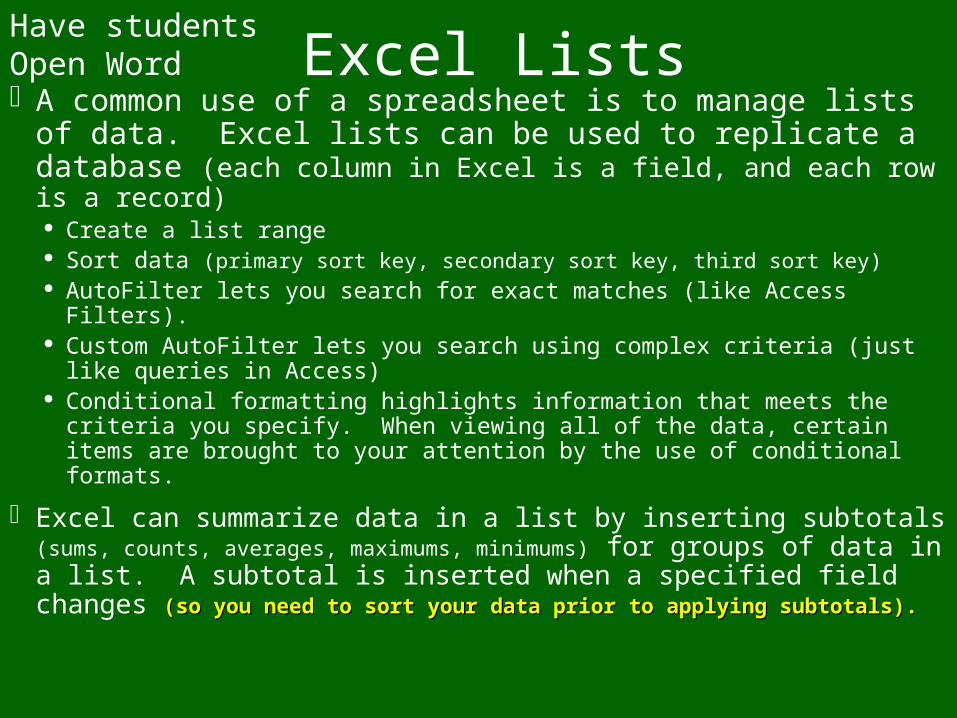
Excel ListsA common use of a spreadsheet is to manage lists of data.
Excel lists can be used to replicate a database (each column in Excel is a field, and each row is a record)
Create a list range Sort data (primary sort key, secondary sort key, third sort key) AutoFilter lets you search for exact matches (like Access Filters). Custom AutoFilter lets you search using complex criteria (just like
queries in Access) Conditional formatting highlights information that meets the criteria you
specify. When viewing all of the data, certain items are brought to your attention by the use of conditional formats.
Excel can summarize data in a list by inserting subtotals (sums, counts, averages, maximums, minimums) for groups of data in a list. A subtotal is inserted when a specified field changes (so you need to (so you need to sort your data prior to applying subtotals).sort your data prior to applying subtotals).
Have students Open Word
Pivot TablesExcel lists often contain a wealth of information, but
because there is so much detailed data present, it is often difficult to form a clear overall view of the information.
A Pivot Table is an interactive report that enables you to group and summarize an Excel list into a concise table format for easier reporting and analysis. Can be used to summarize data into different categories
using functions such as COUNT, SUM, AVERAGE, MAX, and MIN.
Pivot TablesTo generate a Pivot Table, you can specify the
dimensions by which you wish to view the data (one factor or multiple factors), which allows you to see relationships in the data.
Using the data fields, you specify What field is to be used to create row items What field is to be used to create column headings. What field or fields are to be used data area/data items Report Filters (Page fields) can be used to filter the Pivot
Table
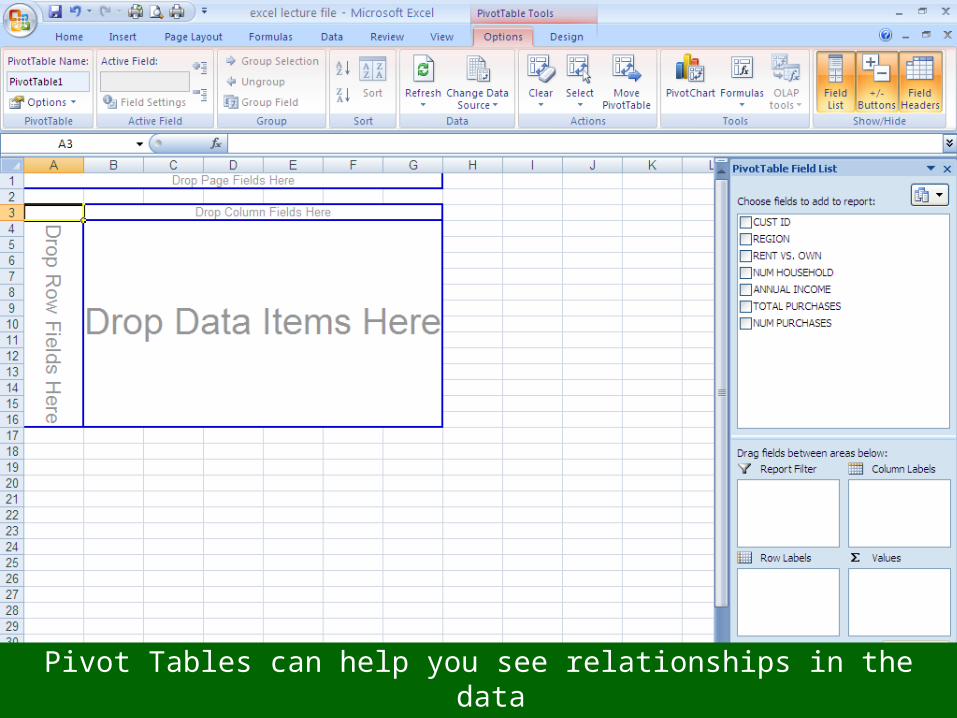
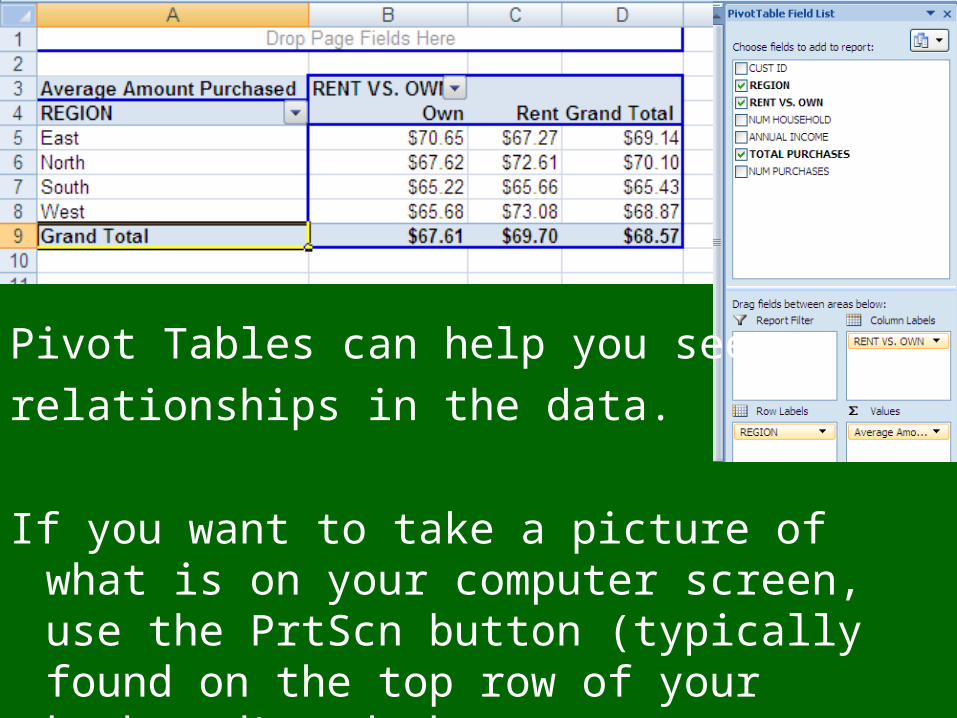
Pivot Tables can help you see relationships in the data
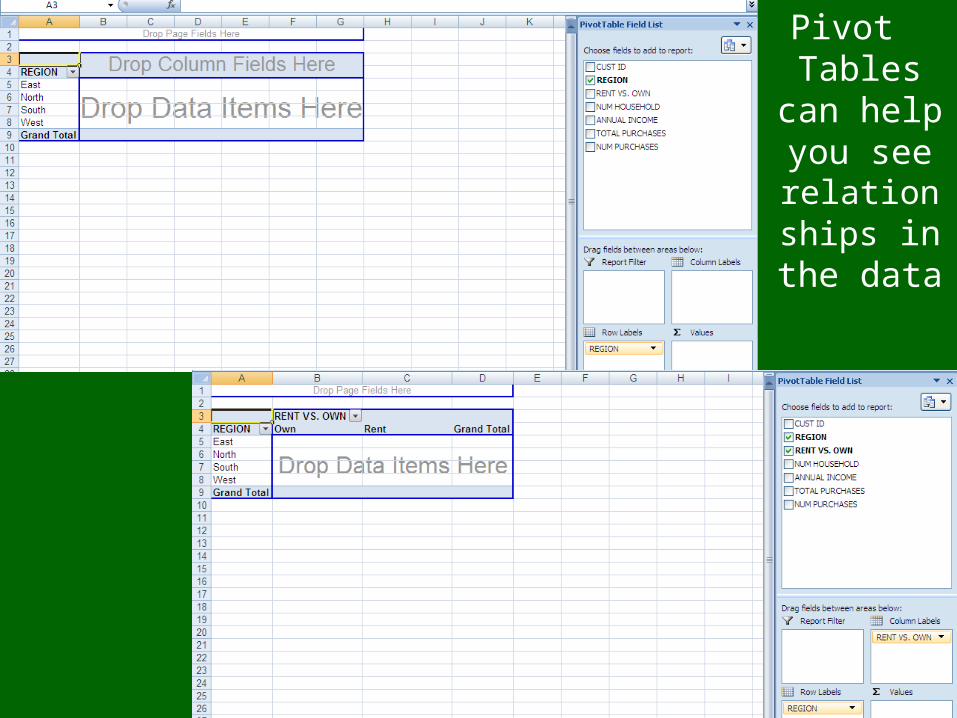
Pivot Tables can help you see
relationships in the data
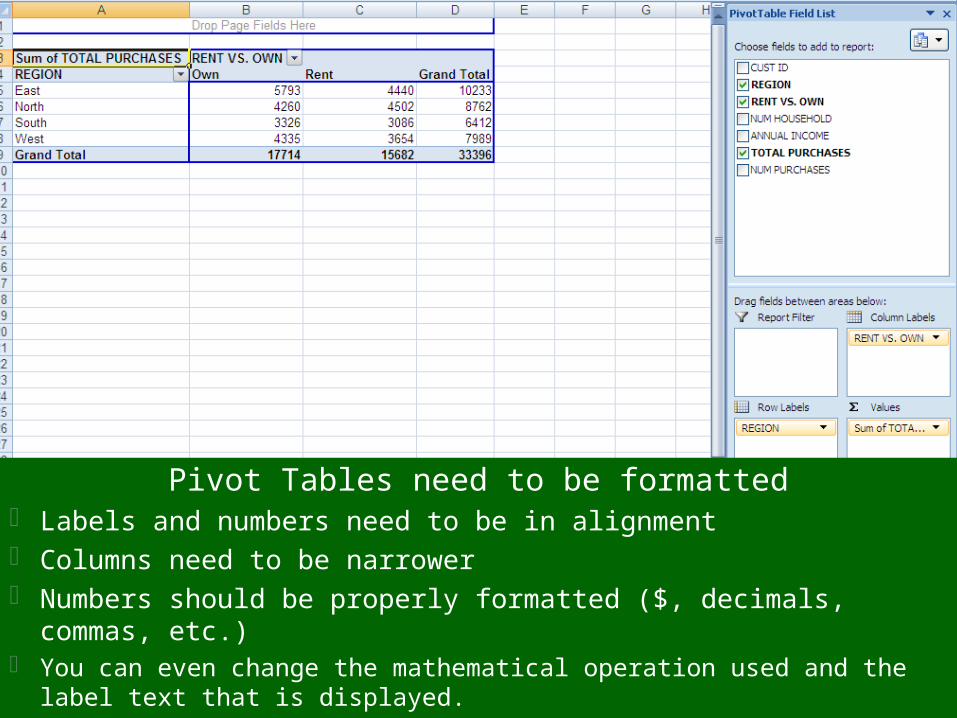
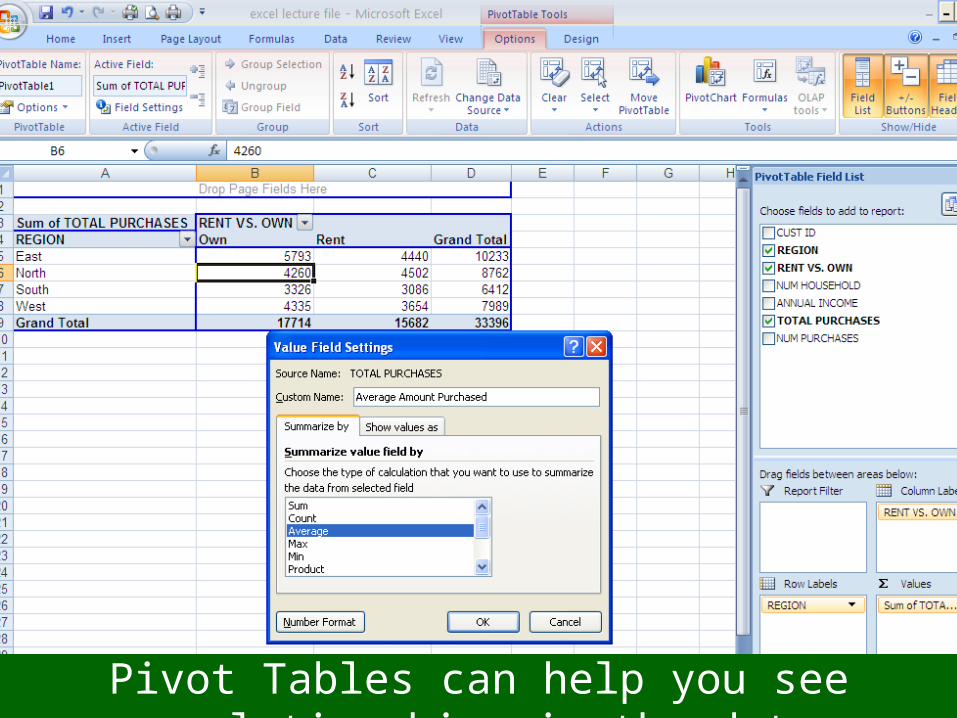
Pivot Tables need to be formatted Labels and numbers need to be in alignment Columns need to be narrower Numbers should be properly formatted ($, decimals, commas, etc.) You can even change the mathematical operation used and the label text that
is displayed.
Pivot Tables can help you see relationships in the data
Pivot Tables can help you see
relationships in the data.
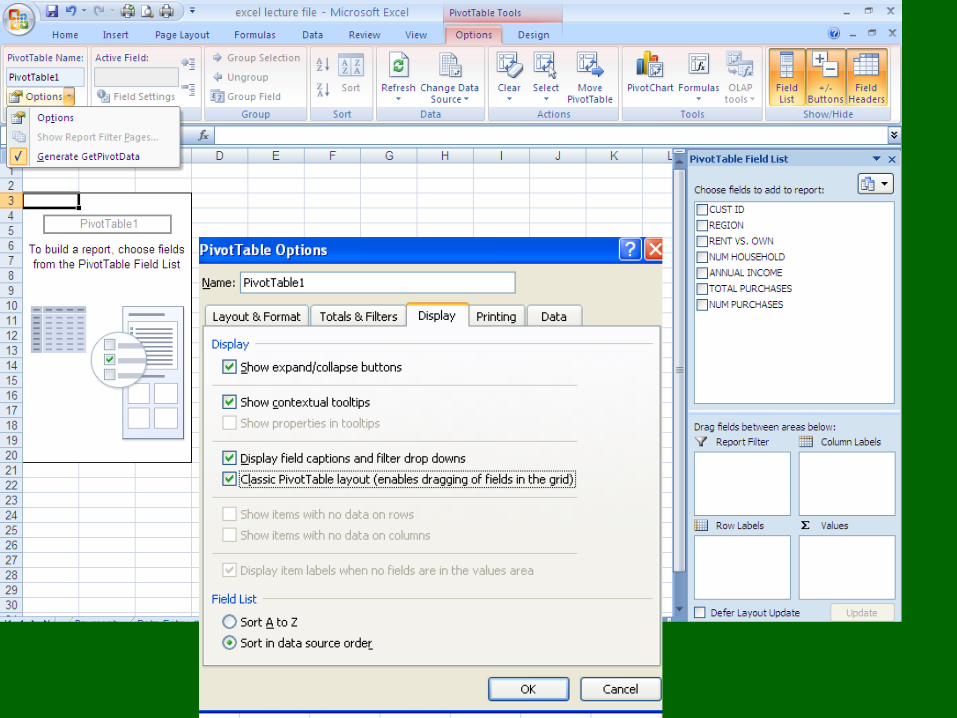
If you want to take a picture of what is on your computer screen, use the PrtScn button (typically found on the top row of your keyboard) and then
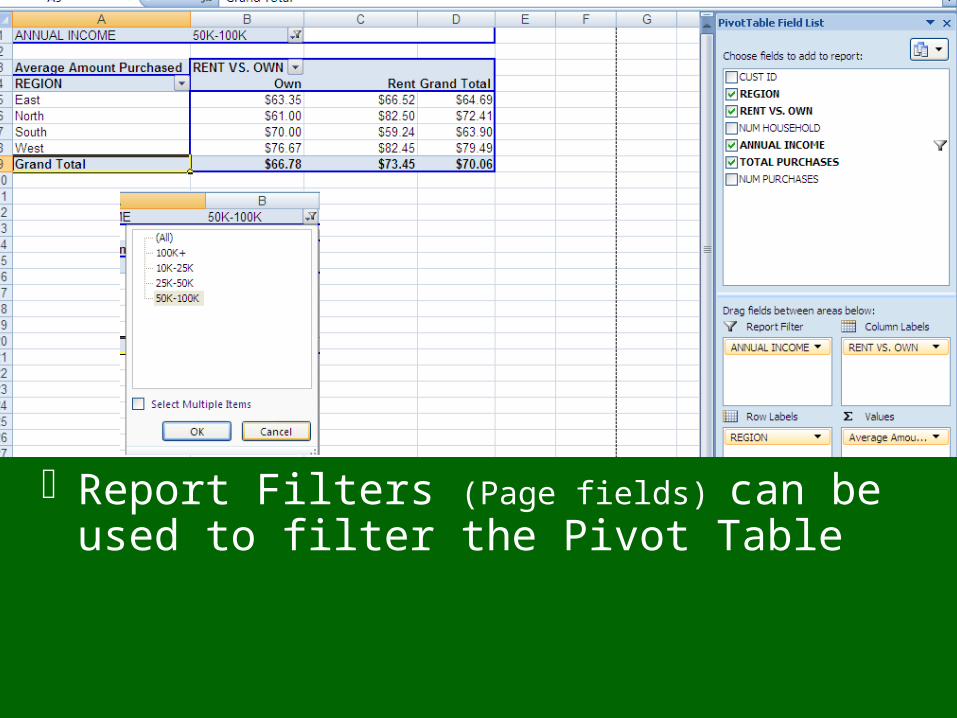
Report Filters (Page fields) can be used to filter the Pivot Table
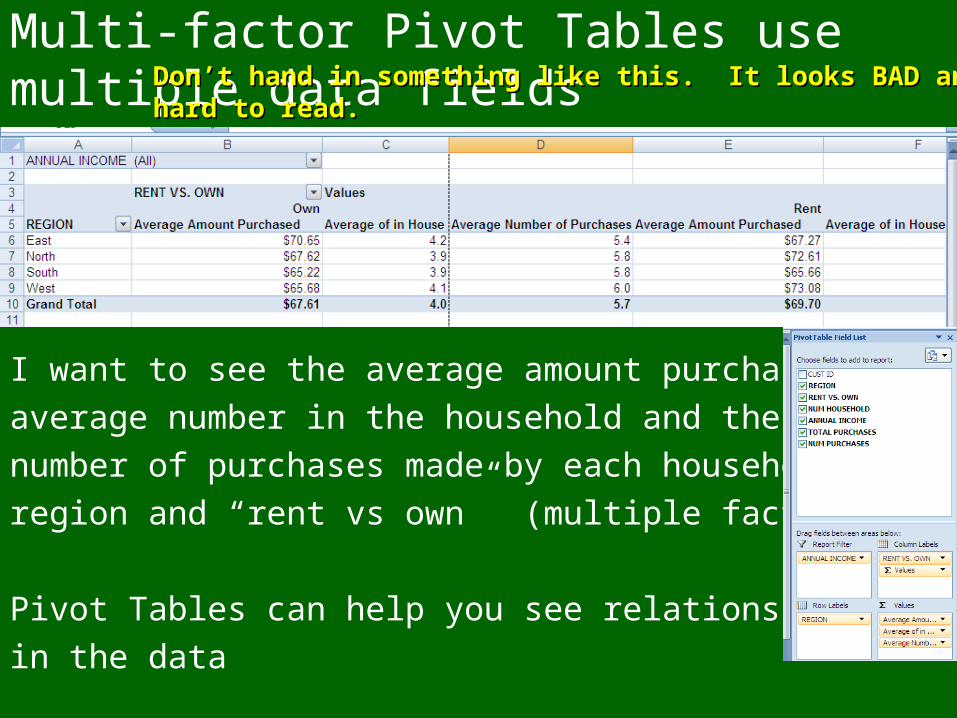
Multi-factor Pivot Tables use multiple data fields
I want to see the average amount purchased, the
average number in the household and the average
number of purchases made by each household, by
region and “rent vs own” (multiple factors)
Pivot Tables can help you see relationships
in the data
Don’t hand in something like this. It looks BAD and is hard to read.Don’t hand in something like this. It looks BAD and is hard to read.
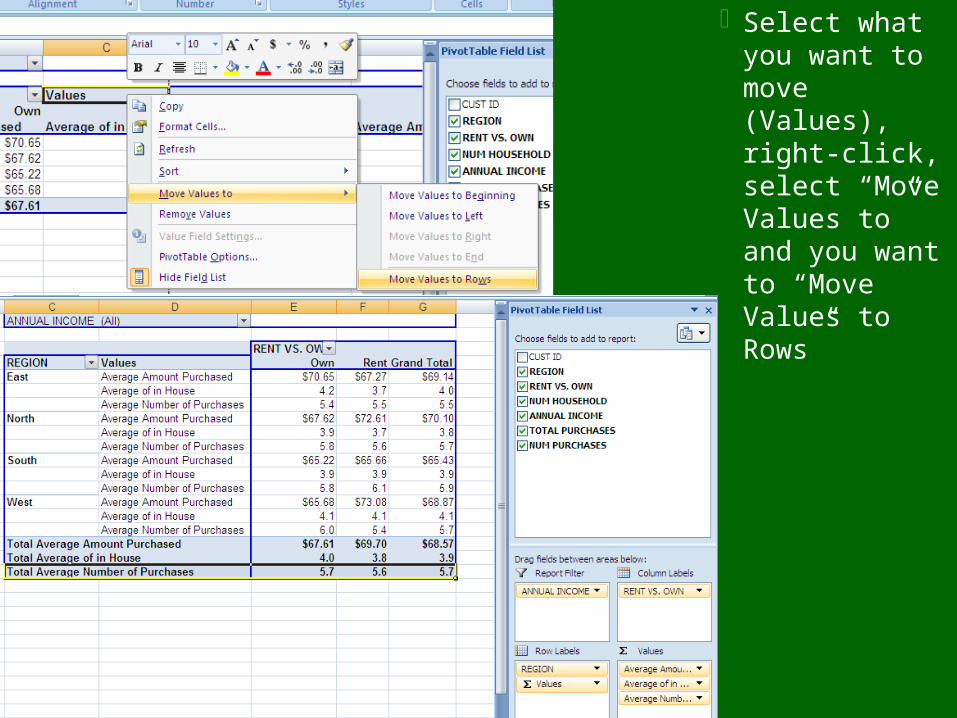
Select what you want to move (Values), right-click, select “Move Values to” and you want to “Move Values to Rows”


![Excel Training Pivot Tables[1]](https://img.pdfslide.net/doc/110x75/55cf8ab355034654898d1682/excel-training-pivot-tables1.jpg)