Embed Size (px)
Citation preview
Trace metals in speleothems: LA-ICP-MS vs synchrotron techniques
Andrea Borsato,the University of Newcastle, Australia
Acknowledgment: S. Frisia, R. Belli (Newcastle), J. Hellstrom, J.Woodhead (Melbourne), I.J. Fairchild (Birmingham), V.Johnston (Trento), S.Eggins (Canberra),M.Cotte, M.Salomè, J.Susini, A. Somogyi (Grenoble),
1. SR applications in speleothem science
2. Soft vs. hard X-ray
3. Sample preparation, spatial resolution,
4. Spectral interference
5. Detection limits and measurable elements
6. Calibration
7. Examples and environmental interpretation
OUTLINE 1. Synchrotron RadiationTechniques
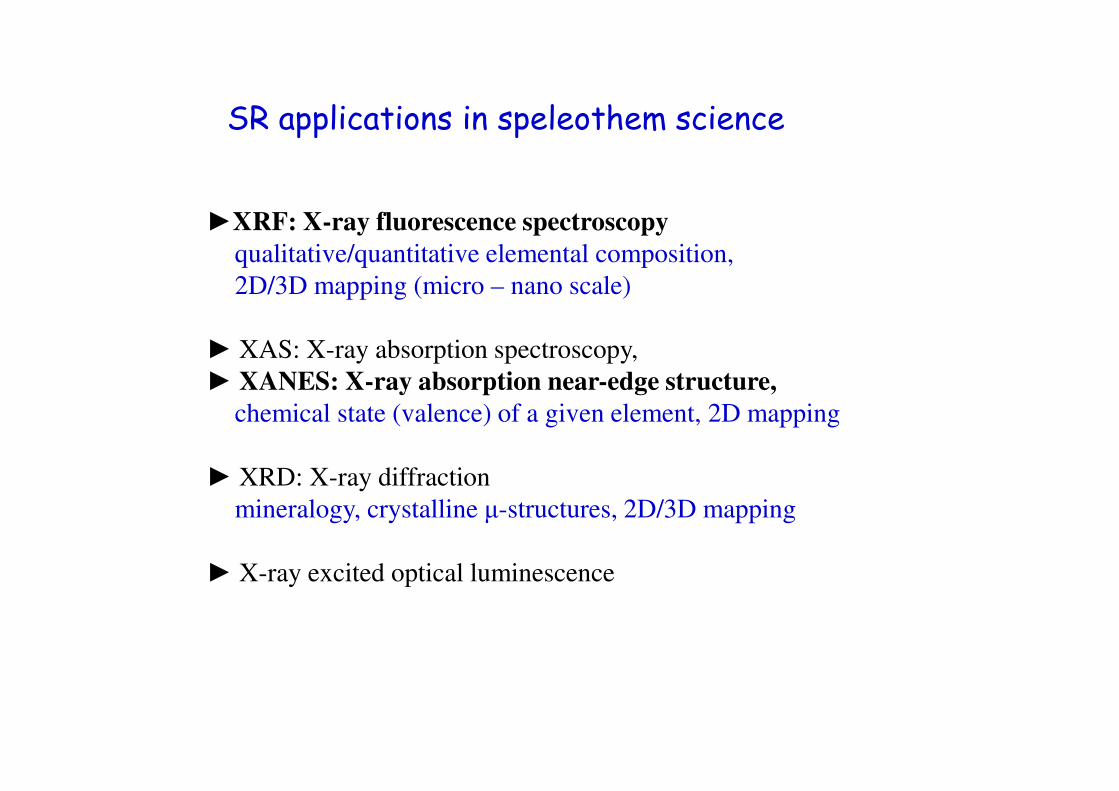
►XRF: X-ray fluorescence spectroscopy
qualitative/quantitative elemental composition,
2D/3D mapping (micro – nano scale)
► XAS: X-ray absorption spectroscopy,
► XANES: X-ray absorption near-edge structure,
chemical state (valence) of a given element, 2D mapping
► XRD: X-ray diffraction
mineralogy, crystalline µ-structures, 2D/3D mapping
► X-ray excited optical luminescence
SR applications in speleothem science
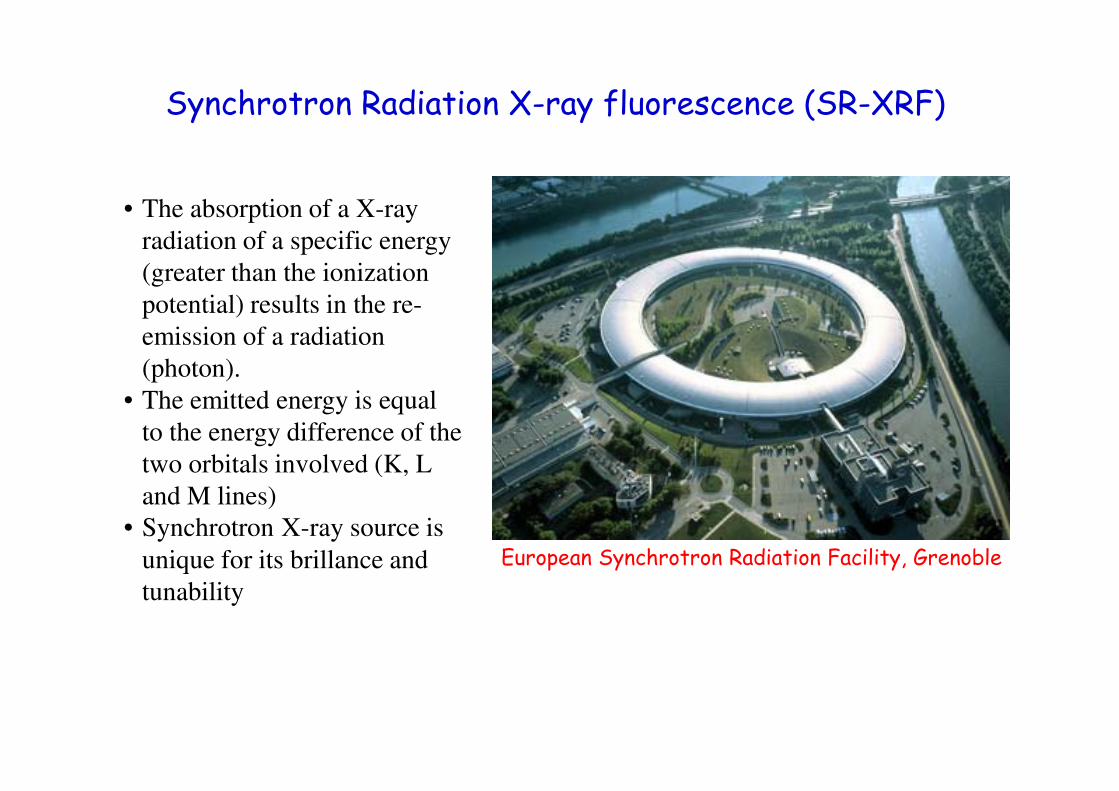
Synchrotron Radiation X-ray fluorescence (SR-XRF)
• The absorption of a X-ray
radiation of a specific energy
(greater than the ionization
potential) results in the re-
emission of a radiation
(photon).
• The emitted energy is equal
to the energy difference of the
two orbitals involved (K, L
and M lines)
• Synchrotron X-ray source is
unique for its brillance and
tunability
European Synchrotron Radiation Facility, Grenoble
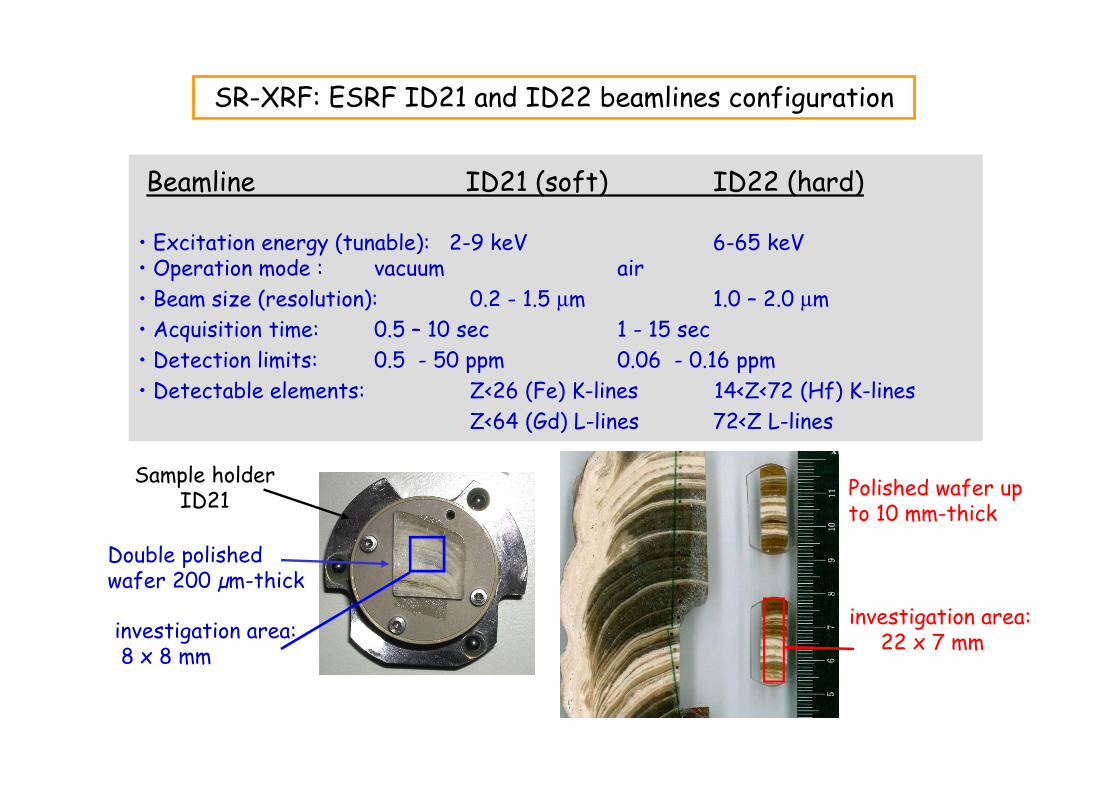
Beamline ID21 (soft) ID22 (hard) .• Excitation energy (tunable): 2-9 keV 6-65 keV• Operation mode : vacuum air
• Beam size (resolution): 0.2 - 1.5 µm 1.0 – 2.0 µm
• Acquisition time: 0.5 – 10 sec 1 - 15 sec
• Detection limits: 0.5 - 50 ppm 0.06 - 0.16 ppm
• Detectable elements: Z<26 (Fe) K-lines 14<Z<72 (Hf) K-lines
Z<64 (Gd) L-lines 72<Z L-lines
SR-XRF: ESRF ID21 and ID22 beamlines configuration
investigation area:8 x 8 mm
Double polished wafer 200 µm-thick
Sample holder ID21
Polished wafer up to 10 mm-thick
investigation area:22 x 7 mm
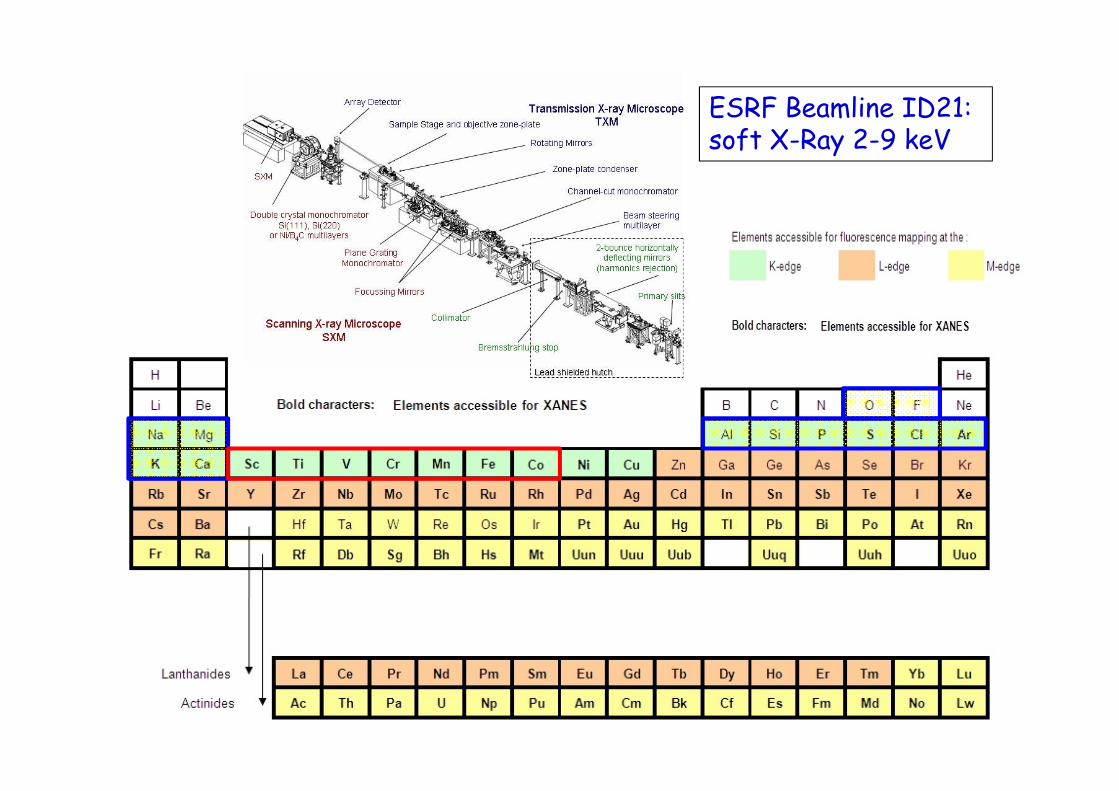
ESRF Beamline ID21: soft X-Ray 2-9 keV
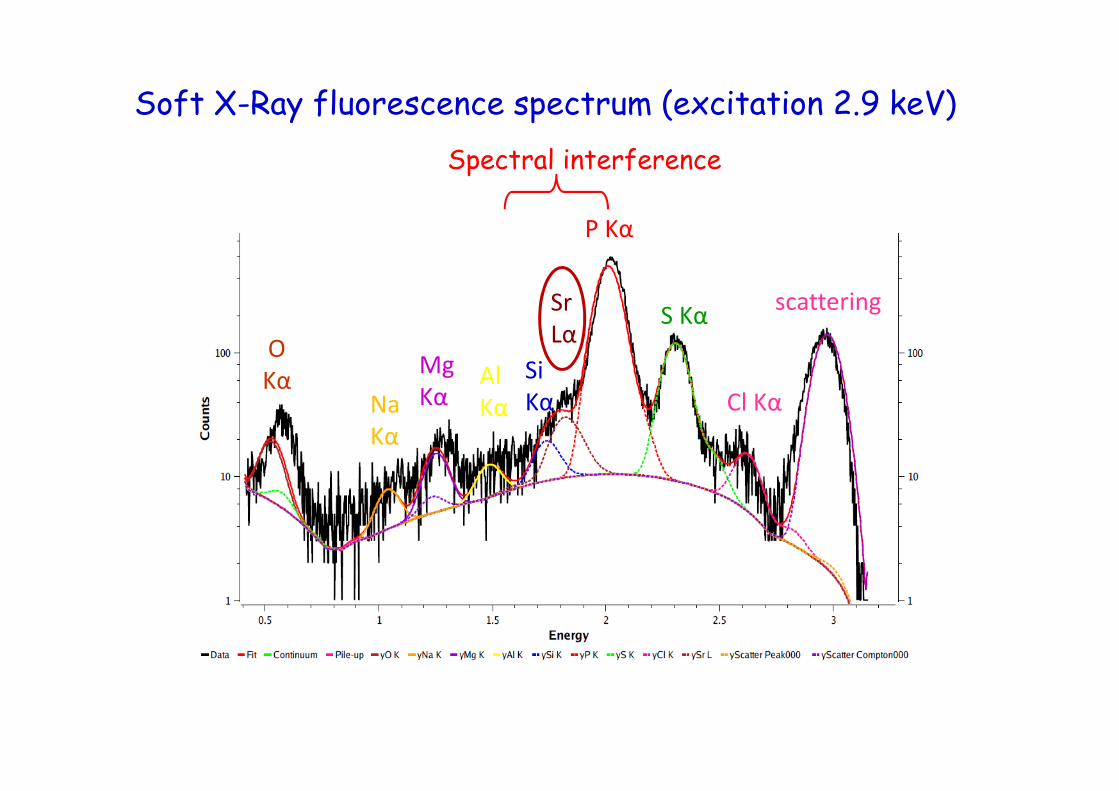
P Kα
Na
Kα
Mg
KαAl
Kα
Si
Kα
Sr
LαS Kα
Cl Kα
scattering
O
Kα
Soft X-Ray fluorescence spectrum (excitation 2.9 keV)
Spectral interference
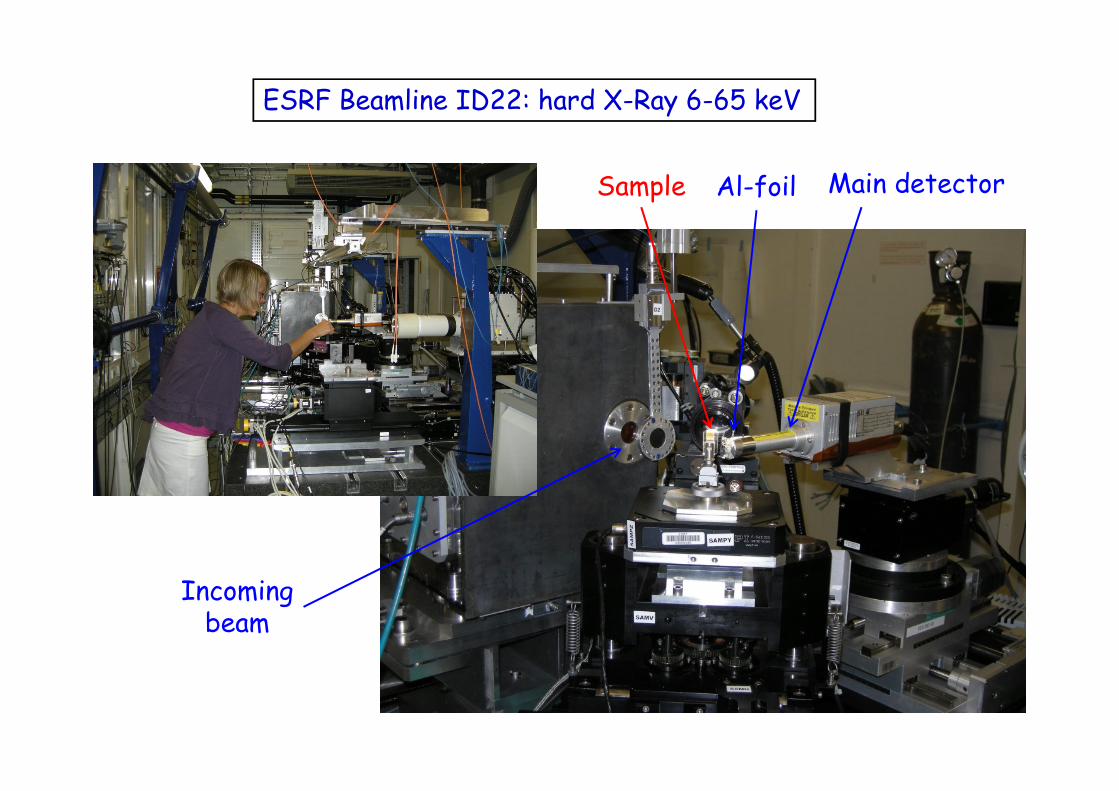
Incoming beam
Sample Main detector
ESRF Beamline ID22: hard X-Ray 6-65 keV
Al-foil
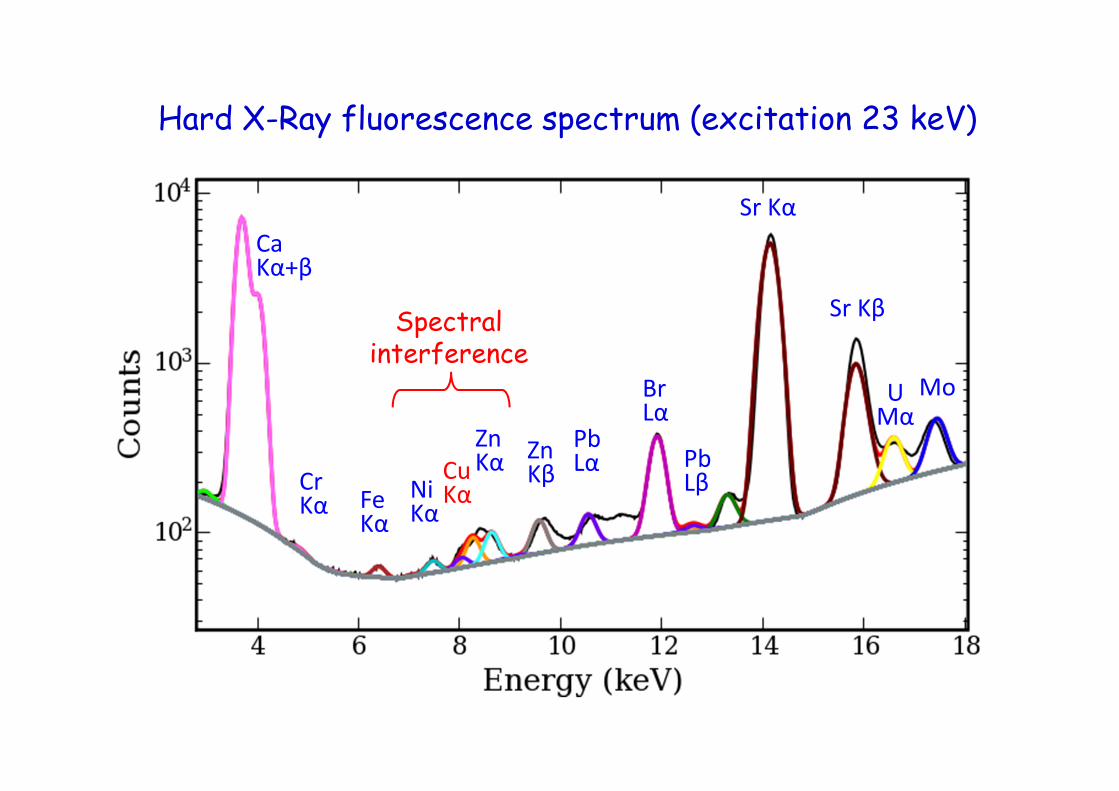
ID22 Fluorescence spectrum
CaKα+β
Sr Kα
Mo
FeKα
CuKα
CrKα
Sr Kβ
ZnKβ
PbLβ
ZnKα
PbLα
NiKα
Hard X-Ray fluorescence spectrum (excitation 23 keV)
Spectral interference
BrLα
UMα
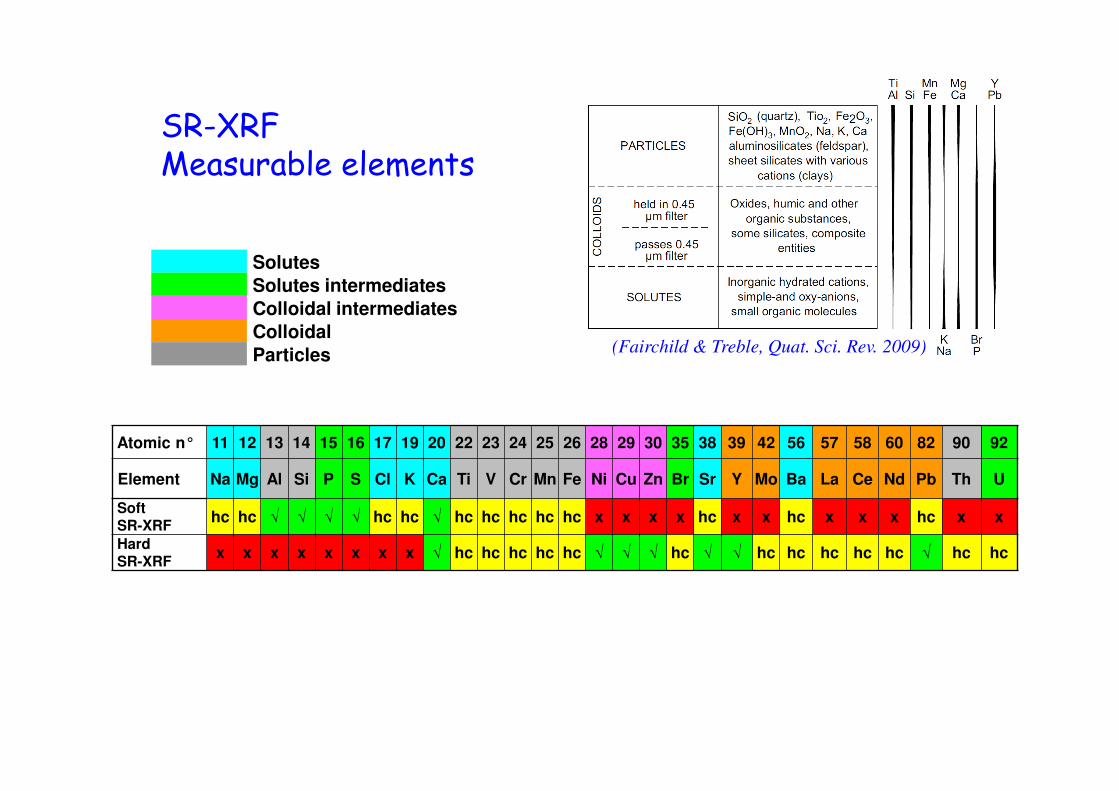
SR-XRF Measurable elements
(Fairchild & Treble, Quat. Sci. Rev. 2009)
Solutes
Solutes intermediates
Colloidal intermediates
Colloidal
Particles
Atomic n° 11 12 13 14 15 16 17 19 20 22 23 24 25 26 28 29 30 35 38 39 42 56 57 58 60 82 90 92
Element Na Mg Al Si P S Cl K Ca Ti V Cr Mn Fe Ni Cu Zn Br Sr Y Mo Ba La Ce Nd Pb Th U
Soft SR-XRF
hc hc √ √ √ √ hc hc √ hc hc hc hc hc x x x x hc x x hc x x x hc x x
Hard SR-XRF
x x x x x x x x √ hc hc hc hc hc √ √ √ hc √ √ hc hc hc hc hc √ hc hc
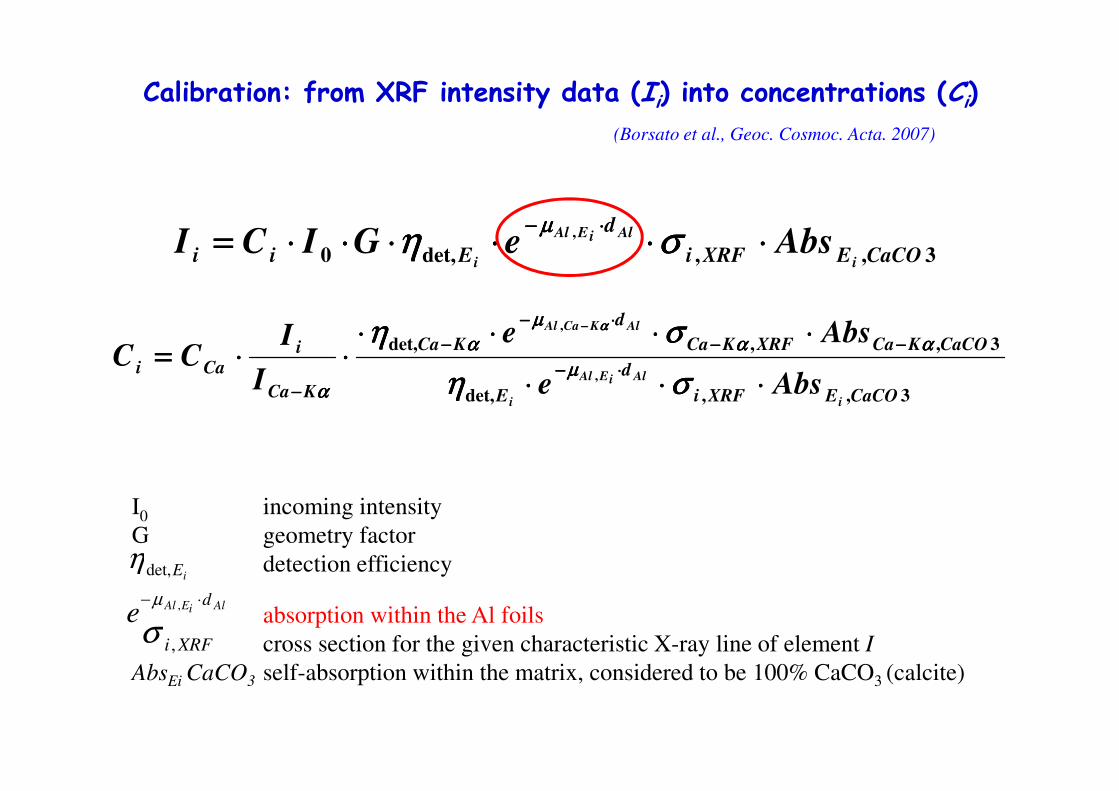
Calibration: from XRF intensity data (Ii) into concentrations (Ci)
3,,det,0
,
CaCOEXRFi
d
Eii i
AliEAl
i
AbseGICI ⋅⋅⋅⋅⋅⋅⋅⋅⋅⋅⋅⋅⋅⋅⋅⋅⋅⋅⋅⋅⋅⋅⋅⋅====⋅⋅⋅⋅−−−−
σσσσηηηηµµµµ
3,,det,
3,,det,
,
,
CaCOEXRFi
d
E
CaCOKCaXRFKCa
d
KCa
KCa
i
Cai
i
AliEAl
i
AlKCaAl
Abse
Abse
I
ICC
⋅⋅⋅⋅⋅⋅⋅⋅⋅⋅⋅⋅
⋅⋅⋅⋅⋅⋅⋅⋅⋅⋅⋅⋅⋅⋅⋅⋅⋅⋅⋅⋅⋅⋅⋅⋅====
⋅⋅⋅⋅−−−−
−−−−−−−−
⋅⋅⋅⋅−−−−
−−−−
−−−−
−−−−
σσσσηηηη
σσσσηηηη
µµµµ
αααααααα
µµµµ
αααα
αααα
αααα
I0 incoming intensity
G geometry factor
detection efficiency
absorption within the Al foils
cross section for the given characteristic X-ray line of element I
AbsEi CaCO3 self-absorption within the matrix, considered to be 100% CaCO3 (calcite)
iEdet,η
AliEAl de
⋅− ,µ
XRFi ,σ
(Borsato et al., Geoc. Cosmoc. Acta. 2007)
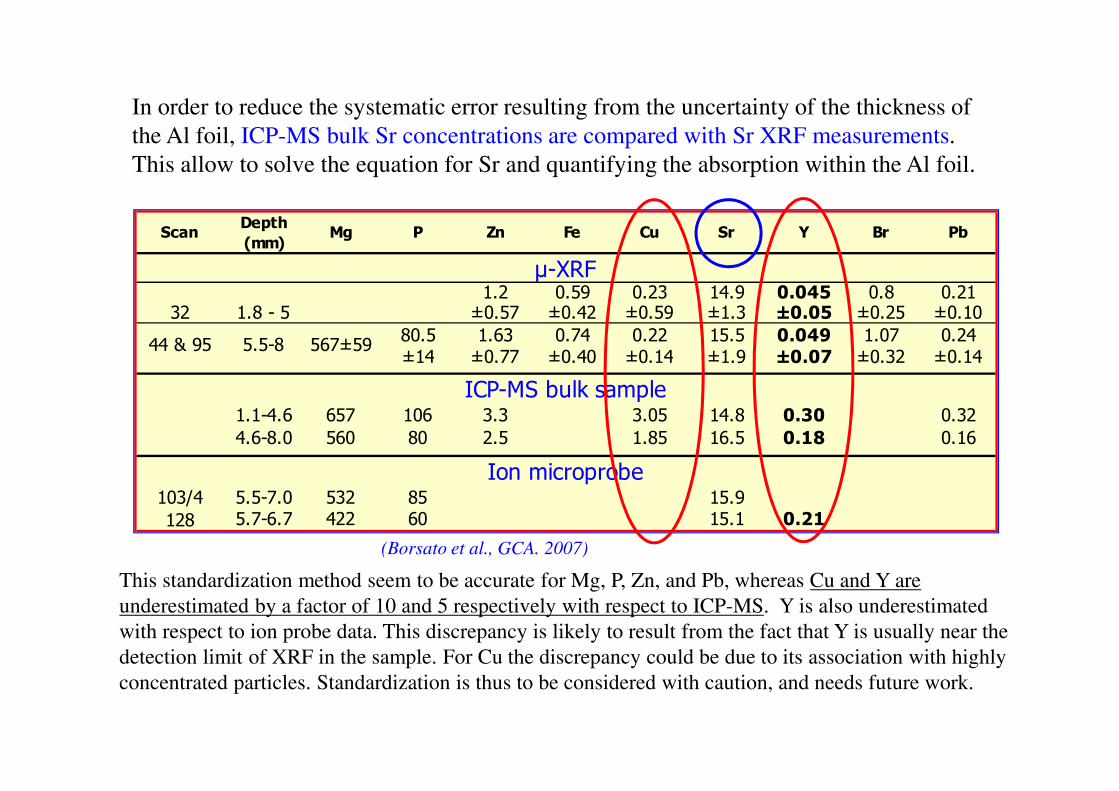
This standardization method seem to be accurate for Mg, P, Zn, and Pb, whereas Cu and Y are
underestimated by a factor of 10 and 5 respectively with respect to ICP-MS. Y is also underestimated
with respect to ion probe data. This discrepancy is likely to result from the fact that Y is usually near the
detection limit of XRF in the sample. For Cu the discrepancy could be due to its association with highly
concentrated particles. Standardization is thus to be considered with caution, and needs future work.
1.2 0.59 0.23 14.9 0.045 0.8 0.21±0.57 ±0.42 ±0.59 ±1.3 ±0.05 ±0.25 ±0.10
80.5 1.63 0.74 0.22 15.5 0.049 1.07 0.24
±14 ±0.77 ±0.40 ±0.14 ±1.9 ±0.07 ±0.32 ±0.14
1.1-4.6 657 106 3.3 3.05 14.8 0.30 0.32
4.6-8.0 560 80 2.5 1.85 16.5 0.18 0.16
103/4 5.5-7.0 532 85 15.9
128 5.7-6.7 422 60 15.1 0.21
ICP-MS bulk sample
Ion microprobe
5.5-8 567±5944 & 95
µ-XRF
32 1.8 - 5
Y Br PbZn Fe Cu SrScan Mg PDepth
(mm)
In order to reduce the systematic error resulting from the uncertainty of the thickness of
the Al foil, ICP-MS bulk Sr concentrations are compared with Sr XRF measurements.
This allow to solve the equation for Sr and quantifying the absorption within the Al foil.
(Borsato et al., GCA. 2007)
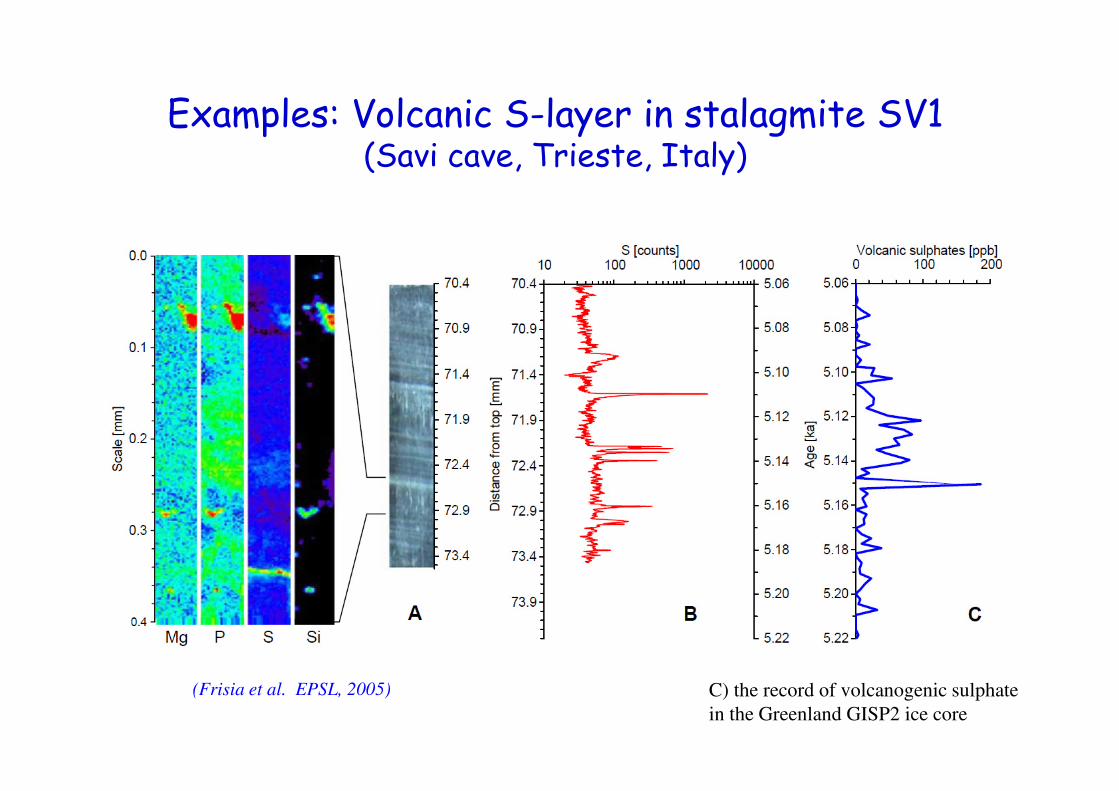
Examples: Volcanic S-layer in stalagmite SV1 (Savi cave, Trieste, Italy)
(Frisia et al. EPSL, 2005) C) the record of volcanogenic sulphate
in the Greenland GISP2 ice core
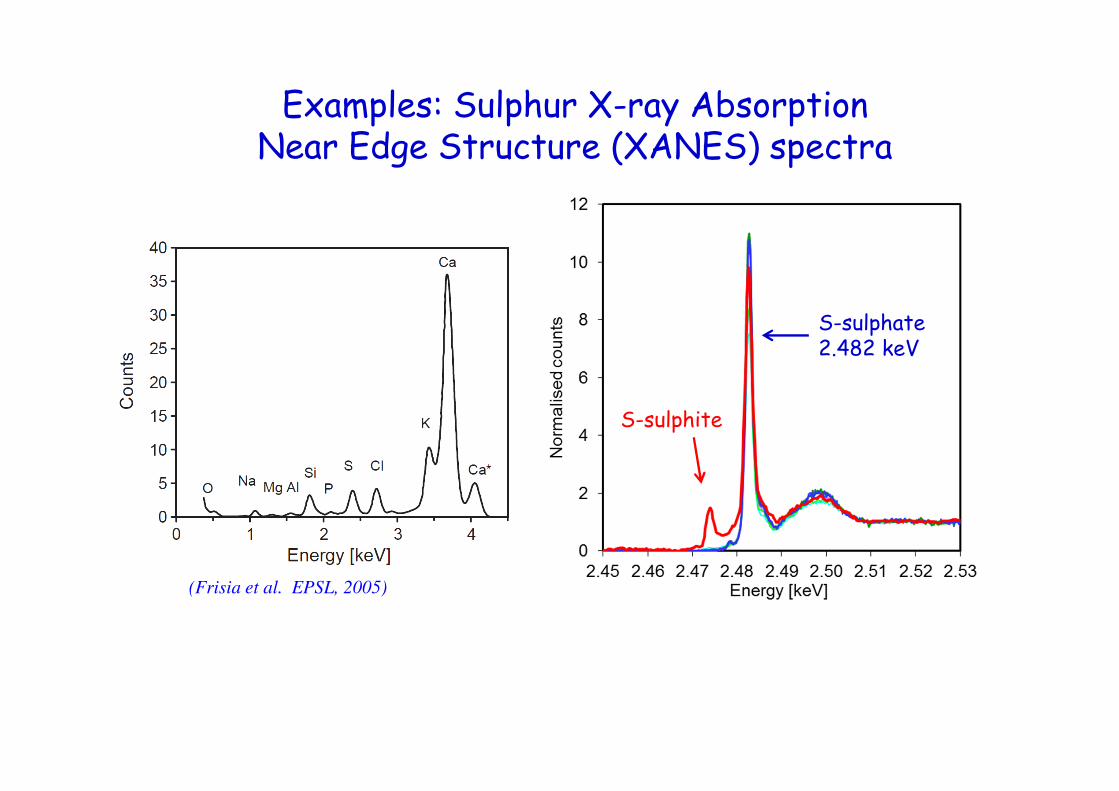
(Frisia et al. EPSL, 2005)
S-sulphate2.482 keV
S-sulphite
Examples: Sulphur X-ray AbsorptionNear Edge Structure (XANES) spectra
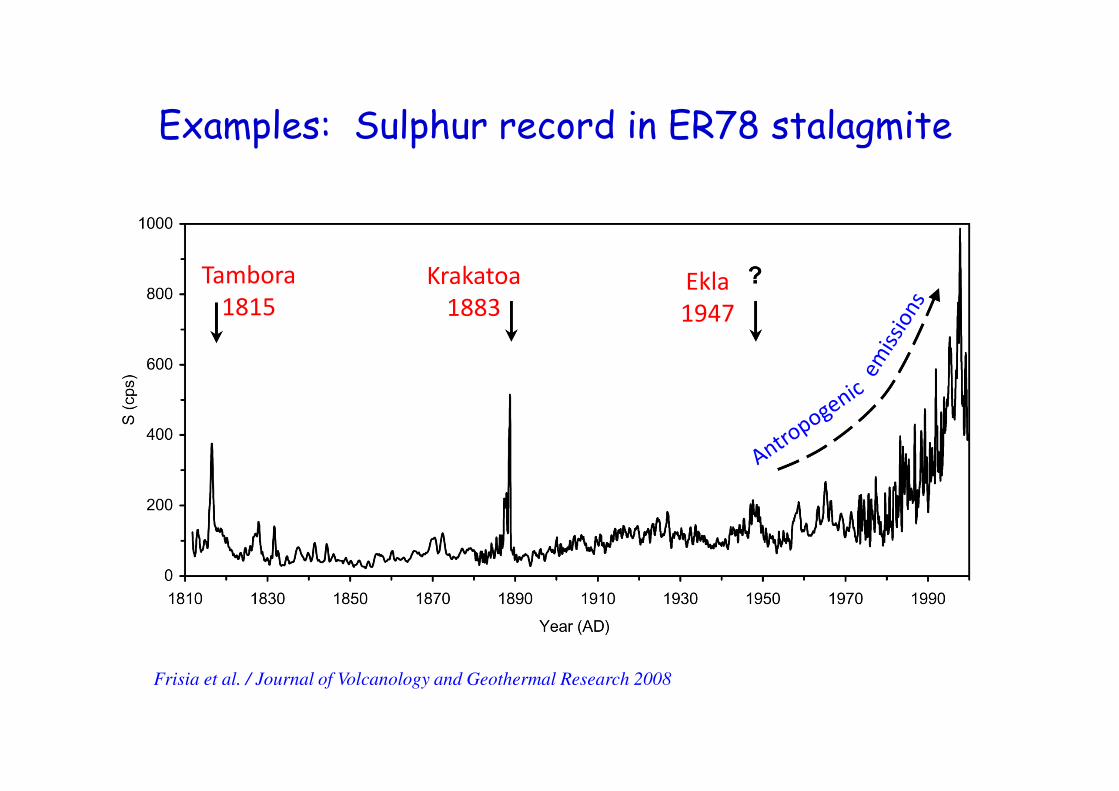
Frisia et al. / Journal of Volcanology and Geothermal Research 2008
Tambora
1815
Krakatoa
1883Ekla
1947
Examples: Sulphur record in ER78 stalagmite
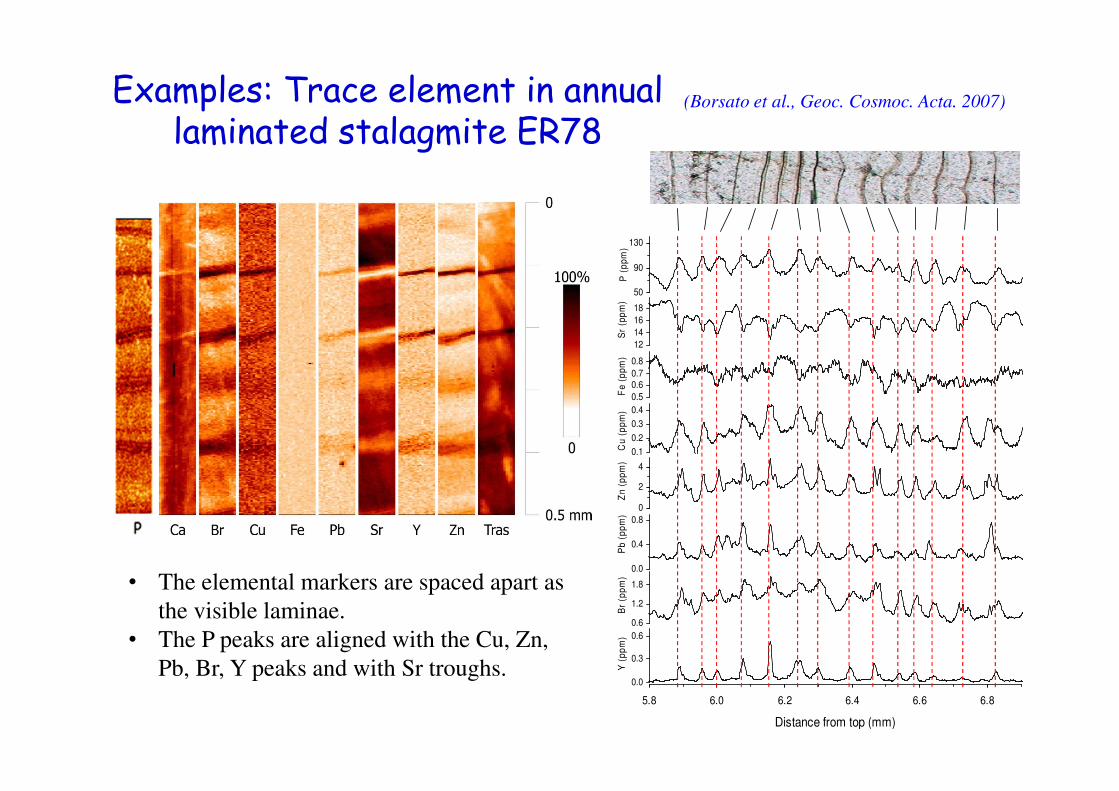
•Stalagmite ER78: cicli chimici dei diversi elementi distanziati come le lamine visibili (50–100 µm).
•I picchi di P, Cu, Zn, Pb, Br, Y corrispondono a minimi di Sr (tasso di crescita minimo)
0.5
0.60.7
0.8
Fe
(p
pm
)
12
14
16
18
Sr
(pp
m)
0
2
4
Zn
(p
pm
)
0.1
0.2
0.3
0.4
Cu
(p
pm
)
0.0
0.3
0.6
Y (
pp
m)
0.0
0.4
0.8
Pb
(p
pm
)0.6
1.2
1.8
Br
(pp
m)
5.8 6.0 6.2 6.4 6.6 6.8
Distance from top (mm)
50
90
130
P (
pp
m)
• The elemental markers are spaced apart as
the visible laminae.
• The P peaks are aligned with the Cu, Zn,
Pb, Br, Y peaks and with Sr troughs.
(Borsato et al., Geoc. Cosmoc. Acta. 2007)Examples: Trace element in annuallaminated stalagmite ER78
(Borsato et al., Geoc. Cosmoc. Acta. 2007)Examples: Trace element in annuallaminated stalagmite ER78
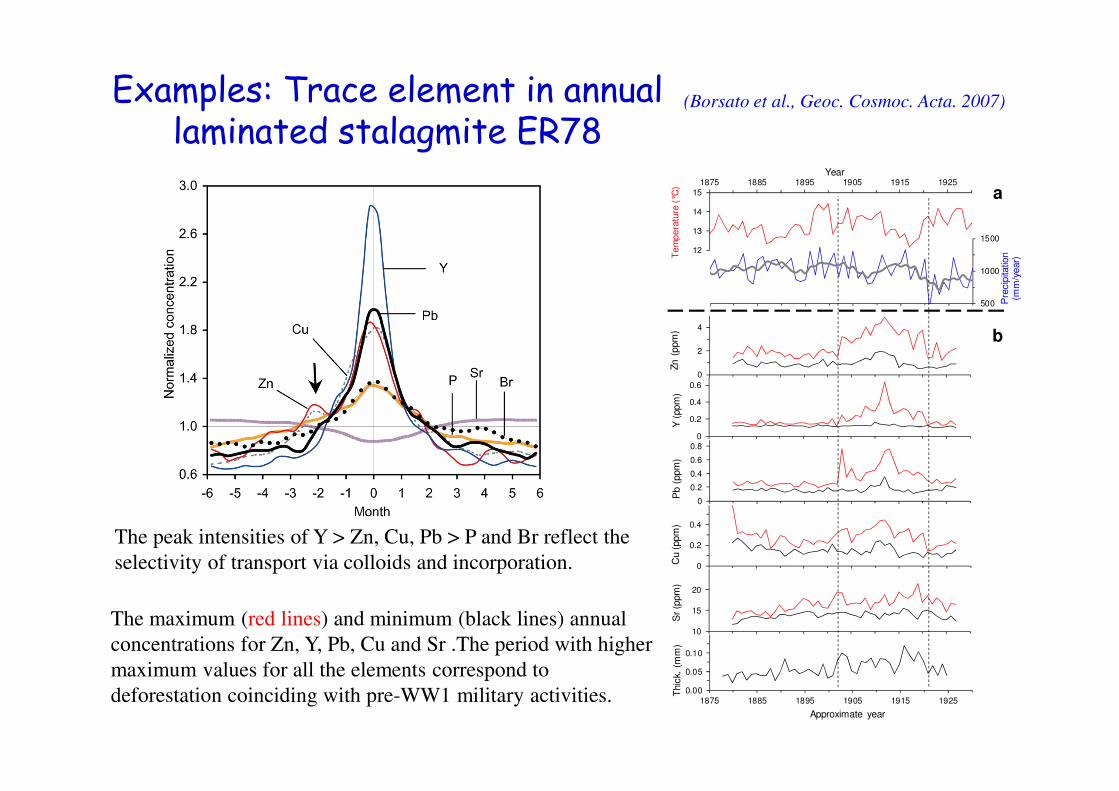
The peak intensities of Y > Zn, Cu, Pb > P and Br reflect the
selectivity of transport via colloids and incorporation.
0
2
4
Zn (
ppm
)
12
13
14
15
1875 1885 1895 1905 1915 1925
Te
mp
era
ture
(°C
)
Year
0
0.2
0.4
0.6
Y (
ppm
)
0
0.2
0.4
Cu (
ppm
)
0
0.2
0.4
0.6
0.8
Pb (
ppm
)
10
15
20
Sr
(ppm
)
500
1000
1500
Pre
cip
itatio
n(m
m/y
ear)
0.00
0.05
0.10
1875 1885 1895 1905 1915 1925
Thic
k. (
mm
)
Approximate year
a
b
The maximum (red lines) and minimum (black lines) annual
concentrations for Zn, Y, Pb, Cu and Sr .The period with higher
maximum values for all the elements correspond to
deforestation coinciding with pre-WW1 military activities.
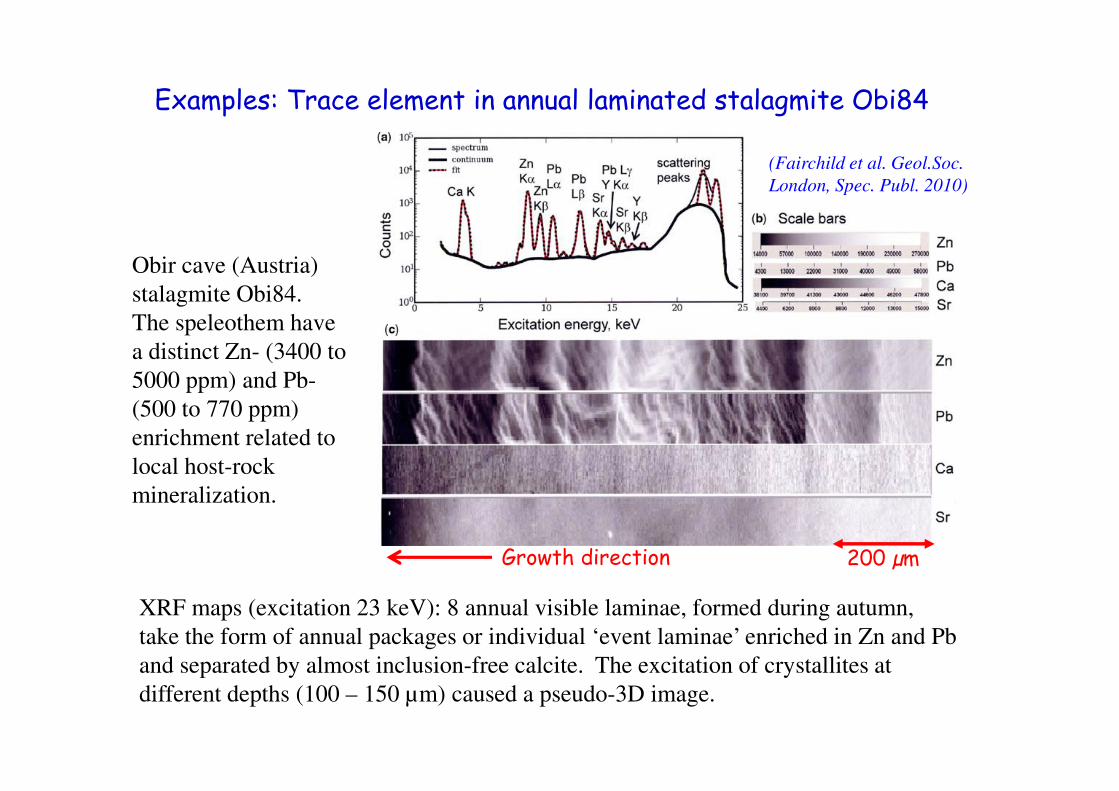
Examples: Trace element in annual laminated stalagmite Obi84
Obir cave (Austria)
stalagmite Obi84.
The speleothem have
a distinct Zn- (3400 to
5000 ppm) and Pb-
(500 to 770 ppm)
enrichment related to
local host-rock
mineralization.
(Fairchild et al. Geol.Soc.
London, Spec. Publ. 2010)
XRF maps (excitation 23 keV): 8 annual visible laminae, formed during autumn,
take the form of annual packages or individual ‘event laminae’ enriched in Zn and Pb
and separated by almost inclusion-free calcite. The excitation of crystallites at
different depths (100 – 150 µm) caused a pseudo-3D image.
Growth direction 200 µm
1. Ablation system, sample preparation, resolution,
2. Interference by molecules and ions
3. Elemental fractionation and mass-load matrix effects
4. Mass resolution, detection limits and measurable elements
5. Background, calibration and standards
6. Riproducibility and adjacent scans correlation
7. Examples and environmental interpretation
OUTLINE 2. Laser Ablation ICP Mass Spectrometry
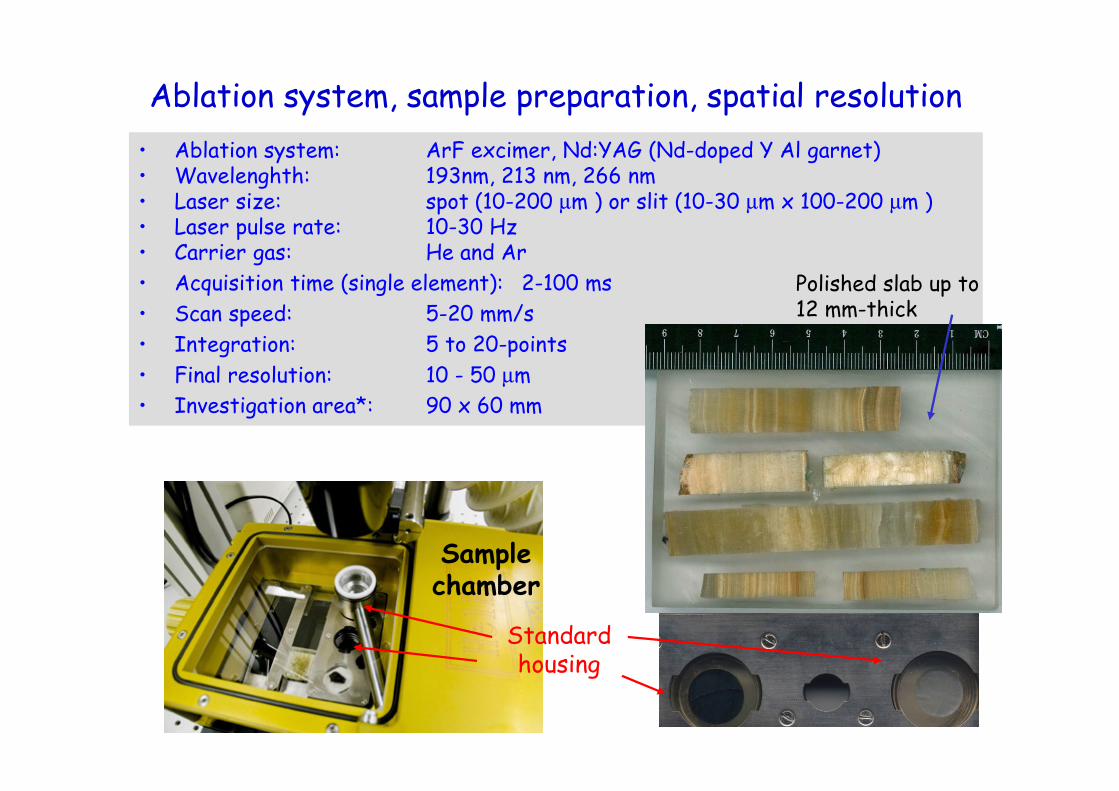
• Ablation system: ArF excimer, Nd:YAG (Nd-doped Y Al garnet) • Wavelenghth: 193nm, 213 nm, 266 nm• Laser size: spot (10-200 µm ) or slit (10-30 µm x 100-200 µm )• Laser pulse rate: 10-30 Hz• Carrier gas: He and Ar
• Acquisition time (single element): 2-100 ms
• Scan speed: 5-20 mm/s
• Integration: 5 to 20-points
• Final resolution: 10 - 50 µm
• Investigation area*: 90 x 60 mm
Ablation system, sample preparation, spatial resolution
Polished slab up to 12 mm-thick
Sample chamber
Standard housing
(Jochum et al., Chem.Geol. 2012)
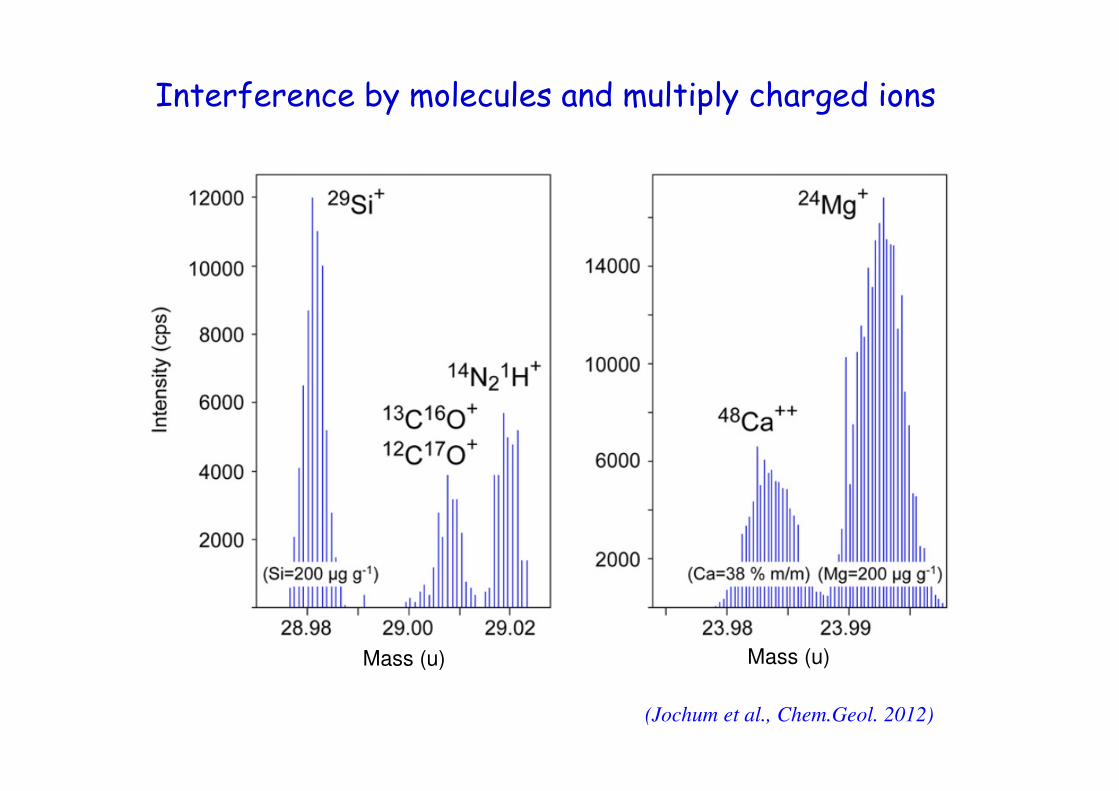
Mass (u) Mass (u)
Interference by molecules and multiply charged ions
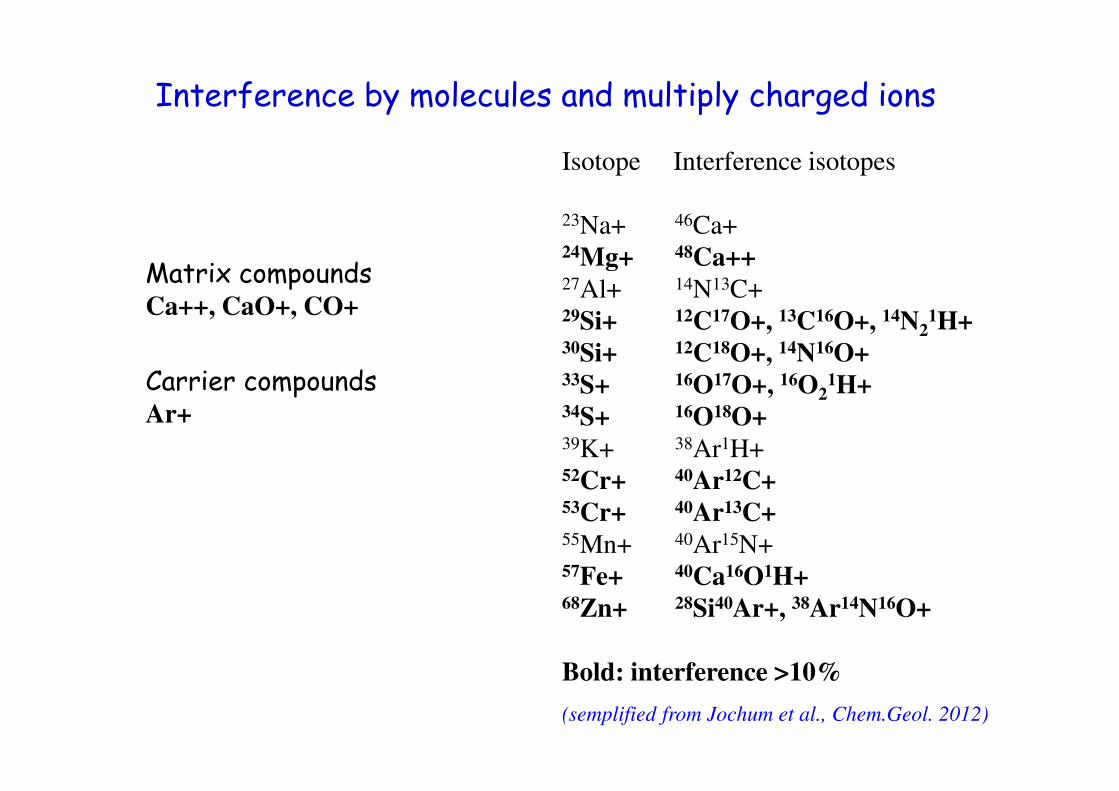
Isotope Interference isotopes
23Na+ 46Ca+24Mg+ 48Ca++27Al+ 14N13C+29Si+ 12C17O+, 13C16O+, 14N2
1H+30Si+ 12C18O+, 14N16O+33S+ 16O17O+, 16O2
1H+34S+ 16O18O+39K+ 38Ar1H+52Cr+ 40Ar12C+53Cr+ 40Ar13C+55Mn+ 40Ar15N+57Fe+ 40Ca16O1H+68Zn+ 28Si40Ar+, 38Ar14N16O+
Bold: interference >10%
Interference by molecules and multiply charged ions
Matrix compoundsCa++, CaO+, CO+
Carrier compoundsAr+
(semplified from Jochum et al., Chem.Geol. 2012)
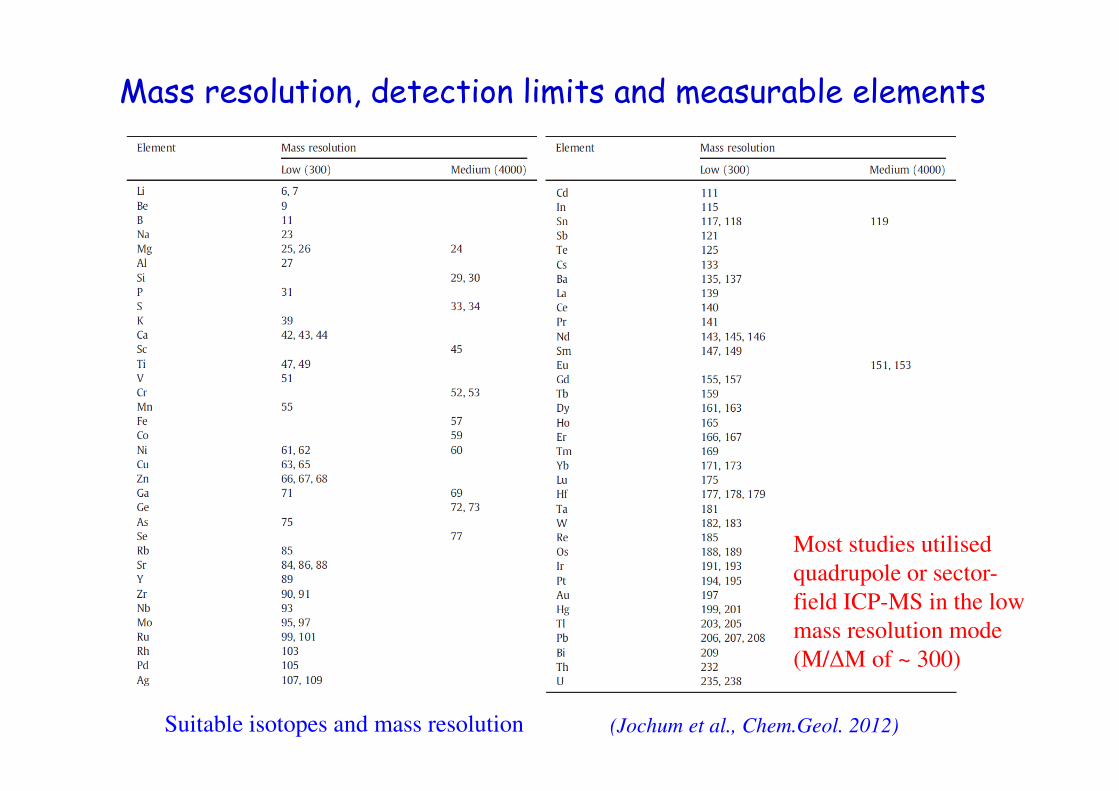
Mass resolution, detection limits and measurable elements
(Jochum et al., Chem.Geol. 2012)
Most studies utilised
quadrupole or sector-
field ICP-MS in the low
mass resolution mode
(M/∆M of ~ 300)
Suitable isotopes and mass resolution
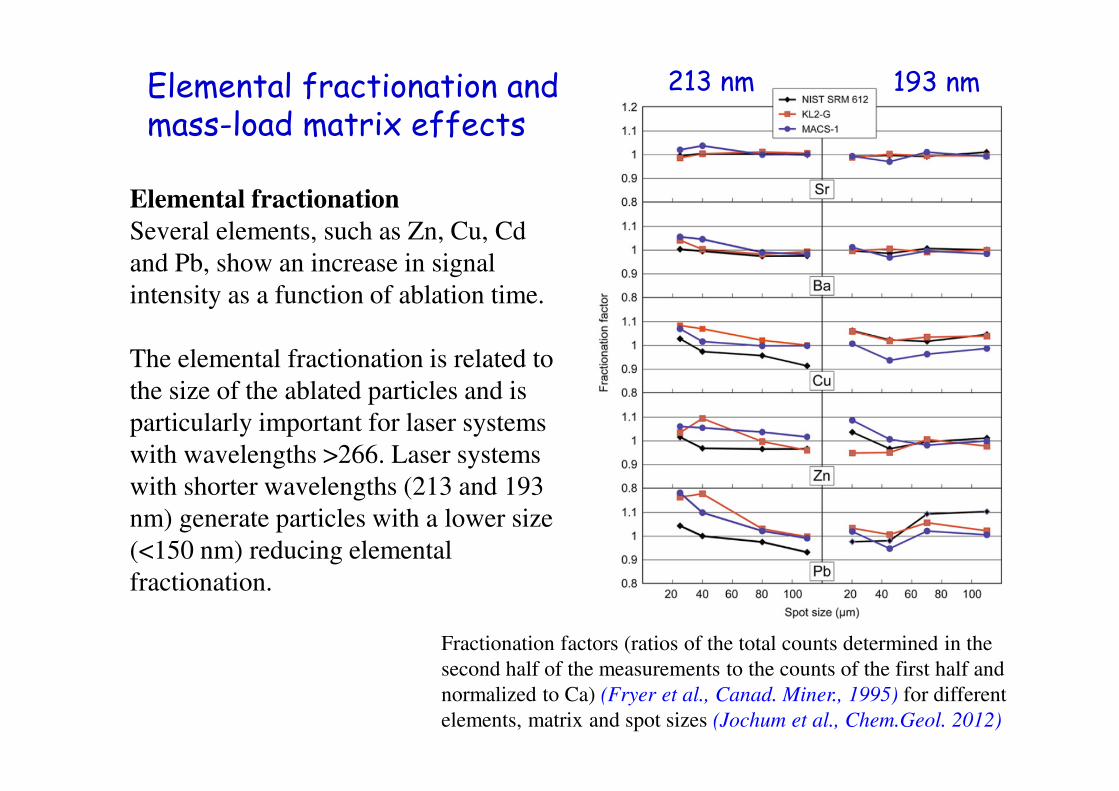
Elemental fractionation
Several elements, such as Zn, Cu, Cd
and Pb, show an increase in signal
intensity as a function of ablation time.
The elemental fractionation is related to
the size of the ablated particles and is
particularly important for laser systems
with wavelengths >266. Laser systems
with shorter wavelengths (213 and 193
nm) generate particles with a lower size
(<150 nm) reducing elemental
fractionation.
Elemental fractionation and mass-load matrix effects
Fractionation factors (ratios of the total counts determined in the
second half of the measurements to the counts of the first half and
normalized to Ca) (Fryer et al., Canad. Miner., 1995) for different
elements, matrix and spot sizes (Jochum et al., Chem.Geol. 2012)
213 nm 193 nm
�N
IST
610
�N
IST
614
�bac
kgro
und
�bac
kgro
und
�bac
kgro
und
�re
sin
�S
ampl
e
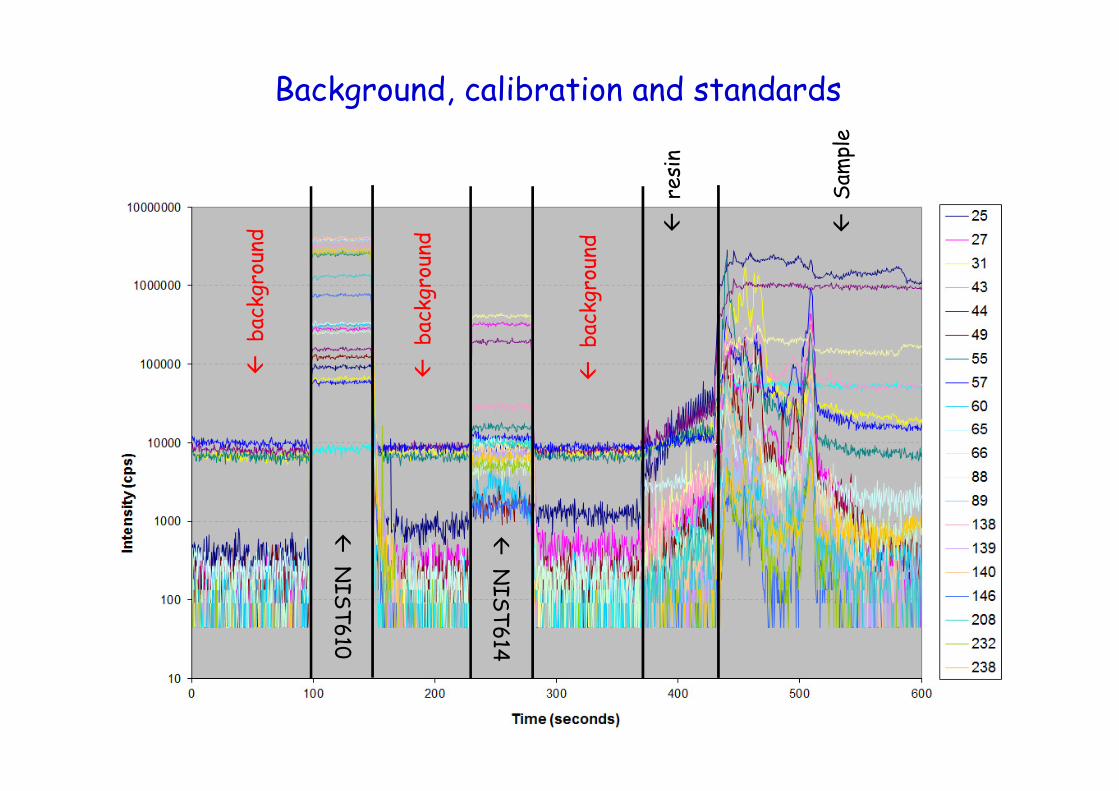
Background, calibration and standards
�N
IST
610
�N
IST
614
�bac
kgro
und
�bac
kgro
und
�bac
kgro
und
�re
sin
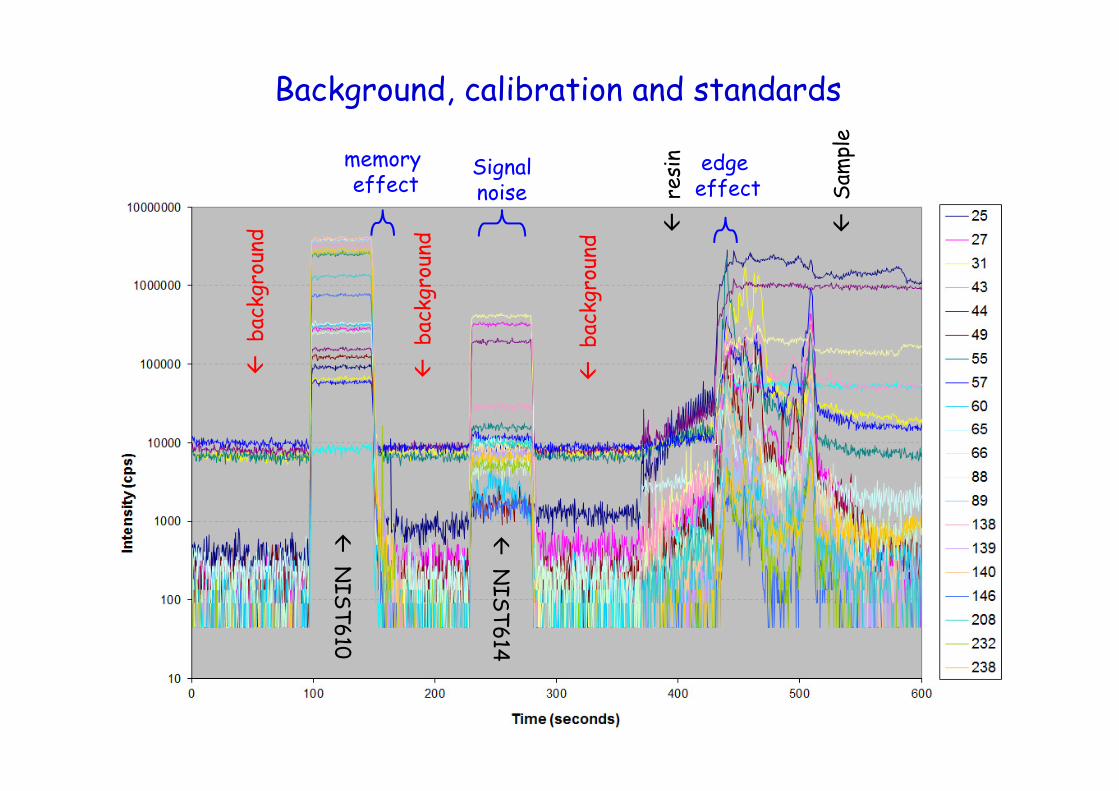
Background, calibration and standards
Signalnoise
edge effect
�S
ampl
e
memory effect
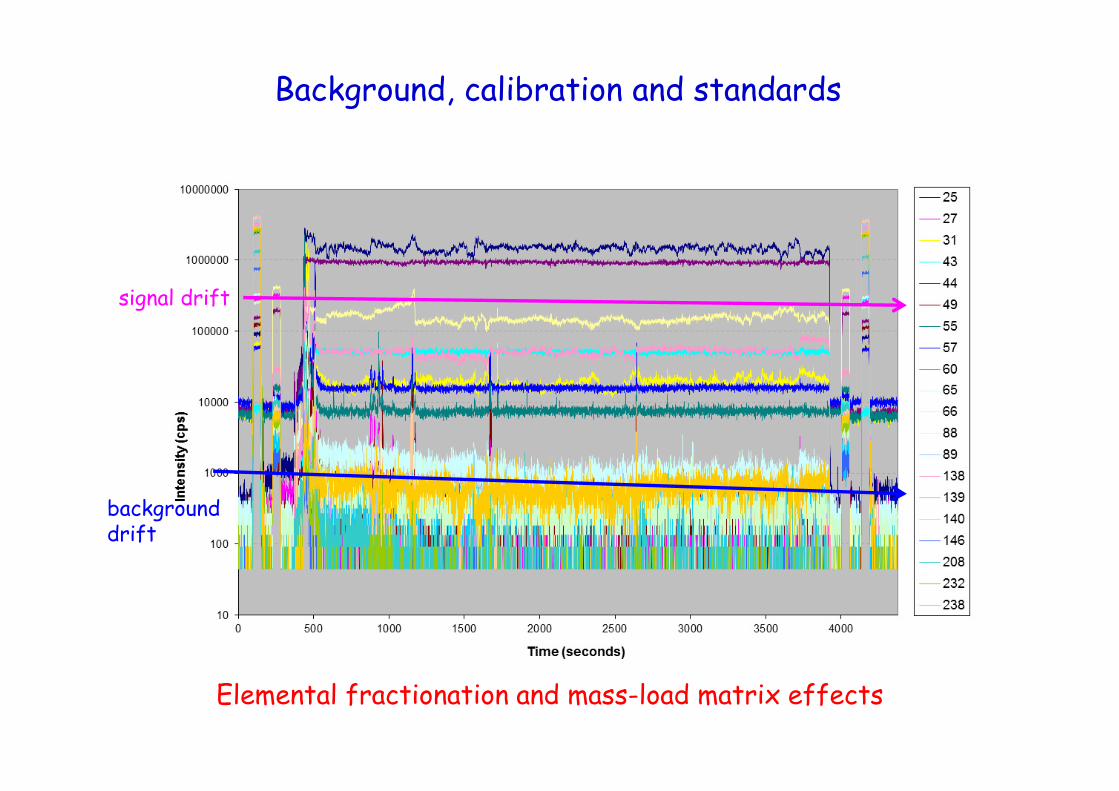
background drift
signal drift
Background, calibration and standards
Elemental fractionation and mass-load matrix effects
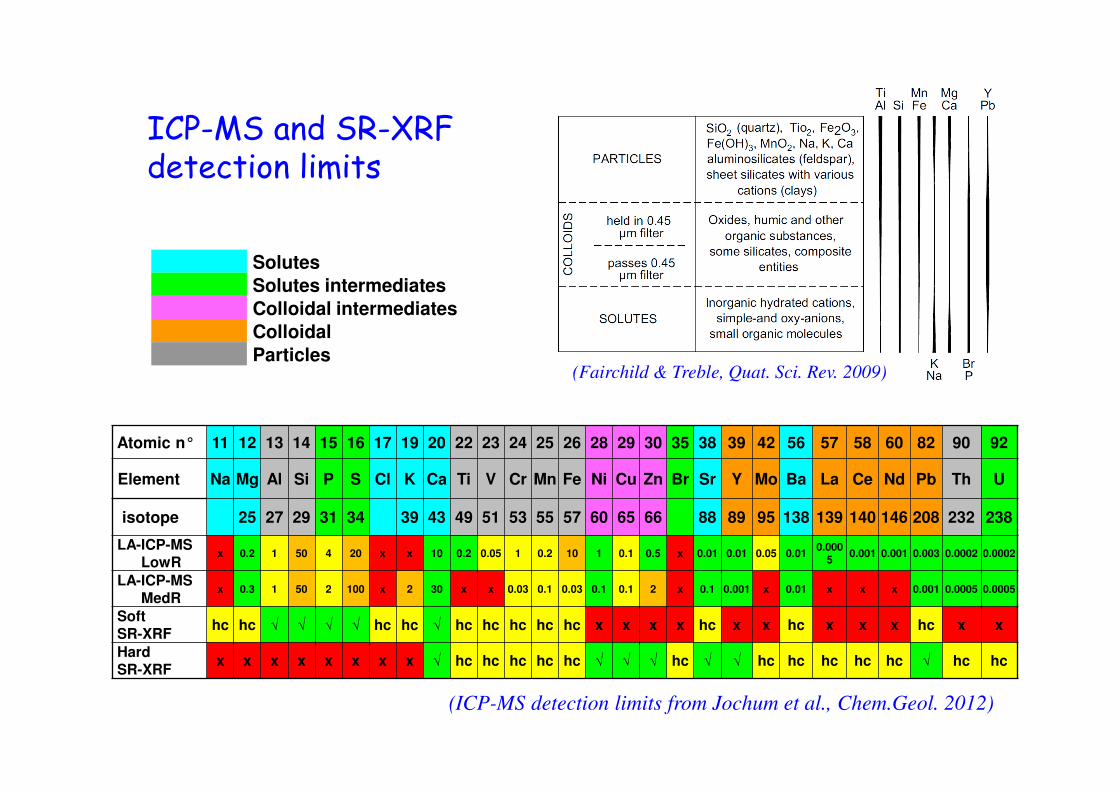
ICP-MS and SR-XRF detection limits
(Fairchild & Treble, Quat. Sci. Rev. 2009)
Solutes
Solutes intermediates
Colloidal intermediates
Colloidal
Particles
Atomic n° 11 12 13 14 15 16 17 19 20 22 23 24 25 26 28 29 30 35 38 39 42 56 57 58 60 82 90 92
Element Na Mg Al Si P S Cl K Ca Ti V Cr Mn Fe Ni Cu Zn Br Sr Y Mo Ba La Ce Nd Pb Th U
isotope 25 27 29 31 34 39 43 49 51 53 55 57 60 65 66 88 89 95 138 139 140 146 208 232 238
LA-ICP-MSLowR
x 0.2 1 50 4 20 x x 10 0.2 0.05 1 0.2 10 1 0.1 0.5 x 0.01 0.01 0.05 0.010.000
50.001 0.001 0.003 0.0002 0.0002
LA-ICP-MSMedR
x 0.3 1 50 2 100 x 2 30 x x 0.03 0.1 0.03 0.1 0.1 2 x 0.1 0.001 x 0.01 x x x 0.001 0.0005 0.0005
Soft SR-XRF
hc hc √ √ √ √ hc hc √ hc hc hc hc hc x x x x hc x x hc x x x hc x x
Hard SR-XRF
x x x x x x x x √ hc hc hc hc hc √ √ √ hc √ √ hc hc hc hc hc √ hc hc
(ICP-MS detection limits from Jochum et al., Chem.Geol. 2012)
0
1
2
3
4
5
6
7
8
9
10
-80
-60
-40
-20
0
20
40
60
80
100
0 10 20 30 40 50 60
Ba
(p
pm
)
Sr
(pp
m)
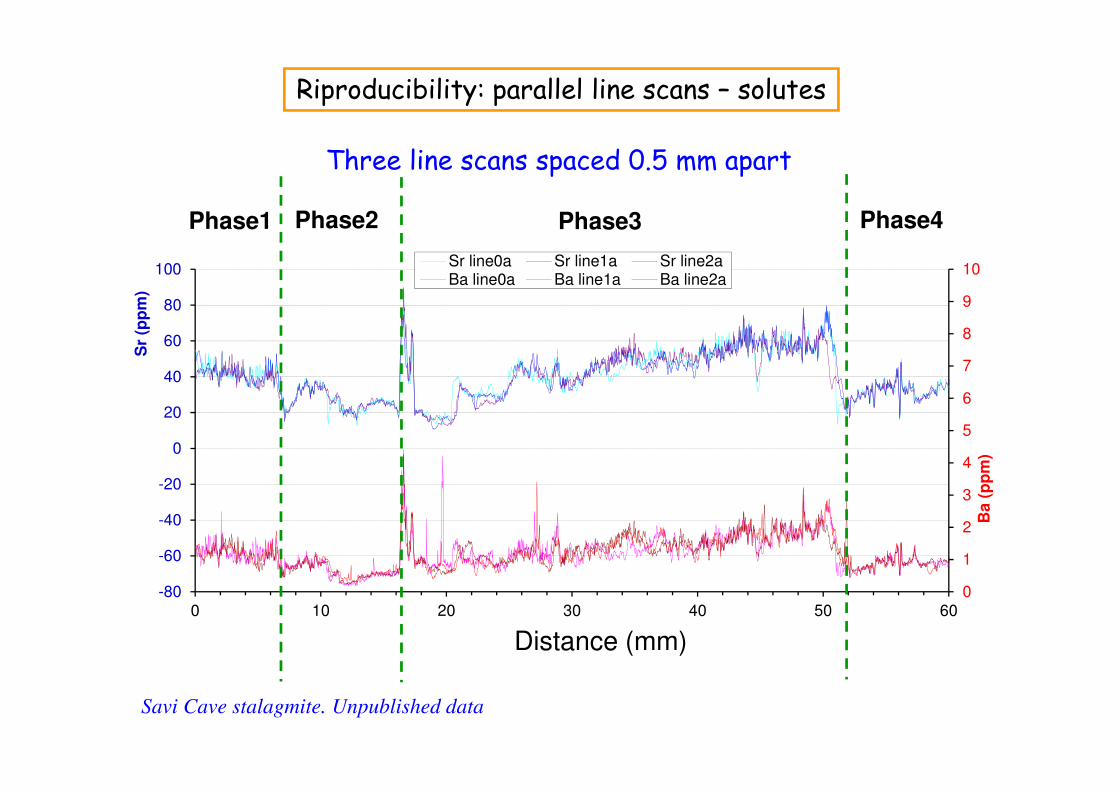
Sr line0a Sr line1a Sr line2aBa line0a Ba line1a Ba line2a
Phase1 Phase3 Phase4Phase2
Distance (mm)
Savi Cave stalagmite. Unpublished data
Riproducibility: parallel line scans – solutes
Three line scans spaced 0.5 mm apart
0.0
0.1
0.2
0.3
0.4
0.5
0.6
-100
-50
0
50
100
150
200
0 10 20 30 40 50 60
U (
pp
m)
P (
pp
m)
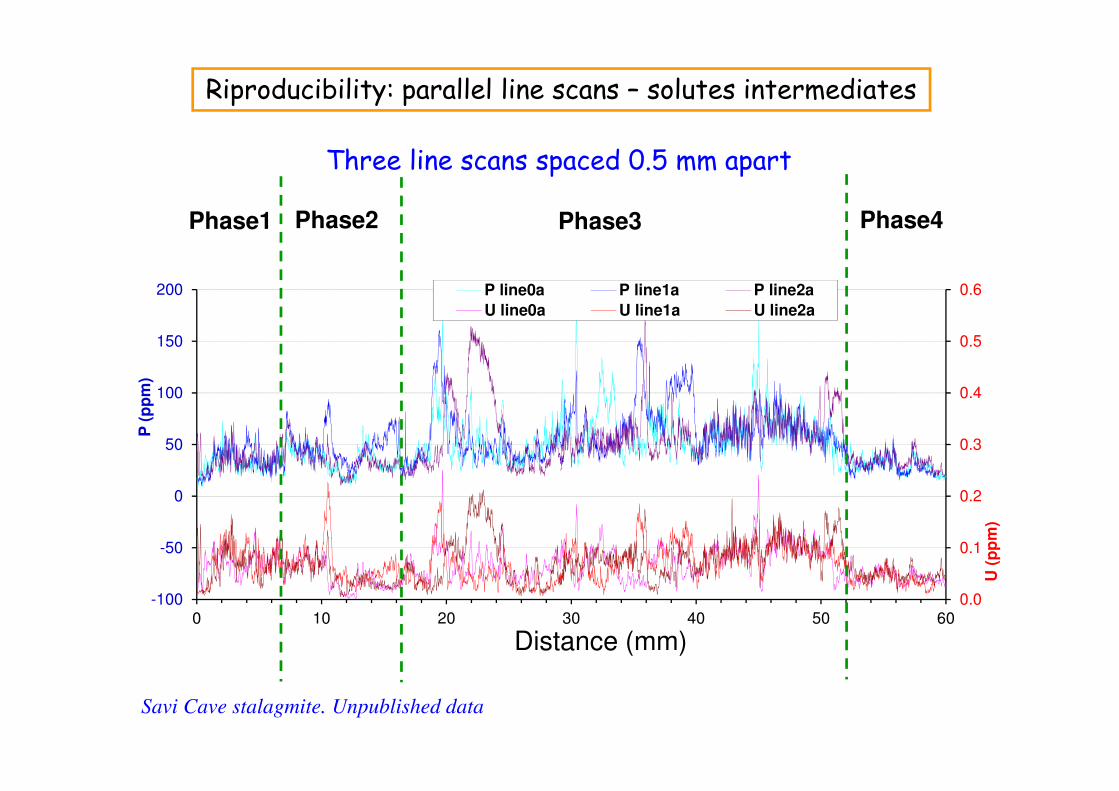
P line0a P line1a P line2a
U line0a U line1a U line2a
Distance (mm)
Savi Cave stalagmite. Unpublished data
Riproducibility: parallel line scans – solutes intermediates
Three line scans spaced 0.5 mm apart
Phase1 Phase3 Phase4Phase2
Combined SR-XRF and LA-ICP-MS analyses
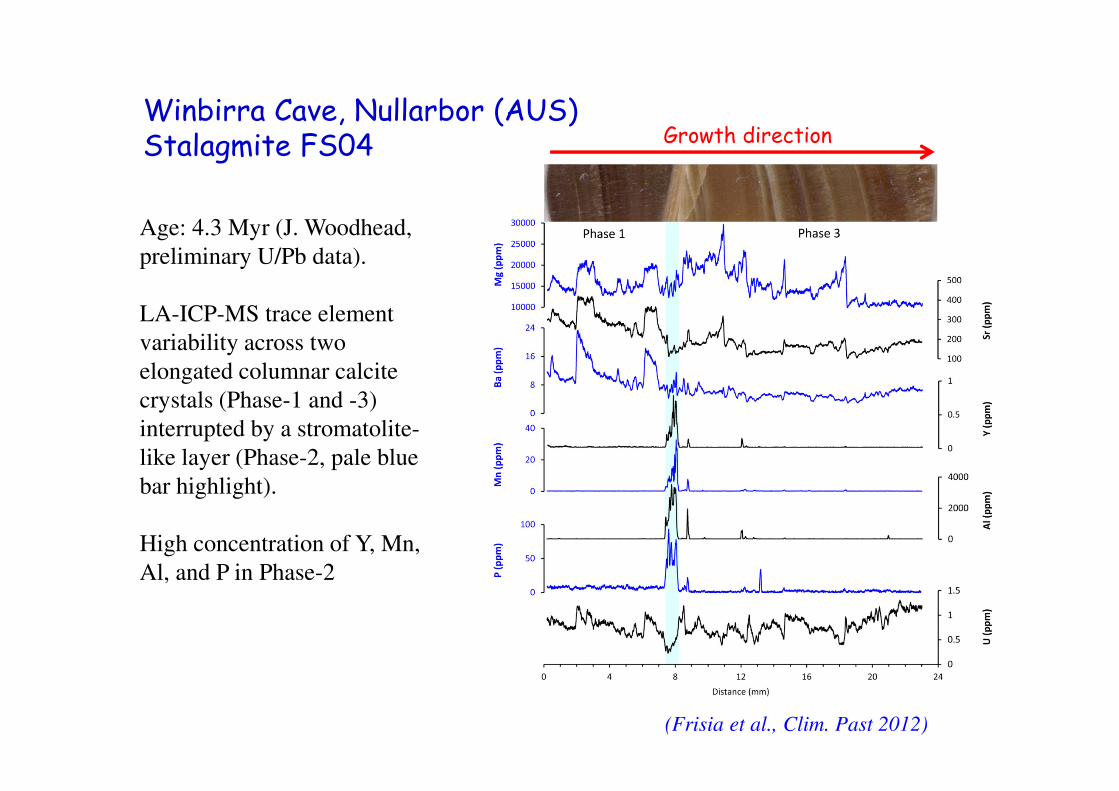
Age: 4.3 Myr (J. Woodhead,
preliminary U/Pb data).
LA-ICP-MS trace element
variability across two
elongated columnar calcite
crystals (Phase-1 and -3)
interrupted by a stromatolite-
like layer (Phase-2, pale blue
bar highlight).
High concentration of Y, Mn,
Al, and P in Phase-2
(Frisia et al., Clim. Past 2012)
Growth directionWinbirra Cave, Nullarbor (AUS)Stalagmite FS04
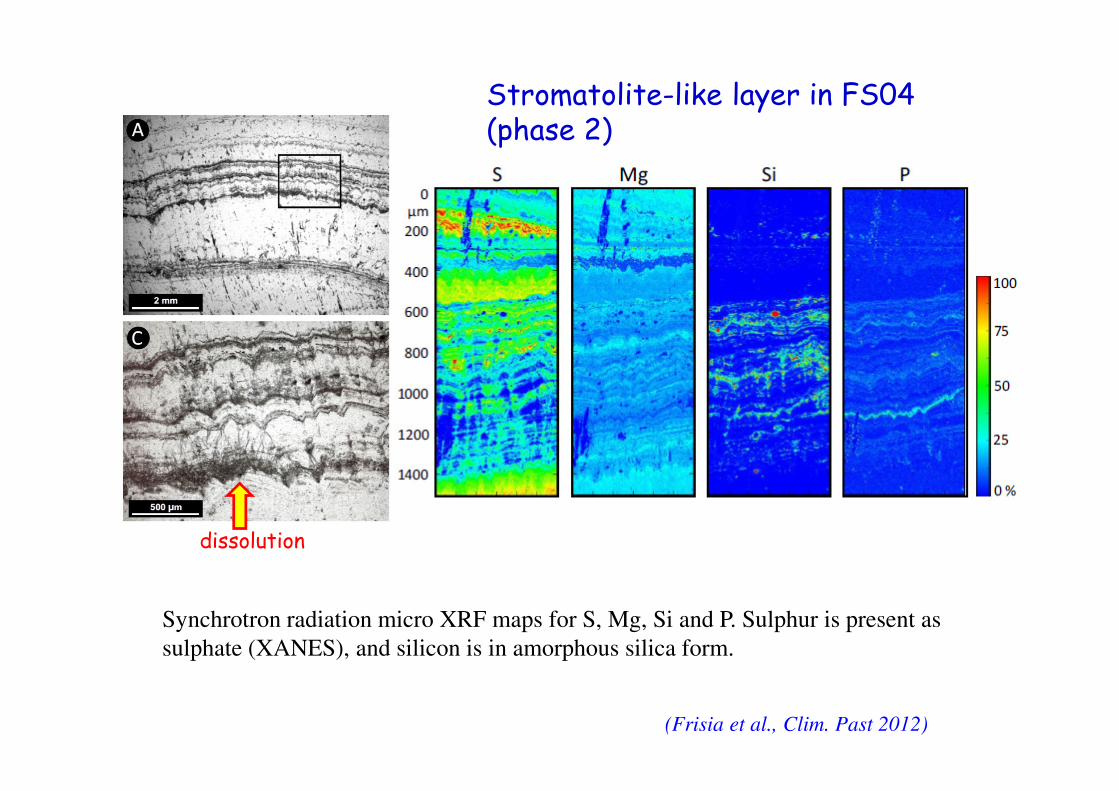
Synchrotron radiation micro XRF maps for S, Mg, Si and P. Sulphur is present as
sulphate (XANES), and silicon is in amorphous silica form.
(Frisia et al., Clim. Past 2012)
Stromatolite-like layer in FS04 (phase 2)
dissolution
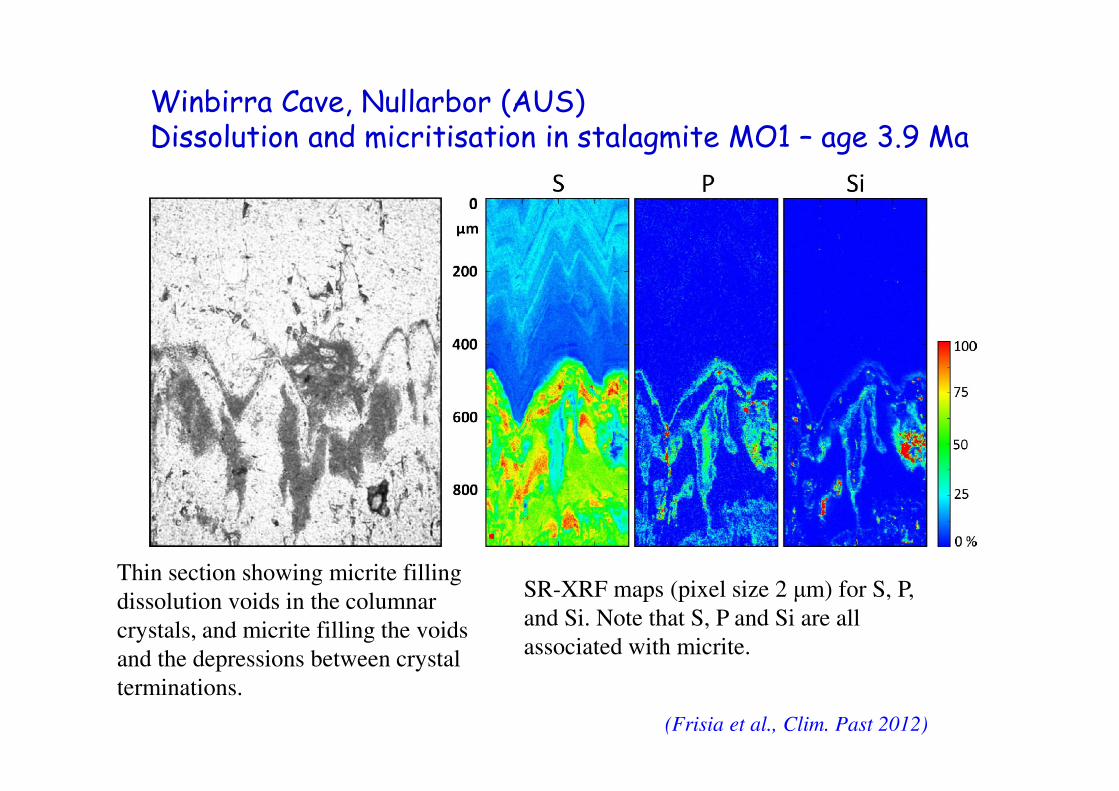
Thin section showing micrite filling
dissolution voids in the columnar
crystals, and micrite filling the voids
and the depressions between crystal
terminations.
Winbirra Cave, Nullarbor (AUS) Dissolution and micritisation in stalagmite MO1 – age 3.9 Ma
(Frisia et al., Clim. Past 2012)
SR-XRF maps (pixel size 2 µm) for S, P,
and Si. Note that S, P and Si are all
associated with micrite.
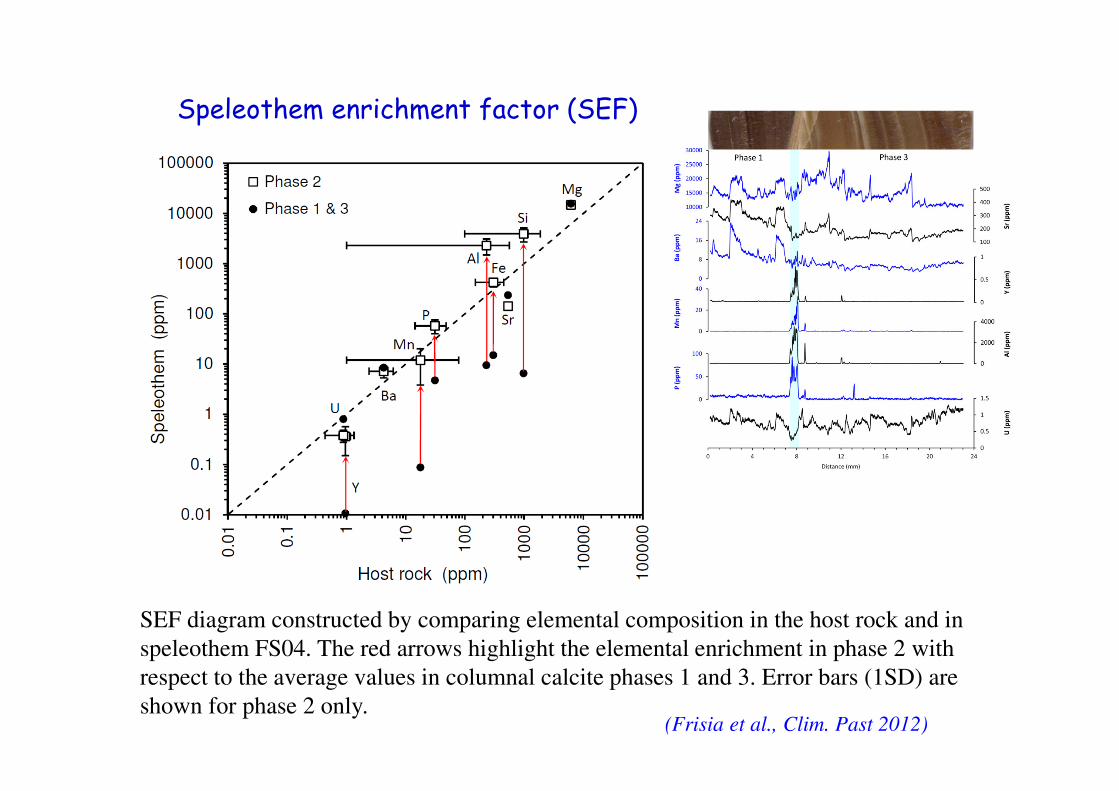
SEF diagram constructed by comparing elemental composition in the host rock and in
speleothem FS04. The red arrows highlight the elemental enrichment in phase 2 with
respect to the average values in columnal calcite phases 1 and 3. Error bars (1SD) are
shown for phase 2 only.(Frisia et al., Clim. Past 2012)
Speleothem enrichment factor (SEF)
• LA-ICP-MS is the most commonly used micro-analytical technique in speleothem science combining low detection limits and high spatial resolution (10–100 µm).
For the correct use in paleoclimate reconstructions the issues of mass interferences, elemental fractionation, mass-load matrix effects and calibration protocols have to be addressed;
• The ultra-high spatial resolution (0.2-1 µm) of SR-XRF allow the detection of ca. 10 elements in standard setting. Mapping confirm the lateral continuity of the elemental distribution in banded and laminated samples.
The measure of a more complete suite of elements as well as the quantification of the data still need technical improvement.
• Mineralogical, crystallographic and textural characteristics have to be considered when planning the analyses and interpreted the data.
Conclusions
• Borsato, A., Frisia, S., Fairchild, I.J., Somogyi, A., & Susini, J., (2007). Trace element distribution in annual
stalagmite laminae mapped by micrometer-resolution X-ray fluorescence: implications for incorporation of
environmentally significant species, Geochim. Cosmoch. Acta 71: 1494–1512.
• Fairchild, I.J. & Treble, P.C. (2009). Trace elements in speleothems as recorders of environmental change.
Quaternary Science Reviews, 28, 449-468.
• Fairchild, I.J., Spötl, C., Frisia, S., Borsato, A., Susini, J., Wynn, P.M., Cauzid, J., & EIMF. (2010). Petrology and
geochemistry of annually laminated stalagmites from an Alpine cave (Obir, Austria): seasonal cave physiology. In:
Pedley, H.M.& Rogerson, M. (eds) Tufas and Speleothems: Unravelling the Microbial and Physical Controls.
Geological Society, London, Special Publications 2010; v. 336; p. 295-321.
• Fairchild, I.J. & Baker, A. (2012). Speleothem Science. From Process to Past Environment. Wiley Blackwell.
• Frisia, S., Borsato, A., Fairchild, I.J., Susini, J., (2005). Variations in atmospheric sulphate recorded in stalagmites
by synchrotron micro XRF and XANES analyses. Earth and Planetary Science Letters, 235: 729-740.
• Frisia, S., Borsato, A., & Susini, J., (2008). Synchrotron radiation applications to past volcanism archived in
speleothems: An overview. Journ. of Vulcanology and Geothermal Research, 177, 1: 96-100.
• Frisia, S., Borsato, A., Drysdale, R.N., Paul, B., Greig, A. & Cotte, M., (2012). A re-evaluation of the
palaeoclimatic significance of phosphorus variability in speleothems revealed by high-resolution synchrotron
micro XRF mapping. Clim. Past, 8, 2039–2051, 2012.
• Fryer, B.J., Jackson, S.E., Longerich, H.P., (1995). The design, operation and role of the laser-ablation microprobe
coupled with an inductively coupled plasma-mass spectrometer (LAM-ICP-MS) in the Earth sciences. The
Canadian Mineralogist 33, 303–312.
• Jochum K.P., Scholz D., Stoll B., Weis U., Wilson, S.A., Yang Q., Schwalb A., Börner N., Jacob D.E., Andreae
M.O., (2012). Accurate trace element analysis of speleothems and biogenic calcium carbonates by LA-ICP-MS.
Chemical Geology 318–319: 31–44.
• Treble, P., Shelley, J. M. G., & Chappell, J. (2003). Comparison of high resolution subannual records of trace
elements in a modern (1911-1992) speleothem with instrumental climate data from southwest Australia. Earth and
Planetary Science Letters, 216, 141-153.
Essential reference lists
![Il linguaggio della Matematica: Insiemi e operazioni · (Microsoft PowerPoint - Insiemi Roberto.ppt [modalit\340 compatibilit\340]) Author: roberto Created Date: 9/12/2010 12:09:29](https://img.pdfslide.net/doc/110x75/5bafdfec09d3f2c70e8d61eb/il-linguaggio-della-matematica-insiemi-e-microsoft-powerpoint-insiemi-robertoppt.jpg)
![SONDAGGIO GASTRICO/DUODENALE LE VARICI ESOFAGEE · 2013. 11. 16. · (Microsoft PowerPoint - 10a lezione - Sondaggio gastrico duodenale, varici esofagee.ppt [modalit\340 compatibilit\340])](https://img.pdfslide.net/doc/110x75/5fec47c60765eb3c530eab50/sondaggio-gastricoduodenale-le-varici-2013-11-16-microsoft-powerpoint-10a.jpg)
![corsodicrm.files.wordpress.comTitle (Microsoft PowerPoint - Cap3 .ppt [modalit\340 compatibilit\340]) Author: Daniele Created Date: 11/25/2011 4:16:38 PM](https://img.pdfslide.net/doc/110x75/5e6199046bb284494042747a/title-microsoft-powerpoint-cap3-ppt-modalit340-compatibilit340-author.jpg)
![340]) › wp › wp-content › uploads › 2017 › 05 › ripopol… · Title (Microsoft PowerPoint - Presentazione1 [modalit\340 compatibilit\340]) Author: isa Created Date: 2/19/2015](https://img.pdfslide.net/doc/110x75/5f1b5db7e02edd0d231d4ef1/340-a-wp-a-wp-content-a-uploads-a-2017-a-05-a-ripopol-title-microsoft.jpg)
![Esercitazione2.ppt [modalit compatibilit ]) › ... › reti › lucidi › Esercitazione2-2014.pdf · 2014-10-10 · (Microsoft PowerPoint - Esercitazione2.ppt [modalit compatibilit](https://img.pdfslide.net/doc/110x75/5f1664949daec47b6943a797/modalit-compatibilit-a-a-reti-a-lucidi-a-esercitazione2-2014pdf.jpg)
![RisoluzioneTDE 2012-09-07-DW [modalit compatibilit ])€¦ · (Microsoft PowerPoint - RisoluzioneTDE_2012-09-07-DW [modalit compatibilit ]) Author: Tania Created Date: 1/27/2015 12:15:18](https://img.pdfslide.net/doc/110x75/5f3334c455b61f321379ca4c/risoluzionetde-2012-09-07-dw-modalit-compatibilit-microsoft-powerpoint-risoluzionetde2012-09-07-dw.jpg)
![Topcon 3D OCTTopcon 3D OCT-2000 2000 · (Microsoft PowerPoint - fdfsd [modalit\340 compatibilit\340]) Author: ivana Created Date: 1/12/2010 10:06:33 AM](https://img.pdfslide.net/doc/110x75/60543825ba4f024c1533aa8a/topcon-3d-octtopcon-3d-oct-2000-2000-microsoft-powerpoint-fdfsd-modalit340.jpg)
![Uplink mobile –Polizia - antechspace.comantechspace.com/wp-content/uploads/2016/10/polizia.pdfTitle (Microsoft PowerPoint - Antech Presentation - eng [modalit\340 compatibilit\340])](https://img.pdfslide.net/doc/110x75/5e14e18c97d0a828f0169f49/uplink-mobile-apolizia-microsoft-powerpoint-antech-presentation-eng-modalit340.jpg)
![di Sandra Renzi - UniTE · (Microsoft PowerPoint - LABORATORIO-1 [Sola lettura] [modalit\340 compatibilit\340]) Author: malessandrini Created Date: 1/25/2011 5:13:36 PM](https://img.pdfslide.net/doc/110x75/5c65da9509d3f252168b6f74/di-sandra-renzi-microsoft-powerpoint-laboratorio-1-sola-lettura-modalit340.jpg)
![Nike - Victory€¦ · Title (Microsoft PowerPoint - Nike-Vittoria n. 101 - Photos [modalit compatibilit ]) Author: ESA52188 Created Date: 20151009092821Z](https://img.pdfslide.net/doc/110x75/6019fc18486a7976a650a54a/nike-victory-title-microsoft-powerpoint-nike-vittoria-n-101-photos-modalit.jpg)
![Relazione: “Nuovi strumenti di valutazione nell’era …...(Microsoft PowerPoint - Presentazione CNIS Padova 2015 Minaudo [modalit\340 compatibilit\340]) Author Ricercatore Created](https://img.pdfslide.net/doc/110x75/5fd67a8c4a039075ec6b51aa/relazione-aoenuovi-strumenti-di-valutazione-nellaera-microsoft-powerpoint.jpg)
![Prodotti a marchio del distributore: sviluppo nel mercato e ......(Microsoft PowerPoint - Relazione Cristini [modalit\340 compatibilit\340]) Author Chiara Daltri Created Date 1/16/2013](https://img.pdfslide.net/doc/110x75/611c03568ab611128441a2df/prodotti-a-marchio-del-distributore-sviluppo-nel-mercato-e-microsoft-powerpoint.jpg)
![ProgettoPOF a.s. 2010-2011 - istitutobartolo.it · a.s. 2010-2011 Introduzione alla ... Esercitazioni in laboratorio ... (Microsoft PowerPoint - LEGO MINDSTORMS NXT [modalit\340 compatibilit\340])](https://img.pdfslide.net/doc/110x75/5c6774bb09d3f226188baf5e/progettopof-as-2010-2011-as-2010-2011-introduzione-alla-esercitazioni.jpg)
![ISDN.ppt [modalit compatibilit ])mcasoni/tecnologie/ISDN.pdf · Title (Microsoft PowerPoint - ISDN.ppt [modalit compatibilit ]) Author: maurizio Created Date: 2/2/2017 11:23:50 AM](https://img.pdfslide.net/doc/110x75/60110b98540db573571546be/isdnppt-modalit-compatibilit-mcasonitecnologieisdnpdf-title-microsoft.jpg)
![Presentazione standard1 [modalit compatibilit ]...Microsoft PowerPoint - Presentazione standard1 [modalit compatibilit ] Author mzucchini Created Date 9/12/2013 1:37:31 PM](https://img.pdfslide.net/doc/110x75/5f12a22501ddc15236163dd8/presentazione-standard1-modalit-compatibilit-microsoft-powerpoint-presentazione.jpg)

![(Microsoft PowerPoint - Lesson IX [modalit\340 compatibilit\340])](https://img.pdfslide.net/doc/110x75/585adeed1a28ab6e32926726/microsoft-powerpoint-lesson-ix-modalit340-compatibilit340.jpg)
![Trapianto [modalit compatibilit ])](https://img.pdfslide.net/doc/110x75/616a298411a7b741a34f7af1/trapianto-modalit-compatibilit-.jpg)