Embed Size (px)
Citation preview
Microsoft SQL Server 2008 R2 Business Intelligence
SQL Server White Paper
Published February 2009
Applies to SQL Server 2008 R2
Summary Microsoftreg SQL Serverreg 2008 R2 expands on the value delivered in SQL Server
2008 to make actionable business intelligence accessible to all employees leading to better
faster more relevant decisions More than ever organizations can empower individuals to gain
deeper insight into all aspects of their business and to share their findings effortlessly and
securely SQL Server 2008 R2 helps organizations improve IT and developer efficiency Simply
put it redefines how organizations deliver and succeed with BI
Copyright
This is a preliminary document and may be changed substantially prior to final commercial
release of the software described herein
The information contained in this document represents the current view of Microsoft Corporation
on the issues discussed as of the date of publication Because Microsoft must respond to
changing market conditions it should not be interpreted to be a commitment on the part of
Microsoft and Microsoft cannot guarantee the accuracy of any information presented after the
date of publication
This white paper is for informational purposes only MICROSOFT MAKES NO WARRANTIES
EXPRESS IMPLIED OR STATUTORY AS TO THE INFORMATION IN THIS DOCUMENT
Complying with all applicable copyright laws is the responsibility of the user Without limiting the
rights under copyright no part of this document may be reproduced stored in or introduced into
a retrieval system or transmitted in any form or by any means (electronic mechanical
photocopying recording or otherwise) or for any purpose without the express written
permission of Microsoft Corporation
Microsoft may have patents patent applications trademarks copyrights or other intellectual
property rights covering subject matter in this document Except as expressly provided in any
written license agreement from Microsoft the furnishing of this document does not give you any
license to these patents trademarks copyrights or other intellectual property
copy 2010 Microsoft Corporation All rights reserved
Microsoft Excel Fluent Internet Explorer the Office logo SharePoint SQL Server VertiPaq
Windows and Windows Server are trademarks of the Microsoft group of companies
All other trademarks are property of their respective owners
Contents
Executive Summary 4
Introduction 5
Business Benefits of the Microsoft BI Solution Stack 5
Taking Advantage of Latest Hardware Trends 7
Scale-Up Designs based on Top-End Server Models 8
Enterprise Flash Drives 9
Next Generation Client Hardware 9
SQL Server 2008 R2 BI Technologies 10
Empowering Business Users 14
Intuitive Authoring Analysis and Publishing 14
Interactive Slicing and Dicing 15
Accelerated Business Reporting with Rich Visualizations 16
Facilitating Sharing and Collaboration 18
Seamless and Secure Collaboration 19
Keeping Insights Up to Date 20
Capitalizing on Existing Workbooks and Reports 21
Maximizing Business Insight 22
Increasing IT Efficiencies 23
Implementing Master Data Management 24
Centralizing BI and Data Management 26
Encapsulating Enterprise Data Sources 27
Conclusion 29
Executive Summary
Delivering actionable business intelligence remains a top priority for IT organizations CIOs
continually tell Microsoft that they need more tools and new capabilities to deliver and succeed
with BI Their wish list includes the capabilities to give users the power to drill into any aspect of
their business on their own manage enterprise information encapsulate data sources gain
control over user-generated solutions and create intuitive shareable reports and analytical
applications In short organizations need new technologies and solutions to expand the reach
of BI from traditional organizational domains into team workspaces and personal BI areas
SQL Server 2008 R2 unveils groundbreaking new technologies and tools specifically targeted
at empowering users assisting in seamless secure sharing and collaboration and increasing IT
and BI developer efficiency Innovations such as Master Data Services Report Builder 30 and
PowerPivot for Excelreg 2010 and SharePointreg 2010 donrsquot just tackle typical enterprise BI
challengesmdashthey change the game
End users will see the greatest impact from the uniform way they now have of working with BI
solutions Using familiar Microsoft Office applications anyone can process vast amounts of data
and obtain actionable insights without having to rely on developers or IT Analyzing large
datasets on desktops with familiar tools in a managed way will be routine Obtaining insights
quickly drilling down into details and discovering new information questions and answers will
all be easier
Lessening the burden on BI developers end users can create team and personal solutions in a
managed BI environment that facilitates seamless and secure sharing and collaboration on self-
service BI solutions In the process theyrsquoll also learn details about organizational BI needs
which they can effectively communicate to developers This should create faster delivery cycles
clearer requirement definitions and more time for developers to produce high-quality
organizational BI solutions
The biggest impact of SQL Server 2008 R2 on IT comes from the new generation of
management tools that drive direct stewardship ensuring data quality compliance with laws
and regulations and oversight over spreadmarts IT professionals can track and control data
entry and changes across all information systems and determine who is using shared self-
service BI applications when how often and with what application By taking proactive steps to
avoid conflicting and outdated spreadsheet data IT can mitigate causes of misleading analysis
confusing results and decision-making complications
This white paper contains information for technical decision makers evaluating the business
benefits of SQL Server 2008 R2 for their enterprises and planning to adopt a business
intelligence strategy based on the Microsoft BI Solution Stack The paper assumes familiarity
with database management systems data warehouses SharePoint farms and Microsoft Office
applications A high-level understanding of the data integration tools and technologies available
on the Microsoft SQL Server 2008 R2 platform will also help Yoursquoll find detailed information on
the Microsoft Web site at httpwwwmicrosoftcomsqlserver2008enusr2aspx
Introduction
Herersquos an all-too-common enterprise scenario Information Workers needing actionable insights
into their business ask IT for an analytics solution The ensuing development cycle burdens
requesters and developers alike with requirements analysis design suggestions user approvals
data modeling code development integration and acceptance testing further tweaking and
sometimes feature creep When the solution finally arrivesmdashweeks or months latermdashit merely
delivers information not the needed insights Or the requirements have changed Or the need is
long gone The organization still lacks the power to make informed decisions misses
opportunities and fails to become more efficient
Commonly business professionals take matters into their own hands using readily available
tools such as Microsoft Office Excel The user interface is familiar the analysis and data-mining
features are comprehensive and intuitive and spreadsheets are easy to use and share
Spreadsheets can incorporate business rules aggregate data and calculate results Frequently
those spreadsheets evolve into mission-critical tools so quickly that IT remains entirely
unawaremdashuntil a change in the underlying data sources breaks the spreadsheets (spreadmarts
as theyrsquore known) and users turn to IT for urgent troubleshooting
Unmanaged spreadmarts come with many issues Conflicting and outdated data are main
causes of decision-making complications Similar and equally serious issues arise when
enterprise information systems such as those used for CRM ERP and GL arenrsquot integrated
Lack of system integration and the absence of centralized data management can lead to non-
compliance with laws and regulations achieving efficiency is nearly impossible and the
organizations endure greater decision-making risks than necessary
It doesnrsquot have to be that way You can implement a central solution to manage master data
You can create a BI environment that turns wayward spreadmarts into managed self-service
solutions and brings developers together with power and business users You can have potent
new reporting and analytics tools that integrate with familiar Office applications SQL Server
2008 R2 packs the power to deliver it all It changes the BI game from the ground up
Business Benefits of the Microsoft BI Solution Stack
A comprehensive end-to-end BI solution must include several distinct platforms a data
infrastructure and BI platform a business collaboration platform and a business user platform
SQL Server 2008 R2 establishes the data infrastructure and BI platform integrates with
Microsoft SharePoint Server 2010 to supply a reliable and secure collaboration platform and
extends Microsoft Office 2010 to provide an intuitive and familiar user platform with powerful
analytics capabilities Together SQL Server 2008 R2 SharePoint Server 2010 and Office 2010
form the Microsoft BI Solution Stack as illustrated in Figure 1 The Microsoft BI Solution Stack is
a cornerstone in the Microsoft BI vision to provide business insight to all employees leading to
better faster more relevant decisions
Figure 1 The Microsoft BI Solution Stack
Table 1 lists key business benefits that the Microsoft BI Solution Stack provides to the
organization business users and the IT department
Organization Business Users IT Department
Increased business agility through better faster more relevant decisions
Maximized utilization of familiar Excel features such as the Office Fluenttrade user interface PivotTables PivotCharts and the new Slicers feature
Increased IT efficiency associated with monitoring and managing business data data sources and mission-critical self-service BI applications in the enterprise
Auditable repeatable management processes by maintaining a complete version history of all changes to business data for internal and external auditing purposes
Fast calculations and advanced analysis capabilities such as through automatically established data relationships and Data Analysis Expressions (DAX) which make actionable insight readily accessible to everyone
Increased consistency integrity security compliance reliability and scalability for business data and self-service BI applications based on standard SharePoint-based features
Maximized ROI into SQL Server 2008 R2 SharePoint Server 2010 and Office 2010
Intuitive authoring and publishing of business reports through Report Builder 30
High degree of data quality and accuracy for decision-making through automatic data refreshing
Business User Platform
Business Collaboration Platform
Data Infrastructure amp BI Platform
Analysis Services Reporting Services Master Data Services Integration Services Data Mining Data Warehousing
Dashboards amp Scorecards Excel Services Web-based Forms amp Workflows Collaboration Search Content Management LOB Data Integration
PowerPivot for SharePoint 2010
Self-Service Access amp Insight Data Exploration amp Analysis Predictive Analysis Data Visualization Contextual Visualization PowerPivot for Excel 2010
Reduced operations costs associated with maintaining and supporting self-service BI applications in the enterprise
Access to relevant information virtually anytime and from any location through browser support and PowerPivot galleries in SharePoint
Reduced IT backlog by delegating BI support responsibilities to power users in each department
Compliance with laws and regulations by enabling a single unified view of the truth as the basis for accurate and verifiable corporate reports
Fewer dependencies on IT for quick and easy reporting and analysis and to compress decision cycles
Ability to translate latest hardware trends into business efficiency such as high-end server systems with 256 logical processors and 2 terabytes of memory
Increased employee and team productivity through shared self-service BI applications
Rich visualizations based on reusable components to deliver meaningful effective reporting solutions quickly and efficiently
Centralization of authority to manage business data across all enterprise information systems and solutions efficiently
Higher potential to generate tangible and intangible assets by accumulating integrating managing sharing and utilizing substantially more business data than in the past
More and faster answers by combining massive amounts of data from a multitude of sources including relational databases multidimensional sources cloud services data feeds Excel files and text files in the corporate network and on the Internet
Ability to encapsulate enterprise information systems that might otherwise not be accessible through a Master Data Management solution and through report-based data feeds
Lower risks in business decision-making
Seamless and secure access to more reporting and analytical solutions based on team and personal BI needs
Higher user satisfaction and regained confidence in the ability of the IT organization to deliver and succeed with BI
New and more efficient BI processes leveraging the knowledge and skills of power users in addition to organizational BI developers
Dynamic workgroup collaboration on user-generated BI solutions with the ability to provide feedback and usage metrics on user-generated solutions
Greener data centers through linear scalability on a single server with up to 256 logical processors terabytes of memory and support of emerging storage technologies
Table 1 Business Benefits of the Microsoft BI Solution Stack
Taking Advantage of Latest Hardware Trends
There are three important hardware trends that an organization can translate directly into
business benefits by using SQL Server 2008 R2 technology More cores and logical processors
per CPU instead of faster cores increasingly affordable memory making large capacities
feasible and enterprise flash drives (EFD) entering the storage market This was impressively
demonstrated by Bill Laing Corporate Vice President Windows Serverreg and Solutions Division
at the Microsoft Windowsreg Hardware Engineering Conference (WinHEC) 2008 Bill showed a
SQL Server build fully exploiting an HP Integrity Superdome with 64 Intel Itanium processors
256 logical processors and 2 terabytes of memory achieving an almost linear scalability
Figure 2 The Relational Engine of SQL Server 2008 R2 on a Server with 256 Logical
Processors
Figure 2 illustrates how Windows Server 2008 R2 and the relational engine of SQL Server 2008
R2 support more than 64 logical processors based on processor groups and NUMA (Non-
Uniform Memory Architecture) nodes A group contains up to 64 logical processors that are
physically close to one another The premise is that a system achieves best performance when
running related code on processors in the same group The kernel determines which logical
processor belongs to which group during the system boot routine
Scale-Up Designs based on Top-End Server Models
It makes sense for organizations with large data warehouses to invest in scale-up designs
based on top-end server models Top-end systems such as HP Integrity Superdome Unisys
ES7000 and IBM x3950 M2 not only deliver massive processor power and memory capacity
for multi-terabyte data warehouses to handle their business-critical workloads with record-
setting performance but also provide high-end reliability availability and serviceability For
example 50 percent of the processors and memory banks can fail in an HP Integrity
Superdome and the faulty components can be replaced without incurring system downtime
Group 0
NUMA Node
Socket
Core
LP
LP
Socket
Core
LP
LP
Socket
Core
LP
LP
Socket
Core
LP
LP
Socket
Core
LP
LP
Socket
Core
LP
LP
Socket
Core
LP
LP
Socket
Core
LP
LP
Core
LP
LP
Core
LP
LP
Core
LP
LP
Core
LP
LP
Core
LP
LP
Core
LP
LP
Core
LP
LP
Core
LP
LP
NUMA Node
Socket
Core
LP
LP
Socket
Core
LP
LP
Socket
Core
LP
LP
Socket
Core
LP
LP
Socket
Core
LP
LP
Socket
Core
LP
LP
Socket
Core
LP
LP
Socket
Core
LP
LP
Core
LP
LP
Core
LP
LP
Core
LP
LP
Core
LP
LP
Core
LP
LP
Core
LP
LP
Core
LP
LP
Core
LP
LP
Group 1
NUMA Node
Socket
Core
LP
LP
Socket
Core
LP
LP
Socket
Core
LP
LP
Socket
Core
LP
LP
Socket
Core
LP
LP
Socket
Core
LP
LP
Socket
Core
LP
LP
Socket
Core
LP
LP
Core
LP
LP
Core
LP
LP
Core
LP
LP
Core
LP
LP
Core
LP
LP
Core
LP
LP
Core
LP
LP
Core
LP
LP
NUMA Node
Socket
Core
LP
LP
Socket
Core
LP
LP
Socket
Core
LP
LP
Socket
Core
LP
LP
Socket
Core
LP
LP
Socket
Core
LP
LP
Socket
Core
LP
LP
Socket
Core
LP
LP
Core
LP
LP
Core
LP
LP
Core
LP
LP
Core
LP
LP
Core
LP
LP
Core
LP
LP
Core
LP
LP
Core
LP
LP
Group 2
NUMA Node
Socket
Core
LP
LP
Socket
Core
LP
LP
Socket
Core
LP
LP
Socket
Core
LP
LP
Socket
Core
LP
LP
Socket
Core
LP
LP
Socket
Core
LP
LP
Socket
Core
LP
LP
Core
LP
LP
Core
LP
LP
Core
LP
LP
Core
LP
LP
Core
LP
LP
Core
LP
LP
Core
LP
LP
Core
LP
LP
NUMA Node
Socket
Core
LP
LP
Socket
Core
LP
LP
Socket
Core
LP
LP
Socket
Core
LP
LP
Socket
Core
LP
LP
Socket
Core
LP
LP
Socket
Core
LP
LP
Socket
Core
LP
LP
Core
LP
LP
Core
LP
LP
Core
LP
LP
Core
LP
LP
Core
LP
LP
Core
LP
LP
Core
LP
LP
Core
LP
LP
Group 3
NUMA Node
Socket
Core
LP
LP
Socket
Core
LP
LP
Socket
Core
LP
LP
Socket
Core
LP
LP
Socket
Core
LP
LP
Socket
Core
LP
LP
Socket
Core
LP
LP
Socket
Core
LP
LP
Core
LP
LP
Core
LP
LP
Core
LP
LP
Core
LP
LP
Core
LP
LP
Core
LP
LP
Core
LP
LP
Core
LP
LP
NUMA Node
Socket
Core
LP
LP
Socket
Core
LP
LP
Socket
Core
LP
LP
Socket
Core
LP
LP
Socket
Core
LP
LP
Socket
Core
LP
LP
Socket
Core
LP
LP
Socket
Core
LP
LP
Core
LP
LP
Core
LP
LP
Core
LP
LP
Core
LP
LP
Core
LP
LP
Core
LP
LP
Core
LP
LP
Core
LP
LP
Scale-up systems also offer a lower footprint in the data center in comparison to scale-out
systems based on commodity hardware They offer lower power consumption and heat
dissipation which facilitates efforts to build a green data center
Enterprise Flash Drives
Lower power consumption and heat dissipation as well as dramatically increased performance
are also compelling reasons to invest in EFD-based storage systems such as EMC Symmetrix
DMX-4 storage arrays According to EMC enterprise flash drives can achieve InputOutput (IO)
rates 10 times higher than traditional magnetic disk drives while consuming up to 98 percent
less energy per IO offering substantial total cost of ownership (TCO) advantages over
traditional storage media Testing conducted jointly by the Microsoft SQL Server Customer
Advisory Team (SQLCAT) and EMC Symmetrix Partner Engineering proved that flash drives
can vastly increase the performance of database applications For details refer to the white
paper ldquoEMC Symmetrix DMX-4 Enterprise Flash Drives with Microsoft SQL Server Databasesrdquo
at httpwwwemccomcollateralhardwarewhite-papersh6018-symmetrix-dmx-enterprise-
flash-with-sql-server-databases-wppdf
Note The relational SQL Server engine supports row-level and page-level compression for
tables and indexes which helps to saves storage cost while improving performance
Next Generation Client Hardware
Top-end systems and innovative storage technologies are an obvious option for database
management systems perhaps less obvious are the options surrounding client hardware
Microsoft assumes that by 2012 64-bit computing will be the standard even on client computers
as will 12-core processors And memory capacities will continue to increase while the price per
gigabyte continues to fall Microsoft Windows 7 and SQL Server 2008 R2-related client
technologies enable organizations to tap into this potential
Like Windows Server 2008 R2 Windows 7 offers support for up to 256 logical processors and
SQL Server PowerPivot for Excel 2010 makes the most of multi-core processors and gigabytes
of memory for massive data analysis on the desktop including the fastest processing of billions
of rows in about the same time as thousands Note however that 64-bit multi-core processors
are not a PowerPivot for Excel 2010 requirement PowerPivot workbooks are limited to 2
gigabytes in size which helps to avoid memory exhaustion on a 32-bit system It is therefore not
necessary to upgrade a client computer in order to run PowerPivot for Excel 2010
However test results vary depending on the compressibility of the data For fastest processing
performance Microsoft recommends multi-core processors and more than 4 GB of RAM
Note The maximum file size of a PowerPivot workbook is 2 gigabytes but there are no
restrictions regarding the amount of data users can import into a workbook It is just not possible
to save workbooks exceeding the maximum file size PowerPivot for Excel 2010 features a very
efficient compression algorithm A 2-gigabyte workbook size typically corresponds to a 4-
gigabyte dataset
SQL Server 2008 R2 BI Technologies
The SQL Server 2008 R2-based data infrastructure and BI platform comprise five key SQL
Server technologies Integration Services Relational Engine Master Data Services Reporting
Services and Analysis Services (see Figure 3) The main purpose of Integration Services is to
implement a scalable enterprise data integration platform with Extract Transform Load (ETL)
processes to load data from a wide array of data sources into the organizationrsquos data
warehouses The Relational Engine implements the relational data store and database
management system for data warehouses Master Data Services a new member of the SQL
Server family enables organizations to implement a Master Data Management (MDM) system
for central management of master data models entities and hierarchies across all information
systems in the enterprise Reporting Services offers a full range of tools and services to create
deploy and manage reports and report-based data feeds Finally Analysis Services provides
the OLAP and data-mining platform to analyze large quantities of multidimensional data based
on OLAP cubes and PowerPivot workbooks
Particularly important for team and personal BI scenarios are the improvements available with
Reporting Services and Analysis Services By using Reporting Services an organization can
encapsulate enterprise information systems through report-based data feeds so that Excel
users can more easily import the data into their self-service BI applications s Analysis Services
on the other hand provides the basis for server-based analytical processing In addition to
standard Multidimensional OLAP (MOLAP) Relational OLAP (ROLAP) and Hybrid OLAP
(HOLAP) storage modes the SQL Server 2008 R2 version of Analysis Services supports (when
installed as a service in SharePoint 2010) the new VertiPaqtrade mode to allows you run
PowerPivot workbooks In-Memory in a SharePoint 2010 farm
Figure 3 The SQL Server 2008 R2-based Data Infrastructure and BI Platform
Table 2 summarizes the most important improvements and innovations regarding key
technologies included in SQL Server 2008 R2
SQL Server Technology ImprovementsInnovations Comments
Integration Services No significant changes apart from patches and fixes which will also be available in a Cumulative Update for SQL Server 2008
The focus of SQL Server 2008 R2 is to expand the reach of BI based on existing infrastructure technology
SUPPORTINGBUSINESS
USERS
BUILDINGTHE DATA CENTER
OF THE FUTURE
JUST SOLVEMY PROBLEM
EFFORTLESSLYCONNECTED
amp IN CONTROL
REWIRINGTHE ECONOMY
Relational Engine Enhancements in
Manageability
Availability
Programmability
Scalability and performance
Security
Enhancements relate to the ability to manage data-tier applications and multiple instances of SQL Server from a central SQL Server Utility Control Point (UCP) new database mirroring options to support hot-standby servers without data loss new data storage features new data types a revamped full-text search architecture and numerous Transact-SQL improvements Scalability and performance improvements achieve higher query-processing performance and new encryption functions increase security
Master Data Services Centralized data management and delegation of administration
Stewardship portal
Data integration and synchronization services
Data cleansing service
Workflows and business rules
MDS Platform APIs
Reporting and auditing capabilities
Versioning for data entities and hierarchies
Supports data replication through Transact-SQL and Web services and a broad range of hierarchy and attribute management strategies provides secure role-based Web access to master data for browsing editing authoring auditing and approving and enables anyone in the organization to access and update master data directly with minimal impact on IT Role-based security features enable fine-grained secure access to master data and MDS can automatically notify data stewards of business-rule violations The reporting auditing and versioning features help to protect master data and ensure compliance by maintaining change histories and logging user date and time for each master data update as well as pertinent audit details such as type of change member code and prior versus new value
Reporting Services SharePoint integration enhancements
Reusable report parts
Shared datasets
Cache refresh plans
Sparklines data bars and other design enhancements
Supports SharePoint Lists as a data source multiple SharePoint Zones and the SharePoint Universal Logging service Offers the ability to store the individual parts of reports as shared components on a report server or on a SharePoint site for reuse in other
Rich geospatial visualizations
Rendering reports to data feeds
Business Intelligence Development Studio (BIDS) support
Report Builder 30
reports Provides the ability to retrieve data from shared data sources that connect to external data sources Improves data retrieval and report viewing response times by caching and refreshing reports and shared dataset query results Includes new visualization and design features to convey as much information as possible in little space and uses maps for rich visualizations by combining spatial and analytical data sources Offers the capability to render report data to an Atom service document which is included by default in all reports created with Report Builder 30
Analysis Services SharePoint integration in VertiPaqtrade mode
Aggregation design enhancements
Cube design enhancements
Dimension design enhancements
Backup and restore enhancements
Personalization extensions
Filtering and cross-validation of data mining models
Support for Office Data Mining Add-Ins
Provides the backend query-processing service for PowerPivot for SharePoint 2010 as well as a multidimensional database and data mining system in traditional OLAP environments Design improvements make it easier to create browse and modify aggregations dimensions and attribute relationships Also features a new storage structure for a more robust repository of archived databases with no practical limit to the size of the database files nor is there a limit to the number of files a database can have Personalization extensions enable developers to provide new objects and functionality dynamically in the context of the user session and the data-mining enhancements support new methods of filtering model cases and assessing the accuracy of data mining models directly in Excel when using the Data Mining Add-Ins
Table 2 Important Technological Improvements and Innovations in SQL Server 2008 R2
Note For a detailed description of all features improvements and innovations available with
SQL Server 2008 R2 refer to the SQL Server 2008 R2 product documentation on Microsoft
TechNet at httpmsdnmicrosoftcomen-uslibrarybb418432(SQL10)aspx
Empowering Business Users
SQL Server 2008 R2 helps organizations empower their users by means of the following tools
Office applications and add-ins PowerPivot for Excel 2010 and Report Builder 30 Standard
Office applications specifically Excel have long been the preferred data analysis tools of
business users Excel includes a formidable formula engine a familiar user interface and
extensive data manipulation analytics and data mining capabilities including PivotTables
PivotCharts and SQL Server Data Mining Add-ins PowerPivot for Excel 2010 extends these
capabilities by adding an in-memory BI engine and new compression algorithms to load even
the biggest data sets into Excel PowerPivot also introduces Data Analysis Expressions (DAX)
for advanced analytics in familiar Excel formula syntax Report Builder 30 on the other hand is
a separate ad-hoc authoring tool for intuitive reports based on Reporting Services By using
Report Builder 30 users can create attractive business reports in a matter of minutes featuring
conditional formatting and rich geographical visualizations In combination Office applications
PowerPivot for Excel 2010 and Report Builder 30 are the keys to bringing managed self-
service BI to all employees leading to better faster more relevant decisions
Intuitive Authoring Analysis and Publishing
Microsoft recommends that power users and business users with advanced analytics
requirements use Excel 2010 and PowerPivot for Excel 2010 for intuitive authoring and analysis
on the desktop PowerPivot for Excel 2010 is an application-level add-in available as a Web
download at wwwpowerpivotcom
Figure 4 PowerPivot for Excel 2010 Architecture
Microsoft Office Excel 2010
PowerPivot for Excel 2010 Add-In Assembly
Excel Workbook (xlsx file)
Excel WorkbookDefault XML Parts
PowerPivot Custom XML Part
PowerPivot Database
(item1data)
VertiPaq Engine
VertiPaq Database ModuleData
Cache
OLE DB Provider for
OLAP AMO ADOMDNET
Excel Features
(PivotTable PivotChart
Custom Code etc)
`
Figure 4 shows how PowerPivot extends Excel 2010 Especially noteworthy is the new version
of Microsoft OLE DB for Online Analytical Processing (OLAP) which PowerPivot adds to the
client configuration By leveraging the familiarity of the Office Fluent user interface PivotTables
PivotCharts and Excel formula syntax in DAX expressions users can hit the ground running
and get the answers they need in seconds
PowerPivot for Excel 2010 supports intuitive authoring analysis and publishing by means of the
following key features
User interface customizations PowerPivot implements its own assembly to enhance
the Excel user experience through ribbon customizations and spreadsheet templates
and overrides the default PivotTable field list to implement its own task pane
VertiPaq engine for advanced data analysis VertiPaq makes the most of multi-core
processors and gigabytes of memory to process enormous quantities of data with
incredible speed Processing millions of rows takes about the same time as thousands
Column-based compression VertiPaq compresses the data users import into a
PowerPivot workbook with efficient column-based compression algorithms and
maintains its database in a custom XML part directly in the Excel workbook
Broad support for data sources PowerPivot users can enjoy broad support of data
sources to load and combine a great variety of data for massive analysis on the desktop
including relational databases multidimensional sources cloud services data feeds
Excel files text files and data from the Web
Data Analysis Expressions By using DAX in addition to standard Excel features
PowerPivot users can quickly create advanced workbook applications These
applications can rely on data relationships between tables as in a database include
calculated columns and measures and aggregate over billions of rows In many cases
PowerPivot for Excel 2010 can establish the table relationships automatically
SharePoint integration PowerPivot users can share data models and analysis
seamlessly and securely and because the solutions are in SharePoint server-based
refresh cycles can be configured to ensure the data remains current automatically The
section ldquoFacilitating Sharing and Collaborationrdquo later in this white paper provides more
details about publishing user-generated BI solutions in a SharePoint environment
Note Microsoft recommends using SharePoint as the business collaboration platform to publish
self-service analysis solutions because SQL Server 2008 R2 integrates seamlessly with
SharePoint 2010
Interactive Slicing and Dicing
Excel PivotTables and PivotCharts are very effective tools for slicing and dicing and in
combination with PowerPivot for Excel 2010 users can slice and dice even the largest datasets
in a matter of seconds without writing any complicated formulas Slicing refers to a two-
dimensional filtering processmdashthe resulting data set only has two dimensions such as products
purchased based on geographical regions Dicing is a filtering process that produces a multi-
dimensional subset of the original data such as products purchased by region quarter and
customer age which enables the user to look at the data from different dimensional
combinations with a specific focus Slicing and dicing are closely related and enable the user to
interact with the data drill down into details and infer insights that are not immediately apparent
in the overall data set With PowerPivot for Excel 2010 slicing and dicing is as easy as dragging
horizontal and vertical slicers onto a spreadsheet as illustrated in Figure 5
Figure 5 Interactive Slicing and Dicing with PowerPivot for Excel 2010
PowerPivot for Excel 2010 offers the following advantages for interactive slicing and dicing
User interface familiarity Users can use familiar PivotTable views charts and slicers
for interactive analysis
High scalability and performance Users can sort filter and scroll through millions of
rows in seconds
Anywhere access In a SharePoint environment users can work seamlessly via Web
browser and enjoy the same performance as in Excel 2010
Note Interactive slicers enable users to look at their data from multiple directions in Excel 2010
and in the browser through PowerPivot for SharePoint and Excel Services
Accelerated Business Reporting with Rich Visualizations
Report Builder 30 accelerates report creation facilitates sharing and collaboration and helps to
ensure reporting consistency by enabling users to create and share reusable report elements in
a Shared Component Library Shared components make it quick and easy to assemble
comprehensive business reports in a professional-looking format As Figure 6 illustrates Report
Builder 30 also supports ldquomashing uprdquo business data with geographic information to get more
value out of every report While most reports use relational and multidimensional databases as
data sources you can also use shared PowerPivot workbooks as Report Builder data sourcds
Figure 6 ldquoMashing Uprdquo Business Information with Geographic Representation
SQL Server 2008 R2 Reporting Services and Report Builder 30 address the following
productivity areas
Intuitive Authoring Report Builder 30 accelerates report creation by leveraging
existing content objects such as queries tables charts maps gauges and logos
Ad-hoc reporting Users can interact with a report through run-time sorting and filtering
multiple sorting grouping as well as column and row group ordering on already
rendered data to further analyze information
Rich visualization Mapping routing custom shapes support for SQL spatial
information and integration with Bing Maps helps to get more value out of BI and
increase user adoption
Report sharing Users can publish predefined queries reports and charts
independently of IT synchronize updates with published content objects and take
advantage of SharePoint-integrated mode
Reuse of subcomponents Reporting Services provides libraries of predefined queries
data and report subcomponents Their reuse helps to decrease report creation time
Existing reports can also be used as data sources for desktop analytics
SharePoint integration Seamless publishing via SharePoint enables business users
to access reports from any location with network connectivity
Note IT organizations can take advantage of Report Builder 30 to encapsulate enterprise data
sources by means of data feeds accessible through published reports in SharePoint
Facilitating Sharing and Collaboration
There are at least three compelling reasons to use SharePoint 2010 in an enterprise BI
environment to establish a business collaboration platform Seamless sharing and collaboration
with flexible security down to the individual item level centralization of farm and infrastructure
administration and automated server-based processing through Windows services and
SharePoint Timer jobs Seamless sharing and collaboration with the ability to delegate control
over individual site collections sites libraries and galleries as well as over individual workbook
applications provides the basis to bring all BI players together in a managed environment as
illustrated in Figure 7 Centralization of farm and infrastructure administration helps IT
departments maintain the managed BI environment with operational efficiency and server-
based processing gives users the ability to access published BI solutions in a Web browser
instead of Excel while workbook owners can schedule fully automated data refresh cycles to
ensure data and analysis remain current and accurate Server-based processing also makes it
possible to reuse published workbook applications and reports as data sources in additional
self-service BI solutions
Figure 7 Bringing all BI Players Together in a Managed BI Collaboration Environment
Note Managed self-service BI is about providing business insights to all employees Heavy
involvement of power users and business users in the design and creation of self-service BI
solutions is therefore critical to the success of managed self-service BI initiatives
IT deploys and maintainsthe managed BI environment
Information workers and decision makers use corporate BI solutions and
published self-service BI applications
Corporate BI Suggestions
Tech
no
logi
cal
Req
uir
emen
ts
Co
llab
ora
tio
n
Req
uir
emen
ts
Org
aniz
atio
nal
BI s
olu
tio
ns
BI Solution Developer
Producer of Insights
(Power User)
Shar
ed s
elf-
serv
ice
BI a
pp
licat
ion
sConsumers of Insights
IT Admin
Seamless and Secure Collaboration
As depicted in Figure 7 power users play an important role as producers of insights at the team
and personal BI level Complementing BI developers who create organizational solutions power
users create and share workbook applications and reports by using PowerPivot for Excel 2010
and Report Builder 30 Figure 8 shows the relationship between power users as producers and
business users as consumers of insights in more detail
Figure 8 Collaboration between Producers and Consumers of Insights
Ultimately power users decide whether to publish self-service BI solutions in SharePoint-based
report libraries and PowerPivot galleries To ensure they do the managed BI collaboration
environment must enable power users to publish their solutions effortlessly and securely They
must also be able determine security roles indicating who can access uploaded self-service BI
solutions and who can modify these solutions with minimal dependency on IT SharePoint 2010
fulfils these requirements by means of a flexible role-based security model that supports
delegation of administrative control to groups and individual user accounts as well as
permission inheritance and explicit permission assignments At any level in the site collection
hierarchy down to the individual workbook files a privileged power user can disable permission
inheritance and specify individual settings such as view-only permissions to prevent business
users from downloading a particular PowerPivot workbook to their workstations
In general business users do not need to download PowerPivot workbooks and do not need to
install Office 2010 or PowerPivot for Excel 2010 on their workstations because these consumers
of insights can access published self-service applications through a Web browser PowerPivot
SharePoint Site Collections Sites Libraries and Galleries
Uploading Workbooks and Report Definitions as Shared Self-Service BI Applications
Consumers of Insights
(Business Users)
IT Admin SharePoint Farm and BI Infrastructure
SharePoint-integratedReporting Services
PowerPivot forSharePoint
PowerPivot forExcel 2010
ReportBuilder 30
Internet Explorer
PowerPivot forExcel 2010
Viewing or Downloading Shared Self-Service BI Applications
Producer of Insights
(Power User)
Excel Services
for SharePoint 2010 (in combination with Excel Services) and Reporting Services in SharePoint-
integrated mode can render PowerPivot workbooks and online reports directly on a SharePoint
server This capability not only eliminates software and download requirements on the desktop
but makes it easy for business users to work together It also boosts the productivity of project
teams and business units because analysis and detailed business insights are accessible at any
time in any location on any device
By taking advantage of SharePoint 2010 SQL Server 2008 R2 enables producers and
consumers of insights to collaborate seamlessly and securely in a managed BI environment
SharePoint security model All SharePoint-integrated technologies of SQL Server
2008 R2 leverage the role-based SharePoint security model to delegate administrative
authority and apply group and user permissions at the site collection site library gallery
and item level in a consistent way
Excel Services PowerPivot for SharePoint 2010 takes advantage of Excel Services to
render PowerPivot workbooks directly on the application server BI consumers can
seamlessly access shared workbook applications directly in the browser without having
to download all the data to their workstations
Reporting Services in SharePoint-integrated mode Report Builder 30 fully exploits
the advantages of Reporting Services in SharePoint-integrated mode to store manage
and render reports directly within the SharePoint collaboration environment Uploaded
report definitions automatically open in the Report Viewer Web Part which supports
page navigation search print and export features You can also connect the Report
Viewer Web Part to a Filter Web Part or a Library Web Part in dashboards or site pages
Standard SharePoint features By using workflows alerts and version control IT
organizations and business units can coordinate how users share their solutions and
streamline analysis SharePoint also facilitates dynamic collaboration on user-generated
contents with the ability to provide feedback and details about usage metrics
Note SQL Server 2008 R2 Reporting Services includes stand-alone and ClickOnce versions of
Report Builder 30 ClickOnce in SharePoint-integrated mode means that users can use the
New or Actions menu directly in a SharePoint library to start Report Builder 30 without having
to install this tool directly on the local computer in a previous step
Keeping Insights Up-to-Date
In addition to permission assignments power users can also manage the data refresh settings
for uploaded self-service BI solutions including refresh schedule user credentials for the
update process and the portions of the datasets that should be updated to ensure accurate
analysis and decision-making SharePoint 2010 then performs the data refresh automatically
As illustrated in Figure 9 SharePoint accomplishes this task based on a PowerPivot Data
Refresh timer job which the SQL Server 2008 R2 Setup program adds to the SharePoint
configuration when installing PowerPivot for SharePoint 2010 This timer job runs every minute
on the SharePoint server to determine if a data refresh job needs to be scheduled and executed
Figure 9 Specifying Data Sources and Keeping Data Up-To-Date
Automatic data refresh for published PowerPivot workbooks offers organizations the following
advantages
Decisions based on most recent data Scheduled data refreshes ensure the data in
managed self-service BI solutions remains current automatically even over the Internet
Centralized monitoring of update processes The IT organization can use the
PowerPivot Management Dashboard to monitor shared workbook applications and
ensure they are always available and up-to-date Among other things the PowerPivot
Management Dashboard enables IT administrators to analyze the data source
information to see where the data in managed self-service BI solutions is coming from
The section ldquoIncreasing IT Efficienciesrdquo later in this white paper covers the Management
Dashboard in more detail
Note SharePoint can refresh the data from the specified data sources over the Web in the
cloud from internal databases Excel files and any other location with network connectivity
Capitalizing on Existing Workbooks and Reports
Automatic data refresh lessens the self-service BI maintenance burden once a solution has
been created and published but SQL Server 2008 R2 also streamlines the creation process
itself For example Report Builder 30 lowers the barrier to entry for authoring customized
reports by allowing users to start from modular components available in a Shared Component
Data Sources
PowerPivotData Refresh
Timer JobPower User
PowerPivot for Excel 2010 Internet Explorer
PowerPivot for SharePoint 2010
Business Users
Power user specifies data refreshing settings
Business users enjoy up-to-date information and analysis
Analysis Services
Microsoft SQL Azure
OfficeAccess
Oracle
TeradataReporting Services
SQL Server
ExcelFiles
TextFiles
Others (OLE DBODBC)
IBM DB2
Sybase Informix
Library such as query objects data regions charts and graphs Figure 10 illustrates this
concept Constructing professional reports based on preexisting building blocks created
individually or as part of another report dramatically accelerates the self-service BI solution
delivery cycle cuts development costs facilitates timely decisions and ultimately increases
user adoption
Figure 10 Reusing Report Components
SQL Server 2008 R2 and Report Builder 30 boost the productivity of report designers by means
of the following features
Shared Component Library Reusing common report elements published in the
Shared Component Library is the basis for ldquoGrab and Gordquo reporting It makes building
up-to-date reports quick and easy
Synchronization of updates Automatic update of shared components ensures that
reports remain current Report designers do not need to implement update or
synchronization logic manually
Note SharePoint provides the central location for sharing and editing report components and
can automatically synchronize published content objects
Maximizing Business Insight
Another innovative capability with impact on the relationship between power users and the IT
department centers on the ability to reuse existing PowerPivot workbooks and Reporting
Services-based reports as data sources in further analysis and reporting solutions This helps to
reduce the requirement for direct access to enterprise information systems and mitigates
hindering dependencies on IT
A power user with access to an enterprise information system can now create intermediate data
sources in the form of PowerPivot workbooks and reports By publishing these self-service BI
applications in SharePoint other users without direct access can then reuse the published
intermediary information in their own PowerPivot workbooks and reportsmdashwhile SharePoint
keeps the data automatically updated in all solutions Figure 11 illustrates the relationship
between PowerPivot Reporting Services and SharePoint in this scenario
Figure 11 Workbooks and Reports as Data Sources
BI producers can use the following strategy to maximize business insight with minimal
dependency on IT
1 A power user imports data into PowerPivot through report-based data feeds or other
means
2 The power user publishes the resulting PowerPoint workbook in SharePoint configures
automatic data refresh settings grants access permissions if necessary and
communicates the URL of the published workbook to other BI producers
3 Other BI producers reference the URL of the published PowerPoint workbook as a data
source in their own self-service BI solutions
Increasing IT Efficiencies
SQL Server 2008 R2 provides two basic options to increase IT efficiencies Streamlining
processes associated with data and BI management across the enterprise and centralizing
ReportBuilder 30
PowerPivot for SharePoint 2010
PowerPivot forExcel 2010
access to enterprise information in a managed BI environment To help organizations streamline
data and BI management processes SQL Server 2008 R2 includes Master Data Services (MDS)
and a PowerPivot Management Dashboard For centralizing access to enterprise information
organizations can also rely on MDS or use Reporting Services-based reports as explained later
in this section
Implementing Master Data Management
Master Data Services gives organizations all the tools they need to maintain and synchronize
business data across all their source information systems so the individual pieces of the data
puzzle always add up to a consistent complete and accurate picture as indicated in Figure 12
By integrating the various source systems in the enterprise with a centralized MDS-based
Master Data Management solution organizations can ensure the accuracy of business-critical
information consistency of reporting and compliance with laws and regulations
Figure 12 An MDM System based on Master Data Services
At the core MDS implements a store to maintain master data and service client applications
Master data is business data that pertains to the nouns of the business such as customers
stores products or contracts or any other business-relevant items or concepts The MDS store
can also capture additional business data that is not stored in any other information system
MDS also implements an ETL pipeline to connect and synchronize the MDS system with the
various source systems in the enterprise As part of data synchronization MDS can perform
Point-Of-Sales SystemGeneral Ledger SystemCustomer Relationship Management System
Enterprise Resource Planning System
ID 1
Customer
ID 7-B-C
Customer
ID 43
Customer
ID XY
Customer
Customer _MasterID 123
Marketing 1Consulting XYSupport 43Claims 7-B-COther AB01Homeless H1
Data Store(Master Data Version History Hierarchies)
Stewardship Portal(Role-Based Security Business
Rules MergeMatchRevert
Workflows Approval Versioning
Auditing Reporting Hierarchy Management)
Extract Transform and Load (ETL) Processes
(Stored Procedures SQL Server Integration Services Packages Web Services)
Other System(s)
ID AB01
Customer
Data Steward
IT Admin Information Worker LOB App UserSolution Developer
GL
Credits and
Debits
Outlook Contact
ERP
Tax
Information
CRM
Database
Record
PSS
Helpdesk
Tickets
SCM
Reverse
Logistics
Conference
System
Seat
Reservation
Legal
Contracts
SharePoint
List Item
ECM
Letters and
Documents
Additional
Information
Order
Fulfillment
System
GL
Credits and
Debits
Outlook Contact
ERP
Tax
Information
CRM
Database
Record
PSS
Helpdesk
Tickets
SCM
Reverse
Logistics
Conference
System
Seat
Reservation
Legal
Contracts
SharePoint
List Item
ECM
Letters and
Documents
Additional
Information
Order
Fulfillment
System
GL
Credits and
Debits
Outlook Contact
ERP
Tax
Information
CRM
Database
Record
PSS
Helpdesk
Tickets
SCM
Reverse
Logistics
Conference
System
Seat
Reservation
Legal
Contracts
SharePoint
List Item
ECM
Letters and
Documents
Additional
Information
Order
Fulfillment
System
Power User Decision Maker
GL
Credits and
Debits
Outlook Contact
ERP
Tax
Information
CRM
Database
Record
PSS
Helpdesk
Tickets
SCM
Reverse
Logistics
Conference
System
Seat
Reservation
Legal
Contracts
SharePoint
List Item
ECM
Letters and
Documents
Additional
Information
Order
Fulfillment
System
ID H1
Customer
Additional Data
data cleansing tasks and establish reliable associations between the data fragments hosted in
each individual information system
To facilitate business process optimization MDS also incorporates a Stewardship Portal for
secure role-based Web access to master data for browsing authoring editing approving
auditing and reporting according to the business rules defined in the system Stewardship
Portal implements the interface to manage role-based security master data hierarchies
approval workflows and version histories Data stewards can also merge and match replicated
data attributes and revert incorrect changes back to the previous state
An MDM solution based on Master Data Services provides the following capabilities
Data governance and stewardship By centrally maintaining business rules that the
business data has to follow in all stages of its lifecycle the MDS system has both a
governance function to guarantee that the right controls are in place and a stewardship
function to ensure that the controls are enforced Organizations can establish a single
unified clean and authoritative ldquomasterrdquo representation of relevant business data
Data integration and synchronization The MDS platform can act as the system of
entry as well as the system of record for all other information systems in the enterprise
Enterprise data encapsulation MDS can act as a central data source for line-of-
business (LOB) applications OLAP tools and self-service BI solutions encapsulating
enterprise information systems that might otherwise not be accessible
Enhance business data The MDS master data store can also host additional
information that is not maintained elsewhere in the organization As illustrated in Figure
12 it gives ldquohomelessrdquo data a home
Facilitate collaboration across organizational boundaries As a Web-based
collaboration platform MDS enables organizations to manage the process of change for
business data securely and efficiently
Tracking and auditing MDS maintains a complete version history of all changes It is
easy to roll back incorrect changes and if an auditor wants to know who was working on
the data there is a single authoritative place to find the answer
Compliance with laws and regulations By enabling a single unified view of the truth
master data can help an organization comply with laws and regulations that mandate
accuracy and completeness of business reports Organizations can prove that reports
are based on accurate and verifiable data
Business planning As a planning system MDS enables business users to track
relevant information even in the earliest brainstorming phases
Hierarchy management An MDS system can organize and classify business data in
multiple explicitly or dynamically defined hierarchies that may or may not exist in the
underlying data sources
Proactive data profiling and reporting MDS can scan source systems for violations
of business rules missing values in data records incorrect values duplicate records
and other data-quality issues Reports can be created that show the number of rules
violations detected the number of manual interventions required and the average
latency of master data updates
Note The capabilities of Master Data Services go beyond the scope of business intelligence MDS is a
platform for implementing a comprehensive reliable and secure technological foundation for efficient
MDM processes across organizational boundaries
Centralizing BI and Data Management
Power users and business users view the managed BI environment primarily as a centralized
collection of sites libraries and galleries that provide access to the BI applications they need
and trigger alerts and workflows to facilitate collaboration IT administrators on the other hand
view the managed BI environment from a different perspective as illustrated in Figure 13
Figure 13 Tracking the Most Popular PowerPivot Workbooks in a Managed BI Environment
SharePoint Site Collections Sites Libraries and Galleries
SharePoint Farm and BI Infrastructure
Power User Business Users
Web Applications
PowerPivot
Gallery
Excel Web
Access
Excel Web
Services
PowerPivot
Management Dashboard
PowerPivot
Web Service
Service Applications
Analysis Servicesin VertiPaq Mode
PowerPivotSystem Service
Excel Calculation
Services
SharePoint-integrated
Reporting Services
SharePoint Timer Service
IT Admin
SharePoint Databases
SharePoint
Content Database
PowerPivot
Application Database
SharePoint
Content Database
SharePoint
Content Database
SharePoint
Configuration Database
IT administrators primarily care about usage statistics for published workbook applications as
well as statistics regarding the availability and performance of their Web applications service
applications and databases hosted on front-end servers application servers and database
servers in the SharePoint farm To provide this information SQL Server 2008 R2 includes a
customizable PowerPivot Management Dashboard that visualizes server and usage statistics
with animated charts The dashboard information helps IT administrators oversee their BI
environments with operational efficiency and it provides the basis to ensure that user-generated
BI solutions are continuously available up-to-date and secure
The PowerPivot Management Dashboard enables the following administrative tasks
Discover mission-critical self-service BI applications IT administrators can monitor
activities and performance of shared workbook applications track usage patterns over
time drill down to reveal hidden details and detect solutions that have become mission-
critical
Ensure data quality integrity and security The Operations Dashboard reveals the
largest and most popular solutions their data sources top users and query-
performance per workbook and helps in this way to ensure high availability scalability
and reliability for mission-critical applications
Track server status and ensure quality of service (QoS) Server administrators can
keep an eye on CPU and memory utilization system capacity and performance per
server response times and current server state to provision appropriate server
resources to ensure high availability and performance according to QoS requirements
Note PowerPivot for SharePoint 2010 integrates with the SharePoint logging infrastructure based on
Unified Logging Service (ULS) The PowerPivot Usage Data Import timer job collects this usage
information from the PowerPivot components and imports it into the centralized SharePoint Usage
Collection database Other timer jobs process this information as well as server health statistics import
the results into the PowerPivot application database and then update the workbook of the PowerPivot
Management Dashboard
Encapsulating Enterprise Data Sources
Data feeds exposed through Reporting Services-based reports will play an important role in
PowerPivot-based self-service BI scenarios for numerous reasons Among other things all
reports created using Report Builder 30 and Reporting Services expose data feeds for
importing the report data conveniently into PowerPivot for Excel 2010 Importing report data into
PowerPivot is as easy as a clicking an orange button on the reportrsquos toolbar with the tooltip
ldquoExport to Data Feedrdquo Doing so launches the data import wizard to add the feed to a
PowerPivot workbook
As mentioned earlier in the section ldquoMaximizing Business Insightrdquo power users can encapsulate
PowerPivot workbooks and other data sources by means of report-based data feeds with
minimal dependency on IT In a similar way the IT organization can use report-based data
feeds to encapsulate enterprise systems that are notoriously hard to get to such as enterprise
resource planning (ERP) systems and customer relationship management (CRM) systems It is
possible to encapsulate and consolidate heterogeneous data sources for analysis to accelerate
common or complex analysis tasks and increase consistency Figure 14 illustrates how an
organization can take advantage of report-based data feeds to provide users with centralized
secure access to the mission-critical information they need
Figure 14 Encapsulating Data Sources through Report-Based Data Feeds
SQL Server 2008 R2 Reporting Services-based data feeds provide the following advantages
Virtually unlimited data access Users can get secure access to mission-critical
information systems via server-based reports that access the source systems using a
system account
Consolidated heterogeneous data sources Reporting Services supports a wide
range of data sources in reports that can serve as data feeds for analysis Consolidating
and preparing data helps to decrease analysis complexity increases consistency helps
to compress decision cycles and contributes to more accurate business insights
OLTP and OLAP Data Sources
Analysis Services
Microsoft SQL Azure
OfficeAccess
Oracle
Teradata
SQL Server
Others (OLE DBODBC)
IBM DB2
Sybase
Informix
SharePoint Farm
Reporting Services
PublishingReport Definition
(rdl) Files
Pu
blis
hed
Rep
ort
s
PowerPivot for Excel 2010
Data Feed-based Import
Increased power user productivity With data-encapsulating and -consolidating
reports readily available in the managed BI collaboration environment users do not
waste time importing data from a variety of internal and external sources
Note Data feed capabilities are provided out of the box in every report based on SQL Server
2008 R2 Reporting Services
Conclusion
The groundbreaking new tools and technologies included in SQL Server 2008 R2 enable
organizations to empower their users facilitate seamless and secure sharing and collaboration
on user-generated BI solutions and help to increase IT and BI developer efficiencies Tools
such as PowerPivot for Excel 2010 and Report Builder 30 and innovative technologies
such as PowerPivot for SharePoint 2010 Analysis Services in SharePoint on VertiPaqtrade or
traditional storage modes Reporting Services and Master Data Services not only tackle all
typical BI challenges in the enterprise they truly change the game of BI The focus shifts from IT
delivering organizational BI solutions to a managed BI collaboration environment that gives
users the power to get timely and reliable information to make more relevant decisions
The managed BI collaboration environment does not replace organizational BI but complements
it with managed team and personal BI solutions Power users can now assume the role of
producers of insights offloading work from organizational BI development teams where
appropriate and otherwise communicating suggestions for organizational BI solutions to them
Heavy involvement of power users and business users in all areas of an organizationrsquos BI
initiatives is crucial to the success of BI in the enterprise
Power users the producers of team and personal BI solutions primarily work with PowerPivot
for Excel 2010 and Report Builder 30 to create workbook applications and online reports Both
tools integrate seamlessly with SharePoint 2010 for secure sharing and collaboration with
colleagues Business users the consumers of insights primarily work with Internet Explorerreg or
any other supported Web browser to view shared applications and reports rendered directly on
the server It is not necessary to download PowerPivot workbooks for analysis Business insight
is now readily available wherever and whenever a user needs it on any browser-capable device
Thanks to SQL Server 2008 R2 technology it is becoming easier for business users to get
accurate answers in seconds and to ask even more questions drill down into details discover
new information and new questions and new answers Built on the familiarity of Excel
PowerPivot vastly expands existing client capabilities with column-based compression an in-
memory BI engine virtually unlimited data sources and new Data Analysis Expressions in
familiar formula syntax PowerPivot users can process massive amounts of data in seconds
and data refresh through PowerPivot for SharePoint 2010 ensures that published PowerPivot
workbooks remain up-to-date Furthermore Reporting Services data feeds can encapsulate
enterprise systems that are otherwise not accessible and reuse shared PowerPivot workbooks
as data sources in new analyses Another viable option to encapsulate enterprise systems is
Master Data Services
Master Data Services is an important technology for establishing sound Master Data
Management processes in the enterprise and increasing an IT organizationrsquos data management
efficiency Among other things MDS can help to drive direct stewardship to ensure data quality
and compliance with laws and government regulations Another key tool is the PowerPivot
Management Dashboard which enables IT to gain control and take proactive steps to avoid
conflicting and outdated data in spreadmarts which are main causes of misleading analysis
confusing results and complications in decision-making IT can now determine who is using
shared BI applications when how often and with what client IT can also analyze data source
information to see where users are importing their data from and obtain server health statistics
SQL Server 2008 R2 redefines how organizations deliver and succeed with BI It affects all
areas ranging from traditional organizational domains to team workspaces and personal BI
SQL Server 2008 R2 is the technology IT organizations need to reestablish confidence in their
ability to deliver timely reliable relevant and actionable information for sound business
decisions
For more information
httpwwwmicrosoftcomsqlserver SQL Server Web site
httptechnetmicrosoftcomen-ussqlserver SQL Server TechCenter
httpmsdnmicrosoftcomen-ussqlserver SQL Server DevCenter
Did this paper help you Please give us your feedback Tell us on a scale of 1 (poor) to 5
(excellent) how you would rate this paper and why you have given it this rating For example
Are you rating it high because it has good examples excellent screenshots clear writing
or another reason
Are you rating it low because it has poor examples fuzzy screenshots or unclear writing
This feedback will help us improve the quality of white papers we release
Send feedback
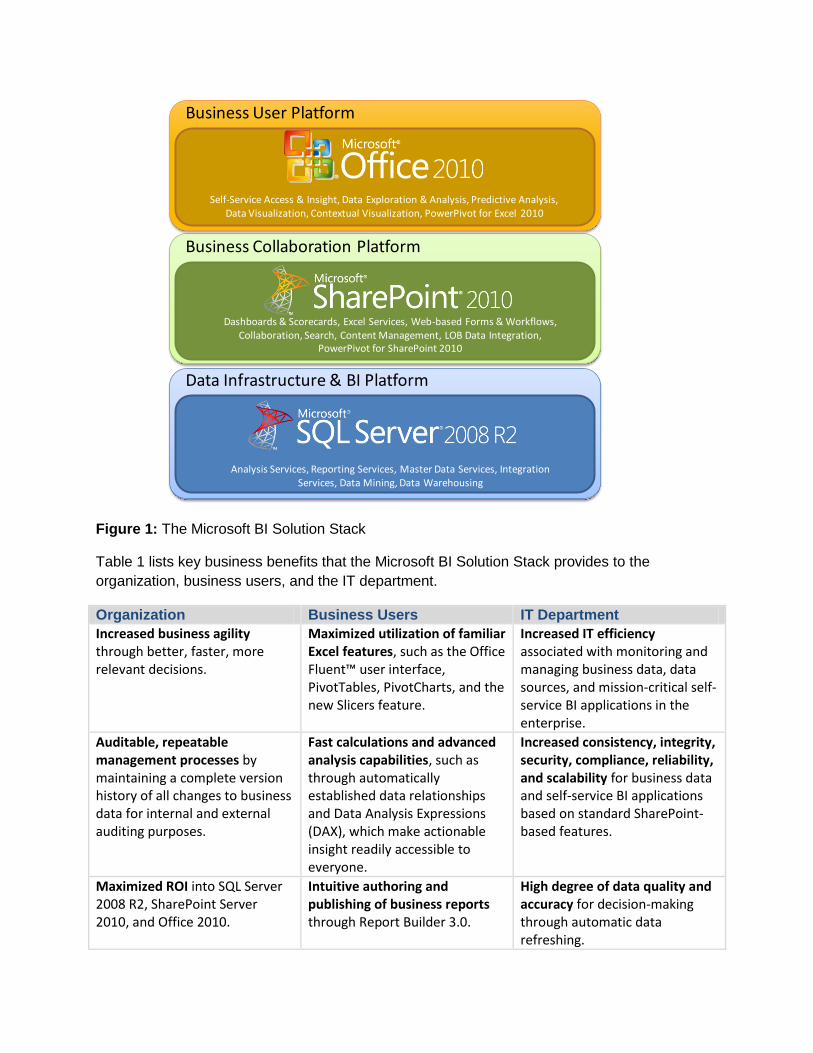
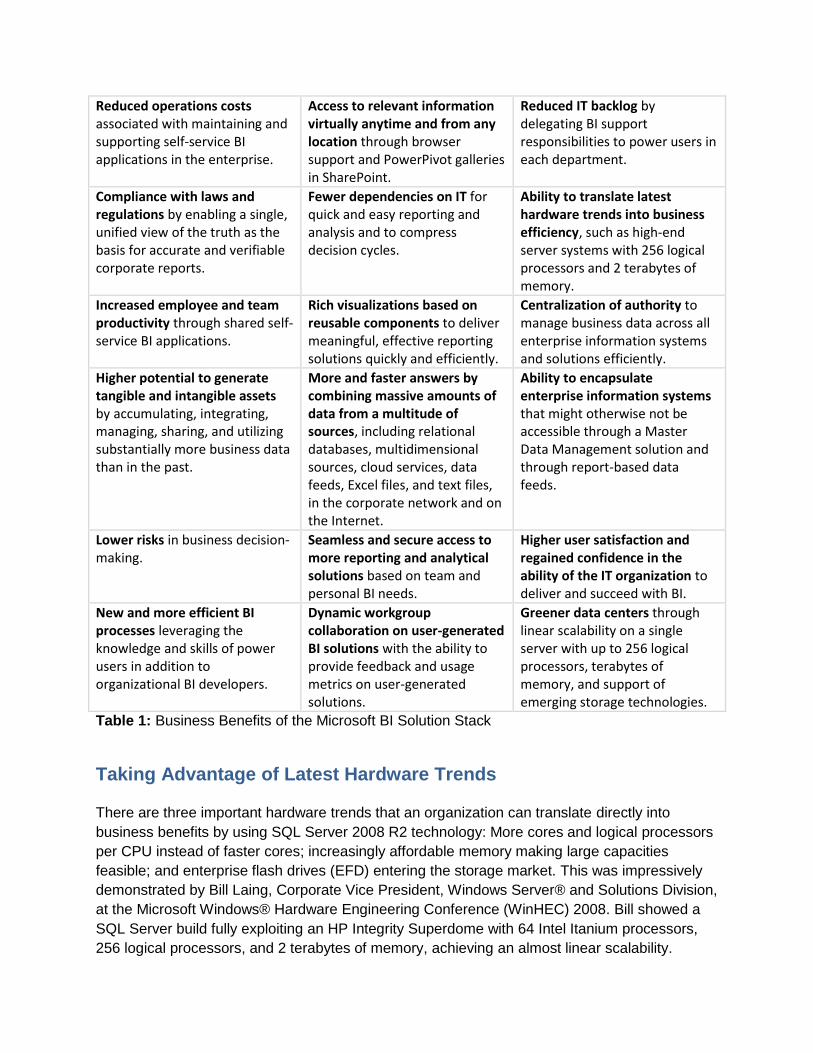
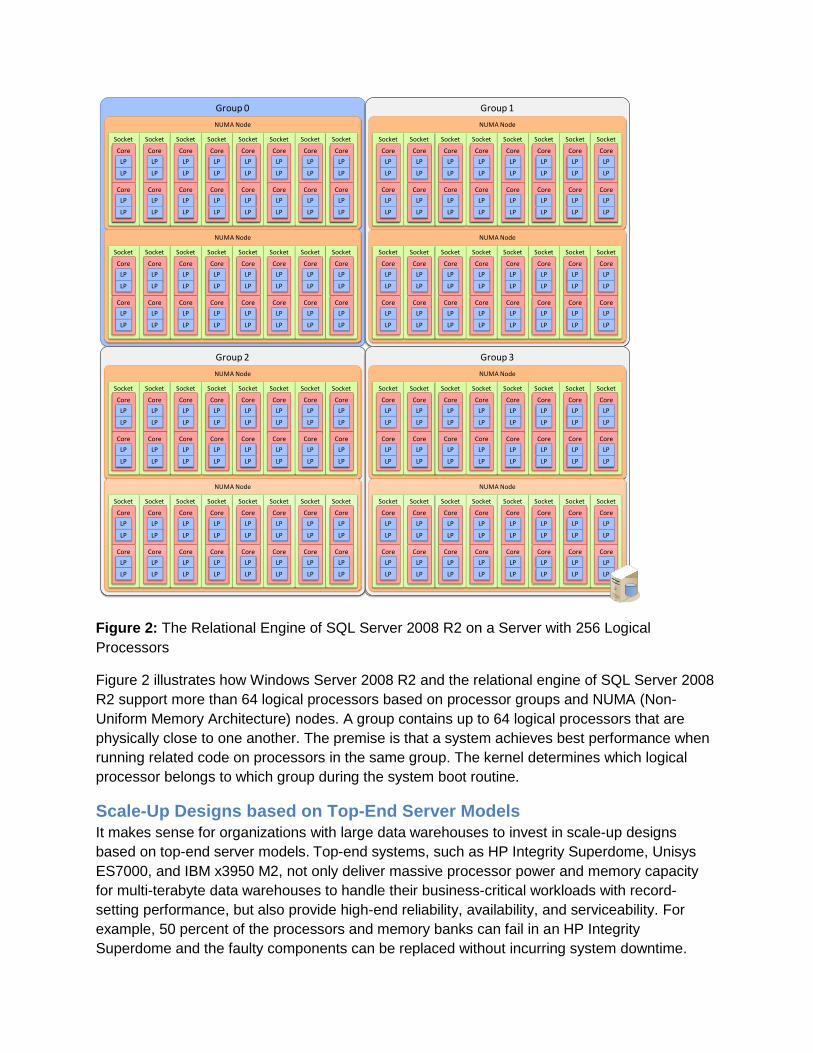
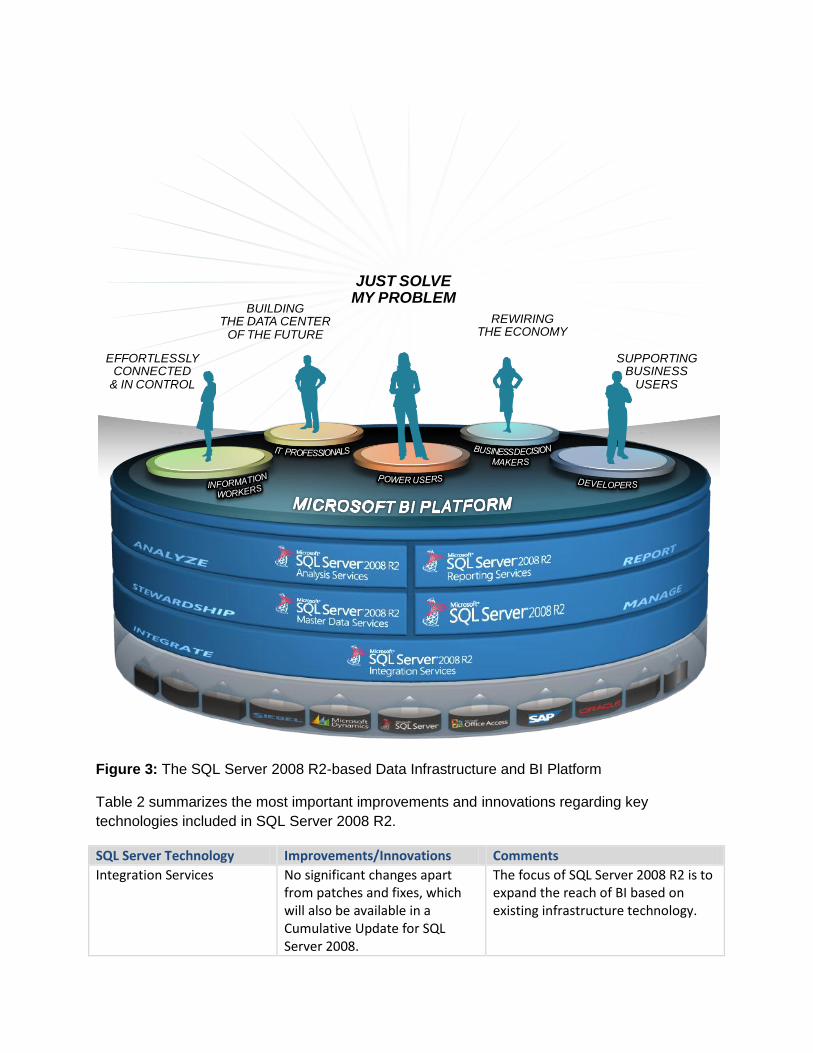
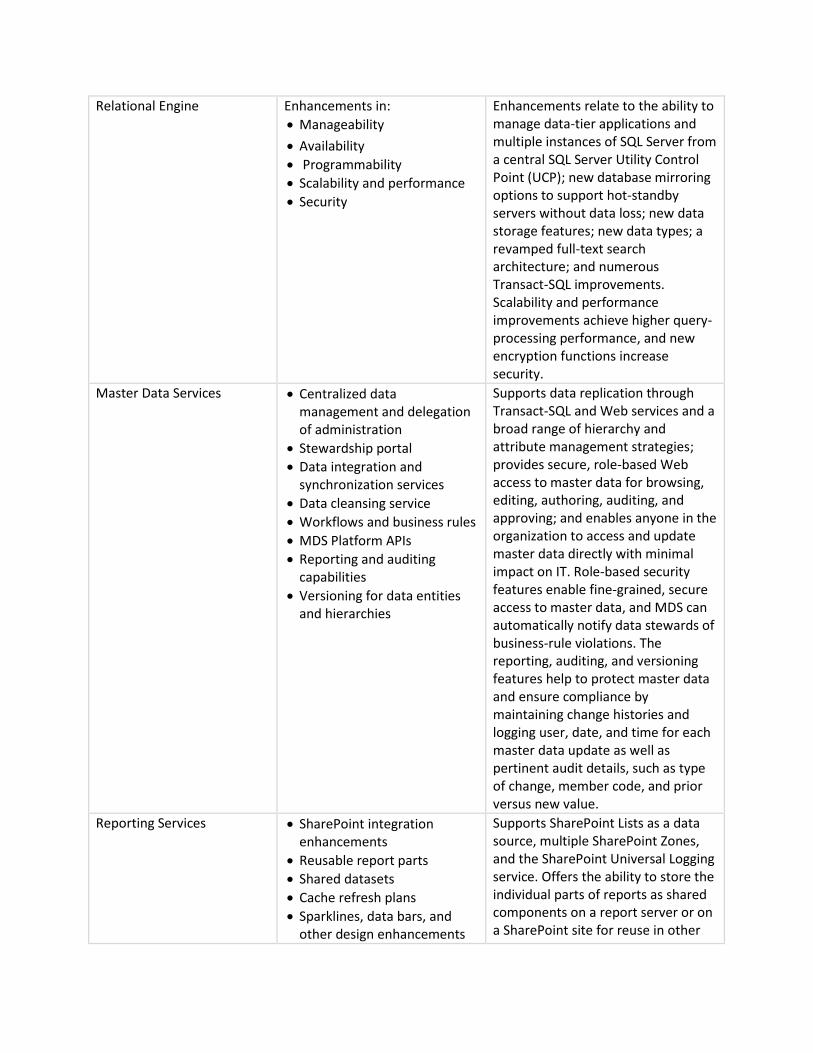
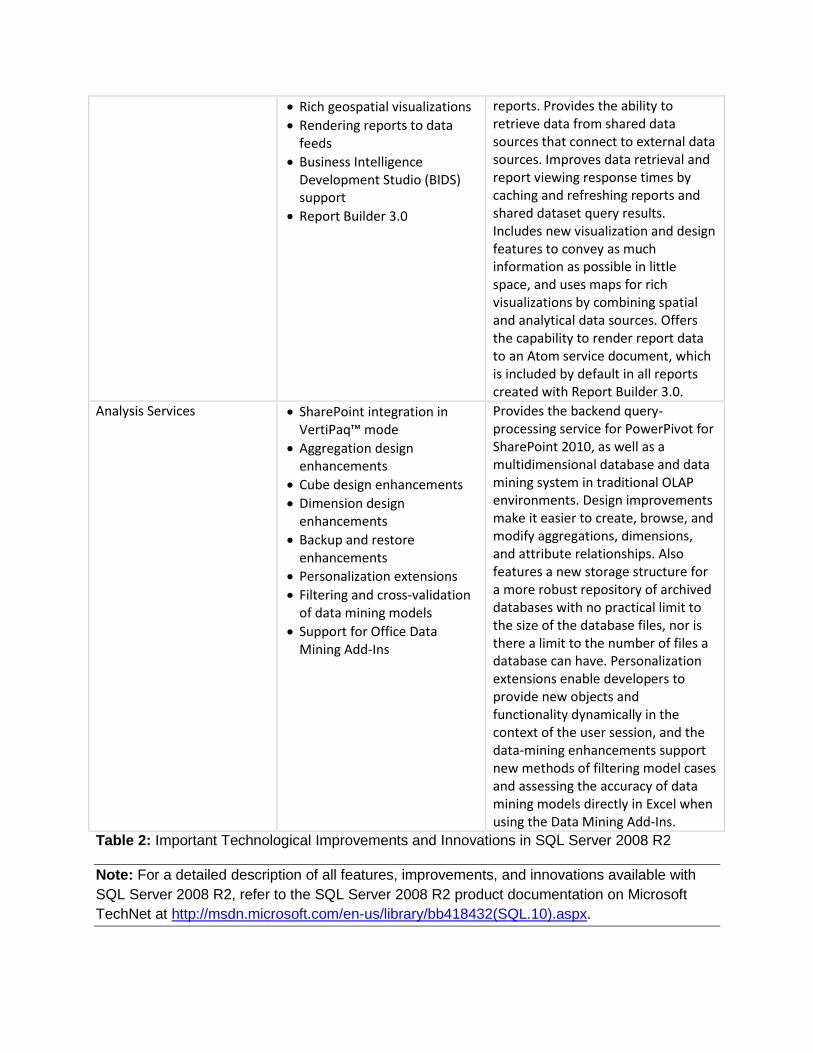
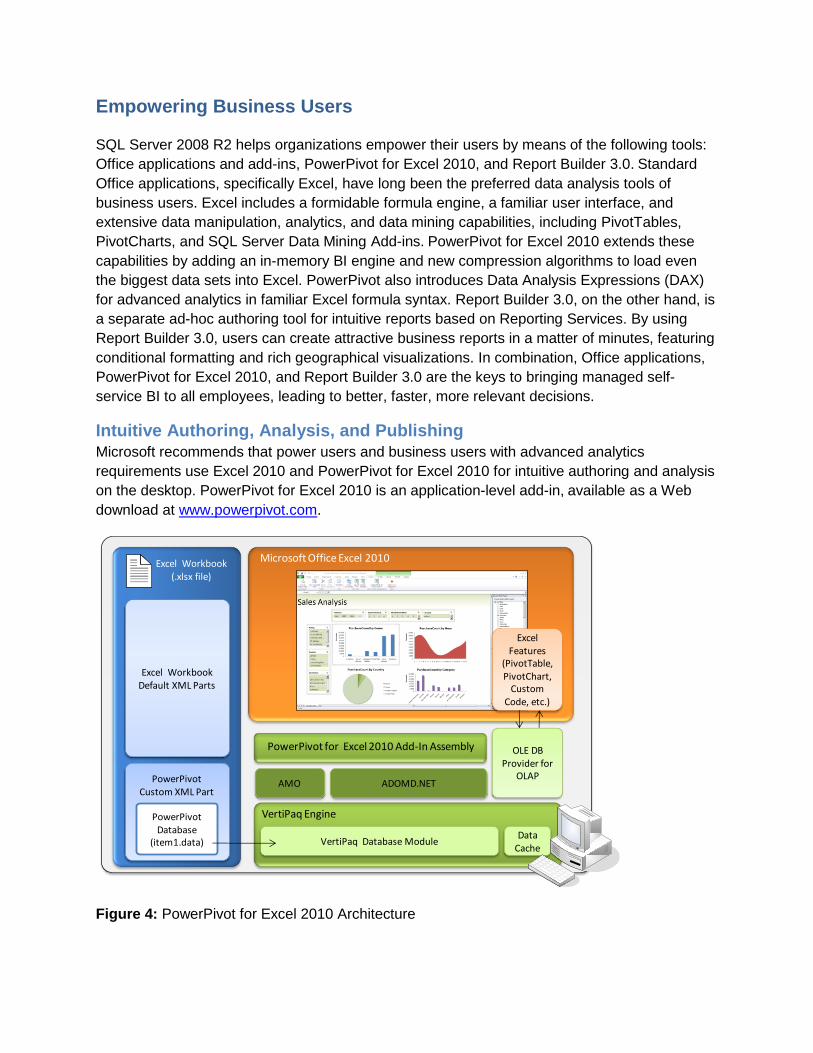
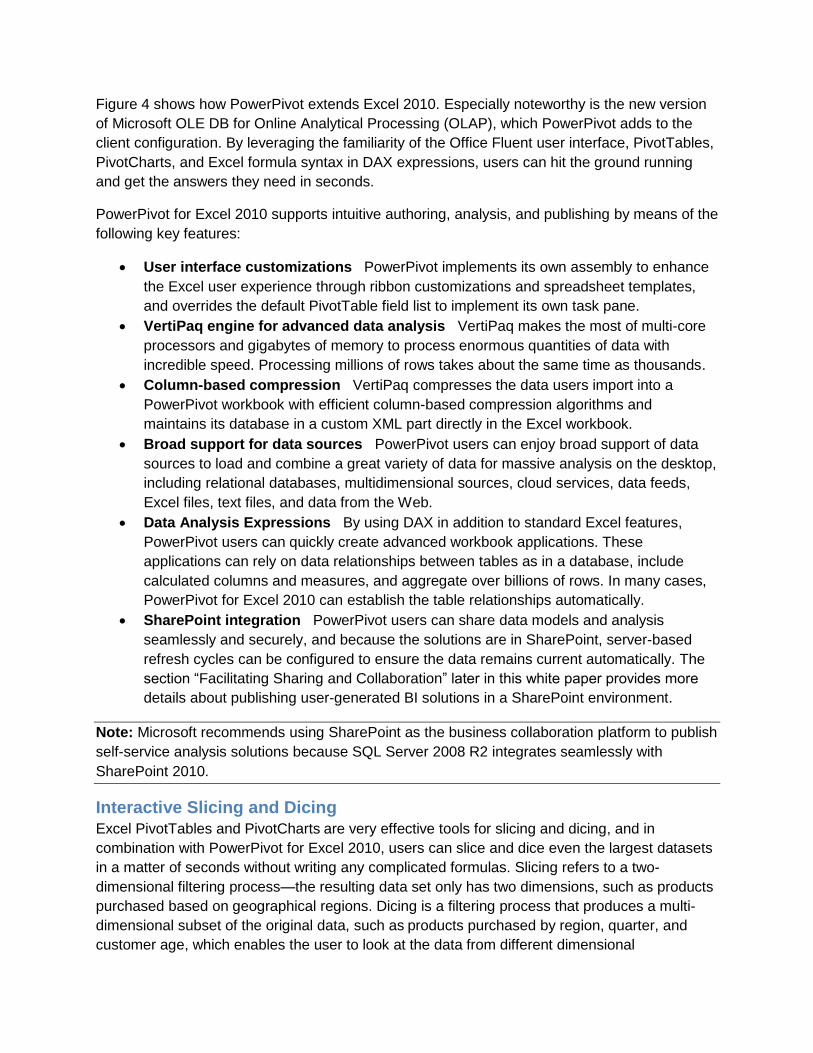
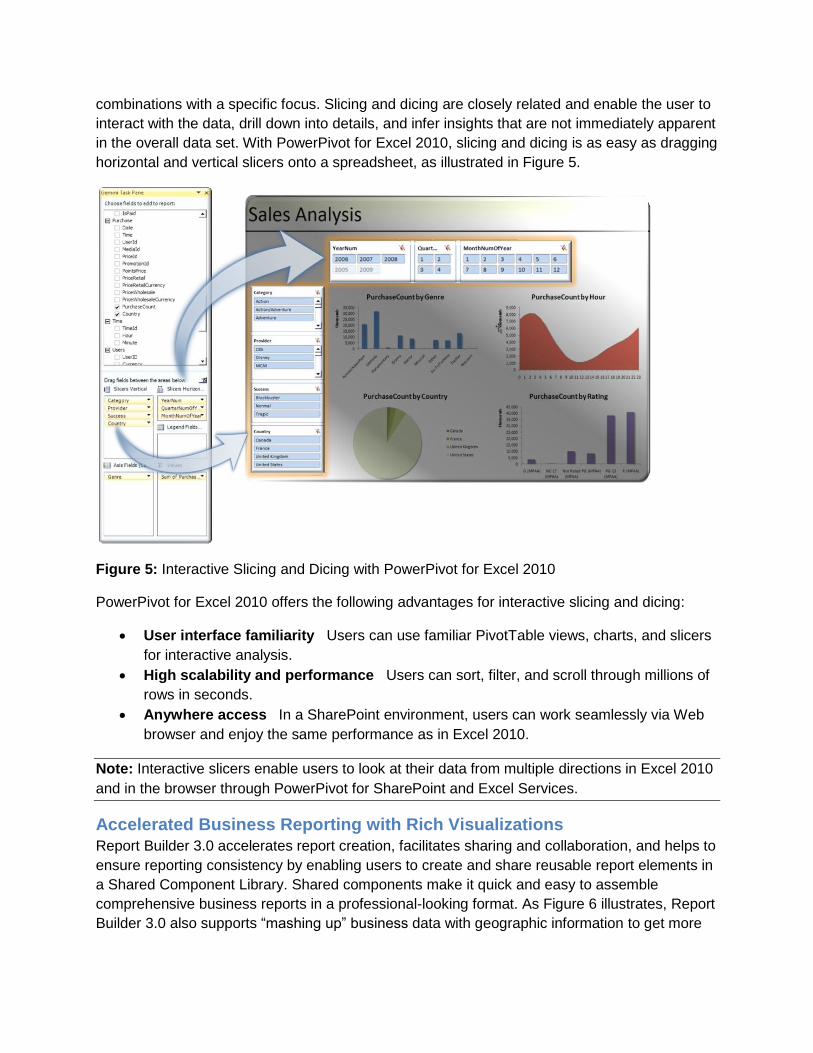
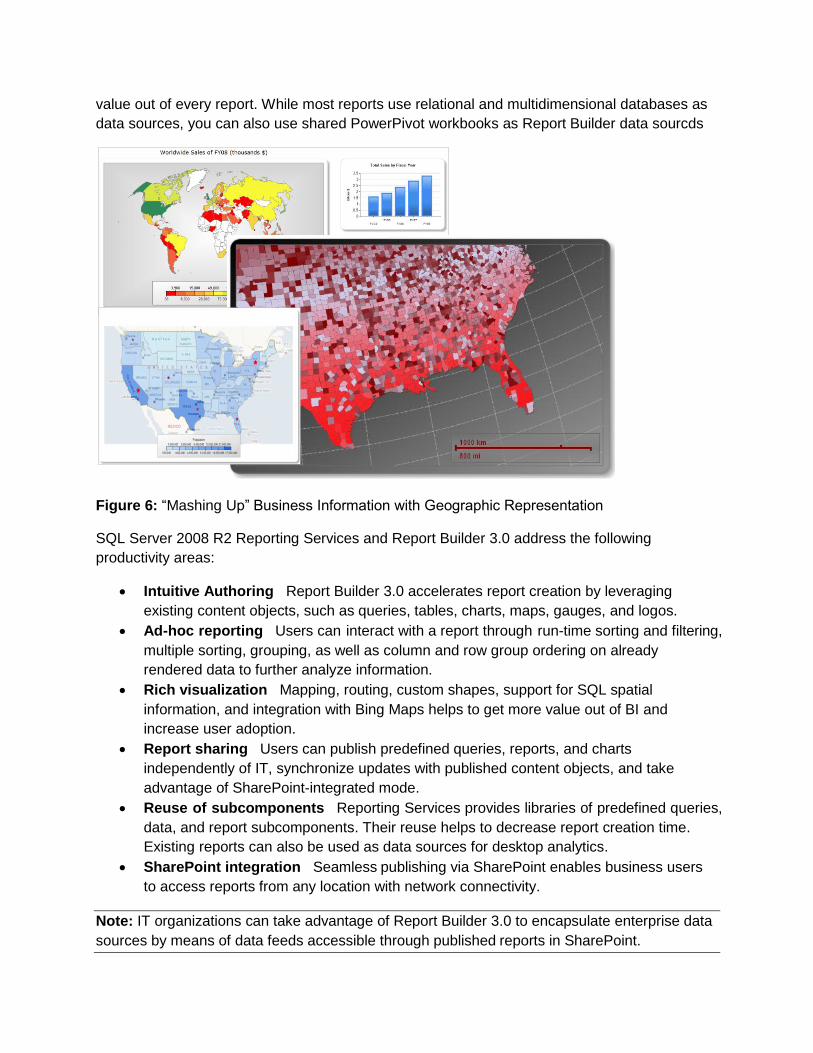
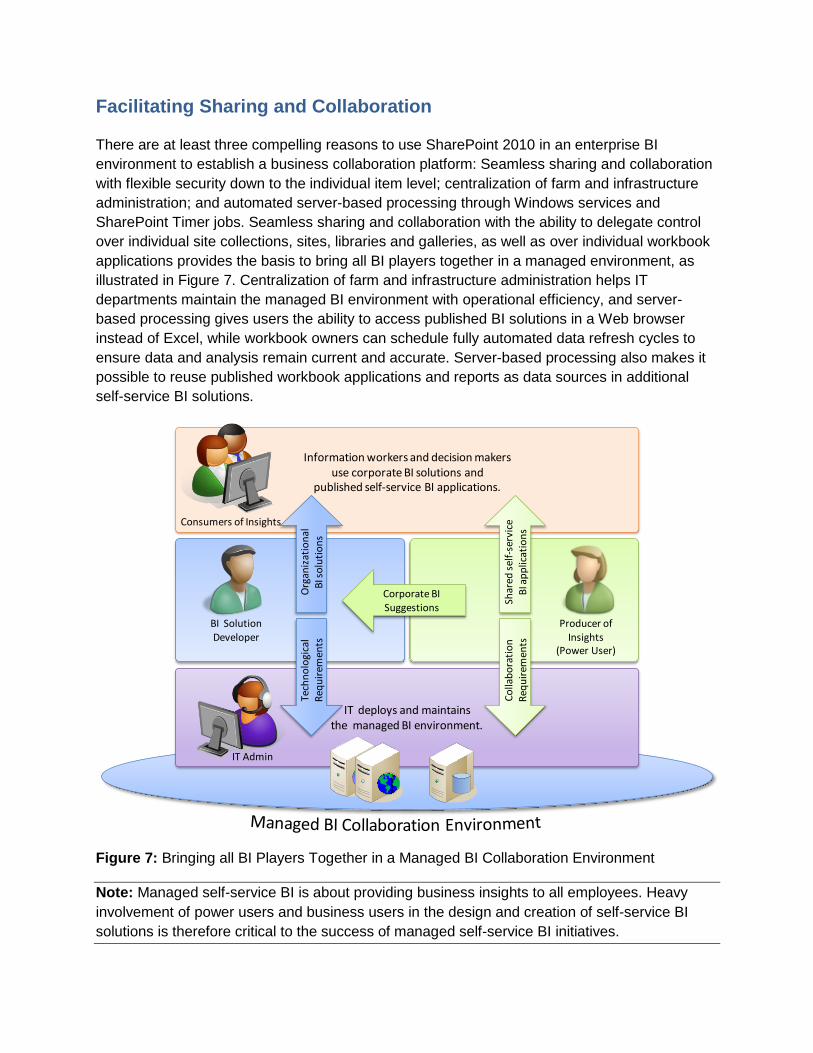
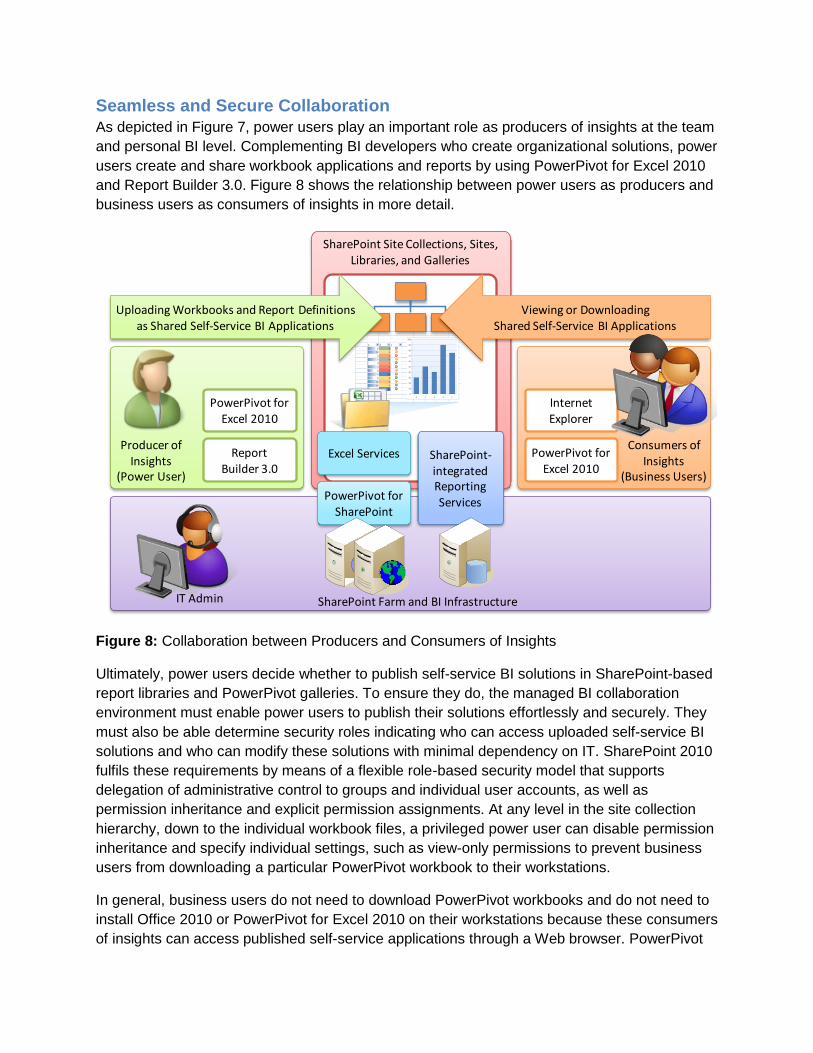
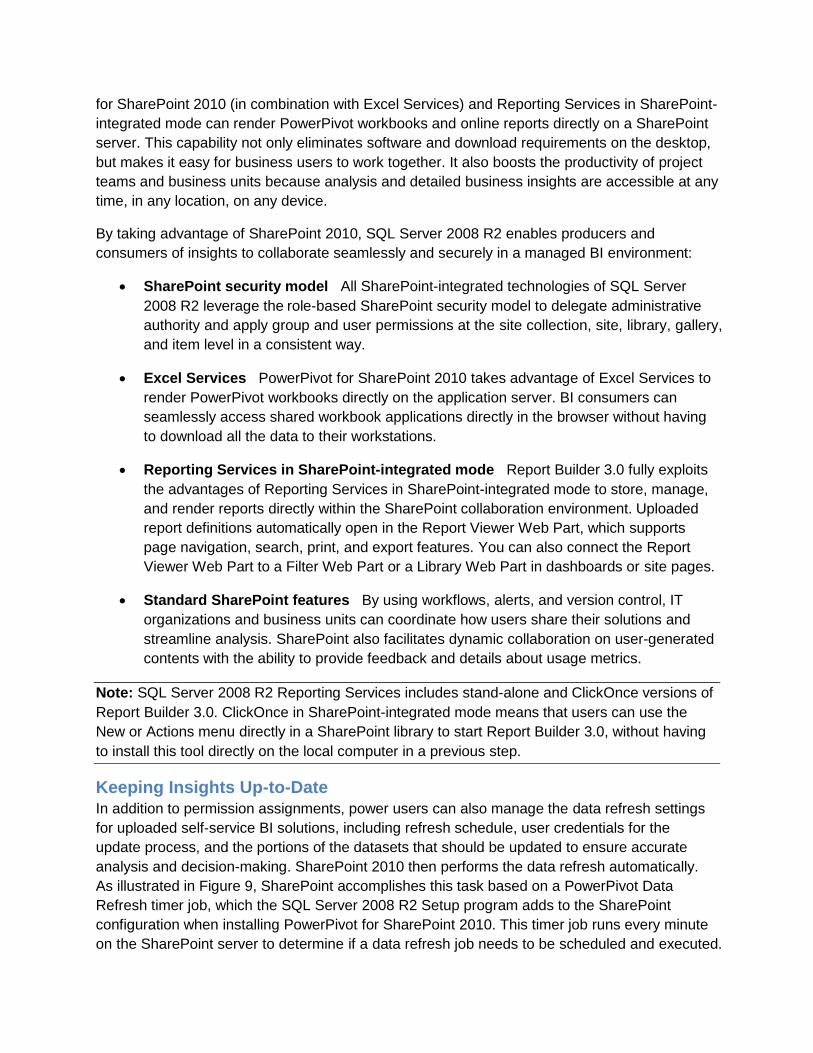
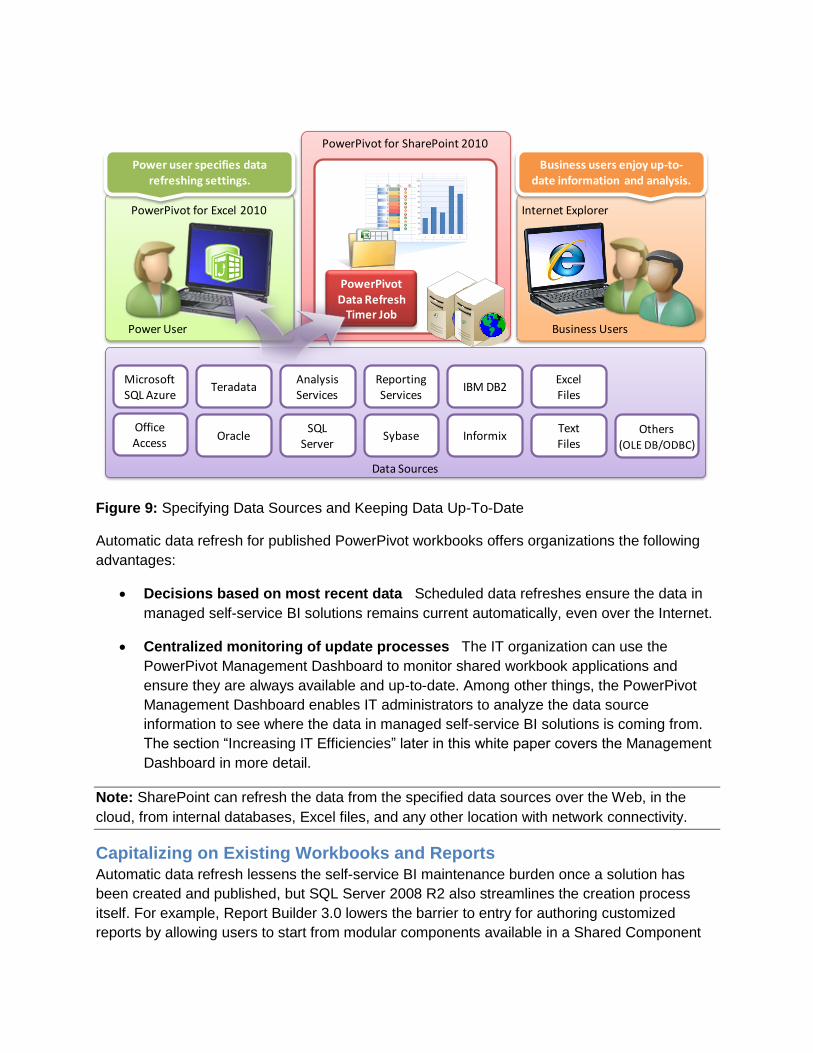
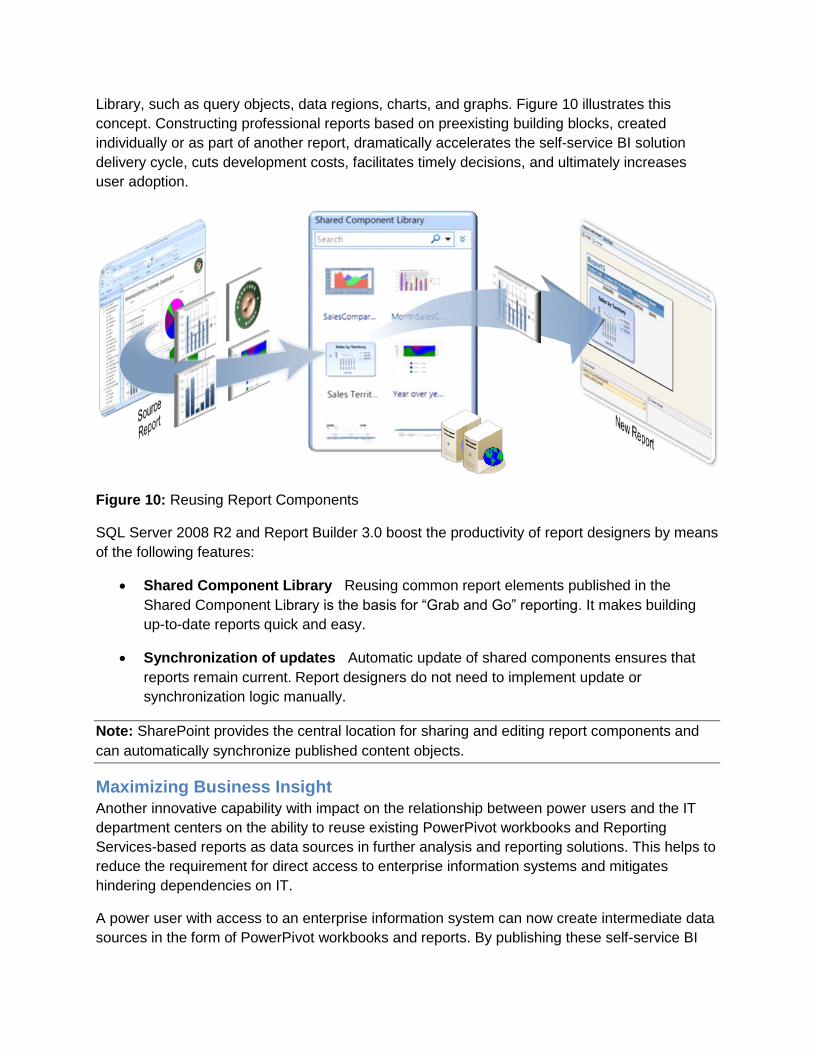
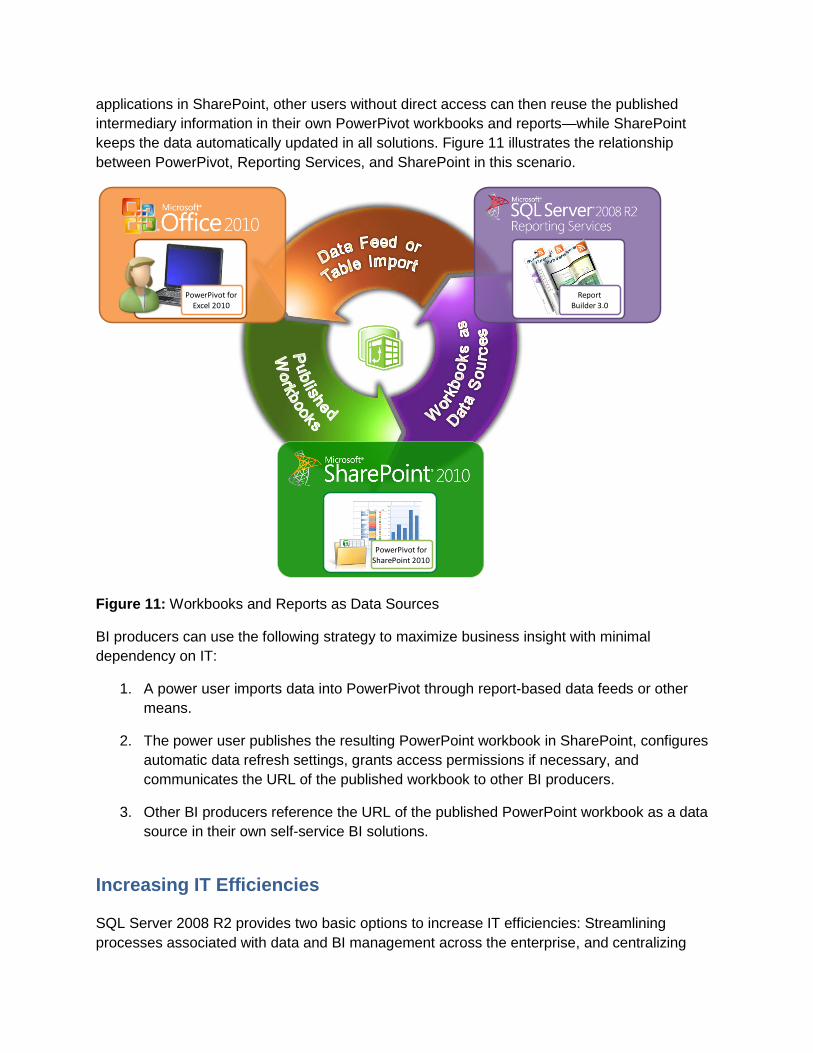
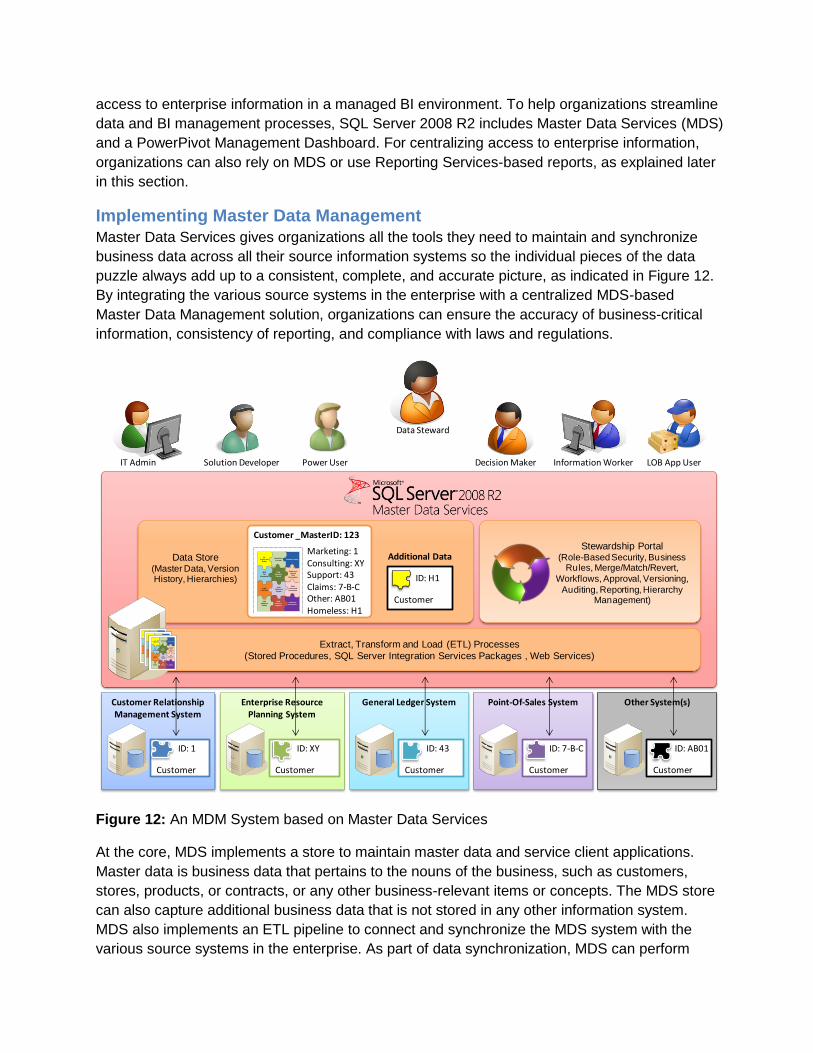
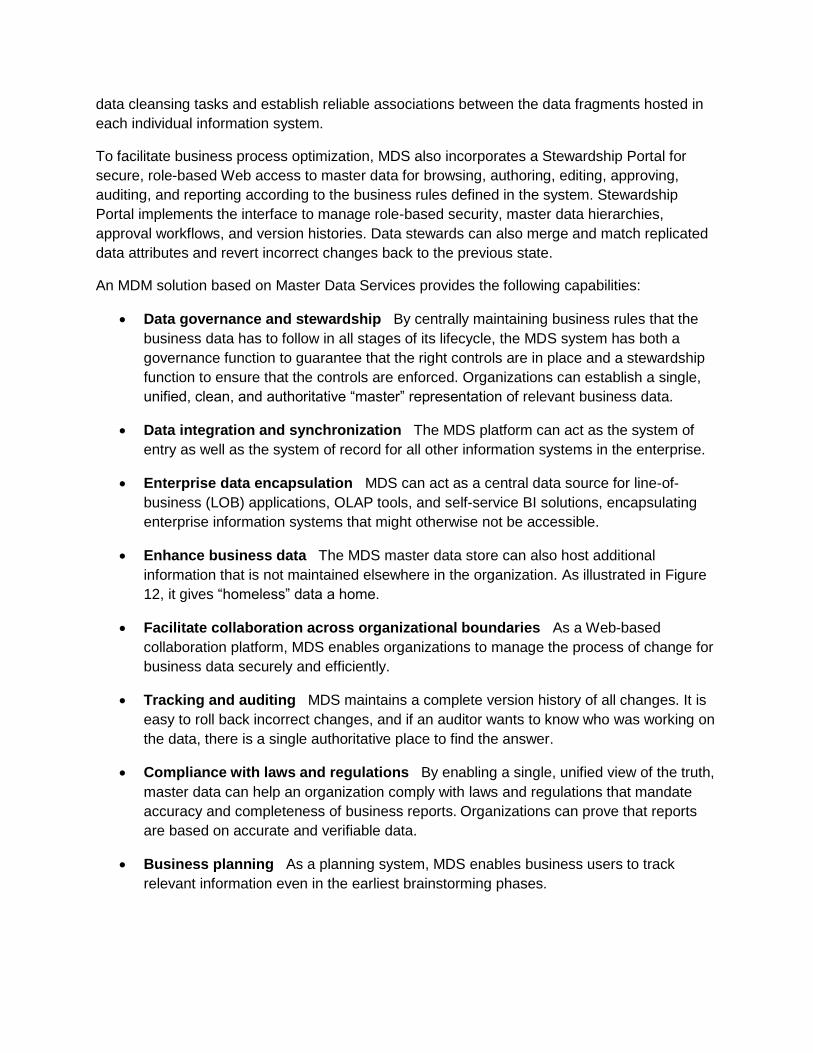
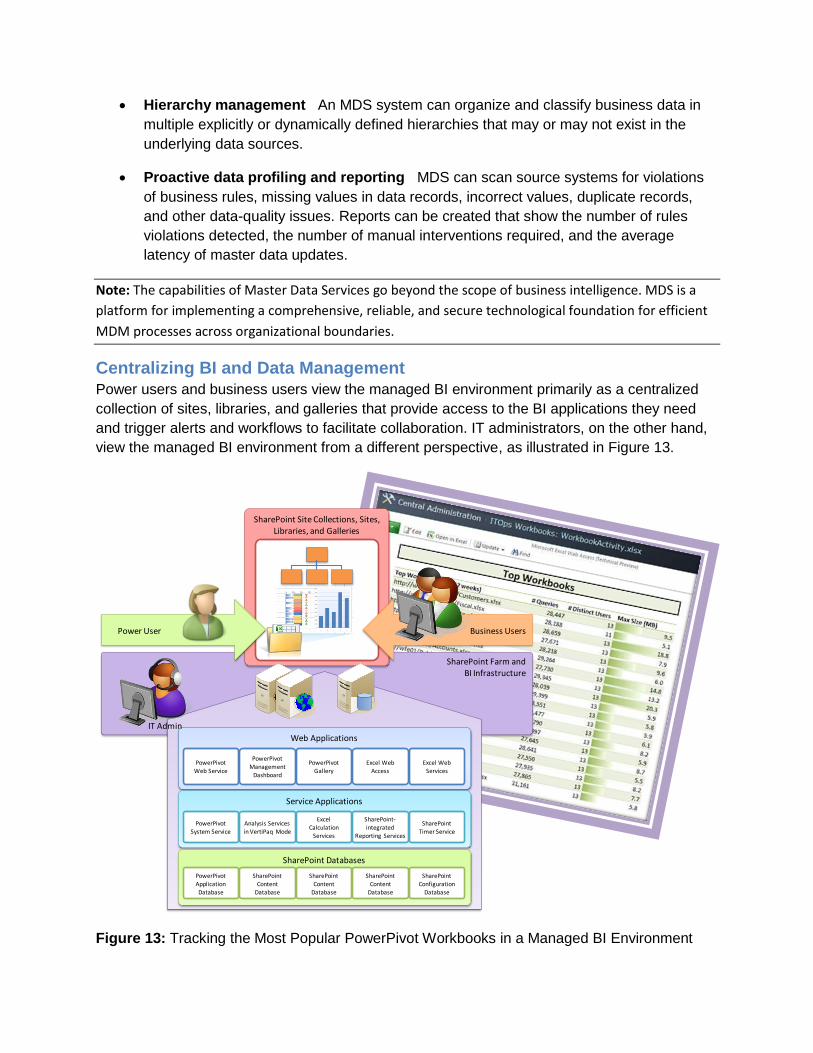
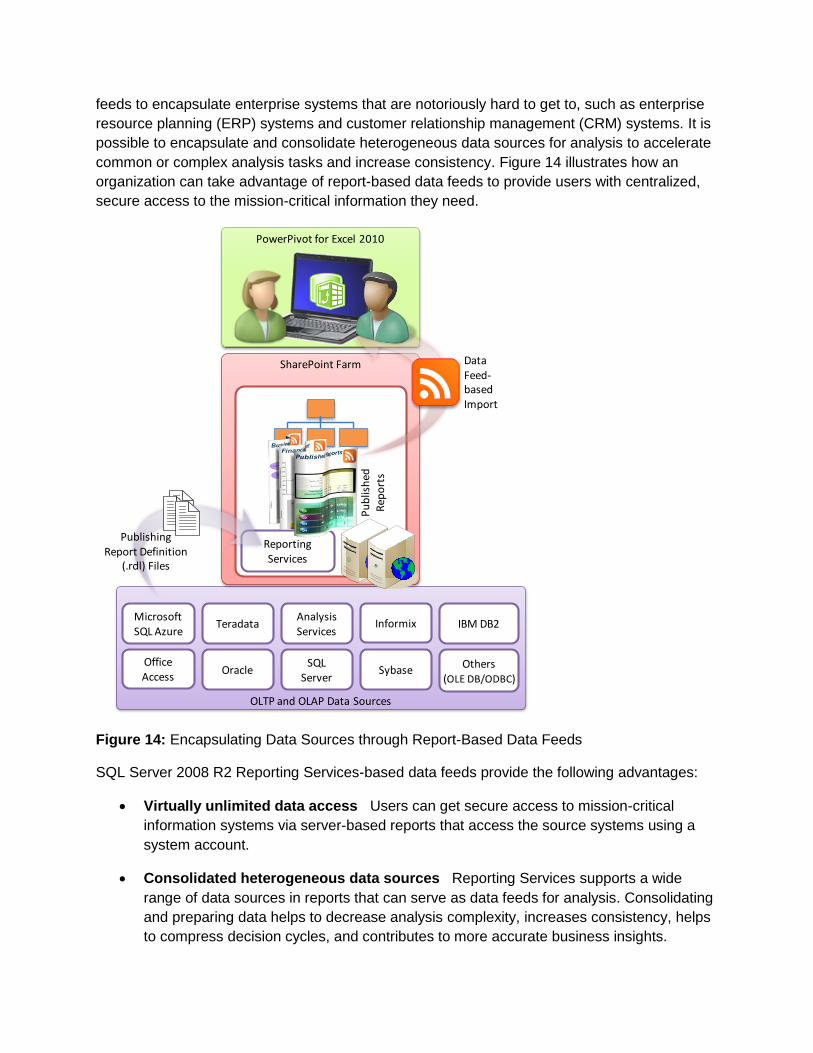